Embed Size (px)
Citation preview

1
Creating a Traffic Operations Center for District 5
of the New Mexico Department of Transportation An Effort to Improve Interagency Interactions
An Interactive Qualifying Project Submitted to the Faculty of
Worcester Polytechnic Institute
In Partial Fulfillment of the Requirements for the Degree of Bachelor of Science
Submitted By:
Nathan Curtis
Serissa Jones
Nicholas Picard
Christopher Tolisano
Sponsoring Agency:
The ITS Bureau of New Mexico Department of Transportation
Project Advisors:
Scott Barton
Fabio Carrera
On-Site Liaisons:
Timothy Brown
John DiRuggiero
Project Information:
https://sites.google.com/site/sf15dot/
This report represents the work of WPI undergraduate students submitted to the faculty as evidence of
completion of a degree requirement. WPI routinely publishes these reports on its website without editorial
or peer review. For more information about the projects program at WPI, please see
http://www.wpi.edu/academics/ugradstudies/project-learning.html

2
Authorship
Cover Page: Written by Serissa Jones. Reviewed by Nathan Curtis, Nicholas
Picard and Christopher Tolisano.
Authorship Page: Written by Serissa Jones and Christopher Tolisano. Reviewed by Nathan
Curtis, and Nicholas Picard.
Table of Contents, List of Figures and List of Tables: Written by Nathan Curtis and Serissa
Jones. Reviewed by Nicholas Picard and Christopher Tolisano.
Abstract: Written by Serissa Jones and Christopher Tolisano. Reviewed by Nathan Curtis and
Nicholas Picard.
Executive Summary: Written by Christopher Tolisano and Nathan Curtis. Reviewed by Serissa
Jones and Nicholas Picard
Introduction: Written by Nathan Curtis, Nicholas Picard, Serissa Jones and Christopher
Tolisano. Reviewed by Nathan Curtis, Nicholas Picard, Serissa Jones and Christopher Tolisano.
Background: Written by Nathan Curtis, Serissa Jones, Nicholas Picard and Christopher
Tolisano. Reviewed by Nathan Curtis, Serissa Jones, Nicholas Picard and Christopher Tolisano.
Traffic Management in New Mexico: Written by Nathan Curtis, Serissa Jones and Nicholas
Picard. Reviewed by Christopher Tolisano.
Traffic Management in District 5: Written by Nathan Curtis, Serissa Jones, Nicholas Picard
and Christopher Tolisano. Reviewed by Nathan Curtis, Serissa Jones, Nicholas Picard and
Christopher Tolisano.
ITS in New Mexico: Written by Nathan Curtis, Nicholas Picard and Christopher Tolisano.
Reviewed by Serissa Jones.
Data Management Technologies: Written by Serissa Jones. Reviewed by Nathan Curtis,
Nicholas Picard and Christopher Tolisano.
District 5 Incident Management: Written by Serissa Jones. Reviewed by Nathan Curtis,
Nicholas Picard and Christopher Tolisano.
Methodology: Written by Nathan Curtis, Serissa Jones, Nicholas Picard and Christopher
Tolisano. Reviewed by Nathan Curtis, Serissa Jones, Nicholas Picard and Christopher Tolisano.
Assessing Current District 5 Operations and Interagency Interaction Methods: Written by
Nathan Curtis and Christopher Tolisano and Serissa Jones. Reviewed by Nicholas Picard.
Exploring New Communication Protocols and Technologies for the District 5 Traffic
Operation Center: Written by Serissa Jones and Nicholas Picard. Reviewed by Nathan Curtis
and Christopher Tolisano.
Selecting the Most Effective Technologies and Interagency Incident Management
Protocols for the District 5 Traffic Operation Center: Written by Serissa Jones. Reviewed by
Nathan Curtis, Nicholas Picard and Christopher Tolisano.
Results and Analysis: Written by Nathan Curtis, Serissa Jones, Nicholas Picard and
Christopher Tolisano. Reviewed by Serissa Jones, Christopher Tolisano, and Nicholas Picard.
Current Technologies and Interactions Between Stakeholders in New Mexico: Written by
Nicholas Picard and Christopher Tolisano. Reviewed by Nathan Curtis and Serissa Jones.
Communication Protocols and Technologies for the District 5 TOC: Written by Serissa
Jones. Reviewed by Nathan Curtis, Nicholas Picard and Christopher Tolisano.
3
Most Effective Technologies and Interagency Incident Management Protocols: Written by
Nathan Curtis and Serissa Jones. Reviewed by Nicholas Picard and Christopher Tolisano.
Recommendations: Written by Serissa Jones, Christopher Tolisano, Nathan Curtis, and
Nicholas Picard. Reviewed by Nathan Curtis, Nicholas Picard, Serissa Jones, and Christopher
Tolisano.
Dashboard Systems: Written by Nathan Curtis. Reviewed by Serissa Jones, Nicholas Picard
and Christopher Tolisano.
NMRoads Utilization: Written by Serissa Jones. Reviewed by Nathan Curtis, Nicholas Picard
and Christopher Tolisano.
Automatic Vehicle Location: Written Nicholas Picard. Reviewed by Nathan Curtis, Serissa
Jones and Christopher Tolisano.
Jurisdictional Boundary and Infrastructure Map: Written by Christopher Tolisano. Reviewed
by Nathan Curtis, Serissa Jones and Nicholas Picard.
Interagency Contact List: Written by Nathan Curtis. Reviewed by Serissa Jones, Nicholas
Picard and Christopher Tolisano.
Interagency Notification System: Written by Serissa Jones. Reviewed by Nathan Curtis,
Nicholas Picard and Christopher Tolisano.
Interagency Conferences: Written by Nicholas Picard. Reviewed by Nathan Curtis, Serissa
Jones and Christopher Tolisano.
Appendix A: Written by Serissa Jones and Nicholas Picard. Reviewed by Nathan Curtis and
Christopher Tolisano.
Appendix B: Written by Serissa Jones. Reviewed by Nathan Curtis, Nicholas Picard and
Christopher Tolisano.
Appendix C: Written by Serissa Jones and Nicholas Picard. Reviewed Nathan Curtis and
Christopher Tolisano.
Appendix D: Written by Serissa Jones. Reviewed by Christopher Tolisano, Nathan Curtis, and
Nicholas Picard.
Appendix E: Written by Christopher Tolisano. Reviewed by Serissa Jones, Nathan Curtis, and
Nicholas Picard.
Bibliography: Written by Christopher Tolisano. Reviewed by Nathan Curtis, Serissa Jones and
Nicholas Picard.

4
Contents Authorship 2
Table of Figures 7
Table of Tables 8
Abstract 9
Executive Summary 10
1. Introduction 12
2. Background 13
2.1 Traffic Management in New Mexico 14
2.1.1 Traffic Incidents in New Mexico 14
2.1.2 Traffic Safety 15
2.1.3 Economic Costs of Traffic 15
2.1.4 Traffic Management and Operations Centers 16
2.1.5 NMRoads 16
2.2 Traffic Management in District 5 18
2.2.1 Traffic Conditions in and around Santa Fe 18
2.2.2 Traffic Management Tools 21
2.2.3 District 5 TOC Stakeholders 22
2.2.4 District 5 Traffic Operation Center (TOC) in Santa Fe 26
2.3 Intelligent Transportation Systems in New Mexico 28
2.3.1 Camera Systems 29
2.3.2 Video Analytics 29
2.3.3 Traffic Signals 29
2.3.4 Dynamic Message Signs 30
2.3.5 Geographic Information Systems 31
2.3.6 Third Party Data Collection 31
2.4 Data Management Technologies 32
2.4.1 Dashboard Systems 32
2.4.2 Traffic Modeling and Simulation 34
2.4.3 Information Distribution 35

5
2.4.4 Interagency Communication Methods 36
2.5 District 5 Incident Management 37
2.5.1 Current District 5 TOC Incident Management Plan 37
2.5.2 Computer Aided Dispatch 39
2.5.3 Stakeholder Involvement with District 5 Incident Management 40
3. Methodology 42
3.1 Assessing Current District 5 Operations and Interagency Interactions Methods 43
3.1.1 Determining Key Stakeholders Involvement with Traffic Incident Management
43
3.1.2 Evaluating The Albuquerque Traffic Management Center’s Operations and
Technologies 45
3.1.3 Current District 5 TOC Data Collection 45
3.2 Exploring New Communication Protocols and Technologies for the District 5
Traffic Operation Center 46
3.2.1 Distinguishing TMC Practices Suited For TOC Implementation 46
3.2.2 Investigating New Technologies and Practices for the TOC 47
3.3 Selecting the most effective technologies and interagency incident management
protocols for the District 5 Traffic Operation Center. 50
3.3.1 Determining TOC Needs 51
3.3.2 Evaluating Possible Solutions for the TOC 53
4. Results and Analysis 56
4.1 Current Technologies and Interactions Between Stakeholders in New Mexico 56
4.1.1 Traffic Data Processing 56
4.1.2 Stakeholders Involved in Incident Management 57
4.1.3 Albuquerque Traffic Management Center Data Processing Methods 60
4.1.4 Current District 5 TOC Data Collection 61
4.2 Communication Protocols and Technologies for the District 5 TOC 62
4.2.1 Direct Implementation of TMC Practices to the TOC 63
4.2.2 Modified Implementation of TMC Practices to the TOC 64
4.2.3 New Technologies and Practices 68
4.3 Most Effective Technologies and Interagency Incident Management Protocols 74
4.3.1 The Ideal TOC 74
4.3.2 Prioritization of Possible Solutions for the District 5 TOC 78

6
5. Recommendations 79
5.1 Dashboard Systems 81
5.2 NMRoads Utilization 83
5.3 Automatic Vehicle Location 86
5.4 Jurisdictional Boundary and Infrastructure Map 87
5.5 Interagency Contact List 89
5.6 Interagency Notification System 91
5.7 Interagency Conference 91
Appendix A - Interview Questions 93
Albuquerque Traffic Management Center Meeting Questions 93
District 5 NMDOT Meeting Questions 93
GIS Meeting Questions 94
EMS Meeting Questions 95
MPO Meeting Questions 96
District 5 NMDOT Meeting 2 Questions 96
New Mexico DPS Questions 98
Appendix. B - Tables 99
Appendix. C - Additional Research 109
ITS Architecture stakeholder list 109
Simtable 110
Appendix. D - Completed Tables 112
Appendix E 127
Section 1. Dashboard Widgets 127
Section 2. Dashboard Applications 132
Bibliography 135

7
Table of Figures Figure 1 New Mexico District Reference Map
Figure 2 New Mexico Causes of Traffic
Figure 3 New Mexico Causes and Costs of Traffic
Figure 4 Santa Fe Area
Figure 5 Santa Fe Urbanized Areas, 2000
Figure 6 Crashes in Santa Fe County, 2013
Figure 7 New Mexico TMC and TOC Relationship
Figure 8 Incident Type and Respective Stakeholders
Figure 9 Current District 5 TOC Operator Station
Figure 10 Current District 5 TOC Room Layout
Figure 11 New Mexico Patrol Yards
Figure 12 New Mexico Traffic Districts and Patrol Yards
Figure 13 Traffic Camera
Figure 14 Traffic Signal and Camera System
Figure 15 Dynamic Message Sign
Figure 16 City Knowledge Theoretical Information Inputs
Figure 17 Venice Dashboard, 2015
Figure 18 NMRoads Website, 2015
Figure 19 Dispatcher Note Log
Figure 20 Official Dispatcher Incident Log
Figure 21 Current TOC & Stakeholders Incident Management Interaction
Figure 22 Goals to Creating a Traffic Operations Center for District 5
Figure 23 Data Processing System
Figure 24 Stakeholder to NMDOT Evaluation
Figure 25 Email from State Police to TMC
Figure 26 Albuquerque TMC Current Data Processing Methods
Figure 27 Implementations from the TMC with Modifications for the TOC
Figure 28 Albuquerque TMC Radio Log
Figure 29 Log System to add Events to NMRoads
Figure 30 Evaluation Methods
Figure 31 Ideal Traffic Operation Center Data Processing
Figure 32 Flowchart of Methodology with Recommendations
Figure 33 Virginia AVL Plow Tracking
Figure 34 Santa Fe Dashboard
Figure 35 District 5 Jurisdictional Map Proof of Concept
Figure 36 Santa Fe Area Jurisdictional Map Proof of Concept
Figure 37 Jurisdictional Contact Map
Figure 38 Emergency Contact Proof Concept
Figure 39 NMRoads Log Drop Down Menu
Figure 40 Simtable Usage, 2015
Figure 41 Dashboard Camera Feed Widget
Figure 42 Dashboard Weather Widget

8
Figure 43 Dashboard Twitter Widget
Figure 44 Dashboard Traffic Congestion Widget
Figure 45 DMS Display Widget
Table of Tables Table 1 Current TOC Organization
Table 2 Pairwise Comparison Chart of Project Objectives
Table 3 Stakeholder Feedback
Table 4 Current TOC Incident Management
Table 5 TMC Models
Table 6 Solution Morphological Chart
Table 7 TOC Operations Numerical Evaluation Chart
Table 8 CAD Software Evaluation Table
Table 9 Simtable Usage Numerical Evaluation Chart
Table 10 Incident Protocol Numerical Evaluation Chart
Table 11 CAD Software Numerical Evaluation Chart
Table 12 Dashboard Numerical Evaluation Chart
Table 13 NMRoads Numerical Evaluation Chart
Table 14 Patrol Vehicles Numerical Evaluation Chart
Table 15 Customized Dashboards Per Agencies
Table 16 Stakeholder and TOC Relationship Results Part 1
Table 17 Stakeholder and TOC Relationship Results Part 2
Table 18 Current TOC Incident Management Results
Table 19 TMC Model Results
Table 20 Current TOC Organizational Results
Table 21 Solution Morphological Chart Results
Table 22 CAD Charts Results
Table 23 TOC Operations and Numerical Evaluation Chart Results
Table 24 CAD Systems Numerical Evaluation Chart Results
Table 25 TOC Incident Protocol Numerical Evaluation Chart Results
Table 26 NMRoads Numerical Evaluation Chart Results
Table 27 Patrol Vehicles Numerical Evaluation Chart Results
Table 28 Incident Protocol Numerical Evaluation Chart Results
Table 29 Simtable Usage Numerical Evaluation Chart Results
Table 30 Dashboard Numerical Evaluation Chart Results
Table 31 Dashboard Widget Evaluation Chart Results

9
Abstract The New Mexico Department of Transportation is expanding the District 5 Traffic
Operations Center (TOC). We assessed the current communication methods and technologies
used within the District 5 TOC. From various interviews and research we recommended that the
TOC increase operational efficiency and interagency communications by implementing the
following technologies and systems: Dashboard systems, NMRoads access expansion,
automatic vehicle location, jurisdictional boundaries and infrastructure map, and interagency
conferences, notification systems and contact lists.

10
Executive Summary The United States has had a significant rise in the number of drivers on its roadways.
For example from 1995 to 2000, the number of passenger cars increased by 5 million and from 2000 to 2005 there was an increase of 3 million passenger cars.1 New Mexico has a 27% higher fatality rate per 100 million vehicle miles travelled than the national average for vehicle miles travelled.2 There is a significant push to improve traffic conditions and highway safety in New Mexico, in part motivated by these statistics.
The New Mexico Department of Transportation (NMDOT) currently manages traffic primarily through its Traffic Management Center (TMC) in Albuquerque, NM. Here, data from all over the state is reviewed and relayed to relevant parties. This is primarily done through email, phone, and radio to key agencies and through the state-run website NMRoads, dynamic message signs to the public.
Over the past few years, there has been a push to greatly improve traffic within the state of New Mexico. Specifically in District 5 which encompasses Santa Fe, NMDOT feels the need to implement a smaller scale version of the Traffic Management Center (TMC) currently operating in Albuquerque. A Traffic Operations Center (TOC), which is how NMDOT defines a smaller Traffic Management Center, could be very beneficial to the District 5 region, which is approximately 200 thousand people.3 This would bridge the gap in communication between local agencies such as police, fire, and Department of Transportation personnel. This center would also have the ability to provide better real time data to the general public through the common outlet of NMRoads, as well as through the NMRoads app.
The goal of this project was to assist in the expansion of the Santa Fe center into a full-fledged TOC, by improving the communications between the District 5 Center and the local agencies, as well as by providing suggestions of new technologies to improve operations of the Center, to ensure that the key stakeholders in the region are kept informed. The key stakeholders in District 5 include the Santa Fe Department of Public Works, New Mexico Department of Public Safety, Santa Fe RECC, and NMDOT. A complete list of stakeholders as defined by the ITS Architecture website can be found Appendix C.4 The benefits of expanding the District 5 TOC would include quicker response times to incidents which could in turn reduce the number of fatalities.
This was achieved by first assessing the current interactions between the Albuquerque Traffic Management Center, the District 5 Traffic Operations Center, and local stakeholders. After assessing the current setup of the TOC and interagency communication methods, and analyzing potential solutions, suggestions were made on potential enhancements.
The technologies that were determined to benefit the TOC the most were the Dashboard system, the automatic vehicle location, and the NMRoads admin access. Along with these technologies it was found that the TOC would benefit from having an up to date interagency contact list, a multi-jurisdictional boundary map, interagency email chains, and interagency conferences. By using these technologies and practices, the TOC would be able to collect, distribute, organize, and log data similar to best practices in the TMC in Albuquerque. Figure 1 below overviews the methods and results of our project.
1 (US Department of Transportation RITA 2014)
2 (TRIP 2014)
3 Personal Correspondence with John DiRuggerio. NMDOT ITS Bureau
4 (NMDOT ITS Architecture)

11
Figure 1 Methodology Chart with Final Results and Recommendations

12
1. Introduction Traffic in the United States is becoming an increasing issue. In 2012, there were over
253 million vehicles driving over 4 million miles of highway across the country.5 Traffic on US
roads cost drivers in medium density populations $628 dollars annually per capita in fuel and
maintenance costs.6 This made for a total of 5.6 million crashes, 2.3 million injuries and 33,561
fatalities according to the US Department of Transportation.7 With so many drivers on the roads
and so many accidents, there is a clear need for improvement. At the state level, the most
popular approach to dealing with traffic accidents and costs are Traffic Management Centers.
A Traffic Management Center (TMC) is a location where operators can review real time
data to help better regulate the traffic in a specific region.8 One of the important elements of a
TMC is its communication with outside organizations, such as corresponding with local law
enforcement about rerouting traffic away from and around crashes.9 The Intelligent
Transportation Systems (ITS) Bureau of the New Mexico Department Of Transportation
(NMDOT) operates a TMC in Albuquerque, which manages the greater Albuquerque area as
well as the rest of the state. The Bureau would like to create satellite versions of the
Albuquerque TMC in all of its 6 Districts to cover the entire state, and to provide everywhere the
same level of local service that is currently offered by the TMC in Albuquerque. As a first step in
that direction, the ITS bureau wants to expand the Traffic Operations Center (TOC), a smaller
scale TMC, in Santa Fe to serve Santa Fe County and the rest of New Mexico’s 5th Transit
District.
Our project focused on expanding the current Santa Fe traffic operations center and
creating new standard operating procedures for interagency communication. To establish the
best means to complete this task, we first evaluated the District 5 Traffic Operations Center.
This resulted in a better understanding of the TOC’s areas for improvements. Next, new
technologies and communication protocols were explored to determine possible improvements
to the TOC. Potential enhancements were proposed for the District 5 TOC as well as the
establishment of an interagency incident management plan. With district traffic operation
centers starting up, this center will set an example for other districts in New Mexico to follow suit
with their own TOCs.
5 (Bureau of Transportation Statistics 2014)
6 (Lomax 2012)
7 (Bureau of Transportation Statistics 2013)
8 Personal Correspondence with Ali Khorasani. Worcester Department of Public Works
9 Personal Correspondence with Tim Brown. NMDOT ITS Bureau

13
2. Background The New Mexico Department of Transportation (NMDOT) aims to provide a safe,
efficient and reliable transportation system to the public.10 NMDOT handles transit, rail, aviation
and highway travel, but, for this study, we focused on the major roadways and traffic aspects of
the NMDOT. The NMDOT has divided the state into six districts, and the primary focus of this
report is District 5, which includes Santa Fe county and the northwest corner of the state of New
Mexico. Figure 2 depicts the traffic districts of New Mexico, District 5 is colored orange. The
NMDOT has implemented a variety of tools and practices to help effectively manage traffic.
Figure 2 New Mexico District Reference Map11
10
(New Mexico Department of Transportation 2012) 11
(DiRuggiero 2014)

14
2.1 Traffic Management in New Mexico
There are many problems associated with traffic in New Mexico. Traffic has direct safety
and economic repercussions. In terms of safety, traffic can lead to accidents. Economically,
traffic costs commuters money by wasting fuel and causing excessive wear on vehicles. Traffic
takes up the time of the commuter which can cause a loss in productivity and therefore wages.
Another important aspect of traffic management is the understanding of the safety impacts of
poorly managed traffic, which can be used to minimize the risk of secondary incidents. Finally,
an understanding of the economic impact of traffic can be used to justify the investments
required to properly manage traffic. An effective tool to moderate traffic is through Traffic
Management Centers (TMC). A TMC is a station that aims to monitor traffic, resolve traffic
incidents as quickly as possible, and inform the public on road conditions. TOC’s are a location
where information about roadways is analyzed and communicated to a range of organizations
within and around its boundaries. In the state of New Mexico, NMRoads is a website that works
to bridge the communication gap between the ITS infrastructure, stakeholders, and the general
public.
2.1.1 Traffic Incidents in New Mexico
There are many elements that can cause traffic congestion in New Mexico that the
NMDOT works to resolve, summarized in Figure 3:
Crashes, which are collisions involving one or more cars and any environmental
features such as roadway barriers or vegetation.12
Weather conditions affect traffic conditions.13 For example in heavy rains, drivers slow
down their speed which can cause congestion.
Construction on roadways can limit the available space creating a bottleneck effect or
force drivers to decrease their speed, causing traffic.14
Special events can create spikes in traffic volumes and variances in traffic patterns on
days, times and locations when there are normally no problems or exacerbate existing
problems.15
Special cargo includes any cargo not usually found on roadways, such as highly
flammable or toxic materials or trucks that are oversized or overweight.16
Road damage plays a major role in traffic conditions. Road damage can greatly reduce
vehicle throughput, as well as causing damage to the vehicles themselves.17
12
(Emergency Transportation Operations 2013) 13
(Dailey 2006) 14
(Work Zones 2015) 15
(Focus on Congestion Relief) 16
Personal Correspondence with John DiRuggerio. NMDOT ITS Bureau 17
(Work Zones 2015)

15
Figure 3 Primary Causes of Traffic
2.1.2 Traffic Safety
A 38% increase in drivers in the state of New Mexico from 1990 to 2012 has led to a
58% increase in vehicle miles traveled in the same time frame, causing traffic disruptions.18 In
2014, drivers in New Mexico traveled on average 12,257 vehicle miles per capita, much more
than the national average of 9,457 miles per capita for the United States.19 A report by TRIP, a
national transportation research group, stated in Januarys 2014, New Mexico’s traffic fatality rate
was 1.43 fatalities per 100 million vehicle miles of travel (VMT).20 This is 27% greater than the
national rate of 1.13 fatalities per 100 million vehicle miles.21
2.1.3 Economic Costs of Traffic
An estimated $31.4 billion of goods is shipped out from sites in New Mexico, and
another $46.6 billion is shipped into the state annually. Of this, 65% of goods travel by truck and
another 18% by multimode or courier services, all of which rely heavily on the physical
infrastructure of the state as well as fast travel times and minimizing delays. According to TRIP,
a national nonprofit research organization, the poor condition of New Mexico roads, as defined
by the Federal Highway Administration, costs the average motorist an additional $458 per year
in expenses in excess wear and increased maintenance costs.22 This amounts to $439 million
per year statewide in costs.
18
(TRIP 2014) 19
(US Department of Transportation RITA 2014) 20
(TRIP 2014) 21
Idem. 22
Idem.

16
Other states have similar problems and have taken action to solve them. One example
of an action to reduce economic costs of traffic is the Coordinated Highways Action Response
Team of Maryland which has resulted in an estimated time reduction of 30 million vehicle-hours
and savings of 5 million gallons of gasoline.23 It is clear, based on the success of Maryland’s
program, that proper traffic management can have huge positive impacts economically in
reduced costs and in terms of recaptured productivity.
Another major problem resulting from traffic is the time lost in traffic. The national
average for additional commuting time due to traffic in a medium sized city such as Albuquerque
is 10% of commuting time, while the national average is 15%.24 Albuquerque also experienced a
far greater reduction in average travel time from 2006 to 2011 compared to similar sized cities
across the country.25 Given the great success of this TMC, NMDOT is looking to expand the
number of TOCs in the state.
2.1.4 Traffic Management and Operations Centers
NMDOT uses a variety of tools to manage traffic on the major roadways throughout the
state. One of the most prominent tools is a Traffic Management Center (TMC). The purpose of a
TMC is to monitor and control the flow of traffic within its area of operations. TMCs use various
systems and technologies to collect traffic data, organize the data, distribute it to the public or
involved agencies, and also log important data. To achieve these functions the TMC utilizes a
variety of specialized equipment, such as dynamic messages signs and traffic cameras which
collectively form the hardware component of Intelligent Transportation Systems (ITS). The TMC
works with a variety of local agencies in order to effectively manage traffic. These organizations
also work together to respond to incidents within their area of operations. New Mexico has a
statewide TMC in Albuquerque that oversees many of the smaller scaled traffic centers called
Traffic Operation Centers (TOC). The TOC is the district level version of a TMC. The goal of the
NMDOT is to eventually have multiple TOCs working under the TMC to create a web of traffic
centers with the TMC being the center of the traffic management. A TOC can provide a range of
benefits, including enhanced safety and reduced congestion, but also economic boons from
reduced commute times and more rapid shipping. A TOC can address many of the problems
resulting from traffic, such as collisions. The TOC is also responsible for communicating
information to and between many other organizations, referred to as stakeholders; working
together to ensure safe and efficient traffic flows throughout its area of operations.
2.1.5 NMRoads
NMRoads was designed by NMDOT as a traffic management tool. NMRoads is a web
based system that the TMC currently controls by adding incidents and conditions along the
roads of New Mexico to the public. Figure 4 below shows what NMRoads looks like to the
general public.
23
(Federal Highway Administration 2008) 24
(Bureau of Transportation Statistics 2014) 25
Idem.

17
Figure 4 NMRoads Website, 201526
The website not only provides an interface for the general public to use, but also has a
many background capabilities that can be utilized by NMDOT. NMRoads bridges the gap
between different types of hardware running on custom made software platforms.27 In the
backend of NMRoads, the Department of Transportation can utilize software to pan, zoom and
tilt (PTZ) the traffic cameras.28 This allows operators to identify and analyze incidents remotely
with a high degree of accuracy. Effective incident assessment is crucial to proper response and
management. The software of NMRoads incorporates older cameras that run on analog signals,
as well as fiber optic and wireless camera systems that offer higher quality images without
lag.29NMRoads also allows NMDOT to log traffic information so that it can be retrieved at a later
date if necessary. The NMRoads software can therefore be vital to the new TOC as it provides a
source of constant data and feedback. To further NMRoads, there is a huge push to increase
interagency communication.
26
(NMRoads Website 2015) 27
Personal Correspondence with John DiRuggerio. NMDOT ITS Bureau 28
Personal Correspondence with Tim Brown. NMDOT ITS Bureau 29
Personal Correspondence with John DiRuggerio. NMDOT ITS Bureau

18
2.2 Traffic Management in District 5
The focus of our project is NMDOT District 5, which includes Santa Fe county and
extends to the northwest corner of the state,30 with a population of approximately 200,000.31
District 5 includes not only the city of Santa Fe and its surrounding County, but also other
important New Mexico towns like Los Alamos, Espanola, Taos and Farmington.
Representatives from the Intelligent Transportation Systems Bureau of the New Mexico
Department of Transportation stated that many of the problems regarding transportation in
District 5 are related to the remote areas of the district. Many of the problems come from
connecting the remote regions with traffic cameras since the area is so large.32
2.2.1 Traffic Conditions in and around Santa Fe
The City of Santa Fe published a report that provided the traffic volumes (average
weekday traffic/24-hours) of the major roadways in Santa Fe in 2013,33 which concluded that
the four roadways with the highest traffic volumes in Santa Fe are:
● St. Francis Drive between Zia Road and Siringo Road with 46,861 average
weekly travelers
● St Francis Drive between Alta Vista and Cordova with 43,642 weekly travelers
● I-25 SW at the La Cienega Interchange with 33,310 weekly travelers
● Cerrillos Road north of Alta Vista with 32,502 weekly travelers34
Figure 5 below provides a map of these key roadways. The most traveled roadways are
in green.
30
(New Mexico Department of Transportation 2012) 31
Personal Correspondence with Tim Brown. NMDOT ITS Bureau 32
Personal Correspondence with Tim Brown. NMDOT ITS Bureau 33
(Liming 2014) 34
(Mid Region Council of Governments of New Mexico 2014)

19
Figure 5 Santa Fe Urbanized Areas, 200035
The city of Santa Fe has three main highways, state routes 84 and 599 and Interstate
25, that run through or by it which increases the amount of traffic that can be going through the
city at any given time. In 2013, the year with the most recent published data, there were 18
locations in the city of Santa Fe with between 27 and 46 crashes.36 All but one of these
locations is on the roads mentioned above. Santa Fe County was in the top five counties with
the most crashes in 2013, representing 7.6% of all crashes in the state. District 5 was the
location of 16.9% of all crashes in New Mexico, but 21.6% of all fatal crashes.37 These statistics
highlight the need for the expansion of the District 5 TOC, noting that District 5 contributed to a
large number of fatal crashes of New Mexico. Figure 6 below displays areas of frequent crashes
in Santa Fe County. No thorough logs of other traffic problems are kept.
35
(New Mexico Department of Transportation, 2014) 36
(University of New Mexico 2013) 37
Idem.

20
Figure 6 Crashes in Santa Fe County, 201338
38
(University of New Mexico 2013)

21
2.2.2 Traffic Management Tools
One way to minimize the large amount of accidents in District 5 compared to New
Mexico is through the use of traffic management tools that aim to reduce emergency response
times and increase communication with emergency services. There is a need for a central
location that can oversee all of these interactions and also for the creation of a standardized
interagency incident management protocol. One way to minimize these problems is through the
use of traffic management tools that aim to reduce emergency response times and increase
communication with emergency services. There is a need for a central location that can oversee
all of these interactions and also for the creation of a standardized interagency incident
management protocol. Traffic Management Centers (TMCs) are information hubs that take in
large amounts of information from key stakeholders of the region, and output information to the
general public, and other stakeholders.39 TMCs are traffic management tools as they contain
procedures and infrastructure to help resolve traffic incidents and improve traffic conditions. In
this project, stakeholders refer to organizations (e.g. police, fire) that use the data gathered from
the integrated corridors and work with the TOC to resolve traffic incidents.40 Integrated
Corridors are stretches of roads that can contain road sensors and cameras gathering data for
the TMC, and message boards, controlled by the TMC, to communicate appropriate information
to the general public.41 The network that these systems run on is known as the Intelligent
Transportation Systems (ITS) network. The TMC can use the ITS network to monitor
accidents, weather conditions, and road condition from a variety of data sources.42 Through
these management methods, TMCs can significantly reduce traffic and improve safety for the
general public. With states being so large, especially in the Southwest, there often is a need for
a more tailored TMC to the local areas with an emphasis on regional stakeholders and issues.43
A Traffic Operations Center (TOC) is how the New Mexico Department of
Transportation describes a district-level satellite of the overall statewide Traffic Management
Center, currently operating in Albuquerque. The NMDOT plans to deploy a full-fledged local
version of the Albuquerque TMC in each of the 6 NMDOT Districts that cover the whole state,
by facilitating the creation or expansion of one Traffic Operation Center (TOC) in each district.
These centers will receive information from the TMC, and will provide local information back to
the TMC by coordinating with local stakeholders. In District 5 of New Mexico, which
encompasses the Santa Fe Region up to the Northwest corner of the state, a full-fledged TOC
can provide swift communication amongst the Santa Fe Department of Public Works, New
Mexico Department of Public Safety, and NMDOT amongst other agencies found in Appendix
C.44 The idea of the TOC at a local level is to monitor local conditions and report them up to the
TMC, while monitoring state-level ITS data to provide swift feedback to local stakeholders in the
event of an emergency, all the while simultaneously alerting the general public through
electronic mediums such as NMRoads, a website and mobile app built by the state of New
39
(Thilmany 2000) 40
(New Mexico Department of Transportation 2011) 41
(Thilmany 2000) 42
(Carlson, Mathie, Riccardi, and Wilson 2014) 43
Idem. 44
(New Mexico Department of Transportation 2011)
22
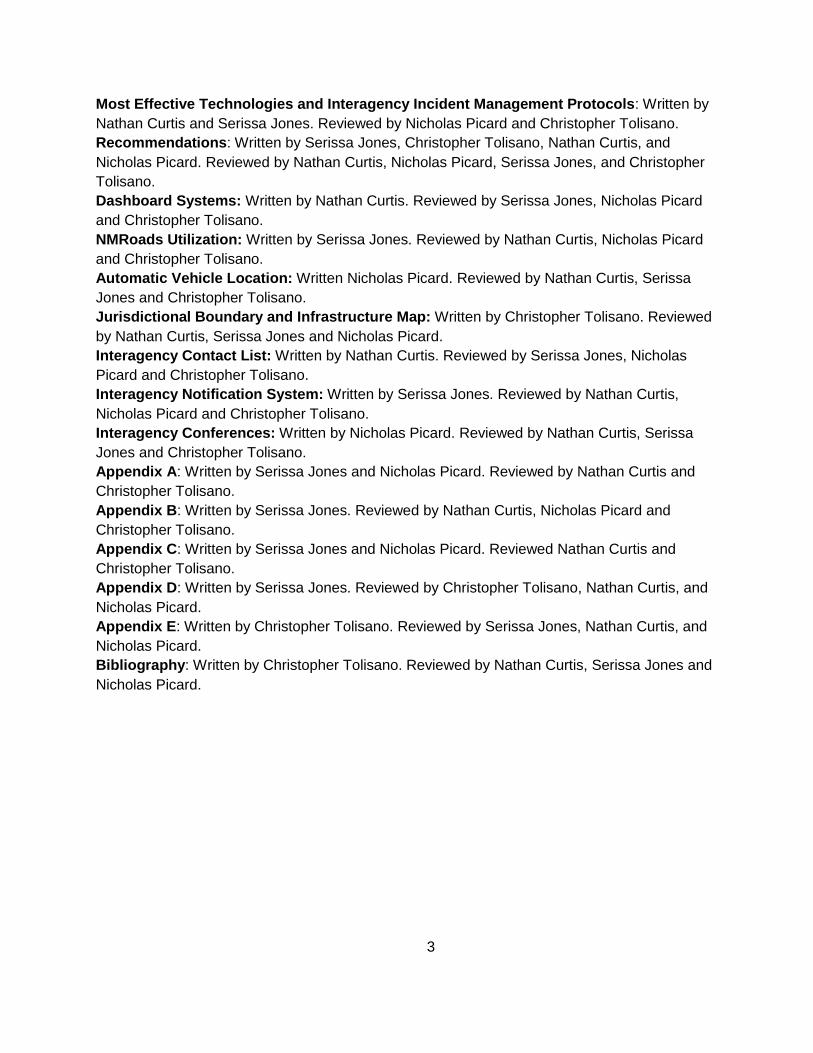
Mexico, to disseminate information about traffic updates, road conditions, weather, and
scheduled delays. Figure 7 below demonstrates the relationship of the Albuquerque, statewide,
TMC to the District 5, district-wide, TOC according to New Mexico ITS Architecture. As shown in
this diagram there is the potential for a couple of approaches. There would be one statewide
TMC and multiple district wide TOCs, with the potential to even have city or county TOCs as
well. All these traffic centers must partake in a system of information exchange, where
information is communicated between one another through various technologies and
operations.
Figure 7 New Mexico TMC and TOC Relationship45
2.2.3 District 5 TOC Stakeholders
The main stakeholders involved with the District 5 TOC traffic operation center, besides
the general public, are:
the Santa Fe Public Works Department,
the New Mexico Department of Public Safety,
the New Mexico Department of Transportation,
the Santa Fe County Geographic Information Systems Office,
the Santa Fe County Regional Emergency Communications Center and
the Santa Fe County Public Works.46
45
(New Mexico Department of Transportation 2011) 46
Idem

23
These departments exchange information to the operation center so that the operation
center can help divert traffic, where accidents or road conditions may occur, and notify the
public of these traffic events.
Another important stakeholder of the Santa Fe District 5 TOC is the TMC in
Albuquerque that the Santa Fe TOC should communicate with to relay important information
between District 5 and the statewide center.47
The TOC should also be in communication with its counterpart in District 5, the Los
Alamos Traffic Management Center. The Los Alamos TOC is a unique result of the national
laboratory in the area. It has 9 cameras, as well as traffic counters, and has recently installed
two dynamic message signs around the town, which overlap with District 5. The TOC should act
as an information hub that distributes relevant information between different organizations. The
information should be gathered from the corresponding organizations, as well as from the
TOC’s own information gathering systems.
Another stakeholder in traffic management that is very different than the majority of the
others is a Metropolitan Planning Organization (MPO). An MPO is an organization that is
federally mandated for any city with a population of 50,000 people or more, also called a
metropolitan area. The MPO is responsible for much of the transportation planning that occurs
in its area of operations.48 The MPO creates both a long and short term plan for improving the
local transportation, including new construction and non-routine maintenance. Since Santa Fe
has an MPO, all new construction plans for the region begin here, which is why regular
communication would be very beneficial so that New Mexico drivers can be alerted to avoid
certain routes based on planned construction. Importantly, the MPO determines the proper
allocation of federal funding for transportation projects.49 An effective TOC can provide vital
feedback to the MPO allowing it to better allocate its resources, and an MPO can aid a TOC by
providing accurate information about a changing road system.
The Regional Emergency Communications Center (RECC) has a very important
relationship with TOCs. The RECC is the regional 911 dispatch center, also known as a public-
safety answering point (PSAP). The Santa Fe County RECC oversees law enforcement, fire,
and medical services for the entire Santa Fe County and Edgewood. Any 911 calls in the Santa
Fe county will get routed to this center as the dispatchers are Emergency Medical Dispatch
(EMD) trained and can automatically communicate with the caller and provide some initial
services to the caller. The dispatcher will retrieve initial information about the nature of the
emergency, code and log the call, contact and direct the proper service to resolve the
emergency, and then provided EMD. The RECC works closely with state police and neighboring
RECCs. It is common for the RECC to receive calls about incidents affecting traffic before the
TOC would be notified. Increasing communications between the RECC and TOC would allow
traffic incidents to be resolved more efficiently. The RECC uses certain codes when classifying
incidents relevant to roadways. The TOC would benefit greatly if they had a way to access or be
47
Personal Correspondence with Tim Brown. NMDOT ITS Bureau 48
Personal Correspondence with Keith Wilson. Santa Fe MPO 49
Idem.

24
notified the instant a relevant code is recorded. Strengthening communications between both
agencies would enable a quicker restoration of traffic for public safety.50
One of the organizations that the RECC coordinated with is the New Mexico State
Police, a branch of the New Mexico Department of Public Safety (DPS). The state police
have several crucial functions in the arena of traffic management. One of these functions is as
first responders to traffic incidents, as well as first reporters of traffic incidents. This is because
the state police regularly patrol the highways and as such are in position to provide reliable
information from the scene of an incident.51 This information is largely communicated to the
police dispatch exclusively. Sharing of this information to NMDOT would help update NMRoads
with more accurate and current traffic conditions. Another vital function of the state police is to
close roads. Only the state police have the authority to close roads under New Mexico law.
However, they commonly confer with other organizations, such as NMDOT, before closing
roads. This is particularly common in the winter when snow can cause problems, as the
NMDOT is responsible for clearing the snow.52
There is room for improved communication between EMS personnel and the DOT.
Emergency medical services are typically one of the first organizations to hear about
accidents, and other road incidents via 911 calls. This information, although often not confirmed,
would be very valuable to have in a traffic operations center. The traffic operations center can
also offer EMS dispatchers valuable information on crashes, construction, and other weather
incidents taking place on the roads. Currently, EMS dispatchers do not monitor road conditions
when sending crews to scenes.53 This information could be very helpful so crews can avoid
construction, traffic, and weather. Improved response times not only can save lives, but if a
crash is not cleared within 30 minutes, there is almost a 100% chance that an additional
accident will occur.54 Improved lines of communication would benefit both agencies offer
valuable information relevant to the line of work both organizations are in and ultimately save
lives. Figure 8 below demonstrates the major incidents that could disrupt traffic and the
stakeholders that have a role in managing those events.
The Santa Fe County Geographic Information Systems (GIS) Office maps new
roads and addresses everyday as they are created. They also create computer generated
maps. This information is needed by the NMDOT so that they can have a steady flow updated
maps for NMRoads, as well as for knowing where everything in their jurisdiction is as it is
created. Currently, District 5, the Albuquerque TMC, and the County GIS office each hold on to
the majority of the their data. Data does not get shared on a regular basis due to limited
communication between parties. Accurate GIS data is important for accurate traveler
information, best routing of emergency vehicles understanding roadway limitations and
maintaining accurate maps.55
50
Personal Correspondence with Ken Martinez. Santa Fe County RECC 51
Personal Correspondence with Kimberly Clark. New Mexico Department of Public Safety 52
Personal Correspondence with David Martinez. NMDOT District 5 53
Personal Correspondence with Kyle Thornton. EMS Headquarters Santa Fe 54
Personal Correspondence with John DeRuggiero. NMDOT ITS Bureau 55
Personal Correspondence with Amanda Hargis. Santa Fe GIS

25
Figure 8 below provides a visual display as to what stakeholders help resolve traffic
problems in correspondence to the particular set of New Mexico traffic causes. Each agency per
each incident type must work together and communicate with one another in order to resolve
the incident. The result box demonstrates the possible actions or areas impacted by these traffic
causes.
Figure 8 Incident Type and Respective Stakeholders

26
2.2.4 District 5 Traffic Operation Center (TOC) in Santa Fe
NMDOT is trying to reduce traffic problems by having traffic operations centers in each
of the six districts of New Mexico. The district level operations center for District 5 is located in
Santa Fe. Each district level operation center has a Public Information Officer that oversees
information that goes out to the public from the district level department of transportation
operations. A district level operations center needs to be able to communicate traffic conditions
to people driving the roads or other agencies in the area that would be impacted by traffic.
Currently the District PIO communicates the traffic conditions of the district through inputting the
data that the district level operation gains to NMRoads. The city of Santa Fe already has a traffic
operation center in place to help with traffic incidents. This operation center currently only has
one station for an operator to work, shown in Figure 9, and the overall layout of the TOC is in
Figure 10.
NMDOT would like to improve to more advanced hardware and software to monitor
traffic conditions and improve incident reporting and overall incident management. The center in
Santa Fe currently does not communicate regularly to the other agencies around Santa Fe that
have an impact on traffic conditions.56 The goal of having an operation center is to be able to
respond quickly to traffic incidents by getting information through communicating with other
agencies that may notice an incident first. This communication would go both ways so that if the
operation center notices an incident the center would then communicate to the network of
agencies, as well as to the general public, that there is a problem.
Figure 9 Current District 5 TOC Dispatcher Station57
56
Personal Correspondence with John DiRuggiero. NMDOT ITS Bureau 57
Personal Correspondence with David Martinez. NMDOT District 5

27
Figure 10 Current District 5 TOC Layout58
District 5, like the other districts within New Mexico, is further divided into sections called
patrol yards. These patrol yards split up the districts into more manageable areas to manage
transportation concerns. Patrol vehicles drive a designated route within their respective section
and look for any incidents that could disrupt traffic. The patrol vehicles have some supplies to
tend to minor incidents like running out of gas or a flat tire, if they come across them in their
route. If a patrol vehicle sees something that is a danger to the public or disrupts the traffic, the
driver will report to the patrol yard dispatch center to further handle the situation.59 New Mexico
contains 82 continuously operated patrol yards and several more patrol yards which are
operated seasonally.60 District 5 comprises of 21 active patrol yards, and 2 seasonal ones.61
Figure 11 below displays the most current map of the patrol yards within New Mexico. Each
green dot on the figure below represents a different patrol yard and pink lines denote patrol yard
boundaries. Patrol yards are distinguished by a numbering system. For example the Santa Fe
patrol yard is numbered 45-46; the “4” represents a patrol yard, the “5” is the district of the yard
and the 46 represents that specific section number within the section.62
58
Personal Correspondence with David Martinez. NMDOT District 5 59
Personal Correspondence with Tim Brown and John DiRuggiero. NMDOT ITS Bureau. 60
(New Mexico Department of Transportation 2010) 61
Personal Correspondence with David Martinez. NMDOT District 5 62
Idem.

28
Figure 11 New Mexico Traffic Districts and Patrol Yards63
2.3 Intelligent Transportation Systems in New Mexico
Traffic operation centers use a variety of technologies to collect, interpret, and transmit
data regarding traffic conditions. Intelligent Transportation Systems (ITS) improve transportation
and mobility. The most common hardware systems that ITS uses include traffic cameras, traffic
signals, and dynamic message signs. Common software systems that ITS uses include
computer aided dispatch, 511 (traffic information) and video analytics of camera data.
63
(DiRuggiero 2014)

29
2.3.1 Camera Systems
The primary tool available to a TOC for traffic management are closed circuit televisions
(CCTVs) or traffic cameras.64 These cameras will send the data directly to the center for
analysis. Camera systems are becoming increasingly popular because video feed can be easily
analyzed by a large number of users simultaneously and independently. Video feeds can also
be sent to outside agencies, such as local law enforcement, for non-traffic purposes such as
incident investigation. Many cameras, including the majority of cameras in New Mexico can be
controlled remotely, allowing an operator to pan, tilt or zoom (PTZ) the camera to focus on a
location more accurately.
Figure 12 Traffic Camera65
2.3.2 Video Analytics
Video analytic systems are software packages with the capability of detecting and
alerting the TOC if a potential incident is occurring.66 These systems harness the camera feeds
and analyze the video to detect abnormalities from normal feeds that would be caused by a
traffic incident. The TOC would determine what those triggers would be that indicate an incident
has occurred. The software can be run from a centralized location, such as the TOC or run
locally on the cameras.
2.3.3 Traffic Signals
New intelligent traffic signal systems work on a master-slave hierarchy, where engineers
can control a group of lights from one central computer.67 This allows the signal timing to be
manually changed by the engineer to help the traffic flow in response to slowdowns or other
road conditions.68 Currently the traffic signal operations and controls are managed by the
Department of Public Works within each county or town.
64
Personal Correspondence with Ali Khorasani. Worcester Department of Public Works 65
(FLIR 2015) 66
(Luttrell, Sampson, Ismart and Matherly 2008) 67
Personal Correspondence with Ali Khorasani. Worcester Department of Public Works 68
Idem.

30
Figure 13 Traffic Signal and Camera System69
2.3.4 Dynamic Message Signs
Engineers also control dynamic message signs (DMS), which can be programmed to
display messages instructing drivers on delays and alternative routes.70 These signs may also
display delays and closures of certain roads before people approach them, allowing drivers to
seek alternate routes. DMS generally fall into two categories: fixed and portable signs.71 DMS
are generally only used on longer stretches of roads and not within cities.72 Large stretches of
highway that connect important locations throughout the state benefit from the use of dynamic
message signs in that information about upcoming road conditions are relayed to drivers on the
road.73
Figure 14 Dynamic Message Sign74
69
(Traffic Cameras 2015) 70
Personal Correspondence with Tim Brown. NMDOT ITS Bureau 71
Personal Correspondence with Michael Fitzpatrick. MassDOT, HOC 72
Idem. 73
Personal Correspondence with John DiRuggerio. NMDOT ITS Bureau 74
(Daktronics 2015)

31
2.3.5 Geographic Information Systems
Geographic Information Systems (GIS) is the technology behind computer generated
maps. This technology allows GIS professionals to map, model, query and analyze large
amounts of information within a single database.75 This includes points of locations, networking
of roads, amongst other geographic features that can be turned on and off the map in the form
of layers. Local governments rely on this technology to update their databases with information
such as new addresses, new roads, and road changes daily. This information often can take
years to be imported into the major online GIS databases such as Google, Bing, and
MapQuest.76 This raises a significant concern, EMS dispatches utilize software that references
the major online databases that often have out of date maps. Often time’s out of date maps are
used in conjunction with e911 calls, a system which populate a dispatcher’s screen with
geographic information, causing potentially dangerous inaccurate dispatches.77 First responders
have extreme difficulty locating incidents when maps are out of date.78 Having accurate road
information is something the DOT needs to not only keep the public informed about road
conditions, but also to provide to other respective state organizations with this information.
Currently there is no continuous communication between GIS professionals in New Mexico, and
the DOT.79
2.3.6 Third Party Data Collection
There are several third party data collection systems, including Inrix, BlueTOAD and
EconoLite. Inrix is one of the most advanced traffic data sources available. Inrix utilizes
crowdsourcing to accurately pinpoint traffic, as well as running complex algorithms to predict
future traffic congestion.80 Crowdsourcing refers to the random data sampling of wireless
devices’ locations, primarily cell phones, to detect where people are. Outside of third party data,
NMRoads also uses a few BlueTOAD devices, which are fixed pieces of hardware located in
various places that monitor how many Wi-Fi or Bluetooth devices move past the sensor.81 New
Mexico has found that although this method of collecting data is accurate, it is not a cost
effective method for measuring traffic.82 NMRoads primarily interfaces with EconoLite, which is
the main supplier of traffic management hardware in the Santa Fe region of District 5.83
EconoLite is a supplier of transportation management solutions, and focuses heavily on
developing new technologies.84 In Santa Fe, EconoLite’s traffic cameras and signal software are
used throughout the city. In a push to create higher quality images without lag in a cost effective
manner, EconoLite has developed wireless broadband technologies to speed up the process.
75
(Evans 2015) 76
Personal Correspondence with Amanda Hargis. Santa Fe GIS 77
Personal Correspondence with Kyle Thornton. EMS Headquarters Santa Fe 78
Personal Correspondence with Amanda Hargis. Santa Fe County GIS Office 79
Idem 80
(Why Inrix 2014) 81
(BlueTOAD 2015) 82
Personal Correspondence with Tim Brown. NMDOT ITS Bureau 83
Idem 84
(About Econolite 2015)

32
The wireless technology used in intersections links smaller intersection controllers to a large
master controller. The master controller is then hooked up to a fiber optic link, which then sends
data to local TOCs. This technology is far cheaper than running fiber optic cables to every
intersection, while still offering high speed data transfer between intersections and the TMC or
TOC.85 EconoLite’s traffic cameras have the ability to not only monitor traffic visually, and can
also use radar to detect the speed that traffic is moving at.
2.4 Data Management Technologies
The TOC collects a variety of data regarding traffic conditions in order to effectively
manage incidents and reduce traffic. The organization and usage of this information is
extremely important for a well running TOC. Compiling data into one source could greatly
increase interagency interactions. Data can also be used to model and simulate various traffic
conditions and scenarios for planning and training purposes. Lastly, it is important to translate
and distribute the data to respective stakeholders and to the public in order to increase
awareness, safety, and incident management protocols. Through these measures interagency
communications will be strengthened.
2.4.1 Dashboard Systems
One of the main issues involved in managing traffic is synthesizing the data into easily
viewable and manageable quantities. There are many techniques to compiling this data, one
being the use of a Dashboard system. Dashboards are a part of an overarching methodology for
data compilation from an organization called City Knowledge. City Knowledge has a main goal
of making cities “smart cities”, through a collaboration of various info sources that mainly use
GIS technology, weather, social media, traffic data (transit, water, air, road) in the form of
widgets.86 Figure 15 below describes the theoretical information inputs that are involved with
creating a Dashboard.
85
(Wang, Robinson, Shelby, Cox, Townsend 2009) 86
(City Knowledge 2015)

33
Figure 15 City Knowledge Theoretical Information Inputs87
Dashboards are structured by the use of widgets that are geared towards displaying a
certain type of information. Widgets are small windows that allow app like functionality within
them. These widgets are designed to display data from a variety of information sources. The
use of customizable widgets or windows into other info sources can be very beneficial when
attempting to display traffic information to the general public as well as for stakeholders involved
with traffic management. Through various feeds the Dashboard could display real time data
about weather, social media feeds, infrastructure posts and more. Figure 16 is an example of
the Dashboard technology designed for public use in Venice, Italy.
87
(The Big Picture 2015)

34
Figure 16 Venice Dashboard, 201588
2.4.2 Traffic Modeling and Simulation
One way of analyzing the data created by traffic monitoring is by modeling or simulating
the traffic network. One of the most advanced approaches is agent based modeling, in which
individual agents, vehicles for example, are modelled as they interact with a larger system, such
as road networks.89 One of the advantages of agent-based modeling is that it can be run
continuously to estimate traffic volumes in all segments of a city, even where there are no
sensors in place.
Only some modeling platforms allow the users to change parameters while in operation,
enabling the study of how agents (drivers) would respond to the changes. In the case of traffic
modeling, these changes can be the disabling or altering of roadways to represent blockages or
limitations. The simulation can be used to predict the impact of a crash or roadway construction,
in real time. This information can be used to plan for crash response, emergency evacuation or
88
(City Knowledge Venice 2015) 89
(Dowling, Skabardonis and Alexiadis 2004)

35
even for events such as road work. There are wide variety of modeling programs and platforms,
both open source and proprietary, including platforms such as Simtable, a visual modeling
system that can be used as an interactive platform for traffic-specific applications. Appendix C
contains some additional information on the functions of Simtable.
2.4.3 Information Distribution
To distribute information about the conditions of traffic within cities, traffic centers can
sometimes use a radio frequency or relay road conditions to drivers via 511 phone lines. This
alerts drivers that there is a problem the problem area before becoming a part of it. Depending
on the stakeholder, different mediums of communication may work better than others. Currently,
the primary source of information to TOCs is through radio, phone, and email in that order.
Methods of communication vary primarily based on reception.90 In areas that there is no radio
reception, cell phones are then utilized. From agency to agency for incident reporting, email
aliases with all relevant stakeholders are used.91 For emergency communication between
agencies, phones are the primary means of communication.92 Outside of interagency
communication, other information distribution methods are utilized to communicate with the
general public.
In New Mexico, there are two main methods for communicating traffic information;
NMRoads and 511. 511 is a phone based system that relays pre typed information from DOT
personnel to drivers who call the number. This real time system management information
program for state DOTs was established in 2010 to comply with federal regulation 23 CFR 511.
The 23 CFR 511 establishes provisions and parameters to get information about travel
conditions to agencies and the public. This regulation establishes a minimum reporting time,
and accuracy of traffic data within and around metropolitan areas. Within a metropolitan area
under 23 CFR 511, construction areas and roadway blocking incidents need to be reported to
the 511 system within 10 minutes of their existence (minimum) with 85% information accuracy
and 90% information availability. Additionally, within a metropolitan area, travel times need to be
calculated to be reported to the 511 system is 10 minutes. Outside of a metropolitan area, the
information about construction or roadway blocking incidents need to be reported and verified
by 20 minutes after their existence. For both metropolitan and nonmetropolitan areas, the time
for hazardous weather reporting to the 511 system is 20 minutes from when it begins as a
minimum reporting expectation.93 Outside of reaching the general public through 511, many
states also utilize state run DOT websites to reach the general public.
The NMDOT distributes the traffic information that they collected to the public,
stakeholders and other NMDOT personnel through the usage of NMRoads.
NMRoads allows anyone to view images from local traffic cameras and displays on a
state map message board, construction, traffic conditions, road closures, and weather
90
Personal Correspondence with David Martinez and Brian Ainsworth. NMDOT District 5. 91
Personal Correspondence with John DiRuggiero. NMDOT ITS Bureau 92
Personal Correspondence with David Martinez and Brian Ainsworth. NMDOT District 5. 93
(Federal Highway Administration 2010)

36
conditions.94 It is not always possible to be on the website at all times, such as while driving.95
NMDOT created Android and iPhone applications to solve this limitation.96 For those without
smartphones, it is possible to program a daily route into the website to receive text or email
updates about traffic. The NMRoads Twitter feed provides the same data in another medium.97
The wide availability of the data allows the general populace to easily access high quality data
about changing road conditions that can make a large impact in their daily lives.
2.4.4 Interagency Communication Methods
NMRoads currently does not have a well-established method for communicating with
local stakeholders at the District level. An example of established lines of communication can be
seen in Boston where their Highway Operation Center (HOC) operators listen to local police
radio and communicate with local fire departments.98 This allows them to talk to the firefighters
driving into Boston’s tunnel network to direct them to issues. Radios are also used to talk to
DOT personnel on patrol, while dedicated phones are used as the primary mode of
communication for all other agencies.99
The system used by the HOC (in Boston) lacks a single platform for personnel to
communicate on efficiently. The federal government recognizes the need for a single network
for emergency personnel to communicate on. Signed into law on February 22, 2012, the Middle
Class Tax Relief and Job Creation Act created the First Responder Network Authority
(FirstNet).100 This law gives FirstNet the mission to build, operate and maintain the first high-
speed, nationwide wireless broadband network dedicated to public safety. FirstNet will provide a
single interoperable platform for emergency and daily public safety communications. The plan
for this network is to utilize current telecommunication networks, private and public, to create an
infrastructure in the 700 MHz range.101 The federal government has allotted $7 billion to
complete this task, with New Mexico being one of the first states to see the system.102
Specifically in Santa Fe, there is a demand for a system that can share vital information from the
TOC to the stakeholders.103 FirstNet is a potential model for how a new TOC should operate in
that it emphasizes cross-agency communication through standard channels. Ideally, the new
TOC in Santa Fe will use a small number of highly efficient communication techniques to
disseminate information most efficiently.
A Traffic Operations Center in Santa Fe would increase the effectiveness of interagency
communication within District 5, as well as effectively communicate the vast amount of ITS data
to pertinent parties. This not only will this benefit the Santa Fe region, but it also will take some
94
Personal Correspondence with Tim Brown. NMDOT ITS Bureau 95
(NMRoads 2015) 96
Idem. 97
Idem. 98
Personal Correspondence with Michael Fitzpatrick. MassDOT HOC 99
Idem. 100
(FirstNet 2015) 101
Idem. 102
Idem. 103
Personal Correspondence with Tim Brown. NMDOT ITS Bureau

37
of the burden off of the Albuquerque Traffic Management Center. A TOC would provide a
solution to the lack of interagency communication at the District level. It would also utilize the
vast amount of incoming ITS information and translate it to the respective agencies which
currently do not receive this information.
2.5 District 5 Incident Management
One of the key functions of the TOC is to manage traffic incidents. The organizations
that are involved in District 5 traffic incident management include state police, local fire
departments, NMDOT, and EMS. District 5 has its own set of procedures in place to manage
traffic incidents. These procedures are independent of other organizations, and highly specific to
the TOC.
2.5.1 Current District 5 TOC Incident Management Plan
David Martinez and Brian Ainsworth of the NMDOT District 5 Office described the
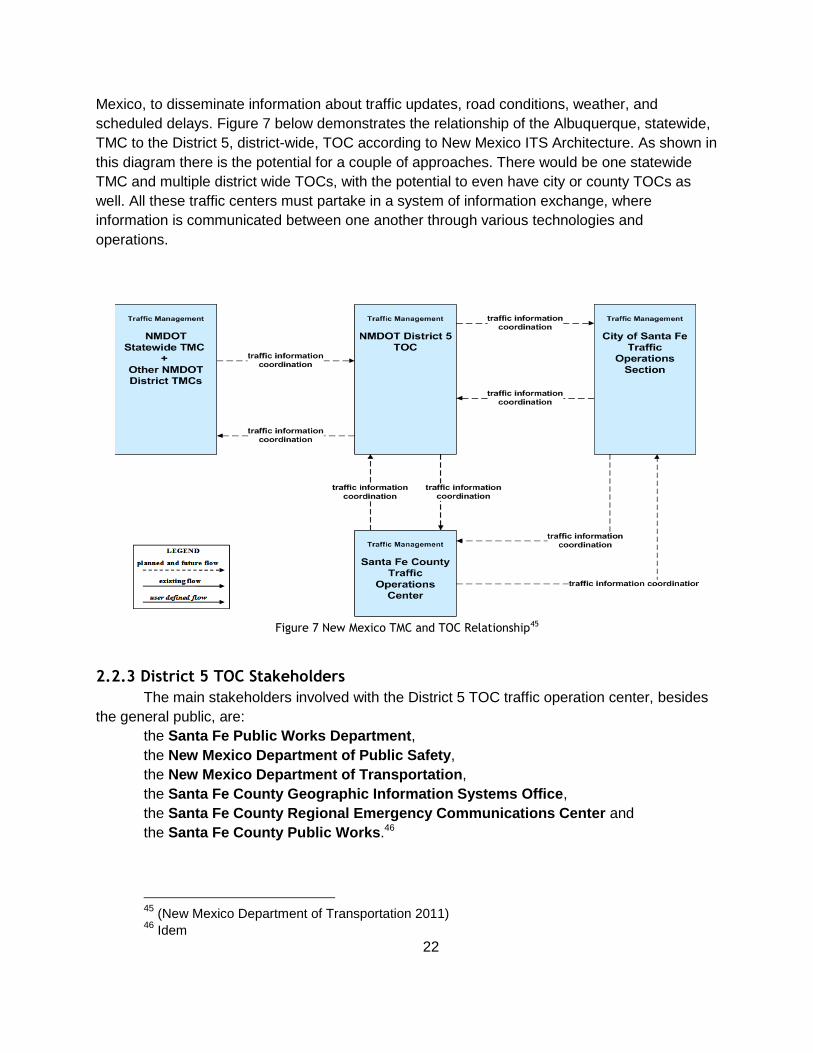
following current traffic incident management procedure for District 5. An incident is typically first
identified by a patrol vehicle, police car or civilian. If a patrol vehicle notices the incident the
driver is supposed to radio the dispatch office with the information. If the radio does not pick up
a frequency, the patrol vehicle drivers may use their cell phone to make the call. Radio calls are
recorded on a hand written log. After the driver’s shift is finished or at stopping points, he or she
will record the time, who called, the road, mile/marker and a brief message describing the
incident by hand writing on a log. If a call was made to the dispatch office by cell phone, not
radio, the call has a chance of not being logged as it was not a typical “radio call” that is part of
the procedure. Once the patrol yard dispatch is notified, the dispatch office will email the
respective New Mexico Department of Transportation District Office about the incident. If police
have not been notified yet of the incident the district office will email or call the police to inform
them of the incident. The police are the only ones with the authority to close down roads or
reroute traffic. The police work with the NMDOT district offices to make a decision on how to
best manage the traffic in response to the incident. Once a resolution has been made the public
information officer in the district office will update 511 and NMRoads with the traffic information.
The Albuquerque TMC approves all NMRoads posts, then updates 511, and will rotate the
cameras for the district if they need to survey the road. At the end of the week the patrol vehicle
logs that were hand recorded at the time of the call, are hand copied over to another paper log
that serve as the final record, and legal document. Figure 17 below is the first log that the
dispatcher uses in District 5, and Figure 18 represents the final log that is used.
38
Figure 17 Dispatcher Note Log104
Figure 18 Official Dispatcher Incident Log105
This system of posting to NMRoads and 511 allow the public to have easy and quick
access to traffic conditions and incident reports that may affect their driving. The district office
has 20 minutes within notification of the outcome of the incident to report the road conditions
outside of a metropolitan area and 10 minutes within a metropolitan area. This system is in
effect due to the 23 CFR 511, Real-Time System Management Information Program.106 Santa
104
Personal Correspondence with David Martinez. NMDOT District 5 105
Idem 106
(Federal Highway Administration 2010)

39
Fe has a population of about 116,000 and is therefore still considered a rural area for reporting
statistics so Santa Fe is required to report incidents within 20 minutes.107 Currently there is a
huge effort to have interagency correspondence and collaboration over traffic related incidents
amongst federal initiative 23 CFR 511.
If the police department was first contacted about an incident, the police dispatch office
will email the NMDOT district office about the situation and the rest of the procedure will
continue as previously stated. This email chain contacts everyone who could be relevant in the
DOT (including the Albuquerque TMC and District 5 TOC) so that the incident will be seen by
someone at any hour of the day, and will be reported and handled accordingly. For issues that
are more critical and important, phones are used to contact personnel between the State Police
and DOT. Once the data on road conditions is collected it is then organized into NMRoads.
Typically if a civilian first notices the incident they will call the police and the plan will
continue accordingly. If the DOT district office needs to contact other organizations about the
incident they will typically call, email or radio them depending on the situation and
organization.108
2.5.2 Computer Aided Dispatch
Computer aided dispatch (CAD) is a system that dispatchers in a call center will use to
help speed up the process of sending a unit of law enforcement or fire department to an
incident. CAD systems allow public safety operations and communications to be augmented,
assisted, or partially controlled by an automated system. This advanced software can offer an
ease not only to reporting incidents, but to logging them as well as integrates cross platform
communication through radio and cellular communication. CAD systems use a grid at the most
basic level. What this means is that a geographic area is divided into grids so that when an
incident occurs in a zone then a unit that is assigned to that zone would respond even if a unit
assigned to another grid would be closer. This uses basic geographic information system (GIS)
data to determine the different zones and which zone the incident occurs in. CAD systems can
be enhanced for better performance with automatic vehicle location (AVL) and geocoding.
Automatic Vehicle Location is a system that can track the location of vehicles and give updates
to dispatchers. Geocoding is a system that translates addresses into a latitude and longitude.
The latitude and longitude of the address would be compared to the position of units in the area
that can respond. Whichever unit is closest would be automatically dispatched to the address.
The most advanced system of CAD would be able to use GIS and AVL to determine how long
each unit that could respond would take to get to the incident, which could help improve overall
incident response time. This would be determined by using the GIS information about the roads
in the area and if there are one way streets or restrictions on turning. CAD systems can be
modified to suit the needs of different agencies. The fundamentals of a CAD system are that it
will generate incidents that are called in by a citizen or personnel in the field, assign field
107
Personal Correspondence with Keith Wilson. Santa Fe MPO 108
Personal Correspondence with David Martinez and Brian Ainsworth. NMDOT District 5

40
personnel to an incident, update created incidents, and time stamping actions made by the
dispatcher at the terminal.109
2.5.3 Stakeholder Involvement with District 5 Incident Management
An important element of incident management is the involvement of relevant
stakeholders. In terms of traffic management, when an incident occurs there are many
organizations that play a role in resolving a traffic conflict. Typically the Department of
Transportation will be involved through the district’s Traffic Operation Center or Traffic
Management Center.110 They will be in frequent contact with the police in resolving the issue
and any impact on the roads.111 Public safety communication services refer to the 911 call
takers and dispatchers, including the RECC.112 Law enforcement is most often used to secure
the scene, provide some medical treatment, conduct investigations, serve as incident
commander, and supervise scene clearance and direct traffic.113 These are the personnel that
are typically first contacted by civilians when an incident occurs. They will then notify the local
TMC or TOC of what situation occurred.114 EMS is typically involved in tending to any injured
persons from the traffic incident. Fire and rescue could be involved as well depending on the
nature of the incident and to help manage the scene. Towing and recovery are frequently
involved with removing and recovering vehicles from the scene and removing debris from the
roadway. And rarely hazardous materials contractors are used to help clean up and dispose and
toxic or hazardous materials as well as provide insight on the transportation of these
products.115 These organizations must all come together in order to effectively manage an
incident. Figure 19 below demonstrates the current process on how the District 5 and
stakeholders work together to manage traffic incidents. The solid lines indicate well established
lines of communication while the red dotted lines represent relationship that would benefit from
updating their communication methods.
109
(Law Enforcement Information Technology Standards Council (LEITSC) 2003) 110
Personal Correspondence with Tim Brown and John DiRuggiero. NMDOT ITS Bureau 111
Personal Correspondence with David Martinez and Brian Ainsworth. NMDOT District 5 112
(Jodoin 2015) 113
Idem. 114
Personal Correspondence with David Martinez and Brian Ainsworth. NMDOT District 5 115
(Federal Highway Administration 2010)

41
Figure 19 Current TOC & Stakeholders Incident Management Interaction

42
3. Methodology
This project will expand communication methods between the District 5 Traffic
Operations Center and its stakeholders, as well as enhance the software and hardware used
within the TOC. The first need was to have a thorough understanding of the technologies and
procedures currently used by the TMC, TOC and stakeholders. The next critical step entailed
exploring various communication methods and technologies to be implemented within the TOC.
This step involved identifying who the key stakeholders were and meeting with them to
determine their needs in terms of interagency communication, in addition to conducting
research on possible solutions. Multiple interviews were conducted in preparing for the final
recommendations. Once the needs of the outside organizations and the TOC itself were
established, several proposals on how to incorporate their findings into a plan for an updated
TOC and a standardized incident management communication procedure were created. In
order to accomplish this the following steps were completed:
1. Assessing current technologies and interactions between stakeholders in District 5, the
Traffic Operations Center in Santa Fe and the Traffic Management Center in
Albuquerque.
2. Exploring a variety of new communication protocols and technologies for the District 5
TOC.
3. Selecting the most effective technologies and interagency incident management
protocols for the District 5 Traffic Operation Center.
These goals were completed by evaluating the District 5 TOC to first determine current
interagency communication methods and potential improvements. This gathered information will
be compiled as the basis for creating a plan to update the District 5 TOC. Lastly, the information
was collected as a basis for creating a plan to update the District 5 TOC. This plan included an
effort to improve interagency communications as well. The key stakeholders involved with the
District 5 TOC were determined through a selection process outlined below. The project was
completed in Santa Fe between March 16th and May 5th, 2015. Figure 20 below outlines our
project mission and the steps necessary to complete our goals.
43
Figure 20 Goals to Creating a Traffic Operation Center for District 5
3.1 Assessing Current District 5 Operations and Interagency Interactions Methods
In order to create a TOC for the NMDOT District 5, it is important to establish all the
needs of the Department of Transportation. In doing this, our group intended to find exactly what
the Department of Transportation wanted out of the traffic operations center, as well as review
possible improvements to the local DOT operations. Part of this process entailed determining
the major stakeholders involved with incident management and evaluating their perspective on
the current communication methods. We assessed the TOC by establishing its needs and
determined the interactions, between key stakeholders. The steps that were necessary to
gather this assessment include:
● Interviews with District 5 stakeholders
● Interviews with Albuquerque TMC personnel
● Interviews with District 5 TOC personnel
3.1.1 Determining Key Stakeholders Involvement with Traffic Incident
Management
We met with our sponsors Timothy Brown and John DiRuggiero of the New Mexico ITS Bureau
to determine who the key stakeholders are for our project. In this meeting, we asked our
sponsors questions like who do the traffic centers work the most with, what do centers expect

44
from stakeholder interactions, and how they define these stakeholders. This discussion led us
our first set of structured interviews with the:
● Santa Fe MPO
● Santa Fe County GIS Office
● Santa Fe EMS Office
Based off of these interviews we established a second set of stakeholders that would be
beneficial to interview. These organizations consisted of:
● Santa Fe RECC
● New Mexico DPS
We created a set of interview questions specific to each stakeholder prior to each
meeting. These questions can be found in Appendix A. These interviews ultimately sought to
establish the stakeholders’ role in traffic incident management. More specifically, the topics of
the interviews included what the needs of the agency were, what information they could provide
to a traffic operation center, what information they would want from a traffic operation center,
any limitations they saw in the current incident management process, and any areas of
communication they believed were particularly efficient or inefficient. Table 1 below was
created to organize the information gathered from these meetings. The table also provides an
example of the type of information that we wanted to receive from these interviews.
Table 1 Stakeholder Feedback
We used Table 2 below to organize the information gathered from the structured
interviews on how each agency placed a role in traffic incident management. A crash scenario
was filled out to demonstrate how these interviews would show relationships between
stakeholders and causes of traffic incidents.
Table 2 Current TOC Incident Management

45
3.1.2 Evaluating The Albuquerque Traffic Management Center’s Operations and
Technologies
Next, we visited the Albuquerque TMC to observe their practices and technologies as well
interview TMC personnel. Prior to this meeting we formed a series of questions which consisted
of who the stakeholders/agencies that the TMC works with, do you see any inefficiencies or
areas for improvement, and what data logging software package do you use. The full list of
these questions can be found in Appendix A. From these questions we were able to thoroughly
observe the operations and functions that take place within the TMC. During one of the visits we
met with a TMC dispatcher to discuss the current means of radio logging and communication.
From here we went and viewed the TMC room with the various camera monitors to get an even
closer look at how the TMC functions.
3.1.3 Current District 5 TOC Data Collection
We visited the Traffic Operations Center following our visit to the TMC. At the TOC, we
observed the overall practices and functionality similar to what we reviewed at the TMC. Some
of the questions we reviewed with the DOT Dispatch consisted of what Software packages are
used, what hardware does the center currently have, what are the agencies the TOC
communicates with, and how are you notified about different scenarios? The full list of questions
from this meeting can be found within Appendix A. From these questions, we gained insight into
how the systems and operations function as well as how the TMC interacts with local
stakeholders. One of the main opportunities that arose from this meeting was the ability to view
the current TOC room and its current setup. This allowed us to draw conclusions on areas that
could be improved. These findings ultimately led us to fill out the Table 3 Current TOC
Organization chart, which contained some of the information displayed below.

46
Table 3 Current TOC Organization
3.2 Exploring New Communication Protocols and Technologies for the District 5
Traffic Operation Center
Our interviews provided us with a lot of information about the efficient and inefficient
technologies and practices currently in place between the TMC, TOC, and stakeholders. We
then used this information to look into new solutions that could ultimately be implemented within
the TOC. Some systems we considered are already used in the TMC and others are completely
new to both the TMC and TOC. The steps that were necessary to explore solutions that would
improve the efficiency of the TOC include:
● Discussion of TMC technologies and protocols suited for implementation within
the TOC
● Discussion of technologies and protocols that are new to both the TMC and TOC
3.2.1 Distinguishing TMC Practices Suited For TOC Implementation
We interviewed TMC personnel multiple times in order to both assess the TMC’s functions, but
also to hear their analysis of the District 5 TOC. In one set of interviews we met with the head
dispatcher, our sponsors and the ITS Bureau Chief, Charles Remkes. In this meeting, we asked
questions that would provide us with information about the statewide TMC, and a vision for the
TOC updates. The specific questions asked can be found in Appendix A. We classified possible
TMC practices for implementation with how we determined that they could be beneficial for the
TOC.
We asked the TMC if they had any strong communication methods with any stakeholders. The
head dispatcher and our sponsors told us about the state police email notifications that get
sent to the NMDOT about traffic incidents that the state police helped resolve. We then used
this information to look into ways that the TOC could mimic this communication system.
Next the head dispatcher showed us of all the applications of NMRoads. From our previous
interviews we realized how little the TOC used NMRoads. We saw that the next steps of
potentially implementing the expansion of NMRoads access to the TOC would require
additional research and interviews with TMC personnel about the workings of NMRoads logs,
camera control, and levels of administrative access.
The TOC personnel mentioned in one our initial meetings that the TMC uses automatic vehicle
location on their state vehicles. In our secondary meetings with our sponsors and TMC

47
personnel we asked about the applications of automatic vehicle location and the possibility of
implementing such as system for the TOC.
3.2.2 Investigating New Technologies and Practices for the TOC
We also looked into various systems that could be implemented that are not currently in use by
the TMC. We conducted the following steps to ensure that we had investigated all possible
solutions:
● Visits to traffic centers in Massachusetts and New Mexico
● Research on other states’ traffic management tools
● Research on additional technologies and practices
We went to the Boston Highway Operation Center in Massachusetts before arriving in
New Mexico in order to evaluate their operational strengths and to determine whether they
could be translated to the District 5 TOC. During this visit we asked questions about the basic
functions and tools used in traffic centers. We then went to the Worcester Department of
Public Works Traffic Operation Center in Massachusetts to see a city level perspective of
TOCs and potentially compare to the District 5 TOC. When we arrived in New Mexico we visited
the Albuquerque Traffic Management Center. Our sponsors gave us a tour of the
Albuquerque TMC and showed us the technologies and methods used to regulate traffic on a
state level. We later visited the Los Alamos Traffic Management Center to observe a larger
variety of traffic management systems. Appendix A contains sets of questions that were used
during our interviews. Table 4 below was used to organize the information that we learned from
these visits with an example of type of information we classified for each category.
Table 4 TMC Models
During our tour of the Albuquerque TMC we were advised to research other states’ websites to
see what they were using to inform the public on traffic conditions. That states that we studied
were Wyoming, Virginia, Georgia, Massachusetts and the California San Francisco Bay
area. We looked at these states for different ways to organize NMRoads and other online
features that could expand the capabilities of the site. We also looked at various methods of
informing drivers of road conditions. Research was conducted on various technologies that
these states use to collect, organize, distribute and log traffic data.
We used the information we gathered from our interviews to determine areas that need
improvement within the TOC. We met with our sponsors to see if they also had any suggestions
on potential solutions that they wanted us to look into. The information we gathered from our

48
research on different traffic centers and state websites was combined with feedback from our
sponsors to create a set of new technologies and protocols that we further researched as
potential solutions. These systems include:
● Dashboard Systems
● RECC feed
● SMS Notifications
● Interagency Contact List
● Multi-Jurisdictional Boundary Map
● Modeling Tools
● Video Analytics
● Computer Aided Dispatch
● Computerized Logs
● Direct Export to 511 from NMRoads
● Interagency Conferences
The following descriptions provide more detail on how we received the ideas for each specific
solution and ways that we researched them.
Our advisor, Professor Carrera, recommended looking into the use of Dashboard Systems as
a tool to compile data from a variety of sources. Dashboards typically output data; however we
looked into ways that the Dashboard could be used to input data for our project. We worked with
Professor Carrera, Tim Brown and John DiRuggiero to compile a list of potential widgets for
District 5 and NMDOT Dashboards. Professor Carrera contacted his colleagues at City
Knowledge to help us build the perspective Dashboards.
When we were at our interview with the Santa Fe RECC we learned of the possibility of creating
an RECC Feed to display the RECC’s traffic data for the TOC. We then worked with our
sponsors and advisors to try and find different technologies that could incorporate a RECC feed.
In our RECC meeting we were told how the RECC uses Short Message Service (SMS)
notifications to alert the public about emergency situations that would affect their safety. We
considered and reviewed the idea of using SMS notifications within the TOC as well. During our
meeting at the RECC we realized the need for agencies to be able to communicate with one
another. Our sponsors suggested we look into finding a chatroom style system so that
multiple agencies can instantaneously communicate with one another.
At the District 5 TOC we asked how the center knows what agencies to communicate with. We
then saw firsthand the set of paper documents that the TOC uses to operate. When we saw this
system we asked the TOC dispatcher if these paper sources were efficient in resolving an
incident. When we interviewed stakeholders we asked them the same question about who they
communicate and under what conditions. We found many stakeholders did not know who to
contact when an incident occurs. We thought it would be beneficial to both the TOC and
stakeholders to find a dynamic system that would better organize an interagency contact list.
We then worked with our advisors and sponsors to research different technologies that would
create this contact list.
During our meeting at the TOC, we saw a large map with the locations of all the patrol yards
relevant to District 5. We asked how well the patrol yards communicated with one another and

49
learned that within the NMDOT, in addition to stakeholders, there is often confusion over where
the boundaries lie for the different personnel among each organization. Similar to the contact
list, we were given the idea to look into making the poster into a virtual system to show
jurisdictional boundaries of different agencies. We then worked with our sponsors to determine
what type of information these jurisdictional boundaries map should contain and how to make
it to help promote communication.
Before arriving to New Mexico, our advisors recommended looking into modeling tools to help
for planning traffic incident management procedures. Professor Carrera introduced us to the
idea of using Simtable as a technology to be incorporated within the TOC. When we arrived in
Santa Fe, we visited the Simtable headquarters to attend an informational session lead by
Stephen Guerin, CEO. This meeting informed us how Simtable would promote traffic
interagency communication and moderate traffic flow. We also attended a follow up meeting at
Simtable to see how video analytics could be integrated into the Simtable technology and
potentially applied as a solution. Figure 21 below provides a visual demonstration of Simtable.
Figure 21 Simtable Usage, 2015116
We researched information regarding different types of video analytic systems and how they
could be incorporated within the TOC. Our Sponsors established that there was a demand for
this type of technology with the large number of traffic cameras in the state, which presents the
116
(Simtable 2015)

50
challenge of reviewing them all simultaneously. We reviewed various video analytic software in
order to see how feasible the available technology was for implementation in the TOC.
In our interviews, particularly with the state police and RECC, we were told about the agencies’
uses of computer aided dispatch systems. These virtual systems would increase the speed and
efficiency in communicating amongst agencies, help dispatch NMDOT vehicles, and has the
ability to log radio and phone calls. We researched different CAD systems that could be
implemented within the TOC due to the demand for this type of system. The criteria for locating
the best possible CAD solution can be found in Appendix B Table 8.
A common question that we asked in our interviews was whether the respective stakeholder
currently has a well-established method for logging data. We recognized that the TOC could use
a more efficient logging process and used our interviews as a way to review new computerized
systems for logging. We compiled a list of best practices to utilize within different agencies
and worked to create a solution that could best improve the district 5 TOC.
In our meeting with the TMC we also asked how NMRoads and 511 work. We tried to learn
more about these systems functions so that we could investigate the idea of combining the
abilities to distribute data to the public through NMRoads and 511. Our sponsors recommended
the possibility of this direct export to 511 when we asked them if there were any processes
that we they wanted us to consider as solutions.
It was very common during interviews for the stakeholders to mention how they weren’t happy
with the inconsistencies in communication amongst different agencies. We began to discuss
issues and best practices within each organization to determine how to improve interagency
interactions. Some of the solutions we mention previously in this section provide brief, real time
means to communicate; yet we saw the need to look into possible ideas that could be
implemented on a larger scale in terms that would create regular lines of communication. From
our interviews with various stakeholders, we noticed that many of them voiced best practice
information as well as concerns for projects other agencies were working on. From this we
gathered that there was a need to increase communication that is not in real time. Many
agencies spoke highly of other interagency conferences they had attended in terms of
improving interagency relations.
3.3 Selecting the most effective technologies and interagency incident
management protocols for the District 5 Traffic Operation Center.
After all the possible solutions were compiled, we created methods to select the most beneficial
technologies and protocols for the District 5 TOC. First, we gathered all the information from our
various interviews with stakeholders and NMDOT personnel to determine the main needs of the
TOC. We used multiple evaluation charts that are designed to analyze the features of each
option. We prioritized the solutions that seemed the most beneficial to the TOC based off of the
results of these evaluations. These charts helped for us to select the ideal enhanced features
for the TOC which we reviewed with our sponsors, advisors and key stakeholders to get their
feedback. We incorporated their feedback to make the best possible solutions for our final
recommendations. Figure 22 below displays the steps taken to achieve the selection of final
recommendations.
51
Figure 22 Selection Methods
3.3.1 Determining TOC Needs
Our team rationalized that we would need to establish what the overarching needs of a
TOC are in order recommend the most effective technologies and protocols. In order to
objectively do this, we used a Pairwise Comparison Chart (PCC). A PCC chart is designed to
rank two objectives against one another in order to determine which is most important to our
sponsors and stakeholders. We determined the objectives for the PCC based off of what
functions were emphasized the most throughout our meetings. The PCC was used to determine
the TOC’s primary needs in order to manage traffic and communicate with stakeholders. In the
PCC, each solution is directly compared to the alternatives, and the more important or better
solution receives one point, while the worse solution receives zero points. In a tie, each solution
receives a half of a point. Solutions are ranked by the number of points they received; the most
important solution is the one with the highest score, the least important with the lowest score.
Table 5 below displays the PCC for our project.
Table 5 Pairwise Comparison Chart of Project Objectives

52
Based off of this chart we established the following goals for the TOC, listed in order by those
with the highest priority:
1. Improved Logs
2. Provide NMRoads Access to TOC
3. Interagency Data Compilation Source`
3. Improved Stakeholders Training
4. Improved Plow Tracking
5. TOC Infrastructure Expansion
6. Improved GIS Update Protocol
We needed a way to organize all the possible solutions we gathered that would
accommodate the project goals. All ideas were organized into a Morphological (Morph) Chart.
A Morph Chart lists the functions, means and features for a specific tool and then all the
possible ideas per topic. In terms of this project, the Morph Chart was modified to reflect the
results of the objectives; such as improving interagency incident management protocols as well
as expanding the TOC operations. For each of those categories, potential means, functions and
features were then listed. Table 6 below contains an example of sample data compiled into a
Morph Chart.

53
Table 6 Solution Morphological Chart
3.3.2 Evaluating Possible Solutions for the TOC
The results of the PCC were used to determine the evaluation criteria for possible
solutions. In other words, the solutions should meet the TOC needs. The most important criteria
were:
● Enabling interagency communication
● Meeting requirements of the TOC
● Removing redundancies in information flow
● Simple and feasible to implement
● Satisfying ideal TOC requirements.
The following section provides a more thorough description of the evaluation criteria.
Enabling interagency communication was an important criterion as many of the
current limitations of the TOC are caused by poor communication with stakeholders. By
addressing this problem, the TOC will be able to function more efficiently and achieve far better
end results.
Meeting TOC requirements was essential, as any solution to be implemented must be
consistent with the scope and goals of the TOC. A solution that falls outside of this requirement
must be disqualified, as it would require the TOC to implement something that it cannot. This
also ensures the TOC is able to modify any solutions as necessary. Static solutions will
inevitably become outdated and need to be replaced in the future. The solution should satisfy
the function of the agency, with the tools that they have regularly available.
Removing redundancies is crucial, as the TOC dispatchers often find themselves
without the time to fully record and log all information that the TOC collects. By removing
redundancies in the systems, less time can be spent on each individual data set, freeing the
dispatcher to focus on other tasks.
Recommendations should be simple and feasible to implement. Solutions that are
complex to implement will likely be discarded, as will infeasible recommendations by definition.

54
By requiring this criteria, we ensure that any recommendation can be utilized immediately to
improve the function of the TOC.
Finally, it is important that the solutions satisfy the ideal TOC model. Solutions that
satisfy the ideal model are the most effective solutions for the immediate improvement of the
TOC. A solution that satisfies the ideal TOC model is also likely to be the best solution for a
given problem. Implementing ideal solutions would also address the steps of the data
processing system. These solutions would all increase the efficiency of the TOC.
We then used numerical evaluation charts to objectively determine which solutions
the strongest are using the evaluation criteria that was just established. The numerical
evaluation chart analyzes which features best match the objectives deemed most important to
the sponsors and stakeholders. A numerical evaluation chart works by listing the constraints (C)
and objectives (O) for the particular topic. Then each option is listed horizontally. A scale is
created to evaluate how each design meets the objectives. If a design does not meet a
constraint, it cannot be used. The features with the highest value should be selected for
implementation. In this project we used a scale of 0- 4 to compare how each design meets the
standard, where 0 - does not meet, 1 - slightly meets, 2 - partially meets, 3 - mostly meets, and
4 - fully meets . A Numerical Evaluation Chart was made to represent the best possible
solutions with the options for features for the TOC design and interagency incident management
procedure. Table 7 below is an example of the Numerical Evaluation charts used to evaluate
each solution. The TOC Operations Numerical Evaluation Chart below is filled out for an
example of the usage of the chart based off of the sample data from Table 6. The other
numerical evaluation charts can be found in Appendix B Tables 9 - 14. Table 7 TOC Operations Numerical Evaluation Chart

55
0 - does not meet
1 - slightly meets
2 - partially meets
3 - mostly meets
4 - fully meets
We used these charts to have a tentative set of final recommendations. We brought
these ideas over to ours sponsors, advisors and key stakeholders to receive their feedback. The
personnel we reviewed our recommendations with include:
● John DiRuggiero
● Tim Brown
● Additional TMC Personnel
● Additional TOC Personnel
● Professor Carrera
● Professor Barton
We adjusted our possible solutions based off of the feedback we received to make our solution
as thorough as possible. Every time we made changes we would adjust the evaluation charts
accordingly. We determined that we had our final set of recommendations when we felt that we
had arrived at the best possible solutions that adequately satisfied our criteria

56
4. Results and Analysis After compiling data from our interviews we categorized the information into the following
categories to later form our final recommendations:
● A suggestion of TMC practices to be directly or modifiable for TOC implementation.
● An analysis of potential data collection methods.
● An analysis of potential data organization methods.
● An analysis of potential data distribution methods.
● An analysis of potential data log methods.
In order to achieve these results we established the current technologies and
interactions between the Albuquerque TMC, District 5 TOC and New Mexico stakeholders. An
analysis of the TMC data processing methods provided a starting point of potential practices to
be implemented within the TOC. The creation of evaluation criteria, in combination of the use of
evaluation charts and follow-up meetings with our sponsors and key stakeholders, enabled us to
select technologies and interagency incident management protocols.
4.1 Current Technologies and Interactions Between Stakeholders in New Mexico
The relationship between the Albuquerque TMC, District 5 TOC and New Mexico
stakeholders was analyzed to determine the efficiency of the incident management methods
and technical operations that are already in use. These relationships were evaluated in respect
to a data processing system. This system was used to analyze the strengths and weaknesses
within the TOC and TMC. The stakeholder’s involvement with incident management procedures
set the stage for areas within the data processing system.
4.1.1 Traffic Data Processing
There are four overarching categories that all traffic management technologies and
procedures could fit into in terms of data processing. These categories were data collection,
data organization, data distribution, and data logs. Data is information regarding a traffic incident
or other information relevant to the NMDOT. Data collection refers to the means of which
information is gathered, obtained, or is notified of information regarding relevant traffic
information. Data organization is classified as displaying and categorizing data. Data distribution
refers to sharing processed information. Data can be distributed statically or dynamically in real
time data. The last major action for the data is logging. This refers to any system of archiving or
holding records of data for an extended period of time after its initial relevance. Figure 23
displays this data processing schematic.

57
Figure 23 Data Processing System
To complete our first objective of assessing current operations between the stakeholders
of District 5, the Traffic Operations Center, and the Traffic Management Center in Albuquerque,
we needed to visit, observe, and question the processes that took place at each location and
make note of how different organizations handled data collection, organization, logging and
distribution, for similar issues the NMDOT will have to deal with. This was an effort to collect
industry best practices that we could suggest to apply in other locations. We used the
Albuquerque TMC as a model, because they use a similar data collection system, which was
assessed to determine what would be feasible to implement in the District 5 TOC.
4.1.2 Stakeholders Involved in Incident Management
Stakeholder involvement is a key aspect of a successful TOC. There are many ways in
which this can be accomplished. For the District 5 TOC these include:
● Interagency Alert Emails
● Utilization of RECC Feeds
● Collaboration with Los Alamos TMC
Figure 24 below is a diagram of the current relationship between the NMDOT, TMC,
TOC, and respective New Mexico stakeholders. This chart is the result of our interviews and
research in determining which agencies currently have strong and efficient or inefficient lines of
communication in place. The solid lines indicate those interactions that are currently working
well; the dashed lines indicate relationships that would be beneficial to strengthen. This diagram
helps to analyze possible solutions in terms of planning how to strengthen the relationships
specifically of those that have dashed lines. This diagram helped to set the stage of our results
in terms of solutions that would improve these relationships.

58
Figure 24 Stakeholder to NMDOT Evaluation
Through assessing the Albuquerque TMC, we found that the bulk of the information
that is transferred to them from other agencies is via email. The state police are responsible for
closing roads, and hear about most incidents first due to 911 dispatch contacting them (typically
though a CAD based system).
Figure 25 Email from State Police to TMC

59
As seen above in Figure 25, interagency emails utilize a medium of communication that
is free, and all those necessary can access. This example shows a road closure due to a train
collision. In the future we would like to see additional organizations utilize this type of alert
system to bring other incidents to the attention of the NMDOT. The only caveat with this email
notification system with the police is minimal accountability on the state police end of the
communication to report when a road has re-opened, or when an incident is cleared. This
however will be solved once the state police implement a new CAD system, which will
automatically send updates (still via email) to the DOT and will automatically notify them when
incidents are cleared.
Organizations such as the RECC, (the Regional Emergency Communication Center for
the Santa Fe Region) handle all the dispatching for Santa Fe County for Police, Fire, and EMS.
Currently their CAD system has a filtering method for car accidents, which has been tagged
“Code 29”. Although this database has personal information embedded within it, there is the
potential to extract only the critical information such as the location of the accident, number of
vehicles involved, and the time of the accident and send this information to the DOT. To this
point, there has been no collaboration of the Code 29 Data, which has the potential to greatly
benefit the NMDOT
Similarly, the lack of established communication with the RECC, there also currently is
no consistent collaboration with the Los Alamos TMC. Information about the systems used in
the Los Alamos TMC, as well as other traffic centers, can be found in Appendix D Table 19. The
Los Alamos TMC currently has only 9 cameras, and because of this, they have the ability to
view them all simultaneously unlike the TMC in Albuquerque. They do not need video analytics,
and can easily manage their system. There are no patrol vehicles at this location, so issues that
the NMDOT runs into regarding vehicle tracking do not apply here. The main potential at Los
Alamos is to simply establish lines of communication, so that incidents happening between
jurisdictional boundaries can be reported on the NMDOT and Los Alamos DMS, websites and
511. Collaboration of what is on the dynamic message signs in Los Alamos, and having them
update that information to NMRoads has yet to be established. In addition to this, the camera
feeds for Los Alamos are not available on NMRoads. This is a simple collaboration that can
easily be addressed so that both parties may benefit from shared information.
The NMDOT also would like to establish regular lines of communication between
themselves and the MPO. Often times, due to a lack of communication, construction is found
out by NMDOT personnel actually driving through a construction site, then making a further
inquiry about the construction and updating NMRoads. Due to this, regular lines of
communication need to be established between the MPO office and the NMDOT.
The final organization that the DOT would like to receive regular updates from is the
Santa Fe County GIS Office. Currently there is no standardized process for maps to be
transferred from the GIS Office to NMRoads. This is critical to the NMDOT because the GIS
Office is the first to know of any map and road changes. This data needs to be sent to the
NMDOT regularly. Improving data collection from the stakeholders such as the GIS Office,
MPO, RECC, and State Police is critical to improving the effectiveness of the District 5 TOC.

60
In Appendix D Tables 16 and 17 display the results of the stakeholder and TOC
relationship analysis. In addition Appendix D Table 18 explains how these stakeholders play a
role in the current TOC incident management procedure that we gathered from our interviews
and research. Lastly, in Appendix D Table 19, the results of the technologies and incident
management methods used in the TMC models: Boston, Worcester, Albuquerque, and Los
Alamos, are recorded. These results were beneficial in finding examples of potential solutions to
be implemented within the TOC.
4.1.3 Albuquerque Traffic Management Center Data Processing Methods
The TMC in Albuquerque currently uses many tools in its data processing. The specific
systems and technologies we discovered that are used by the TMC can be found in Appendix D
Table 19. These tools cover the four process steps: collection, organization, distribution and
logging. Figure 26 displays how these tools fell into each part of the data process system.
The Albuquerque TMC uses the following technologies and systems:
● Courtesy patrol vehicles ● State police email ● Public ● Inrix ● Traffic Cameras ● Wall of monitors ● NMRoads ● Dynamic Message Signs ● NMRoads ● 511 System
Figure 26 Albuquerque TMC Current Data Processing Methods
The TMC collects data through observations by the courtesy patrol vehicles. These
courtesy vehicles are efficient in collecting data since they are driving on the roads. The

61
courtesy vehicles get to see how much traffic that is on the roads as well as attempt to alleviate
minor problems encountered. This system works well within the TMC as all courtesy vehicles
have AVL installed to provide the TMC with real time data which enables the TMC to decrease
the time it takes to identify the location of incidents. This continuously income of data helps the
TMC to maintain a rapid incident detection rate.
The email notification system that the NMDOT receives from state police is an efficient
way to gather information about traffic incidents. This collection method is useful because the
TMC receives the information about incidents quicker from the state police than if they were to
use the courtesy vehicles or the cameras to notice the incident. This combination of the state
police emailing the TMC and the courtesy vehicles observing incidents on the roads leads to an
efficient system for finding incidents that happen in the Albuquerque area.
Another method of data collection within the TMC is the usage of traffic cameras.
These cameras are a very productive way for the TMC to gather data regarding incidents. The
camera can indicate the location of the incident, which can be determined instantaneously,
based on which camera is in use. The TMC has the ability to adjust the camera in order to
assess the situation as needed. This control helps the TMC to independently analyze a situation
without relying on other organizations decreasing the TMC’s response time.
The TMC organizes data through their display of the data collected by the traffic
cameras. The live feed of the cameras are shown through a wall of monitors of the TMC. This
wall categorizes the cameras by location and allows dispatchers to easily focus in on a
particular monitor when necessary. Some camera feeds are color coded to distinguish certain
roads from each other.
From the collection and organization of the information, the TMC then distributes data
about traffic incidents through posting to NMRoads and adding the information to 511. This
system works well for the NMDOT by providing the public with multiple ways to quickly view
traffic information, yet it requires a few steps within the TMC to post. The process has the
potential to be made more efficient in reducing the amount of actions needed to post on both
NMRoads and 511. This system would be very useful to take advantage of within the TOC.
Once the information about traffic incidents are collected, organized, and distributed, the TMC
stores the information for potential future uses.
The TMC logs data in two different log systems which are the radio logs and the
NMRoads logs. The TMC uses the radio logs to document the observations and uses of the
courtesy vehicles while the NMRoads log is used to add incidents to NMRoads for the public to
see. Each log contains drop down menus in order to promote consistency and efficiency in
reporting incidents. The TMC is currently the only center in New Mexico that utilizes this two log
system through NMRoads. The TMC collects, organizes, distributes, and stores information
about traffic incidents. This was compared to the TOC to determine how the TOC could use
technologies from the TMC to collect, organize, distribute, and logs data.
4.1.4 Current District 5 TOC Data Collection
Data collection is one of the most important tasks for a TOC to operate effectively.
Because of this, we analyzed the data collection of the District 5 TOC to better understand its
strengths and weakness. We discovered:

62
● Handwritten Paper Radio Forms
● A Need for NMRoads Camera Access and Training
● A Need for Efficient Data Processing
From meeting with the District 5 Traffic Operation Center and the stakeholders located in
District 5, we identified the strengths and areas of possible improvement of the TOC. We were
able to determine which aspects of the TOC were efficient and those that could be improved, by
analyzing the results of current TOC organization, which can be found in Appendix D Table 20.
Since the TOC uses paper forms, as described in background section 2.5.1, the information
takes longer to record since it is written multiple times before being put into NMRoads. This
leads to information being lost along the way when transferring the data which becomes a
problem since any information about an incident report could be important.
The Albuquerque TMC controls all of NMRoads, including camera pan, tilt and zoom
controls. This system for posting to NMRoads and moving cameras is inefficient because the
TOC needs to call the TMC to get anything added or moved when they could just do it
themselves. Currently the District 5 TOC does not get any NMRoads training so they need to
work through the TMC or the PIO to update NMRoads and rotate cameras.
Since the TOC is a main point of gathering traffic information in incident management
procedures; it is important to explore a variety of more advanced or efficient processing
methods. The TOC needs to know of traffic conditions and incidents in order to be of use to the
district and reach its optimal functionality. With a variety of information coming into the TOC, it
will then need a few ways to organize the data. Data organization is important to make sense of
all of the information that has been collected in terms of who is it important to, what is it and
what should be done next. One of the main issues that we observed from our meetings that
prevents a strong interagency incident management plan is that when incidents occur most
agencies and TOC personnel don’t know who to contact. Therefore, the District 5 TOC could
increase its efficiency and functionality by better organizing the data the center receives in terms
of who should be contacted under what circumstances. Once data is efficiently collected and
organized; it is important to distribute the data to other agencies involved. The operations of the
TOC and the district’s incident management plan could be improved by permitting the TOC to
have more data distribution functions. A TOC needs to store its data, often for legal reasons, but
also to allow future analysis to identify issues throughout its operations and in the field.
4.2 Communication Protocols and Technologies for the District 5 TOC
Through our research we established that the TMC has operations that allow it to make
use of all aspects of data processing; collection, organization, distribution and logging. Based
from our analysis, it is clear that the TOC would benefit from additional practices and
technologies that would expand its functionality in data collecting, organizing, distributing and
logging. The Albuquerque TMC can serve as an initial model for the TOC on practices that all
aspects of data process. Some of the methods currently in use by the TMC have the potential to
be directly implemented within the District 5 TOC. Yet not all of the TMC’s methods would be
helpful to the TOC as they currently exist. Some would be most beneficial with a few

63
modifications that would cater towards the TOC’s, not the TMC’s, needs. Lastly there are a
variety of possible communication protocols and technologies that neither the TOC nor the TMC
currently uses that could potentially be incorporated within both centers. Any and all solutions
were explored as to their properties and prospects of implementation. All possible solutions that
were considered for evaluation can be found in Appendix D Table 21. The District 5 TOC
currently focuses on data collection to be processed or used by other stakeholders and the
TMC.
4.2.1 Direct Implementation of TMC Practices to the TOC
There are several practices in the TMC that could directly benefit the TOC if
implemented. These practices could be copied without change from the TMC and immediately
put into effect at the TOC. The practices are:
● Interagency Notification System to the TOC
● District Access and Training for NMRoads
● NMRoads Infrastructure Control
NMDOT currently has an agreement with the state police where they use an email
notification system to communicate information about incidents that could affect traffic. There is
the possibility to expand this service within the TOC for other stakeholders with a variety of
interagency notification systems to the TOC. The current email notification system used
between the NMDOT and state police has proven to be very efficient for collecting traffic data
and establishing lines of communication between the two organizations. This email notification
system would be structured the same as the current state police system, but would be
expanding to other groups.
Another TMC process that could be directly implemented within the TOC would be
district access to NMRoads. Currently NMRoads has the ability for different users, like PIOs
and dispatchers, to have administrator access in all districts, yet frequently the districts are not
aware of these capabilities that the TMC already utilizes. Districts would be reminded that they
have the ability to give dispatchers administrator rights. If the districts were appropriately trained
there could be the possibility that the districts can directly publish to NMRoads and have control
of infrastructure without going through the TMC first.
NMRoads expansion could be accomplished by providing different levels of
administrator access within the TOC. The TOC would have one system they already use where
they could easily retrieve data from different sources. The TOC or TMC could vet the imported
data. In this sense, NMRoads could serve as a data collection source from external sources for
the TOC.
With appropriate training, the TMC could directly implement NMRoads infrastructure
control to the TOC as well. The TOC could have more control of the District 5 infrastructure,
such as traffic cameras and DMS, so that they could collect data from these technologies
independently from the TMC. Extensive training would be required in order to provide camera
and DMS control. This could increase efficiency of the TOC as they could use the infrastructure
in terms of their own needs to gather information the moment an incident occurs in the district,

64
and not rely on a middleman to control the camera functioning and viewing as well as DMS
postings. All personnel, within the TOC and externally, with NMRoads access would receive
trainings specific to their respective NMRoads abilities.
4.2.2 Modified Implementation of TMC Practices to the TOC
There are several practices in the TMC that could benefit the TOC if altered before
implementation. Such practices would need some changes from the current TMC
implementation and then introduced at the TOC. The practices are:
● Patrol Vehicle Location Information ● TOC NMRoads Administrative Hierarchy ● Automatic Vehicle Location Logs ● NMRoads Incident Logs
Figure 27 below shows what features currently exist within the TMC and how they could be
modified in order to be successfully incorporated within the TOC.
Figure 27 Implementations from the TMC with Modifications for the TOC
Although there are some TMC practices and tools that could be directly implemented
within the TOC, there are a few that would satisfy the needs of the TOC if they were adjusted
before implementation. The TOC operates under different conditions than the TMC using

65
different technologies and addressing different issues, therefore it is appropriate that some tools
and processes of the TMC would not be effective as is without adjustment.
It was discovered through our meetings that the TMC uses courtesy patrol vehicles; and
provides traffic control assistance to law enforcement in the Albuquerque Metropolitan Area.117
These courtesy vehicles use GPS, a type of AVL, to track the location of the vehicles while they
are in use. The GPS systems use cellular networks to communicate information back to their
central location, a patrol yard or the TOC in this case. In the event that the vehicle loses cellular
coverage, the data would be transmitted when the vehicle reaches an area of coverage, such as
when it returns to its patrol yard. This system could be adjusted for the TOC by establishing a
system that would identify patrol vehicle location information. The patrol vehicle location
information could be found through the implementation of an AVL system as well. This
technology would expand the TOC’s abilities to collect data. An AVL system would allow for real
time or near to real time monitoring with no loss of data or resolution over time. Currently, the
closest thing the district has to AVL is through the logs submitted by the drivers on a weekly
basis. These have the disadvantage of not being updated in real time and being able to be
altered before submission. Access to this data would help build a more complete model of the
traffic systems in which these vehicles operate. By better understanding the traffic and road
conditions, the TOC can help plan better maintenance, response and improvement projects to
the roadways. The data would also allow the TOC to ensure that all vehicles are properly
responding to known incidents. The limitation of an AVL system is the potential anger or
unwillingness to implement the systems by the vehicle drivers, as well as the cost of
implementation.
From our research and visits to the TMC we learned that the Albuquerque TMC
dispatchers use NMRoads to record their incidents. This center also has a radio log in addition
to the road conditions administrator logs. The Albuquerque TMC uses the radio logs as a
performance metric for a radio call to document traffic incidents and use of the courtesy patrol.
The TMC NMRoads radio logs could be adjusted to function within the TOC as NMRoads
incident logs. Currently, the TOC in District 5 stores its records in logs on paper. This has a
number of key failings. First, the logs that are stored are copied from previous paper logs that
are handwritten at the time of an incident by the dispatcher. This causes issues as it takes a
significant amount of time to record each report, which can be disastrous during periods of high
activity, such as a snow storm. There is also the problem of limited standardization of logs. Each
dispatcher who takes an log takes the same basic information, but records it in a unique way.
This leads to non-standard logs that increase the difficulty of retrieving accurate data in a timely
manner. It is timely to both initially record and later retrieve data, since each report must be
copied by hand and is not easily searchable or indexable once created. The data is essentially
trapped in a difficult to access or utilize form, rendering it rapidly irrelevant. Therefore the TOC
would greatly benefit from a more advanced system of data logging.
The TMC’s NMRoads radio logs are a more extensive log system than that of the typical
admin log on NMRoads, and will record incidents or courtesy patrol usages that do not affect
traffic enough to be posted on NMRoads. The TMC therefore has two sets of log systems
117
(NMDOT 2012)

66
through NMRoads; one that consists of the radio logs (usage of the courtesy vehicles) as seen
in Figure 28 and the logs of information that is published publicly on NMRoads as seen in Figure
29. These log systems are automatically saved with the ability to export them if needed. The
NMRoads log systems also have the ability to automatically notify the TMC through email, call,
or text when an incident is logged; neither the Albuquerque TMC nor the TOC make use of this
function. Each log contains drop down menus in order to promote consistency and efficiency in
reporting incidents.
Figure 28 Albuquerque TMC Radio Log

67
Figure 29 Log System to add Events to NMRoads118
The TMC classifies one log system as radio logs because the information is gathered through
radio. In order to expand this concept to the TOC, the logs could be considered incident logs
and would record information from the patrol vehicles through any means of contact; phone,
radio or even email. The TMC’s two log systems could be further enhanced by reducing the
process to only one log system within NMRoads. This would increase efficiency as there would
118
Personal Correspondence with John DiRuggiero. NMDOT ITS Bureau

68
only be one step in the data logging process and it would be incorporated within NMRoads, a
system that is already used by both the TOC and TMC. These logging capabilities would
streamline the current incident reporting process by giving better tools to the dispatchers. The
districts would be able to retrieve these archived log records when necessary, and they would
be in a standardized, easy to understand, form. NMRoads training would emphasize this
change and help resolve the issues of inconsistent call logging.
Building upon these internal changes within, an additional modification to NMRoads
would be from mimicking the concept of the TMC NMRoads administrative hierarchy to a
version of TOC NMRoads administrative hierarchy. An administrative hierarchy is different
levels of logins that permit for different responsibilities of organizing data within NMRoads.
NMRoads currently organizes the majority of the internal operations of the TOC and TMC
through collecting, reporting and logging of data. The suggestion of more levels means a
hierarchy of login access for district level employees with different usage rights depending on
the needs of the employee. Different administrative levels would enable the tasks associated
with publishing an incident on NMRoads or logging patrol vehicle usage, to be more distributed
and organized so that there can be a standardized and efficient approach to using NMRoads.
Different users within the TOC would have different responsibilities as to logging, reporting and
storing. Various levels of notification systems and vetting processes could be incorporated as
part of the data organization process within NMRoads. By expanding the awareness of these
capabilities, within the TOC, the TOC will become more self-sufficient and less reliant on the
TMC. The TMC will also be capable of organizing data and regulating NMRoads through a
district wide, not statewide approach.
4.2.3 New Technologies and Practices
There are several technologies and practices that neither the TMC or TOC currently
utilize, but could greatly improve the effectiveness of either center. These would require the
most work to implement, as there is no current version in place, but would nonetheless be
beneficial. Figure 30 below displays the possible new technologies and practices. These
include:
● Dashboard System ● RECC Feed ● SMS Notifications ● Video Analytics Software ● Jurisdiction Boundaries and Infrastructure Map ● Modeling ● Interagency Conferences ● Jurisdictional Map ● Interagency Contact List ● Chat Room Style SMS Feed ● Direct Export to 511 from NMRoads ● Preset Excel Sheets ● Web Based Data Logging ● Computer Aided Dispatch

69
Figure 30 New Technologies and Practices
Although the TMC does offer a range of technologies and practices that could enhance the
TOC’s capabilities for data processing, there are still many other new tools that could be
considered for implementation. Since the ultimate goal is to expand the TOC’s operations to
increase interagency communication methods and technologies that would introduce new ways
for data collecting, organizing, distributing and logging were analyzed.
Dashboard System
70
One approach is to use data compilation sources, such as a Dashboard system, through
the use of the Dashboard widgets. The Dashboard widgets could serve as a data collection
method as the TOC could customize its widgets to be able to receive more or less
instantaneous data regarding the fields that they find relevant to their operations. This could
potentially involve other stakeholders by providing them feeds to display their data on the TOC’s
Dashboard or the potential to allow various stakeholders to customize their own Dashboards to
display the data they specifically process so that other organizations like the TOC can have a
source to access pertinent information. A Dashboard in this sense would be used more
internally to gather information within an organization as opposed to a public display of
processed data.
Dashboard systems could be used to organize data. The Dashboard system could be
used by the different stakeholders of District 5. Based on the stakeholders needs, the
Albuquerque TMC, District 5 TOC, Los Alamos TMC, and the RECC would be provided with
private customizable Dashboards not open to the general public. These Dashboards would
display pertinent information to their organization's needs and allow each stakeholder to
organize their information better. The widgets serve as an effective organization tool as they
distinguish different functions of input and output sources and can group them accordingly. Due
to the wide range of applications and customization that are capable for Dashboard, this system
would be very efficient to for the TOC and affiliated stakeholders.
Another approach to expand the TOC’s ability to distribute data to different agencies
independent of the TMC would be through providing public and interagency access to
Dashboard systems. If the TOC wanted to display specific types of information to specific
agencies, private interagency accounts or logins with different access levels to specific content
could be created for sensitive information.
A Dashboard system can also be used as a data logging tool. Information from widgets
can easily be stored in a data base as it is created or displayed to the Dashboard.
RECC Feed
An REEC feed could be a data collection widget that could potentially be incorporated
into a Dashboard or another type of notification system, like email or text. Upon visiting the
Santa Fe County RECC we learned that they document traffic related incidents by “29 codes”.119
If the TOC could have access to this feed then they could be immediately notified of traffic
incidents as soon as they are documented and could use their infrastructure to appropriately
locate the incident and continue on in the incident management procedure. Interagency feeds
could greatly increase the speed and efficiency of supply on another with important information.
Short Message Service Notifications
The ability to collect data from a variety of agencies and the TOC could be
implemented through Short Message Service (SMS) notifications. This would be
communication through text message or web based media. Some disadvantages of these
notification systems include potential inconsistencies in classifying information to determine the
119
Personal Correspondence with Ken Martinez. Santa Fe County RECC

71
proper recipients, difficulties in enforcing the execution of the notification system in incident
management protocols, as well as the recipients receiving more notifications than are relevant
to their needs or at such a frequent rate that they no longer pay attention to them.
The SMS notification system could also be used as a data distribution tool. The
notification system would allow agencies to have real time conversations with one another to
share important information and discuss important issues currently affecting those involved.
This type of feed could potentially be integrated into other technological systems, but would
require the coordination between the respective agencies.
Interagency Contact List
An interagency contact list could be used to bridge the gap between static and dynamic data
distribution. This list would contain a list of agencies in District 5 as well as a variety of terms
or scenarios that are related to their functionality. In addition, it would provide information as to
who specifically within the agency should be contacted and their specific contact information.
The contact list could be executed in a few ways; it could be done statically, as recorded on
paper, or dynamically, through a virtual system. A paper system would align with what the TOC
currently uses, but the usage of paper documents have shown to be inefficient for TOC
operations by being slow to use and difficult to organize within the operator station. In a dynamic
system, the user could search a particular scenario and a contact that had that scenario in their
description would appear. This list ideally would speed up the notification process for the TOC
and other involved agencies and prevent information getting lost among personnel who
shouldn’t be receiving the data.
Jurisdictional Contact Map
The jurisdictional contact map would be helpful as it provides a visual representation of who to
distribute data to. Since this map can also be used to organize data, it can then be enabled in
terms of using this information to contact those involved in a particular incident. It would harness
the archived data from the map in order to determine where information should be distributed.
This would be a static system that would use GIS data to locate the boundaries of control for
agencies the TOC interacts with as well as internal boundaries. These boundaries would be
characterized by the specific contact information for that region which would help to organize
the jurisdiction of the collected data regarding an incident.
Simtable
Simtable was explored as a modeling tool that acts as a static system to distribute
data. Simtable was primarily considered for this project as an interagency communication tool
that harnesses archived data regarding previous incidents in order to plan for future incident
management. Relevant functions of Simtable can be found in Appendix C. The TOC could
share their collected and organized data through the Simtable URL to affiliated agencies in
order to work together to model various traffic simulations on how to resolve a range of traffic
incidents, predict traffic flow or adjusting transportation routes. Simtable has a few
disadvantages that could make it difficult to implement within the TOC in order to promote
interagency communication. This technology is mostly a planning tool, and if ever in an

72
emergency situation, resolving the incident through Simtable would be a slower and less
efficient than the current process of communicating instantaneously through phone or email.
Simtable could be used for long term planning, but as of now this is not a primary concern of the
TOC and respective stakeholders. In addition, incorporating Simtable would add expenses to
already constrained budgets that many organizations may not be able to afford.
Computer Aided Dispatch
Computer Aided Dispatch (CAD) is a more technologically advanced dynamic system
that could be used to communicate among different agencies. A CAD system would collect real
time data through AVL and geocoding to automatically distribute data regarding patrol
vehicles and the corresponding incident to agencies that would want to know the location of the
information as soon as possible. The system could be modified to the needs of the respective
agency in terms of what type of information is distributed and how. For example some systems
can be programed to send out automated texts or emails with one way notifications under a set
of predetermined conditions or codes and based off of what process is most efficient for the
organizations involved.
A CAD system could also be used for data logging. As CAD systems are by definition
computer based, they can be used to reduce the number of steps needed to record information
as well as minimizing loss of data by reducing transcription errors and subjectivity in logging. A
CAD system also has the advantage of automatically generating reports of all contact, which
can easily be archived for future reference. Different systems have different specifications, so
care must be used to select the system that best meets the criteria of the TOC. One key feature
that needs to be in a logging system is ease of recording geographic information for each report.
Although a CAD system could greatly increase the speed and efficiency of collecting,
distributing and logging data, there are a few drawbacks to the technology. It is uncertain
whether the CAD system could be integrated within NMRoads, which is a very important part of
the TOC’s incident management process. In addition it could require hardware and software
upgrades which would increase the costs of the programs for the TOC. There is also the cost of
implementation of a CAD system within the TOC, which may be prohibitively high. In addition in
order for a CAD system to be able to productively distribute data, it must be compatible with the
systems used by other agencies. This could be very difficult to coordinate as every stakeholder
has their own systems for incident management and own requirements that may not necessarily
correlate to a singular CAD system. A CAD system also has the limitation that it is usually
designed with only one form of contact between dispatcher and field agent. This is a huge
problem for District 5 which already uses multiple forms of communication to overcome
limitations of coverage throughout the district. The different CAD systems we analyzed to
determine these results can be found in Appendix D Table 22.
Computerized Logging
One simple idea for data logging is using a series of drop down menus within a
program. This would enable the dispatchers to all record the same data in the same format.
Training on the drop down system would also allow dispatchers to record incidents at much

73
more rapid rates, alleviating difficulties during high activity times. It would also ensure all logs
were stored in a digital format, promoting ease of access. Digital logs can also be shared more
rapidly between organizations and stored or backed up in external locations to ensure their
accessibility regardless of the TOC.
An implementation of this digital system might be an Excel log with various drop down
lists for different events or categories of events. This has the benefit of being easy to create,
lightweight to run and utilizing software that most businesses already have purchased. These
logs would be far more organized and standardized than paper logs, although they would have
the limitation of difficulty searching the contents of each log. There could also be one of two
limitations, either a large number of logs or difficulty in finding individual reports. If each log is
recorded on an individual sheet, it would be relatively easy to find each log. However, this would
create a very large number of logs that would take a large amount of work to organize post
creation. It would also require a new sheet to be created for each log, slowing down log
creation. If multiple logs are recorded on the same sheet, the number of files created would be
decreased, as would the initial time to create a blank log. The drawback is that a large number
of logs recorded on one sheet would greatly hinder the ease of retrieving a specific report.
A different approach to solve the same problem would be a web based log system.
This would require an authorized account to create or access a log. A log would have drop
down menus for each required category and be automatically saved to a database containing all
other logs. A dispatcher would record all communications with field units in such a log, reducing
the number of steps and transcriptions from the current system, which would greatly improve
data integrity over the long term. The standard recording of all reports in one format would be
greatly beneficial to District 5, as they take reports over both radio and cellular phone due to the
vast area the district covers. A web system would address many limitations of the current paper
logs. It would allow for easy access, easy searching and standardization of reports. In addition,
a well-constructed web system would be much quicker to record data than the current system. It
would also have the advantage of being easier to integrate with web based 511, traffic maps, or
other reporting tools. Because of the online nature of the report, it would be trivial to send copies
to other parties. For example, an email notification could alert a public relations manager of a
new event to approve for publishing to the web. Because the records are automatically recorded
in a database, careful construction of the database would ensure that the logs are created in
inherently searchable forms, that is to say that the design of the log would cause all entries to
be made in a way designed to be easily referenced. The result of this would be to enable
analysis of the logs to search for patterns, limitations or similar.
Direct Export to 511 from NMRoads
A more internally driven method to distribute data is through direct export to 511 from
NMRoads. This process would enable expanding the NMRoads capabilities for NMRoads so
that they can expand their distribution process. Instead of relying on the TMC to approve of
NMRoads posts for public display and creating the 511 messages, the TOC could be given
access to take control of their own district. Currently a process is in the works where an entry is
put into NMRoads and once the data is input, it will automatically be translated to computer
generated speech, distributed and imported to the 511 system. This would greatly decrease the

74
time in which traffic information can be distributed to the public by cutting down on the time it
takes to send the data from the TOC to the TMC and then wait for the TMC to approve and post
and also reduce redundancies in the 511 process.
Interagency Conferences
In regards to current incident management procedures, the involved stakeholders rarely
meet in addition to being aware of one another’s functionality. In our meetings we discovered
how many of the agencies were not informed of the technologies or process that were being
used throughout the district to manage incidents. Interagency Conferences would be effective
forms of data distribution in which each agency involved with traffic incident management
could share their goals and practices. These could be held at whatever frequency the involved
agencies see fit. These conferences will not satisfy real time or immediate demands to
communicate with one another on a regular basis. However, sharing best practices and
operational procedures could be a huge benefit to all parties involved.
4.3 Most Effective Technologies and Interagency Incident Management Protocols
We first determined what an ideal TOC would consist of in terms of technologies and protocols
that satisfy the data processing system. This ideal TOC model was then used to evaluate
possible solutions. Together, the set of recommendations would need to fulfill the ideal TOC
model in order to provide beneficial changes to the District 5 TOC. This process enabled
allowed us to distinguish valuable results that enabled us to prioritize the possible solutions into
final recommendations.
4.3.1 The Ideal TOC
There are four major functions a well operating TOC should accomplish; data collection,
organization, distribution and logging. Each component is critical to the best operations of a
TOC. The ideal TOC model was derived from the PCC in Section 3.3.1. This chart prioritized the
methods and operations that should be implemented within the TOC. We created this ideal
TOC model from the results of our interviews and research in combination with the goals
determined from the PCC. Generally, a TOC should collect accurate data in real time from a
variety of sources, organized the data in an efficient, streamlined manner, distribute information
rapidly to both stakeholders and the public and finally store the data in an easy to access and
easy to search manner. This ideal TOC model serves an effective evaluation tool for possible
solutions to see if they would satisfy the criteria outlined from the model. Figure 31 displays the
information gathered as the ideal TOC model.

75
Figure 31 Ideal Traffic Operation Center Data Processing
Data Collection
The first element of data processing the TOC is responsible for is data collection. A
successful TOC must collect data from both internal and external sources. Internal data, such
as camera feeds or reports from field agents are the backbone of a TOC’s functionality. This
data provides the basis of how the TOC will view and respond to developing traffic conditions.
Data must be collected both accurate and in real time. This means that personnel at the TOC
should be in reliable contact with all field units and have access to all information sources within
its area of jurisdiction. This TOC should have robust software capable of identifying and
displaying the most important data feeds at any given time. Unfortunately, this software is not
fully mature, and so cannot be implemented fully. However, it is possible for a TOC to establish
the infrastructure and procedures necessary to fully take advantage of this technology when it
does further develop.
The other key element of data collection is information from outside agencies. Agencies
outside the TOC might be aware of traffic conditions or incidents before the TOC is notified. In
this case, the TOC should ideally be made aware of the incident as quickly as possible. The
reverse is true as well, a TOC should alert other relevant agencies if it possess information they
do not. The transfer of this information in real time is critical to ensure proper response by all
agencies. Strong relationships and procedures need to be developed and maintained between
all parties in order for this information flow to exist. Stakeholders can better communicate
relevant information more efficiently by understanding the capabilities, functions and operational
goals of other agencies. Ideally, much of this data sharing would be accomplished automatically
in real time by existing or future data collection systems. When an incident is recorded in an
agency’s system, the record should be automatically analyzed for information relevant to the
functions of the TOC. If a match is identified, the record should be sent immediately to
personnel at the TOC. By utilizing an automatic system, the time between notifications of the
TOC can be greatly reduced while minimizing additional responsibilities for operators at the
various stakeholders.

76
The ultimate goal of the data detection is to detect incidents, including their location and
severity, with the end result being improved response times. The earlier an incident can be
detected, the more prompt the response, mitigating secondary incidents and traffic congestion.
The data collected should include the location of the incident. This is a key point as geographic
data greatly impacts the response of various agencies. The proper outside agency can be
contacted by the TOC if personnel know the precise location of the incident. It would also aid
the TOC in dispatching support by identifying the closest resources to the incident. Other
information that should be collected includes the type and severity of the incident. This would
help determine the proper response necessary for the incident. As information technology
improves into the future, automatic identification of incidents will become feasible, as well as
automatic notification of the proper TOC resources and external agencies.
Data Organization
The data must be organized into useable information after it is collected. This
organization must be conducted in a standardized manner, so that the data is all processed in
the same way. This applies to all forms of collection. For example, all contact from patrol
vehicles within the TOCs district should be recorded identically, regardless of contact method,
such as phone or radio. There should also be standardized processes for categorizing data from
external agencies. When a report or notification arrives from a stakeholder, the information it
contains should be parsed in the same manner, regardless of origin or content of the message.
Proper processing of data is vital to ensuring that the most relevant and important information is
available for decision making at the TOC.
Organization needs to be more than just standardized, it must also be streamlined. It is
crucial that the data be organized in a timely manner as TOCs collect increasing amounts of
data from various sources. Slow sorting of the data can be detrimental to both current and future
response. Inefficient sorting of the data causes immediate delays in response to incidents. It
also can cause disruptions to later responses. Delays may compound to extended periods of
time, greatly degrading the response of the TOC and other stakeholders if the particular data set
is not organized quickly.
Based on these criteria, standardization and streamlining of organization, some general
conclusions can be made. The system implemented must be carefully constructed to capture
the broadest categories of incoming data, to prevent information from escaping classification. It
must also be specific enough that data is organized efficiently and thoroughly regardless of its
origin. The speed needed to organize the data lends itself to a computer based system that can
quickly and accurately be used to organize the data into a useable format.
Data Distribution
Data must be distributed to a large range of external parties after it is organized. This
includes other stakeholders in the district’s jurisdiction as well as the public at large. Importantly,
the information required by the stakeholders and the public is not identical. Stakeholders may
receive more technical information and specifics that do not apply to the general populace.
Distribution to stakeholders should occur as rapidly as possible without disseminating false or
incomplete information. Rapid communication promotes better responses to an incident, in

77
addition to coordinating with various agencies to execute their jobs as quickly as possible. It is
critical to accurately identify which stakeholder is required to be notified to establish solid lines
of communication with stakeholders. Ideally, the data already has geographic information
encoded, which allows for easy computerized reference against a map of stakeholder
jurisdictions. Once referenced, the data can be sent to only the relevant stakeholders. This
ensures that stakeholders carefully review the data as they only receive pertinent information.
Efficient distribution is not limited to stakeholders, but should also include the public. It is
important to distribute information to the public to prevent further incidents and promote better
travel throughout the district. By giving the public accurate data on the road conditions and the
presence of incidents, the public is empowered to avoid further problems by self-selecting
routes that avoid incidents and congestion. The public has great disincentive to avoid traffic
slowdowns, so by providing them accurate information, the TOC can help mitigate secondary
problems with minimal work.
Another important consideration for data distribution is the time frame in which it occurs.
Usually, it is critical for communications to happen as rapidly as possible. This entails electronic
systems, which are typically cheap, near instantaneous systems. An additional way of
increasing distribution speeds is linking the distribution into the collection. This can be
accomplished by automated systems that identify the proper recipients and inform them by
analyzing data as it is captured.
Not all distribution needs to be rapid. Communication can also occur that is better suited
to a less rapid approach. For example, discussions of long term plans and strategies between
stakeholders will likely produce better results if the parties meet in person rather than
exchanging electronic messages. These meetings are vital for the TOC to coordinate its efforts
with that of other stakeholders, which is what ultimately will allow rapid communication to reach
its full potential.
Data Logs
A TOC must log data that it collects or receives. Ideally, all data should be automatically
logged into the same database, using the same criteria. In addition, data should be logged upon
creation or capture to minimize degradation of the information over time. These features are
critical as dispatchers often do not have time to archive information after recording it and if they
do, the data can be unintentionally altered or misrepresented due to interpretation or limited
memory of the incident in question. Standardization of the data is key as it guarantees that the
most relevant information from any source is logged. Standardized logging means that the same
information in identical formats and contexts is recorded for each incident. This is important to
ensure that all incidents can be compared and analyzed on the same criteria. It is also important
that the data log is inherently searchable. This means that the logs must be created in a format
that enforces ease of querying. Data that is not searchable often ends up lost. The purpose of
the log is to create a record of an incident that can easily be found and reviewed after being
resolved. In addition, being searchable is critical for analysis of the data for patterns or
anomalies that can be used to better the operations of the TOC.

78
The possible solutions that we compared to this data processing outline can be found in
our completed morphological chart in Appendix D Table 21.
4.3.2 Prioritization of Possible Solutions for the District 5 TOC
We completed our numerical evaluation charts in order to analyze the different functions within
each individual proposed solution. These charts showed whether the solutions overall were
effective and beneficial to implement within the TOC, or if they contained too many
disadvantages that would make the TOC operate inefficiently. The numerical evaluation charts
determined which solutions would be objectively the highest priority to be implemented within
the TOC. The results of these tables can be found in Appendix D Tables 23 - 30. According to
these charts the following solutions and practices were classified in terms of highest to lowest
priority to implement.
1. NMRoads Expansion
2. TOC Incident Protocols
3. Interagency Incident Protocol
4. Dashboard Systems
5. TOC Operations
6. Patrol Vehicles
7. CAD Systems
8. Simtable Usage
We then had follow-up meetings with our sponsors and other TMC and TOC personnel in order
to make sense of the results of the numerical evaluation charts. We discussed the specific
functions that each solution could potentially contain. The feedback from these people was very
important in reevaluating the purpose of each solution and how it could be implemented with the
TOC. These solutions ultimately need to promote efficiency within the District 5 TOC and
promote communication with key stakeholders. We analyzed the data from our follow-up
meetings to create a new list prioritizing solutions for implementation:
1. Dashboard Systems
2. NMRoads Expansion
3. TOC Incident Protocol
4. Interagency Incident Protocol
5. TOC Operations
6. Patrol Vehicles
7. CAD Systems
8. Simtable Usage
In our recommendations and conclusions section of this report we go into more detail about the
technologies and protocols we suggest to be implemented within the District 5 TOC. In this
section, we also describe the specific applications of our ideal solutions that we would
recommend for the TOC.

79
5. Recommendations
The solutions recommended are the solutions we feel are the best to address the data
process schematic, as well as being feasible to implement. The solutions were organized by the
data processing element they satisfy, such as data collection, data organization, data
distribution and data logs. Our recommendations are to implement the following technologies
and systems:
● Dashboard Systems
● NMRoads Utilization
● Automatic Vehicle Location
● Jurisdictional Boundary and Infrastructure Map
● Interagency Contact List
● Interagency Conferences
● Interagency Notifications System
Figure 32 below reiterates the steps we took to achieve our final recommendations. Each
objective lists the results gathered from that stage of our project. The figure concludes with
selecting the solutions to serve as the final recommendations, which can be seen as the result
of the third objective.

80
Figure 32 Flowchart of Methodology with Recommendations
Figure 33 displays how different solutions fit into multiple categories of the data
processing system. This was key in helping determine the priority of the solutions, as solutions
that occupied multiple locations represented more efficient uses of resources. The most efficient
solutions were NMRoads and the Dashboard system.

81
Figure 33 Prioritizing Recommendation Effectiveness
5.1 Dashboard Systems
A way to improve data collection would be through a City Knowledge Dashboard
System. Widgets could include weather, Inrix traffic data, dynamic message signs, NMRoads, a
SMS based chat room for stakeholders, local camera feeds, and a RECC feed for car accidents.
All of these potential widgets could be used to organize data that is being collected by the TOC
for the stakeholders of District 5. These widgets also have the ability to move around to create
groups to the users’ preference. Personnel with administrator access have the ability to
customize their Dashboard with widgets that are particular to them and can therefore organize
the type of data they want to collect. In addition, the users are capable of rearranging the layout
of the widgets in order to satisfy their needs or how they want to group the data they display.
The widgets can also be programed to automatically change their locations based on new or
changed inputs from their sources. The TOC would be able to use the Dashboard to sort how
data is collected, sent out, and organized. Appendix E Section 1 contains a more thorough list of

82
potential widgets that could be incorporated into an NMDOT Dashboard and describes their
functions. A Dashboard system would allow the NMDOT and stakeholders to have a centralized
remote way to access information. In order to give a proof of concept of how a Dashboard can
help to collect data, we created a Santa Fe Dashboard. The Dashboard in Figure 34 has
widgets for weather, NMRoads, RSS feeds, local traffic cameras, Waze traffic data, and google
traffic data. All of these widgets are specific for the Santa Fe area.
Figure 34 Santa Fe Dashboard120
We feel that this system is the best method for portraying information across
stakeholders due to its customizable nature to meet the needs of the various stakeholders.
Appendix E Section 2 then describes our recommendations on a few agency specific
Dashboards based off of the information we gathered from our research and interviews.
Another use of a Dashboard system is to organize a large number of video feeds into
one centralized location. This could be used to allow the TOC to display all of the cameras
within its jurisdiction in one location without a major investment in hardware to do so. The each
camera feed could be rearranged or programmed to move in the event that it is able to view an
120
(City Knowledge Santa Fe 2015)

83
incident. The size of this feed could also be adjusted to make an incident more prominent or
easy to view. Figure 35 below shows how a variety of camera feeds could be displayed on
Dashboard.
Figure 35 Multi-Camera Display Proof of Concept
A Dashboard system can also be used for data distribution. A Dashboard would allow
stakeholders to easily review information posted by the TOC or other users. A TOC customized
Dashboard, could distribute their data to a variety of agencies or the public in the form of
widgets. Different logins with levels of access or private interagency accounts could allow the
TOC to specify who can see what data. An example of this would be the Los Alamos TMC,
which could have their own Dashboard displaying their camera feeds, DMS systems, NMRoads,
and the RECC Feed. The Dashboard could serve as a centralized location to view information
from other sources, helping streamline the distribution process amongst agencies.
The Dashboard system can also be used to log data. Widgets can be programmed to
automatically record the information passed to them by their sources. The format in which the
data is logged is can be predetermined at creation to ensure it is logged in a way that matches
the ideal process. This would allow the creation of database that would store all the information
passed through the Dashboard so that it could analyzed in the future.
5.2 NMRoads Utilization
Many suggestions that have been made include basic improvements to NMRoads, but
also increasing the number of administrators by expanding district access to NMRoads. This
expansion would make use of the available functions of NMRoads for the TOC, especially in

84
terms of login capabilities. Other personnel affiliated within the TOC such as dispatcher, PIOs,
patrol vehicle drivers and more could have different capabilities to input data as well and collect
it within one spot. With more people accessing the information, it is necessary to have user
training. The trainings would show the users how to properly use NMRoads. Other districts
have different training processes and it would be beneficial for the District 5 TOC and the TMC
to look into the different training process to potentially replicate good practices as well as
improve poor practices and create an overall standardized training process. For example,
District 6 is known for its ideal training procedures and could potentially be used as a model on
NMRoads training. This NMRoads training is very important to implement because it would
open up more opportunities to update NMRoads so that the public is more informed.
Dispatchers would be trained to log all reports, not strictly radio calls. Any input of information
whether through cell phone, radio or some other mode should be documented. This process will
ensure that data is not lost when reported.
A major aspect of training that needs to be reviewed is the NMRoads camera control
through the usage of the NMDOT camera feeds to collect data. These camera feeds can
sometimes in the event of an accident display graphic details of crashes that the general public
should not see. It is critical that operators and dispatchers who have the ability to PTZ the
cameras are trained to cut feeds and move cameras as needed. Another aspect of expanding
access to the cameras is the maintenance of the camera networks. If the local districts plan to
access the state level camera network, they also should be participating in the network
maintenance and costs of operation. This includes paying for CDMA data access and overall
maintenance to the network. With camera control, the TOC should also be responsible for
maintenance operations of the technology. Through thorough evaluation, we feel these
suggestions can make the greatest impact in improving the methods for data collection for the
NMDOT, and the respective stakeholders.
To help organize data, the TOC should be granted administrative access and establish
a system of NMRoads administrative hierarchy. NMRoads currently has some tiered access
to however the required training to utilize this system is not given to dispatchers in the other
districts, particularly District 5. This hierarchy would have different levels of access. This would
be done through a notification system, so every time the dispatcher logs something worthy of
NMRoads, the PIO would be notified by email, or a pop up on NMRoads. By giving more
NMRoads access to the TOC workers, the overarching process of incident management
through NMRoads will be quicker as the TOC does not have to incorporate the TMC, which has
its own additional responsibilities, within the District 5 incident management plan.
NMRoads could be used as a data distribution system beyond what is currently
implemented. Currently, NMRoads displays all recorded incidents on a map of the state in either
a web or mobile setting. NMRoads can also be configured to notify users of conditions that
occur on selected roadways within specific time intervals by SMS, email or both. A new
distribution method would be to automatically convert all incidents to records in New Mexico’s
511 system. In order to achieve direct export to 511 from NMRoads, a program would
automatically retrieve the important data from the log and convert it to digital speech. This
implementation would accelerate the transfer of data, as well as reducing chances of false or

85
flawed reports. Since 511 is a commonly used service, this would be a very effective use of
resources relative to the benefit derived.
Ultimately we recommend that the TOC transition out of using paper logs and uses
NMRoads logs as their data logging method. The log system would be an updated version of
the logging process that the Albuquerque TMC uses; instead of having a radio log and a road
conditions log for information published through NMRoads, they would both be combined onto
one log. The logs would be structured similarly with drop down menus regarding options specific
for District 5. This will increase the speed of inputting data, as well as create a standardized
form of entry and responses. Similar to the current NMRoads log processes, not all logs will be
published on NMRoads for public view. In the streamlined, one log format, there could be a
button that would allow for the admin to simply click in order for the information to be posted for
the public. If not selected the information would be archived. Predetermined users, like the PIO,
could have access to these stored logs so that they can pull information when needed. Figure
36 is an example of the current administrator log and how the drop down menus could be
utilized.

86
Figure 36 NMRoads Log Drop Down Menu
5.3 Automatic Vehicle Location
Patrol vehicle location information should be implemented within DOT vehicles through AVL.
AVL systems could be installed on district patrol vehicles. The best AVL solution to collect
data for District 5 is GPS. This would eliminate the need for complicated and inaccurate logging
of plowing, and provide the general public with real time, reliable information regarding road

87
conditions. A GPS tracking device within the plows would communicate back to the TOC the
whereabouts of the plow, while automatically mapping the locations to NMRoads, so the general
public can benefit from knowing when the roads were plowed. This is similar to what is done in
Virginia, where the plows equipped with AVL communicate directly to the Virginia DOT website
and show which roads have been plowed at a specific time. Figure 37 below shows an example
of AVL plow tracking used in Virginia, which could be implemented within New Mexico.
Knowledge of what roads are drivable at a given time can help reduce cars on unsuitable roads.
This in turn helps mitigate secondary problems caused by large snow falls. This would also
increase safety for plow drivers so they do not have to log information while in the field.
Furthermore, GPS can be used as a general patrol monitoring tool to track the general
whereabouts of NMDOT patrol vehicles.
Figure 37 Virginia AVL Plow Tracking121
This type of data log system would use geocoding to track and record the location of the
vehicles and how long they remained at a certain location. This system is practical to ensure
that patrol vehicles are doing their job and working as efficiently as possible; in addition to
providing quick information by automatically logging the location of an incident. There is the
capability for this AVL log system to be incorporated within NMRoads or 511, ensuring that the
public has access to accurate data about road conditions.
5.4 Jurisdictional Boundary and Infrastructure Map
Another way to improve data organization and data distribution for the TOC is
through a multi-jurisdictional boundary and infrastructure map. Each organization has its
area of jurisdiction encoded into the map. The result of this is a convenient way of determining
the appropriate contact from a specific organization when needed. This map would contain
different boundaries in District 5, such as the state police boundaries, the NMDOT patrol yard
121
(Virginia Department of Transportation 2015)

88
boundaries, the public safety answering points, county lines, and locations of traffic cameras
and DMS in District 5. The map that was created for proof of concept contains PSAP locations,
camera locations, patrol yard locations, boundaries for NMDOT patrol yards, and the county
lines for the state of New Mexico. The map pictured below is a proof of concept. Green dots
denote patrol yards while pink lines demark patrol yard operational boundaries. Non-green dots
represent Public Safety Answering Point, with each color representing a different county, as
seen in Figure 38. Camera icons mark the location of traffic cameras operated by the NMDOT,
as seen in Figure 39. Only cameras in District 5 are included.
Figure 38 District 5 Jurisdictional Map Proof of Concept122
Figure 39 Santa Fe Area Jurisdictional Map Proof of Concept123
This jurisdictional map would be online and have the ability to locate the position of an
incident so that the correct agency is contacted to deal with the incident. Geocodes would be
used to classify the incident as to who should be responding due to location. This helps
distribute data by allowing the dispatcher of the TOC to contact the correct agency first through
an organized map instead of multiple physical maps. It would also have an immediate way to
locate which cameras, DMS and other infrastructure are in the area of the incident so that they
can be optimized for the TOC needs to collect data on the incident or in terms of adjusting
122
(DiRuggiero 2014) 123
(DiRuggiero 2014)

89
public viewing of the location. This should greatly reduce the time needed to contact a
stakeholder by predetermining the contact point at that agency. This would increase
communication between the TOC and stakeholders because the process is simpler and more
direct. Another advantage of the system is that it preserves institutional knowledge. When
personnel in the TOC change, there is less loss of information and crucially far less degradation
of the communication between the TOC and the stakeholders. Figure 40 below demonstrates
how contact information can be easily displayed to when selecting a particular patrol yard or
other jurisdictional boundary.
Figure 40 Jurisdictional Contact Map
These jurisdictional boundary and infrastructure maps could help establish a consistent
means of communication between the District 5 TOC and Santa Fe County GIS Office. Since
these maps are made with GIS data, there would be an increased need for communication
between the GIS Office in order to keep the map most up to date. The TOC and GIS Office
could implement a variety of systems in order to alert one another when changes have been
made to the district’s geographic information.
5.5 Interagency Contact List
A similar data distribution system to the jurisdiction map is the interagency contact
list. The interagency contact list would be based on types of incidents while the jurisdictional
boundaries map would be a location based system for determining who to contact for incidents.

90
The contact list would be a database of contact information that includes information about
which stakeholder would respond to certain incidents along the roads for each district. A
dynamic system would advance the TOC to using virtual systems that could be used on a
phone or computer. These systems would work by creating an account per agency or individual
which would then have a customized list of contacts with a description of what they do under the
contact information. When data is gathered regarding a traffic incident, the TOC can search key
words about the nature of the particular event, contact name, organization or responsibility and
contacts that match the description will appear with the respective contact information. Finding
this information on a paper contact list would take more time to find identifying key words, while
using a virtual system would increase the speed in locating the appropriate contact. This allows
the TOC to contact the agencies for any given incident within their jurisdiction. By centralizing
and simplifying the contact scheme, the TOC can guarantee quick communication with
stakeholders, regardless of which personnel is contacting the stakeholder. This list will have all
the pertinent stakeholders for any situation within it. An example of this would be if you typed in
“Emergency” the RECC, State Police, Albuquerque Police, Santa Fe Police, and Santa Fe
County Sheriff phone numbers among others would populate the search.
As a proof of concept, we utilized Google Contacts, which can be loaded into an
authorized phone, computer, or Outlook account, so that they can access the proper contacts
remotely. Figure 41 portrays the Google Contact we used as our proof of concept, and shows
how searching for a key term will bring up a list of corresponding contacts. A dynamic system
such as this would reduce the paper clutter within the TOC which consists of phone numbers for
dispatchers to call. Although the list itself consists of archived descriptions and contact
information of the respective agencies; the act of using a dynamic system to search keywords,
select an agency and call them to immediately resolve an incident which gives the contact list a
dynamic functionality.
Figure 41 Emergency Contact Proof Concept
91
Another usage of the contact list would be to combine it with the jurisdictional contact
map to create a searchable map. This hybrid system would combine the advantages of both the
map and the contact list. In this case, a search would highlight all applicable results on the map,
allowing the dispatcher to then select the correct organization based on both location and
responsibility. This would enable incredibly simple identification of the correct stakeholder with a
bare minimum of information known about the stakeholder in advance.
5.6 Interagency Notification System
Expanding interagency notification system to the TOC could greatly benefit the TOCs
data collection. Similarly to how the state police currently email the NMDOT about road
closures and incidents, as well as when they are cleared, the MPO could establish a means of
regularly emailing the NMDOT scheduled construction as well as when the construction is
expected to be completed and when it is completed. This way NMRoads can be accurate and
up to date with real time construction information. Besides the MPO, this system could be
implemented for other stakeholders to send the TOC information.
A slightly different data distribution system is an interagency notification system
from the TOC. This system is based on email communication from the TOC to multiple
stakeholders. An email based system has many benefits. One of the most basic is the
willingness of stakeholders to use email based systems, since they are already an integral form
of communication in most organizations. Email systems allow for mass distribution of
information simultaneously to a large number of stakeholders at near instant speeds.
Organizations can be easily categorized into distribution lists, allowing emails to reach a specific
group of stakeholders. Another benefit is the virtually nonexistent cost of establishing,
maintaining and using these distribution lists. The interagency notification system could serve as
both a data collection and data distribution system by allowing the TOC to send and receive
emails to stakeholders of District 5 as well as the state police. This system would mirror the
current state police email notification system to the TMC, but instead of the TMC sending and
receiving the emails, the TOC would send and receive emails.
5.7 Interagency Conference
A different data distribution system is an interagency conference. The purpose of the
conference is to put the TOC and stakeholders in direct, explicit communication with each other.
This is important as there is currently very limited communication between many of the
stakeholders and the TOC. By gathering all of the relevant parties in one place, direct
communication is greatly promoted. These interagency conferences could be held as frequently
as needed. There are several other goals besides the promotion of basic communication
between the TOC and stakeholders. One such goal is training stakeholders how to best utilize
the tools that the TOC can provide them, such as NMRoads or the proposed Dashboard
system. Some other options could include the conferences being ran by the state level NMDOT
or conferences held by district offices
By training the stakeholders how to take advantage of these tools, the TOC can promote
its effectiveness with a minimum of further work by the TOC. A more important goal however, is

92
the creation of memoranda of understanding or agreement, MOU and MOA respectively.
The purpose of these memoranda is to establish the common goals or plans of the
organizations, usually without a formal or legal commitment. After establishing these
agreements, the agencies would seek to create a joint operating procedure, which describe
how the agencies will interact with each other. The most important outcome of these
agreements is to ensure that policies work in tandem and stay consistent over time and are not
subject to change.

93
Appendix A - Interview Questions
Albuquerque Traffic Management Center Meeting Questions ● Who are the stakeholders/agencies that the TMC works with?
● How do you get information from each stakeholder?
● Does the TMC communicate anything to the stakeholders?
● What is the general process when there’s an incident?
● How do you (operators) divide up the work or share work (who’s working on what, using what)?
● What are the main ways of communicating?
● Do you see any inefficiencies or areas for improvement?
● Can you expand upon NMRoads, Skyline (?), really any programs in use and how are they used/how do
they work?
● How does the database management work/what’s in the database?
● If the TMC reroutes traffic, what is the process?
● What data logging software package do you use (CAD)?
○ How well does this work?
○ What do you like about this system?
○ What do you dislike?
○ Have you heard of better systems out there that may be better for this application?
● What AVLS software or system do you use?
○ How well does this work?
○ What do you like about this system?
○ What do you dislike?
○ Have you heard of better systems out there that may be better for this application?
District 5 NMDOT Meeting Questions ● Existing TOC/TMC infrastructure?
○ Software packages?
○ Hardware installations?
○ Operators?
■ Training received/planned/programs?
○ Outside contacts (patrol yards)
■ Training received/planned/programs?
■ Communication plans/systems
○ Plans for expansion?
■ Number of employees
■ Operational hours
■ Budget
● Hardware outside TOC (cameras, DMS etc.)
● Hardware inside TOC (operator stations, specialized equipment)
● Software packages
● Support staff/capabilities
● What are the agencies that you work with?
○ Most frequent contact?
○ Who contacts you about what?
○ How do they contact you?
○ What information do they give you?
○ What additional info would you like?
○ Who else would you like to work with?
● How are you notified of scenarios?

94
● Who do you notify about scenarios?
○ What agencies?
○ For what reasons?
○ How?
● What type of situations does the TOC want/should interact with?
○ How do you classify these situations?
○ What do you consider most prevalent?
● Do you/want to keep some sort of log of this information?
○ What do you log?
○ How do you log reports? Automatic/manual?
○ Is this format easily searchable/indexable?
○ How do you classify reports?
■ What do you do if something has multiple possible classifications?
○ How, if at all, do you share reports with others?
○ Are you willing to share?
■ Limitations: people, information etc.
● Do you have ITS data willing to share?
○ Do you currently use ITS data for anything?
● What is the DOT’s role in handling incidents?
○ Process?
○ Who contact about what?
■ How do you know who to contact?
○ How contact?
GIS Meeting Questions ● How is GIS currently used in traffic management?
○ What situations are you involved with?
■ Construction?
■ Planning?
■ Accidents?
■ Special Occasions - like rock fallings, etc.?
○ What is good about this process?
○ What could be improved in this process?
○ If NOT used in traffic, how would you like it to be used?
● Does the TOC have any data/information that would be helpful to you?
○ Incident logs?
○ Cameras?
● GIS data used to monitor districts?
● Are you ever contacted about specific situations?
○ How do you classify your situations?
● Do you use any sorts of logs or databases?
○ How do you log them?
■ What system?
■ What information do you include?
■ Classification?
■ Who logs the information?
■ Do you share that information?
● Would you be willing to share that information?
■ Is the log ever used for anything?
● What are the agencies that you are in frequent contact with?
○ What do you tell them?
○ Who do you contact about what?
○ How do you determine when someone else needs to be contacted?

95
○ How do you communicate with them? What technologies/modes?
● What technologies are used in coordination with GIS?
○ CAD?
○ ITS architecture?
● Ease of transferring data?
○ Format of data sent?
■ Does it need proprietary software, is it pen and paper, etc.
○ Sending data to others or receiving data
○ Bulk versus specific item
○ On demand or automatically?
● Create data ahead of a project or reactionary?
○ Who drives the creation?
○ How to commission/request new report?
EMS Meeting Questions ● What do you need from the TOC?
○ Is there any information that you wish was shared with you?
■ What information do you use when handling an incident?
● Types of car?
● Damage of car?
● People involved?
● Road conditions?
● Who is at the scene?
● What events do both EMS and the TOC work together?
○ What is your role with emergency situations and traffic?
○ Do you ever work directly with the TOC?
○ If you don’t, would you like to?
● When you arrive at the scene, what is the typical flow of events?
○ What are your first actions?
○ Who do you contact about the accident?
■ What do you contact them about?
■ What mode/technology do you use to make the contact?
○ Once you respond to the scene are there any further actions you do?
■ Do people ask you timing?
■ Do you predict how long the road/scene won’t be cleared?
■ Do you have any role in closing the road/lane/impacting the traffic?
● Is there anything about the process that could be streamlined?
● Is there anything about the process where communication, esp. with TOC/traffic
management be improved?
● How do you classify different types of incidents?
○ Only accidents?
○ Different levels?
○ What do you do if something has multiple possible classifications?
● Do you have a log of all the events that EMS goes to?
○ How do you log them?
■ Automatic/manual
■ Is the format easily searchable/indexable?
■ What system?
■ What information do you include?
■ Classification?
■ Who logs the information?
■ Do you share that information?
● Would you be willing to share that information?

96
■ Is the log ever used for anything?
● Are you ever contacted or needed for anything besides accidents?
○ How do you separate accidents from other calls?
● Internal communications structure?
○ Up/down/across levels?
○ Formal or informal procedure?
■ How good at following formal procedure?
○ Limitations of the system?
● External communications?
○ When an emergency occurs on a road, how are you notified?
○ What other agencies typically?
■ Up/down/across levels?
■ Formal or informal procedure?
● How good at following formal procedure?
■ Limitations of the system?
● If not already mentioned, do you communicate with any other agencies?
○ What do you tell them?
○ Who do you contact about what?
○ How do you determine when someone else needs to be contacted?
○ How do you communicate with them? What technologies/modes?
○ Do you make any of the calls/decisions?
MPO Meeting Questions ● How do you interact with DOT?
○ What types of situations?
○ Who contacts who?
○ How do you contact one another?
● Long term or short term or both for planning when it comes to traffic incidents?
● What types of situations do you plan for?
● What current process is of alerting DOT of new roadways? Can update NMRoads?
District 5 NMDOT Meeting 2 Questions ● ls there a CAD system already in place? Would you be interested in using a CAD System?
○ Thoughts on incorporating a drop down menus or shorthand to speed the process of filling out
forms?
● Who does the dispatcher frequently take calls from?
○ What is the process for taking calls?
○ What information is gathered from the calls?
● How could we make the current incident management process and actual TOC more electronic?
● What would you want out of a Dashboard type system?
● What are your thoughts on Simtable usage?
● What are your thoughts on NMRoads improvements?
○ Tiered log in?
○ Different admin levels?
● What are standardized descriptions for the logs?
● What are your interactions with the Albuquerque TMC?
● What are your typical interactions with the public?
● What are your thoughts on video analytics software?
● What are your interactions with the state police?
**Review current ideas for solutions
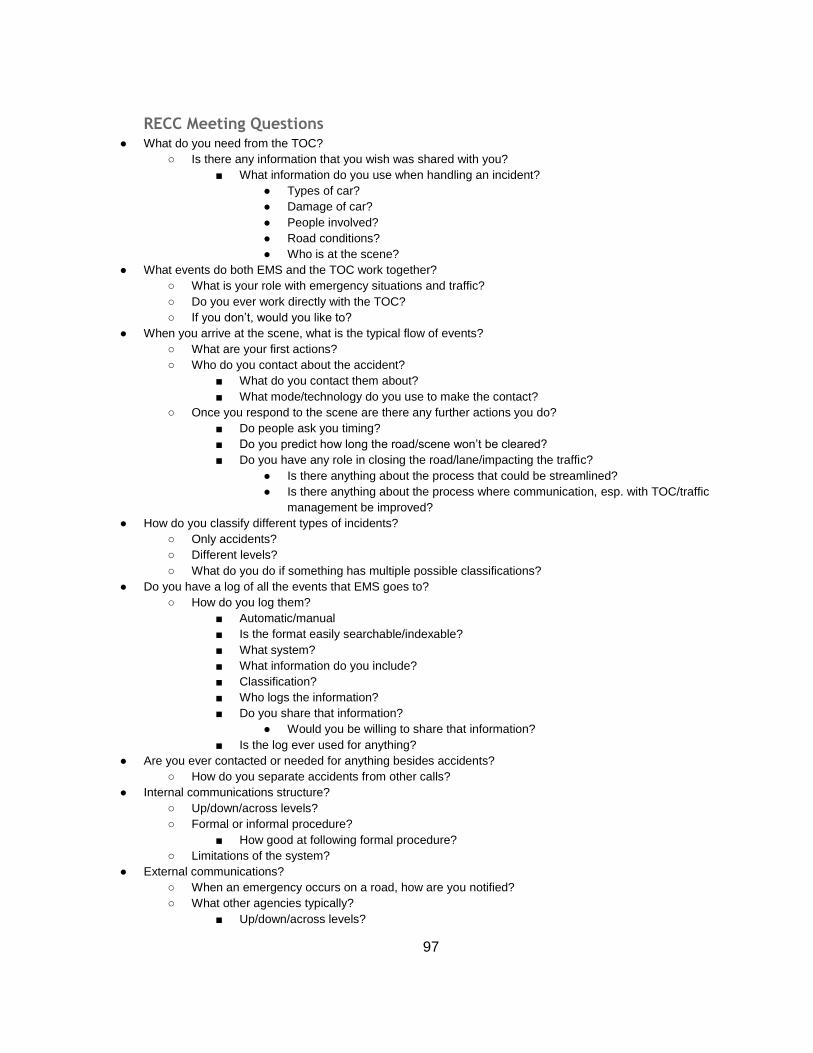
97
RECC Meeting Questions
● What do you need from the TOC?
○ Is there any information that you wish was shared with you?
■ What information do you use when handling an incident?
● Types of car?
● Damage of car?
● People involved?
● Road conditions?
● Who is at the scene?
● What events do both EMS and the TOC work together?
○ What is your role with emergency situations and traffic?
○ Do you ever work directly with the TOC?
○ If you don’t, would you like to?
● When you arrive at the scene, what is the typical flow of events?
○ What are your first actions?
○ Who do you contact about the accident?
■ What do you contact them about?
■ What mode/technology do you use to make the contact?
○ Once you respond to the scene are there any further actions you do?
■ Do people ask you timing?
■ Do you predict how long the road/scene won’t be cleared?
■ Do you have any role in closing the road/lane/impacting the traffic?
● Is there anything about the process that could be streamlined?
● Is there anything about the process where communication, esp. with TOC/traffic
management be improved?
● How do you classify different types of incidents?
○ Only accidents?
○ Different levels?
○ What do you do if something has multiple possible classifications?
● Do you have a log of all the events that EMS goes to?
○ How do you log them?
■ Automatic/manual
■ Is the format easily searchable/indexable?
■ What system?
■ What information do you include?
■ Classification?
■ Who logs the information?
■ Do you share that information?
● Would you be willing to share that information?
■ Is the log ever used for anything?
● Are you ever contacted or needed for anything besides accidents?
○ How do you separate accidents from other calls?
● Internal communications structure?
○ Up/down/across levels?
○ Formal or informal procedure?
■ How good at following formal procedure?
○ Limitations of the system?
● External communications?
○ When an emergency occurs on a road, how are you notified?
○ What other agencies typically?
■ Up/down/across levels?

98
■ Formal or informal procedure?
● How good at following formal procedure?
■ Limitations of the system?
● If not already mentioned, do you communicate with any other agencies?
○ What do you tell them?
○ Who do you contact about what?
○ How do you determine when someone else needs to be contacted?
○ How do you communicate with them? What technologies/modes?
Los Alamos TMC Questions
● What software packages do you currently use to manage traffic
● Do you currently have a method for communicating with the NMDOT about issues within your district
○ can there be an RSS feed established to send data to NMRoads?
● What video analytic software do you use if any?
● In terms of a brick and mortar/ hybrid/ virtual setup, do you currently have a method for managing traffic
remotely?
● Do you currently communicate with local stakeholders?
○ If so what medium of communication do you use?
○ Do they provide you with feedback
■ Is it timely
■ Can they remotely send you feedback
○ Do these stakeholders currently benefit from your traffic information
● Do you have a mobile application or website?
New Mexico DPS Questions ● What are your current interactions with the department of transportation when there are traffic incidents?
○ Email chain?
○ Do you like it?
○ Do you get info back?
○ Do you want to?
● How do you log incidents? Specific codes related to traffic?
○ Do you share these with anyone can you?
● Is there anything you’d like to improve with your interactions the TOC/department of transportation?
● Are you content with the current email system that has been put in place for reporting incidents
○ Would you like to see more out of this system
○ Do you have to go out of your way to create the emails or are they a part of your current logging
protocol
■ Could your CAD system theoretically output incident emails to the DOT automatically if
this is not currently the case?
● Do local police contact you with issues to report
○ Is the chain of information from local to state to the DOT effective/ robust?

99
Appendix. B - Tables Table 8 CAD Software Evaluation Table
Functional
Requirements Software 1 Software 2 Software 3 Software 4
Geocoding
Data Logging
In field Vehicle
Tracking
Hold Radio Logs
Single
radio/phone platform
Feasibility of
NMRoads Integration
Necessary
Hardware Upgrade Cost
Cost
Table 9 Simtable Usage Numerical Evaluation Chart
Simtable
Usage
Design #1 Design #2 Design #3 Design #4 Design #5
C:
Enables
Communication
With More Than
One Agency
C:The
Agency Is Willing
to Use the
Method
O:The
communication
does not rely on
"Middlemen"

100
O: Is
Reliable
O:
Promote
Efficiency
O:
Redundant
Communication
(Field to
Dispatch)
O:
Accessible
O: Can
Be Incorporated
Into Training
Session
O: Is
Simple to
Implement
O:
Applicable to
Predetermined
Incidents/Users
O: User
Friendly
Total
0 - does not meet
1 - slightly meets
2 - partially meets
3 - mostly meets
4 - fully meets
Table 10 Incident Protocol Numerical Evaluation Chart
Incident
Protocol
Design #1 Design #2 Design #3 Design #4 Design #5
C:

101
Enables
Communication
With More Than
One Agency
C:The
Agency Is
Willing to Use
the Method
O:The
communication
does not rely on
"Middlemen"
O: Is
Reliable
O:
Promote
Efficiency
O:
Redundant
Communication
(Field to
Dispatch)
O:
Accessible
O: Can
Be Incorporated
Into Training
Session
O: Is
Simple to
Implement
O:
Applicable to
Predetermined
Incidents/Users
O: User
Friendly

102
Total
0 - does not meet
1 - slightly meets
2 - partially meets
3 - mostly meets
4 - fully meets
Table 11 CAD Software Numerical Evaluation Chart
CAD Software
Design #1 Design #2 Design #3 Design #4 Design #5
C:
Enables
Communication
With More Than
One Agency
C:The
Agency Is Willing
to Use the
Method
O:The
communication
does not rely on
"Middlemen"
O: Is
Reliable
O:
Promote
Efficiency
O:
Redundant
Communication
(Field to
Dispatch)
O:
Accessible
O: Can
Be Incorporated

103
Into Training
Session
O: Is
Simple to
Implement
O:
Applicable to
Predetermined
Incidents/Users
O: User
Friendly
Total
0 - does not meet
1 - slightly meets
2 - partially meets
3 - mostly meets
4 - fully meets
Table 12 Dashboard Numerical Evaluation Chart
Dashboard
Design #1 Design #2 Design #3 Design #4 Design #5
C:
Enables
Communication
With More Than
One Agency
C:The
Agency Is
Willing to Use
the Method
O:The
communication
does not rely on
"Middlemen"
O: Is
Reliable
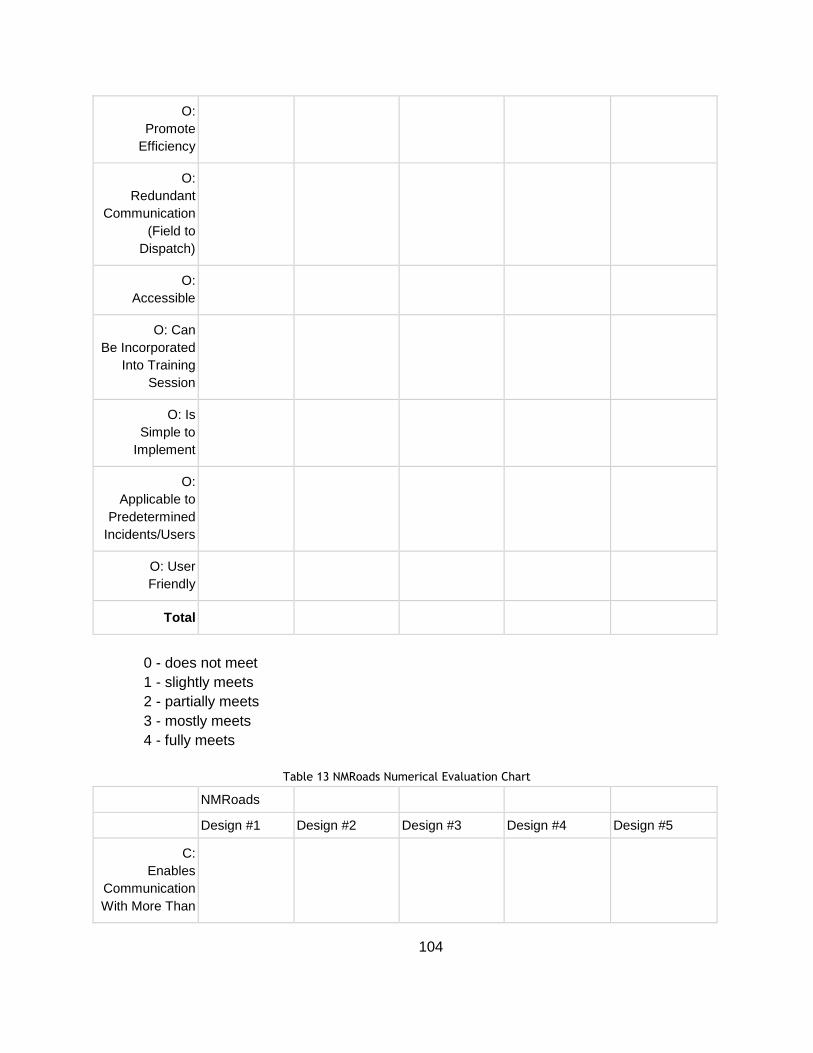
104
O:
Promote
Efficiency
O:
Redundant
Communication
(Field to
Dispatch)
O:
Accessible
O: Can
Be Incorporated
Into Training
Session
O: Is
Simple to
Implement
O:
Applicable to
Predetermined
Incidents/Users
O: User
Friendly
Total
0 - does not meet
1 - slightly meets
2 - partially meets
3 - mostly meets
4 - fully meets
Table 13 NMRoads Numerical Evaluation Chart
NMRoads
Design #1 Design #2 Design #3 Design #4 Design #5
C:
Enables
Communication
With More Than

105
One Agency
C:The
Agency Is
Willing to Use
the Method
O:The
communication
does not rely on
"Middlemen"
O: Is
Reliable
O:
Promote
Efficiency
O:
Redundant
Communication
(Field to
Dispatch)
O:
Accessible
O: Can
Be Incorporated
Into Training
Session
O: Is
Simple to
Implement
O:
Applicable to
Predetermined
Incidents/Users
O: User
Friendly
Total
0 - does not meet

106
1 - slightly meets
2 - partially meets
3 - mostly meets
4 - fully meets
Table 14 Patrol Vehicles Numerical Evaluation Chart
Patrol Vehicles
Design #1 Design #2 Design #3 Design #4 Design #5
C:
Enables
Communication
With More Than
One Agency
C:The
Agency Is
Willing to Use
the Method
O:The
communication
does not rely on
Middlemen
O: Is
Reliable
O:
Promote
Efficiency
O:
Redundant
Communication
(Field to
Dispatch)
O:
Accessible
O: Can
Be Incorporated
Into Training
Session
O: Is
Simple to
Implement
O:
Applicable to

107
Predetermined
Incidents/Users
O: User
Friendly
Total
0 - does not meet
1 - slightly meets
2 - partially meets
3 - mostly meets
4 - fully meets
Table 15 Customized Dashboards Per Agencies
Albuquerque TMC
Santa Fe D5 TOC
RECC Los Alamos TMC
NMRoads
Camera no PTZ
Camera PTZ
RECC Feed 29
Weather
SMS Chat Room
Count Data
Contact List
Traffic (Inrix/google) (times/levels)

108
Plow Tracking Map
Customizable RSS Feed
DMS Viewing

109
Appendix. C - Additional Research
ITS Architecture stakeholder list
● Albuquerque Transit
● Bureau of Indian Affairs
● City of Santa Fe
● City of Santa Fe Fire Department
● City of Santa Fe Police Department
● City of Santa Fe Public Works Department
● City of Santa Fe Senior Services
● City/ County of Santa Fe
● Commercial Vehicle Operators
● County Emergency Management Agencies
● County Public Safety Agencies
● Department of Game and Fish
● DPS Motor Transportation Division (MTD)
● Financial Institution
● Independent School Districts
● Local Media
● Local Transit Operators
● Municipal Government
● Municipal Public Safety
● Municipal Public Works Department
● New Mexico Department of Public Safety
● New Mexico General Services Department
● NMDOT
● NOAA
● North Central Regional Transit District
● Northern New Mexico Park and Ride Service
● Operation Respond Institute
● Private Concierge Service Providers
● Private Consultants
● Private Equipment Repair Providers
● Private Sector Traveler Information Service Providers
● Private Taxi Providers
● Private Tow/ Wrecker Providers
● Private Transportation Providers
● Private Travelers
● Private Weather Service Providers
● Private/ Public Ambulance Providers

110
● Rail Operators
● RECC Joint Powers Agreement
● Regional Medical Center
● Regional Public Safety Agencies
● Santa Fe Convention and Visitors Bureau
● Santa Fe County Public Works
● Santa Fe MPO
● Santa Fe Trails
● Town of Taos
● Transit Partnership
● Tribal Councils
● Volunteer Fire Departments
Simtable
Simtable is an interactive demonstration tool that combines GIS data with agent-based
modeling to provide a means for preparing protocols on handling a variety of incidents.124 This
technology most commonly uses a projector and computer to transmit simulations on any
surface. Typically a sand table is used due to the abilities to model changes in topography and
other surface features, yet the technology can be used on any surface.125 Simtable helps link
data visualization and human computer interactions and apply it to resolving social and physical
dilemmas.126 This tool is typically applied to emergency management, airborne particles,
biological and ecological behaviors, wildfire, flood, evacuations, defense and urban security
communities.127 A common application of the Simtable is in firefighter trainings on how to put out
forest fighters.128 This tool can also be used to model traffic flow and simulate various scenarios
that would disrupt traffic, adjust transportation routes or other various traffic management
tools.129 Real time GIS data is used to keep the simulations the most up to date as possible.130
The ultimate goal of this tool is to increase real time situational awareness for a variety of
scenarios.131
Simtable can identify fixed objects, motion and the links between them through matching
pixel by pixel the generated data from the camera to the projector. This technology also
responds to light in terms of initiating various simulations. Real maps are used and the
projections are layered to create a scenario, in addition to the ability to realistically scale objects
and other data. Simtable promotes communication between various parties as the same model
can be shared and utilized throughout different locations and devices by sending the Uniformed
Resource Locator (URL) or Quick Response (QR) code. Simtable is working on expanding its
124
(Simtable 2015) 125
Idem. 126
Idem. 127
Idem. 128
Personal Correspondence with Stephen Guerin. Simtable 129
Idem. 130
(Simtable 2015) 131
Idem.

111
technologies to connect smartphones to projectors in order to increase the functionality of the
tool to commonly owned items.132
132
Personal Correspondence with Stephen Guerin. Simtable.

112
Appendix. D - Completed Tables
Table 16 Stakeholder and TOC Relationship Results Part 1

113
Table 17 Stakeholder and TOC Relationship Results Part 2

114
Table 18 Current TOC Incident Management Results

115
Table 19 TMC Models Results

116
Table 20 Current TOC Organizational Results

117
Table 21 Solution Morphological Chart Results

118
Table 22 CAD Charts Results

119
Table 23 TOC Operations Numerical Evaluation Chart Results

120
Table 24 CAD Systems Numerical Evaluation Chart Results

121
Table 25 TOC Incident Protocol Numerical Evaluation Chart Results

122
Table 26 NMRoads Numerical Evaluation Chart Results
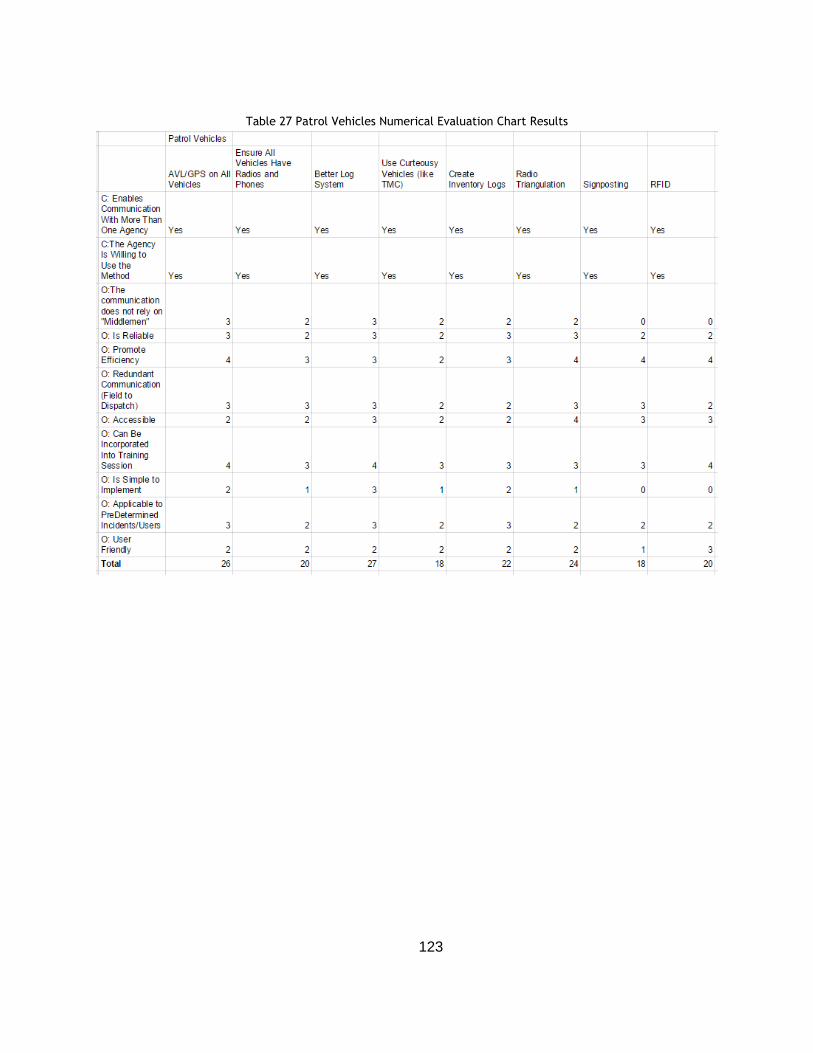
123
Table 27 Patrol Vehicles Numerical Evaluation Chart Results
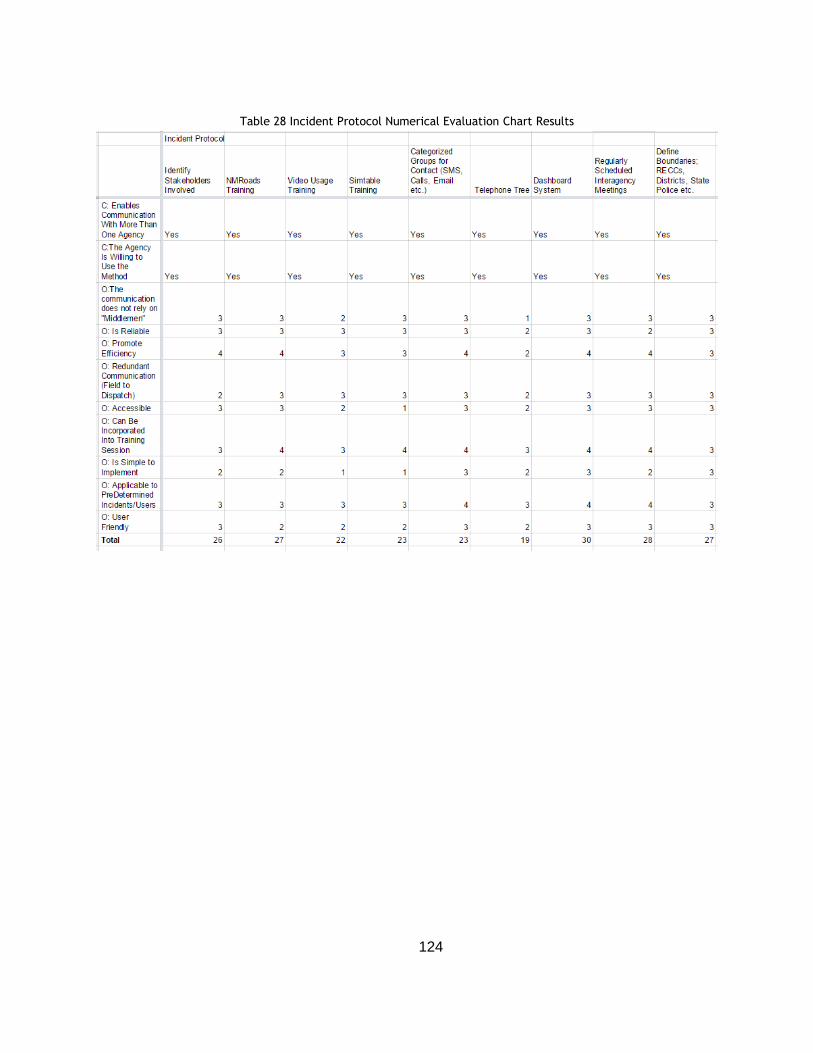
124
Table 28 Incident Protocol Numerical Evaluation Chart Results

125
Table 29 Simtable Usage Numerical Evaluation Chart Results

126
Table 30 Dashboard Numerical Evaluation Chart Results

127
Appendix E
Section 1. Dashboard Widgets
In this section we compiled a list of theoretical widgets that could be implemented within
a Dashboard. This section also describes the functions of the possible widgets.
NMRoads Widget
The NMRoads website offers great functionality and information for both users and
administrators, however many of the stakeholders including the DOT who view this information
source also have the need to view other information sources simultaneously. For this reason, it
would be very beneficial for the TMC to have a NMRoads Widget. Within this widget the user
can view the NMRoads. It could also display the posts or notifications that get sent out through
NMRoads.
Live Traffic Camera Widget
In addition to having a NMRoads application, creating a Camera Widget that can have
the most critical cameras present in front of a stakeholder relevant to their specific region could
be at a great advantage in the event of an emergency when information needs to be accessed
remotely with ease. The current method for viewing Cameras remotely is looking at them
individually within NMRoads which is not a smooth method for viewing various cameras
simultaneously with PTZ (Pan Tilt Zoom) functionality. Currently, to adjust a camera, you can
only have one camera open at a time, while attempting to adjust the PTZ functionality. From our
findings, not everyone should have the access rights to adjust the cameras because this
requires special training. This being said, the camera widget will allow PTZ for stakeholders with
specific access rights, and only viewing for other users depending on the needs of the
stakeholder.

128
Figure 42 Dashboard Traffic Camera Feed Widget133
RECC Feed Widget
From our meetings with the RECC, we established that their CAD system categorizes
various incident types with different codes. The RECC receives calls for Fire, Police, EMS, for
the Santa Fe Region, which means that they bridge the gap between 911 and emergency
responders. Utilizing their CAD system, we plan to synthesize their data to display all their code
29’s, or traffic and accident reports to display on a Dashboard RSS style feed. This will be very
beneficial to Traffic Management Centers because it will receive word of incidents, although
unverified, as soon as they are reported.
Weather Widget with Expanded Functionality
City Knowledge currently has a weather widget; however, for the betterment of this
project, our advisor Professor Carrera has utilized his connections at City Knowledge to adapt
the weather widget so that it can easily be adjusted per location. This will allow stakeholders
such as the TMC to simply input the location they wish to see the weather for, without using
additional web pages to view different weather. Dashboard is so customizable that you could
even have multiple weather widgets open within the same Dashboard for various locations in
the district, or the state in terms of the TMC.
133
(City Knowledge Santa Fe 2015)

129
Figure 43 Dashboard Weather Widget134
Virtual Interagency Communication
In an effort to be prepared for any situation, there is a need for a method of
communication for incidents that are not worthy of phone calls to reach representatives at other
traffic centers throughout the district and state. For non-critical emergencies, a chat room style
interface that could also be SMS based would work very well in connecting interagency
organizations. Critical personnel can be placed in chatrooms with others, similar to a district 5
dispatcher reporting back to the Albuquerque TMC all within a small widget while
simultaneously viewing other information sources. This transfer of data could also be used to
add multiple stakeholders’ dispatchers into a single place, to make quick decisions about
issues. This could also have a voice activated feature to allow for online radio communication.
Count Data
There are a lot that can be done by monitoring traffic rates such as Planning, Traffic
Information, Information about congestion times, as well as light timing information. In the
specific case of Los Alamos, there are currently have counters on sections of the main
roadways that leads in and out of the area. This roadway utilizes small magnetic sensors that
can detect when large metal objects pass over them, and can tell the size of the vehicle,
distinguishing between truck or small vehicle. Currently, Los Alamos traffic data is collected in
134
(City Knowledge Santa Fe 2015)

130
real time and posted to a website automatically. This data is useful for the TMC in Los Alamos,
which is why we believe, that it would be beneficial to have it displayed within their Dashboard.
A widget displaying a Twitter feed could be incorporated in the Dashboard. This would
allow stakeholders to use Twitter to review press releases or public comments about roadways.
Figure 44 Dashboard Twitter Widget135
Google Emergency Contact Widget
The current setup at the traffic operations center has many call lists that are over
complicated, possibly out of date, and cluttered making it challenging to find the number you
actually need. A simple solution that could solve this would be to create a google account with a
name such as “NMStateEmergencies”. Within this account, there could be explicit names of
who to call for a specific emergency. In addition to this, within the notes field of each contact
there could be specific information about the caller that could easily be picked up within
Google’s search feature. An example of this would be if there was a deer, the title of the contact
could be animal patrol, and deer could be listed within the notes so the search engine could pick
up on the content. The way we see this widget functioning would be similar to a smart phones
contacts with all the contacts listed in alphabetical order with a search bar at the top. The widget
would be small, but the search feature would be the primary method for finding the correct
contact. An added benefit for using the google account would be the that the contacts can be
loaded to mobile phones. For NMDOT personnel in the field, it would be very easy to have the
additional contacts loaded in their phones in case of emergencies. An example can be seen in
Figure 41.
135
(City Knowledge Venice 2015)

131
Traffic Speeds
Figure 45 Dashboard Traffic Congestion Widget136
Similar to the Venice Dashboard, data is available from various information sources to
display the traffic speeds of roadways in New Mexico. Currently NMRoads displays statewide
traffic information on a map with red, orange, yellow, green, and black. This information is
excellent on NMRoads, but for a local stakeholder, an example being the TOC in District 5, state
level traffic delays are not relevant, only information from district 5 is mainly needed within that
region. For this reason, displaying INRIX data similar to the images above where a specific
region is displayed within the map can be very useful for the local stakeholders.
Plow Tracking Through AVL
The use of AVL systems to bring plow data to the general public is an up and coming
concept. Virginia is one of the first states to implement this technology for the general public.
Similar to having widgets that contain INRIX data, this information could be displayed at a
smaller level than state level, only pertaining to a specific location relevant to a stakeholder if it
were to be displayed in a Dashboard widget. This information can directly benefit EMS in
regards to getting to incidents during bad weather.
136
(City Knowledge Santa Fe 2015)

132
DMS Viewing
Relevant to location, viewing DMS data is important information for specific stakeholders
to view. With logins to the Dashboard being customized based on a stakeholders needs which
usually pertain to their location, DMS signs similar to a twitter feed can be organized based on a
simple RSS feed style display.
Figure 46 DMS Display Widget137
Section 2. Dashboard Applications
Expanding on what each stakeholder needs, specific widgets needed to be produced in
order to meet each stakeholders needs. Looking at the possibility of what each stakeholder
could want, we developed Table 31 below to evaluate what would be on each organization's’
perspective Dashboard. This chart covers widgets, widget access rights, and possible
information sources.
137
(City Knowledge Santa Fe 2015)

133
Table 31 Dashboard Widget Evaluation Chart Results
Albuquerque TMC
Santa Fe D5 TOC
RECC Los Alamos TMC
NMRoads X X X X
Camera no PTZ
X X
Camera PTZ
X X
RECC Feed 29
X X X X
Weather X X X X
SMS Chat Room
X X X
Count Data
X
Twitter X X X X
Contact List
X X X X
Traffic (Inrix/google) (times/levels)
X X X
Plow Tracking Map
X
Customizable RSS Feed
X X X X
DMS Viewing
X X X
Albuquerque
The Albuquerque TMC has a very particular set of needs. Considering they oversee
traffic at the state level, they need to have access to the greatest amount of information, with an
easy interface to view and make informed decisions about this information. For these reasons,
they need to have full PTZ access to the camera widgets, with access to the RECC feeds and
SMS. Inrix data also plays a role on the state highways which intersect in Albuquerque and are
within district 3. DMS signs also are only changed within the TMC so it would make sense that
they have an easy way to access all the signs in the state.
District 5 TOC in Santa Fe
The District 5 TMC should have similar access to the Albuquerque TMC including
access to the PTZ features of the cameras, RECC feed, and chat room features. The main
difference between this the TOC and the Albuquerque Dashboard is the use of the plow tracking
widget. This is something that the local district has been asking for to reduce the time it takes to
log plowing as well as keep the general public notified about the quality of the roads, ultimately

134
improving their safety. This technology could be used by the Albuquerque TMC; however it was
not noted as a priority by them.
Santa Fe RECC
The RECC has a very different set of needs compared to both the TOC and TMC. The
RECC would like to have traffic alerts so they can know if there is an incident on the way to an
accident to avoid it. For this reason, they want access to the cameras within their region;
however they do not need access to PTZ the cameras. Weather plays an obvious role, and their
intent for the Dashboard was to have the data displayed on monitors throughout the RECC. For
this reason it makes sense to have the RECC Feed 29 displaying all their current accidents so
that people can stay up to date on what is going on within the center. Contact lists in the event
of an emergency as well as SMS chat rooms to collaborate with the DOT and possibly LOs
Alamos TMC could very much benefit the center in the event of an emergency. DMS and Inrix
data goes along with simply making sure that the RECC is up to date with the current road
conditions as to not be delayed on the way to an accident.
Los Alamos Traffic Management Center
The Los Alamos Traffic Management Center covers a very small section of road, but
also has virtually full video coverage of the main intersections and highest volume sections of
road. For this reason, it makes sense that if they had their own Dashboard, they should have
their cameras running utilizing the camera widget. Inrix and plow information from the state is
also not necessarily relevant to this small town, so we did not feel it was necessary to include it
in the TMC. Los Alamos does have various counters places throughout the town, which count
vehicles and the vehicle size that passes over the counter. This data is relevant to Los Alamos
which is why having it displayed in a widget would be very beneficial to them. In case of an
emergency, it makes sense to have Los Alamos in the SMS chat room for the purpose of swift
interagency communication.

135
Bibliography
(LEITSC), Law Enforcement Information Technology Standards Council. "Standard Functional Specifications for Law Enforcement Computer Aided Dispatch (Cad) Systems." 2003.
"About." http://www.econolite.com/index.php/about#about. Administration, Federal Highway. "Real-Time System Management Information
Program." 2010. Administration, Federal Highway. "Traffic Signal Timing Manual." In Institute of
Transportation Engineers. ITE Journal, 33. Washington: Institute of Transportation Engineers, 2009.
Ainsworth, Brian. In IQP, edited by WPI DOT Team, 2015. Alexiadis, Vassili, Krista Jeannotte, and Andre Chandra. "Traffic Analysis
Toolbox “, edited by Federal Highway Administration, 17. Oakland, CA: Cambridge Systematics, Inc., 2004.
Bernasek, Anna. "The Cost of Getting Stuck in Traffic." In Inrix, Estimate of traffic congestion costs in the U.S., 2013: $124 billion; Forecast of traffic congestion costs in the U.S., 30: $186 billion SOURCE: INRIX AND THE CENTRE FOR ECONOMICS AND BUSINESS RESEARCH. Newsweek, 2014.
"Bluetoad - Bluetooth Detection for Travel Time & Road Speeds." TraffiCast http://www.trafficcast.com/products/view/blue-toad/.
Brown, Tim. In IQP, edited by WPI DOT Team, 2015. Bureau of Transportation, Statistics. "National Transportation Statistics,
2013;2014 Asi 7314-1." 2014. Bureau of Transportation, Statistics. "State Transportation Statistics 2013;2014
Asi 7314-16." 2014. Carrera, Fabio. In IQP, edited by WPI DOT Team, 2015. "City Knowledge." http://www.cityknowledge.net/#projects. Clark, Kimberly. In IQP, edited by WPI DOT Team, 2015. Clark, Maggie. "Do Traffic Cameras Work?" Governing The States and
Localities, 2013. Committee, State of New Mexico Legislative Finance. "Report of the Legislative
Finance Committee to the Fifty-First Legislature First Session." edited by Legislative Finance Committee. Santa Fe, New Mexico, 2013.
Dailey, Daniel. "The Use of Weather Data to Predict Non-Recurring Traffic Congestion." Washington State Transportation Center (TRAC) (2006).
Daktronics. "Freeways." Daktronics, 2015. DiRuggiero, John. In IQP, edited by WPI DOT Team, 2015. DiRuggiero, John. "Psap." ARCGIS, 2015. Dowling, Richard, Alexander Skabardonis, and Vassili Alexiadis. "Traffic
Analysis Toolbox ", edited by Federal Highway Administration. Oakland, CA: Cambridge Systematics, Inc., 2004.
Evans, Don. "Geographic Information Systems (Gis)." United States Environmental Protection Agency,http://www.epa.gov/reg3esd1/data/gis.htm.
Fe, City Knowledge Santa. "Santa Fe Dashboard." 2015. Fe, City of Santa. "Santa Fe Trends 2014." edited by Mid Region Council of
Governments of New Mexico, 10. Santa Fe, NM: City of Santa Fe, 2014.

136
Fitzpatrick, Michael. In IQP, edited by WPI DOT Team, 2015. FLIR. "Fc-Series Its." http://www.flir.com/traffic/display/?id=62067. Grimm, Julie. "City Panel Scheduled to Discuss Santa Fe Traffic Issues." The
Santa Fe New Mexican (2012). Guerin, Stephen. In IQP, edited by WPI DOT Team, 2015. Guerin, Stephen. "Simtable." http://www.simtable.com/. Gupta, Pratishtha, G.N. Purohit, and Amrita Dadhich. "Computing Installation
Parameters of Cctv Cameras for Traffic Surveillance." International Journal of Computer Science & Information Technology (IJCSIT) 4, no. 6 (2012): 105-24.
Hargis, Amanda. In IQP, edited by WPI DOT Team, 2015. Inrix. "Americans Will Waste $2.8 Trillion on Traffic by 2030 If Gridlock Persists."
edited by Centre for Economics and Business Research, 2014. Inrix. "Why Inrix - a Closer Look." Inrix, http://www.inrix.com/why-inrix/. Jodoin, Paul. "Traffic Incident Management." U.S. Department of Transportation
Federal Highway Administration,http://ops.fhwa.dot.gov/eto_tim_pse/about/tim.htm. "Key Concepts of the National Its Architecture." Developing Traffic Signal
Control System Using the National ITS Architecture (2012),http://www.iteris.com/itsarch/.
Khorasani, Ali. In IQP, edited by WPI DOT Team, 2015. Liming, Reed. "City Annexation Plan." City of Santa Fe, 2005. Martinez, David. In IQP, edited by WPI DOT Team, 2015. Mexico, The University of New. "New Mexico Traffic Crash Annual Report
2011." In New Mexico Traffic Crash Annual Report. Santa Fe, New Mexico, 2013. "National Its Architecture." The National ITS Architecture
7.0,http://www.iteris.com/itsarch/. "New Mexico Department of Transportation." New Mexico Department of
Transportation, http://dot.state.nm.us/en/Traffic_Safety.html. "New Mexico Department of Transportation District 5 Phase Ii Ms4 2014 Annual
Report." Albuquerque, NM: Bohannan Huston, Inc., 2014. New Mexico Highway and Transportation, Department. "New Mexico Traffic
Crash Information, 2009 Annual Report;2012 Sri S5665-1." 2012. "New Mexico Transportation by the Numbers:Meeting the State's Need for Safe
and Efficient Mobility." TRIP: A National Transportation Research Group, http://www.tripnet.org/docs/NM_Transportation_By_The_Numbers_TRIP_Report_Jan_2014.pdf.
"Nmroads Website." Santa Fe, New Mexico: NMDOT, 2015. Operations, Emergency Transportation. "What Is an Incident?" U.S. Department
of Transportation Federal Highway Administration,http://ops.fhwa.dot.gov/eto_tim_pse/docs/incident_mgmt_perf/section2.htm.
Operations, Office of. "Traffic Bottlenecks." U.S. Department of Transportation Federal Highway Administration, http://ops.fhwa.dot.gov/bn/lbr.htm.
Radow, Laurel. "Simplified Guide to the Incident Command System for Transportation Professionals." U.S. Department of Transportation Federal Highway Administration,http://www.ops.fhwa.dot.gov/publications/ics_guide/.
Relief, Focus on Congestion. "Describing the Congestion Problem." U.S. Department of Transportation Federal Highway Administration.
Richtmyer, William Hames Student author M. G. E., Dylan Joseph Student author C. S. Kirby, Gregory Thomas Student author C. S. Giola, Kristen Lee Student author C. S. Brann, F. L. Faculty advisor C. E. Hart, and Fabio Faculty advisor I. D.

137
Carrera. "25 Years of Venice Knowledge Online." Worcester, MA U6 - ctx_ver=Z39.88-2004&ctx_enc=info%3Aofi%2Fenc%3AUTF-8&rfr_id=info:sid/summon.serialssolutions.com&rft_val_fmt=info:ofi/fmt:kev:mtx:book&rft.genre=book&rft.title=25+Years+of+Venice+Knowledge+Online&rft.au=Richtmyer%2C+William+Hames+Student+author+--+MGE&rft.au=Kirby%2C+Dylan+Joseph+Student+author+--+CS&rft.au=Giola%2C+Gregory+Thomas+Student+author+--+CS&rft.au=Brann%2C+Kristen+Lee+Student+author+--+CS&rft.series=Science+and+Technology%3A+Policy+and+Management&rft.date=2014-01-01&rft.pub=Worcester+Polytechnic+Institute&rft.externalDocID=2074157¶mdict=en-US U7 - eBook U8 - FETCH-wpi_catalog_20741573: Worcester Polytechnic Institute, 2014.
Schwartz, James. "Cause of Road Congestion: Too Many Cars." The Urban Country, 2012.
Statistics, Bureau of Transportation. "National Transportation Statistics." edited by U.S. Department of Transportation. Office of the Assistant Secretary for Research and Technology, 2014.
"The Big Picture." CityKnowledge, 2015. Thilmany, Jean. "Designing Traffic Management Centers." Mechanical
Engineering-CIME, 2000/03// 2000, 24. Thornton, Kyle. In IQP, edited by WPI DOT Team, 2015. "Traffic Cameras." https://wiki.waze.com/wiki/Cameras. Transportation, New Mexico Department of. "About the New Mexico Department
of Transportation." http://dot.state.nm.us/en/About_Us.html. Transportation, New Mexico Department of. "Nmdot District 5 Traffic Operation
Center." 2011. Transportation, New Mexico Department of. "Nmdot Patrol Yards." New Mexico
Department of Transportation,http://dot.state.nm.us/content/dam/nmdot/Travel_conditions/maps/patrol_yd_D.pdf.
Transportation, New Mexico Department of. "Nmroads." Real Time Solutions,http://nmroads.com/.
Transportation, Virginia Department of. "Nova Snow Plowing."http://novasnowplowing.virginia.gov/.
Venice, City Knowledge. "Venice Dashboard." City Knowledge,http://dashboard.cityknowledge.net/#/venice.
Wang, Robinson, Shelby, Cox, and Townsend. "Evaluation of Acs Lite Adaptive Control Using Sensys Arterial Travel Time Data." Siemens,http://w3.usa.siemens.com/mobility/us/en/urban-mobility/road-solutions/adaptive-software/Documents/Fulton%20County%20ACS%20Lite%20Evaluation.pdf.
Wilson, Keith. In IQP, edited by WPI DOT Team, 2015. Wilson, Taylor Louis Student author C. E., Danielle L. Student author E. C. E.
Riccardi, Ryan Scot Student author B. E. Mathie, Victoria Lynn Student author M. E. Carlson, Fabio Faculty advisor I. D. Carrera, and Lauren M. Faculty advisor B. B. Mathews. Developing an Integrated Traffic Corridor in Santa Fe through Intelligent Transportation Infrastructure. Worcester, MA U6 - ctx_ver=Z39.88-2004&ctx_enc=info%3Aofi%2Fenc%3AUTF-8&rfr_id=info:sid/summon.serialssolutions.com&rft_val_fmt=info:ofi/fmt:kev:mtx:book&rft.genre=book&rft.title=Developing+an+Integrated+Traffic+Corridor+in+Santa+Fe+throug

138
h+Intelligent+Transportation+Infrastructure&rft.au=Wilson%2C+Taylor+Louis+Student+author+--+CE&rft.au=Riccardi%2C+Danielle+L.+Student+author+--+ECE&rft.au=Mathie%2C+Ryan+Scot+Student+author+--+BE&rft.au=Carlson%2C+Victoria+Lynn+Student+author+--+ME&rft.series=Urban+and+Environmental+Planning&rft.date=2014-01-01&rft.pub=Worcester+Polytechnic+Institute&rft.externalDocID=2565696¶mdict=en-US U7 - eBook U8 - FETCH-wpi_catalog_25656963: Worcester Polytechnic Institute, 2014.
"Work Zones." Texas Department of Transportation,http://www.txdot.gov/driver/share-road/work-zones.html.