Embed Size (px)
Citation preview
SIX-MONTHLYREPORT
OF THE IMPOL GROUP ANDIMPOL 2000, D.D.
JAN–JUN 2016
2
six-monthly report
Unaudited Report on the operations of the Impol Group and Impol 2000, d.d., in the first six months of 2016
Index
IN-DEPTH REVIEW 3
Detailed Examination of Impol Group Operations in first six months of 2016 3
Presentation of the parent company Impol 2000, d.d., and the Impol Group 5
Important business events and achievements of the Impol Group in the first six months of 2016 8
Performance analysis for the Impol Group and Impol 2000, d.d. 10
FINANCIAL REPORT FOR THE IMPOL GROUP FOR THE FIRST SIX MONTHS OF 2016 19
Consolidated financial statements of the Impol Group 20
Disclosures for individual items in financial statements 28
FINANCIAL REPORT FOR IMPOL 2000, d.d., FOR THE FIRST SIX MONTHS OF 2016 45
Financial statements of Impol 2000, d.d. 46
Disclosures for individual items in financial statements 52
List of tables and charts 66
3
six-monthly report
Unaudited Report on the operations of the Impol Group and Impol 2000, d.d., in the first six months of 2016
DETAILED EXAMINATION OFIMPOL GROUP OPERATIONS IN
FIRST SIX MONTHSOF 2016
AN IN-DEPTREVIEW

4
six-monthly report
Unaudited Report on the operations of the Impol Group and Impol 2000, d.d., in the first six months of 2016
THE FIRST SIX MONTHS OF 2016
Table 1: Key indicators
Chart 1: EBITDA margin Chart 2: Net debt/EBITDA
Characteristics of Impol Group Operations in First Six Months of 2016
• The first half of 2016 continued to mark a positive trend in increasing the demand for the products of the Impol Group, which enabled the set monthly targets in all sales programmes to be achieved and even exceeded.
• In comparison with the first half of the previous year, the quantitative sales in the first six months of 2016 increased by more than five percent.
• Proceeds from the sales in the first six months of 2016 compared to the first half of the previous year were lower, however, this drop resulted from the decreased value of aluminium on the stock exchange, which is the basis for determining the sales prices of products and the purchase prices of raw materials.
• The Impol Group has managed to maintain and even increase profitability in specific segments, also with the support of favourable conditions in the upstream and downstream market. Purchase premiums for the input raw materials have also decreased this year and at the same time we managed to maintain sales prices due to an increase in demand, which has had a favourable impact on sales margins.
• In comparison with the first half of 2015, we have recorded a 33.9% increase in EBITDA and a decrease in net debt ratio as compared to EBITDA.
• On 30 June 2016, the Impol Group employed 2,148 people, of which 1,175 worked in companies in Slovenia, 680 in Serbia, 288 in Croatia, 3 in the United States and 2 in Hungary.
Metric unit Jan–Jun 2014 Jan–Jun 2015 Jan–Jun 2016
The development in quantitative sales
Volume of sales of aluminium semi-finished products in 000 tonnes 97.1 99.3 104.8
Financial data
Net revenue from sales in million EUR 245.44 296.89 276.32
Share of exports in % 94% 94% 94%
EBITDA* in million EUR 24.2 24.8 33.2
EBIT in million EUR 16.0 17.4 25.7
EBITDA Margin in % 9.8% 8.4% 12.0%
Net profit or loss in million EUR 10.41 11.85 19.35
Investments in million EUR 6.64 3.97 14.95
Statement of financial position on 30 June 2016
Total assets in million EUR 329.4 351.4 370.4
Capital/equity in million EUR 105.8 118.6 144.8
Net debt** in million EUR 141.6 152.9 117.1
Net debt/EBITDA* 3.52 3.85 2.06
The share of capital in funding in % 32% 34% 39%
Employees
Number of employees on 30 June 2016 1,873 1,856 2,148
1 H 2014 1 H 20161 H 2015
10.0%
9.0%
11.0%
8.0%
12.0%
13.0%
14.0%
1 H 2014 1 H 20161 H 2015
2.42.2
2.6
3.4
2.0
2.8
3.6
3.0
3.8
3.2
4.0
*EBITDA = operating profit or loss + depreciation**Net debt = financial liabilities – cash and cash equivalents – current financial investments***The indicators take into account the EBITDA for the last 12 months (1 July 2015–30 June 2016)
5
six-monthly report
Unaudited Report on the operations of the Impol Group and Impol 2000, d.d., in the first six months of 2016
Parent Company
In compliance with the Companies Act, Impol 2000, d.d., with the registered office in Slovenska Bistrica, Partizanska 38, being the holding company of the Impol Group and a large public limited company, is obliged to prepare a consolidated annual report and have its operations audited. With the issue of bonds at the end of 2015 the company was transformed to a public limited company.
Impol 2000, d.d., a management company, was established in August 1998, and registered in the Register of Companies at the Re-gional Court in Maribor on 3 August 1998 as a public limited company, with the decision Srg. 98/01042, and with the entry number 1/10469/00. The Company is classified under the activity code 70.100, i.e., the management of holding companies. The Company’s registration number is 1317342.
On 9 November 1998, the Company’s decision Srg 98/01486 on increasing the share capital with in-kind contributions, i.e., with the shares of Impol, d.d., Slovenska Bistrica, was registered in the Register of Companies at the Regional Court in Maribor, with the entry number 1/10469/00.
On 1 October 1999, the Company adopted a decision on increasing its share capital. The in-kind contribution of Impol, d.d., i.e. the takeover of the 100-percent share that Impol, d.d., had in Impol Servis, d.o.o., was registered in the Register of Companies at the Re-gional Court in Maribor on 15 February 2000, with the decision Srg. 1999/03108, and the entry number 1/10469/00.
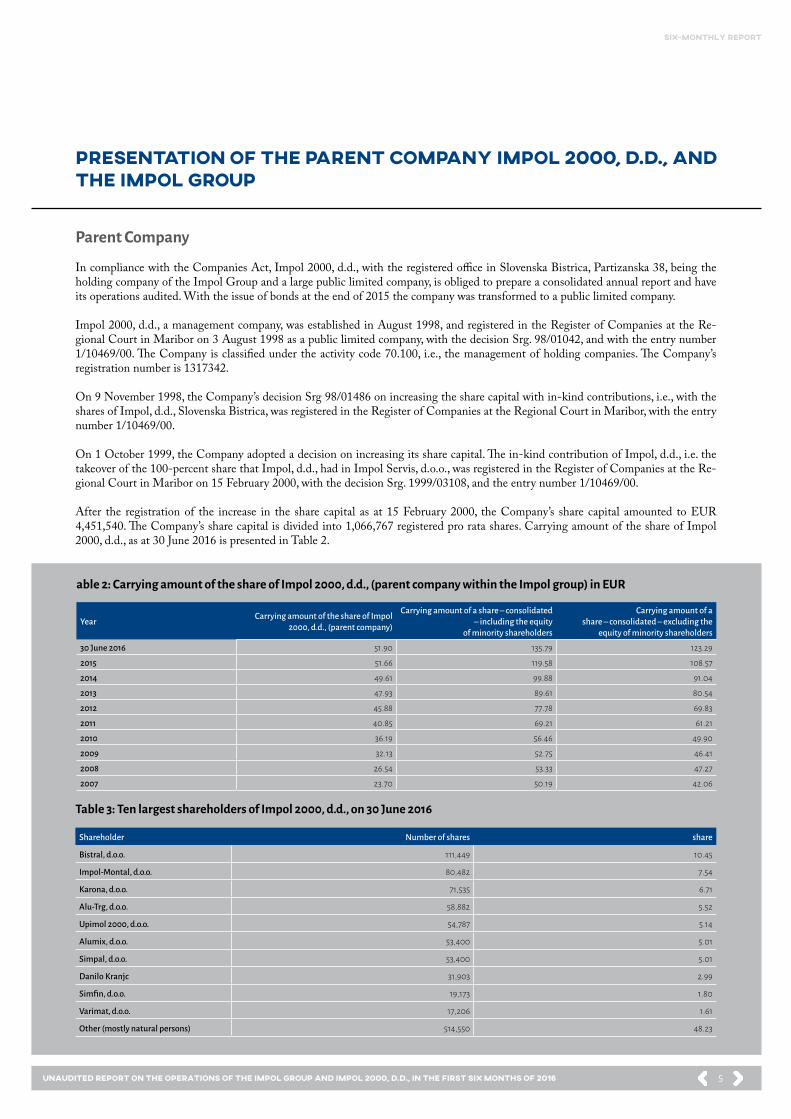
After the registration of the increase in the share capital as at 15 February 2000, the Company’s share capital amounted to EUR 4,451,540. The Company’s share capital is divided into 1,066,767 registered pro rata shares. Carrying amount of the share of Impol 2000, d.d., as at 30 June 2016 is presented in Table 2.
PRESENTATION OF THE PARENT COMPANY IMPOL 2000, D.D., AND THE IMPOL GROUP
able 2: Carrying amount of the share of Impol 2000, d.d., (parent company within the Impol group) in EUR
Year Carrying amount of the share of Impol 2000, d.d., (parent company)
Carrying amount of a share – consolidated – including the equity
of minority shareholders
Carrying amount of ashare – consolidated – excluding the
equity of minority shareholders
30 June 2016 51.90 135.79 123.29
2015 51.66 119.58 108.57
2014 49.61 99.88 91.04
2013 47.93 89.61 80.54
2012 45.88 77.78 69.83
2011 40.85 69.21 61.21
2010 36.19 56.46 49.90
2009 32.13 52.75 46.41
2008 26.54 53.33 47.27
2007 23.70 50.19 42.06
Shareholder Number of shares share
Bistral, d.o.o. 111,449 10.45
Impol-Montal, d.o.o. 80,482 7.54
Karona, d.o.o. 71,535 6.71
Alu-Trg, d.o.o. 58,882 5.52
Upimol 2000, d.o.o. 54,787 5.14
Alumix, d.o.o. 53,400 5.01
Simpal, d.o.o. 53,400 5.01
Danilo Kranjc 31,903 2.99
Simfin, d.o.o. 19,173 1.80
Varimat, d.o.o. 17,206 1.61
Other (mostly natural persons) 514,550 48.23
Table 3: Ten largest shareholders of Impol 2000, d.d., on 30 June 2016
6
six-monthly report
Unaudited Report on the operations of the Impol Group and Impol 2000, d.d., in the first six months of 2016
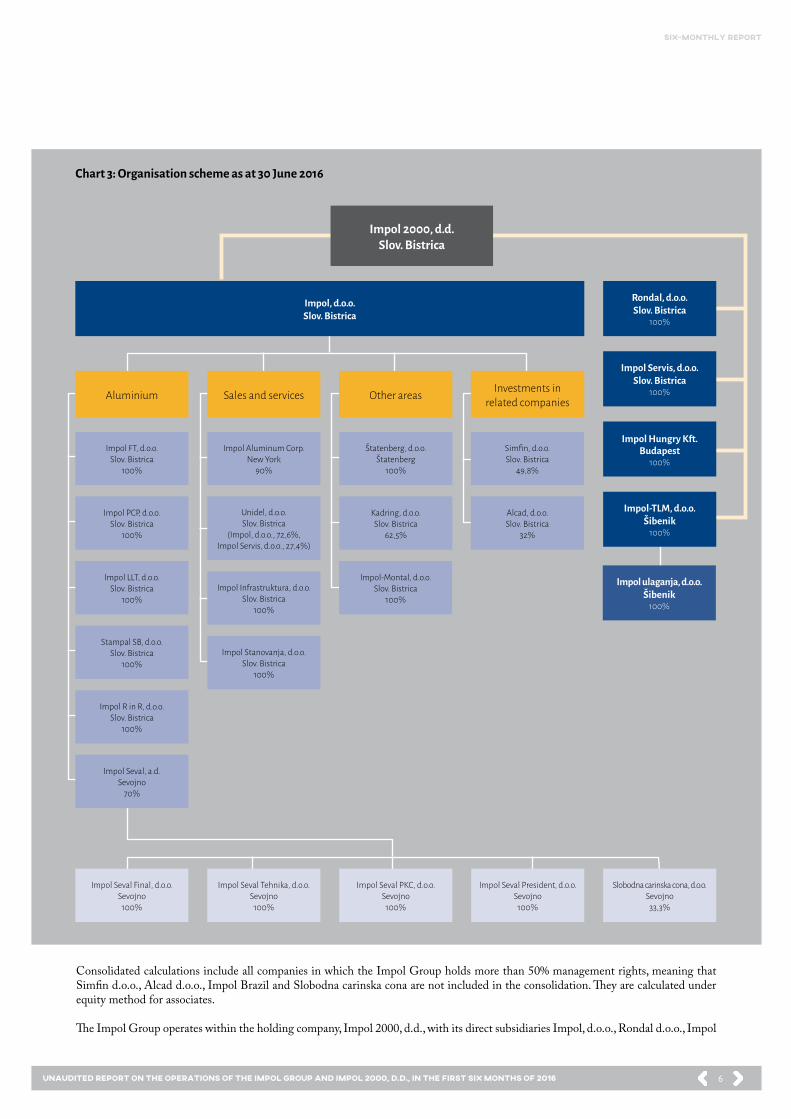
Consolidated calculations include all companies in which the Impol Group holds more than 50% management rights, meaning that Simfin d.o.o., Alcad d.o.o., Impol Brazil and Slobodna carinska cona are not included in the consolidation. They are calculated under equity method for associates.
The Impol Group operates within the holding company, Impol 2000, d.d., with its direct subsidiaries Impol, d.o.o., Rondal d.o.o., Impol
Chart 3: Organisation scheme as at 30 June 2016
Rondal, d.o.o. Slov. Bistrica
100%
Impol Hungry Kft. Budapest
100%
Impol Servis, d.o.o. Slov. Bistrica
100%
Impol-TLM, d.o.o. Šibenik
100%
Impol ulaganja, d.o.o.Šibenik
100%
Impol 2000, d.d.Slov. Bistrica
Impol, d.o.o. Slov. Bistrica
Aluminium Sales and services Other areas Investments in related companies
Impol Seval Final, d.o.o.Sevojno
100%
Impol Seval Tehnika, d.o.o.Sevojno
100%
Impol Seval PKC, d.o.o.Sevojno
100%
Impol Seval President, d.o.o. Sevojno
100%
Slobodna carinska cona, d.o.o.Sevojno
33,3%
Impol FT, d.o.o. Slov. Bistrica
100%
Kadring, d.o.o. Slov. Bistrica
62,5%
Impol-Montal, d.o.o. Slov. Bistrica
100%
Simfin, d.o.o. Slov. Bistrica
49,8%
Alcad, d.o.o. Slov. Bistrica
32%
Impol Aluminum Corp.New York
90%
Štatenberg, d.o.o.Štatenberg
100%
Impol LLT, d.o.o. Slov. Bistrica
100%Impol Infrastruktura, d.o.o.
Slov. Bistrica100%
Impol R in R, d.o.o. Slov. Bistrica
100%
Impol PCP, d.o.o. Slov. Bistrica
100%
Unidel, d.o.o.Slov. Bistrica
(Impol, d.o.o., 72,6%,Impol Servis, d.o.o., 27,4%)
Stampal SB, d.o.o. Slov. Bistrica
100%Impol Stanovanja, d.o.o.
Slov. Bistrica100%
Impol Seval, a.d. Sevojno
70%

7
six-monthly report
Unaudited Report on the operations of the Impol Group and Impol 2000, d.d., in the first six months of 2016
Hungary Kft. and Impol Servis, d.o.o., and Impol-TLM, d.o.o., which from 2 March 2016 it also owns Impol ulaganja, d.o.o., with its registered office in Croatia, and Impol, d.o.o., which operates with thirteen active subsidiaries, four active sub-subsidiaries, and two active associated companies.
Of 26 Group companies, 9 operate abroad. Impol Hungary Kft. and Impol-TLM, d.o.o., are direct subsidiaries of Impol 2000, d.d., whereas two subsidiaries of Impol, d.o.o., also operate abroad: IAC, New York, USA, and Impol Seval, a.d., Serbia, which is the 100% owner of four companies.

8
six-monthly report
Unaudited Report on the operations of the Impol Group and Impol 2000, d.d., in the first six months of 2016
Through Impol-TLM, d.o.o., in Croatia which the Impol Group established in 2015, the Group managed to lease production assets to set up the programme of rolled aluminium products in Šibenik. The above mentioned Impol-TLM purchased Adrial Ulaganja, d.o.o., on 2 March 2016 (which was later renamed into Impol ulaganja, d.o.o.). In April this year, first rolled products manufactured by Impol-TLM were launched to the market and production has increased. On 28 May 2016, this positive trend was interrupted by the fire on one of the key machines – a hot rolling mill. In co-operation with external experts, the Impol Group carried out repairs on the machine and successfully completed them in August. The hot rolling mill was restarted at the beginning of September 2016 and, thus, optimal production flow in Impol-TLM will be established in the last quarter of 2016.
The investments of the Impol Group prioritise the launch of production in Croatia and in this regard the Impol Group directed a lot of its energy in the first six months in the establishment of the system of management at Impol-TLM, d.o.o., and Impol ulaganja, d.o.o., in accordance with the corporate rules of the Impol Group.
The Impol Group also carried out a number of minor investments, which already successfully contribute to the increase in produc-tion capacities and to the achievement of strict quality requirements of the customers:• A new one chamber melting furnace was purchased for the foundry and a new line for continuous homogenisation of rods.• For extrusion a new ultrasonic device was acquired.• In Serbia, we are modernising a hot rolling mill and in Slovenia we are investing in the modernisation of a cold rolling mill for
the production of rolled products.• A new line for the production of forgings was launched.• Laboratory equipment was modernised and this enables the production of reliable and credible chemical, mechanical and
metallographic tests.
A new energy management information system, ENIS, was implemented for energy use optimisation. We also continued to update the business information system.
We are preparing a strategy of the Impol Group until 2025, where the Impol Group will pursue a major strategic objective, namely to achieve a sales volume in the amount of EUR 1 billion by 2025.
In accordance with the preparation of the renewed strategy, we are preparing an investment programme for the following investment period. The Impol Group has determined following priorities:• Increase of the capacity of rolling with the support of investment in the purchase of production means of TLM-Aluminium, d.
d., in bankruptcy and with the support of the modernisation of the equipment in Impol Seval, Sevojno, Serbia.• Increase of the capacity extrusion in Slovenska Bistrica and development of the finalisation of extruded products.• The adoption of the technology of casting rods and an increase in sales opportunities in this segment.• Gradual introduction of digitalisation and the establishment of a smart factory system.In the field of human resources management, we actively engaged in introducing the principles of lean operations, with a focus on reducing work-related accidents. We have introduced a system of line supervision on the situation of safety and quality in a majority of production processes and the activities for informing employees have been enhanced. As a result, the number of accidents at work in five largest companies of the Impol Group has decreased by 30 percent.
Important business events after the operative period
On 15 July 2016, 19th General Meeting of Impol 2000, d.d., took place and it was attended by 539,301 (50.78%) shares with the right to cast votes. The General Meeting took note of the adoption of the Annual Report of the company and the consolidated An-nual Report of the Impol Group for 2015. It decided to use EUR 1,504,141.47 for dividend payments, which is EUR 1.14 per share, from the formed profit of Impol 2000, d.d., in the amount of EUR 32,998,861.46. The remaining EUR 31,494,719.99 in undistrib-uted distributable profit remained undistributed. In the beginning of September 2016, the dividends were paid to all shareholders who entered in the Shareholder Register on 11 July 2016. The shareholders granted discharge to the Management Board and to the Executive Directors of Impol 2000, d.d., Auditor, d.o.o., was appointed as the approved auditor for 2016.
Foreseen operations in the second six months of 2016
As regards the operations of the Impol Group, the second six months of 2016 are presumed to be less profitable, mainly because of two factors:• due to holidays in August, in particular in Italy, the level of dispatch becomes lower and this has been foreseen in the annual
plan;
IMPORTANT BUSINESS EVENTS AND ACHIEVEMENTS OF THE IMPOL GROUP IN THE FIRST SIX MONTHS OF 2016
9
six-monthly report
Unaudited Report on the operations of the Impol Group and Impol 2000, d.d., in the first six months of 2016
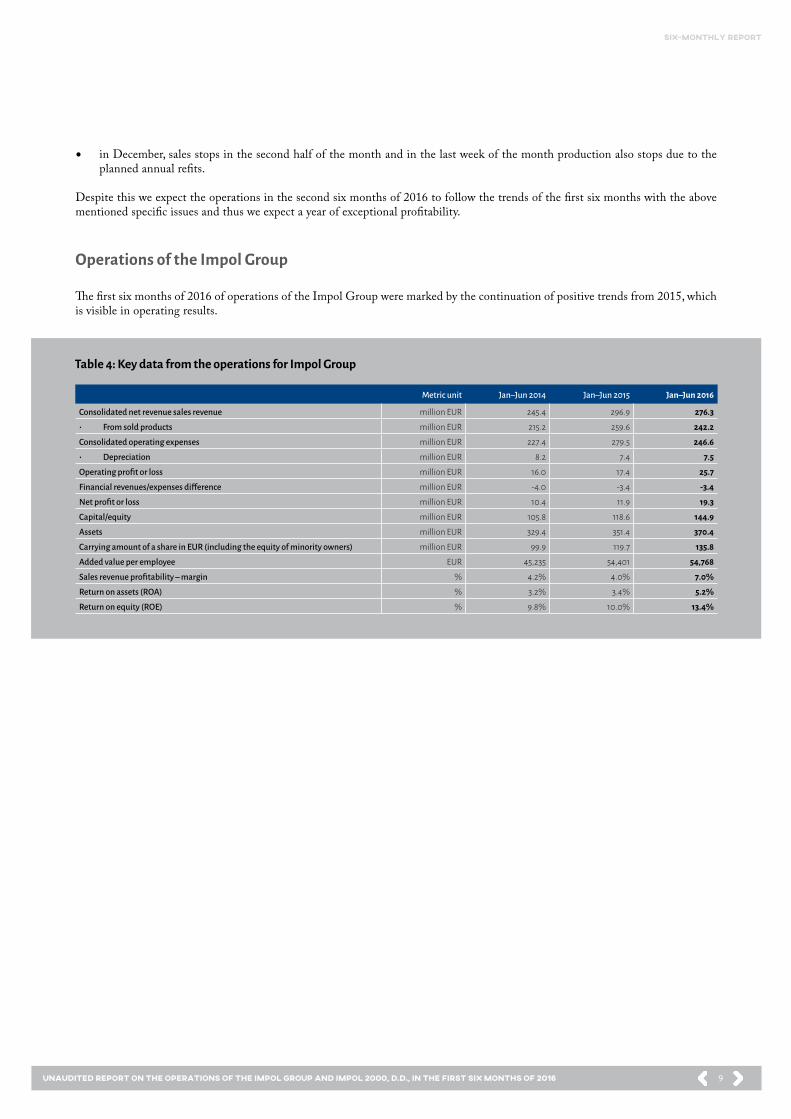
Table 4: Key data from the operations for Impol Group
Metric unit Jan–Jun 2014 Jan–Jun 2015 Jan–Jun 2016
Consolidated net revenue sales revenue million EUR 245.4 296.9 276.3• From sold products million EUR 215.2 259.6 242.2Consolidated operating expenses million EUR 227.4 279.5 246.6• Depreciation million EUR 8.2 7.4 7.5Operating profit or loss million EUR 16.0 17.4 25.7Financial revenues/expenses difference million EUR -4.0 -3.4 -3.4Net profit or loss million EUR 10.4 11.9 19.3Capital/equity million EUR 105.8 118.6 144.9Assets million EUR 329.4 351.4 370.4Carrying amount of a share in EUR (including the equity of minority owners) million EUR 99.9 119.7 135.8Added value per employee EUR 45,235 54,401 54,768Sales revenue profitability – margin % 4.2% 4.0% 7.0%Return on assets (ROA) % 3.2% 3.4% 5.2%Return on equity (ROE) % 9.8% 10.0% 13.4%
• in December, sales stops in the second half of the month and in the last week of the month production also stops due to the planned annual refits.
Despite this we expect the operations in the second six months of 2016 to follow the trends of the first six months with the above mentioned specific issues and thus we expect a year of exceptional profitability.
Operations of the Impol Group
The first six months of 2016 of operations of the Impol Group were marked by the continuation of positive trends from 2015, which is visible in operating results.
10
six-monthly report
Unaudited Report on the operations of the Impol Group and Impol 2000, d.d., in the first six months of 2016
Impol Group Performance
Notes to the income statement of the Impol Group
In the first six months of 2016, the Impol Group generated net sales revenue of EUR 276.3 million, which is 6.9% less than in the first six months of 2015 despite a more than 5% increase in the quantitative sales. The reason lies in the fall of the quoted aluminium prices which serve as the basis for establishing the purchase and sales prices of aluminium. Thus the average quoted aluminium price in the first six months of 2016 amounted to EUR 1,383.90/t and in the first six months of 2015 it amounted to EUR 1,598.69/t. The revenues generated in the domestic market account for 6.3% in the structure of sales revenues, and compared to the previous six months they decreased by 1.5%. Revenues generated in foreign markets accounted for 93.7% of total revenues and in comparison with the first six months of 2015 they fell by 7.3%. Most of the revenues generated by the Impol Group in foreign markets are achieved in the markets of the European Union, which is presented later in the report.
• Operating expenses of the Impol Group amounting to EUR 246.6 million are by 11.8% lower than in the comparable period of 2015. The costs of goods, material and services, which account for 86.2% in the structure, fell by 14% compared to the first six months of 2015.
• The most important category of operating expenses is the cost of material which amounted to EUR 164.9 million in the first six months of 2016.
• Their proportion in total operating expenses equals 66.9%. The largest share of costs of material represents the costs of raw mate-rials, and the remaining costs are the costs of energy products, water, packaging and other materials.
• Costs of services which account for 8.2% of total operating expenses amounted to EUR 20.2 million in the first six months of 2016 and increased by 11.1% compared to the first six months of 2015.
• Labour costs amounting to EUR 24.6 million are by 10.9% higher than in the comparable six months of 2015.• Write-offs in the amount of EUR 8.5 million are 12% lower than in the first six months of 2015, mainly as a result of lower operat-
ing expenses from revaluation of current assets. Depreciation charge in the first six months of 2016 amounted to EUR 7.5 million, which is almost 1.3% more than in the first six months of 2015.
• Other operating expenses in the first six months of 2016 amounted to EUR 0.7 million, which is 103% more than in the first six months of 2015. The biggest proportion of other operating expenses is the cost associated with the environmental taxes (concession for water, land use fee, etc.).
• In the first six months of 2015, the Impol Group thus generated EUR 25.7 million of operating profit (EBIT) and EUR 33.2 million of cash flow from operations (EBITDA), whereas in the first six months of 2015 EBIT amounted to EUR 17.4 million and EBITDA amounted to EUR 24.8 million.
• In the first six months of 2016, the Impol Group generated EUR 3.4 million of loss from financing (in the same period of 2015 EUR -3.4 million).
• In the first six months, financial expenses which mainly included liabilities to banks and interest of issued bonds, amounted to EUR 4.3 million (first six months of 2015 EUR 4.6 million).
• In the first six months of 2016, the Impol Group generated net profit of EUR 19.3 million, which is 63% more than in the same period of 2015, when the net profit amounted to EUR 11.8 million.
Notes on the Statement of Financial Position of the Impol Group
On 30 June 2016, the assets of the Impol Group equalled EUR 370.4 million, which is 2.2% more than total assets of the Group at the end of 2015.
Non-current assets increased by EUR 7.5 million, which was primarily a result of more investment and of the acquisition of assets and liabilities of Impol ulaganja, d.o.o., which, in 2016, was included in consolidation for the first time.
Current assets on 30 June 2016 equalled EUR 228.9 million, which is comparable with the amount on the last day of 2015. The inven-tories have decreased by EUR 5 million and operating receivables have increased by EUR 34.9 million, which is a result of increased sales and receivables due from other companies, in particular the VAT refund claims.
As at 30 June 2016, total liabilities of the Impol Group equalled EUR 370.4 million and have increased in the first six months of 2016 by EUR 7.9 million if compared to the amount on 31 December 2015 and by EUR 19 million if compared to the amount on 30 June 2015. The Group decreased its current liabilities by EUR 11.7 million and maintained its non-current liabilities at the level of 2015. Compared to 30 June 2015, it increased the amount of non-current loans by EUR 12.6 million and decreased the amount of current loans by EUR 16.5 million.
ANALYSIS OF THE PERFORMANCE OF THE IMPOL GROUP AND IMPOL 2000, D.D.
11
six-monthly report
Unaudited Report on the operations of the Impol Group and Impol 2000, d.d., in the first six months of 2016
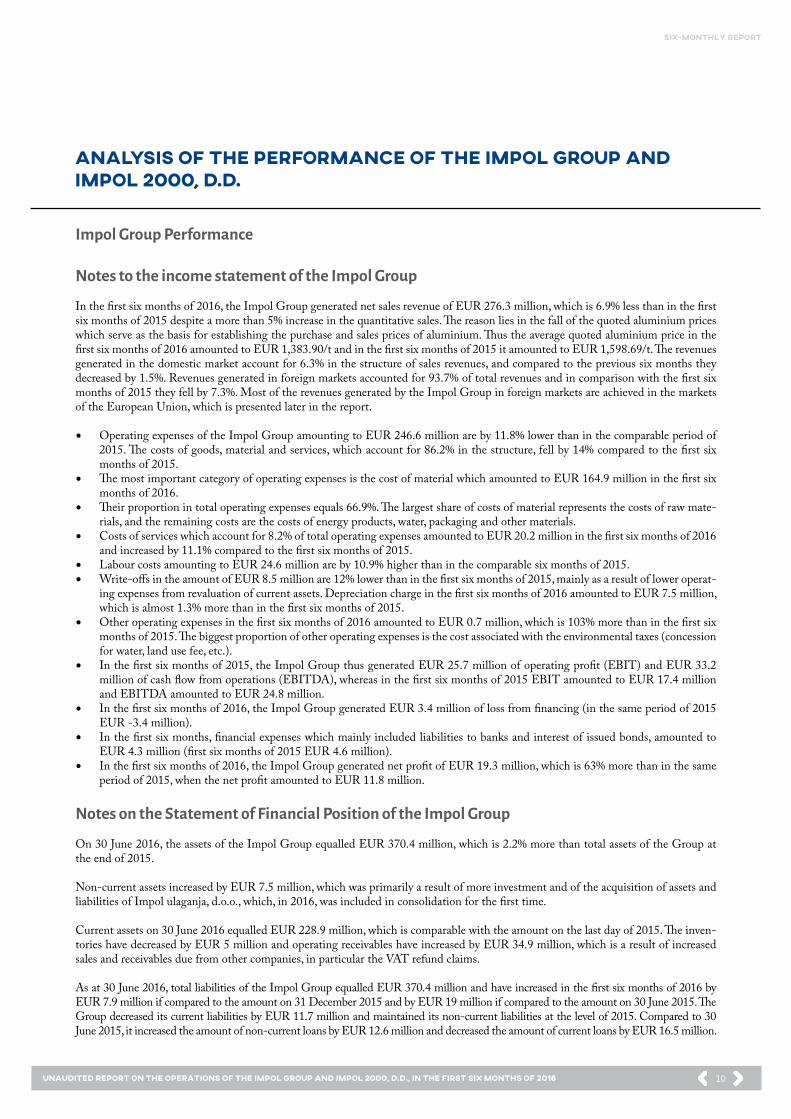
As at 30 June 2016, net debt of the Impol Group, calculated as a difference between total financial liabilities and cash and cash equiva-lents and short-term financial investments, amounted to EUR 117.1 million, which is EUR 0.9 million less than on the last day of 2015.
Total capital of the Impol Group increased in the first six months of 2016 by EUR 17.3 million and compared to 30 June 2015 it in-creased by EUR 26.3 million.
Performance of Impol 2000, d.d.
Notes to the income statement of Impol 2000, d.d.
In the first six months of 2016, Impol 2000, d.d., (hereinafter: the Company) generated net sales revenues of EUR 9.8 million from the sales of products, services and merchandise, which is 20.5% more than in the same period of 2015. In the domestic market, the Com-pany generated net revenues arising from the sales of products, services and merchandise of EUR 8 million, which is 14.5% more than in the first six months of 2015. In foreign markets, it generated net revenues arising from the same areas equalling to EUR 1.8 million, which is 56.8% more than in the first six months of 2015. In the first six months of 2016, operating expenses of the Company increased by 24.8% compared to the same period of 2015 and stood at EUR 8.6 million. Costs of goods and material sold account for 69.6% of total operating expenses and are followed by labour costs equalling 19.6%, and costs of services with 8.6%.
In the first six months of 2016, the Company generated EUR 1.19 million of operating profit which is comparable to the same period of 2015.
Operating cash flow (EBITDA) in the amount of EUR 1.2 million was positive. In 2015, the Company generated EUR 0.08 million of profit from financial revenues. In the same period, financial expenses amounted to EUR 0.97 million and they are EUR 0.6 million higher compared to the first six months of 2015 as a result of financial expenses from financial liabilities arising from bonds. In the first six months of 2016, the Company generated net profit after tax of EUR 0.25 million, while in the first six months of 2015, it amounted to EUR 0.7 million.
Notes to the income statement of Impol 2000, d.d.
On 30 June 2016, the assets of the Company equalled EUR 109.7 million, which is 1.9% more than at the end of 2015. In the first six months of 2016, non-current assets increased by 2.1% compared to the end of 2015. The increase in assets was a result of the increase of participating interests in Group companies.
As at 30 June 2016, total liabilities of the Company stood at EUR 109.7 million and were EUR 2 million higher than the liabilities of the previous year.
The capital of the Company in the amount of EUR 55.3 million was 0.5% or EUR 0.25 million higher than in 2015.
As at 30 June 2016, net debt, calculated as a difference between total financial liabilities and cash and cash equivalents and short-term financial investments, amounted to EUR 14.1 million, which is EUR 0.36 million less than on the last day of 2015.
30 June 2014
non-current loans current loans other liabilities equity
30 June 2015 30 June 2016
50.0
100.0
0
150.0
200.0
250.0
300.0
350.0
400.0
97.7 103.8 116.4
47.5
61.8
144.9
64.0
65.0
118.6
66.8
59.1
105.8
Chart 4: Structure of liabilities in million EUR

12
six-monthly report
Unaudited Report on the operations of the Impol Group and Impol 2000, d.d., in the first six months of 2016
Sales
Trends of external business environment
• Because of low aluminium prices and numerous competitive advantages of the metal over its substitutes, the demand for alumini-um products has been increasing in the first six months of 2016 and it can be sensed in all the industrial markets.
• Political environment of the European Union is becoming less stable and the financial public was also shocked by the announced exit of Great Britain from the
• European Union. For now, the latter has not affected the business events in aluminium industry to a greater extent.• The producers of aluminium foils have united in their fight against dumping prices of Chinese competitors. Furthermore, the
European market has witnessed a decline in the interest in the Far East producers’ products.• An unstable political environment in Turkey draws attention of the European producers of aluminium products because Turkey is
one of the important exporters of standard aluminium products. A crisis of confidence in the Turkish market could consequently mean new business opportunities for their competition.
• In the first six months of 2016, the USD gained in strength compared to the EUR, which means an improvement of opportunities for exporting products to the markets of
• Northern America.• Automotive industry has been continuing to increase its share of aluminium in vehicles and consequently, in order to maintain
high quality and stability, their representatives orient themselves towards concluding non-current strategic contracts.
Trends of operations of the Impol Group in sales
In the first six months of 2016, the demand for Impol’s products has grown which enabled an increase in the volume of sales for 6% and at the same time the sales prices have been maintained and the purchase prices of the raw materials have reached higher sales margins.
1 H 2013 1 H 2014 1 H 20161 H 2015
80,000
85,000
75,000
90,000
95,000
100,000
105,000
Table 5: Sales in tonnes for periods of six months
Chart 5: Sales in tonnes
1st six months in 2013 1st six months in 2014 1st six months in 2015 1st six months in 2016
Quantity of sales in tonnes 87,950 97,132 99,280 104,845
The chart shows a growth in the sales of products by individual periods of six months and indicates that the sales has been increasing on a yearly basis and that the Impol Group has been spreading its market. Namely, the trend in net sales revenue does not indicate any growth caused by the above mentioned development in the quoted price of aluminium.
Dispersion of sales
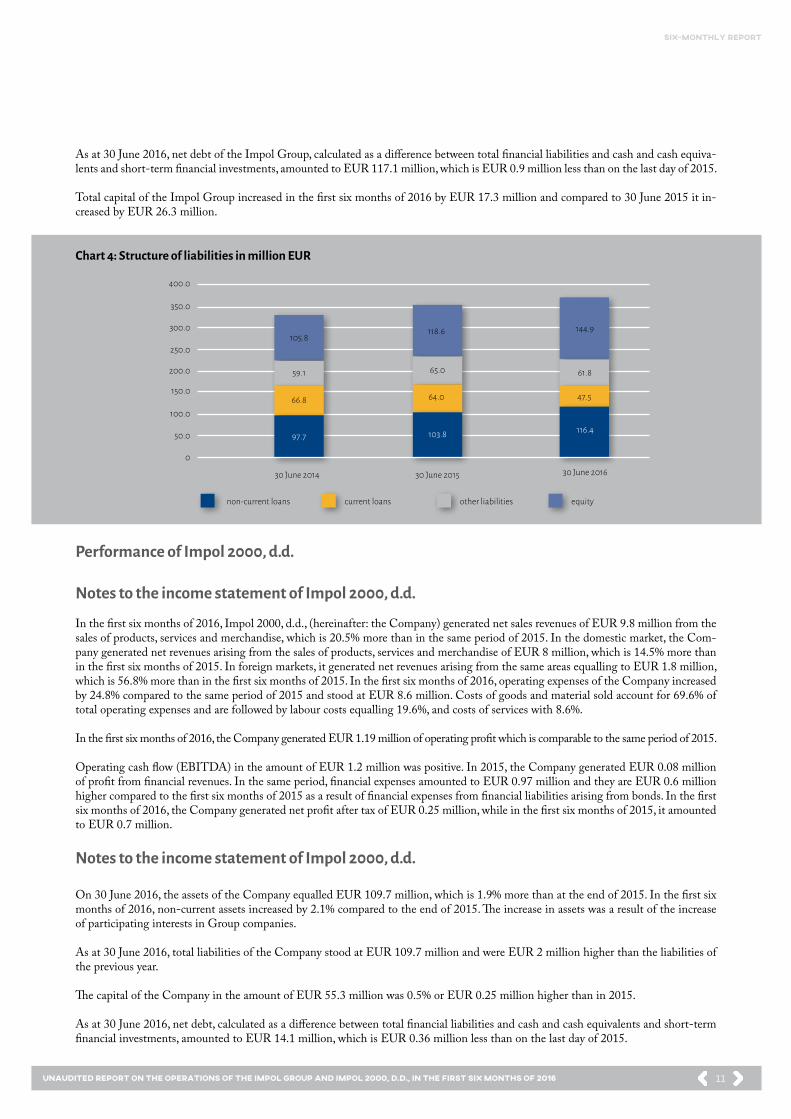
Impol’s strategic advantage is the dispersion of sales across markets, industries and customers. Such sales policy has continued in 2016. In the first six months of the year, we exported 94.7% of our products. Europe remains to be the most important market, where the larg-
13
six-monthly report
Unaudited Report on the operations of the Impol Group and Impol 2000, d.d., in the first six months of 2016
Chart 6: Sales of products by region
82.51% EU
7.31% Europe – other
5.28 % Slovenia
3.93 % North America
0.33 % Africa
0.37 % South America
0.22 % Asia
0.04 % Australia
Chart 7: Sales of products by country
Chart 8: Share of sales by industry
Germany Italy
Slovenia France
Czech Republic The Netherlands
Austria Spain
USAPoland Russia
HungarySerbia
Switzerland Croatia
36.97%15.24%
5.28%5.04%4.51%
4.05%3.61%3.42%3.35%
2.49%2.35%2.24%2.08%1.21%1.15%
Customers buy more than a half of the Impol’s products and the remaining part (45%) is bought by traders who sell them further via their intermediaries. The largest share among end-consumers belongs to transport (23%), followed by construction (12%) and food industry (8%).
Machines and equipment
0.61%Other
1.16%Electrical industry
2.53%Pharmaceutical industry
2.39%
Food industry
8.18%Consumer goods
5.97%Construction business,
constructions
11.94%
Transport
22.65%Retail/distributers
44.57%
est share of our products is exported to Germany (37%), followed by Italy (15%) and France (5%), whereas the shares of export to other countries do not exceed 5%. In the first six months of 2016, we exported the Impol products to 49 different courtiers around the world.
14
six-monthly report
Unaudited Report on the operations of the Impol Group and Impol 2000, d.d., in the first six months of 2016
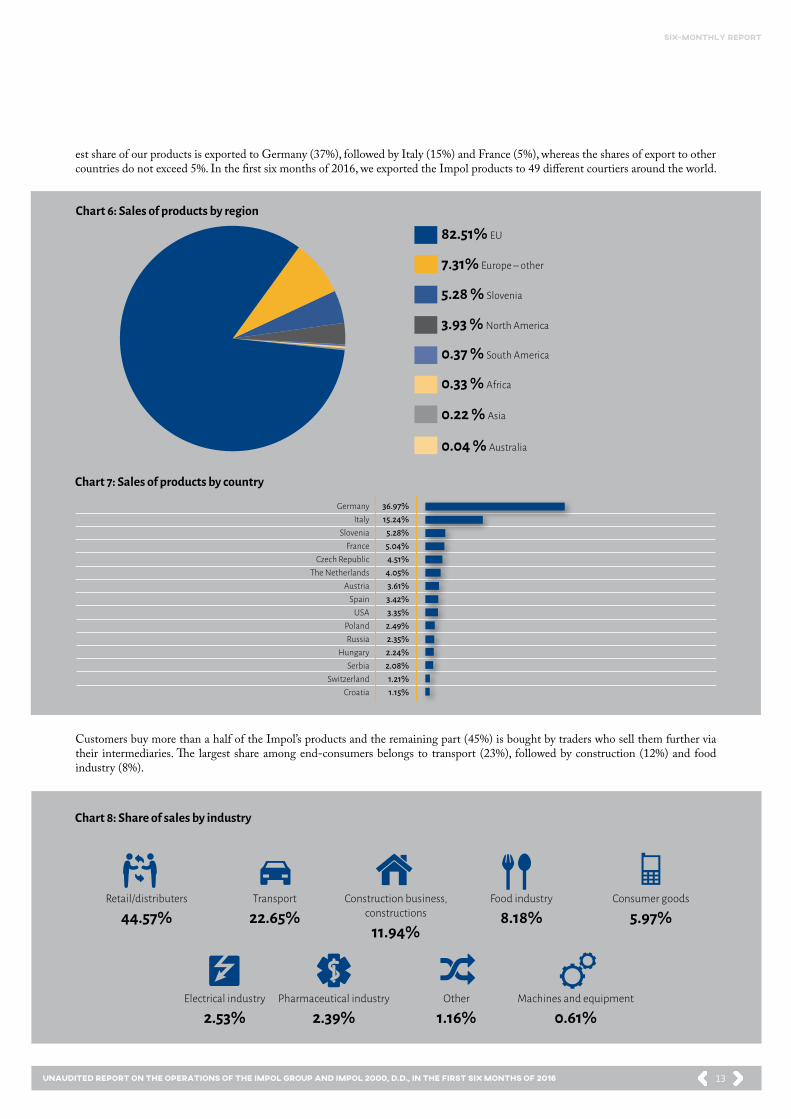
Sales of products by programmes
The Impol sales program consists of two market segments – rolling and extrusion. Positive trend of demand growth characterised both segments.
Chart 9: Sales by types of products
17.13%
31.46%
4.73%
8.46%
8.78%
2.29%
26.82%
0.34%
Foils and thin coils
Coils and sheets
Painted coils
Circles, slugs, etc.
Profiles and sections
Tubes and pipes
Bars and rods
Forged products
Key characteristics of rolled product sales:
• The increase in production capacity with the launch of production in Croatia has also been successfully followed by sales. We have managed to increase the volume of sales to the existing customers and we have also revived business relationships with former buyers of the Croatian company in bankruptcy.
• The market share has increased in all segments of rolled products, including the segment of foils and thin strips which represent products with a higher added value.
• The activities in the field of sales process integration within the Impol Group have continued.
Key characteristics of extruded product sales:
• In the first six months of 2016, the demand for extruded products has been encouraging.• All the extrusion programmes earned profit and their operations have been better than in the previous year.• The trend of increasing the market share in automotive industry has continued and the Group established long-term cooperation
with the customers.• Under the project of restructuring the Profile Unit, the Group has managed to get new buyers for demanding shapes of profiles
with which the share of standard products decreased and the profitability of the sales programme has improved.• New products have been successfully launched to the market: “crash” profiles and profiles and tubes for finalisation.
Purchasing
Trends in the segment of purchasing
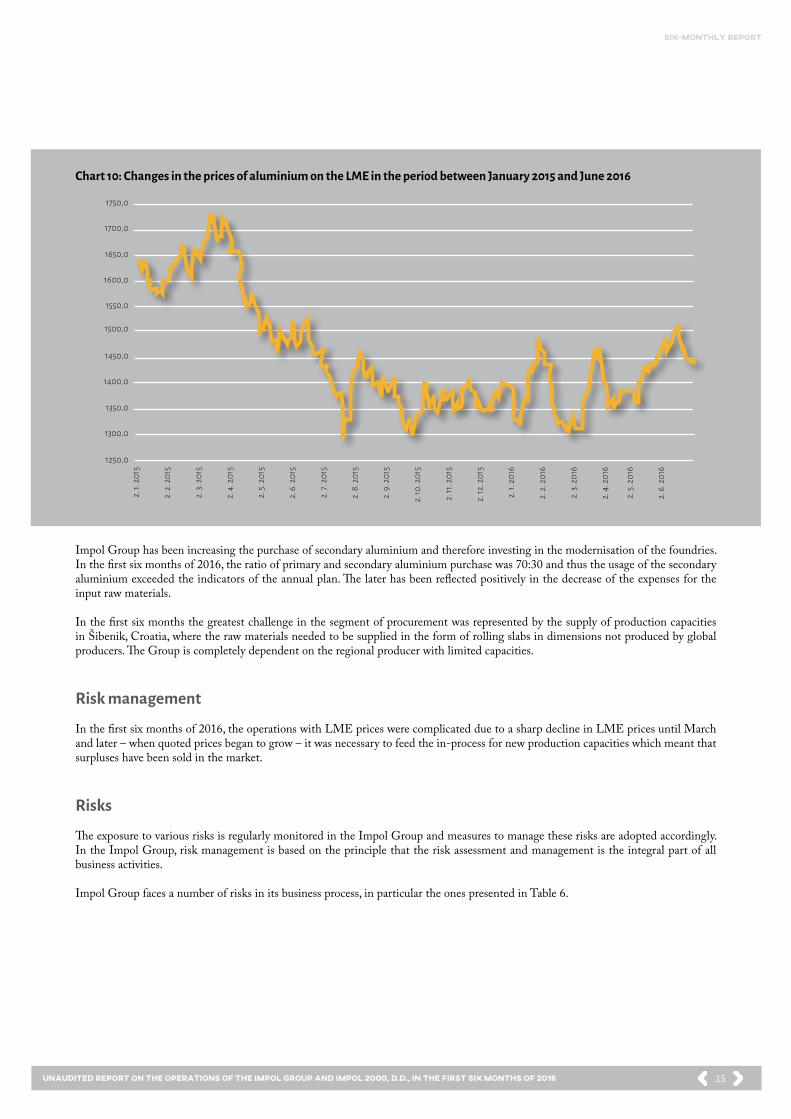
In the first two months of 2016, the quoted prices of aluminium sharply declined and then high volatility followed without a distinct trend. In the period between April and June, the quoted prices were growing. The whole period was also characterised by a slight decline in the MB prices on the market. Since we concluded flexible purchase price formulas at the end of 2015, this trend reflected in lower costs for raw materials and this influenced the growth of sales margins and thus an increased profitability.
15
six-monthly report
Unaudited Report on the operations of the Impol Group and Impol 2000, d.d., in the first six months of 2016
Chart 10: Changes in the prices of aluminium on the LME in the period between January 2015 and June 2016
2. 1.
201
5
2. 3.
201
5
2. 5.
201
5
2. 7.
201
5
2. 9
. 201
5
2. 11
. 201
5
2. 1.
201
6
2. 3.
201
6
2. 5.
201
6
2. 2
. 201
5
2. 4
. 201
5
2. 6
. 201
5
2. 8
. 201
5
2. 10
. 201
5
2. 12
. 201
5
2. 2
. 201
6
2. 4
. 201
6
2. 6
. 201
6
1350,0
1300,0
1400,0
1250,0
1450,0
1500,0
1550,0
1600,0
1650,0
1700,0
1750,0
Impol Group has been increasing the purchase of secondary aluminium and therefore investing in the modernisation of the foundries. In the first six months of 2016, the ratio of primary and secondary aluminium purchase was 70:30 and thus the usage of the secondary aluminium exceeded the indicators of the annual plan. The later has been reflected positively in the decrease of the expenses for the input raw materials.
In the first six months the greatest challenge in the segment of procurement was represented by the supply of production capacities in Šibenik, Croatia, where the raw materials needed to be supplied in the form of rolling slabs in dimensions not produced by global producers. The Group is completely dependent on the regional producer with limited capacities.
Risk management
In the first six months of 2016, the operations with LME prices were complicated due to a sharp decline in LME prices until March and later – when quoted prices began to grow – it was necessary to feed the in-process for new production capacities which meant that surpluses have been sold in the market.
Risks
The exposure to various risks is regularly monitored in the Impol Group and measures to manage these risks are adopted accordingly. In the Impol Group, risk management is based on the principle that the risk assessment and management is the integral part of all business activities.
Impol Group faces a number of risks in its business process, in particular the ones presented in Table 6.

16
six-monthly report
Unaudited Report on the operations of the Impol Group and Impol 2000, d.d., in the first six months of 2016
Table 6: Risk types and their management through the application of special measures
Business risks Risk description Management method employed Exposure
Market and price risks
Sales:• Market prices do not keep in step with changes in
purchase prices or they only adjust to the latter with a lag of several months.
• Customer service – delays resulting from production stoppages, inadequately organised logistics cause excessive costs and delays.
Purchasing:• Aluminium – unexpected events in the areas of prices
and purchase premiums, exchange rate risk (negative exchange rate differences), unreliable supply sources and associated negative effects on production, liquidity gaps caused by the need to purchase large quantities all at once.
• Energy products – unexpected increase in prices,
• Conclusion of contracts by determining sales premiums so that the changes in purchase premiums are translated in the sales premiums.
• Continuous training for quality and full compliance with all the obligations.
• Conclusion of contracts for longer, at least one year delivery periods.
• Integration of suppliers as financiers.• Majority of energy is purchased for a period of at least two
years in advance.
Moderate
Investment risks
• Increase in fixed costs and the resulting need to increase the volume of sales coupled with the threat of an increase in losses.
• Being late in mastering the technical-technological aspects of new investments, new markets; neglecting the costs resulting from the above.
• Cash flow being too weak to ensure the return of invested assets.
• Neglect of investments into durable current assets and their subsequent financing with short-term sources of financing despite the investment definitely being a long-term one.
• When planning the required added value per employee, Impol starts from the finding that the said value must, in addition to meeting the requirements arising from current operations and the dividend-related expectations of the shareholders, also meet the need of investing no less than EUR 10 thousand per year in order to preserve the existing po-sition of employment and that at least a total of EUR 1 million must be earmarked for all types of investments for each new position of employment taking into account the expected growth in the number of new positions of employment.
Moderate
Human resources
• Lack of mobility and the associated costs that are higher than would be justified.
• Inadequate assurance of knowledge retention.• Risk associated with the acquisition of key personnel.
• By introducing new IT applications, the company ensures the capture of a broader scope of employee knowledge and important data that are thus made available to a broader circle of employees, working with the key personnel, intro-duction of the governance standards, permanent education and training.
Moderate
Research and development
• Efficiency of development processes and provision of new products.
• Introduction of a comprehensive system of applicative and technological development, integration as a development supplier to customers.
Moderate
Environmental protection • Discharges of hazardous substances. • • Constant monitoring of emissions, integration of
devices to prevent or reduce risks. Moderate
Financial risks Risk description Management method employed Exposure
Liquidity risk
• Lack of liquid assets required to settle operating and financing liabilities.
• Liquidity risk is a risk of incurring loss owing to short-term insolvency.
• Pre-agreed credit lines and drawing up of outflow and inflow plans. Minor
Risk of a change in the prices of aluminium raw materials
• Aluminium is a commodity and its prices change con-tinuously. Customers seek to purchase products based on the pre-arranged price basis for aluminium.
• Hedging – forwards and futures contracts. Moderate
Foreign exchange risk • The threat of loss on account of unfavourable exchange rate fluctuations – this applies to USD in particular.
• Hedging by means of appropriate derivative financial instru-ments and the option of purchasing basic raw materials in the local currency.
Moderate
Interest Rate Risk • Risk associated with changes in the terms and condi-tions for financing and borrowing.
• Monitoring of the ECB’s and FED’s policies, hedging using ap-propriate derivative financial instruments interest rate swaps, shifting from a fixed to a floating interest rate.
Moderate
Credit risk • Risk of customer failure to settle their liabilities.
• Securing trade receivables - primarily receivables from foreign debtors through Prva kreditna zavarovalnica and foreign insurance firms, monitoring of customer credit ratings, limiting maximum exposure to individual customers. Transactions with customers located in high-risk markets are only performed on the basis of advance payments or prime bank guarantees.
Moderate to high
Claims for damages and lawsuit risk
• Risk of claims for damages being filed by third parties as a result of loss events caused inadvertently by the company through its activities, possession of items and placement of products on the market.
• General liability and product liability insurance (mainly for the segment of the manufacture of products intended for the means of transport industry).
Low to moderate
Damage to property risk • The threat of damage to property resulting from de-structive natural forces; machinery break-down, fire, etc.
• Conclusion of non-life insurance, machinery breakdown insurance, business interruption insurance, fire insurance and other specific insurance types.
Moderate
17
six-monthly report
Unaudited Report on the operations of the Impol Group and Impol 2000, d.d., in the first six months of 2016
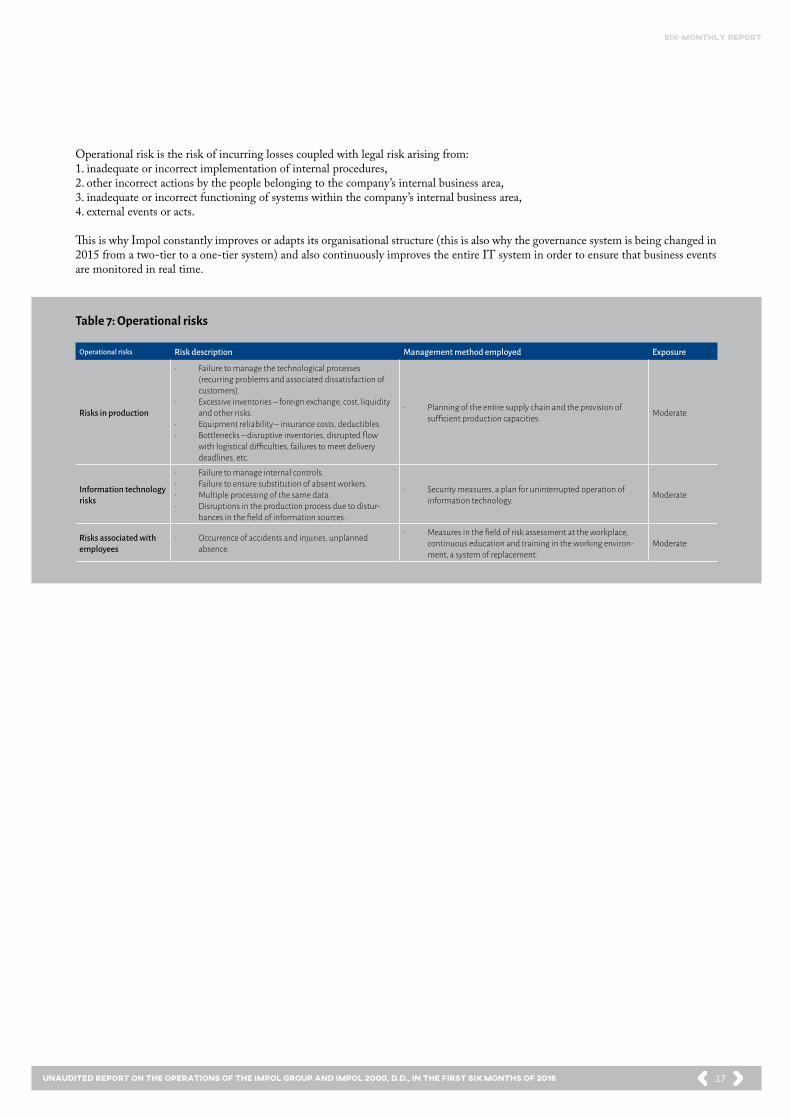
Operational risk is the risk of incurring losses coupled with legal risk arising from:1. inadequate or incorrect implementation of internal procedures,2. other incorrect actions by the people belonging to the company’s internal business area,3. inadequate or incorrect functioning of systems within the company’s internal business area,4. external events or acts.
This is why Impol constantly improves or adapts its organisational structure (this is also why the governance system is being changed in 2015 from a two-tier to a one-tier system) and also continuously improves the entire IT system in order to ensure that business events are monitored in real time.
Operational risks Risk description Management method employed Exposure
Risks in production
• Failure to manage the technological processes (recurring problems and associated dissatisfaction of customers).
• Excessive inventories – foreign exchange, cost, liquidity and other risks.
• Equipment reliability – insurance costs, deductibles.• Bottlenecks – disruptive inventories, disrupted flow
with logistical difficulties, failures to meet delivery deadlines, etc.
• Planning of the entire supply chain and the provision of sufficient production capacities. Moderate
Information technology risks
• Failure to manage internal controls.• Failure to ensure substitution of absent workers.• Multiple processing of the same data.• Disruptions in the production process due to distur-
bances in the field of information sources.
• Security measures, a plan for uninterrupted operation of information technology. Moderate
Risks associated with employees
• Occurrence of accidents and injuries, unplanned absence.
• Measures in the field of risk assessment at the workplace, continuous education and training in the working environ-ment, a system of replacement.
Moderate
Table 7: Operational risks
18
six-monthly report
Unaudited Report on the operations of the Impol Group and Impol 2000, d.d., in the first six months of 2016
Executive Directors’ liability declaration The Executive Directors are responsible for drawing up a six-monthly report of the Impol Group, so that it gives a true and fair view of the financial situation of the Impol Group and Impol 2000, d.d., and we hereby state the following:• we are responsible for taking appropriate measures to safeguard the property, to continuously monitor other operating risks and to
adopt measures intended to minimise them;• the financial report of the Impol Group and Impol 2000, d.d., for the first six months of 2016 has been prepared in accordance with
the international accounting standards and that the presentation of assets and liabilities, financial position, income statement and comprehensive income of Impol 2000, d.d., and other companies, included in consolidation, is true and fair as a whole;
• business report of the Impol Group and Impol 2000, d.d., for the first six months of 2016 includes a fair presentation of the devel-opment and business results of the company and its financial position, including the description of the fundamental types of risks, to which Impol 2000, d.d., and other companies, included in consolidation, are exposed to as a whole;
• report of the Impol Group and Impol 2000, d.d., for the first six months of 2016 includes a fair presentation of important opera-tions with related persons and it is prepared in accordance with international accounting standards.
Slovenska Bistrica, 19 September 2016
The Management Board hereby confirms the Financial Statements for Impol 2000, d.d., for the period between 1 January 2016 to 30 June 2016 and the accounting policies used. This Six-Monthly Report was adopted by the Management Board of the company at its session held on 19 September 2016.
Slovenska Bistrica, 19 September 2016
Jernej Čokl(President of the
Management Board)
Janko Žerjav(Member of the
Management Board)
Vladimir Leskovar(Vice President of the Management Board)
Milan Cerar(Member of the
Management Board)
Bojan Gril(Member of the
Management Board)
Irena Šela(Executive Director
of Finance)
Edvard Slaček(Chief Executive Officer)

19
six-monthly report
Unaudited Report on the operations of the Impol Group and Impol 2000, d.d., in the first six months of 2016
FINANCIALREPORT FOR THE IMPOL
GROUP FOR THE FIRST SIX MONTHS OF 2016
FIRST SIX MONTHS
IN NUMBERS

20
six-monthly report
Unaudited Report on the operations of the Impol Group and Impol 2000, d.d., in the first six months of 2016
Accounting policies and notes form an integral part of the financial statements presented below and should be read in connection to them. Group Income Statement
CONSOLIDATED FINANCIAL STATEMENTS OF THE IMPOL
Table 8: Group income statement in EUR
Item Note Jan–Jun 2016 Jan–Jun 2015
1. Net revenue from sales 1 276,322,561 296,886,999
a) Net revenue from sales in the domestic market 17,350,544 17,614,134
b) Net revenue from sales in the foreign market 258,972,017 279,272,865
2. Change in the value of product inventories and unfinished production -8,665,236 -1,482,605
3. Capitalised own products and services 381,695 385
4. Other operating revenue (including operating revenue from revaluation) 4,207,741 1,779,742
5. Costs of goods, materials and services 2 212,723,854 247,298,098
a) Cost of sold goods and materials and costs of materials used 192,526,251 229,147,325
b) Costs of services 20,197,603 18,150,773
6. Labour costs 2 24,596,062 22,187,527
a) Costs of salaries 17,885,675 15,806,691
b) Social security costs (pension insurance costs are shown separately) 4,120,328 3,631,525
c) Other labour costs 2,590,059 2,749,311
7. Writedowns 2 8,511,621 9,676,567
a) Depreciation 7,480,689 7,384,462
b) Operating expenses from revaluation of intangible assets and tangible fixed assets 955,964 150
c) Operating expenses from revaluation associated with current operating assets 74,968 2,291,955
8. Other operating expenses 2 729,572 358,102
9. Financial revenue from participating interests 3 90,575 4,811
a) Financial revenue from participating interests in other companies 90,575 4,811
10. Financial revenue from loans granted 3 13,907 4,216
a) Financial revenue from loans to others 13,907 4,216
11. Financial revenue from operating receivables 3 858,720 1,178,158
a) Financial revenue from operating receivables due from others 858,720 1,178,158
12. Financial expenses from financial liabilities 3 3,375,647 3,687,384
a) Financial expenses from loans from banks 2,377,578 2,679,440
b) Financial expenses from bonds issued 944,809
c) Financial expenses incurred in connection with other financial liabilities 53,260 1,007,944
13. Financial expenses from operating liabilities 3 998,584 887,205
a) Financial expenses from trade payables and bills of exchange payable 227,296 4,625
b) Financial expenses from other operating liabilities 771,288 882,580
14. Income tax 2,733,856 2,299,843
15. Deferred taxes 191,525 122,084
16. Net profit or loss for the accounting period 19,349,242 11,854,896
a) Of which equity profit/loss that belongs to minority shares 1,783,108 876,100
b) Profit/loss that belongs to owners of the parent company 17,566,134 10,978,796
Result of continuing operations 19,349,242 11,854,896
Result of discontinued operations

21
six-monthly report
Unaudited Report on the operations of the Impol Group and Impol 2000, d.d., in the first six months of 2016
Table 9: Group statement of comprehensive income in EUR
Note Jan–Jun 2016 Jan–Jun 2015
Net profit or loss for the accounting period 19,349,242 11,854,896
Changes in surplus from revaluation of intangible and tangible fixed assets (+ / -)
Changes in the surplus from revaluation of financial assets available for sale (+/-) 13 -218,211
Gains and losses resulting from the conversion of Financial Statements of foreign compa-nies (effects of changes to the exchange rate) (+/-) 13 -558,763 273,470
Actuarial gains and losses of defined benefit plans (employee benefits) (+/-)
Other items of comprehensive income (+/-)
Total comprehensive income for the accounting period 18,572,268 12,128,366
• Of which total comprehensive income of minority equity 1,635,822 849,589
• Of which total comprehensive income attributable to owners of the parent company 16,936,446 11,278,777
Table 10: Balance sheet of the Group in EUR
Note 30 June 2016 31 December 2015
A. Fixed assets 140,512,311 133,040,860
I. Intangible assets and non-current deferred costs and accrued revenue 5 2,159,949 1,786,630
1. Non-current property rights 1,840,720 1,467,401
2. Goodwill 319,229 319,229
II. Tangible fixed assets 6 132,236,118 125,043,592
1. Land and buildings 42,890,490 36,795,864
a) Land 4,765,547 3,740,137
b) Buildings 38,124,943 33,055,727
2. Production equipment and machinery 68,678,621 72,068,086
3. Other machinery and equipment 3,570,623 3,599,838
4. Fixed assets being acquired 17,096,384 12,579,804
a) Tangible fixed assets under construction and manufacture 13,312,974 11,502,974
b) Advances to acquire tangible fixed assets 3,783,410 1,076,830
III. Investment property 7 3,601,134 3,696,605
IV. Non-current investments 8 1,555,471 1,554,417
1. Non-current investments, excluding loans 1,163,024 1,169,046
a) Shares and participating interests in associate companies 656,620 656,633
b) Other shares and participating interests 506,404 512,413
2. Non-current loans 392,447 385,371
a) Non-current loans to others 392,447 385,371
V. Non-current operating receivables 1,250 1,250
1. Non-current operating receivables due from others 1,250 1,250
VI. Deferred tax receivables 958,389 958,366
B. Current assets 228,979,771 229,328,199 I. Inventories 9 92,810,783 97,858,243
1. Material 74,593,623 72,182,684
2. Work in process 9,274,027 9,830,248
3. Products and merchandise 6,306,925 14,521,829
4. Advances for inventories 2,636,208 1,323,482
II. Current financial investments 10 5,153,990 6,179,902
1. Current financial investments, excluding loans 28,108 0
a) Other current investments 28,108 0
2. Current loans 5,125,882 6,179,902
a) Current loans to others 5,125,882 6,179,902
III. Current operating receivables 11 89,413,835 54,452,700
1. Current operating receivables due from customers 64,018,203 47,453,396
2. Current operating receivables due from others 25,395,632 6,999,304
IV. Cash and cash equivalents 12 41,601,163 70,837,354
C. Current deferred costs and accrued revenue 950,727 109,974 TOTAL ASSETS 370,442,809 362,479,033

22
six-monthly report
Unaudited Report on the operations of the Impol Group and Impol 2000, d.d., in the first six months of 2016
Note 30 June 2016 31 December 2015
A. Equity 13 144,852,127 127,562,535 Minority shareholders’ equity 13,330,061 11,742,184
I. Called-up capital 4,451,540 4,451,540
1. Share capital 4,451,540 4,451,540
II. Capital reserves 10,751,254 10,751,254
III. Reserves from profit 6,906,327 6,906,327
1. Reserves for treasury shares and own participating interests 506,406 506,406
2. Treasury shares and own participating interests (as deductions) -506,406 -506,406
3. Statutory reserves 1,173,746 1,173,746
4. Other reserves from profit 5,732,581 5,732,581
IV. Revaluation surplus -382,158 -169,318
V. Revaluation adjustment of capital -1,087,069 -670,221
VI. Net profit brought forward 93,316,038 74,934,946
VII. Net profit/loss for the financial year 17,566,134 19,615,823
B. Provisions and non-current accrued costs and deferred revenue 14 2,393,712 2,414,420 1. Provisions for pensions and similar liabilities 1,748,226 1,752,717
2. Other provisions 1,251 1,251
3. Non-current accrued costs and deferred revenue 644,235 660,452
C. Non-current liabilities 15 118,079,000 117,899,807 I. Non-current financial liabilities 116,353,179 116,274,737
1. Non-current financial liabilities to banks 75,584,007 75,616,919
2. Non-current financial liabilities from bonds payable 40,000,000 40,000,000
3. Other non-current financial liabilities 769,172 657,818
II. Non-current operating liabilities 224,570 294,767
1. Other non-current operating liabilities 224,570 294,767
III. Deferred tax liabilities 1,501,251 1,330,303
Č. Current liabilities 16 101,942,649 113,687,948 I. Current financial liabilities 47,480,472 78,704,151
1. Current financial liabilities to banks 36,705,416 63,074,607
2. Current financial liabilities from bonds payable 10,000,000 10,000,000
3. Other current financial liabilities 775,056 5,629,544
II. Current operating liabilities 54,462,177 34,983,797
1. Current trade payables 41,265,975 26,711,391
2. Current operating liabilities from advance payments 562,489 1,834,256
3. Other current operating liabilities 12,633,713 6,438,150
D. Current accrued costs and deferred revenue 16 3,175,321 914,323 TOTAL LIABILITIES 370,442,809 362,479,033

23
six-monthly report
Unaudited Report on the operations of the Impol Group and Impol 2000, d.d., in the first six months of 2016
Tabl
e 11:
Grou
p st
atem
ent o
f cha
nges
in eq
uity
for t
he fi
rst s
ix m
onth
s of 2
016 i
n EU
R
Ca
lled-
up
capi
tal
Min
ority
sh
areh
olde
rs’
equi
ty
Capi
tal
rese
rves
Surp
lus f
rom
re
valu
atio
n
Reva
luat
ion
adju
stm
ent o
f ca
pita
l
Net
pro
fit
brou
ght
forw
ard
Net
pro
fit/
loss
for t
he
finan
cial
year
Tota
lEQ
UIT
Y
III
IIIIV
VVI
VII
VIII
IX
Shar
e cap
ital
Rese
rves
for
treas
ury s
hare
s an
d ow
n pa
rtic
ipat
ing
inte
rest
s
Trea
sury
shar
es
and
own
part
icip
atin
g in
tere
sts (
as
dedu
ctio
ns)
Stat
utor
y re
serv
esO
ther
rese
rves
fro
m p
rofit
Net
pro
fit
brou
ght f
orw
ar
Net
pro
fit o
f th
e fina
ncia
l ye
ar
TOTA
L EQ
UIT
Y
I/1II
IIIIV
/1IV
/2IV
/3IV
/4V
IVVI
I/1VI
II/1
IX
A.1
Bala
nce a
t the
end
of th
e pre
viou
s re
port
ing
perio
d on
31 D
ec 20
154,
451,5
4011
,742
,184
10,7
51,2
5450
6,40
6-5
06,4
061,1
73,7
465,
732,
581
-169
,318
-670
,221
74,9
34,9
4619
,615
,823
127,
562,
535
a)Re
troac
tive c
alcu
latio
ns0
b)Re
troac
tive a
djus
tmen
ts0
A.2
Open
ing
bala
nce o
f the
repo
rtin
g pe
riod
on 1
Jan
2016
4,45
1,540
11,7
42,18
410
,751
,254
506,
406
-506
,406
1,173
,746
5,73
2,58
1-1
69,3
18-6
70,2
2174
,934
,946
19,6
15,8
2312
7,56
2,53
5
B.1
Chan
ges i
n eq
uity
– tr
ansa
ctio
ns
with
owne
rs-4
7,94
5-1
,234
,731
-1,2
82,6
76
Acqu
isitio
n of
non
-con
trolli
ng sh
are
at Im
pol-T
LM, d
.o.o.
34,7
31-1
,234
,731
-1,2
00,0
00
D
isbur
sem
ent o
f div
iden
ds-8
2,67
6-8
2,67
6
B.2
Tota
l com
preh
ensiv
e inc
ome i
n th
e re
port
ing
perio
d1,6
35,8
22-2
12,8
40-4
16,8
4817
,566
,134
18,5
72,2
68
En
try o
f net
pro
fit/lo
ss in
the
finan
cial
year
1,783
,108
17,5
66,13
419
,349
,242
Ch
ange
s in
the s
urpl
us fr
om re
valu
a-tio
n of
fina
ncia
l inv
estm
ents
-5,3
71-2
12,8
40-2
18,2
11
O
ther
item
s of t
he to
tal c
ompr
ehen
-siv
e inc
ome i
n th
e rep
ortin
g pe
riod
-141
,915
-416
,848
-558
,763
B.3
Chan
ges i
n eq
uity
19,6
15,8
23-1
9,61
5,82
30
Re
allo
catio
n of
a p
art o
f the
net
pro
f-it
from
the c
ompa
rativ
e rep
ortin
g pe
riod
to o
ther
equ
ity it
ems
19,6
15,8
23-1
9,61
5,82
30
C.Cl
osin
g ba
lanc
e of t
he re
port
ing
perio
d on
31 D
ecem
ber 2
015
4,45
1,540
13,3
30,0
6110
,751
,254
506,
406
-506
,406
1,173
,746
5,73
2,58
1-3
82,15
8-1
,087
,069
93,3
16,0
3817
,566
,134
144,
852,
127

24
six-monthly report
Unaudited Report on the operations of the Impol Group and Impol 2000, d.d., in the first six months of 2016
Tabl
e 12:
Gro
up S
tate
men
t of C
hang
es in
Equi
ty in
2015
in E
UR
Ca
lled-
up ca
pita
lM
inor
ity
shar
ehol
ders
’ eq
uity
Capi
tal
rese
rves
Surp
lus
from
reva
lu-
atio
n
Reva
lua-
tion
ad-
just
men
t of
capi
tal
Net
pro
fit
brou
ght
forw
ard
Net
pro
fit/
loss
for t
he
finan
cial
ye
ar
Tota
lEQ
UIT
Y
III
IIIIV
VIV
VII
VIII
IX
Shar
e cap
ital
Unca
lled-
up
capi
tal (
as
dedu
ctio
n)
Rese
rves
for
treas
ury s
hare
s an
d ow
n pa
rtic
ipat
ing
inte
rest
s
Trea
sury
shar
es
and
own
part
icip
atin
g in
tere
sts (
as
dedu
ctio
ns)
Stat
utor
y re
serv
es
Oth
er
rese
rves
fro
m p
rofit
Net
pro
fit
brou
ght
forw
ard
Net
pro
fit o
f th
e fina
ncia
l ye
ar
TOTA
L EQ
UIT
Y
I/1I/2
IIIII
IV/1
IV/2
IV/3
IV/4
VIV
VII/1
VIII/
1IX
A.1
Bala
nce a
t the
end
of th
e pre
viou
s re
port
ing
perio
d on
31 D
ec 20
154,
451,5
409,
472,
165
10,7
51,2
5450
6,40
6-5
06,4
0669
4,97
25,
732,
581
-7,7
21-7
35,9
8963
,914
,120
11,9
49,2
1610
6,17
7,13
8
A.2
Open
ing
bala
nce o
f the
repo
rtin
g pe
riod
on 1
Jan
2015
4,45
1,540
9,47
2,16
510
,751
,254
506,
406
-506
,406
694,
972
5,73
2,58
1-7
,721
-735
,989
63,9
14,12
011
,949
,216
106,
177,
138
B.1
Chan
ges i
n eq
uity
– tr
ansa
ctio
ns
with
owne
rs-9
0,15
1-9
27,7
70-1
,017
,921
Disb
urse
men
t of d
ivid
ends
-88,
837
-925
,580
-1,0
14,4
17
Disb
urse
men
t of b
onus
es to
the
Boar
d an
d th
e Sup
ervi
sory
Boa
rd-1
,314
-2,19
0-3
,504
B.2
Tota
l com
preh
ensiv
e inc
ome i
n th
e re
port
ing
perio
d4,
451,5
402,
405,
170
-161
,597
65,7
68-6
2020
,094
,597
22,4
03,3
18
Entr
y of n
et p
rofit
/loss
in th
e fin
ancia
l yea
r2,
439,
035
20,0
94,5
9722
,533
,632
Chan
ges i
n th
e sur
plus
from
reva
lu-
atio
n of
fina
ncia
l inv
estm
ents
-1,8
05-7
1,550
-73,
355
Oth
er it
ems o
f the
tota
l com
preh
en-
sive i
ncom
e in
the r
epor
ting
perio
d-3
2,06
0-9
0,04
765
,768
-620
-56,
959
B.3
Chan
ges i
n eq
uity
478,
774
11,9
49,2
16-1
2,42
7,99
00
Real
loca
tion
of a
part
of t
he n
et
profi
t fro
m th
e com
para
tive r
epor
t-in
g pe
riod
to o
ther
equi
ty it
ems
11,9
49,2
16-1
1,949
,216
0
Allo
catio
n of
a po
rtio
n of
net
pro
fit
from
the r
epor
ting
perio
d to
oth
er
equi
ty co
mpo
nent
s bas
ed o
n th
e re
solu
tion
of m
anag
emen
t and
su
perv
isory
bod
ies
478,
774
-478
,774
0
C.
Clos
ing
bala
nce o
f the
repo
rtin
g pe
riod
on 31
/12/2
014
4,45
1,540
11,7
42,18
410
,751
,254
506,
406
-506
,406
1,173
,746
5,73
2,58
1-1
69,3
18-6
70,2
2174
,934
,946
19,6
15,8
2312
7,56
2,53
5

25
six-monthly report
Unaudited Report on the operations of the Impol Group and Impol 2000, d.d., in the first six months of 2016
Table 13: Group cash flow statement in EUR
Item Jan–Jun 2016 Jan–Jun 2015
A. Cash flows from operating activities
a) Items of the Income Statement 29,413,530 25,213,801
Operating revenue (except from revaluation) and financial revenue from operating receivables 279,570,299 298,366,510
Operating revenue excluding depreciation (except from revaluation) and financial expenses from operating liabilities -247,231,388 -270,730,782
Income and other tax not included in operating expenses -2,925,381 -2,421,927
b) Changes to net operating current assets (and accruals and deferrals, provisions and deferred tax receivables and liabilities) of the Balance Sheet operating items -10,100,524 -14,987,557
Opening less closing operating receivables -35,036,221 -37,314,490
Opening less closing deferred costs and accrued revenue -840,753 -2,694,904
Opening less closing deferred tax receivables -23 -3,724
Opening less closing inventories 5,033,417 10,115,994
Closing less opening operating liabilities 19,258,961 12,650,909
Closing less opening accrued costs and deferred revenue and provisions 1,313,147 1,968,528
Closing less opening deferred tax liabilities 170,948 290,130
c) Net cash from operating activities (a+b) 19,313,006 10,226,244
B. Cash flows from investing activities
a) Cash proceeds from investing activities 7,950,611 1,293,783
Inflows from interest and participation in others` profits relating to investing activities 54,036 4,811
Cash proceeds from disposal of tangible fixed assets 2,647,394
Cash proceeds from disposal of investment property 28,046
Cash proceeds from disposal of non-current investments 62,424
Cash proceeds from disposal of current investments 5,158,711 1,288,972
b) Cash payments from investing activities -21,560,311 -2,901,407
Cash disbursements to acquire intangible assets -671,935 -673,121
Cash disbursements to acquire tangible fixed assets -16,738,596 -2,225,523
Cash disbursements to acquire non-current financial investments -15,822 -2,763
Cash disbursements to acquire current financial investments -4,133,958
c) Net cash from investing activities (a+b) -13,609,700 -1,607,624
C. Cash flows from financing activities
a) Cash proceeds from financing activities 8,698,972 20,555,574
Cash proceeds from increase in non-current financial liabilities 0 20,555,574
Cash proceeds from increase in current financial liabilities 8,698,972
b) Cash payments from financing activities -43,638,469 -27,172,758
Interest paid on financing activities -2,195,542 -3,687,384
Cash repayments of equity (acquisition of non-controlling share) -1,200,000
Cash repayments of non-current financial liabilities -3,346
Cash repayments of current financial liabilities -40,156,905 -23,466,874
Dividends and other profit shares paid -82,676 -18,500
c) Net cash from financing activities (a+b) -34,939,497 -6,617,184
Č. Closing balance of cash 41,601,163 14,562,942
a) Net cash flow for the period -29,236,191 2,001,436
b) Opening balance of cash 70,837,354 12,561,506
Notes to the Financial Statements
Parent Company
In compliance with the Companies Act, the parent company Impol 2000, d.d., headquartered in Slovenska Bistrica, Partizanska 38, is a large public limited company. The company is classified under the activity code 70.100 – company management. The company’s share capital in the amount of EUR 4,451,540 is divided into 1,066,767 registered pro rata shares that are not traded in the organized securities market. The shares are owned by 948 shareholders.
The consolidated financial statements for the period that ended on 30 June 2016 are presented hereafter. The consolidated financial statements include the company Impol 2000, d.d., and its subsidiaries and participations in associates.
26
six-monthly report
Unaudited Report on the operations of the Impol Group and Impol 2000, d.d., in the first six months of 2016
Statement of Compliance with IFRS
The Management Board confirmed the financial statements and the consolidated financial statements on 19 September 2016.
Financial statements of the company Impol 2000, d.d., and the consolidated financial statements of the Group were prepared in ac-cordance with the International Financial Reporting Standards (IFRS), as they were adopted by the European Union, including the notes that were adopted by the International Financial Reporting Interpretations Committee (IFRIC) and that were also adopted by the European Union, and in accordance with the Slovenian Companies Act (ZGD). This Six-Monthly Report has been prepared in accordance with the IAS 34 – Interim Financial Reporting. In the preparation of the financial statements for the period January–June 2016 the same accounting policies have been used as in the preparation of the financial statements for 2015.
On the balance sheet date, there are no differences between the applied IFRS and the IFRS adopted by the European Union in account-ing guidelines of Impol, d.d., and the Impol Group as regards the process of confirming standards in the European Union. Inter-annual financial statements of the Impol Group were not audited.
Basis and estimates for preparing financial statements
Financial statements of the Group and financial statements of Impol 2000, d.d., were prepared at historical cost basis, except in case of derivatives.
Financial statements in this report are given in EUR, no cents, and EUR is also the functional currency of the Group.
Foreign currency transactions
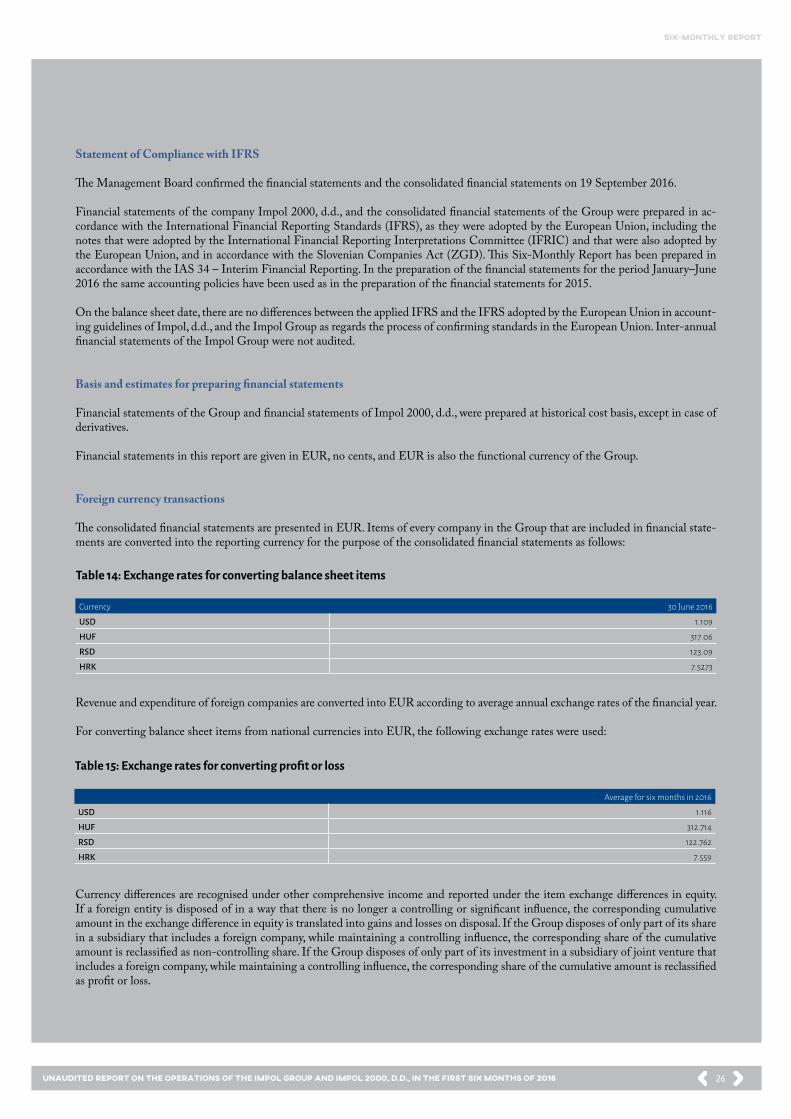
The consolidated financial statements are presented in EUR. Items of every company in the Group that are included in financial state-ments are converted into the reporting currency for the purpose of the consolidated financial statements as follows:
Currency 30 June 2016
USD 1.109
HUF 317.06
RSD 123.09
HRK 7.5273
Average for six months in 2016
USD 1.116
HUF 312.714
RSD 122.762
HRK 7.559
Table 14: Exchange rates for converting balance sheet items
Table 15: Exchange rates for converting profit or loss
Revenue and expenditure of foreign companies are converted into EUR according to average annual exchange rates of the financial year.
For converting balance sheet items from national currencies into EUR, the following exchange rates were used:
Currency differences are recognised under other comprehensive income and reported under the item exchange differences in equity. If a foreign entity is disposed of in a way that there is no longer a controlling or significant influence, the corresponding cumulative amount in the exchange difference in equity is translated into gains and losses on disposal. If the Group disposes of only part of its share in a subsidiary that includes a foreign company, while maintaining a controlling influence, the corresponding share of the cumulative amount is reclassified as non-controlling share. If the Group disposes of only part of its investment in a subsidiary of joint venture that includes a foreign company, while maintaining a controlling influence, the corresponding share of the cumulative amount is reclassified as profit or loss.
27
six-monthly report
Unaudited Report on the operations of the Impol Group and Impol 2000, d.d., in the first six months of 2016
Segment reporting
Because the nature of product groups, the production procedure and distribution are very similar, the Group defined only one operating segment. At segment reporting, it is considered that the main operating section of the Group is the aluminium business activities. Other activities have an insignificant effect on presenting financial information.
The group reports on sales by geographical area. The defined geographical areas are Slovenia, European Union, other European coun-tries and the rest of the world.
28
six-monthly report
Unaudited Report on the operations of the Impol Group and Impol 2000, d.d., in the first six months of 2016
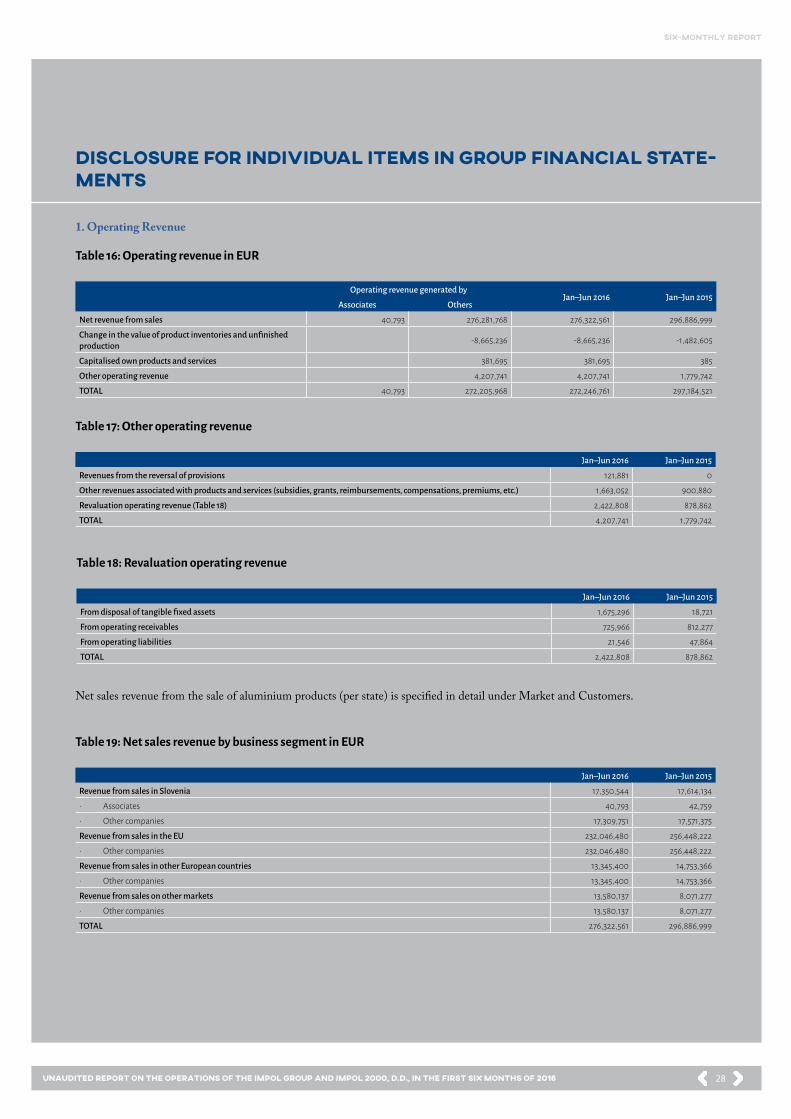
1. Operating Revenue
DISCLOSURE FOR INDIVIDUAL ITEMS IN GROUP FINANCIAL STATE-MENTS
Table 16: Operating revenue in EUR
Table 17: Other operating revenue
Table 18: Revaluation operating revenue
Table 19: Net sales revenue by business segment in EUR
Operating revenue generated by Jan–Jun 2016 Jan–Jun 2015
Associates Others
Net revenue from sales 40,793 276,281,768 276,322,561 296,886,999
Change in the value of product inventories and unfinished production -8,665,236 -8,665,236 -1,482,605
Capitalised own products and services 381,695 381,695 385
Other operating revenue 4,207,741 4,207,741 1,779,742
TOTAL 40,793 272,205,968 272,246,761 297,184,521
Jan–Jun 2016 Jan–Jun 2015
Revenues from the reversal of provisions 121,881 0
Other revenues associated with products and services (subsidies, grants, reimbursements, compensations, premiums, etc.) 1,663,052 900,880
Revaluation operating revenue (Table 18) 2,422,808 878,862
TOTAL 4,207,741 1,779,742
Jan–Jun 2016 Jan–Jun 2015
From disposal of tangible fixed assets 1,675,296 18,721
From operating receivables 725,966 812,277
From operating liabilities 21,546 47,864
TOTAL 2,422,808 878,862
Jan–Jun 2016 Jan–Jun 2015
Revenue from sales in Slovenia 17,350,544 17,614,134
• Associates 40,793 42,759
• Other companies 17,309,751 17,571,375
Revenue from sales in the EU 232,046,480 256,448,222
• Other companies 232,046,480 256,448,222
Revenue from sales in other European countries 13,345,400 14,753,366
• Other companies 13,345,400 14,753,366
Revenue from sales on other markets 13,580,137 8,071,277
• Other companies 13,580,137 8,071,277
TOTAL 276,322,561 296,886,999
Net sales revenue from the sale of aluminium products (per state) is specified in detail under Market and Customers.
29
six-monthly report
Unaudited Report on the operations of the Impol Group and Impol 2000, d.d., in the first six months of 2016
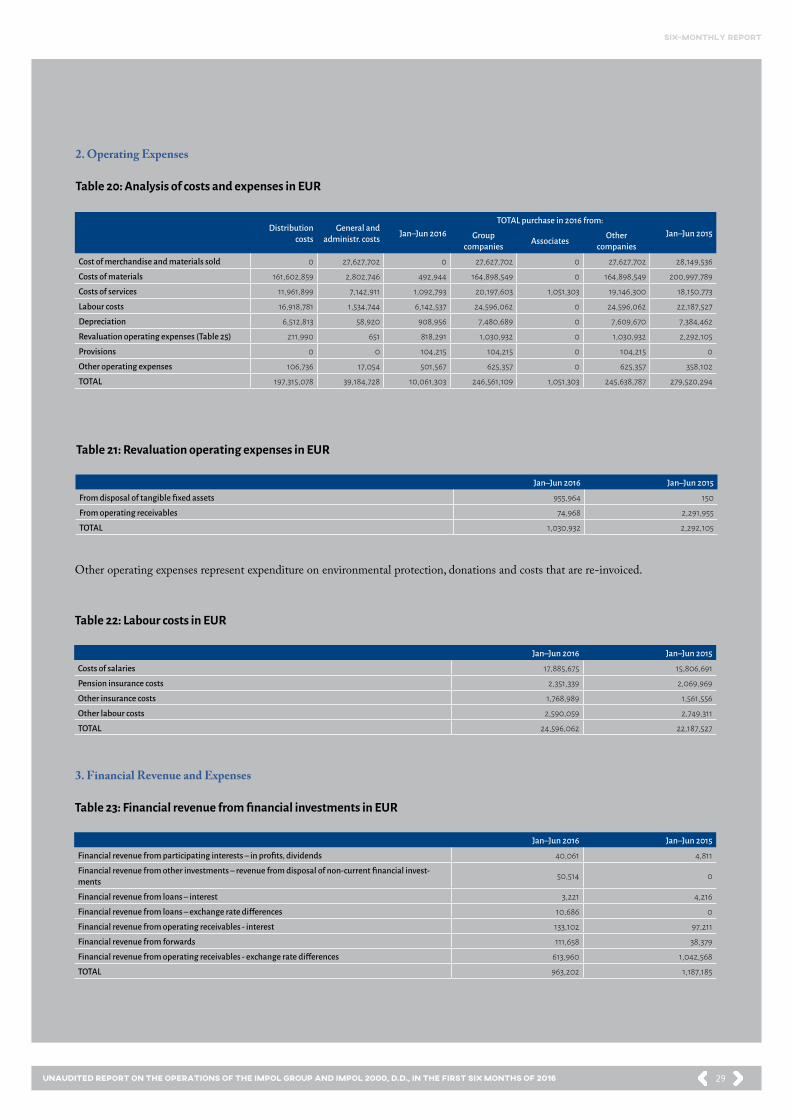
2. Operating Expenses
Distributioncosts
General and administr. costs Jan–Jun 2016
TOTAL purchase in 2016 from:Jan–Jun 2015Group
companies Associates Other companies
Cost of merchandise and materials sold 0 27,627,702 0 27,627,702 0 27,627,702 28,149,536
Costs of materials 161,602,859 2,802,746 492,944 164,898,549 0 164,898,549 200,997,789
Costs of services 11,961,899 7,142,911 1,092,793 20,197,603 1,051,303 19,146,300 18,150,773
Labour costs 16,918,781 1,534,744 6,142,537 24,596,062 0 24,596,062 22,187,527
Depreciation 6,512,813 58,920 908,956 7,480,689 0 7,609,670 7,384,462
Revaluation operating expenses (Table 25) 211,990 651 818,291 1,030,932 0 1,030,932 2,292,105
Provisions 0 0 104,215 104,215 0 104,215 0
Other operating expenses 106,736 17,054 501,567 625,357 0 625,357 358,102
TOTAL 197,315,078 39,184,728 10,061,303 246,561,109 1,051,303 245,638,787 279,520,294
Table 20: Analysis of costs and expenses in EUR
Table 21: Revaluation operating expenses in EUR
Table 22: Labour costs in EUR
Table 23: Financial revenue from financial investments in EUR
Jan–Jun 2016 Jan–Jun 2015
From disposal of tangible fixed assets 955,964 150
From operating receivables 74,968 2,291,955
TOTAL 1,030,932 2,292,105
Jan–Jun 2016 Jan–Jun 2015
Costs of salaries 17,885,675 15,806,691
Pension insurance costs 2,351,339 2,069,969
Other insurance costs 1,768,989 1,561,556
Other labour costs 2,590,059 2,749,311
TOTAL 24,596,062 22,187,527
Jan–Jun 2016 Jan–Jun 2015
Financial revenue from participating interests – in profits, dividends 40,061 4,811
Financial revenue from other investments – revenue from disposal of non-current financial invest-ments 50,514 0
Financial revenue from loans – interest 3,221 4,216
Financial revenue from loans – exchange rate differences 10,686 0
Financial revenue from operating receivables - interest 133,102 97,211
Financial revenue from forwards 111,658 38,379
Financial revenue from operating receivables - exchange rate differences 613,960 1,042,568
TOTAL 963,202 1,187,185
Other operating expenses represent expenditure on environmental protection, donations and costs that are re-invoiced.
3. Financial Revenue and Expenses
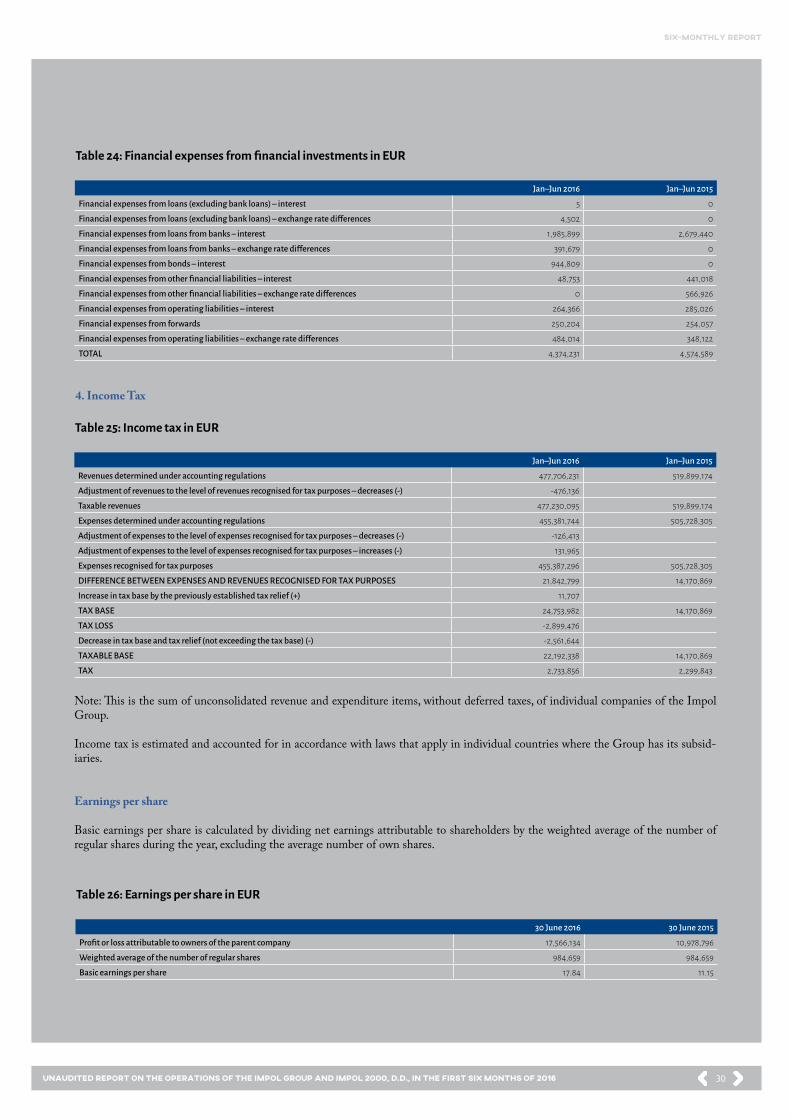
30
six-monthly report
Unaudited Report on the operations of the Impol Group and Impol 2000, d.d., in the first six months of 2016
Table 24: Financial expenses from financial investments in EUR
Jan–Jun 2016 Jan–Jun 2015
Financial expenses from loans (excluding bank loans) – interest 5 0
Financial expenses from loans (excluding bank loans) – exchange rate differences 4,502 0
Financial expenses from loans from banks – interest 1,985,899 2,679,440
Financial expenses from loans from banks – exchange rate differences 391,679 0
Financial expenses from bonds – interest 944,809 0
Financial expenses from other financial liabilities – interest 48,753 441,018
Financial expenses from other financial liabilities – exchange rate differences 0 566,926
Financial expenses from operating liabilities – interest 264,366 285,026
Financial expenses from forwards 250,204 254,057
Financial expenses from operating liabilities – exchange rate differences 484,014 348,122
TOTAL 4,374,231 4,574,589
Table 25: Income tax in EUR
Table 26: Earnings per share in EUR
Jan–Jun 2016 Jan–Jun 2015
Revenues determined under accounting regulations 477,706,231 519,899,174
Adjustment of revenues to the level of revenues recognised for tax purposes – decreases (-) -476,136
Taxable revenues 477,230,095 519,899,174
Expenses determined under accounting regulations 455,381,744 505,728,305
Adjustment of expenses to the level of expenses recognised for tax purposes – decreases (-) -126,413
Adjustment of expenses to the level of expenses recognised for tax purposes – increases (-) 131,965
Expenses recognised for tax purposes 455,387,296 505,728,305
DIFFERENCE BETWEEN EXPENSES AND REVENUES RECOGNISED FOR TAX PURPOSES 21,842,799 14,170,869
Increase in tax base by the previously established tax relief (+) 11,707
TAX BASE 24,753,982 14,170,869
TAX LOSS -2,899,476
Decrease in tax base and tax relief (not exceeding the tax base) (-) -2,561,644
TAXABLE BASE 22,192,338 14,170,869
TAX 2,733,856 2,299,843
30 June 2016 30 June 2015
Profit or loss attributable to owners of the parent company 17,566,134 10,978,796
Weighted average of the number of regular shares 984,659 984,659
Basic earnings per share 17.84 11.15
4. Income Tax
Note: This is the sum of unconsolidated revenue and expenditure items, without deferred taxes, of individual companies of the Impol Group.
Income tax is estimated and accounted for in accordance with laws that apply in individual countries where the Group has its subsid-iaries.
Earnings per share
Basic earnings per share is calculated by dividing net earnings attributable to shareholders by the weighted average of the number of regular shares during the year, excluding the average number of own shares.
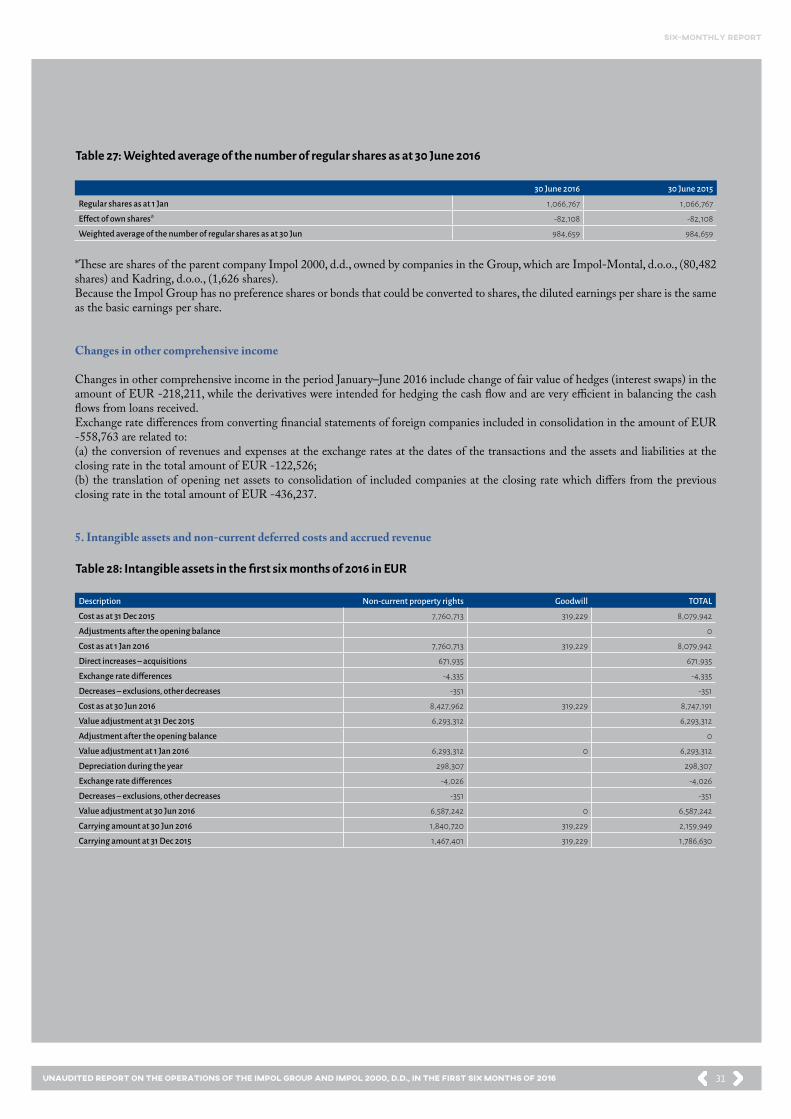
31
six-monthly report
Unaudited Report on the operations of the Impol Group and Impol 2000, d.d., in the first six months of 2016
Table 27: Weighted average of the number of regular shares as at 30 June 2016
Table 28: Intangible assets in the first six months of 2016 in EUR
30 June 2016 30 June 2015
Regular shares as at 1 Jan 1,066,767 1,066,767
Effect of own shares* -82,108 -82,108
Weighted average of the number of regular shares as at 30 Jun 984,659 984,659
*These are shares of the parent company Impol 2000, d.d., owned by companies in the Group, which are Impol-Montal, d.o.o., (80,482 shares) and Kadring, d.o.o., (1,626 shares).Because the Impol Group has no preference shares or bonds that could be converted to shares, the diluted earnings per share is the same as the basic earnings per share.
Changes in other comprehensive income
Changes in other comprehensive income in the period January–June 2016 include change of fair value of hedges (interest swaps) in the amount of EUR -218,211, while the derivatives were intended for hedging the cash flow and are very efficient in balancing the cash flows from loans received.Exchange rate differences from converting financial statements of foreign companies included in consolidation in the amount of EUR -558,763 are related to:(a) the conversion of revenues and expenses at the exchange rates at the dates of the transactions and the assets and liabilities at the closing rate in the total amount of EUR -122,526;(b) the translation of opening net assets to consolidation of included companies at the closing rate which differs from the previous closing rate in the total amount of EUR -436,237.
5. Intangible assets and non-current deferred costs and accrued revenue
Description Non-current property rights Goodwill TOTAL
Cost as at 31 Dec 2015 7,760,713 319,229 8,079,942
Adjustments after the opening balance 0
Cost as at 1 Jan 2016 7,760,713 319,229 8,079,942
Direct increases – acquisitions 671,935 671,935
Exchange rate differences -4,335 -4,335
Decreases – exclusions, other decreases -351 -351
Cost as at 30 Jun 2016 8,427,962 319,229 8,747,191
Value adjustment at 31 Dec 2015 6,293,312 6,293,312
Adjustment after the opening balance 0
Value adjustment at 1 Jan 2016 6,293,312 0 6,293,312
Depreciation during the year 298,307 298,307
Exchange rate differences -4,026 -4,026
Decreases – exclusions, other decreases -351 -351
Value adjustment at 30 Jun 2016 6,587,242 0 6,587,242
Carrying amount at 30 Jun 2016 1,840,720 319,229 2,159,949
Carrying amount at 31 Dec 2015 1,467,401 319,229 1,786,630

32
six-monthly report
Unaudited Report on the operations of the Impol Group and Impol 2000, d.d., in the first six months of 2016
Description Non-current property rights Goodwill
Other non-current deferred costs and
accrued revenueTOTAL
Cost as at 31 Dec 2014 7,620,816 319,229 46,623 7,986,668
Cost as at 1 Jan 2015 7,620,816 319,229 46,623 7,986,668
Direct increases – acquisitions 216,143 216,143
Transfer from investments under way 14,420 14,420
Exchange rate differences -1,503 -1,503
Decreases – exclusions, other decreases -89,163 -46,623 -135,786
Cost as at 31 Dec 2015 7,760,713 319,229 0 8,079,942
Value adjustment at 31 Dec 2014 5,648,097 5,648,097
Value adjustment at 1 Jan 2015 5,648,097 0 0 5,648,097
Depreciation during the year 705,150 705,150
Exchange rate differences -1,289 -1,289
Decreases – exclusions, other decreases -58,646 -58,646
Value adjustment at 31 Dec 2015 6,293,312 0 0 6,293,312
Carrying amount at 31 Dec 2015 1,467,401 319,229 0 1,786,630
Carrying amount at 31 Dec 2014 1,972,719 319,229 46,623 2,338,571
Table 29: Intangible assets in 2015 in EUR
Table 30: Intangible assets in 2015 in EUR
The disclosed intangible assets are owned by the Group and are free of debts.More than half of all intangible assets that were used on 30 June 2016 were fully depreciated.
Goodwill
Structure of goodwill according to business combinations that generated it:
30 June 2016 31 December 2015
Stampal SB, d.o.o. 319,229 319,229

33
six-monthly report
Unaudited Report on the operations of the Impol Group and Impol 2000, d.d., in the first six months of 2016
6. T
angi
ble fi
xed
asse
ts
Des
crip
tion
Land
Build
ings
Prop
erty
bei
ng
acqu
ired
Tota
l pro
pert
yPr
oduc
tion
equi
pmen
t and
m
achi
nery
Othe
r ma-
chin
ery a
nd
equi
pmen
t
Equi
pmen
t and
ot
her t
angi
ble a
s-se
ts b
eing
acqu
ired
fixed
Adva
nces
to ac
quire
tang
i-bl
e fixe
d as
sets
Tota
l eq
uipm
ent
TOTA
L
Cost
as at
31 D
ec 20
153,
740,
137
77,2
66,5
661,6
59,8
2182
,666
,524
294,
881,9
6417
,787
,372
9,84
3,15
31,0
76,8
3032
3,58
9,31
940
6,25
5,84
3
Adju
stm
ents
afte
r the
ope
ning
bal
ance
00
0
Cost
as at
1 Ja
n 20
163,
740,
137
77,2
66,5
661,6
59,8
2182
,666
,524
294,
881,9
6417
,787
,372
9,84
3,15
31,0
76,8
3032
3,58
9,31
940
6,25
5,84
3
Dire
ct in
crea
ses –
acqu
isitio
ns37
0,71
71,3
91,4
601,1
09,0
452,
871,2
221,3
04,0
0419
,381
4,24
4,68
83,
377,
690
8,94
5,76
311
,816
,985
Dire
ct in
crea
ses –
fina
ncia
l lea
se0
97,8
8197
,881
97,8
81
Tran
sfer
from
inve
stm
ents
in p
rogr
ess
1,466
,367
-1,4
66,3
670
1,604
,998
529,
623
-2,13
4,62
10
0
Tran
sfer
bet
wee
n Gr
oup
com
pani
es –
acqu
i-sit
ion
028
828
828
8
Tran
sfer
of t
angi
ble fi
xed
asse
ts o
f Gro
up
com
pani
es u
pon
acqu
isitio
n*73
1,122
3,97
8,13
44,
709,
256
04,
709,
256
Exch
ange
rate
diff
eren
ces
-8,3
38-1
50,14
1-1
,861
-160
,340
-756
,251
-4,7
51-3
9,05
3-5
,082
-805
,137
-965
,477
Reva
luat
ion
for i
mpa
irmen
t0
00
Dec
reas
es –
sale
s-6
8,09
1-6
78,7
84-7
46,8
75-6
,047
,054
-8,7
80-6
,055
,834
-6,8
02,7
09
Dec
reas
es –
excl
usio
ns, o
ther
dec
reas
es0
-2,5
03-2
8,97
3-3
63,6
28-3
95,10
4-3
95,10
4
Cost
as at
30 Ju
n 20
164,
765,
547
83,2
73,6
021,3
00,6
3889
,339
,787
290,
985,
158
18,2
93,8
7212
,012
,336
4,08
5,81
032
5,37
7,17
641
4,71
6,96
3
Valu
e adj
ustm
ent a
t 31 D
ec 20
1544
,210
,839
44,2
10,8
3922
2,81
3,87
814
,187,
534
237,
001,4
1228
1,212
,251
Adju
stm
ents
afte
r the
ope
ning
bal
ance
00
0
Valu
e adj
ustm
ent a
t 1 Ja
n 20
160
44,2
10,8
390
44,2
10,8
3922
2,81
3,87
814
,187,
534
00
237,
001,4
1228
1,212
,251
Dep
recia
tion
953,
304
953,
304
5,56
7,16
057
6,46
06,
143,
620
7,09
6,92
4
Tran
sfer
of t
angi
ble fi
xed
asse
ts o
f Gro
up
com
pani
es u
pon
acqu
isitio
n90
,333
90,3
330
90,3
33
Exch
ange
rate
diff
eren
ces
-105
,817
-105
,817
-236
,686
-4,0
09-2
40,6
95-3
46,5
12
Dec
reas
es –
sale
s0
-5,8
35,6
05-8
,780
-5,8
44,3
85-5
,844
,385
Dec
reas
es –
excl
usio
ns, o
ther
dec
reas
es0
-2,2
10-2
7,95
630
2,40
027
2,23
427
2,23
4
Valu
e adj
ustm
ent a
t 30
Jun
2016
045
,148,
659
045
,148,
659
222,
306,
537
14,7
23,2
490
302,
400
237,
332,
186
282,
480,
845
Carr
ying
amou
nt at
30 Ju
n 20
164,
765,
547
38,12
4,94
31,3
00,6
3844
,191,1
2868
,678
,621
3,57
0,62
312
,012
,336
3,78
3,41
088
,044
,990
132,
236,
118
Carr
ying
amou
nt at
31 D
ec 20
153,
740,
137
33,0
55,7
271,6
59,8
2138
,455
,685
72,0
68,0
863,
599,
838
9,84
3,15
31,0
76,8
3086
,587
,907
125,
043,
592
Tabl
e 31:
Tang
ible
fixe
d as
sets
in th
e firs
t six
mon
ths o
f 201
6 in
EUR
*On
2 M
arch
201
6, th
e sub
sidia
ry Im
pol-T
LM, d
.o.o
., ac
quire
d A
dria
l ulag
anja
(whi
ch w
as la
ter r
enam
ed to
Impo
l ulag
anja,
d.o
.o.).
At t
he d
ay o
f the
acqu
isitio
n, th
e ass
ets a
cqui
red
were
estim
ated
at a
prov
ision
al va
lue.
The v
alue o
f the
com
pany
will
estim
ated
at th
e end
of 2
016.
Car
ryin
g am
ount
of t
he p
ledge
d ta
ngib
le fix
ed as
sets/
plan
t, pr
oper
ty an
d eq
uipm
ent a
s at 3
0 Ju
ne 2
016
amou
nted
to E
UR
81,
732,
526.
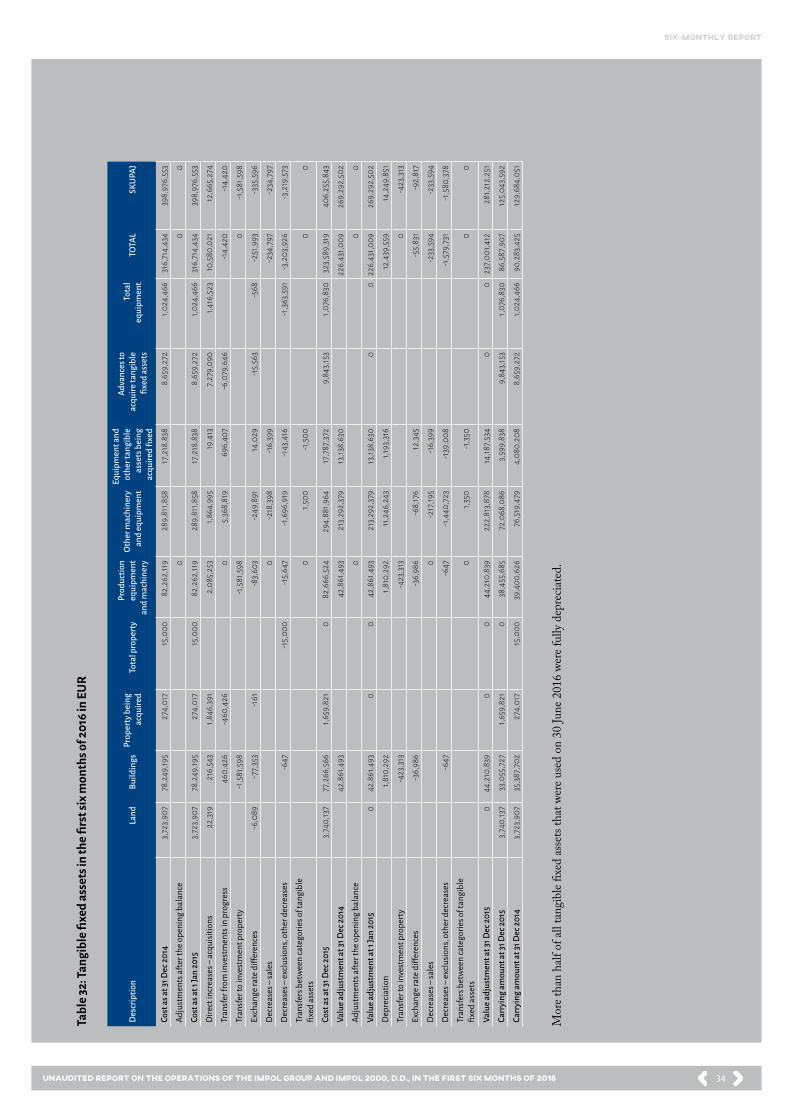
34
six-monthly report
Unaudited Report on the operations of the Impol Group and Impol 2000, d.d., in the first six months of 2016
Des
crip
tion
Land
Build
ings
Prop
erty
bei
ng
acqu
ired
Tota
l pro
pert
yPr
oduc
tion
equi
pmen
t an
d m
achi
nery
Othe
r mac
hine
ry
and
equi
pmen
t
Equi
pmen
t and
ot
her t
angi
ble
asse
ts b
eing
ac
quire
d fix
ed
Adva
nces
to
acqu
ire ta
ngib
le
fixed
asse
ts
Tota
l eq
uipm
ent
TOTA
LSK
UPAJ
Cost
as at
31 D
ec 20
143,
723,
907
78,2
49,19
527
4,01
715
,000
82,2
62,11
928
9,81
1,858
17,2
18,8
388,
659,
272
1,024
,466
316,
714,
434
398,
976,
553
Adju
stm
ents
afte
r the
ope
ning
bal
ance
00
0
Cost
as at
1 Ja
n 20
153,
723,
907
78,2
49,19
527
4,01
715
,000
82,2
62,11
928
9,81
1,858
17,2
18,8
388,
659,
272
1,024
,466
316,
714,
434
398,
976,
553
Dire
ct in
crea
ses –
acqu
isitio
ns22
,319
216,
543
1,846
,391
2,08
5,25
31,8
64,9
9519
,413
7,27
9,09
01,4
16,5
2310
,580
,021
12,6
65,2
74
Tran
sfer
from
inve
stm
ents
in p
rogr
ess
460,
426
-460
,426
05,
368,
819
696,
407
-6,0
79,6
46-1
4,42
0-1
4,42
0
Tran
sfer
to in
vest
men
t pro
pert
y-1
,581
,598
-1,5
81,5
980
-1,5
81,5
98
Exch
ange
rate
diff
eren
ces
-6,0
89-7
7,35
3-1
61-8
3,60
3-2
49,8
9114
,029
-15,
563
-568
-251
,993
-335
,596
Dec
reas
es –
sale
s0
-218
,398
-16,
399
-234
,797
-234
,797
Dec
reas
es –
excl
usio
ns, o
ther
dec
reas
es-6
47-1
5,00
0-1
5,64
7-1
,696
,919
-143
,416
-1,3
63,5
91-3
,203
,926
-3,2
19,5
73
Tran
sfer
s bet
wee
n ca
tego
ries o
f tan
gibl
e fix
ed as
sets
01,5
00-1
,500
00
Cost
as at
31 D
ec 20
153,
740,
137
77,2
66,5
661,6
59,8
210
82,6
66,5
2429
4,88
1,964
17,7
87,3
729,
843,
153
1,076
,830
323,
589,
319
406,
255,
843
Valu
e adj
ustm
ent a
t 31 D
ec 20
1442
,861
,493
42,8
61,4
9321
3,29
2,37
913
,138,
630
226,
431,0
0926
9,29
2,50
2
Adju
stm
ents
afte
r the
ope
ning
bal
ance
00
0
Valu
e adj
ustm
ent a
t 1 Ja
n 20
150
42,8
61,4
930
042
,861
,493
213,
292,
379
13,13
8,63
00
022
6,43
1,009
269,
292,
502
Dep
recia
tion
1,810
,292
1,810
,292
11,2
46,2
431,1
93,3
1612
,439
,559
14,2
49,8
51
Tran
sfer
to in
vest
men
t pro
pert
y-4
23,3
13-4
23,3
130
-423
,313
Exch
ange
rate
diff
eren
ces
-36,
986
-36,
986
-68,
176
12,3
45-5
5,83
1-9
2,81
7
Dec
reas
es –
sale
s0
-217
,195
-16,
399
-233
,594
-233
,594
Dec
reas
es –
excl
usio
ns, o
ther
dec
reas
es-6
47-6
47-1
,440
,723
-139
,008
-1,5
79,7
31-1
,580
,378
Tran
sfer
s bet
wee
n ca
tego
ries o
f tan
gibl
e fix
ed as
sets
01,3
50-1
,350
00
Valu
e adj
ustm
ent a
t 31 D
ec 20
150
44,2
10,8
390
044
,210
,839
222,
813,
878
14,18
7,53
40
023
7,00
1,412
281,2
12,2
51
Carr
ying
amou
nt at
31 D
ec 20
153,
740,
137
33,0
55,7
271,6
59,8
210
38,4
55,6
8572
,068
,086
3,59
9,83
89,
843,
153
1,076
,830
86,5
87,9
0712
5,04
3,59
2
Carr
ying
amou
nt at
31 D
ec 20
143,
723,
907
35,3
87,7
0227
4,01
715
,000
39,4
00,6
2676
,519
,479
4,08
0,20
88,
659,
272
1,024
,466
90,2
83,4
2512
9,68
4,05
1
Tabl
e 32:
Tang
ible
fixe
d as
sets
in th
e firs
t six
mon
ths o
f 201
6 in
EUR
Mor
e tha
n ha
lf of
all t
angi
ble fi
xed
asse
ts th
at w
ere u
sed
on 3
0 Ju
ne 2
016
were
fully
dep
recia
ted.

35
six-monthly report
Unaudited Report on the operations of the Impol Group and Impol 2000, d.d., in the first six months of 2016
7. Investment Property
In the period under observation the investment property only includes buildings and associated land held to earn rentals.
Description Land Buildings TOTAL
Cost as at 31 Dec 2015 372,928 7,232,259 7,605,187
Adjustments after the opening balance 0
Cost as at 1 Jan 2016 372,928 7,232,259 7,605,187
Transfer from inventory accounts (+) 14,043 14,043
Decreases (-) -5,635 -28,931 -34,566
Cost as at 30 Jun 2016 367,293 7,217,371 7,584,664
Value adjustment at 31 Dec 2015 3,908,582 3,908,582
Adjustments after the opening balance 0
Value adjustment at 1 Jan 2016 0 3,908,582 3,908,582
Depreciation (+) 81,468 81,468
Decreases (-) -6,520 -6,520
Value adjustment at 30 Jun 2016 0 3,983,530 3,983,530
Carrying amount at 30 Jun 2016 367,293 3,233,841 3,601,134
Carrying amount at 31 Dec 2015 372,928 3,323,677 3,696,605
Description Land Buildings TOTAL
Cost as at 31 Dec 2014 138,929 5,652,866 5,791,795
Transfer from tangible fixed assets (+) 1,581,598 1,581,598
Transfer from non-current assets (+) 234,721 234,721
Exchange rate differences -722 -2,205 -2,927
Cost as at 31 Dec 2015 372,928 7,232,259 7,605,187
Value adjustment at 31 Dec 2014 3,341,043 3,341,043
Depreciation (+) 144,585 144,585
Transfer from tangible fixed assets (+) 423,313 423,313
Exchange rate differences -359 -359
Value adjustment at 31 Dec 2015 0 3,908,582 3,908,582
Carrying amount at 31 Dec 2015 372,928 3,323,677 3,696,605
Carrying amount at 31 Dec 2014 138,929 2,311,823 2,450,752
Table 33: Investment property in the first six months of 2016 in EUR
Table 34: Investment property in 2015 in EUR
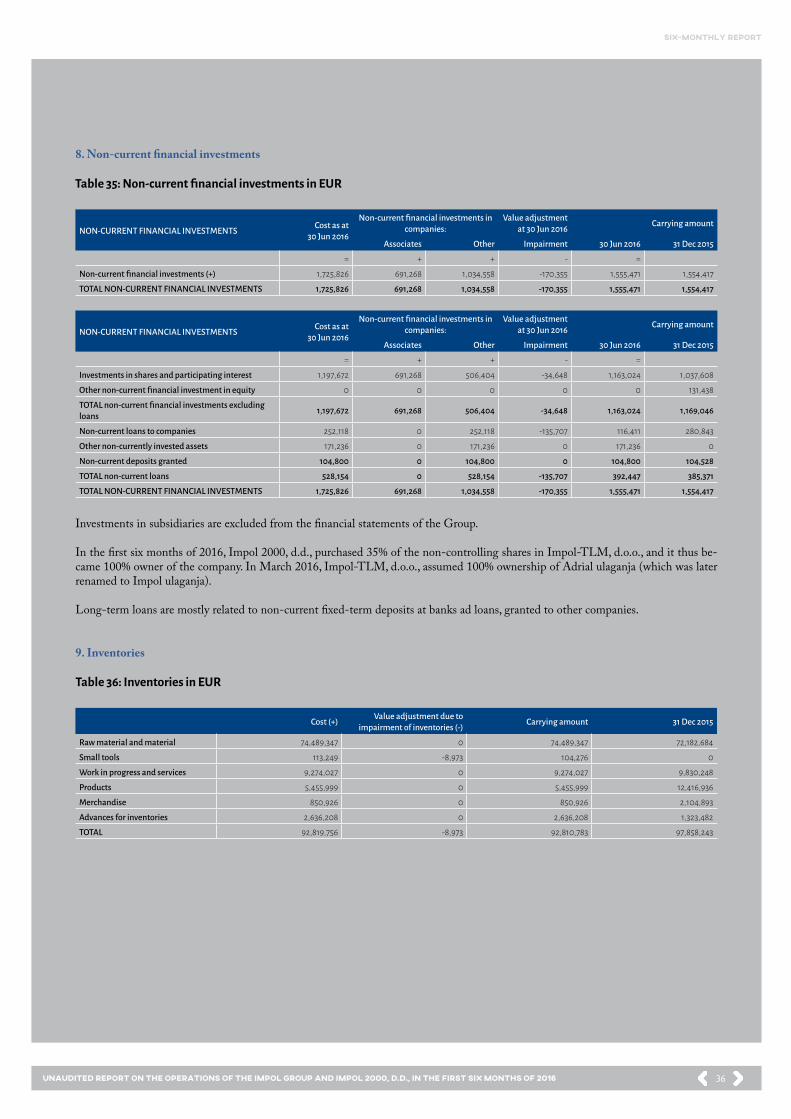
36
six-monthly report
Unaudited Report on the operations of the Impol Group and Impol 2000, d.d., in the first six months of 2016
8. Non-current financial investments
NON-CURRENT FINANCIAL INVESTMENTS Cost as at 30 Jun 2016
Non-current financial investments in companies:
Value adjustment at 30 Jun 2016 Carrying amount
Associates Other Impairment 30 Jun 2016 31 Dec 2015
= + + - =
Non-current financial investments (+) 1,725,826 691,268 1,034,558 -170,355 1,555,471 1,554,417
TOTAL NON-CURRENT FINANCIAL INVESTMENTS 1,725,826 691,268 1,034,558 -170,355 1,555,471 1,554,417
NON-CURRENT FINANCIAL INVESTMENTS Cost as at 30 Jun 2016
Non-current financial investments in companies:
Value adjustment at 30 Jun 2016 Carrying amount
Associates Other Impairment 30 Jun 2016 31 Dec 2015
= + + - =
Investments in shares and participating interest 1,197,672 691,268 506,404 -34,648 1,163,024 1,037,608
Other non-current financial investment in equity 0 0 0 0 0 131,438
TOTAL non-current financial investments excluding loans 1,197,672 691,268 506,404 -34,648 1,163,024 1,169,046
Non-current loans to companies 252,118 0 252,118 -135,707 116,411 280,843
Other non-currently invested assets 171,236 0 171,236 0 171,236 0
Non-current deposits granted 104,800 0 104,800 0 104,800 104,528
TOTAL non-current loans 528,154 0 528,154 -135,707 392,447 385,371
TOTAL NON-CURRENT FINANCIAL INVESTMENTS 1,725,826 691,268 1,034,558 -170,355 1,555,471 1,554,417
Table 35: Non-current financial investments in EUR
Table 36: Inventories in EUR
Investments in subsidiaries are excluded from the financial statements of the Group.
In the first six months of 2016, Impol 2000, d.d., purchased 35% of the non-controlling shares in Impol-TLM, d.o.o., and it thus be-came 100% owner of the company. In March 2016, Impol-TLM, d.o.o., assumed 100% ownership of Adrial ulaganja (which was later renamed to Impol ulaganja).
Long-term loans are mostly related to non-current fixed-term deposits at banks ad loans, granted to other companies.
9. Inventories
Cost (+) Value adjustment due toimpairment of inventories (-) Carrying amount 31 Dec 2015
Raw material and material 74,489,347 0 74,489,347 72,182,684
Small tools 113,249 -8,973 104,276 0
Work in progress and services 9,274,027 0 9,274,027 9,830,248
Products 5,455,999 0 5,455,999 12,416,936
Merchandise 850,926 0 850,926 2,104,893
Advances for inventories 2,636,208 0 2,636,208 1,323,482
TOTAL 92,819,756 -8,973 92,810,783 97,858,243
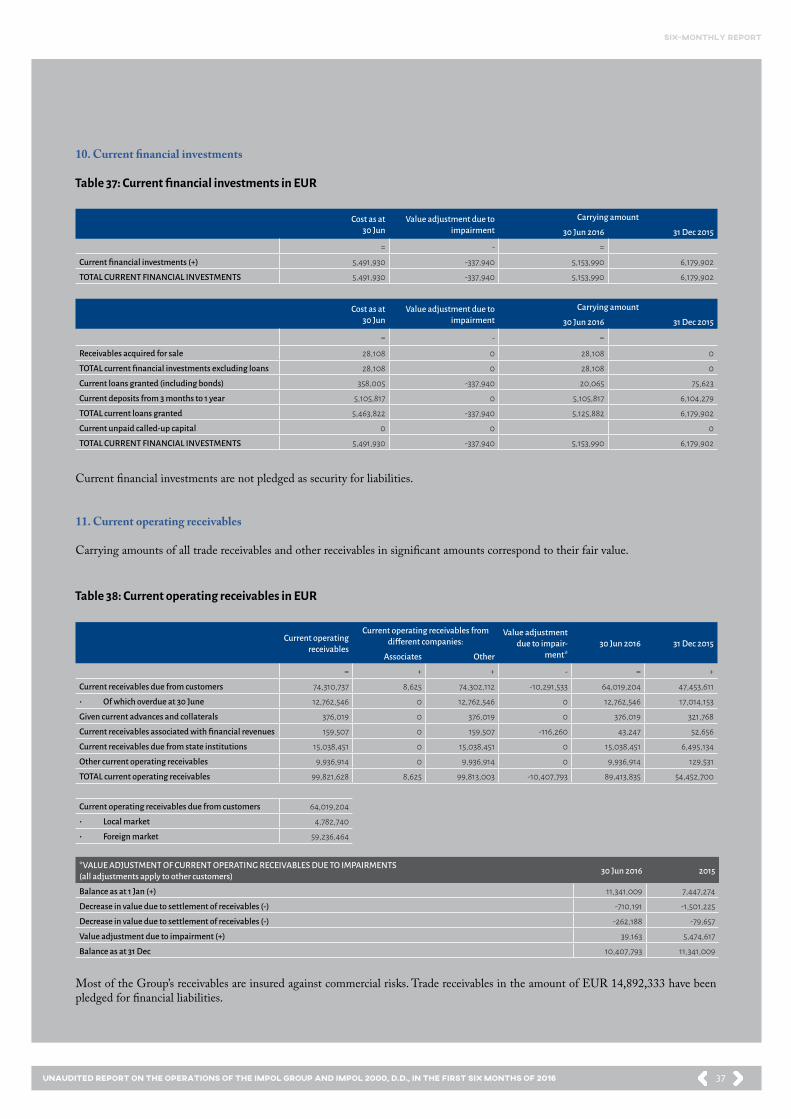
37
six-monthly report
Unaudited Report on the operations of the Impol Group and Impol 2000, d.d., in the first six months of 2016
10. Current financial investments
Cost as at30 Jun
Value adjustment due toimpairment
Carrying amount
30 Jun 2016 31 Dec 2015
= - =
Current financial investments (+) 5,491,930 -337,940 5,153,990 6,179,902
TOTAL CURRENT FINANCIAL INVESTMENTS 5,491,930 -337,940 5,153,990 6,179,902
Cost as at30 Jun
Value adjustment due toimpairment
Carrying amount
30 Jun 2016 31 Dec 2015
= - =
Receivables acquired for sale 28,108 0 28,108 0
TOTAL current financial investments excluding loans 28,108 0 28,108 0
Current loans granted (including bonds) 358,005 -337,940 20,065 75,623
Current deposits from 3 months to 1 year 5,105,817 0 5,105,817 6,104,279
TOTAL current loans granted 5,463,822 -337,940 5,125,882 6,179,902
Current unpaid called-up capital 0 0 0
TOTAL CURRENT FINANCIAL INVESTMENTS 5,491,930 -337,940 5,153,990 6,179,902
Table 37: Current financial investments in EUR
Table 38: Current operating receivables in EUR
Current financial investments are not pledged as security for liabilities.
11. Current operating receivables
Carrying amounts of all trade receivables and other receivables in significant amounts correspond to their fair value.
Current operating receivables
Current operating receivables from different companies:
Value adjustment due to impair-
ment*30 Jun 2016 31 Dec 2015
Associates Other
= + + - = +
Current receivables due from customers 74,310,737 8,625 74,302,112 -10,291,533 64,019,204 47,453,611
• Of which overdue at 30 June 12,762,546 0 12,762,546 0 12,762,546 17,014,153
Given current advances and collaterals 376,019 0 376,019 0 376,019 321,768
Current receivables associated with financial revenues 159,507 0 159,507 -116,260 43,247 52,656
Current receivables due from state institutions 15,038,451 0 15,038,451 0 15,038,451 6,495,134
Other current operating receivables 9,936,914 0 9,936,914 0 9,936,914 129,531
TOTAL current operating receivables 99,821,628 8,625 99,813,003 -10,407,793 89,413,835 54,452,700
Current operating receivables due from customers 64,019,204
• Local market 4,782,740
• Foreign market 59,236,464
*VALUE ADJUSTMENT OF CURRENT OPERATING RECEIVABLES DUE TO IMPAIRMENTS(all adjustments apply to other customers) 30 Jun 2016 2015
Balance as at 1 Jan (+) 11,341,009 7,447,274
Decrease in value due to settlement of receivables (-) -710,191 -1,501,225
Decrease in value due to settlement of receivables (-) -262,188 -79,657
Value adjustment due to impairment (+) 39,163 5,474,617
Balance as at 31 Dec 10,407,793 11,341,009
Most of the Group’s receivables are insured against commercial risks. Trade receivables in the amount of EUR 14,892,333 have been pledged for financial liabilities.

38
six-monthly report
Unaudited Report on the operations of the Impol Group and Impol 2000, d.d., in the first six months of 2016
12. Cash and cash equivalents
30 Jun 2016 31 Dec 2015
Cash in hand and promptly cashable securities 6,884 5,478
Cash in banks and other financial institutions 41,594,279 70,831,876
TOTAL 41,601,163 70,837,354
30 Jun 2016 31 Dec 2015
Current deferred costs or expenses 904,227 86,460
VAT from received advances 46,500 23,514
TOTAL 950,727 109,974
30 Jun 2016 31 Dec 2015
Capital/equity 144,852,127 127,562,535
Minority shareholders’ equity 13,330,061 11,742,184
Called-up capital 4,451,540 4,451,540
Share capital 4,451,540 4,451,540
Capital reserves 10,751,254 10,751,254
Reserves from profit 6,906,327 6,906,327
Reserves for treasury shares and own participating interests 506,406 506,406
Treasury shares and own participating interests (as deductions) -506,406 -506,406
Statutory reserves 1,173,746 1,173,746
Other reserves from profit 5,732,581 5,732,581
Revaluation surplus -382,158 -169,318
Revaluation adjustment of capital -1,087,069 -670,221
Net profit brought forward 93,316,038 74,934,946
Net profit/loss for the financial year 17,566,134 19,615,823
Table 39: Cash and cash equivalents in EUR
Table 40: Current deferred costs and accrued revenue in EUR
Table 41: Capital/equity
The Group has no cash deposits of under three months. Daily deposits are included under Cash in banks.
13. Capital/equity
Revaluation adjustment of capital
Revaluation adjustment of capital as at 30 June 2016 equals to EUR -1,087,069 and decreased in first six months of 2016 by EUR -416,848, which corresponds to an increased due to exchange rate differences that occurred when including financial reports of foreign subsidiaries into consolidated financial statements.
Balance as at 1 Jan 2016 Formed Removed Total as at 31 Dec 2016
Revaluation surplus: + / - + / - - / + =
Revaluation surplus IFI (interest rate swaps) -73,355 -218,211 0 -291,566
Actuarial gains/losses, recognised under reservations for retirement benefits -97.768 0 0 -97.768
TOTAL -171,123 -218,211 0 -389,334
Of which revaluation surplus that belongs to minority shares -1,805 -5,371 0 -7,176
Revaluation surplus that belongs to owners of the parent company -169,318 -212,840 0 -382,158
Revaluation surplus includes changes of value of effective hedges of cash flow (interest rate swaps) in the amount of EUR -218,211.
Table 42: Revaluation surplus in EUR
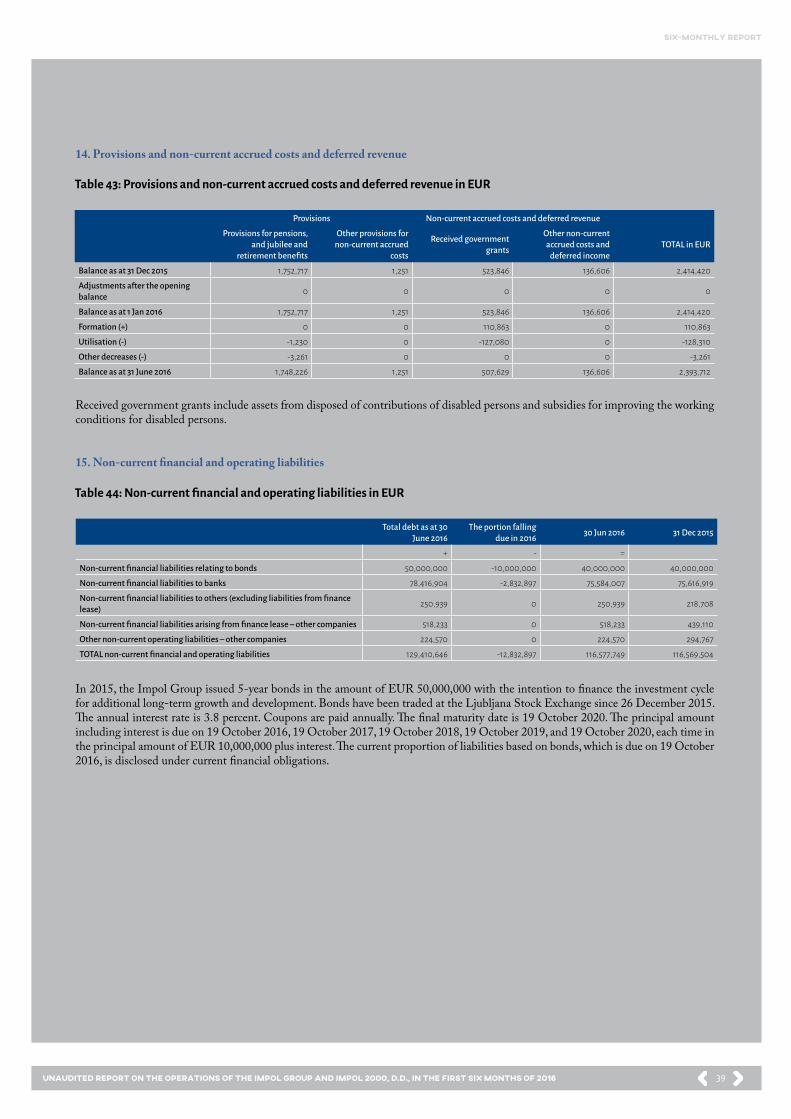
39
six-monthly report
Unaudited Report on the operations of the Impol Group and Impol 2000, d.d., in the first six months of 2016
14. Provisions and non-current accrued costs and deferred revenue
Table 43: Provisions and non-current accrued costs and deferred revenue in EUR
Table 44: Non-current financial and operating liabilities in EUR
Provisions Non-current accrued costs and deferred revenue
Provisions for pensions, and jubilee and
retirement benefits
Other provisions for non-current accrued
costs
Received government grants
Other non-current accrued costs and
deferred incomeTOTAL in EUR
Balance as at 31 Dec 2015 1,752,717 1,251 523,846 136,606 2,414,420
Adjustments after the opening balance 0 0 0 0 0
Balance as at 1 Jan 2016 1,752,717 1,251 523,846 136,606 2,414,420
Formation (+) 0 0 110,863 0 110,863
Utilisation (-) -1,230 0 -127,080 0 -128,310
Other decreases (-) -3,261 0 0 0 -3,261
Balance as at 31 June 2016 1,748,226 1,251 507,629 136,606 2,393,712
Received government grants include assets from disposed of contributions of disabled persons and subsidies for improving the working conditions for disabled persons.
15. Non-current financial and operating liabilities
Total debt as at 30 June 2016
The portion falling due in 2016 30 Jun 2016 31 Dec 2015
+ - =
Non-current financial liabilities relating to bonds 50,000,000 -10,000,000 40,000,000 40,000,000
Non-current financial liabilities to banks 78,416,904 -2,832,897 75,584,007 75,616,919
Non-current financial liabilities to others (excluding liabilities from finance lease) 250,939 0 250,939 218,708
Non-current financial liabilities arising from finance lease – other companies 518,233 0 518,233 439,110
Other non-current operating liabilities – other companies 224,570 0 224,570 294,767
TOTAL non-current financial and operating liabilities 129,410,646 -12,832,897 116,577,749 116,569,504
In 2015, the Impol Group issued 5-year bonds in the amount of EUR 50,000,000 with the intention to finance the investment cycle for additional long-term growth and development. Bonds have been traded at the Ljubljana Stock Exchange since 26 December 2015. The annual interest rate is 3.8 percent. Coupons are paid annually. The final maturity date is 19 October 2020. The principal amount including interest is due on 19 October 2016, 19 October 2017, 19 October 2018, 19 October 2019, and 19 October 2020, each time in the principal amount of EUR 10,000,000 plus interest. The current proportion of liabilities based on bonds, which is due on 19 October 2016, is disclosed under current financial obligations.

40
six-monthly report
Unaudited Report on the operations of the Impol Group and Impol 2000, d.d., in the first six months of 2016
A. Current operating and financial liabilities 30 Jun 2016 31 Dec 2015
Current trade payables – associates 484,708 328,196
Current trade payables – other companies 40,781,267 26,383,195
Current operating liabilities based on advances to other companies 562,489 1,834,256
Other current operating liabilities to other companies 12,633,713 6,438,150
TOTAL current operating liabilities 54,462,177 34,983,797
Current portion of non-current financial liabilities – banks 2,832,897 38,744,072
Current portion of non-current financial liabilities (excluding liabilities from finance lease) – other companies 0 5,045,575
Current portion of non-current financial liabilities – bonds 10,000,000 10,000,000
Current portion of non-current financial liabilities from finance lease – other companies 0 122.515
Current financial liabilities – banks 33,872,519 24,330,535
Current financial liabilities (excluding liabilities from finance lease) – other companies 691,423 454,399
Current financial liabilities from the distribution of profit 6,993 7,052
Current financial liabilities from finance lease – other companies 76,640 3
TOTAL current financial liabilities 47,480,472 78,704,151
TOTAL current financial and operating liabilities 101,942,649 113,687,948
16. Current liabilities
Table 45: Current liabilities in EUR
Table 46: Current accrued expenses and deferred income in EUR
Current accrued costs and deferred revenue 30 Jun 2016 31 Dec 2015
Accrued costs and expenses 2,894,429 688,905
Current deferred income 42,796 37,400
VAT from given advances 238,096 188,018
TOTAL 3,175,321 914,323
Current deferred costs or expenses include costs of interest of issued bonds and deferred income based on accruals and VAT from given advances.
17. Contingent liabilities
The Group has issued guarantees in the amount EUR 3,773,087, mostly in connection with custom duties upon importation of goods and materials and minor liabilities mostly in connection with recalculated VAT at bankruptcy. There is also a lawsuit in progress regard-ing a guarantee issued to a bank in the amount of EUR 1,738,290. The Group estimates that these claims are unjustified, which is why the Group did not form current provisions for these purposes. In case of labour law disputes, the Group has insured possible liabilities through an insurance company.
18. Financial instruments and financial risks
Financial risks of the Impol Group have an important role considering their probability and importance, which is why special attention is paid to these categories of risk. Risks are actively monitored and managed by the Finance and Business Administration Department, the Risk Management Department (RM) and other all other relevant departments at Impol Group companies that operate outside Slovenia.
Liquidity risks
When it comes to liquidity risk management, the Impol Group examines whether it is able to settle all current operating liabilities and whether it is generating a sufficiently large cash flow to settle financing liabilities. Floating weekly and monthly planning of cash flows allows us to establish the liquid asset requirements. Potential shortages of cash are covered by bank credit lines, whereas any short-term surpluses are invested in liquid current financial assets.
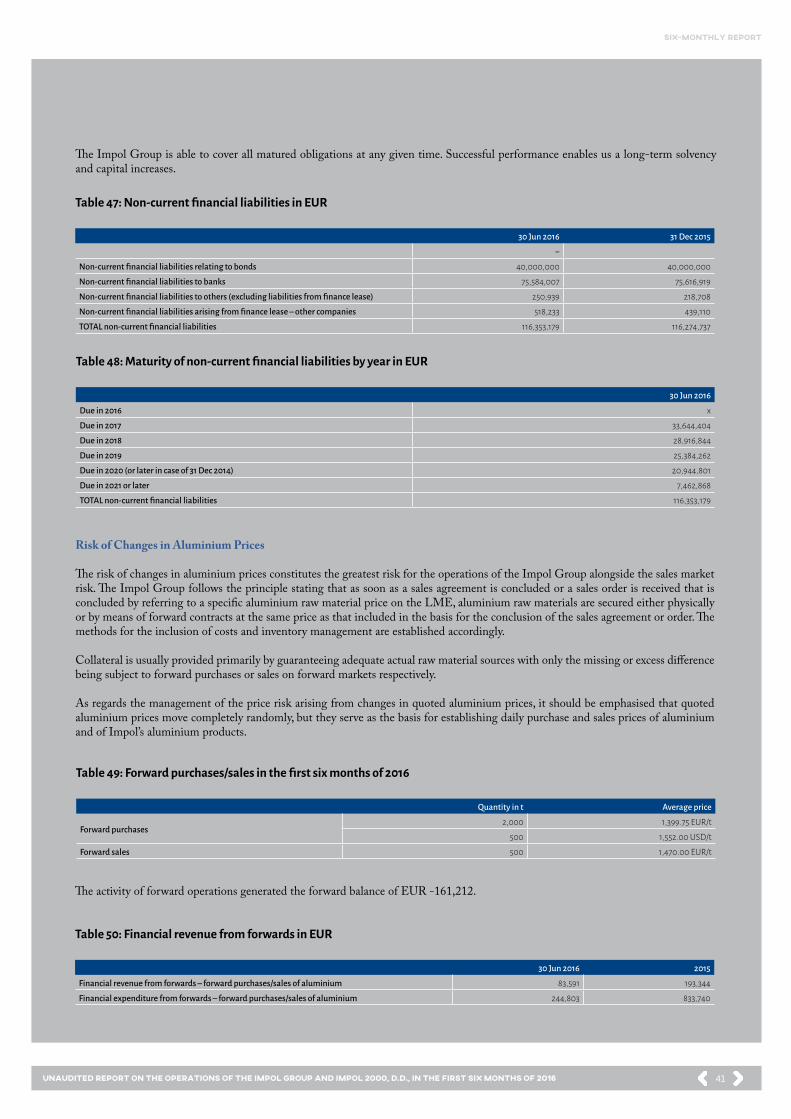
41
six-monthly report
Unaudited Report on the operations of the Impol Group and Impol 2000, d.d., in the first six months of 2016
The Impol Group is able to cover all matured obligations at any given time. Successful performance enables us a long-term solvency and capital increases.
Table 47: Non-current financial liabilities in EUR
Table 48: Maturity of non-current financial liabilities by year in EUR
Table 49: Forward purchases/sales in the first six months of 2016
Table 50: Financial revenue from forwards in EUR
30 Jun 2016 31 Dec 2015
=
Non-current financial liabilities relating to bonds 40,000,000 40,000,000
Non-current financial liabilities to banks 75,584,007 75,616,919
Non-current financial liabilities to others (excluding liabilities from finance lease) 250,939 218,708
Non-current financial liabilities arising from finance lease – other companies 518,233 439,110
TOTAL non-current financial liabilities 116,353,179 116,274,737
30 Jun 2016
Due in 2016 x
Due in 2017 33,644,404
Due in 2018 28,916,844
Due in 2019 25,384,262
Due in 2020 (or later in case of 31 Dec 2014) 20,944,801
Due in 2021 or later 7,462,868
TOTAL non-current financial liabilities 116,353,179
Risk of Changes in Aluminium Prices
The risk of changes in aluminium prices constitutes the greatest risk for the operations of the Impol Group alongside the sales market risk. The Impol Group follows the principle stating that as soon as a sales agreement is concluded or a sales order is received that is concluded by referring to a specific aluminium raw material price on the LME, aluminium raw materials are secured either physically or by means of forward contracts at the same price as that included in the basis for the conclusion of the sales agreement or order. The methods for the inclusion of costs and inventory management are established accordingly.
Collateral is usually provided primarily by guaranteeing adequate actual raw material sources with only the missing or excess difference being subject to forward purchases or sales on forward markets respectively.
As regards the management of the price risk arising from changes in quoted aluminium prices, it should be emphasised that quoted aluminium prices move completely randomly, but they serve as the basis for establishing daily purchase and sales prices of aluminium and of Impol’s aluminium products.
Quantity in t Average price
Forward purchases2,000 1,399.75 EUR/t
500 1,552.00 USD/t
Forward sales 500 1,470.00 EUR/t
30 Jun 2016 2015
Financial revenue from forwards – forward purchases/sales of aluminium 83,591 193,344
Financial expenditure from forwards – forward purchases/sales of aluminium 244,803 833,740
The activity of forward operations generated the forward balance of EUR -161,212.

42
six-monthly report
Unaudited Report on the operations of the Impol Group and Impol 2000, d.d., in the first six months of 2016
Table 51: Balance of open forward position as at 30 June 2016
Table 52: Financial revenue and expenditure from forwards – foreign exchange swaps in EUR
Table 53: Balance of open forward position as at 30 June 2016
Table 54: Overview of USD inflows, outflows and open positions at Impol, d.o.o., in millions of USD
Quantity in t Average price
Open forward positions1,500 1,379.67 EUR/t
500 1,552.00 USD/t
Fair value of these financial instruments as at 30 June 2016 is EUR 155,935.
Foreign exchange risks
The majority of sales and purchasing are performed in the same currency, meaning that changes in foreign exchange rates do not bring about difficulties in these areas.
The Group is, however, exposed to such changes in two major areas, i.e. the purchasing of aluminium raw materials and when taking out loans denominated in a currency that is different than the currency of the company’s accounts.
A major part of raw materials imported by Impol from outside the European Union is purchased in US Dollars, which represents an open FX position of Impol d.o.o.
In 2016, a certain portion of open USD positions was hedged by Impol, d.o.o., in compliance with the foreign exchange risk man-agement policy by using derivative financial instruments, while the remaining part was left unhedged. For hedging, we used simple derivatives like forwards.
30 Jun 2016 2015
Financial revenue from forwards – foreign exchange swaps 28,067 40,400
Financial expenditure from forwards – foreign exchange swaps 5,430 57,887
Foreign exchange forward (FX Forward) – purchase Currency
6,000,000 USD
Fair value of foreign exchange swaps as at 30 June 2016 is EUR -291.566 (as at 31 December 2015 it amounted to EUR -73,355). Contracts fall due on monthly basis, which is between 31 May 2016 and 30 November 2016.
2012 2013 2014 2015 Until 30 Jun 2016
Inflows 19.0 15.0 16.2 18.5 9.6
Outflows 58.0 36.0 45.1 41.5 15.9
The other part of the foreign exchange risk takes place in Serbia with the exchange between EUR/RSD and in Croatia between EUR/HRK.The measure of the Group for reducing the effects of foreign exchange differences in Serbia and Croatia is a reduction of the need for financing the majority of raw materials by executing the majority of sales in the European Union through the company Impol, d.o.o., which than has the aluminium processed. This way, the foreign exchange risk is eliminated.
In the first six months of 2016, the Group generated a negative financial result from foreign exchange differences in the amount of EUR 255,549.
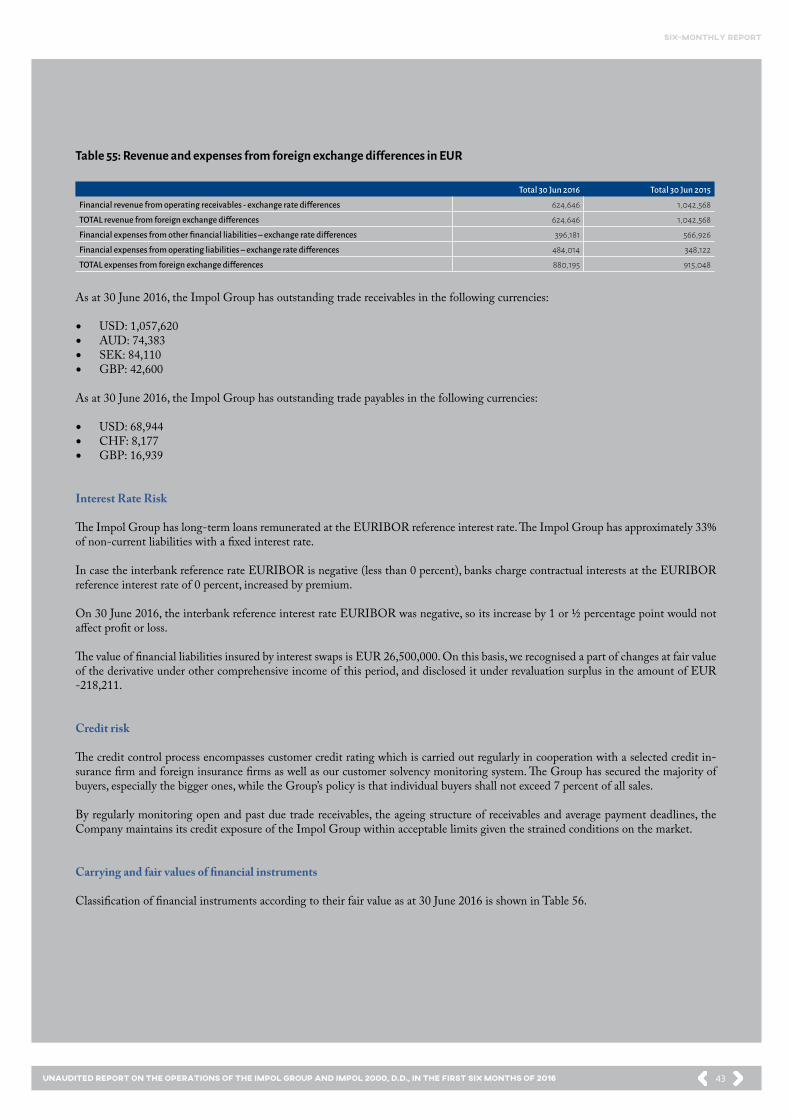
43
six-monthly report
Unaudited Report on the operations of the Impol Group and Impol 2000, d.d., in the first six months of 2016
Table 55: Revenue and expenses from foreign exchange differences in EUR
Total 30 Jun 2016 Total 30 Jun 2015
Financial revenue from operating receivables - exchange rate differences 624,646 1,042,568
TOTAL revenue from foreign exchange differences 624,646 1,042,568
Financial expenses from other financial liabilities – exchange rate differences 396,181 566,926
Financial expenses from operating liabilities – exchange rate differences 484,014 348,122
TOTAL expenses from foreign exchange differences 880,195 915,048
As at 30 June 2016, the Impol Group has outstanding trade receivables in the following currencies:
• USD: 1,057,620• AUD: 74,383• SEK: 84,110• GBP: 42,600
As at 30 June 2016, the Impol Group has outstanding trade payables in the following currencies:
• USD: 68,944• CHF: 8,177• GBP: 16,939
Interest Rate Risk
The Impol Group has long-term loans remunerated at the EURIBOR reference interest rate. The Impol Group has approximately 33% of non-current liabilities with a fixed interest rate.
In case the interbank reference rate EURIBOR is negative (less than 0 percent), banks charge contractual interests at the EURIBOR reference interest rate of 0 percent, increased by premium.
On 30 June 2016, the interbank reference interest rate EURIBOR was negative, so its increase by 1 or ½ percentage point would not affect profit or loss.
The value of financial liabilities insured by interest swaps is EUR 26,500,000. On this basis, we recognised a part of changes at fair value of the derivative under other comprehensive income of this period, and disclosed it under revaluation surplus in the amount of EUR -218,211.
Credit risk
The credit control process encompasses customer credit rating which is carried out regularly in cooperation with a selected credit in-surance firm and foreign insurance firms as well as our customer solvency monitoring system. The Group has secured the majority of buyers, especially the bigger ones, while the Group’s policy is that individual buyers shall not exceed 7 percent of all sales.
By regularly monitoring open and past due trade receivables, the ageing structure of receivables and average payment deadlines, the Company maintains its credit exposure of the Impol Group within acceptable limits given the strained conditions on the market.
Carrying and fair values of financial instruments
Classification of financial instruments according to their fair value as at 30 June 2016 is shown in Table 56.

44
six-monthly report
Unaudited Report on the operations of the Impol Group and Impol 2000, d.d., in the first six months of 2016
Carrying amount Fair value Fair value level
Investments in associates 656,620 656,620 3
Non-current financial investments – available-for-sale assets 506,404 506,404 3
Non-current loans given 392,447 392,447 3
Non-current operating receivables 1,250 1,250 3
Current financial investments, excluding loans 28,108 28,108 3
Current loans given 5,125,882 5,125,882 3
Current operating receivables 89,413,835 89,413,835 3
Cash and cash equivalents 41,601,163 41,601,163 3
Non-current financial liabilities 116,353,179 116,353,179 3
Non-current operating liabilities 224,570 224,570 3
Current financial liabilities 47,188,906 47,188,906 3
Current financial liabilities – fair value of IFI 291,566 291,566 2
Current operating liabilities 54,462,177 54,462,177 3
Table 56: Carrying and fair values of financial instruments in EUR

45
six-monthly report
Unaudited Report on the operations of the Impol Group and Impol 2000, d.d., in the first six months of 2016
FIRST SIX MONTHS
IN NUMBERS
FINANCIAL REPORT FOR IMPOL 2000, d.d.,
FOR THE FIRST SIX MONTHS
OF 2016
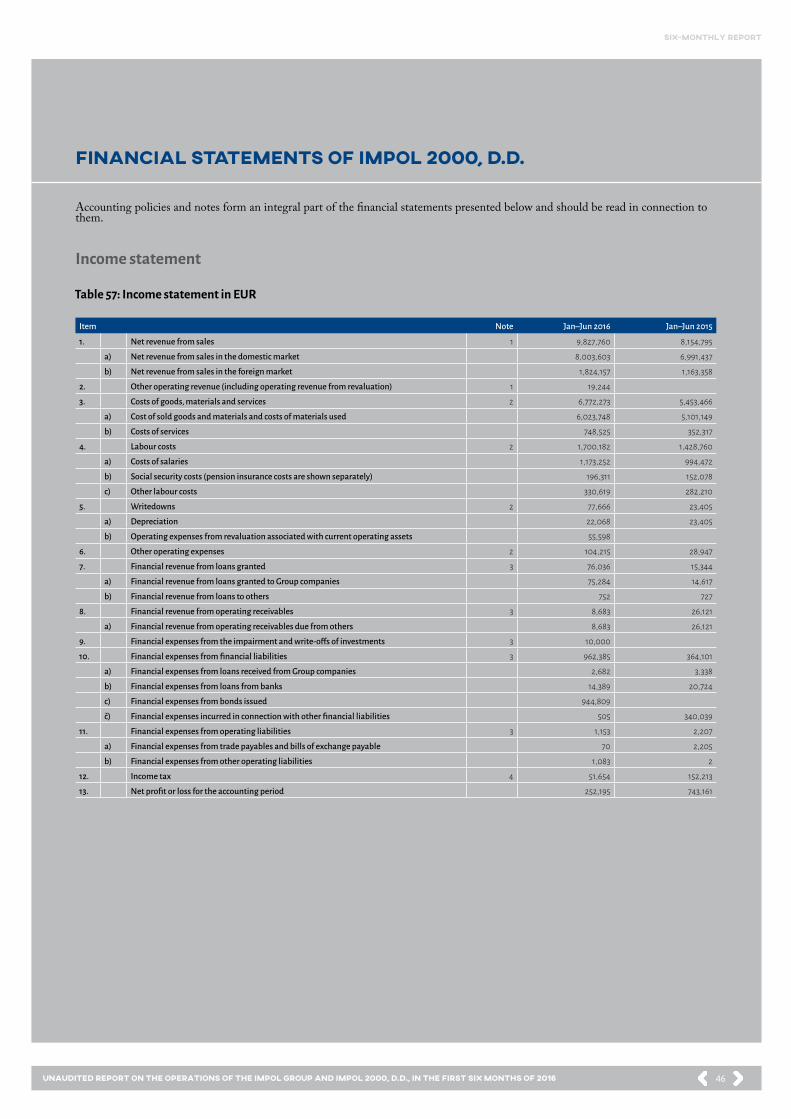
46
six-monthly report
Unaudited Report on the operations of the Impol Group and Impol 2000, d.d., in the first six months of 2016
Accounting policies and notes form an integral part of the financial statements presented below and should be read in connection to them.
Income statement
FINANCIAL STATEMENTS OF IMPOL 2000, D.D.
Table 57: Income statement in EUR
Item Note Jan–Jun 2016 Jan–Jun 2015
1. Net revenue from sales 1 9,827,760 8,154,795
a) Net revenue from sales in the domestic market 8,003,603 6,991,437
b) Net revenue from sales in the foreign market 1,824,157 1,163,358
2. Other operating revenue (including operating revenue from revaluation) 1 19,244
3. Costs of goods, materials and services 2 6,772,273 5,453,466
a) Cost of sold goods and materials and costs of materials used 6,023,748 5,101,149
b) Costs of services 748,525 352,317
4. Labour costs 2 1,700,182 1,428,760
a) Costs of salaries 1,173,252 994,472
b) Social security costs (pension insurance costs are shown separately) 196,311 152,078
c) Other labour costs 330,619 282,210
5. Writedowns 2 77,666 23,405
a) Depreciation 22,068 23,405
b) Operating expenses from revaluation associated with current operating assets 55,598
6. Other operating expenses 2 104,215 28,947
7. Financial revenue from loans granted 3 76,036 15,344
a) Financial revenue from loans granted to Group companies 75,284 14,617
b) Financial revenue from loans to others 752 727
8. Financial revenue from operating receivables 3 8,683 26,121
a) Financial revenue from operating receivables due from others 8,683 26,121
9. Financial expenses from the impairment and write-offs of investments 3 10,000
10. Financial expenses from financial liabilities 3 962,385 364,101
a) Financial expenses from loans received from Group companies 2,682 3,338
b) Financial expenses from loans from banks 14,389 20,724
c) Financial expenses from bonds issued 944,809
č) Financial expenses incurred in connection with other financial liabilities 505 340,039
11. Financial expenses from operating liabilities 3 1,153 2,207
a) Financial expenses from trade payables and bills of exchange payable 70 2,205
b) Financial expenses from other operating liabilities 1,083 2
12. Income tax 4 51,654 152,213
13. Net profit or loss for the accounting period 252,195 743,161

47
six-monthly report
Unaudited Report on the operations of the Impol Group and Impol 2000, d.d., in the first six months of 2016
Table 58: Statement of comprehensive income in EUR
Jan–Jun 2016 Jan–Jun 2015
Net profit or loss for the accounting period 252,195 743,161
Total comprehensive income for the accounting period 252,195 743,161
Table 59: Balance sheet in EUR
Note 30 Jun 2016 31 Dec 2015
A. Fixed assets 69,563,012 68,126,592
I. Intangible assets and non-current deferred costs and accrued revenue 6 147,163 2,601
1. Non-current property rights 147,163 2,601
II. Tangible fixed assets 7 252,317 160,459
1. Production equipment and machinery 109,450 115,537
2. Other machinery and equipment 142,867 44,922
III. Investment property 0
IV. Non-current investments 8 69,135,645 67,935,645
1. Non-current investments, excluding loans 69,135,645 67,935,645
a) Shares and participating interests in the Group 69,135,645 67,935,645
V. Non-current operating receivables 0 0
VI. Deferred tax receivables 27,887 27,887
B. Current assets 40,137,918 39,495,794 I. Assets (groups for disposal) for sale 0
II. Inventories 9 34,842 74,396
1. Products and merchandise 34,842 74,396
2. Advances for inventories 0
III. Current financial investments 10 26,589,796 3,974,518
1. Current loans 26,589,796 3,974,518
a) Current loans to Group companies 22,569,796 3,974,518
b) Current loans to others 4,020,000 0
IV. Current operating receivables 11 2,747,854 2,461,574
1. Current operating receivables due from Group companies 773,777 464,777
2. Current operating receivables due from customers 1,902,690 1,631,510
3. Current operating receivables due from others 71,387 365,287
V. Cash and cash equivalents 12 10,765,426 32,985,306
C. Current deferred costs and accrued revenue 13 31,040 14,161 TOTAL ASSETS 109,731,970 107,636,547
A. Equity 55,360,177 55,107,982 I. Called-up capital 4,451,540 4,451,540
1. Share capital 4,451,540 4,451,540
II. Capital reserves 10,751,254 10,751,254
III. Reserves from profit 6,906,327 6,906,327
1. Statutory reserves 1,173,746 1,173,746
2. Other reserves from profit 5,732,581 5,732,581
IV. Revaluation surplus 0
2. Net profit brought forward 32,998,861 30,285,811
IV. Net profit/loss for the financial year 252,195 2,713,050
B. Provisions and non-current accrued costs and deferred revenue 67,117 67,117 Provisions for pensions and similar liabilities 67,117 67,117
C. Non-current liabilities 13 40,940,123 40,861,000 I. Non-current financial liabilities 40,940,123 40,861,000
1. Non-current financial liabilities to banks 861,000 861,000
2. Non-current financial liabilities from bonds payable 40,000,000 40,000,000
3. Other non-current financial liabilities 79,123 0
II. Non-current operating liabilities 0 0
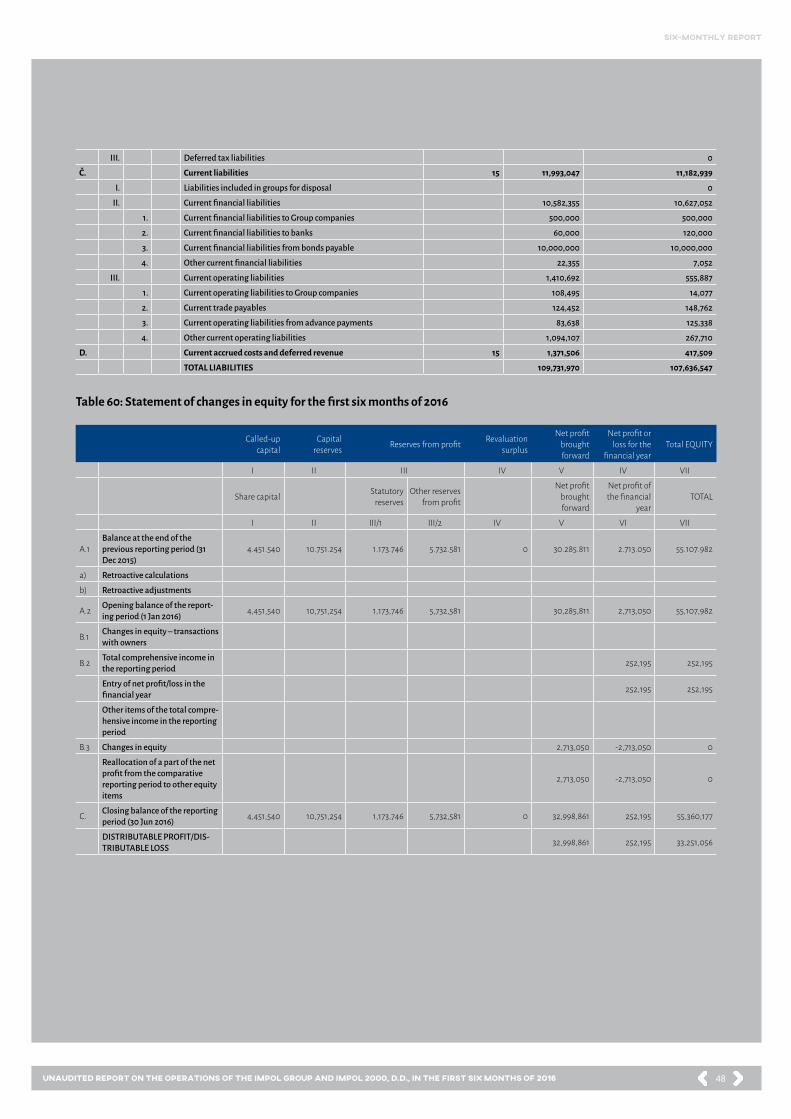
48
six-monthly report
Unaudited Report on the operations of the Impol Group and Impol 2000, d.d., in the first six months of 2016
III. Deferred tax liabilities 0
Č. Current liabilities 15 11,993,047 11,182,939 I. Liabilities included in groups for disposal 0
II. Current financial liabilities 10,582,355 10,627,052
1. Current financial liabilities to Group companies 500,000 500,000
2. Current financial liabilities to banks 60,000 120,000
3. Current financial liabilities from bonds payable 10,000,000 10,000,000
4. Other current financial liabilities 22,355 7,052
III. Current operating liabilities 1,410,692 555,887
1. Current operating liabilities to Group companies 108,495 14,077
2. Current trade payables 124,452 148,762
3. Current operating liabilities from advance payments 83,638 125,338
4. Other current operating liabilities 1,094,107 267,710
D. Current accrued costs and deferred revenue 15 1,371,506 417,509 TOTAL LIABILITIES 109,731,970 107,636,547
Table 60: Statement of changes in equity for the first six months of 2016
Called-up capital
Capital reserves Reserves from profit Revaluation
surplus
Net profit brought forward
Net profit or loss for the
financial yearTotal EQUITY
I II III IV V IV VII
Share capital Statutory reserves
Other reserves from profit
Net profit brought forward
Net profit of the financial
yearTOTAL
I II III/1 III/2 IV V VI VII
A.1Balance at the end of the previous reporting period (31 Dec 2015)
4.451.540 10.751.254 1.173.746 5.732.581 0 30.285.811 2.713.050 55.107.982
a) Retroactive calculations
b) Retroactive adjustments
A.2 Opening balance of the report-ing period (1 Jan 2016) 4,451,540 10,751,254 1,173,746 5,732,581 30,285,811 2,713,050 55,107,982
B.1 Changes in equity – transactions with owners
B.2 Total comprehensive income in the reporting period 252,195 252,195
Entry of net profit/loss in the financial year 252,195 252,195
Other items of the total compre-hensive income in the reporting period
B.3 Changes in equity 2,713,050 -2,713,050 0
Reallocation of a part of the net profit from the comparative reporting period to other equity items
2,713,050 -2,713,050 0
C. Closing balance of the reporting period (30 Jun 2016) 4,451,540 10,751,254 1,173,746 5,732,581 0 32,998,861 252,195 55,360,177
DISTRIBUTABLE PROFIT/DIS-TRIBUTABLE LOSS 32,998,861 252,195 33,251,056
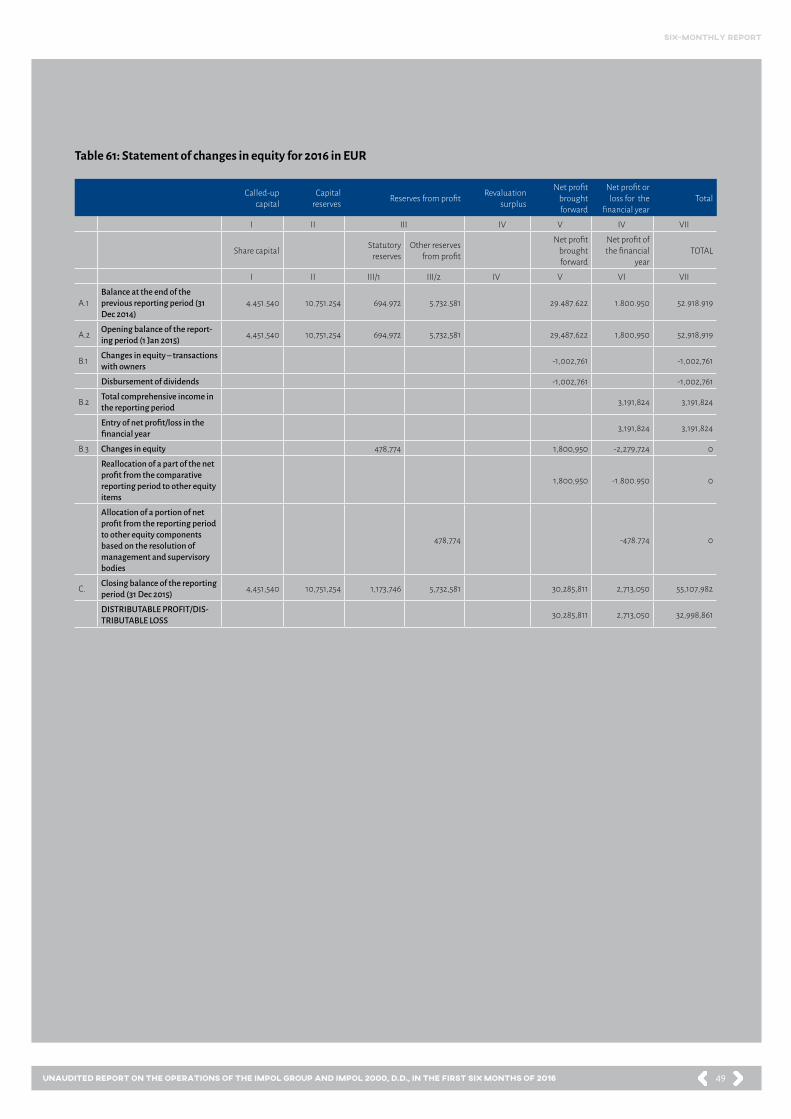
49
six-monthly report
Unaudited Report on the operations of the Impol Group and Impol 2000, d.d., in the first six months of 2016
Table 61: Statement of changes in equity for 2016 in EUR
Called-up capital
Capital reserves Reserves from profit Revaluation
surplus
Net profit brought forward
Net profit or loss for the
financial yearTotal
I II III IV V IV VII
Share capital Statutory reserves
Other reserves from profit
Net profit brought forward
Net profit of the financial
yearTOTAL
I II III/1 III/2 IV V VI VII
A.1Balance at the end of the previous reporting period (31 Dec 2014)
4.451.540 10.751.254 694.972 5.732.581 29.487.622 1.800.950 52.918.919
A.2 Opening balance of the report-ing period (1 Jan 2015) 4,451,540 10,751,254 694,972 5,732,581 29,487,622 1,800,950 52,918,919
B.1 Changes in equity – transactions with owners -1,002,761 -1,002,761
Disbursement of dividends -1,002,761 -1,002,761
B.2 Total comprehensive income in the reporting period 3,191,824 3,191,824
Entry of net profit/loss in the financial year 3,191,824 3,191,824
B.3 Changes in equity 478,774 1,800,950 -2,279,724 0
Reallocation of a part of the net profit from the comparative reporting period to other equity items
1,800,950 -1.800.950 0
Allocation of a portion of net profit from the reporting period to other equity components based on the resolution of management and supervisory bodies
478,774 -478.774 0
C. Closing balance of the reporting period (31 Dec 2015) 4,451,540 10,751,254 1,173,746 5,732,581 30,285,811 2,713,050 55,107,982
DISTRIBUTABLE PROFIT/DIS-TRIBUTABLE LOSS 30,285,811 2,713,050 32,998,861

50
six-monthly report
Unaudited Report on the operations of the Impol Group and Impol 2000, d.d., in the first six months of 2016
Table 62: Cash flow statement in EUR
Item Jan–Jun 2016 Jan–Jun 2015
A. Cash flows from operating activities
a) Items of the Income Statement 1,330,425 1,130,668
Operating revenue (except from revaluation) and financial revenue from operating receivables 9,855,687 8,194,054
Operating revenue excluding depreciation (except from revaluation) and financial expenses from operating liabilities -8,473,608 -6,911,172
Income and other tax not included in operating expenses -51,654 -152,214
b) Changes to net operating current assets (and accruals and deferrals, provisions and deferred tax receivables and liabilities) of the Balance Sheet operating items 495,984 4,232
Opening less closing operating receivables -286,898 -248,860
Opening less closing deferred costs and accrued revenue -16,879 -64,042
Opening less closing inventories 39,554 3,962
Closing less opening operating liabilities 855,234 278,319
Closing less opening accrued costs and deferred revenue and provisions -95,027 34,853
c) Net cash from operating activities (a+b) 1,826,409 1,134,900
B. Cash flows from investing activities
a) Cash proceeds from investing activities 1,821,006 0
Inflows from interest and participation in others` profits relating to investing activities 21,006
Cash proceeds from disposal of current investments 1,800,000
b) Cash payments from investing activities -25,785,885 -1,833,365
Cash disbursements to acquire intangible assets -144,930 330
Cash disbursements to acquire tangible fixed assets -15,677 -13,695
Cash disbursements to acquire non-current financial investments -1,210,000
Cash disbursements to acquire current financial investments -24,415,278 -1,820,000
c) Net cash from investing activities (a+b) -23,964,879 -1,833,365
C. Cash flows from financing activities
a) Cash proceeds from financing activities 0 981,000
Cash proceeds from increase in non-current financial liabilities 0 981,000
c) Cash payments from financing activities -81,410 -1,074,288
Interest paid on financing activities -18,005 -364,101
Cash repayments of non-current financial liabilities -3,346
Cash repayments of current financial liabilities -60,000 -710,187
Dividends and other profit shares paid -59
c) Net cash from financing activities (a+b) -81,410 -93,288
Č. Closing balance of cash 10,765,426 816,505
a) Net cash flow for the period -22,219,880 -791,753
b) Opening balance of cash 32,985,306 1,608,258
Notes to the Financial Statements
Reporting Entity
In accordance with the Companies Act, Impol 2000, d.d., (hereinafter also the company), with the head office at Slovenska Bistrica, Partizanska ulica 38, is a large public limited company, and is obliged to undergo regular annual audit. The company is classified un-der the activity code 70.100 – company management. The company’s share capital in the amount of EUR 4,451,540 is divided into 1,066,767 registered pro rata shares that are not traded in the organized securities market. The shares are owned by 948 shareholders.
Below is the presentation of financial statements of Impol 2000, d.d., for the first six months of 2016.
Statement of Compliance with IFRS
The Board of Directors and Executive Directors confirmed the financial statement on 19 September 2016.
Financial statements of Impol 2000, d.d., are composed in accordance with the International Financial Reporting Standards (IFRS), as adopted by the European Union, and with the notes adopted by the IFRS Interpretations Committee (IFRIC) and by the European Union, and in accordance with the provisions of the Companies Act (ZGD).
51
six-monthly report
Unaudited Report on the operations of the Impol Group and Impol 2000, d.d., in the first six months of 2016
This Six-Monthly Report has been prepared in accordance with the IAS 34 – Interim Financial Reporting. In the preparation of the financial statements for the period January–June 2016 the same accounting policies have been used as in the preparation of the financial statements for 2015.
On the balance sheet date, there are no differences between the applied IFRS and the IFRS adopted by the European Union in account-ing guidelines of Impol, d.d., as regards the process of confirming standards in the European Union. Inter-annual financial statements of Impol 2000, d.d., were not audited.
Bases for the Composition of Financial Statements
Financial statements of the company Impol 2000, d.d., observe historical cost.
Functional and Presentation Currency
Financial statements in this report are given in EUR, no cents, and EUR is also the functional currency of the company. For the pur-poses of rounding value data, there may be insignificant differences in sums found in tables.
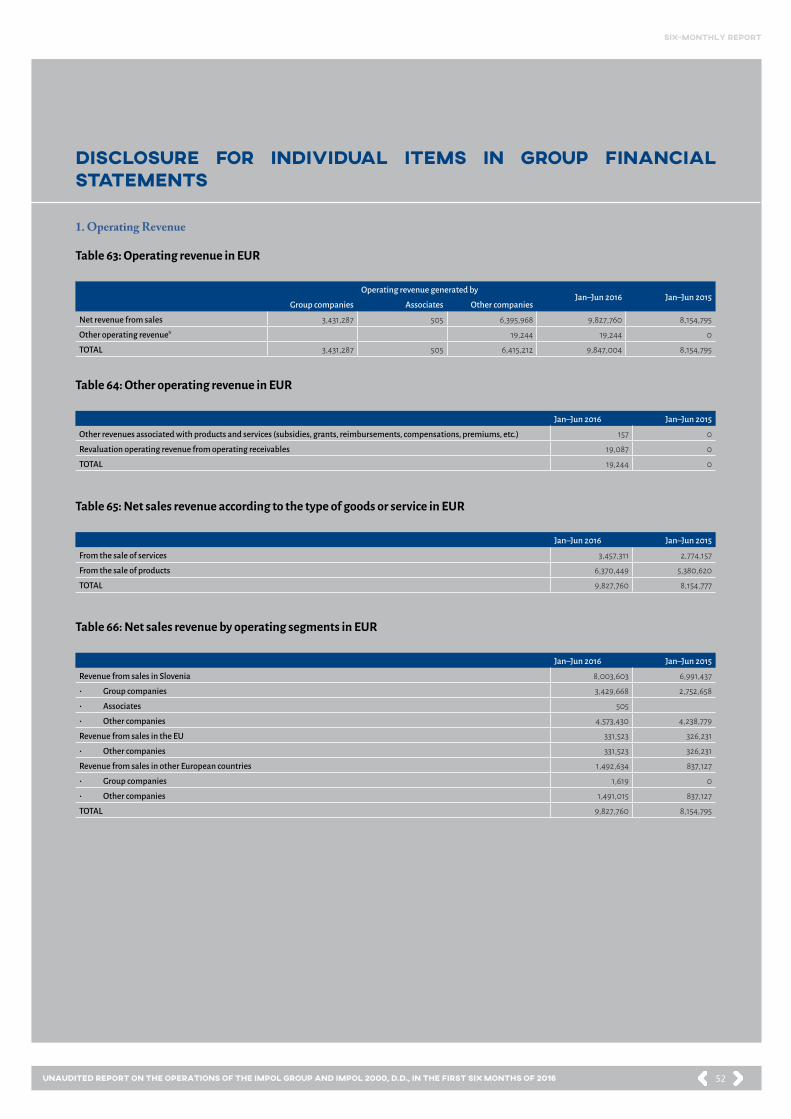
52
six-monthly report
Unaudited Report on the operations of the Impol Group and Impol 2000, d.d., in the first six months of 2016
1. Operating Revenue
DISCLOSURE FOR INDIVIDUAL ITEMS IN GROUP FINANCIAL STATEMENTS
Table 63: Operating revenue in EUR
Table 64: Other operating revenue in EUR
Table 65: Net sales revenue according to the type of goods or service in EUR
Table 66: Net sales revenue by operating segments in EUR
Operating revenue generated by Jan–Jun 2016 Jan–Jun 2015
Group companies Associates Other companies
Net revenue from sales 3,431,287 505 6,395,968 9,827,760 8,154,795
Other operating revenue* 19,244 19,244 0
TOTAL 3,431,287 505 6,415,212 9,847,004 8,154,795
Jan–Jun 2016 Jan–Jun 2015
Other revenues associated with products and services (subsidies, grants, reimbursements, compensations, premiums, etc.) 157 0
Revaluation operating revenue from operating receivables 19,087 0
TOTAL 19,244 0
Jan–Jun 2016 Jan–Jun 2015
From the sale of services 3,457,311 2,774,157
From the sale of products 6,370,449 5,380,620
TOTAL 9,827,760 8,154,777
Jan–Jun 2016 Jan–Jun 2015
Revenue from sales in Slovenia 8,003,603 6,991,437
• Group companies 3,429,668 2,752,658
• Associates 505
• Other companies 4,573,430 4,238,779
Revenue from sales in the EU 331,523 326,231
• Other companies 331,523 326,231
Revenue from sales in other European countries 1,492,634 837,127
• Group companies 1,619 0
• Other companies 1,491,015 837,127
TOTAL 9,827,760 8,154,795
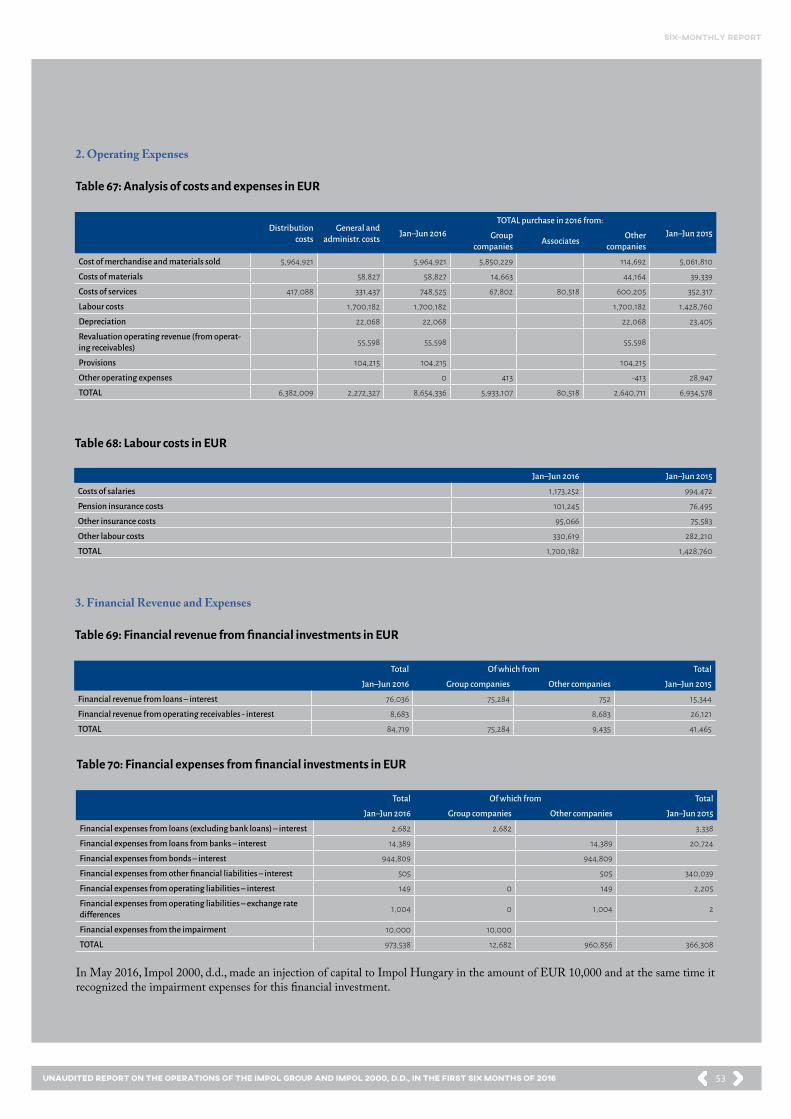
53
six-monthly report
Unaudited Report on the operations of the Impol Group and Impol 2000, d.d., in the first six months of 2016
2. Operating Expenses
Distributioncosts
General and administr. costs Jan–Jun 2016
TOTAL purchase in 2016 from:Jan–Jun 2015Group
companies Associates Other companies
Cost of merchandise and materials sold 5,964,921 5,964,921 5,850,229 114,692 5,061,810
Costs of materials 58,827 58,827 14,663 44,164 39,339
Costs of services 417,088 331,437 748,525 67,802 80,518 600,205 352,317
Labour costs 1,700,182 1,700,182 1,700,182 1,428,760
Depreciation 22,068 22,068 22,068 23,405
Revaluation operating revenue (from operat-ing receivables) 55,598 55,598 55,598
Provisions 104,215 104,215 104,215
Other operating expenses 0 413 -413 28,947
TOTAL 6,382,009 2,272,327 8,654,336 5,933,107 80,518 2,640,711 6,934,578
Table 67: Analysis of costs and expenses in EUR
Table 68: Labour costs in EUR
Table 69: Financial revenue from financial investments in EUR
Table 70: Financial expenses from financial investments in EUR
Jan–Jun 2016 Jan–Jun 2015
Costs of salaries 1,173,252 994,472
Pension insurance costs 101,245 76,495
Other insurance costs 95,066 75,583
Other labour costs 330,619 282,210
TOTAL 1,700,182 1,428,760
3. Financial Revenue and Expenses
Total Of which from Total
Jan–Jun 2016 Group companies Other companies Jan–Jun 2015
Financial revenue from loans – interest 76,036 75,284 752 15,344
Financial revenue from operating receivables - interest 8,683 8,683 26,121
TOTAL 84,719 75,284 9,435 41,465
Total Of which from Total
Jan–Jun 2016 Group companies Other companies Jan–Jun 2015
Financial expenses from loans (excluding bank loans) – interest 2,682 2,682 3,338
Financial expenses from loans from banks – interest 14,389 14,389 20,724
Financial expenses from bonds – interest 944,809 944,809
Financial expenses from other financial liabilities – interest 505 505 340,039
Financial expenses from operating liabilities – interest 149 0 149 2,205
Financial expenses from operating liabilities – exchange rate differences 1,004 0 1,004 2
Financial expenses from the impairment 10,000 10,000
TOTAL 973,538 12,682 960,856 366,308
In May 2016, Impol 2000, d.d., made an injection of capital to Impol Hungary in the amount of EUR 10,000 and at the same time it recognized the impairment expenses for this financial investment.

54
six-monthly report
Unaudited Report on the operations of the Impol Group and Impol 2000, d.d., in the first six months of 2016
Table 71: Financial expenses from operating liabilities in EUR
TotalJan–Jun 2016
TotalJan–Jun 2015
Financial expenses from liabilities to suppliers – interests 70 2,205
Financial expenses from other operating liabilities – interest 79
Financial expenses from other operating liabilities – exchange rate differences 1,004 2
TOTAL 1,153 2,207
Table 72: Income tax in EUR
Table 73: Earnings per share in EUR
Jan–Jun 2016 Jan–Jun 2015
Revenues determined under accounting regulations 9,931,723 8,196,260
Taxable revenues 9,931,723 8,196,260
Expenses determined under accounting regulations 9,627,874 7,300,886
Expenses recognised for tax purposes 9,627,874 7,300,886
DIFFERENCE BETWEEN EXPENSES AND REVENUES RECOGNISED FOR TAX PURPOSES 303,849 895,374
TAX BASE 303,849 895,374
TAX LOSS 0 0
Decrease in tax base and tax relief (not exceeding the tax base) (-) -1
TAXABLE BASE 303,849 895,373
TAX (17%) 51,654 152,213
30 Jun 2016 30 Jun 2015
Profit or loss attributable to owners of the parent company 252,195 743,161
Weighted average of the number of regular shares 1,066,767 1,066,767
Basic earnings per share (in EUR) 0.24 0.70
Regular shares as at 1 Jan 1,066,767 1,066,767
Effect of own shares 0 0
Weighted average of the number of regular shares as at 30 Jun 1,066,767 1,066,767
Effect of own shares 0 0
Weighted average of the number of regular shares as at 30 Jun 1,066,767 1,066,767
4. Income tax
6. Net Earnings per Share
Basic earnings per share is calculated by dividing net earnings attributable to shareholders by the weighted average of the number of regular shares during the year, excluding the average number of own shares.
Because the company has no preference shares or bonds that could be converted to shares, the diluted earnings per share is the same as the basic earnings per share.
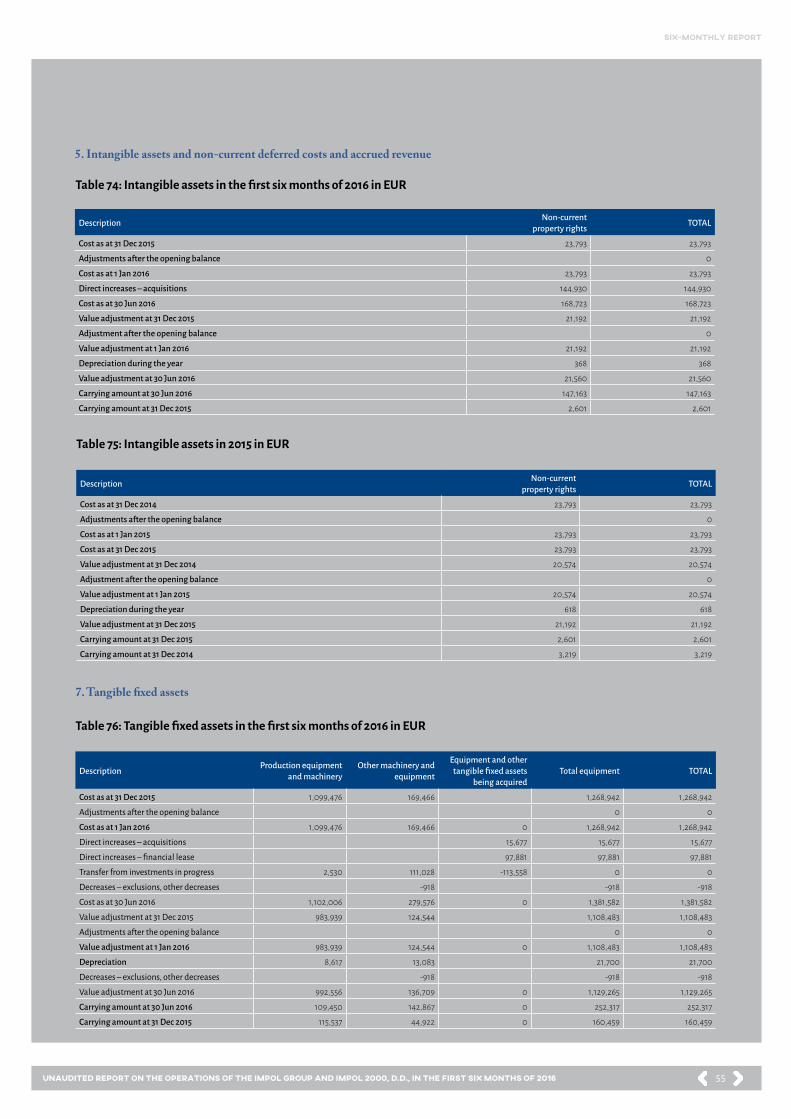
55
six-monthly report
Unaudited Report on the operations of the Impol Group and Impol 2000, d.d., in the first six months of 2016
Table 74: Intangible assets in the first six months of 2016 in EUR
5. Intangible assets and non-current deferred costs and accrued revenue
Description Non-current property rights TOTAL
Cost as at 31 Dec 2015 23,793 23,793
Adjustments after the opening balance 0
Cost as at 1 Jan 2016 23,793 23,793
Direct increases – acquisitions 144,930 144,930
Cost as at 30 Jun 2016 168,723 168,723
Value adjustment at 31 Dec 2015 21,192 21,192
Adjustment after the opening balance 0
Value adjustment at 1 Jan 2016 21,192 21,192
Depreciation during the year 368 368
Value adjustment at 30 Jun 2016 21,560 21,560
Carrying amount at 30 Jun 2016 147,163 147,163
Carrying amount at 31 Dec 2015 2,601 2,601
Description Non-current property rights TOTAL
Cost as at 31 Dec 2014 23,793 23,793
Adjustments after the opening balance 0
Cost as at 1 Jan 2015 23,793 23,793
Cost as at 31 Dec 2015 23,793 23,793
Value adjustment at 31 Dec 2014 20,574 20,574
Adjustment after the opening balance 0
Value adjustment at 1 Jan 2015 20,574 20,574
Depreciation during the year 618 618
Value adjustment at 31 Dec 2015 21,192 21,192
Carrying amount at 31 Dec 2015 2,601 2,601
Carrying amount at 31 Dec 2014 3,219 3,219
Table 75: Intangible assets in 2015 in EUR
7. Tangible fixed assets
Description Production equipment and machinery
Other machinery and equipment
Equipment and other tangible fixed assets
being acquiredTotal equipment TOTAL
Cost as at 31 Dec 2015 1,099,476 169,466 1,268,942 1,268,942
Adjustments after the opening balance 0 0
Cost as at 1 Jan 2016 1,099,476 169,466 0 1,268,942 1,268,942
Direct increases – acquisitions 15,677 15,677 15,677
Direct increases – financial lease 97,881 97,881 97,881
Transfer from investments in progress 2,530 111,028 -113,558 0 0
Decreases – exclusions, other decreases -918 -918 -918
Cost as at 30 Jun 2016 1,102,006 279,576 0 1,381,582 1,381,582
Value adjustment at 31 Dec 2015 983,939 124,544 1,108,483 1,108,483
Adjustments after the opening balance 0 0
Value adjustment at 1 Jan 2016 983,939 124,544 0 1,108,483 1,108,483
Depreciation 8,617 13,083 21,700 21,700
Decreases – exclusions, other decreases -918 -918 -918
Value adjustment at 30 Jun 2016 992,556 136,709 0 1,129,265 1,129,265
Carrying amount at 30 Jun 2016 109,450 142,867 0 252,317 252,317
Carrying amount at 31 Dec 2015 115,537 44,922 0 160,459 160,459
Table 76: Tangible fixed assets in the first six months of 2016 in EUR

56
six-monthly report
Unaudited Report on the operations of the Impol Group and Impol 2000, d.d., in the first six months of 2016
Description Production equipment and machinery
Other machinery and equipment
Equipment and other tangible fixed assets
being acquiredTotal equipment TOTAL
Cost as at 31 Dec 2014 1,099,476 175,258 1,274,734 1,274,734
Adjustments after the opening balance 0 0
Cost as at 1 Jan 2015 1,099,476 175,258 0 1,274,734 1,274,734
Direct increases – acquisitions 24,315 24,315 24,315
Transfer from investments in progress 25,371 -25,371 0 0
Transfer between Group companies – acquisition 1,056 1,056 1,056
Decreases – exclusions, other decreases -31,163 -31,163 -31,163
Cost as at 31 Dec 2015 1,099,476 169,466 0 1,268,942 1,268,942
Value adjustment at 31 Dec 2014 954,152 136,987 1,091,139 1,091,139
Adjustments after the opening balance 0 0
Value adjustment at 1 Jan 2015 954,152 136,987 0 1,091,139 1,091,139
Depreciation 29,787 18,703 48,490 48,490
Decreases – exclusions, other decreases -31,146 -31,146 -31,146
Value adjustment at 31 Dec 2015 983,939 124,544 0 1,108,483 1,108,483
Carrying amount at 31 Dec 2015 115,537 44,922 0 160,459 160,459
Carrying amount at 31 Dec 2014 145,324 38,271 0 183,595 183,595
Table 77: Tangible fixed assets in 2015 in EUR
All disclosed tangible assets (excluding assets under finance lease) are the property of Impol 2000, d.d., and are free from all encumbrances.
8. Non-current financial investments
NON-CURRENT FINANCIAL INVESTMENTS Cost as at 30 JunNon-current financial investments in: Value adjustment
as at 30 Jun impairment
(Account 069, 079)
Carrying amount
Group companies Associates 30 Jun 2016 31 Dec 2015
= + - =
Non-current financial investments (+) 69,182,017 69,147,369 34,648 -46,372 69,135,645 67,935,645
Current par of non-current investments (+) 0 0 0
TOTAL NON-CURRENT FINANCIAL INVESTMENTS 69,182,017 69,147,369 34,648 -46,372 69,135,645 67,935,645
2016Of which revaluation of
non-current financial invest. to: 2015Group companies
= +
Revaluation of non-current financial investments due to impairments charged to financial expenses 10,000 10,000 36,371
Table 78: Non-current financial investments in EUR
Table 79: Revaluation of non-current financial investments in EUR
In March 2016, Impol 2000, d.d., purchased 35% of the non-controlling shares in Impol-TLM, d.o.o., and it thus became 100% owner. The compensation to acquire the 35% share amounted to EUR 1.2 million.
A financial investment in the amount of EUR 100,000, which relates to the participating interest of Impol 2000, d.d., in the subsidiary Rondal, d.o.o., is pledged as security for liability relating to the long-term received loan, which amounts to EUR 921,000 as at 30 June 2015. The financial investment into the capital of Impol, d.o.o., (97.5387-percent ownership share) in the amount of EUR 67,588,863 is also pledged in the form of a given guarantee, and is intended for liabilities of Impol, d.o.o., to banks.
In May 2016, Impol 2000, d.d., made an injection of capital to Impol Hungary in the amount of EUR 10,000 and at the same time it recognized the impairment expenses for this financial investment because it was estimated that the carrying amount of the investment exceeded its recoverable amount (i.e. the current value of the future cash flows).

57
six-monthly report
Unaudited Report on the operations of the Impol Group and Impol 2000, d.d., in the first six months of 2016
Table 80: Trend in investments to subsidiaries and associates in EUR
Jan–Jun 2016 2015
Balance as at 1 Jan 2016 67,935,645 67,970,271
Acquisition of 35% of non-controlling share at Impol-TLM 1,200,0000 1,745
Injection of capital in Impol Hungary 10,000
Impairment of investment in Impol Hungary -10,000 -36,372
Balance as at 31 June 2016 69,135,645 67,935,645
All long-term financial investments are distributed to the group »financial assets available for sale« and are measured by acquisition cost.
The company Impol 2000, d.d., as the parent company, prepares the consolidated financial statements for the above-presented compa-nies.
9. Inventories of Goods
30 Jun 201631 Dec 2015
Cost (+) Revaluation of value due to impairment of inven-tories (-) Carrying amount
Merchandise 34,842 34,842 74,396
TOTAL 34,842 0 34,842 74,396
Table 81: Inventories of Goods in EUR
10. Current financial investments
Cost as at 30 JunCurrent financial investments in: Value adjustment
due to impair-ment
Carrying amount
30 Jun 2016 31 Dec 2015Group companies Other companies
= + - =
TOTAL current financial investments excluding loans 0 0 0 0 0 0
Current loans granted (including bonds) 22,589,796 22,569,796 20,000 22,589,796 3,974,518
Current deposits 4,000,000 4,000,000 4,000,000 0
TOTAL current loans granted 26,589,796 22,569,796 4,020,000 0 26,589,796 3,974,518
Current unpaid called-up capital 0 0 0
TOTAL CURRENT FINANCIAL INVESTMENTS 26,589,796 22,569,796 4,020,000 0 26,589,796 3,974,518
Group companies
Loans as at 1 Jan 2016 3,974,518
New loans (+) 20,415,278
Refunds (-) 1,800,000
Loans granted as at 30 June 2016 22,589,796
Table 82: Current financial investments in EUR
Table 83: Trend in loans granted in EUR
All loans granted to associates shall bear interest at an established interest rate, increased by one percentage point. All loans are secured with a bill of exchange.
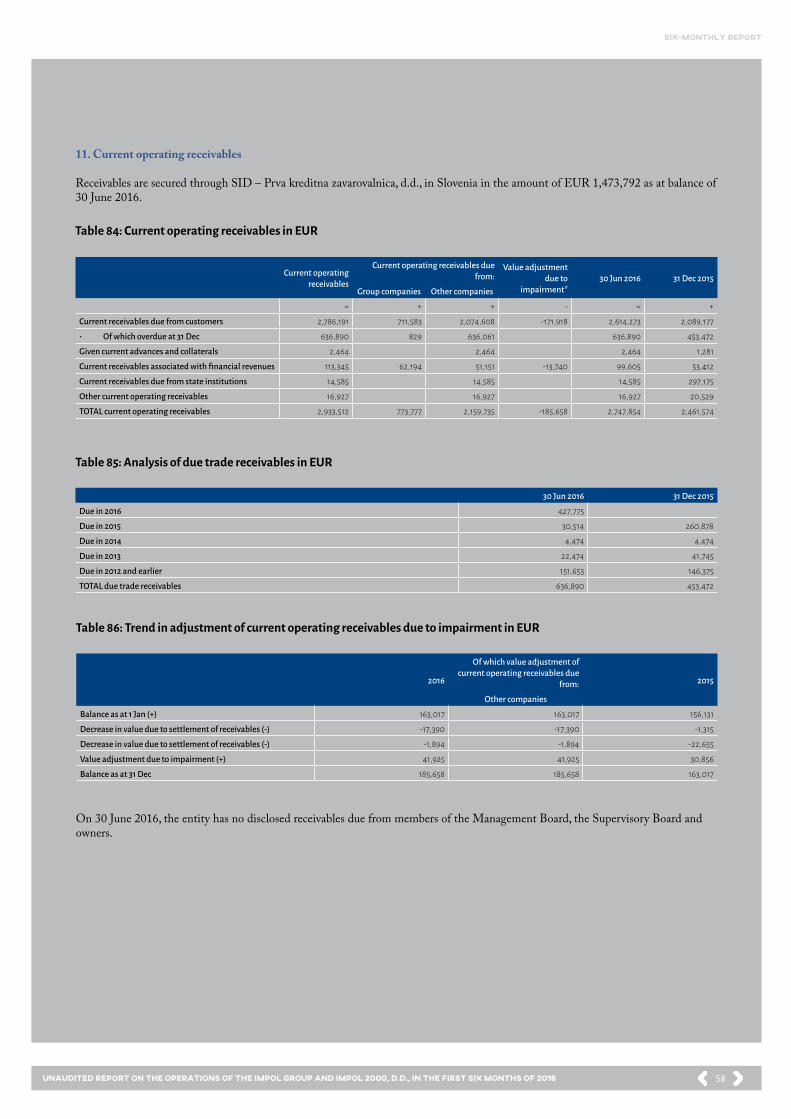
58
six-monthly report
Unaudited Report on the operations of the Impol Group and Impol 2000, d.d., in the first six months of 2016
Table 84: Current operating receivables in EUR
Table 85: Analysis of due trade receivables in EUR
11. Current operating receivables
Receivables are secured through SID – Prva kreditna zavarovalnica, d.d., in Slovenia in the amount of EUR 1,473,792 as at balance of 30 June 2016.
Current operating receivables
Current operating receivables duefrom:
Value adjustment due to
impairment*30 Jun 2016 31 Dec 2015
Group companies Other companies
= + + - = +
Current receivables due from customers 2,786,191 711,583 2,074,608 -171,918 2,614,273 2,089,177
• Of which overdue at 31 Dec 636,890 829 636,061 636,890 453,472
Given current advances and collaterals 2,464 2,464 2,464 1,281
Current receivables associated with financial revenues 113,345 62,194 51,151 -13,740 99,605 53,412
Current receivables due from state institutions 14,585 14,585 14,585 297,175
Other current operating receivables 16,927 16,927 16,927 20,529
TOTAL current operating receivables 2,933,512 773,777 2,159,735 -185,658 2,747,854 2,461,574
30 Jun 2016 31 Dec 2015
Due in 2016 427,775
Due in 2015 30,514 260,878
Due in 2014 4,474 4,474
Due in 2013 22,474 41,745
Due in 2012 and earlier 151,653 146,375
TOTAL due trade receivables 636,890 453,472
Table 86: Trend in adjustment of current operating receivables due to impairment in EUR
2016
Of which value adjustment of current operating receivables due
from: 2015
Other companies
Balance as at 1 Jan (+) 163,017 163,017 156,131
Decrease in value due to settlement of receivables (-) -17,390 -17,390 -1,315
Decrease in value due to settlement of receivables (-) -1,894 -1,894 -22,655
Value adjustment due to impairment (+) 41,925 41,925 30,856
Balance as at 31 Dec 185,658 185,658 163,017
On 30 June 2016, the entity has no disclosed receivables due from members of the Management Board, the Supervisory Board and owners.

59
six-monthly report
Unaudited Report on the operations of the Impol Group and Impol 2000, d.d., in the first six months of 2016
12. Cash and cash equivalents
30 Jun 2016 31 Dec 2015
Cash in hand and promptly cashable securities 256 296
Cash in banks and other financial institutions 10,765,170 32,985,010
TOTAL 10,765,426 32,985,306
30 Jun 2016 31 Dec 2015
Current deferred costs or expenses 22,907 12,562
VAT from received advances 8,133 1,599
TOTAL 31,040 14,161
Table 87: Cash and cash equivalents in EUR
Table 88: Current deferred costs and accrued revenue in EUR
Table 90: Current deferred costs and accrued revenue in EUR
Current deferred costs or expenses mainly refer to the costs of professional literature paid in advance.
Table 89: Non-current financial and operating liabilities in EUR
15. Non-current financial and operating liabilities
Total debt as at 30 June 2016
The portion falling due in 2016 30 Jun 2016 31 Dec 2015
+ - =
Non-current financial liabilities relating to bonds 50,000,000 -10,000,000 40,000,000 40,000,000
Non-current financial liabilities to banks 921,000 -60,000 861,000 861,000
Non-current financial liabilities arising from finance lease – other companies 79,123 79,123 0
TOTAL non-current financial and operating liabilities 51,000,123 -10,060,000 40,940,123 40,861,000
30 Jun 2016 31 Dec 2015
Due in 2017 10,883,805 10,861,000
Due in 2018 10,031,872 10,000,000
Due in 2019 10,022,805 10,000,000
Due in 2020 10,001,641 10,000,000
Due in 2021 0
Due in 2022 or later x
TOTAL non-current financial and operating liabilities 40,940,123 40,861,000
As at 30 June 2016, the company Impol 2000, d.d., has a long-term loan open in the amount of EUR 921,000. The loan falls due on 25 March 2017. It is secured with bills of exchange and pledge of business share in the company Rondal, d.o.o. The interest rate is the 6-month EURIBOR + 3.0 percent annually.

60
six-monthly report
Unaudited Report on the operations of the Impol Group and Impol 2000, d.d., in the first six months of 2016
No. Date of maturity of liability Payment of coupon in EUR (interest) Payment of principal value in EUR Total payment in EUR
1 19 October 2016 1,900,000.00 10,000,000.00 11,900,000.00
2 19 October 2017 1,520,000.00 10,000,000.00 11,520,000.00
3 19 October 2018 1,140,000.00 10,000,000.00 11,140,000.00
4 19 October 2019 760,000.00 10,000,000.00 10,760,000.00
5 19 October 2020 380,000.00 10,000,000.00 10,380,000.00
Total 5,700,000.00 50,000,000.00 55,700,000.00
Table 91: Depreciation plan of issued bonds in EUR
Issued bonds
In 2015, the Impol 2000, d.d., for the first time issued five-year bonds in the amount of EUR 50 million with the intention to finance the investment cycle for additional long-term growth and development. The interest rate is 3.8-percent annually. Coupons are paid annually. The final date of maturity is 19 October 2020.
Liabilities for issued bonds relate to the bonds listed as IM01. The parent company issued the bonds in the total nominal value of EUR 50,000,000. The total issue of bonds comprises 50,000 denominations of EUR 1,000.
The interest rate for the issued bonds is stable and amounts to 3.80 percent annually. Bonds have been traded on the Ljubljana Stock Exchange.
Table 92: Non-current financial liabilities arising from finance lease in EUR
14. Non-current financial and operating liabilities
Lessor,No. of contract
Debt balance as at 1 Jan 2016
New financialleases
Attribution of interest
to principal
Repayments in the current year
Debt balance as at 30 Jun 2016
Of which the proportion falling due:Security
leasingin 2016 after 1 Jan 2017
(analytically by agreements) + + + - = - =
Porsche Leasing 0 97,831 -3,346 94,485 -15,362 79,123 Equipment
TOTAL 0 97,831 0 -3,346 94,485 -15,362 79,123

61
six-monthly report
Unaudited Report on the operations of the Impol Group and Impol 2000, d.d., in the first six months of 2016
Current operating and financial liabilities 30 Jun 2016 31 Dec 2015
Current trade payables – Group companies 107,653 13,015
Current trade payables – associates 58,730 12,993
Current trade payables – other companies 65,722 135,769
Current operating liabilities based on advances to other companies 83,638 125,338
Other current operating liabilities – Group companies 842 1,062
Other current operating liabilities to other companies 1,094,107 267,710
TOTAL current operating liabilities 1,410,692 555,887
Current portion of non-current financial liabilities – banks 60,000 120,000
Current portion of non-current financial liabilities – bonds 10,000,000 10,000,000
Current financial liabilities (excluding liabilities from finance lease) – Group companies 500,000 500,000
Current financial liabilities from the distribution of profit 6,993 7,052
Current financial liabilities from finance lease – other companies 15,362 0
TOTAL current financial liabilities 10,582,355 10,627,052
TOTAL current financial and operating liabilities 11,993,047 11,182,939
15. Current liabilities
Table 94: Current operating and financial liabilities
Table 95: Analysis of overdue trade payables in EUR
30 Jun 2016 31 Dec 2015 31. 12. 2015
Due in 2016 504 x
Due in 2015 40,658
TOTAL trade payables already due 504 40,658
Table 93: Non-current financial liabilities arising from finance lease in EUR
Lender, No. of contract
Type of loan (with respect to the lender) Interest rate in % Maturity date Debt balance as
at 1 Jan 2016New loans in the
current yearRepayments in
the current yearDebt balance as
at 31 June 2016Loan
security*
+ + - =
Bonds Other domestic companies 3.8 19 Oct 2016 10,000,000 10,000,000 Other
companies
Rondal, d.o.o. Group companies POM + 1% 18 Feb 2016 500,000 500,000 Bills of exchange
NKBM, d. d. Domestic banks 6M EUR + 3,0 25 Dec 2016 120,000 -60,000 60,000 Other companies
TOTAL 10,620,000 0 -60,000 10,560,000
*Liabilities based on bonds are not hedged.
Current financial liabilities include the liabilities from loans whose repayment period is shorter than one year. They include EUR 10,000,000 for liabilities based on bonds which represents the current proportion of liabilities falling due in 2016.
The interests for loans between companies in the Group are calculated at the established interest rate, which applies to loans among associated entities, increased by 1 percentage point.
All current financial liabilities, except the current proportion of bonds, are secured.
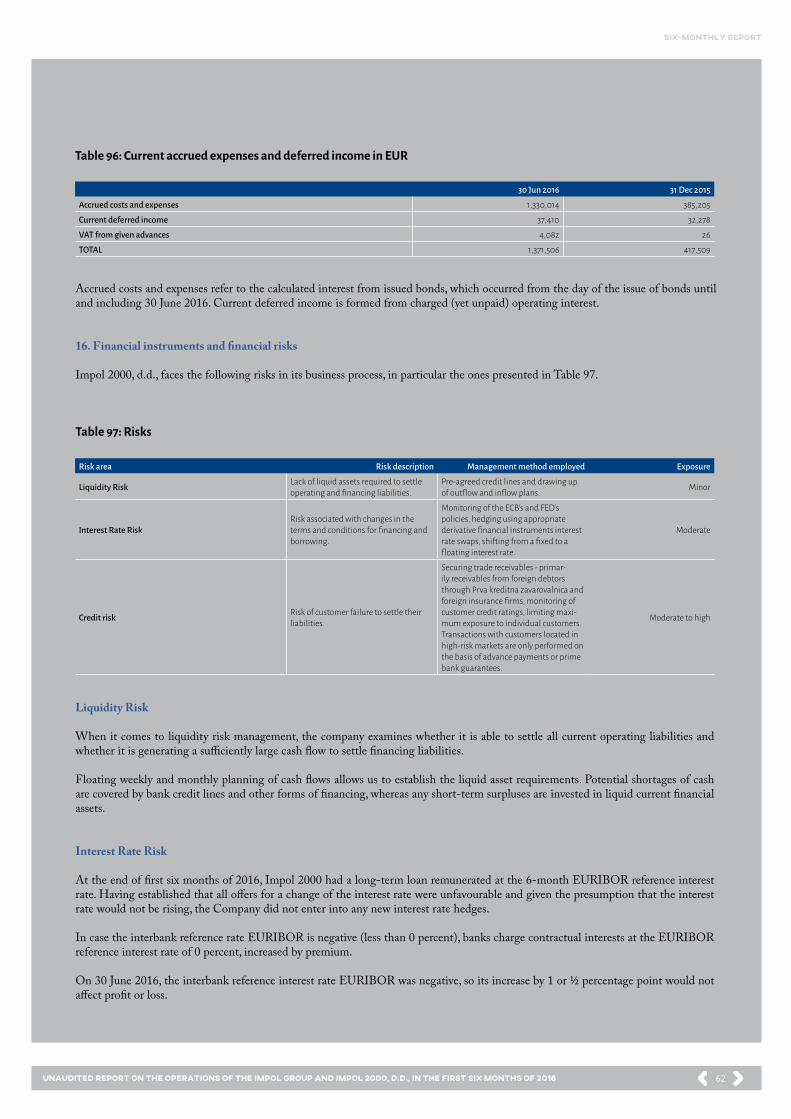
62
six-monthly report
Unaudited Report on the operations of the Impol Group and Impol 2000, d.d., in the first six months of 2016
Table 96: Current accrued expenses and deferred income in EUR
Table 97: Risks
30 Jun 2016 31 Dec 2015
Accrued costs and expenses 1,330,014 385,205
Current deferred income 37,410 32,278
VAT from given advances 4,082 26
TOTAL 1,371,506 417,509
Risk area Risk description Management method employed Exposure
Liquidity Risk Lack of liquid assets required to settle operating and financing liabilities.
Pre-agreed credit lines and drawing up of outflow and inflow plans. Minor
Interest Rate RiskRisk associated with changes in the terms and conditions for financing and borrowing.
Monitoring of the ECB’s and FED’s policies, hedging using appropriate derivative financial instruments interest rate swaps, shifting from a fixed to a floating interest rate.
Moderate
Credit risk Risk of customer failure to settle their liabilities.
Securing trade receivables - primar-ily receivables from foreign debtors through Prva kreditna zavarovalnica and foreign insurance firms, monitoring of customer credit ratings, limiting maxi-mum exposure to individual customers. Transactions with customers located in high-risk markets are only performed on the basis of advance payments or prime bank guarantees.
Moderate to high
Accrued costs and expenses refer to the calculated interest from issued bonds, which occurred from the day of the issue of bonds until and including 30 June 2016. Current deferred income is formed from charged (yet unpaid) operating interest.
16. Financial instruments and financial risks
Impol 2000, d.d., faces the following risks in its business process, in particular the ones presented in Table 97.
Liquidity Risk
When it comes to liquidity risk management, the company examines whether it is able to settle all current operating liabilities and whether it is generating a sufficiently large cash flow to settle financing liabilities.
Floating weekly and monthly planning of cash flows allows us to establish the liquid asset requirements. Potential shortages of cash are covered by bank credit lines and other forms of financing, whereas any short-term surpluses are invested in liquid current financial assets.
Interest Rate Risk
At the end of first six months of 2016, Impol 2000 had a long-term loan remunerated at the 6-month EURIBOR reference interest rate. Having established that all offers for a change of the interest rate were unfavourable and given the presumption that the interest rate would not be rising, the Company did not enter into any new interest rate hedges.
In case the interbank reference rate EURIBOR is negative (less than 0 percent), banks charge contractual interests at the EURIBOR reference interest rate of 0 percent, increased by premium.
On 30 June 2016, the interbank reference interest rate EURIBOR was negative, so its increase by 1 or ½ percentage point would not affect profit or loss.

63
six-monthly report
Unaudited Report on the operations of the Impol Group and Impol 2000, d.d., in the first six months of 2016
Credit risk
The credit control process encompasses customer credit rating which is carried out regularly in cooperation with Prva kreditna za-varovalnica and foreign insurance firms as well as our customer solvency monitoring system. By regularly monitoring open and past due trade receivables, the ageing structure of receivables and average payment deadlines, the Company maintains its credit exposure within acceptable limits given the strained conditions on the market. In 2016, the Company managed to maintain trade receivables on approximately the same level as in 2015.
Carrying and fair values of financial instruments
Classification of financial instruments according to their fair value as at 30 June 2016:
Table 98: Risks
Table 99: Receivables due from Group companies in EUR
Carrying amount Fair value Fair valuelevel
Non-current investments to associated companies 0 0 3
Non-current investments to subsidiaries 69,135,645 69,135,645 3
Current loans given to Group companies 22,569,796 22,569,796 3
Current loans to others 4,020,000 4,020,000 3
Current operating receivables 2,747,854 2,747,854 3
Cash and cash equivalents 10,765,426 10,765,426 3
Non-current financial liabilities 40,940,123 40,940,123 3
Current financial liabilities 10,582,355 10,582,355 3
Current operating liabilities 1,410,692 1,410,692 3
Receivables of Impol 2000, d.d., as at 30 June 2016 due from:Group companies – receivables
TOTALNon-current financial investments in equity
Current operatingreceivables
Short-term loansgranted
Impol, d.o.o. 67,588,863 483,957 3,750,000 71,822,820
Impol LLT, d.o.o. 15,360 15,360
Impol FT, d.o.o. 81,281 81,281
Impol PCP, d.o.o. 112,922 112,922
Impol Infrastruktura, d.o.o. 1,748 1,748
Impol R in R, d.o.o. 3,733 3,733
Rondal, d.o.o. 100,000 8,129 108,129
Impol-Montal, d.o.o. 869 869
Impol Servis, d.o.o. 245,037 286 245,323
Impol Stanovanja, d.o.o. 261 261
Kadring, d.o.o. 1,105 1,105
Stampal SB, d.o.o. 5,072 5,072
TGP Štatenberg, d.o.o. 0
Unidel, d.o.o. 2,502 2,502
Impol-TLM, d.o.o. 1,201,745 56,183 18,519,796 19,777,724
Impol ulaganja, d.o.o. 369 300,000 300,369
TOTAL 69,135,645 773,777 22,569,796 92,479,218
17. Contingent liabilities
As at 30 June 2015, Impol 2000, d.d., has guarantees in the amount of EUR 45,741,360 granted to the subsidiary Impol, d.o.o., in respect of received non-current loans at banks. The given guarantee in the amount of EUR 33,250,000 is secured by the pledge of a 97.5-percent ownership share in the company Impol, d.o.o.
18. Transactions with Related Parties
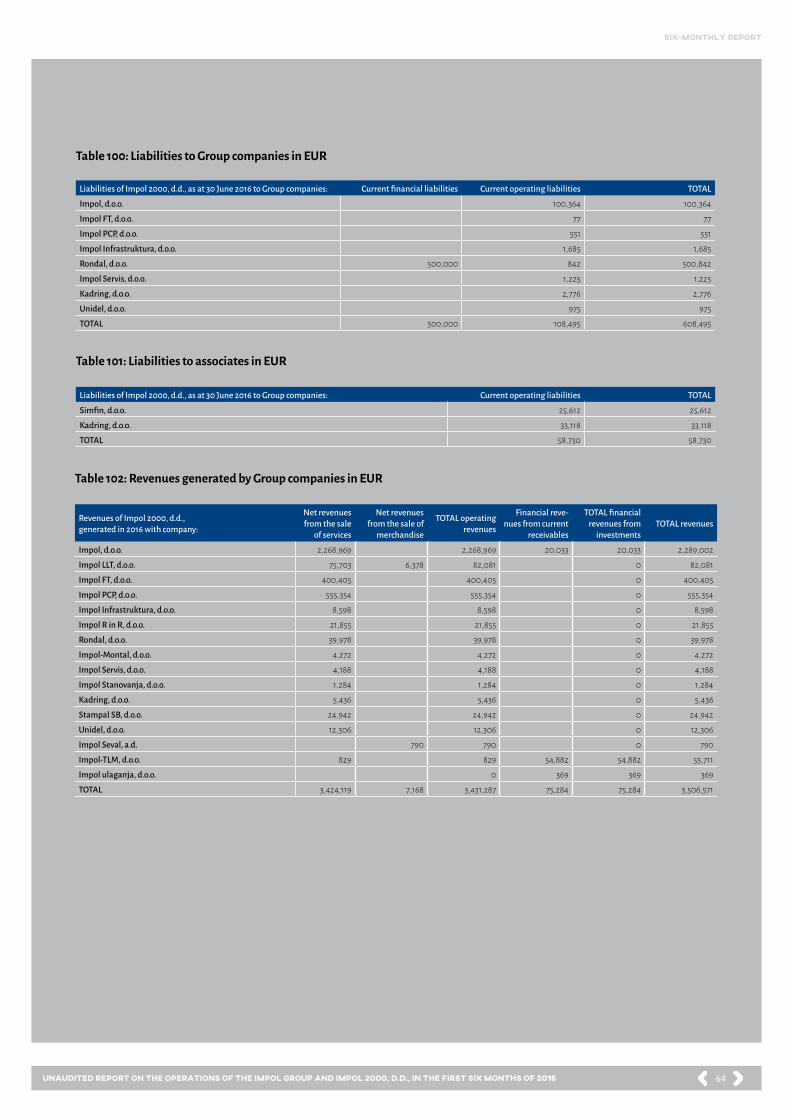
64
six-monthly report
Unaudited Report on the operations of the Impol Group and Impol 2000, d.d., in the first six months of 2016
Table 100: Liabilities to Group companies in EUR
Table 101: Liabilities to associates in EUR
Table 102: Revenues generated by Group companies in EUR
Liabilities of Impol 2000, d.d., as at 30 June 2016 to Group companies: Current financial liabilities Current operating liabilities TOTAL
Impol, d.o.o. 100,364 100,364
Impol FT, d.o.o. 77 77
Impol PCP, d.o.o. 551 551
Impol Infrastruktura, d.o.o. 1,685 1,685
Rondal, d.o.o. 500,000 842 500,842
Impol Servis, d.o.o. 1,225 1,225
Kadring, d.o.o. 2,776 2,776
Unidel, d.o.o. 975 975
TOTAL 500,000 108,495 608,495
Liabilities of Impol 2000, d.d., as at 30 June 2016 to Group companies: Current operating liabilities TOTAL
Simfin, d.o.o. 25,612 25,612
Kadring, d.o.o. 33,118 33,118
TOTAL 58,730 58,730
Revenues of Impol 2000, d.d., generated in 2016 with company:
Net revenues from the sale
of services
Net revenues from the sale of
merchandise
TOTAL operating revenues
Financial reve-nues from current
receivables
TOTAL financial revenues from
investmentsTOTAL revenues
Impol, d.o.o. 2,268,969 2,268,969 20,033 20,033 2,289,002
Impol LLT, d.o.o. 75,703 6,378 82,081 0 82,081
Impol FT, d.o.o. 400,405 400,405 0 400,405
Impol PCP, d.o.o. 555,354 555,354 0 555,354
Impol Infrastruktura, d.o.o. 8,598 8,598 0 8,598
Impol R in R, d.o.o. 21,855 21,855 0 21,855
Rondal, d.o.o. 39,978 39,978 0 39,978
Impol-Montal, d.o.o. 4,272 4,272 0 4,272
Impol Servis, d.o.o. 4,188 4,188 0 4,188
Impol Stanovanja, d.o.o. 1,284 1,284 0 1,284
Kadring, d.o.o. 5,436 5,436 0 5,436
Stampal SB, d.o.o. 24,942 24,942 0 24,942
Unidel, d.o.o. 12,306 12,306 0 12,306
Impol Seval, a.d. 790 790 0 790
Impol-TLM, d.o.o. 829 829 54,882 54,882 55,711
Impol ulaganja, d.o.o. 0 369 369 369
TOTAL 3,424,119 7,168 3,431,287 75,284 75,284 3,506,571
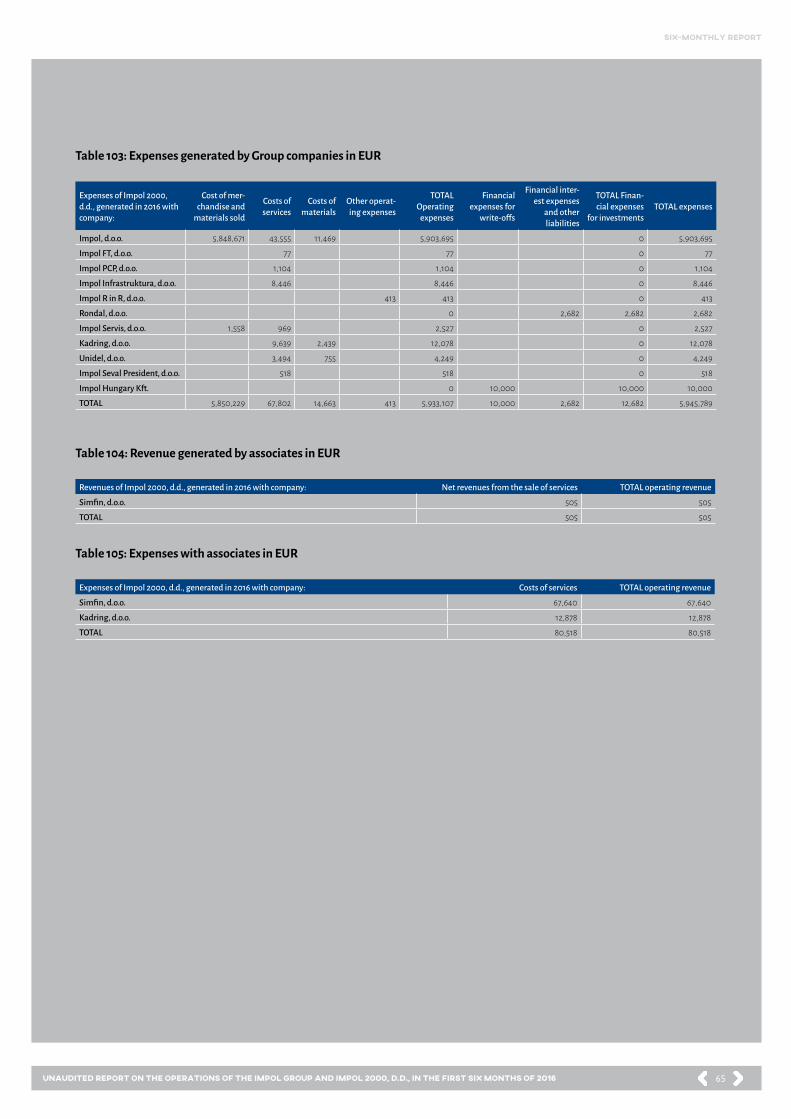
65
six-monthly report
Unaudited Report on the operations of the Impol Group and Impol 2000, d.d., in the first six months of 2016
Table 103: Expenses generated by Group companies in EUR
Expenses of Impol 2000, d.d., generated in 2016 with company:
Cost of mer-chandise and
materials sold
Costs of services
Costs of materials
Other operat-ing expenses
TOTAL Operating
expenses
Financial expenses for
write-offs
Financial inter-est expenses
and other liabilities
TOTAL Finan-cial expenses
for investmentsTOTAL expenses
Impol, d.o.o. 5,848,671 43,555 11,469 5,903,695 0 5,903,695
Impol FT, d.o.o. 77 77 0 77
Impol PCP, d.o.o. 1,104 1,104 0 1,104
Impol Infrastruktura, d.o.o. 8,446 8,446 0 8,446
Impol R in R, d.o.o. 413 413 0 413
Rondal, d.o.o. 0 2,682 2,682 2,682
Impol Servis, d.o.o. 1,558 969 2,527 0 2,527
Kadring, d.o.o. 9,639 2,439 12,078 0 12,078
Unidel, d.o.o. 3,494 755 4,249 0 4,249
Impol Seval President, d.o.o. 518 518 0 518
Impol Hungary Kft. 0 10,000 10,000 10,000
TOTAL 5,850,229 67,802 14,663 413 5,933,107 10,000 2,682 12,682 5,945,789
Table 104: Revenue generated by associates in EUR
Table 105: Expenses with associates in EUR
Revenues of Impol 2000, d.d., generated in 2016 with company: Net revenues from the sale of services TOTAL operating revenue
Simfin, d.o.o. 505 505
TOTAL 505 505
Expenses of Impol 2000, d.d., generated in 2016 with company: Costs of services TOTAL operating revenue
Simfin, d.o.o. 67,640 67,640
Kadring, d.o.o. 12,878 12,878
TOTAL 80,518 80,518
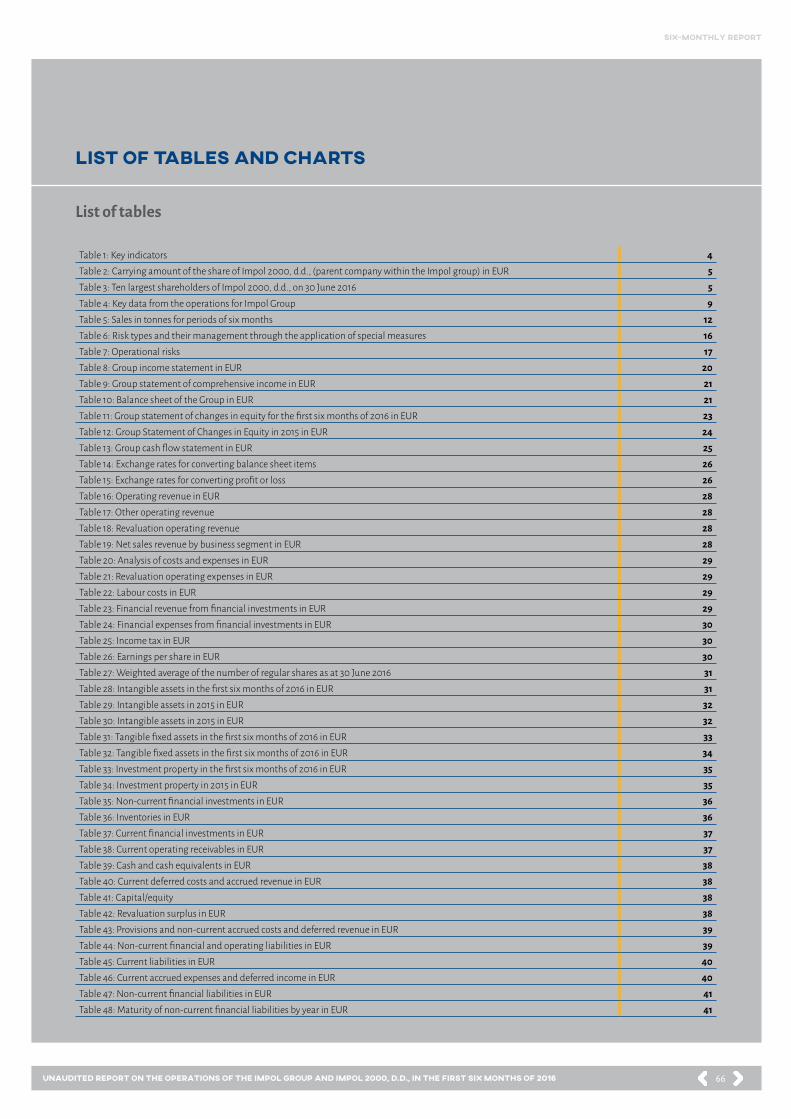
66
six-monthly report
Unaudited Report on the operations of the Impol Group and Impol 2000, d.d., in the first six months of 2016
LIST OF TABLES AND CHARTS
Table 1: Key indicators 4Table 2: Carrying amount of the share of Impol 2000, d.d., (parent company within the Impol group) in EUR 5Table 3: Ten largest shareholders of Impol 2000, d.d., on 30 June 2016 5Table 4: Key data from the operations for Impol Group 9Table 5: Sales in tonnes for periods of six months 12Table 6: Risk types and their management through the application of special measures 16Table 7: Operational risks 17Table 8: Group income statement in EUR 20Table 9: Group statement of comprehensive income in EUR 21Table 10: Balance sheet of the Group in EUR 21Table 11: Group statement of changes in equity for the first six months of 2016 in EUR 23Table 12: Group Statement of Changes in Equity in 2015 in EUR 24Table 13: Group cash flow statement in EUR 25Table 14: Exchange rates for converting balance sheet items 26Table 15: Exchange rates for converting profit or loss 26Table 16: Operating revenue in EUR 28Table 17: Other operating revenue 28Table 18: Revaluation operating revenue 28Table 19: Net sales revenue by business segment in EUR 28Table 20: Analysis of costs and expenses in EUR 29Table 21: Revaluation operating expenses in EUR 29Table 22: Labour costs in EUR 29Table 23: Financial revenue from financial investments in EUR 29Table 24: Financial expenses from financial investments in EUR 30Table 25: Income tax in EUR 30Table 26: Earnings per share in EUR 30Table 27: Weighted average of the number of regular shares as at 30 June 2016 31Table 28: Intangible assets in the first six months of 2016 in EUR 31Table 29: Intangible assets in 2015 in EUR 32Table 30: Intangible assets in 2015 in EUR 32Table 31: Tangible fixed assets in the first six months of 2016 in EUR 33Table 32: Tangible fixed assets in the first six months of 2016 in EUR 34Table 33: Investment property in the first six months of 2016 in EUR 35Table 34: Investment property in 2015 in EUR 35Table 35: Non-current financial investments in EUR 36Table 36: Inventories in EUR 36Table 37: Current financial investments in EUR 37Table 38: Current operating receivables in EUR 37Table 39: Cash and cash equivalents in EUR 38Table 40: Current deferred costs and accrued revenue in EUR 38Table 41: Capital/equity 38Table 42: Revaluation surplus in EUR 38Table 43: Provisions and non-current accrued costs and deferred revenue in EUR 39Table 44: Non-current financial and operating liabilities in EUR 39Table 45: Current liabilities in EUR 40Table 46: Current accrued expenses and deferred income in EUR 40Table 47: Non-current financial liabilities in EUR 41Table 48: Maturity of non-current financial liabilities by year in EUR 41
List of tables

67
six-monthly report
Unaudited Report on the operations of the Impol Group and Impol 2000, d.d., in the first six months of 2016
Table 49: Forward purchases/sales in the first six months of 2016 41Table 50: Financial revenue from forwards in EUR 41Table 51: Balance of open forward position as at 30 June 2016 42Table 52: Financial revenue and expenditure from forwards – foreign exchange swaps in EUR 42Table 53: Balance of open forward position as at 30 June 2016 42Table 54: Overview of USD inflows, outflows and open positions at Impol, d.o.o., in millions of USD 42Table 55: Revenue and expenses from foreign exchange differences in EUR 43Table 56: Carrying and fair values of financial instruments in EUR 44Table 57: Income statement in EUR 46Table 58: Statement of comprehensive income in EUR 47Table 59: Balance sheet in EUR 47Table 60: Statement of changes in equity for the first six months of 2016 48Table 61: Statement of changes in equity for 2016 in EUR 49Table 62: Cash flow statement in EUR 50Table 63: Operating revenue in EUR 52Table 64: Other operating revenue in EUR 52Table 65: Net sales revenue according to the type of goods or service in EUR 52Table 66: Net sales revenue by operating segments in EUR 52Table 67: Analysis of costs and expenses in EUR 53Table 68: Labour costs in EUR 53Table 69: Financial revenue from financial investments in EUR 53Table 70: Financial expenses from financial investments in EUR 53Table 71: Financial expenses from operating liabilities in EUR 54Table 72: Income tax in EUR 54Table 73: Earnings per share in EUR 54Table 74: Intangible assets in the first six months of 2016 in EUR 55Table 75: Intangible assets in 2015 in EUR 55Table 76: Tangible fixed assets in the first six months of 2016 in EUR 55Table 77: Tangible fixed assets in 2015 in EUR 56Table 78: Non-current financial investments in EUR 56Table 79: Revaluation of non-current financial investments in EUR 56Table 80: Trend in investments to subsidiaries and associates in EUR 57Table 81: Inventories of Goods in EUR 57Table 82: Current financial investments in EUR 57Table 83: Trend in loans granted in EUR 57Table 84: Current operating receivables in EUR 58Table 85: Analysis of due trade receivables in EUR 58Table 86: Trend in adjustment of current operating receivables due to impairment in EUR 58Table 87: Cash and cash equivalents in EUR 59Table 88: Current deferred costs and accrued revenue in EUR 59Table 89: Non-current financial and operating liabilities in EUR 59Table 90: Current deferred costs and accrued revenue in EUR 59Table 91: Depreciation plan of issued bonds in EUR 60Table 92: Non-current financial liabilities arising from finance lease in EUR 60Table 93: Non-current financial liabilities arising from finance lease in EUR 61Table 94: Current operating and financial liabilities 61Table 95: Analysis of overdue trade payables in EUR 61Table 96: Current accrued expenses and deferred income in EUR 62Table 97: Risks 62Table 98: Risks 63Table 99: Receivables due from Group companies in EUR 63Table 100: Liabilities to Group companies in EUR 64Table 101: Liabilities to associates in EUR 64
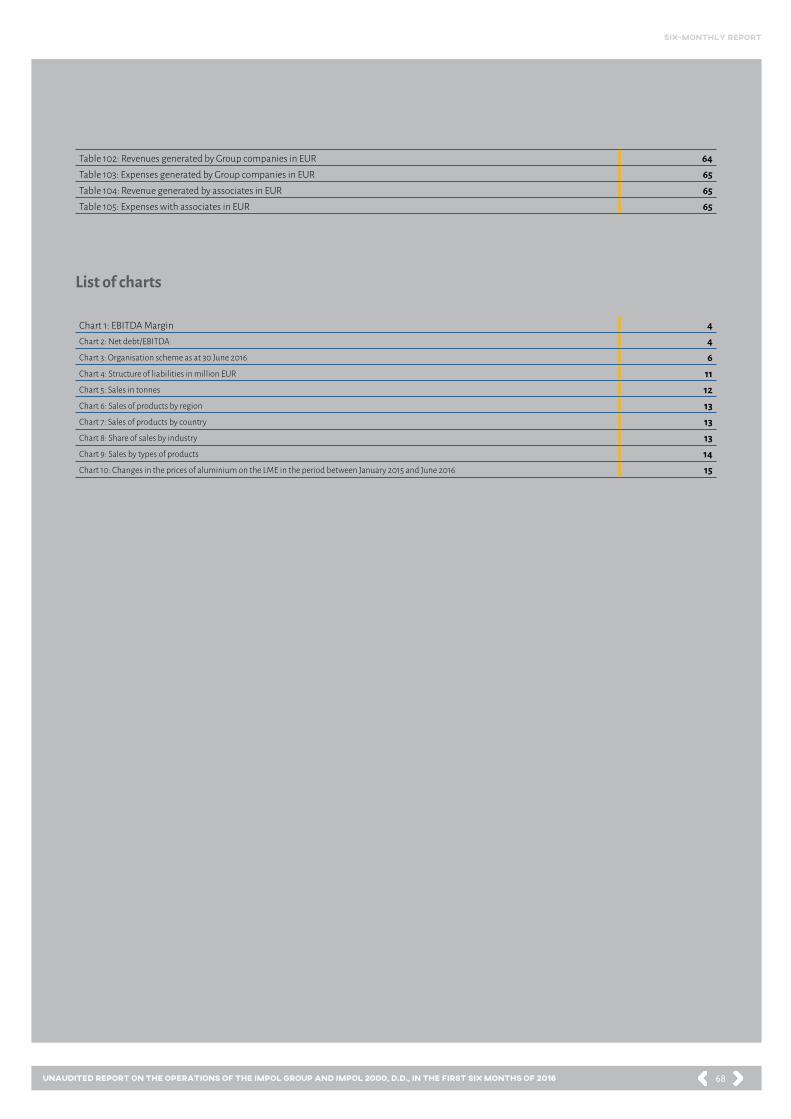
68
six-monthly report
Unaudited Report on the operations of the Impol Group and Impol 2000, d.d., in the first six months of 2016
Table 102: Revenues generated by Group companies in EUR 64Table 103: Expenses generated by Group companies in EUR 65Table 104: Revenue generated by associates in EUR 65Table 105: Expenses with associates in EUR 65
Chart 1: EBITDA Margin 4Chart 2: Net debt/EBITDA 4Chart 3: Organisation scheme as at 30 June 2016 6Chart 4: Structure of liabilities in million EUR 11Chart 5: Sales in tonnes 12Chart 6: Sales of products by region 13Chart 7: Sales of products by country 13Chart 8: Share of sales by industry 13Chart 9: Sales by types of products 14Chart 10: Changes in the prices of aluminium on the LME in the period between January 2015 and June 2016 15
List of charts