Embed Size (px)
Citation preview
J. Physiol. (1968), 199, pp. 685-703 685With 11 text-ftguresPrinted in Greaat Britain
OXYGEN CONSUMPTIONIN NORMALLY GROWN, SMALL-FOR-DATES AND LARGE-
FOR-DATES NEW-BORN INFANTS
By JUNE R. HILL* AND D. C. ROBINSONtFrom the M.R.C. Research Group for the Study of Respiration
and Energy Metabolism in the Newborn, Departmentof Physiology, The London Hospital
Medical College, London E. 1
(Received 22 July 1968)
SUMMARY
1. Serial measurements of minimal oxygen consumption (ro,) havebeen obtained from nineteen healthy new-born infants in order to find outhow body weight, gestational age and age after birth affected V0o. Thefirst measurement of Vo. was done within 12 hr of birth, and furthermeasurements were made at intervals until the baby left hospital.
2. The majority of the infants (seventeen) weighed less than 2-5 kg atbirth, and were 'premature' according to international definition. Gesta-tional age, calculated from the mother's last menstrual period, wascorroborated by clinical data and obstetrical history. The babies weredivided into four groups according to birth weight and gestational agecombined (see Table 1). Babies in the first two groups were the appropriateweight for dates (i.e. normally grown), babies in the other two groups wereeither small-for-dates or large-for-dates.
3. At birth minimal ro, was closely correlated with birth weight in allbabies and appeared to be directly proportional to it. The value for Jo,/kgwas similar in all groups. Po, was not related to gestational age per se.However, in the two normally grown groups ro, was roughly related togestational age because birth weight was related to gestational age.
4. In all babies minimal Io, rose progressively with increasing age afterbirth; a marked increase in V0, occurred in the first week of life, despite asmall decline in body weight.
5. At a given age after birth differences in 02o/kg between the four
* Present address: Department of Paediatrics, University College Hospital MedicalSchool, London, W.C.1.
t Present address: Department of Paediatrics, Makerere University College, Kampala,Uganda.

JUNE R. HILL AND D. C. ROBINSONgroups were mostly less than 10 %, and in general the differences were notstatistically significant.
Values for minimal o02 in all four groups were roughly:
5 m. 02/kg. min at < 12 hr of age.7 ml. 02/kg.min at 7-14 days of age.9 ml. 03/kg. min at about 2 months of age.
6. It is concluded that:(a) At birth minimal 'o, is largely determined by birth weight.
Jo,/kg is little affected by either rate ofgrowth in utero or gestational age.(b) Minimal ro, is a function of age after birth as well as of body weight,
and the value for Io2/kg increases as the baby gets older.
INTRODUCTION
The growth rate of babies in utero, as estimated from birth weight atknown gestational ages, varies widely (Lubchenco, Hansman, Dressler &Boyd, 1963; Butler & Bonham, 1963). In deciding what is abnormal amajor difficulty is that neither age, nor weight, considered independently,provides a satisfactory criterion of 'prematurity'. For example, the Peri-natal Mortality survey (Butler & Bonham, 1963) found that nearly 40%of babies classed as premature according to international definition, whichis based purely on weight (less than 2-5 kg at birth), have gestational agesof 38 weeks or more, and would generally be held to be mature from theage standpoint. However, these small-for-dates babies undoubtedly con-stitute a special high-risk group, since their mortality is some eight timeshigher than that of babies weighing more than 2-5 kg at birth, who alsohave gestational ages greater than 38 weeks. Small babies between 1-5 and2*0 kg in fact have a higher mortality when their gestational age is 36weeks or more than when it is 30-35 weeks (McDonald, 1965). The impor-tance of distinguishing between low birth weight due to short gestationand that due to retarded intrauterine growth is clear; investigations inwhich this distinction is made should lead to a better understanding of thesituation and its post-natal consequences.The investigation reported here concerns oxygen consumption in a
sample of babies who weighed 2x5 kg or less at birth and whose gestationalage was accurately assessed; minimal oxygen consumption was measuredas soon after birth as possible and the measurement was repeated at inter-vals as the baby got older. Two babies who were immature by gestationalage, yet large-for-dates, are included to provide a contrast. The data wereanalysed to find out to what degree minimal oxygen consumption at birthwas determined by body weight and to what degree by gestational age.
686

02 CONSUMPTION IN NEW-BORN INFANTS 687
The data obtained at increasing age after birth were also analysed in anattempt to discover the relative roles played by age after birth and bybody weight in determining the oxygen consumption.
METHODS
The investigations described below were harmless to the babies, and no infant showedany untoward effects that could be attributed to the investigative procedure, either at thetime or subsequently. The purpose of the investigation, and the procedure, were explainedto each mother, who was then free to decide whether to permit her infant to take part inthe investigation. All the babies in this series, save three who were born by Caesarean sectionand are referred to later, were born normally by vaginal delivery. Only babies who showedno clinical evidence of cardiac or respiratory disease, nor signs of asphyxia during or afterbirth, and who did not suffer from hyperbilirubinaemia, are included in this report: allinfants stayed healthy and asymptomatic throughout the period of study.
Apparatus and experimental detailsOxygen consumption rate was measured using the apparatus described in detail by Hill
& Rahimtulla (1965): the differentiating float was capable of recording accurately oxygenconsumption rates as low as 4 ml./min and the apparatus was sensitive enough for even thesmallest premature infant. The investigations were done during an interval between feeds(the babies being fed 3-hourly, or occasionally 2-hourly), so that the feeding routine wasnot disturbed in any way. The experimental procedure that was followed has been describedby Hill & Rahimtulla (1965): at each investigation oxygen consumption was measured overa period of approximately 10 min, at a number of different environmental temperatures,both at temperatures judged to be within the thermoneutral range of temperatures and alsoin 'cold' conditions. Similarly to what emerged from the previous study, all the babies inthis series showed an increased oxygen consumption in 'cold' conditions; however, we shallnot be dealing with the metabolic response to cold in this paper. All the measurementsreported here were obtained while the baby was inactive or sleeping, breathing air ofapproximately normal composition, and in an environment that was thermally neutral forthe baby concerned, thus all values reported here are approximately minimal values (or inolder terminology basal or standard values). (Environment in baby-chamber for thermo-neutrality: dry bulb temperature in the region of 360 C (extreme range 32-40' C, dependingon the baby's size and age), radiant temperature within 20 C of dry bulb temperature,relative humidity 20-25%: volume flow of circulating air 251./min, with a linear flowthrough the baby-chamber of 2-3 cm/sec.)From every investigation generally two or more estimates of minimal oxygen consumption
were obtained; in calculating the final results these estimates were pooled and mean valuesare given: all volumes are expressed at s.t.p.d.
Rectal temperature was monitored continuously while oxygen consumption was beingmeasured; where rectal temperature changed slightly over a given period of T:o2 measure-ment, the mean value has been used in the final results.
Symbols used throughout the paper are:
V02 = minimal oxygen consumption, ml./min,TB = rectal temperature, °C,W = body weight, kg.
The babiesEach baby was investigated repeatedly until it left hospital. Such repeated measurements
were obtained from nineteen babies who either weighed less than 2-5 kg at birth or had
44 Phy. i99
688 JUNE R. HILL AND D. C. ROBINSONbeen born before term (representing a total of 275 measurements of oxygen consumptionobtained from 130 separate investigations).
Gestational age. This was carefully assessed in each baby. It was calculated from the firstday of the mother's last menstrual period as stated in the antenatal notes, and is given inweeks (to the nearest week). Consideration was also given to:
(i) The size of the uterus at the first obstetrical examination (generally at 12-16 weeks)as recorded in the antenatal notes.
(ii) The clinical appearance and behaviour of the infant at birth.(iii) The obstetrical history, including any relevant clinical details.In all the babies in the sample the clinical criteria (i), (ii) and (iii) corroborated the
gestational age as calculated from the mother's last menstrual period. One additional babywho would otherwise have been included in the sample was rejected because of uncertaintyover the date of the mother's last menstrual period.Age after birth. Each baby was examined at a number of different ages: it was not prac-
ticable to do the investigations at precisely the same age for each baby, but we did succeedin making the first measurement within 12 h of birth in almost every case. Babies who werehealthy and thriving were discharged 10-14 days after birth provided that their weightwas not much below 2-5 kg. Babies of considerably lower weight were kept in hospital untiltheir weight had reached this value, and we were able to follow them for very much longer:the shortest stay was 10 days, the longest 10 weeks. In order to analyse for a possible effectof age after birth, we found it necessary to define age classes which were arbitrarily chosenas follows:
Class I II 111 IV V VI VIIAge < 12 hr 12-48 hr 2-7 days 7-14 days 2-4 weeks 1-2 months > 2 months
RESULTS
Birth weight in relation to gestational age. Birth weight is shown plottedagainst gestational age for all nineteen babies in Fig. 1. The 90th, 50th and10th percentiles derived from the Denver study of birth weight in relationto gestational age (Lubchenco et al. 1963) are indicated, and also the meanbirth weight + 1 S.D. for the later weeks of gestation from data of theNational Birthday Trust Perinatal Mortality Survey (Butler, 1965). Eachbaby in our sample (with a single exception, described in detail later)could be assigned to one of four well-defined groups according to birthweight and gestational age combined, namely:
(1) Young pre-term (indicated by filled triangles).(2) Pre-term (indicated by filled circles).(3) Small-for-dates (indicated by open squares).(4) Large-for-dates (indicated by open diamonds).
These symbols will be retained in most of the figures that follow. Note thatfilled symbols have been used where the baby's weight was within + 10thpercentile limits for gestational age (normally grown), open symbols whereweight was either below the 10th or above the 90th percentile limit forgestational age (small-for-dates and large-for-dates). Table 1 gives furtherdetails about the grouping.

02 CONSUMPTION IN NEW-BORN INFANTS
The weight of all young pre-term and pre-term babies fell within the90th and 10th percentile limits and they were judged to be of appropriateweight for gestational age: these babies are termed 'normally grown'(cf. Sinclair & Silverman, 1966). Small-for-dates babies fell well below the
5 r
I-
! 3.0_QCB
bo
.90%
50%
10%
/C0 C
26 30 34 38
Gestational age (weeks)42
Fig. 1. Ordinates: Birth weight, kg. Abscissae: gestational age, weeks. Triangles:young pre-term. Circles: pre-term. Squares: small-for-dates. Diamonds: babies ofdiabetic mothers; two are large-for-dates, see text.The symbol has been filled in when the baby's weight is appropriate to its
gestational age, and has been left open when the weight is either lower or higher thanusual for gestational age, i.e. open for small-for-dates and large-for-dates.The three curved lines indicate the 90th, 50th and 10th percentiles from data
of Lubchenco et al. (1963) for babies of both sexes. The horizontal bars withassociated vertical line indicate respectively, the mean birth weight, + 1 S.D., foreach completed week of gestation from 36-41 from data of the Perinatal Mortalitysurvey (Butler, 1965).
10th percentile and all clearly weighed less than the norm. The mothers ofthe remaining three babies were all diabetic, and for this reason all threewere delivered by elective Caesarean section before term (at 36-37 weeksgestational age). Two were characteristically 'large-for-dates', their weight
44-2
689
I I a I I

JUNE R. HILL AND D. C. ROBINSON
being above the 90th percentile limit. The third baby was not large-for-dates, in fact its weight was jukt below the 50th percentile for its gesta-tional age. We decided that for purposes of statistical analysis we shouldnot include this infant with the pre-term group, even though it had theweight-for-gestational age characteristics of this group. This baby, there-fore, has been given a special symbol of its own (filled diamond) so thatit can be distinguished from pre-term babies among whom it lies in Fig. 1.
Rectal temperature. Body temperature might be expected to affect ro,,so before comparing 1o, values in the different groups of babies it was
TABLE 1. Sample broken down into groups
Gesta-Birth Size for Group description tional Birth wt.wt. dates Maturity and symbol age mean and S.D. n*
Low Normal Very Young pre-term A 29-32 1-47 kg+O 39 5immature weeks
Low Normal Immature Pre-term * 33-36 2.19 kg+O 30 5weeks
Low Small Mature Small-for-dates [] 37-42 2-0 kg ± 0 16 6weeks
High Large Immature Large-for-dates 0 36, 37 3-71 kg & 4-78 2weeks
* The remaining baby who makes up the full total of nineteen could not properly beassigned to any one of these groups (its mother was diabetic, yet it was not large-for-dates.36 weeks, 2-47 kg). In the figures it has been given a special symbol of its own: see text.
necessary to find out whether rectal temperature, recorded during eachperiod of ro measurement, varied significantly between the groups.Table 2 shows the results of statistical analysis ofrectal temperature values(the number of babies in the 'diabetic' group was too small for statisticalanalysis so individual values are given). At a given age the more immaturebabies tended to have a lower rectal temperature than the mature ones,but the difference between the mean values for the various groups wassmall, never more than 10C at a given post-natal age, which is not statis-tically significant. In view ofthe fact that a difference in rectal temperatureof this order could theoretically affect Jo, values by only a few percent atthe most, rectal temperature has been ignored in analysing the 1o2results; however, the variation may well have contributed somewhat tothe scatter of the individual measurements.
rO2 at birth
ro, in relation to ge8tational age. The results obtained are shown in Fig. 2.It is seen that JO0 and gestational age are well correlated in normallygrown infants, but small-for-dates and large-for-dates babies mostly lienowhere near the same line as the normally grown ones. Thus r at birthdoes not appear to be dependent on gestational age per se.
690

02 CONSUMPTION IN NEW-BORN INFANTS 691
V02 in relation to birth u'eight. Fig. 3 demonstrates the results obtained.The continuous line is the regression of o02 at 0-12 hr after birth on bodyweight, calculated from data for normally grown babies only (i.e. youngpre-term and pre-term together, making ten pairs). The correlation
TABLE 2. Mean rectal temperature, + 1 S.D. followed by n, by group and age class
Age after birth
Group
Young pre-term
Pre-term
Small-for-dates
< 12 hr
35-6 + 0-655
35-8+ 0-795
36-3 + 0-555
12-48 hr
35-8+ 0-545
36-3 + 0-245
36-6 + 0-225
2-7 days
35-9+0-385
36-7 + 0-595
36-8 + 0-345
7-14 days
36-2+0-345
36-54
36-65
Diabetic mother 36-2 36-5 37-1(individual 37-0 36-9 37 0values) 36-3 37-0 37-2
The individual values used in calculating mean and S.D. are derived from values observedduring periods over which P°2 was measured, as shown in Table 3: at every age a givenbaby contributes only one value.
A .L0A
A
A*A
,'/ 1I I I I I I I I26 30 34 38 42
Gestational age (weeks)
Fig. 2. Ordinates: V02 ml./min, measured within 12 hr of birth. Abscissae:gestational age, weeks. Symbols and shading as in Fig. 1.
24 r
22
20 -
_-
_-
:, 18
; 16
$4 14
o 12
- 10
0R 8.S
6
F_
4
2
0

692 JUNE R. HILL AND D. C. ROBINSON
coefficient is high, r = 0-96, P < 0 001: also the regression line passesclose to the origin, equation
o02ml./min = 4-81 x W kg + 0-32.For practical purposes the small intercept is best disregarded: Vf02 is thendirectly proportional to body weight as shown by the pecked line whichhas been drawn from the equation
Jo, ml./min 5 x W kg._ ~~~~~~~~~~~/
24 -
*/ 20 /
.4~ ~ ~ ~ /e 16 -
0, 12
8 -
4 -
/
0 1 2 3 4 5Body weight at birth (kg)
Fig. 3. Ordinates: lo2,° ml./min, measured within 12 hr of birth. Abscissae: bodyweight at birth, kg. Symbols and shading as in Fig. 1. The dashed line is defined by'O2 ml./min = 5 x body weight, kg.
It is clear that the points for small-for-dates and large-for-dates babies lieclose to the same line, the small-for-dates tending to lie just above it, andthe large-for-dates just below it. At birth, therefore, VV2 per kg bodyweight appears to be much the same for undergrown and overgrown babiesas it is for normally grown ones.
702 after birthAll the results of 1702 measurements obtained from the nineteen babies
are shown plotted against body weight on double logarithmic co-ordinatesin Fig. 4. Each group has been given the same symbol as in previousfigures, but here shading has been used to indicate age after birth-the

02 CONSUMPTION IN NEW-BORN INFANTS
a
9
8
7
5
0 I I I1 I _ I
1*6 20 25 30
Body weight (kg) log, sale
I I .
3.5 4.0 5.0
Fig. 4. Ordinates: VO2, ml./min; log. scale. Abscissae: body weight, kg; log. scale.This figure shows all the measurements that were obtained from the nineteenbabies. Triangles: young pre-term. Circles: pre-term. Squares: small-for-dates.Diamonds: babies of diabetic mothers.
Shading ofsymbol is a guide to age after birth, the darker the shading, the greaterthe age; viz.: none: < 12 hr. Stipple: 12-48 hr. Horizontal: 2-7 days. Vertical:7-14 days. Cross-hatch: 2-4 weeks. Filled: > 4 weeks. Diagonal lines have beendrawn as defined by: V02/kg = 5 ml./min, Jo02/kg = 6 ml./min and etc. Upperleft-hand corner: continuous line indicates unit slope: the length of each arm of theright-angle shows the amount of displacement for a 10% change in each parameter.The points shown here comprise all those shown in Figs. 5-8.
40
36
32
693
28 _
24 _*
20
18
16
9
710
0
14 -
12 _
10 1-
8
5
4 LI .C 12 1 4
-
_ I / A6
I_ I
I 0 e __V_

JUNE R. HILL AND D. C. ROBINSON
darker the shading, the greater the age (see legend to Fig. 4). It can beseen that the open symbols (I;, at less than 12 hr age) lie, as in Fig. 3,close to the line defined by
Po2 ml./min = 5 x WV kg.The points as a whole cover a wide range, and there is a definite tendencyfor V02 to rise with increasing age as well as with increasing weight.Examination of the changes that take place in an individual baby shows
36 tIL10%
20 F
0
IO.9
9
1-'
ti
///
/
ir
101
El
I DiI\I 1I;~~~~~~~~~~~~-r2 2-0L 1-2 20 2-0
B I I II I I I IA. i l 1
2 3-01-0 2-0
2-0 3-0
3-0
34
Body weight (kg) log, scle
Fig. 5. Younig pre-term babies. Ordinates: V°2 rnl./min; log. scale. Abscissae:body weight, kg; log. scale. Abscissal scales have been staggered to separate thepoints for different babies, each of whom is represented by a different symbol.
Shading of symbols indicates age after birth as in Fig. 4. Each point representsthe mean O, measured over a period of between 10-30 min, and its associatedvertical bar, 1 S.D.
5
694
02 CONSUMPTION IN NEW-BORN INFANTS
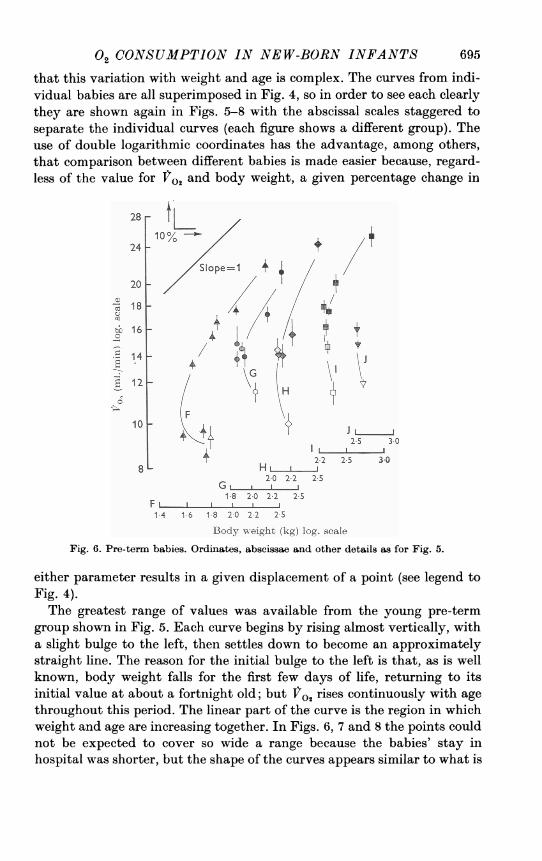
that this variation with weight and age is complex. The curves from indi-vidual babies are all superimposed in Fig. 4, so in order to see each clearlythey are shown again in Figs. 5-8 with the abscissal scales staggered toseparate the individual curves (each figure shows a different group). Theuse of double logarithmic coordinates has the advantage, among others,that comparison between different babies is made easier because, regard-less of the value for V0 and body weight, a given percentage change in
28-110% t
24 +S1ope=1 4
20~~~~~~- 222
20
018 2t 16 8
14
ialz ~ ~ Bd w}h (g og cl
10J
2-22-5
3-02-0 2-2 25S
1-8 2-0 2-2 25S
1-4 1-6 1-8 2-0 2-2 2-S
Body weight (kg) log, scaleFig. 6. Pre-term babies. Ordinates, abscissae and other details as for Fig. 5.
either parameter results in a given displacement of a point (see legend toFig. 4).The greatest range of values was available from the young pre-term
group shown in Fig. 5. Each curve begins by rising almost vertically, witha slight bulge to the left, then settles down to become an approximatelystraight line. The reason for the initial bulge to the left is that, as is wellknown, body weight falls for the first few days of life, returning to itsinitial value at about a fortnight old; but o02 rises continuously with agethroughout this period. The linear part of the curve is the region in whichweight and age are increasing together. In Figs. 6, 7 and 8 the points couldnot be expected to cover so wide a range because the babies' stay inhospital was shorter, but the shape of the curves appears similar to what is
695

JUNE R. HILL AND D. C. ROBINSON
1I
100, C
/Slpe=1
JL.
N 0
It+f
*}
M'I I Ilp I.1-8 240 2*2 20 2-2 2-5 3 0
L 0 L-.L..-.J1.8 20 22 25 20 22 2-5
K N L ....J
1-8 240 22 25 1-8 2.0 2.2 25Body weight (kg) log. sae
Fig. 7. Small-for-dates babies. Ordinates, abscissae and other details as for Fig. 5.
'1
36 t
32 -10% -
28 /
_
at 24
.a-t 20
e 18
16
It
R
14 _-
12 L
L a .I I.
2!2 25 3-0 3-5 4.0 4.5 5.0Body weight (kg) log, scale
Fig. 8. Babies of diabetic mothers; two are large-for-dates, see text. Ordinates,abscissae and other details as in Fig. 5 except that the abscissal scales did not needto be staggered.
36 r
32
28
241-0
a
:S°
0
.0
0
20
i8
16
14 1-
121-
696
10 L

02 CONSUMPTION IN NEW-BORN INFANTS 697
seen in Fig. 5. They all begin with a steep rise and in many cases extendfar enough to display a linear region. In all examples the linear region hasa slope greater than unity, in fact Vo, is rising roughly as (body weight)' 3.At first sight this may appear to conflict with what was shown in Fig. 3where the results on new-born babies indicated that ho, was directlyproportional to body weight. The difference is that in Fig. 3 all the babieshad the same age, while in Figs. 5-8 the differing values of body weightare associated with different ages.
24
20 _
16
12 - A /
8 -
c3. _/
o 4
oC, I I1 1
0 1 2 3 4 5Body weight (kg)
Fig. 9. Ordinates: o2,, ml./min, measured at between 7 and 14 days after birth.Abscissae: body weight, kg. Symbols and shading as in Fig. 3, with which thisfigure is directly comparable. The dotted line is defined by Vo2 m./min = 7 x bodyweight kg. The dashed line is reproduced from Fig. 3, i.e. r°2 ml./min = 5 x bodyweight kg.
This illustrates how important it is to remember that Vo2 is a functionof two principal variables, age and body weight. In algebraic terms,
V02 = fn (age, body weight)
Fig. 3 shows that at a constant age, less than 12 hr in this case,
Vr2 = constant x body weightand Fig. 9 demonstrates that at a greater, and again roughly constant,age (7-14 days), the same equation still applies, but with a different value

JUNE R. HILL AND D. C. ROBINSON
of the constant. Indeed it appears to a first approximation that all theresults can be fitted by the equation
o0 = fn' (age) x body weight.
So the problem becomes simplified to finding out what fn' (age) is.Rearranging the equation,
fn'(age) = 1o,/body weight
10
0 - 0- - - - -
<12 hr 12-36 36 hr 7-14 2-4 1-2 >2 monthshr -7 days days weeks months
Age after birth
Fig. 10. Ordinates: }7o2/kg body weight (ml./min). Abscissae: age groups (not toscale). The different symbols indicate different groups, the mean, + 2 8.E. of mean.is shown. Where a filled rectangle is attached to the small-for-dates group, it indi-cates that the mean differs from that of the young pre-term group at P < 0-05.
Table 3 and Fig. 10 illustrate how this fraction varies in all four groups. Itis evident that Jo,/kg rises with increasing age in all four groups; however,at all ages, o,/kg of the small-for-date babies is consistently highest,while that of the young pre-term babies is consistently lowest. Thedifferences between these two groups are statistically significant atP < 0 05 where indicated by the filled rectangles in Fig. 10.
698

02 CONSUMPTION IN NEW-BORN INFANTS 699
TABLE 3. 1o. per kg by group and age classValues given are: (1) and (2) Mean I2o, ml./rin kg± 1 S.D.; (3) Mean body weight, kg.
(4) No. of babies (some babies are not represented in the older age groups). Note that agiven infant, when represented within an age group, contributes only one value.
Age after birth
Weight within a few %of birth weight
Young pre-term 1234
Pre-term 1234
Small-for-dates 1234
Diabetic mother(individual valuesfor 'o in birthwt. order)
12-48 hr
5-69+0-30
1-4256-40
+0-822-1056-79
+0.561-975
2-7 7-14days days
6-06 6-48+0*50 +0*77
1-36 1-425 56-64 7-34
+0-78 +0-592-09 1-965 4*7-21 7*63
+0-52 +0*592-00 2-155 5
-5-19- -7 11- 7-98-4-87 6-80 6-87L4-60J LB-70 6.881
[7.12]
Weight greater thanbirth weight
A
2-4 1-2 >2weeks months months
7*21 8-63 9.70+0-83 +0-77 +0 53
1-56 2-13 3-125 5 38-25 8-99
+0-36 +0-122-18 2-264 38*55 10.09
+ 0.55 10-582-25 indivi-3 dual
valuesforinfant
[7-20] - -
* The baby who dropped out of the group at this time was naturally the heaviest one,
consequently the mean body weight of those remaining apparently fell.
DISCUSSION
Descriptions of physiological phenomena such as have been given herehave two main uses. The first, purely pragmatic and empirical, is to laydown normal standards, so that it is possible to say in a given case whetheror not the baby conforms to them. From a clinical standpoint it is particu-larly important that normal standards should be well established. Thesecond, still largely unattained, is to understand the physiology ofthesituation and the mechanism behind the changes that take place, sincethey must have significance for the survival, or at least the well-being, ofthe baby.
Results of recent investigations agree in broad outline over absolutevalues and the changes that occur with increasing post-natal age; thedifferences that arise between different reports appear to concern mattersof detail (see e.g. Briick, 1961; Adams, Fujiwara, Spears & Hodgeman,1964; Levison & Swyer, 1964; Mestyain, Fekete, Bata & Jarai, 1964;Adamsons, Gandy & James, 1965; Hill & Rahimtulla, 1965; Scopes
< 12 hr
4.93+0-44
1-4755*06
+0-452-1955-31
+0-462-005

JUNE R. HILL AND D. C. ROBINSON
& Ahmed, 1966). In these papers mean values for V0 of babies at birth allfall within the range 4-5-5-2 ml./min. kg, there being no significantdifference between premature and full-term infants. Again, there is generalagreement that V02 rises soon after birth in both full-term and prematurebabies, the disagreements if any being concerned with the time course andmagnitude of the rise. It would be tedious to examine at length smalldifferences between different studies; for details the papers quoted aboveshould be consulted. In any case, small differences in absolute values maywell arise because the type of population sampled and also the experimentaltechniques and apparatus employed vary between different groups ofworkers.
Since the same apparatus and experimental technique was used in thisstudy and that of Hill & Rahimtulla (1965) on full-term babies, it is pos-sible to compare the absolute values obtained closely. Over the age rangeof 0-10 days differences in 1V02/kg between the four groups of prematurebabies and the full-term babies are not great, and in general are notsignificant at the P = 0-05 level. Values for the small-for-dates babies runconsistently about 10% higher than those of full-terms, but this isprobably merely a reflexion of the fact small-for-date babies are light inweight largely because they possess a smaller amount of subcutaneous fat(which has a low metabolic rate compared with the rest of the body as awhole) than do other full-term babies. Sinclair & Silverman (1966) andScopes & Ahmed (1966) both reported a somewhat higher V02/kg insmall-for-dates babies than in babies whose weight was within normallimits for gestational age.At ages greater than two weeks a large and rather surprising difference
appears to exist between our results on premature infants and those ofothers on full-term babies. In the latter fo,2/kg has been found to stayconstant at roughly 7'2 ml./min from two weeks up to one year of age(Benedict & Talbot, 1921; Karlberg, 1952: see Hill & Rahimtulla, 1965,Fig. 8), whereas the metabolic rate of premature infants reported herecontinued to rise after two weeks, reaching much higher values, around9 ml./min, by 1-2 months. There seems no obvious explanation for thisdifference; it suggests, at a purely practical level, that calorie require-ments per unit body weight are likely to be considerably greater in prema-ture than in full-term babies after the immediate neonatal period.The question of what 'metabolic reference standard' is best related to
VO, has been investigated by Sinclair, Scopes & Silverman (1967) on agroup of babies whose ages covered a much narrower range (2-10 days)than our sample, barely overlapping the third age class in Table 3 andFig. 10 of this paper. They were concerned to find a function of the bodyweight that was directly proportional to V02 in order to derive an expres-
700

02 CONSUMPTION IN NEW-BORN INFANTS 701
sion for 1t0,/metabolic reference standard that was constant and thusindependent of body weight (range in their sample 1-4 kg). After rejectingbody weight itself, surface area, body weightb73, and two more functionsof body weight, they concluded that (body weight - extracellular fluid)came closest to the function they were seeking. However, since they hadnot measured extracellular fluid (ECF) independently on the individualbabies, but had calculated it from body weight (see their Table II), in factthey were assessing the constancy of Jo,/(W - 0 561 WO8m).
Unless it has an established theoretical basis, the usefulness of a functionshould be judged both by its accuracy in predicting values of one variable(Ito,) from the other (W), and by its simplicity. Sinclair et al. (1967)maintain that fo./W-ECF is superior to the functions they rejectedbecause the use of these latter 'contributes to a systematic variation in theexpression of metabolic rate among neonates'. But a systematic variationthat is related to body weight cannot be regarded as an error. In thisconnexion their Table V gives a false impression because it gives the totalstandard deviation without breaking it down into its two componentparts, the systematic part due to linear regression which is not an error,and the residual part (due to deviations from the linearity) which is. Theresidual error, which is what limits the accuracy of their prediction, doesnot appear to vary in their Figs. 1-6, nor to be obviously less in the formu-lation that they have chosen. Over the question of simplicity and ease ofcalculation there seems little doubt that the equation they favour
r02 = (0 16 W+ 1135) (W- 0-561 Wo-8.)is unnecessarily complex since their results can be expressed with equalaccuracy as a simple power function of body weight,
02 = 5.05 x WI 22 (r = 0-97, P < 0-001),the coefficient of variation of the residual deviation amounting to 5-4% ofthe mean. These two equations yield virtually identical values for 02;the line that they define is indicated by the dashed line in Fig. 11 in whichthe data of Sinclair et al. (1967) taken from their Table III have beenplotted as Tfos against body weight. Since the data are fairly scattered avariety of equations might be found to fit the data reasonably well. Anequation which relates ro, to body weight (continuous line in Fig. 11)also fits the data well,
rOs = (7.4x W)-2 8 (r = 0-96, P < 0.001)with a coefficient of variance of residual deviation = 14-3% of the mean.The data do not appear to be fitted quite as well by an equation in which VO,is directly proportional to body weight, see e.g. dotted line in Fig. 11.

JUNE R. HILL AND D. C. ROBINSON
30
.
* a
25
20
- -iE15
0
10
5
0
.
0*O
a
0 -
.0
/-0
0
'00 .
.
0
I 2 3 4Body weight (kg)
Fig. 1 1. Data taken from Table III of Sinclair et al. (1967). Ordinates: 1ro,, ml./min.Abscissae: body weight (W), kg. * American series, 0 British series.Dashed line: regression of log r02 on log W fitted to the data by least squares
(92 pairs). Equation V09 = 5.05 x W1l22 (r = 0-97, P < 0 001, coefficient of varianceof residual S.D. = 5-4% of the mean). The dashed line also describes the equationfitted by Sinclair et al. (1967) to their data, viz. 'V2 = (0-16 W+11-35) (W-0-561 WO.8025).
Continuous line: regression of on W fitted by least squares (92 pairs).Equation r0, = (7.4 x W) - 2-8 (r = 0-96, P < 0-001, coefficient of variance ofresidual S.D. = 14-3 % of mean).Dotted line: shows for comparison a line drawn from the equation Vo. = 6-5 x W.
702
.
.
a
I I I I

02 CONSUMPTION IN NEW-BORN INFANTS 703
Clinically it is important to have predictive values, because these decidewhether a given individual is abnormal or not; and for this purpose asimple equation (provided its residual variance is reasonably small) is to bepreferred. The idea that Sinclair et al. (1967) have in mind, that V0o is pro-portional to W - ECF, is interesting, but can be properly tested only bymeasuring ECF as well as V02 on each individual baby.We are indebted to the many people on the staff of the London Hospital who co-operated
m this study. We wish to thank the consultant Paediatricians and Obstetricians, and theObstetric Nursing Sisters, particularly Miss Major, for their constant help and interest.We are particularly grateful to Professor K. W. Cross for continued advice and encourage-
ment, to Dr Kulsum Rahimtulla and Dr Sheila Lewis for performing some of the investiga-tions, and to Mrs Jean Gustavson for her expert assistance.
D.C.R. gratefully acknowledges receipt of a Nuffield Foundation Trainee Paediatricianaward. The expenses of part of this work were covered by a grant from the Spastics Society.
REFERENCES
ADAMS, F. H., FUJIWARA, T., SPEARS, R. & HODGEMAN, J. (1964). Gaseous metabolism inpremature infants at 32_-34° C ambient temperature. Pediatrics, Springfield 33, 75-82.
ADAMSONS, K. JR., GANDY, G. M. & JAMES, L. S. (1965). The influence of thermal factorsupon oxygen consumption of the newborn human infant. J. Pediat. 66, 495-508.
BENEDICT, F. G. & TALBOT, F. B. (1921). Metabolism and growth from birth to puberty.Carnegie Institute of Washington, Pub. no. 302.
BRUCK, K. (1961). Temperature regulation in the newborn infant. Biol. Neonat. (Basel) 3,65-119.
BUTLER, N. R. (1965). Perinatal death. Gestational Age, Size and Maturity, ed. DAWKINS,M. & MACGREGOR, W. C., pp. 74-82. London: Spastics Society and Heinemann.
BUTLER, N. R. & BONHAM, D. G. (1963). Perinotal Mortality, pp. 142-143. London: Living-stone.
HTTmT., J. R. & RAHIMTULLA, K. A. (1965). Heat balance and the metabolic rate of new-bornbabies in relation to environmental temperature; and the effect of age and of weight onbasal metabolic rate. J. Physiol. 180, 239-265.
KARLBERG, P. (1952). Determinations of standard energy metabolism (basal metabolism)in normal infants. Acta paediat., Stockh. 41, suppl. 89, 11-151.
LEVISON, H. & SWYER, P. R. (1964). Oxygen consumption and the thermal environment ofnewly born infants. Biol. Neonat. (Basel) 7, 305-313.
LUIBCHENCO, L. O., HANSMAN, C., DRESSLER, M. & BOYD, E. (1963). Intrauterine growthas estimated from live born birth-weight data at 24 to 42 weeks of gestation. Pediatrics,Springfield 32, 793-800.
McDONALD, A. (1965). Retarded foetal growth. In Gestational Age, Size and Maturity, ed.DAWKINS, M. & MACGREGOR, W. C., pp. 14-27. London: Spastics Society and Heinemann.
MESTYAN, J., FEKETE, M., BATA, G. & JA_RAI, I. (1964). The basal metabolic rate ofpremature infants. Biol. Neonat. (Basel) 7, 11-25.
SCOPES, J. W. & AHMED, I. (1966). Minimal rates of oxygen consumption in sick andpremature newborn infants. Archs Dis. Childh. 41, 407-416.
SINCLAIR, J. C., SCOPES, J. W. & SILVERMiAN, WV. A. (1967). Metabolic reference standardsfor the neonate. Pediatrics, Springfield 39, 724-732.
SINCLAIR, J. C. & SILVERMAN, W. A. (1966). Intrauterine growth in active tissue mass ofthe human fetus, with particular reference to the undergrown baby. Pediatrics, Spring-field 38, 48-62.
Phy. 9945