Embed Size (px)
Citation preview

Claire D. Coles, Ph.D.Departments of Psychiatry and Behavioral Sciences and Pediatrics
Emory University School of Medicine, Atlanta, GA
Albert Einstein College of MedicineMay 16, 2011

Departments of Psychiatry and Behavioral Sciences and Pediatrics, Emory University School of Medicine
Fetal Alcohol and Drug Exposure Center, at the Marcus Autism Center of Children’s Health Care of Atlanta

Biomedical Imaging Technology Center, Wallace H. Coulter Center
Emory University & Georgia Institute of Technology
Xiaoping P. Hu, Ph.D.
(Director)
Zhihao Li, Ph.D.
Longchaun Li, Ph.D.
Xiangchuan Chen, PhD.
Priya Santhanam, PhD
Gopikrishna Deshpande, PhD (Auburn University)
Maternal Substance Use and Child Development LaboratoryEmory University School of Medicine
Mary Ellen Lynch, Ph.D.
Julie A. Kable, Ph.D.
Department of Neurology
Felicia Goldstein, PhD.
Department of Psychology
Stephan Hamann, Ph.D.

Some of the Research discussed today was supported by:
National Institute on Alcoholism and Alcohol Abuse, R01
AA014373
National Institute on Drug Abuse, R01-DA 07362
Georgia Department of Human Resources

0
5
10
15
20
25
30
Marijuana Cocaine Other Alcohol Cigarettes
Ebrahim, SH, & Gfroerer, J (2003) Obstetrics and Gynecology, 101, p374-378
%

TM
U.S. Virgin Islands
State-Specific Weighted Prevalence Estimates of Alcohol Use
(Percentage of Any Use/Binge Drinking)
Among Women Aged 18 – 44 Years — BRFSS, 2008
State-Specific Weighted Prevalence Estimates of Alcohol Use
(Percentage of Any Use/Binge Drinking)
Among Women Aged 18 – 44 Years — BRFSS, 2008
Puerto Rico
53.1
14.8
53.1
14.8
53.0
12.9
53.0
12.9
43.3
12.8
43.3
12.8
51.7
18.0
51.7
18.0
45.0
12.9
45.0
12.9
54.4
19.3
54.4
19.3
49.1
15.0
49.1
15.0
56.6
14.7
56.6
14.7
42.6
10.0
42.6
10.0
20.4
6.5
20.4
6.5
51.6
15.5
51.6
15.5
54.0
23.0
54.0
23.0
57.0
19.4
57.0
19.4
53.2
18.9
53.2
18.9
49.2
12.8
49.2
12.8
43.6
11.6
43.6
11.6
40.9
11.3
40.9
11.346.1
12.0
46.1
12.0
56.9
19.3
56.9
19.3
58.2
22.9
58.2
22.9
49.2
16.0
49.2
16.0
39.8
11.1
39.8
11.1
45.6
10.7
45.6
10.7
35.3
8.9
35.3
8.9
31.7
8.0
31.7
8.0
38.0
9.9
38.0
9.9
55.4
19.4
55.4
19.4
68.4
23.9
68.4
23.9 58.8
18.7
58.8
18.7
47.6
12.3
47.6
12.3
54.5
16.3
54.5
16.328.8
6.9
28.8
6.9
38.1
9.5
38.1
9.547.1
12.5
47.1
12.5
40.8
11.4
40.8
11.4
40.4
11.8
40.4
11.8
49.5
14.7
49.5
14.7
51.1
12.8
51.1
12.8
52.5
18.9
52.5
18.9
58.7
18.2
58.7
18.264.0
17.9
64.0
17.9
61.2
12.5
61.2
12.5
63.9
16.0
63.9
16.0
58.0
18.1
58.0
18.1
63.1
19.5
63.1
19.5
55.2
17.1
55.2
17.153.8
14.9
53.8
14.9
62.1
21.9
62.1
21.9
Washington, D.C.
52.3
14.9
52.3
14.9
47.7
10.9
47.7
10.944.7
15.5
44.7
15.5
25.2
7.7
25.2
7.7
41.7
6.1
41.7
6.1
Any Use
Binge
CA
DE
MD
RICT
MA
ME
NH
VT
NJ
NY
PAOH
WV
VAKY
INIL
MI
WI
MN
TNNC
SC
GA
IA
HI
AK
NV
ND
SD
OR
WA MT
AZ
ID
WY
UT
CO
NM
OK
TX
NE
KS
ALMS
LA
MO
AR
FL
28.6
7.1
Guam

Alcohol is a TERATOGEN:
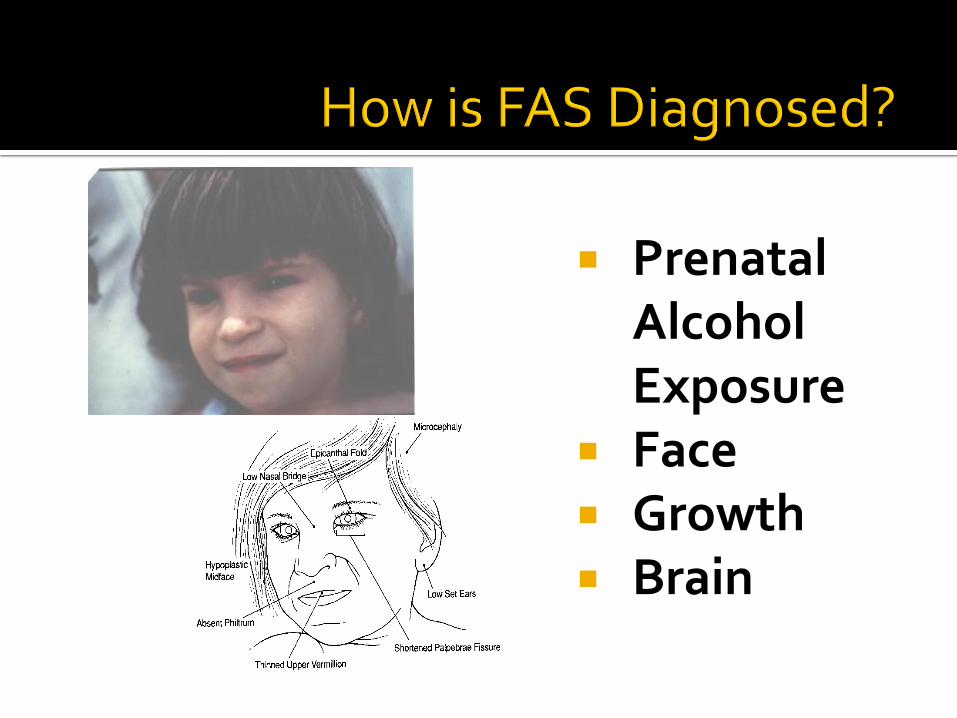
Prenatal Alcohol Exposure
Face Growth Brain
FAS

General Cognitive/Learning Skills (IQ) Executive Functioning Skills Attentional regulation Memory,Planning and organization
Motor skills Visual/spatial skills Academic Achievement Adaptive Behavior Social Behavior Mental Health/Behavioral Disorders

Adult Follow-up of Prenatally Identified Cohort-M age 22.5 Years
Predominantly African-American, Born 1980 to 1986
Documented exposure to EtOH and other drugs High levels of exposure (M=10+ AAoz/wk= 20+
drinks) Longitudinal vs Clinical sample; not biased by
behavior problems, etc Developmental and social history known

Controls- Recruited prenatally, same hospital and SES, no alcohol exposure.
Dysmorphic -Recruited prenatally, alcohol exposed, Dysmorphic Checklist score 1 SD above group mean.
ARND - Recruited prenatally, alcohol exposed, no dysmorphia, IQ<84.
Special Education (n=20) Recruited in adolescence, no alcohol exposure, Special Education services, Same SES.

Control
(n = 26)
ARND
(n = 36)
DYSM
(n = 30)
% Males 46.2 27.8 46.7
% A-A1 100 97.2 100
Age (yrs) 22.7 (1.7) 23.1 (1.6) 23.1 (2.2)
Ed (yrs) 12.3 (1.6) 11.7 (1.5) 11.8 (1.3)Dysm Score 3.62 (3.3) 4.7 (3.8) 9.43 (7.8)*
FSIQ2 84.0 (8.6) 80.5 (12.1) 76.0 (12.0)*
AA/oz/wk 0 (0) 7.7 (13.1)* 13.5 (13.6)*
1. African-American; 2. Full Scale IQ * Indicates a significant difference

Structure-Identify structural changes associated with prenatal alcohol exposure (PAE)-sMRI
White matter integrity-Using Diffusion Tensor Imaging (DTI), identify effects of PAE on structural connectivity
Activation-Using fMRI, examine differences in activation of candidate ROIs-Math and Attention Tasks
3T Siemens Magnetom Trio Scanner

PAE is associated with structural changes in brain
PAE affects white matter integrity PAE is associated with alterations in BOLD
activation in areas responsible for Math performance
PAE affects brain networks responsible for structural and functional connectivity

96 separate measurements of brain volume, ranging from total Intracranial volume to subcortical structures (e.g., hippocampus)using Free surfer Examined:
▪ Cortical regions
▪ Subcortical
▪ Corpus Callosum Compared:
Alcohol exposure vs Nonexposed Controls
Alcohol “affected” vs “non-affected” vs Controls

SFr: Superiorfrontal
RMF: Rostralmiddlefrontal
CMF: Caudalmiddlefrontal
PTr: Parstriangularis
POr: Parsorbitalis
LOF: Lateralorbitofrontal
PrC: Precentral
PoC: Postcentral
SuM: Supramarginal
SPa: Superiorparietal
STe: Superiortemporal
ITe: Inferiortemporal
LOc: Lateraloccipital,
CAC: Caudalanteriorcingulate
PCu: Precuneus
Cun: Cuneus
PCa: Pericalcarine
Lin: Lingual
Fus: Fusiform
PHi: Parahippocampal
RAC: Rostralanteriorcingulate
IPa: Inferiorparietal
POp: Parsopercularis.
Chen, et al., (2011) ) Understanding Specific Effects of Prenatal Alcohol
Exposure on Brain Structure in Young Adults, Human Brain Mapping
Cortical regions exhibiting PAE effects (N=92)

Cbr: Cerebral Cortex
Cbe: Cerebellum
Cortex
Tha: Thalamus Proper
Hip: Hippocampus
Put: Putamen
Pal: Pallidum
Amy: Amygdala
Cau: Caudate
Acu: Accumbens
Area.
R: Right Hemisphere,
L: Left Hemisphere.
Sub-cortical regions exhibiting PAE effects, (N=92)

. Segmentation of the corpus callosum (A), in which some
portions (1, 4 and 5) exhibited the general PAE effect (B). 1:
Anterior, 2: Mid-Anterior, 3: Central, 4: Mid-Posterior, 5:
Posterior.
Effects of Prenatal Alcohol Exposure on Corpus Callosum Volume
•Chen, X., C.D. Coles, M.E. Lynch, X. Hu (2011, in Pre ) Understanding Specific Effects of
Prenatal Alcohol Exposure on Brain Structure in Young Adults, Human Brain Mapping ss
0
50000
100000
150000
200000
250000
LC Cortex RC Cortex LCB C'tex RCB C'tex
Control
EtOH
DYSM
SpecED
Brain Region
p<.02 p<.03 p<.04 p<.04
In Cerebral
Cortex,
Dysm<Controls,
Left, p<.008;
Right, p<.05, no
other groups are
significantly
different.
Coles, Li, et al. 2008

0
50000
100000
150000
200000
250000
Lcerebral Rcerebral Lc'bellum Rc'bellum
Control
EtOH
DYSM
SpecED
Brain Region
p<006 P<.008 p=.07 p=.09
In Cerebral
Cortex,
both
alcohol
groups
differ from
both
control
groups and
not from
each other.
Coles, Li, et al. 2008
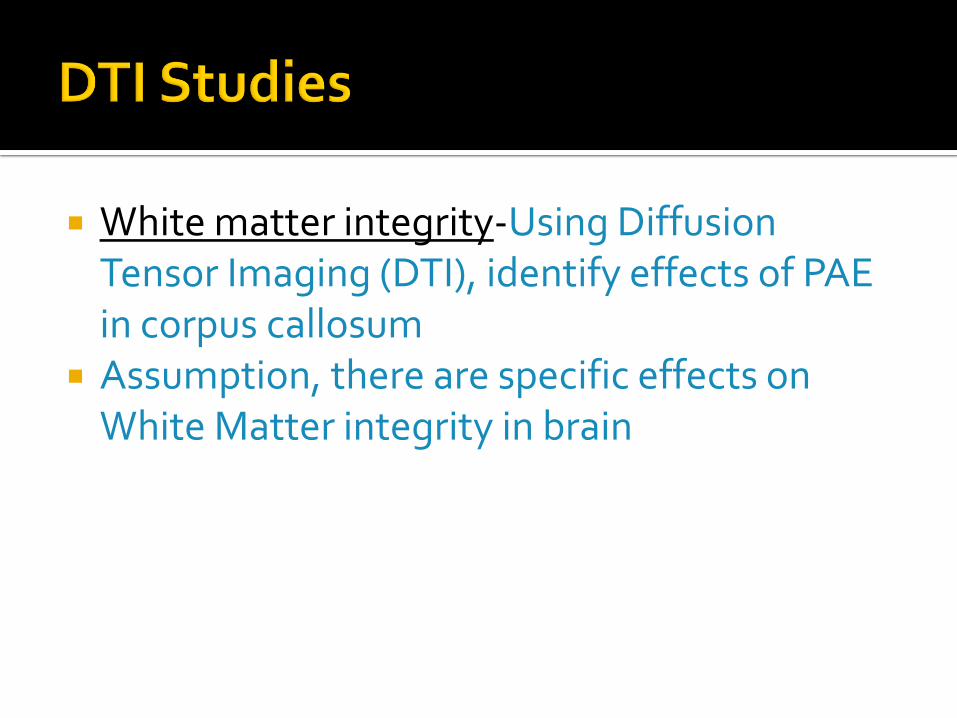
White matter integrity-Using Diffusion Tensor Imaging (DTI), identify effects of PAE in corpus callosum
Assumption, there are specific effects on White Matter integrity in brain
Diffusion Tensor Imaging examines white matter integrity and white matter tracts.
Behavioral data in alcohol-affected individuals suggests a effect on white matter integrity.
Structural neuroimaging studies indicate differences in white matter, particularly loss of white matter in alcohol-affected individuals.

FA-Fractional Anistropy-How strongly directional local tract structure is. Responsive to conditions that affect axon development or damage axons reflected in low FA and Hi MD.
MD-Mean diffusivity. Average Diffusion in all 3 directions.
AD-Axial Diffusivity- Mean magnitude of water diffusion parallel to axon direction within the voxel of axon tracts-measures axonal integrity
RD-Radial Diffusivity-Mean magnitude of water diffusion perpendicular to axon tracts-measures demylenization

LI, Coles, Lynch, & Hu, Human Brain Mapping, 2009

Skeletonized FA difference between Control and Non-Dysmorphic PAE groups
(green=skeleton, purple=anatomically defined ROI, pink=region of significant
difference). Similar differences were seen between control and dysmorphic PAE
groups.
Santhanam, et al, 2011, in press
Using TBSS for DTI analysis, voxel-wise statistics on the skeletonized FA data reveal
subregions of the cingulum with significantly lower FA values in both PAE groups
versus control subjects.

TBSS results for bilateral cingulum. ROI shows significant differences between
(a) Control and Non Dysmorphic PAE groups
(b) Control and Dysmorphic PAE groups in FA.
Green indicates mean FA skeleton and red indicates regions of significant difference between groups, with thickened red-yellow for the bilateral cingulum ROI. Axial slices shown are z=107 to z=112.

Controls Non-Dys PAE Dys PAE
Controls Non-Dys PAE Dys PAE
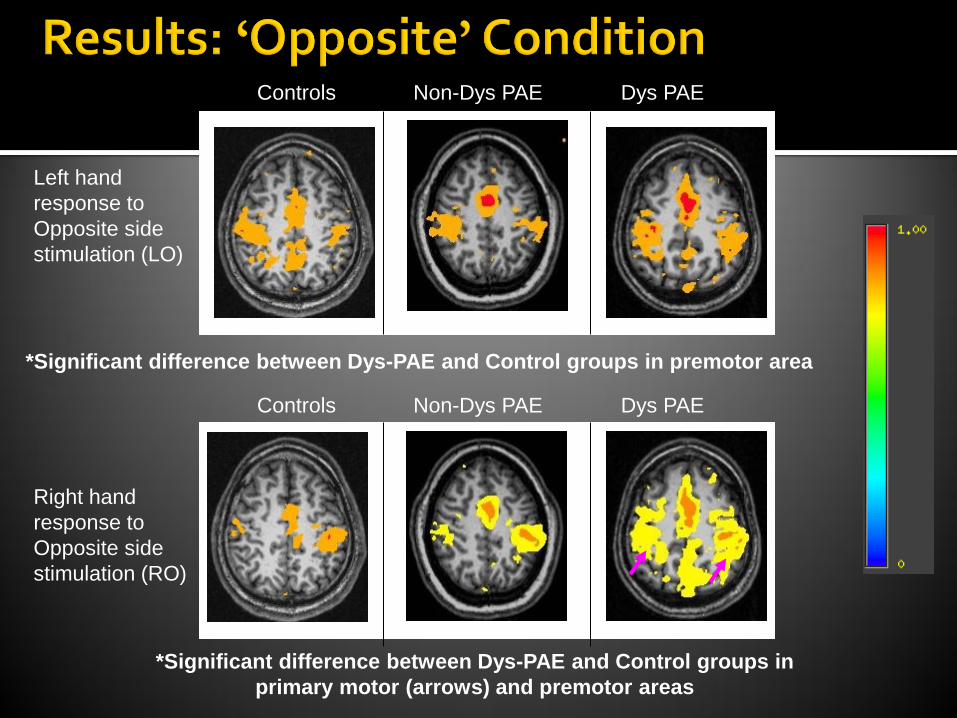
Left hand
response to
Opposite side
stimulation (LO)
Right hand
response to
Opposite side
stimulation (RO)
*Significant difference between Dys-PAE and Control groups in
primary motor (arrows) and premotor areas
*Significant difference between Dys-PAE and Control groups in premotor area

29
Group maps of task-related activation
Control
Non-dysPAE
Dys PAE
Control-NonDys
Control-Dys
Difference maps of task-related activation
+
_

Regions of default mode deactivation during arithmetic task (using letter-matching task as baseline). MPFC and PCC clusters from these group average activation maps were used for subsequent resting-state analysis. Color bar indicates these regions are negatively activated.
Figure 1

Resting-state functional connectivity (correlation) group maps (a) with and (b) without global signal regression. At threshold p<0.001, only positive correlation (red-yellow was noted with the seeding region regardless of regression method. Seeding was in the PCC region defined in Figure 1.
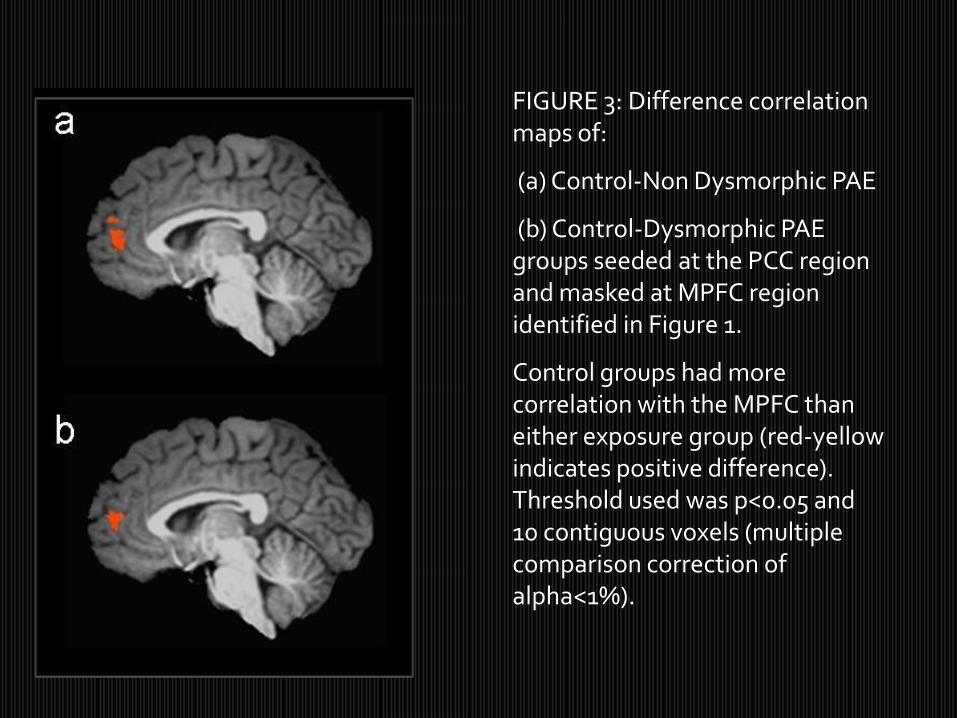
FIGURE 3: Difference correlation maps of:
(a) Control-Non Dysmorphic PAE
(b) Control-Dysmorphic PAE groups seeded at the PCC region and masked at MPFC region identified in Figure 1.
Control groups had more correlation with the MPFC than either exposure group (red-yellow indicates positive difference). Threshold used was p<0.05 and 10 contiguous voxels (multiple comparison correction of alpha<1%).

Task related reactivity in DMN affected by PAE
Structural Connectivity lower (DTI) Functional Connectivity affected (fMRI) Implies that structural connectivity deficit
affects functional network in system that modulates attention and cognition

Genetic differences that characterize women who use drugs/alcohol during pregnancy
Social factors, like nutrition, post natal environment, social class, ethnic group…
Polydrug exposure prenatally and postnatally Experimental characteristics-sample
selection, research design, and so forth

Evidence for persistent, global deficits even when SES and postnatal environment accounted for.
In addition to global deficits, there may be specific cognitive problems in the following areas: Motor functioning, visual spatial skills, math, memory.
MRI (and fMRI) suggest neurological basis for behavioral findings.
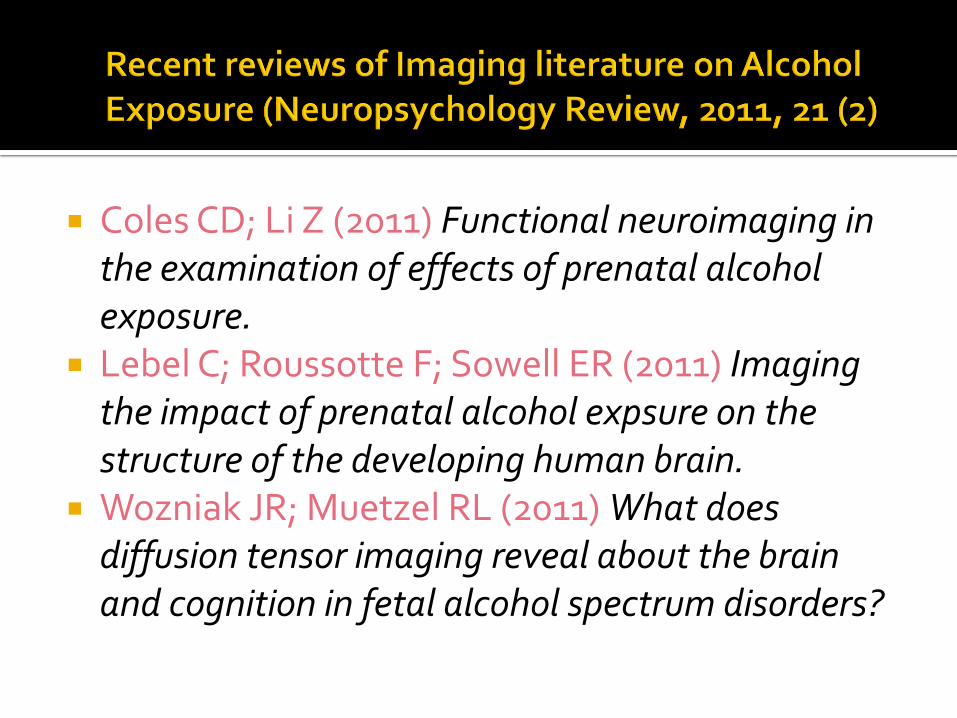
Coles CD; Li Z (2011) Functional neuroimaging in the examination of effects of prenatal alcohol exposure.
Lebel C; Roussotte F; Sowell ER (2011) Imaging the impact of prenatal alcohol expsure on the structure of the developing human brain.
Wozniak JR; Muetzel RL (2011) What does diffusion tensor imaging reveal about the brain and cognition in fetal alcohol spectrum disorders?
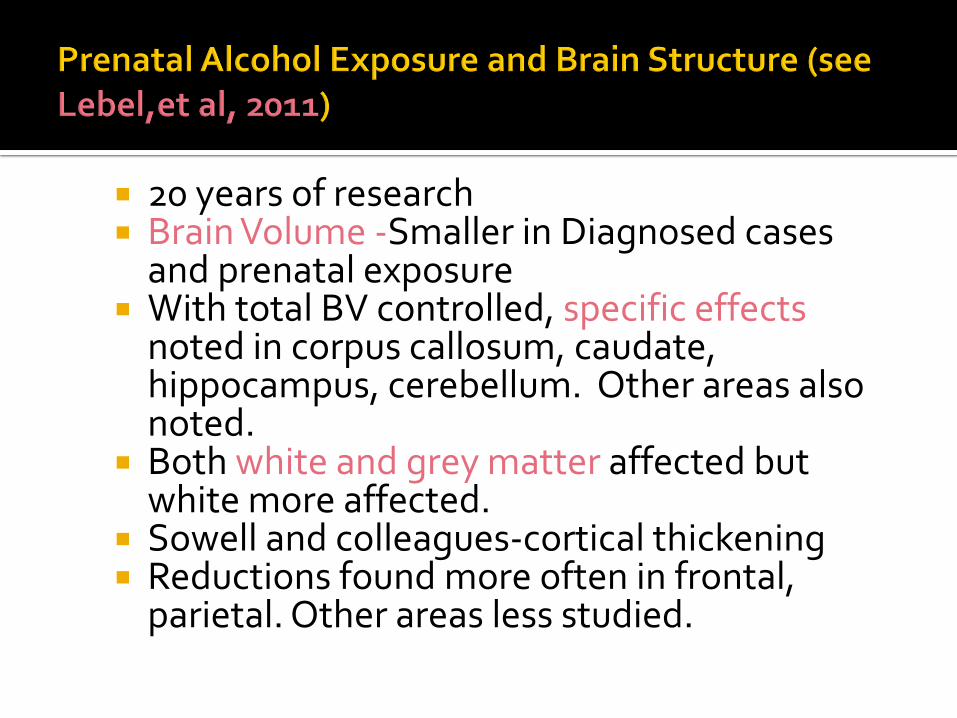
20 years of research Brain Volume -Smaller in Diagnosed cases
and prenatal exposure With total BV controlled, specific effects
noted in corpus callosum, caudate, hippocampus, cerebellum. Other areas also noted.
Both white and grey matter affected but white more affected.
Sowell and colleagues-cortical thickening Reductions found more often in frontal,
parietal. Other areas less studied.

7 Studies, 2 with adults, 5 with older children and adolescents.
Microstructural anomalies found in many regions studied, but particularly, Corpus Callosum
Structural and functional deficits appear related DTI seems sensitive to teratogenic effects of
alcohol; however, effects are not specific but similar to those in other disorders
Lack of developmental norms makes interpretation difficult.