Embed Size (px)
Citation preview
ACCELERATED/k&BREVIATED TEST METHuDDS, STUDY 4 OF TMK 3 ( E W 5 U O T i O N l ) 8 F TlHE 1QW.COIST SILICON SOLAR ARRAY PRUJ ECT
Wmrk Perfannd Under Contract No. NAS-7-180.95M58
U.S. Department of Energy
Solar Energy
DISCLAIMER
This report was prepared as an account of work sponsored by an agency of the United States Government. Neither the United States Government nor any agency Thereof, nor any of their employees, makes any warranty, express or implied, or assumes any legal liability or responsibility for the accuracy, completeness, or usefulness of any information, apparatus, product, or process disclosed, or represents that its use would not infringe privately owned rights. Reference herein to any specific commercial product, process, or service by trade name, trademark, manufacturer, or otherwise does not necessarily constitute or imply its endorsement, recommendation, or favoring by the United States Government or any agency thereof. The views and opinions of authors expressed herein do not necessarily state or reflect those of the United States Government or any agency thereof.
DISCLAIMER
Portions of this document may be illegible in electronic image products. Images are produced from the best available original document.
DOE/ JPL/95445Y-9 Distribution Category l!C-63b
C76-819.7/201
EIGHTH QIJPXTERLY PROGRESS REPOFT
(Covering January through March 1978)
on
ACCELERATED/ABBREVIATED TEST METHODS
STUDY 4 OF TASK 3 (ENCAPSULATION) OF THE
LOW-COST SILICON SOLAR ARMY PROJECT
JPL CONTRACT NO. 954458
I NOTICE
The D L Low-Cost Silicon Solar Array Project i s sponsored by the U. S. Department of Energy and forms par t of the Solar Photovoltaic Conversion Program t o i n i t i a t e a rrajor e f fo r t toward the development of low-cost solar arrays. This work was performed for the J e t Propulsion Laboratory, California Institute of Technology by agrcement between NASA and DOE. ' .
Prepared April 3, 1978
by
J. M. Kolyer , Principal Investigator
Rockwell International Autonetics Strategic Systems Division
Elaebenic Syateme Group 3370 Miralorna Avenue
P.O. Box 4192 Anaheim. C A 92803
TABLE OF CONTENTS
Page . . . . . . . . . . . . . . . . . . . . . . . . I SUMMARY 1
I1 . INTRODUCTION . . . . . . . . . . . . . . . . . . 2
I11 . DISCUSSION OF RESULTS THIS QUARTER . . . . . . . 2
A . First Year Study (Inherent Weatherability sf Trmpnrcnt hcapsulants) . . . . . . . . . . . 2
1 . T r a u p a l c ~ ~ L Plastic I3lm . . . . . - . . . . 2
a . Master Plot of Seasonal Outdoor Absorbance Data for Lexan . . . . . . . . . 2
b . Example of Empirical Curve-Fitting Using Lexan Accelerated Exposure Data . . . . . . 4
. . . . . . . . . 2 Universal Test Specimens (UI'S's) 4
B . Second Year Stdy . . . . . . . . . . . . . . . 5
1 . Inherent Weatherability of UTS1s with Nine Different Encapsulant-Substrate Conditions . 5
a . Outdoor Exposure . . . . . . . . . . . . 5
. . . . . . . . . . . . . b Accelerated Exposure 5
i . Data C1bt.a. ined . . . . . . . . . . . 5
ii . Observations . . . . . . . . . . . . 6
i ii . Predict ions . . . . . . . . . . . . 8
2 . Hyperacceleration by Highly-Concentrated Natural Sunlight . . . . . . . . . . . . . . . 9
. . . . . . . . . IV . CONCLUSIONS AND RECOMMENDATIONS 11
PLANS FOR NEXT QUARTER
VI . REFERENCES . . . . . . . . . . . . . . . . . . . 12
LIST OF FIGURES
Figure
1. Yellowing of Lexan in Phoenix (45'5) . . . . . . . . . . . . 2. Yellowing of Lexan in Miami (45's) . . . . . . . . . . . . . 3. Absorbance Data for Accelerated Exposure of Lexan . . . . . 4. Change in Solar Cell Power During Accelerated Exposure:
ArraySystem#l . . . . . . . . . . . . . . . . . . . . 5. Change in Solar Cell Power During Accelerated Exposure:
Array System #2 . . . . . . . . . . . . . . . . . . . . 6. Change in Solar Cell Power During Accelerated Exposure:
Array System # 3 . . . . . . . . . . . . . . . . . . . . 7. Change in Solar Cell Power During Accelerated Exposure:
ArraySystem#4 . . . . . . . . . . . . . . . . . . . . . 8. Change in Solar Cell Power During Accelerated Exposure:
Array System #5 . . . . . . . . . . . . . . . . . . . . 9. Change in Solar Cell Power During Accelerated Exposure:
ArraySystem#6 . . . . . . . . . . . . . . . . . . . .
Page
13
14
15
10. Change in Solar Cell Power During Accelerated Exposure: ' Array System #7 . . . . . . . . . . . . . . . . . . . . 22
11. Change in Solar Cell Power During Accelerated Exposure : Array System #8 . . . . . . . . . . . . . . . . . . . . 23
12. Change in Solar Cell Power During Accelerated Exposure: ArraySystem#9 . . . . . . . . . . . . . . . . . . . . 2 4
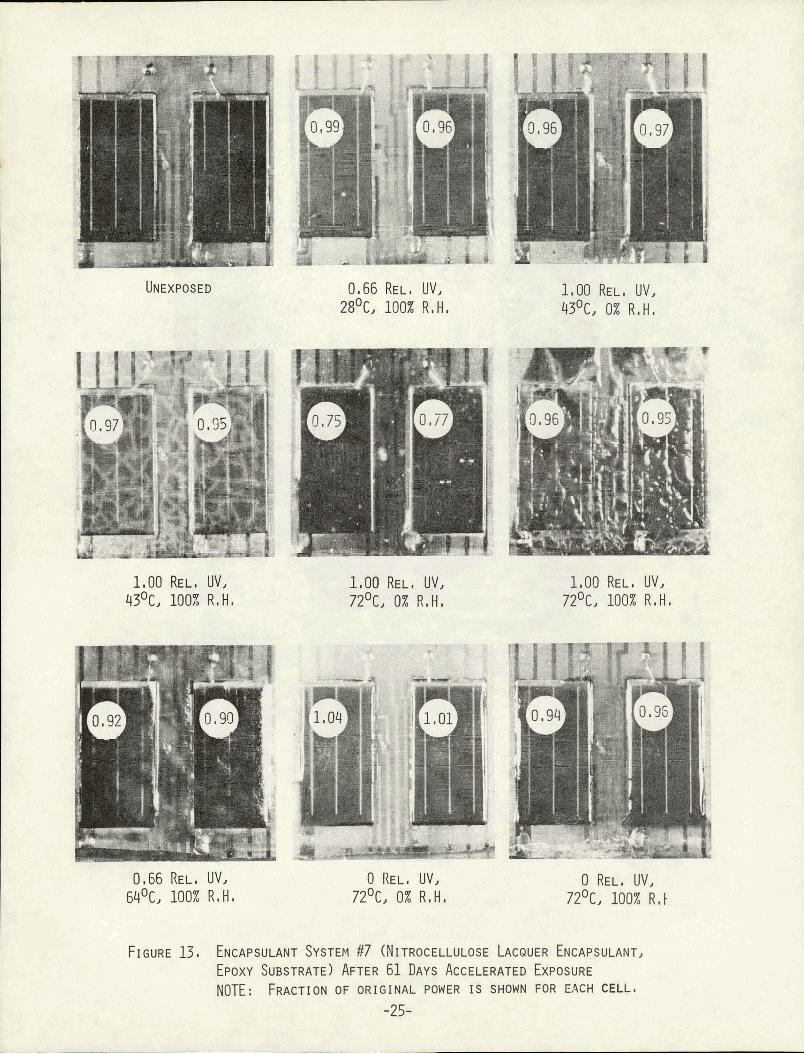
13. hcapsulant System #7 (Nitrocellulose Lacquer Encapsulant, Epoxy Substrate) After 61 Days Accelerated Exposure . . 25
14. Encapsulant System # 7 (Nitrocellulose Lacquer, Epoxy Substrate) After 61 Days Accelerated Exposure . . . . . 26
15. Encapsulant Systems #7-9 (Epoxy Substrate) After 61 Days Accelerated Exposure . . . . . . . . . . . . . . 26
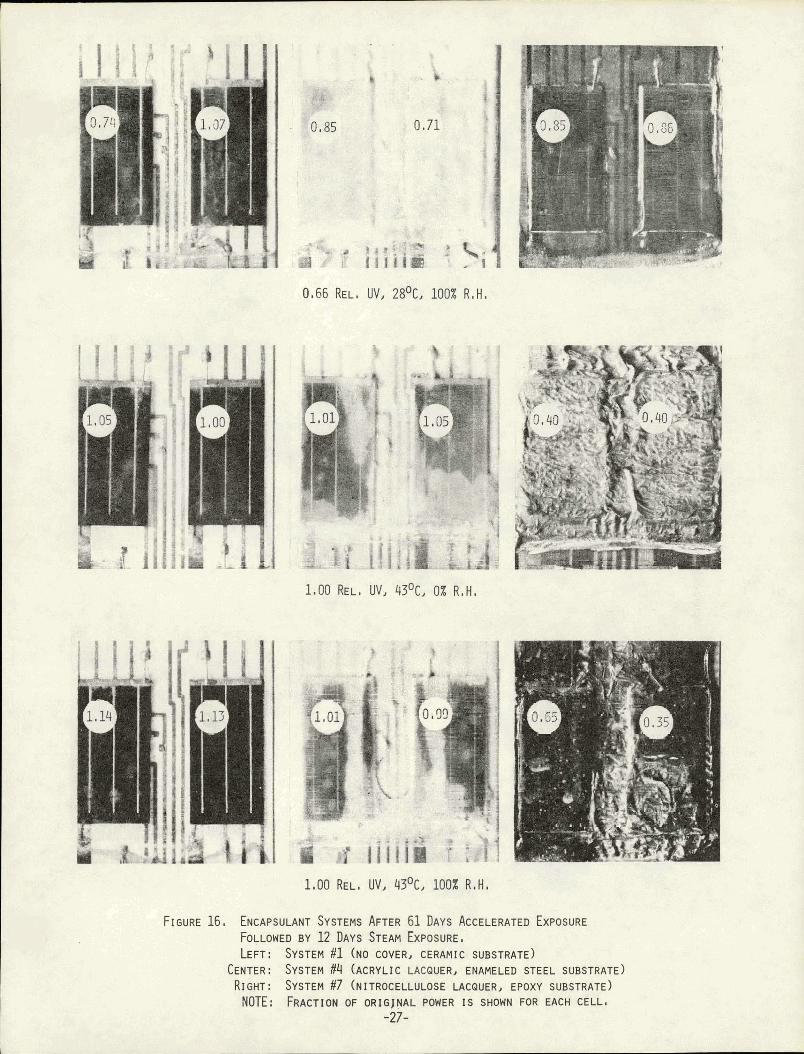
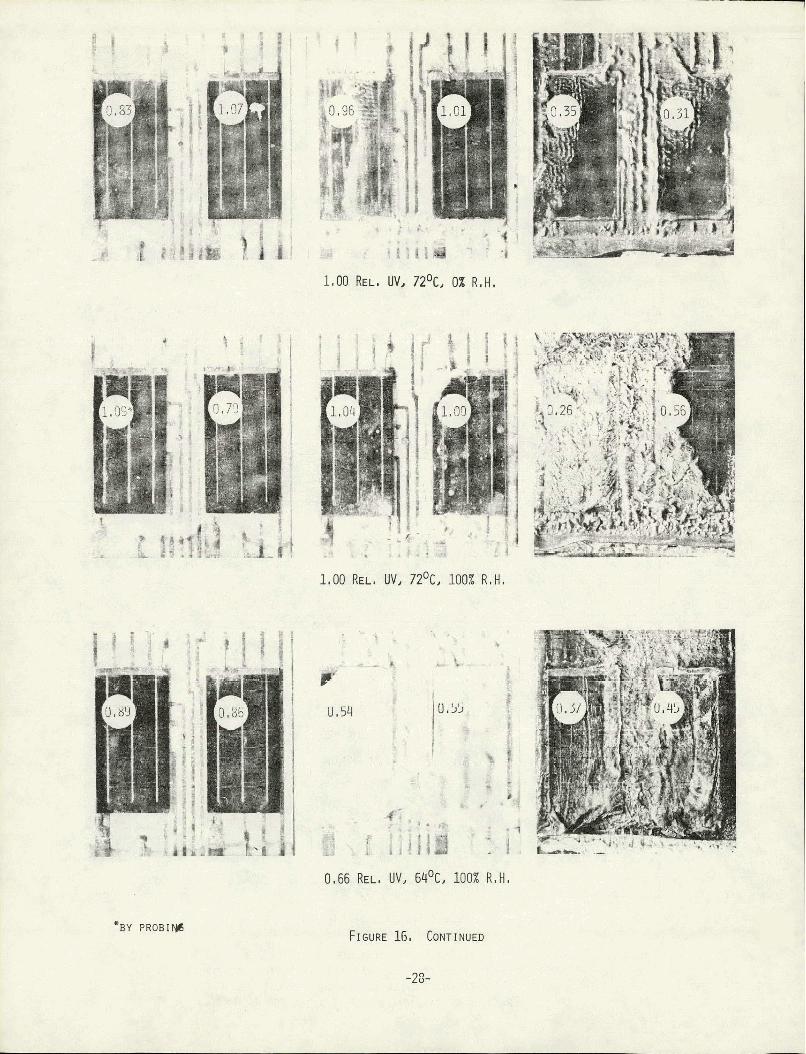
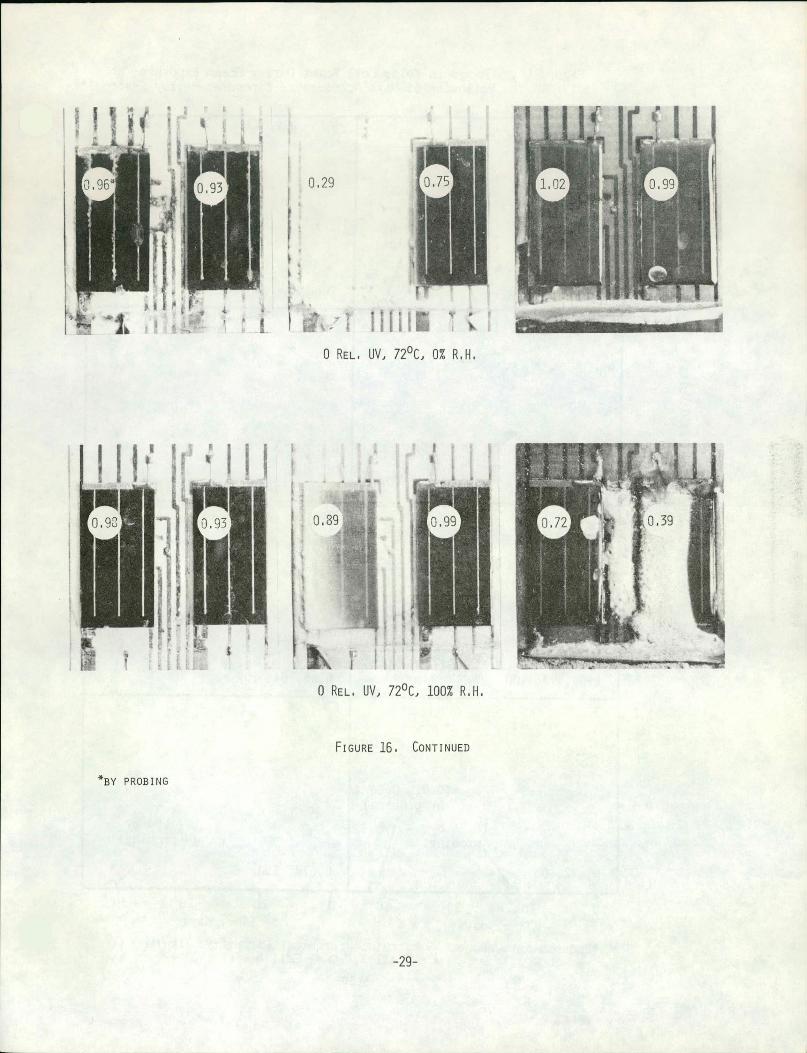
16. Encapsulant Systems After 61 Days ~icelerated Exposure rollowed by 12 Days Steam Exposure . . . . . . . . . . . 27
iii
LIST OF FIGURES (Cont'd)
Figure Page
17. Change in Solar Cell Power During Steam Exposure Following 61 Days Accelerated Exposure: Array System 1 . . . . . . 30
18. Change in Solar Cell Power During Steam Exposure Following 61 Days Accelerated Exposure: Array System 2 . . . . . . 31
19. Change in Solar Cell Power During Steam Exposure Following . . . . . . 61 Days Accelerated Exposure: Array System 3 32
20. C h w e in Solar Cell Power During Steam Exposure Following . . . . . . G1 Days Accelerated Exposure : Array .System 4 33
21. Change in Solar Cell Power hring Steam Exposure Following 61 Days Accelerated Exposure: Array System 5 . . . . . . 34
22. Change in Solar Cell Power During Steam Exposure Following . . . . . . 61 Days Accelerated Exposure: Array System 6 35
23. Change in Solar Cell Power During Steam Exposure Following . . . . . . 61 Days AcceleratedExposure: Array System 7 36
24. Change in Solar Cell Power During Steam Exposure Following 61 Days Accelerated Exposure: Array System 8 . . . . . . 37
25. Change in Solar Cell Power During Steam Exposure Following 61 Days Accelerated Exposure: Array System 9 . . . . . . 38
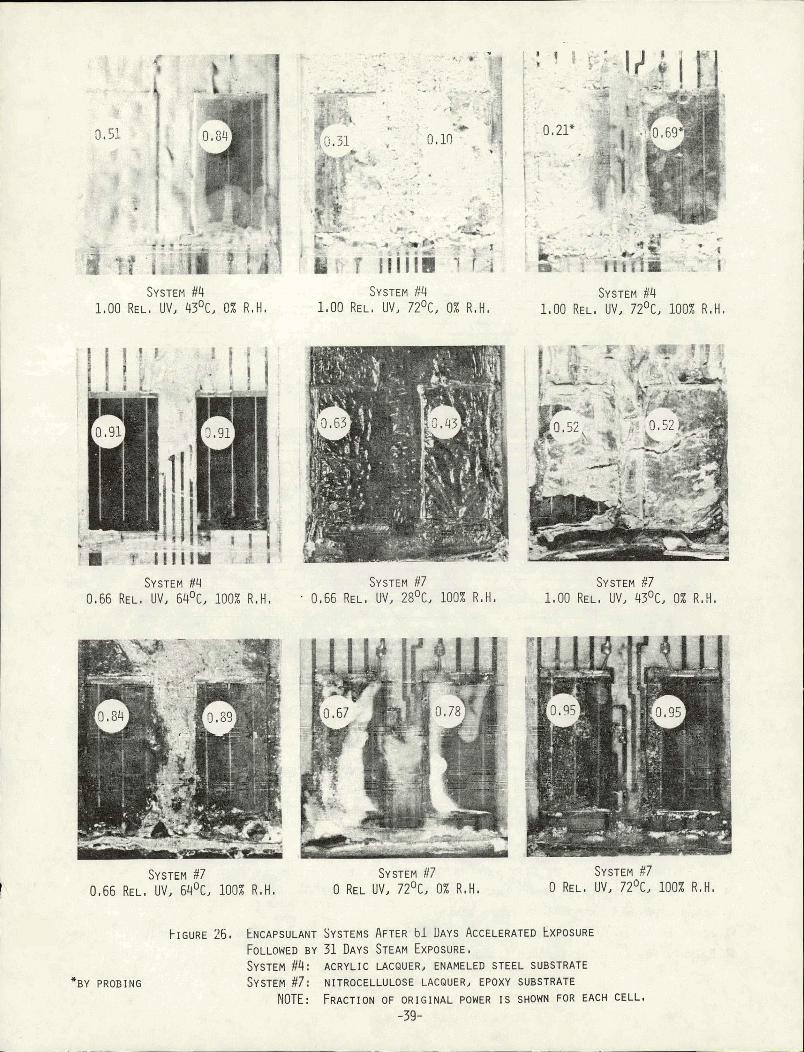
26. Encapsulant Systems After 67. Days Accelerated Exposure Followed by 31 Days Steam Exposure . . . . . . . . . . . 39
27. Increase in Absorbance of Plastic Films in Solar Furnace at1400 Suns vs. Xenon Lamp at1 Sun . . . . . . . . . . 40
28. Hypothetical Data Points Extrapolated by Lognormal bfodel . . 41
29. Hypothetical Data Points Extrapolated by Weibull Model . . . 42
Table
LIST OF TABLES
Page
IV.
v. VI.
VIII.
IX.
XI.
XII.
XIII.
XIV.
Monthly Rate Factors for Lexan Based on . . . . . . . . . . . . . Early Seasonal Absorbance Data 43
Electrical Data on UTS1s (First Study) after . . . . . . . . . . . . . . . 420 DaysOutdoor Exposure 44
Appearance of Encapsulant (Cover) after Accelerated Exposure for 61 Days . . . . . . . . . . . . 4 5
Appearance of Copper Circuitry after . . . . . . . . . . . . Accelerated Exposure for 61 Days 46
Sununary of Effects of Accelerated Exposure for 61 Days . . 47
Appearance of Encapsulant (Cover) af.ter Accelerated Exposure for 61 Days Followed . . . . . . . . . . . . . by Steam Exposure for 12 Days 48
Appearance of Copper Circuitry after Accelerated Exposure for 61 Days Followed . . . . . . . . . . . . . by Steam Exposure for 12 Days 49
Summary of Effects of Accelerated Exposure for 61 Days . . . . . . . . . Followed by Steam Exposure for 12 Days 50
Effect of Length of Circuitry Path on Solar Cell Power after Accelerated Exposure for 61 Days
. . . . . . . . . Followed by Steam Exposure for 12 Days 51
Sununary of Performance of Encapsulant Systems after Accelerated (Xenon Lamp) Exposure (61 Days) . . . . . . . . . . Followed by Steam Exposure (12 Days) 52
Ratio of Final to Original Leakage Current.at 18 Volts for FET's after Accelerated Exposure for 61 Days Followed by Steam Exposure for 12 Days . . . . . . . . . 53
Appearance of Encapsulant (Cover) after Accelerated Exposure for 61 Days Followed by Steam Exposure for 31 Days . . . 54
Appearance of Copper Circuitry after Accelerated Exposure . . . for 61 Bays Followed by Steam Exposure for 31 Days 55
Summary of Effects of Accelerated Exposure for 61 Days . . . . . . . . . Followed by Steam Exposure for 31 Days 56
LIST OF TABLES ( C o n t l d )
T a b l e Page
XV. Effect of Length of Circuitry Path on Solar Cell Power a f t e r Accelerated Exposure fo r 61 Days Followed by Steam Exposure f o r 31 Days . . . . . . . . .
XVI. Summary of Performance of Encapsulant Systems a f t e r Accelerated (Xenon Lamp) Exposure (61 Days) Followed by Steam Exposure (31 Days) . . . . . . . . . .
XVII. Effect on Substrates of Accelerated Exposure fo r 61 Days Followed by S tem~Expo~use fo r 31 Days . r r
XVIII. Ratio of Final t o Original Leakage Current a t 18 Volts for FET1s a f t e r Accelerated Exposure for 61 Days Followed by Steam Exposure fo r 31 Days . . . . . . . . .
XIX. Absorbance Data for P las t ic Fi1.m~ . . . . . . . . . . . . . . Exposed i n the Solar Furnace
XX. Tensile Test Data fo r Polystyrene Film Exposed in the Solar Furnace a t 1400 Suns . . . . . . .
XXI. Tensile Test Data.for Lexan Film Exposed i n the Solar Furnace a t 1400 Suns . . . . . . . . . . . . . . .
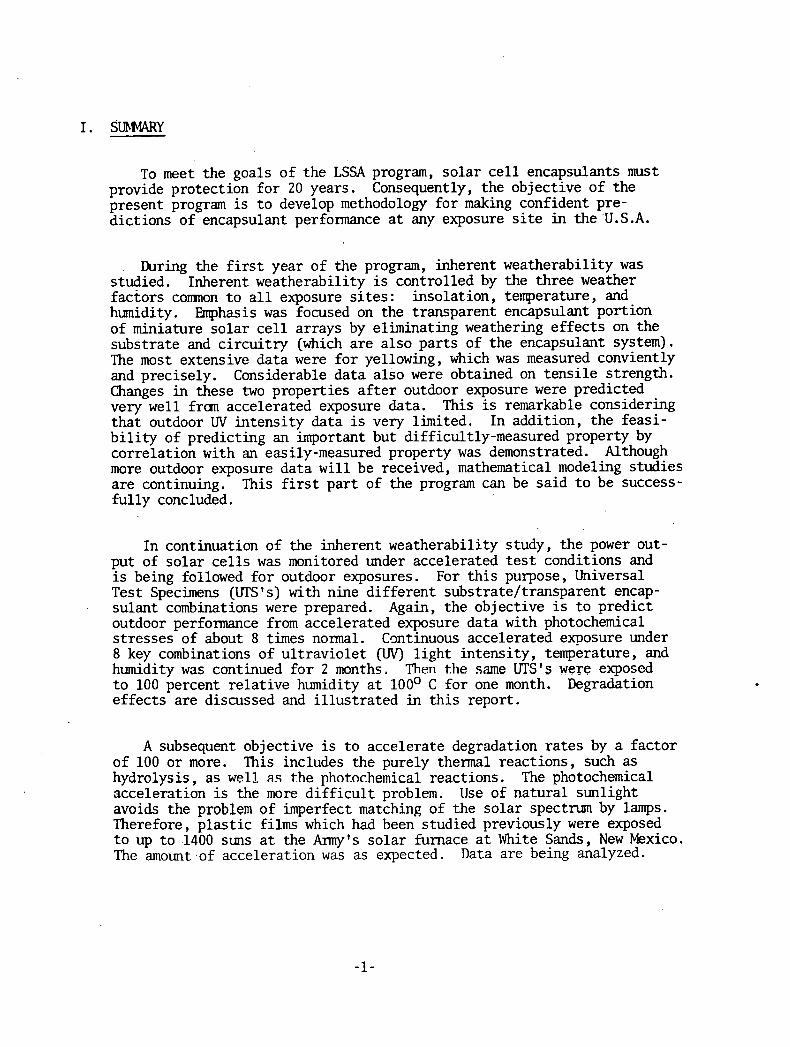
To meet the goals of the LSSA program, solar cell encapsulants must provide protection for 20 years. Consequently, the objective of the present program is to develop methodology for making confident pre- dictions of encapsulant performance at any exposure site in the'U.S.A.
During the first year of the program, inherent weatherability was studied. Inherent weatherability is controlled by the three weather factors comnon to all exposure sites: insolation, temperature, and humidity . hphas is was focused on the transparent encapsulant portion of miniature solar cell arrays by eliminating weathering effects on the substrate and circuitry (which are also parts of the encapsulant system). The most extensive data were for yellowing, which was measured conviently and precisely. Considerable data also were obtained on tensile strength. Changes in these two properties after outdoor exposure were predicted very well fran accelerated exposure data. This is remarkable considering that outdoor W intensity data is very limited. In addition, the feasi- bility of predicting an important but difficultly-measured property by correlation with an easily-measured property was demonstrated. Although more outdoor exposure data will be received, mathematical modeling studies are continuing. This first part of the program can be said to be success- fully concluded.
In continuation of the inherent weatherability study, the power out- put of solar cells was monitored under accelerated test conditions and is being followed for outdoor exposures. For this purpose, Universal Test Specimens (UTS ' s) with nine different subs trate/transparent encap - sulant combinations were prepared. Again, the objective is to predict outdoor perfonnance from accelerated exposure data with photochemical stresses of about 8 times nonnal. C~ntinuous accelerated exposure under 8 key combinations of ultraviolet (UV) light intensity, temperature, and hmidity was continued for 2 months. Then t.lie same UTS's were exposed to 100 percent relative humidity at loo0 C for one month. Degradation effects are discussed and illustrated in this report.
A subsequent objective is to accelerate degradation rates by a factor of 100 or more. This includes the purely thermal reactions, such as hydrolysis, as well. as the phnt.ochemica1 reactions. The photochemical acceleration is the more difficult problem. Use of natural sunlight avoids the problem of imperfect matching of the solar spectrum by lamps. Therefore, plastic films which had been studied previously were exposed to up to 1400 suns at the Amy's solar furnace at White Sands, New Mexico. The amount of acceleration was as expected. Data are being analyzed.
The f i r s t year study (inherent weatherability of transparent encap- sulants) is essentially complete. Successful predictions for the rate of .loss of properties on outdoor exposure were made for plast ic films based upon accelerated data. These predictions were summarized i n the Sixth Quarterly Progress Report and w i l l be presented in a paper a t the Conference on Aerospace Transparent Materials and Enclosures, Long Beach, CA, i n April of t h i s year. Degradation data for samples exposed begin- ning i n winter and sumner are s t i l l being monitored. The electr ical performance of solar ce l l s in WS1s exposed outdoors is also be in^ followed.
The second year study involves UTS1s with several transparent encapsulant-substrate systems which are relatively rapidly degraded on outdoor exposure. The key property being followed is maximum power out- put of the solar ce l l s . Results of the accelerated exposure program are discussed below. Outdoor samples w i l l continue to be returned a t inter- vals arid tested.
Of special interest is the possibi l i ty of hyperacceleration of photo- chemical degradation, e. g. , by 100 times. Feasibility was shown by exposing samples t o mirror-concentrated sunlight in a solar furnace. Data are discussed below.
DISCUSSION OF RESULTS THIS QUAKER - - . .- - - - - -.
A. Firs t Year Study (Inhcrcnt Wcathcrability a.E Transparent Glcapsu1alt.s)
1. Transparent Plast ic Films
a. Master . . . . .,.. ,- Pl . nt. nf Seasona.1 Outdoor Abso_rb-gse. _Data for Lexan
Results, except recent data on outdoor samples, lave already been tabulated (Reference 1 ) . Predictions were s m a r i z e d in the Sixth Quarterly Progress Report (for July through September 1977).
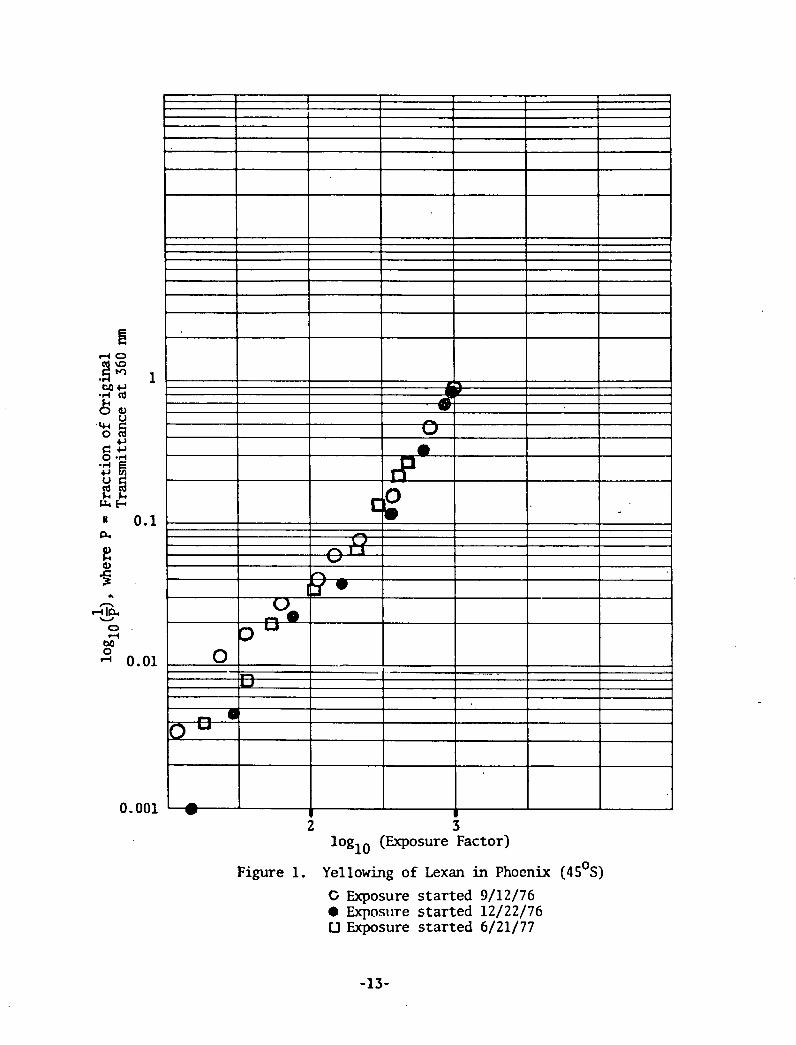
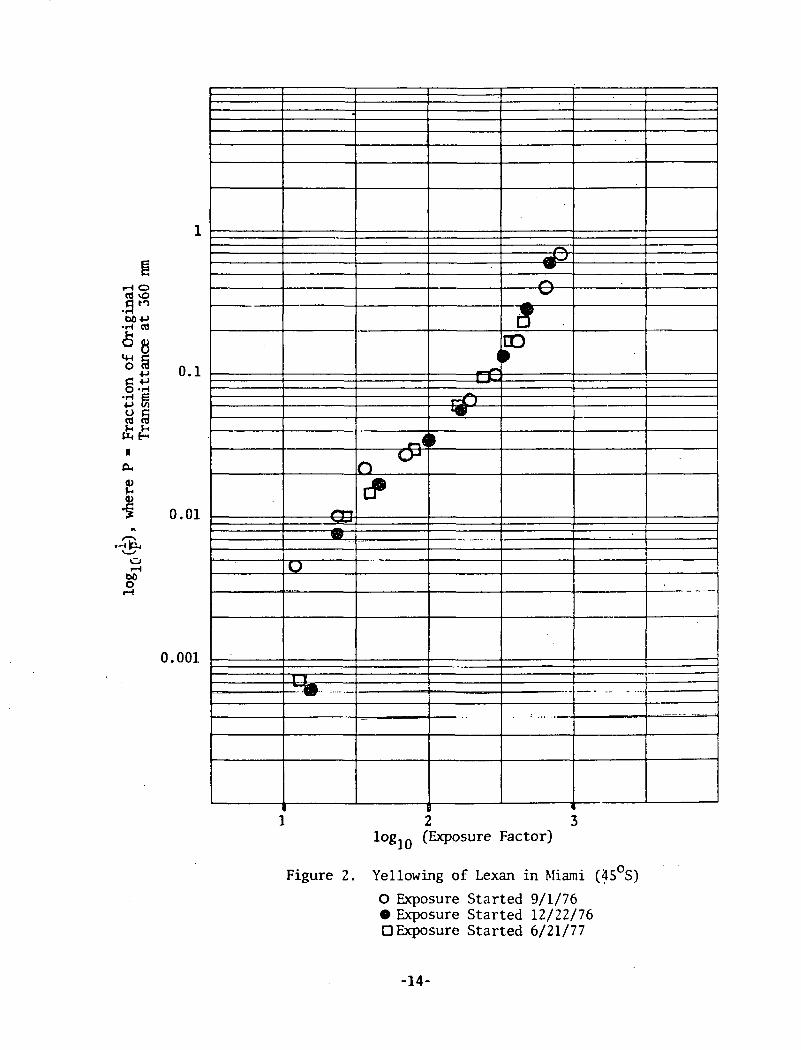
Using early seasonal degradation ra te data to estimate "exposure factors," the increase in absorbance a t 360 nanometers for Lexan exposed in Phoenix or Miami could be plotted into one approximate l ine regardless of the time of year when exposure s tar ted (Figures 1 and 2 ) . The method was as follows.
F i r s t , an exponential model was assumed. This a t l e a s t approximately f i t s the fac t s , and i t s use simplif ies calcula t io~ls . Also, t h i s model corresponds t o a simple photochemical r e a c t i ~ n i n which the accumulated chromophore (colored species) , which is d i r ec t l y proportional t o absorbance, is a lso d i rec t ly proportional t o the t o t a l W energy (in the appropriate wavelength region) received.
Next, ear ly seasonal absorbance data were used t o estimate "monthly r a t e factors" (Table I ) . These factors were plotted vs. month of the year, and a smooth curve was drawn through the points f o r each of the two s i t e s . NOTE: These data imply Phoenix has more W variat ion than Miami ( a t about 300 nun, the wavelength region causing yellowing of Lexan).
Finally, the "exposure factor" fo r a given sample was ca l - culated by averaging the "monthly r a t e factors" fo r the months of exposure and multiplying by the number of days of exposure. For example, the sample exposed i n Phoenix fo r 300 days s ta r t ing on 1 2 / 2 2 was outdoors during January ("monthly r a t e factor" = 1.0) , February (2.0) , March (2.7) , and so on through October (1.8). The average of the "monthly r a t e factors" i s (1.0 + 2.0 + 2 . 7 + . . . 1.8)/10 = 2.7, and 2.7 x 300 = 810. Log10(810) = 2.91,
1 a t which time logl0($ = 0.6958, and t h i s point w i l l be found
plot ted in Figure 1.
Convergence of data points (Figures 1 and 2) by t h i s nethod i s f a r c loser than had been at tained using "exposure factors" assumed from W data i n the l i t e r a tu r e . Although an exponential model (Weibull p lo t with slope = 1) had been assumed i n handling the seasonal e f f ec t s , the l a t e r data points f a l l in to a l i ne with slope = about 2 . That is , the model i s the Weibull model:
,-i
P = e '. This means t ha t the chromophore concentration is proportional t o the s uare of W l igh t deposited on the sample. However, other models, su as the lognormal, remain t o be t r i ed and may a l so f i t .
%
A ra t ional izat ion fo r the increase i n absorbance being pro- port ional t o the 'square of W l igh t deposited is tha t as the chromophore concentration increases more of the degrading W l igh t is absorbed so tha t the reaction is "autocatalytic".
b, Example of Empirical Curve-Fitting Using Lexan Accelerated b o s u r e Data
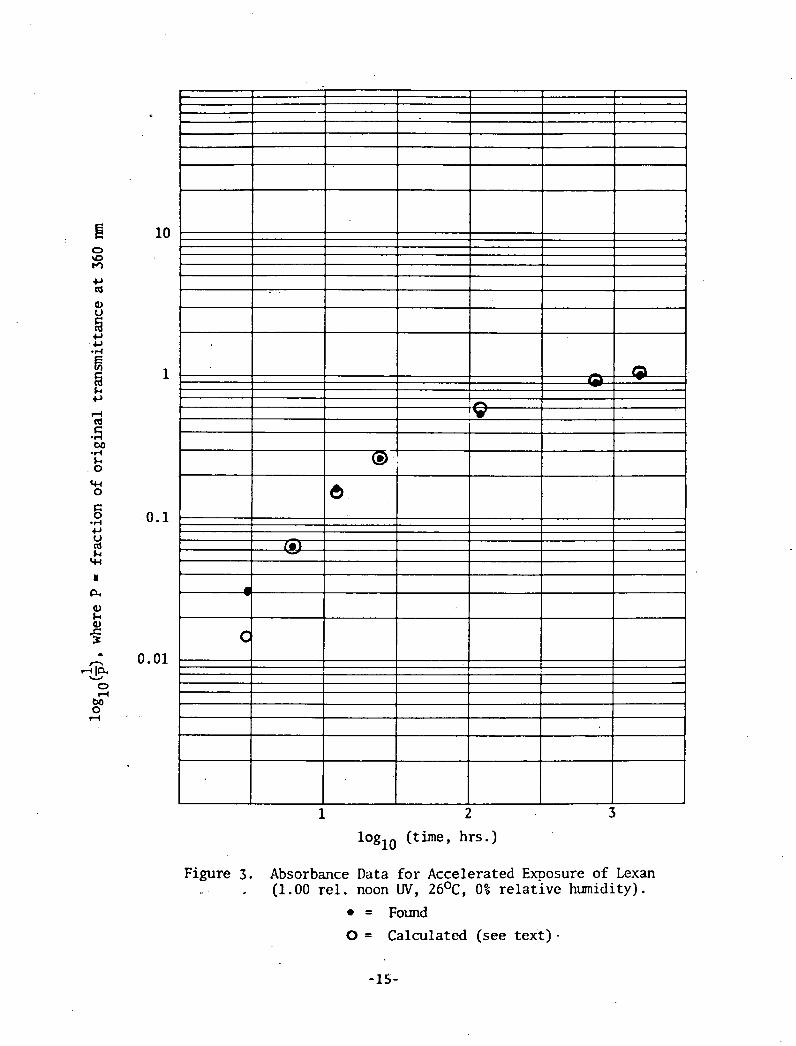
An example of empirical curve-fit t ing is shown i n Figure 3. The following equation was selected from Reference 2 :
y = aeb/x, where b is less than 0.
l inear form: In y = In a + b/x
The quantity logl0 (1000 log (A) )) was defined a s y , and In 10 Y
( t h e , hours) was defined as x. A suitable value of "a" was found by t r i a l and error t o be 3.55. Then, using the value of
7
logl0(;) found for 24 hours, "b" was calculated to be -1.21. Thus, the l inear form of the equation became.:
where t = time i n hours and P = fraction of original transmittance a t 360 m.
The factor of 1000 w a s used for convenience and subsequently removed. Figure 3 shows that a good f i t was achieved. This is
a Weibull plot . If ln\log10 ll000 loglO(~)) ] were plotted on the
ordinate and l / l n t on with abscissa, a s t raight l ine wo~ild resu l t , with slope -1.21.
2 . Universal Test S~ecimens .IUTSJsl
Electrical data arc now complcte for IITS's exposed for 42.0 days i n Phoenix and in Miami. Results are given in Table 11. The average percent of original power retaineC for the 6 solar ce l l s in each UTS was 100 fo r Phoenix, 82 for Miami, 93 for the M, and 99 for the EWAQUA. The degraded power output in Miami may be due to moisture- induced r.orrnsj.on of c e v metallization caused by high h1mi.di.t.y. The f ie ld effect t ransis tors (FET's) s t i l l have shown no notable increase in leakage current. (However, FET's do operated as expected. For example, accelerated exposure of the "second generation" UTS's followed by steam exposure increased leakage currents up t o l o 5 times. Outdoor exposure of the new UTSts also caused high leakage currents i n some cases.)
In physical appearance, the exposed Sylgard 184 encapsulant was dulled and s l ight ly dusty on the surface in a l l cases. On the other hand, it w a s quite clear internally. The Tedlar remained glossy and
and colorless in all cases, The Lexan became yellow on exposure but maintained its integri ty a f te r the 4S0S exposures. Note that unsupported Lexan samples were b r i t t l e and retained only about 25 percent of original tensi le strength a f t e r 300 days in Phoenix or Miami. Such a low tensi le strength nonnally means loss of integrity. However, Lexan cemented t o the Sylgard 184 on UTS1s w a s s t i l l intact a f t e r 420 days. This is an exanple of favorable interaction of encapsulant components. After E3MA exposure, the Lexan w a s deep yellow, rough-surfaced, and showed one large crack. During EMVIAQUA exposure, 'the Lexan cover w a s almost completely los t . However, there was no visible effect of exposure on the ceramic substrate or gold- plated circuitry. Assuming an acceleration factor of 6, 420 days of M ( Q U A ) exposure represents 7 years of normal exposure.
Four UTS's are sti l l on exposure for each of the four conditions. The next samples w i l l be returned a t 540 days.
B. Second Year Study
1. Inherent Weatherability of UTSts with Nine Different Enca~sulant- A
Substrate Combinations
a. Outdoor Exposure
The nine array systems are described in our Sixth Quarterly Progress Report. Outdoor exposure began a t Miami (4S0S) on 10/31/77 and a t Phoenix (4s0s, BMA, EbMAQUA) on 10/23/77.
Samples have been returned a f t e r 30, 60, and 90 days of ex- posure. As expected, there was no significant reduceion in solar c e l l power a f t e r 30 days. FET leakage current became high in a few cases. The other samples are being electr ical ly tested. Visible changes in transparent encapsulants and copper circui t ry were generally s l ight through 90 days. The next sampling point is 180 days.
b. Accelerated Exposure
Data Obtained
Accelerated (xenon lamp) exposure of twenty-four WS's (eight with each of the three substrates: ceramic, enameled s t ee l , and epoxy) was ended a f t e r 61 days. Results are sum- marized in Tables I11 - V and Figures 4 - 15.
These UTS1s were next exposed to steam a t 100° C for 1 2 days. Considerable additional degradation occurred. Results are s m a r i z e d in Tables VI - X I and Figure 16.
Finally, the same UTS1s were exposed again t o steam for an additional 1.9 days, bringing the to t a l time of steam ex- posure t o 31 days. Results are summarized in Tables X I 1 - XVIII and Figures 1 7 - 26.
Note that the i n s i t u solar ce l l power data are approxi- mate. The ~ i g u r e s ( 4 5 , 1 7 - 26) i l l u s t r a t e scat ter in values during "plateaus11 of performance vs. time,
ii. Obselvatio~ls
Figure 13 shows nitrocellulose lacquer a f t e r exposure t o a l l 8 accelerated conditions. I t i l l u s t r a t e s the advan- tages of multicondition exposure in clarifying the relat ive effect of W l ight , temperature, and moisture. For con- venience, the nine photographs w i l l be referred to as ftl, 2 , and 3 from l e f t t o right across the top, # 4 , 5, and 6 across the middle, and #7, 8, and 9 across the bottom. The followLIlg C O I ~ C ~ U S ~ O ~ S are drawn by comparing these photo- graphs. Figures 15, 16, and 26 also are referred to.
(I) n - e most prono~mced visible degradation (blistering) i s caused by:
[a] More W - # A worse than #9 # 5 worse thm #8
(b) Higher temperatures - #6 worse than # 4
(c) Increased humidity - #6 worse than #5 # 4 worse than ft3 H7 wurst, t.hui H Z #9 worse than #8
(2) Blistering is proportional t o l ight intensity. Co~~ipare #9 with #7, showing a relatively fine I 1 o ~ ~ n g c peelt1 tcxtt~re, and wi th f t 6 ,
(3) Photograph #3 represents NoCT a t noon in a dry, desert climate. Photograph #4 represents,NOn a t noon in a moist climate such as Miami. These resul ts i l l u s t r a t e the dramatic differences in encapsulant performance possible for dry vs. wet s i t e s .
(4) Incidentally, referring t o Figure 15, the effect of humidity i n causing ioss of gloss of the polyurethane encapsulant is clearly,shown.
(5) The nitrocellulose lacquer w a s degraded by moisture alone, with no previous W exposure, a t 100° C (Figures 16 (right column) and 26). However, pre- vious W exposure without moisture caused greater degradation in subsequent steam exposure. Therefore, weather factors can have a sequential effect.
(6) Under prolonged exposure, an encapsulant can become opaque. For example, see Figures 16, 23, and
26 fo r nitrocellulose lacquer originally exposed a t 0 r e l . W, 7Z0 C, and 100 percent R.H. There remained less material a f t e r 31 days of steam ex- posure than a f t e r 1 2 days. Consequently, the solar c e l l power dropped to about 50 percent of original a t 1 2 days steam exposure and rose to about 95 per- cent a t 31 days. The same e f e i s seen for nitro- cellulose lacquer originally exposed to 0.66 r e l . W, 64O C, and 100 percent R.H. (Figures 16, 23, and 26) and also for ac l i c lacquer originally exposed t o =6 0.66 r e l . W, 64 C , and 100 percent R.H. (Figures 16, 20, and 26).
Other observations are:
(1) Power loss by the solar ce l l s was surprisingly l i t t l e as encapsulants darkened and/or became opaque. For example, the loss was as l i t t l e . as 10 percent despite darkening of polyurethane encapsulant to the point of visual opacity. Opaque (milky) acrylic lacquer caused as l i t t l e as 15 percent power loss. See Figures 16 and 26 fo r ot.her examples.
(2) With no encapsulant, solar c e l l metallization (Ti/Ag coated with solder) resisted 100 percent relative humidity a t 72' C for 61 days followed by steam a t 1000 C for 31 days.
(3) There was no obvious effect of encapsulant degradation products on the ce l l s .
(4) Field ef ec t transistors (FET1s) gave leakage currents S up t o 10 times the original value af te r steam exposure.
(5) Enameled s tee l is a promising substrate.
(6) N o promising encapsulants are acrylic lacquer and a rubbery polyurethane pottant with glass cover.
(7) Copper circuitry may be feasible for modules if properly protected.
(8) The feasibility of taking in situ power .readings during multicondition exposure was demonstrated (Figures 4 - 12 and 17 - 25). Tape cables for this purpose were soldered to the edge contacts of the UTS's. Continuation of such measurements for a year, assuming a conservative time-compression "acceleration factor" of 8, would give perfomce vs. time curves simulating 8 years of outdoor exposure.
Disparj.t.i.es i.n p e r f o m c e between paired solar cells were generally not great in accelerated exposure (Figures 4 - 12) but were sometimes very large in steam exposure (Figures 17 - 25). One reason is that the Cu-plated Mom circuitry on the ceramic substrate (Figures 17 - 19) often corroded to failure. A longer circuitry path provided more opportunity for corrosion to reduce power, as shown in Tables IX and XV.
(10) The originally high resistance of the Cu-plated Mom circuitry lines is indicated by the fact that the direct probing of cells attached to short lines gave no higher than 111 percent of original power (Figure 17), while probing cells atLaclied ,to longer lines gave up to 146 percent of original power (Figure 18).
iii. Predictions
The plan was to follow the moisture-induced degradation of solar cell metallization (Ti/AG) as a measure of protection, essentially by moisture exclusion, afforded by the encapsulants. Huwever, thc solder-coated metallizatiun proved to be very moisture-resistant. Survival at 7Z0 C and 1 nfl percent relative humidity for 2 months suggests, by the rule of thumb that re- action rate doubles for each lo0 C rise in temperature, a lifetlme of at least 2x23 = 16 months under the most humid conditions at an average 'lcinctic tempcrtlturcM of 40' C. Further, the following month of survival in st am at 100' C % suggests an additional minimum lifetime of 1x2 = 64 months. The total is 16+64 = 80 months, or a minimum lifetime of about 7 years.
Steam exposure was an expedient for the purpose of forcin f failure of the unexpectedly moisture-resistant cells. The ce 1 metallization survived, but degradation of the cover encapsu- lants was interesting, especially in regard to the surprisingly small effect of visual opacity on solar cell power. However,
the steam temperature (100° C) may have given unrealistic results. For example, 100° C is considerably over the Tg of the acrylic lacquer, which was found by differential scanning calorimetry (DSC) to be about 630 C, at which tem- perature stress relief occurred, Therefore, a hydrolysis reaction may have been forced. This presumably resulted in a milkiness improbable under real conditions.
Accelerated exposuredata lead to predictions of maximum solar cell power. This should remain at over 90 percent of original for all the array systems under conventional (4S0S) exposure for at least 1.5 years, assuming an "acceleration factorf1 of 9. Similarly, the acrylic lacquer (System #4) and the glass/polyurethane encapsulants (Systems # 3 , 6, and 9) are predicted to remain unchanged after 1.5 years. The only accelerated conditions that degraded the acrylic lacquer were at a UTS temperature of 72O C, which exceeds the Tg of 630C as determined by DSC. Similarly, Tedlar was degraded only above its Tg (57O C by DSC) in accelerated exposure (Reference 1). On the other hand, severe degradation of nitrocellulose lacquer (System #7) is predicted at 1.5 years.
2. - Hyperaccelerat ion by Highly-Concentrated Natural Sunlight
These tests were conducted at the White Sands Missile Range in February. The plastic films under test were immersed in rapidly flaring water (5 liters/minute) in a quartz vessel (7.8 x 5.2 x 25 an. ID, 2 m.wall thickness). The light passed through 5.2 awater, which absorbs essentially all energy of wavelength above 1.3 microns (about 17 percent of the solar constant). Calorimetric readings were made on light actually passing through the sample, which was placed against the back inner surface of the vessel. The water entered the vessel at about 14O C and exited at about 35O C. This method worked smoothly, although clouds and gusty winds frequently interrupted operation of the furnace. The water-immersion met,hnd is valid because air and water have little effect on the photochemical yellowing re- actions (Reference 1) .
/
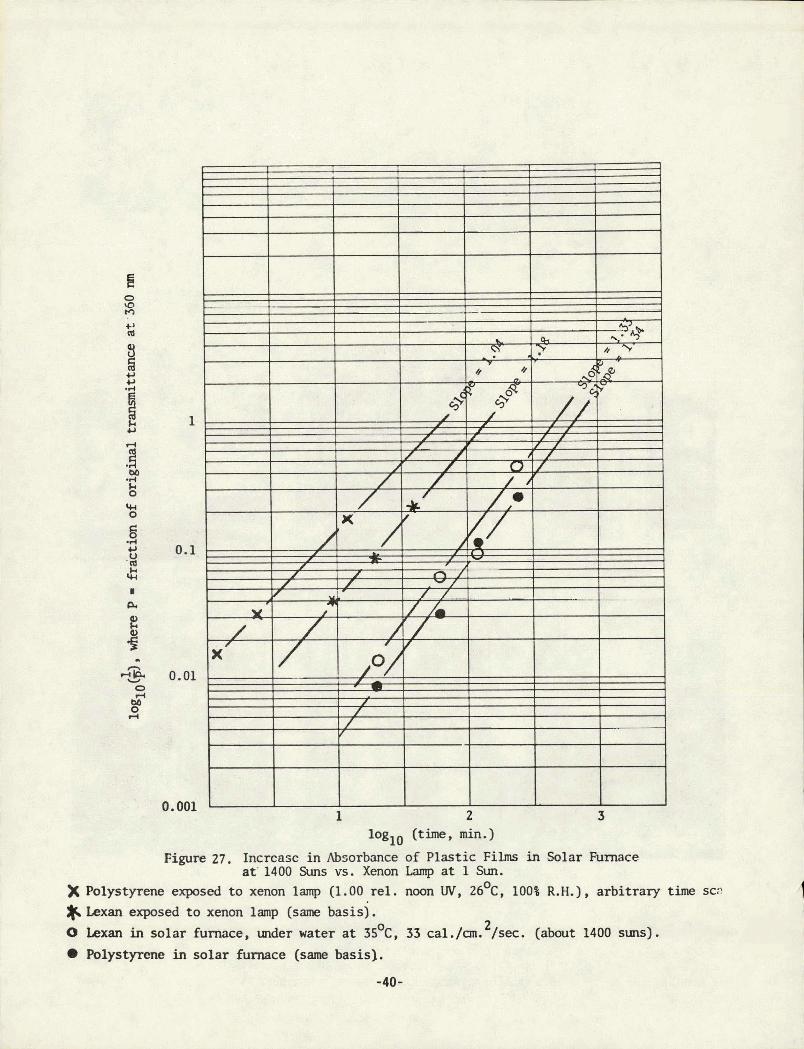
Absorbance data are given in Tables XIX and XX. The best of these data, obtained at 1400 suns (33 ~al./an.~/sec.) , are plotted in Figure 27. Points from accelerated testing are included for comparison. Within experimental error, there appears to be no real differcnce in the slopes of lines through the experimental data. Rough calculations indicate that the order of magnitude of acceleration is as expected. We hope to obtain W data to refine these calculations. The 4 hour exposure of Lexan gave about the same degree of yellowing as attained in 280 days of natural exposure (tilted 4S0, facing south) near Phoenix starting in September. Similarly, the 4 hour exposure of polystyrene equaled 150 days of exposure in Miami starting in October.
2 Tensile t e s t resul ts on the films exposed to 33 cal,/an, /sec. are shown in Tables XX and XXI,
The breaking s t ress of polystyrene w a s s t i l l about 84 percent of original a f te r 4 hours, a t which point logl0(;), where P = fraction
of. original transmittance a t 360 nm., w a s 0.2; (Table XX). After 150 days of 45% exposure in. Miami, both resul ts were exactly the same. Tensile data are only approximate, but the point is that hyperaccelerated exposure with natural sunlight matched natural ex- posure in the correlation of two dissimilar properties. In the xenon
1 lamp exposure, 1 0 g ~ ~ ( ~ ) of about 0.20 w a s attained a t 350 C and 100
percent relat ive humidity in 120 hours. A t t h i s time the tensi le strcngth w a s 76 percene of original, These da.t.a agree roughly with Ll~e above.
In the case of Lexan, unlike polystyren xenon lamp exposure f , had over-accelerated the increase in 1 0 g ~ ~ ( ~ ) vs . . loss of tensi le strength. After 768 hours of xenon lan~p exposure a t 3S0 C and 100
'1
percent relat ive humidity, logl0 ($) was about 1.1 and the tensi le
strength w a s 52 percent of original. In contrast, outdoor exposure 1 resul ts for 1 0 g ~ ~ ( ~ ) and percent of original tensi le strength were,
respectively, 0.48 and 27 (Phoenix, 45's) , .0.46 and 27 (M) , and 1 0.64 and 31 (DMQUA) . When logl (F) reached about 1.1 on the EMA
or ElMAQUtA, the tensi le strength dropped t o about 7 percent of 1 original. Solar furnace exposure gave = 0.46 and 26 percent
of original tens i le strength a t 4 hours (Table XXI), which agrees well with the outdoor resul ts . These data show that the solar furnace exposure matched natural exposure in the correlation of two dissimilar properties f o r Lexan as well as fo r polystyrene.
The conclusion is that hypt?racce:l.erated exposure using natural sunlight. is a feasible t e s t method a d an import.ant step i n prerlictirig 20-year outdoor lifetimes.
The alternative of using exposure data obtai.ncd over a short tk r s of less than 2 years l i e s in the d i f f icu l ty of extrapolating data. Figures 28 and 29 give a hypothetical example. The four data points, covering up t o 5 months, precisely f i t a lognormal model (Figure 28) but can easi ly be construed t o f i t a Weibull model also (Figure 29). The usual experimental errors pem-it no distinction and, in fac t , could favor the wrong model. A t 20 years (logl0 (time, days) = 3.86),
the lognormal extrapolation gives logl0 . (6) = or P = 0.14, and the - -
Weibull extrapolation gives log (L) = 1.44 or P = 0.04. Another 10 P possibil i ty is that degradationpfollows neither model but rather the
IV.
dotted curve in Figure 28, This curve resembles the one for Lexan empirically modeled above, In this case, the xenon lamp's output of short -wavelength W was continuously decreasing (Figure 3) . At 20 ' years, the dotted curve in Figure 28 gives logl0(9 = 0.45, or P = 0.35. P
Consider what the consequences of extrapolation could be. If property P were tensile strength, and if retention of 1/3 the original strength were required for integrity of an encapsulant, then the dotted curve (Figure 28) would represent a 34 year life, the lognormal model. (Figure 28) would represent a 6.1 year life, and the Weibull model (Figure 29) would .represent a 2.4 year life.
This illustration shows why careful data gathering and judicious mathematical modeling are essential, especially if a hyperaccelerated 20-year value is not available.
CONCLUSIONS AND RECMNRATICNS
1. One important conclusion is that photochemical reactions of encap- sulants can be accelerated over 100 times without changing chemical mechanisms. Such hyperacceleration is a valid test procedure, i.e., natural degradation pathways are followed. This possibility should be investigated further. For example ,' even full-scale modules could be subjected to "20 years" of W light and then exposed at elevated ,
temperature/humidity to accelerate degradation.
2. Early test results suggest that one low-cost solar array includes acrylic lacquer (or glass-covered polyurethane) as the transparent encapsulant, copper (or perhaps aluminum) circuitry, and enameled steel as substrate.
3. Final conclusions and recommendations will be made in the Final Report (draft copy due in hands of JPL on April 30, 1978).
V. PLANS FOR NEXT QUARTER
1. Examine weathered samples by Fourier transform attenuated total reflectance infrared spectroscopy (ATR).
2. Complete measurement of properties of UTS s and films returned to date from the outdoor exposure sites.
3. Prepare draft of Final Report (due April 30, 1978) .
VI. REFERENCES
1. Interim Report, this contract, ERI1A-JPL-954458-7712, prepared October, 24, 1977.
2. C. Daniel and F. S. Wood, Fitting Equations to Data, Wiley Interscience, 1971, page 22.
2 3 loglo (Exposure Factor)
Figure 1. Yellowing of Lexan in Phoenix (45's)
G Exposure started 9/12/76 + Expos~~re started 12/22/76 U Exposure started 6/21/77
1
0.1
0.01
0.001
. . . , . .-
7- 1 2 3
loglo (Exposure Factor)
Figure 2. Yellowing of Lexan i n Miami (~5's)
0 Exposure S ta r t ed 9/1/76 0 Exposure S ta r t ed 12/22/76 OExposure S ta r t ed 6/21/77
loglO (time, hrs .)
Figure 3. Absorbance Data for Accelerated Exposure of Lexan - (1.00 rel. noon W, 26O ~ , 0% relative humidity) .
= Found
0 = Calculated (see text) .
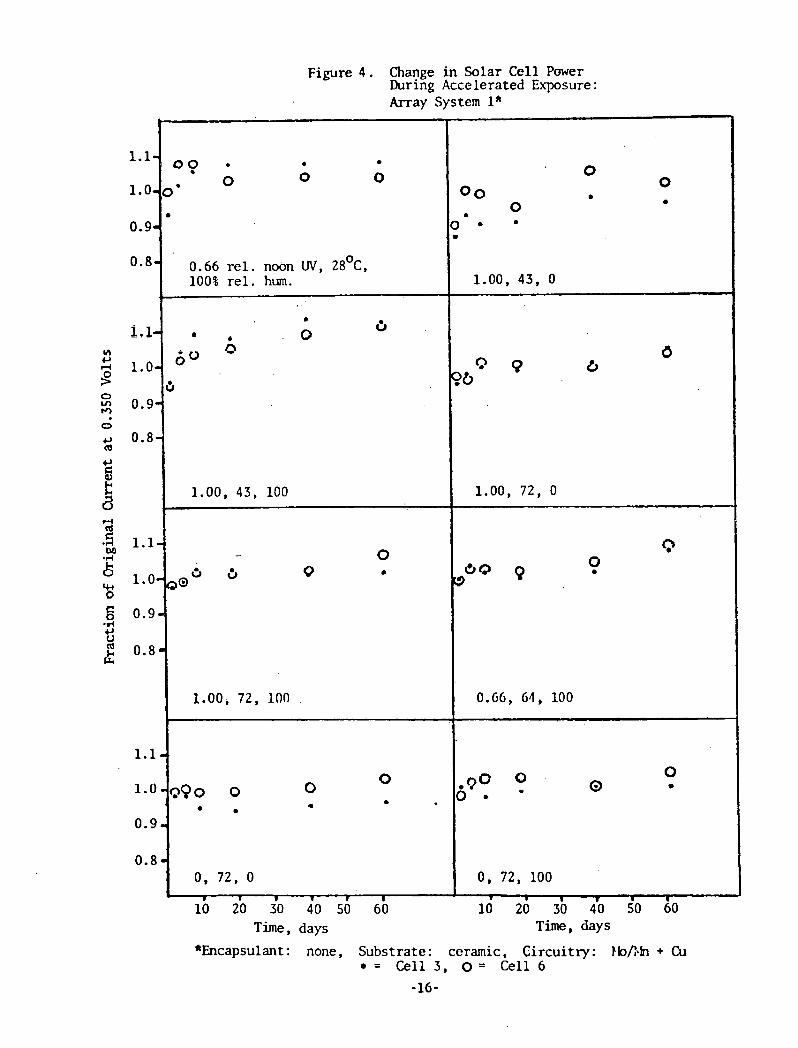
Figure 4. Change in Solar Cell Power During Accelerated Exposure: Array System l*
Time, days Time, days
"Encapsulant : none, Substrate : ceramic, Circuitry: FbLbIn + Cu = Cell 3, 0 = Cell 6
-16-
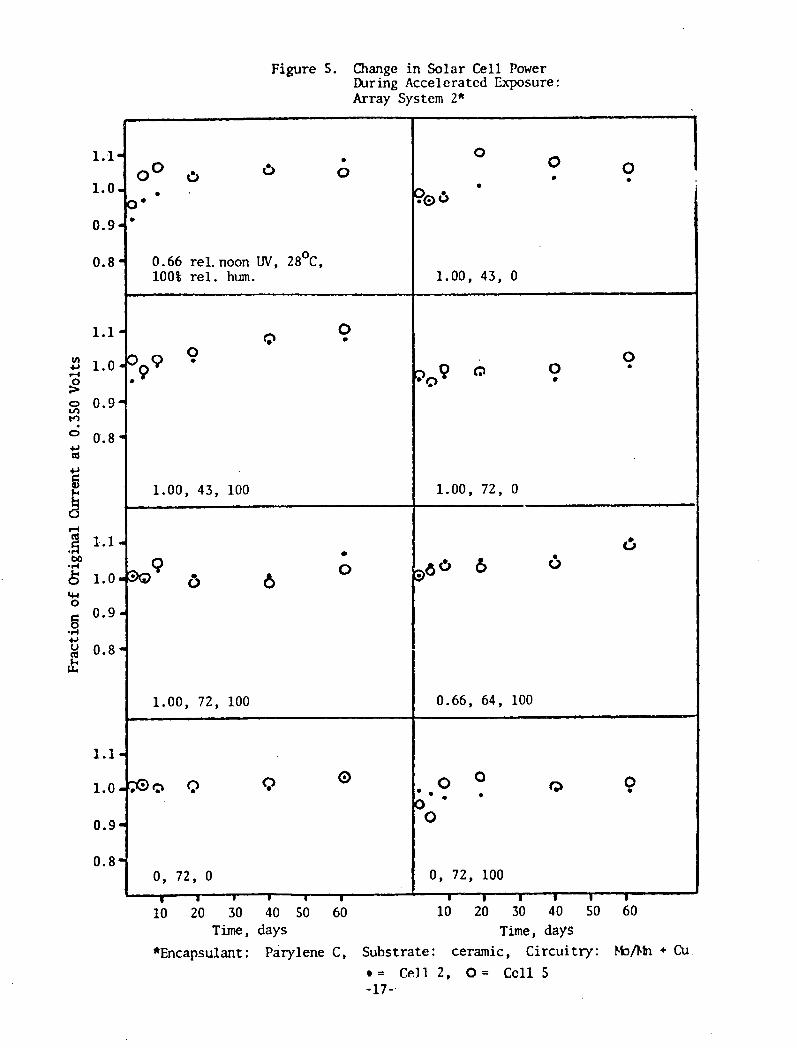
Figure 5. Change in Solar Cell Power During Accelerated Exposure: Array System 2*
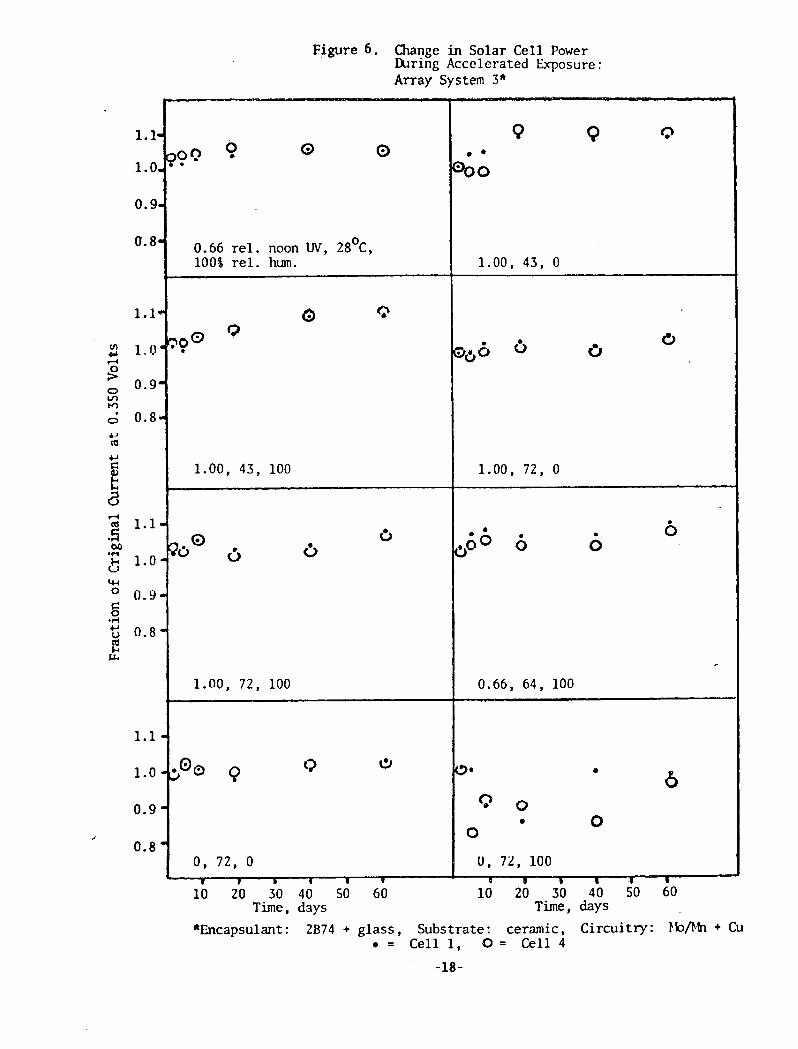
Figure 6. Change in Solar Cell Power During Accelerated Exposure: Array System 3"
*hcapsulant: 2B74 + glass, Substrate: ceramic, Circuitry: t.bfitn + Cu = Cell 1, 0 = Cell 4
-18-

Figure 7. Change in Solar Cell Power During Accelerated Exposure: Array System 4"
- -
Time, days
*hcapsulant: acrylic, Substrate: enameled steel, Circuitry: Cu (fired) = Cell 3, 0 = Cell 6
-19-
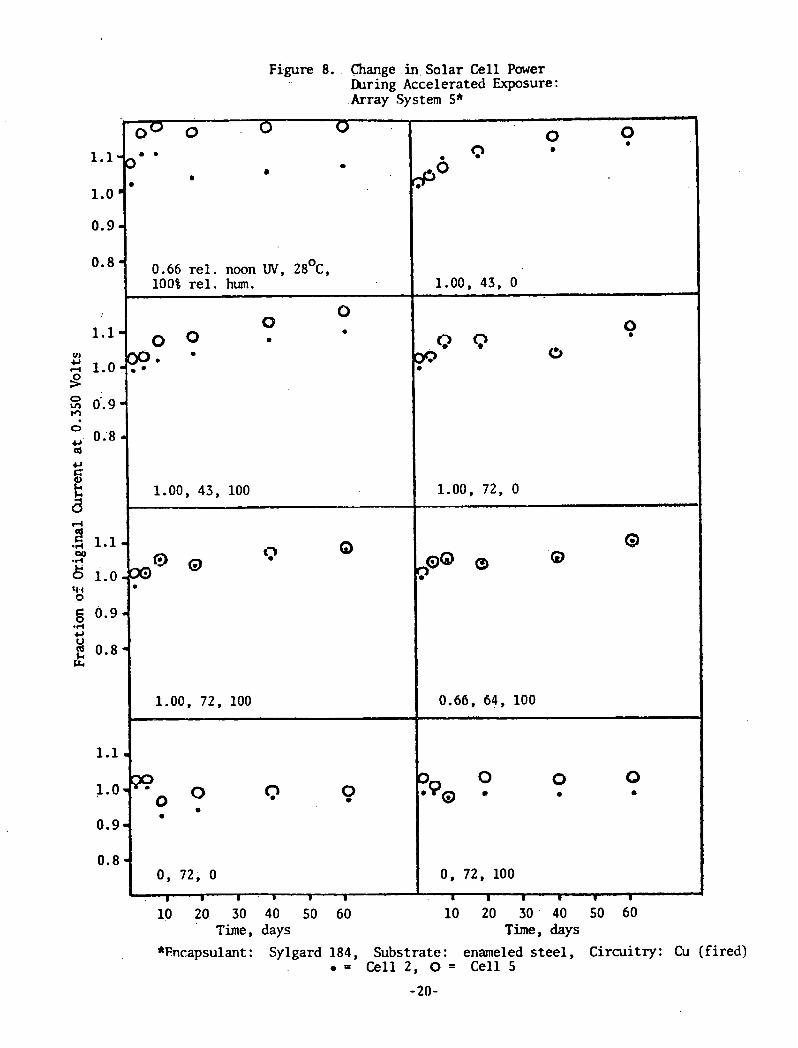
Figure 8. . Change in, Solar Cell Power Jhring Accelerated Exposure: .Array System 5*
10 20 30 40 SO 60 Time, days
10 20 30. 40 SO 60 Time, days
*Encapsulant: Sylgard 184, Substrate: enameled steel, Circuitry: Cu (fired) = Cell 2, 0 = Cell 5
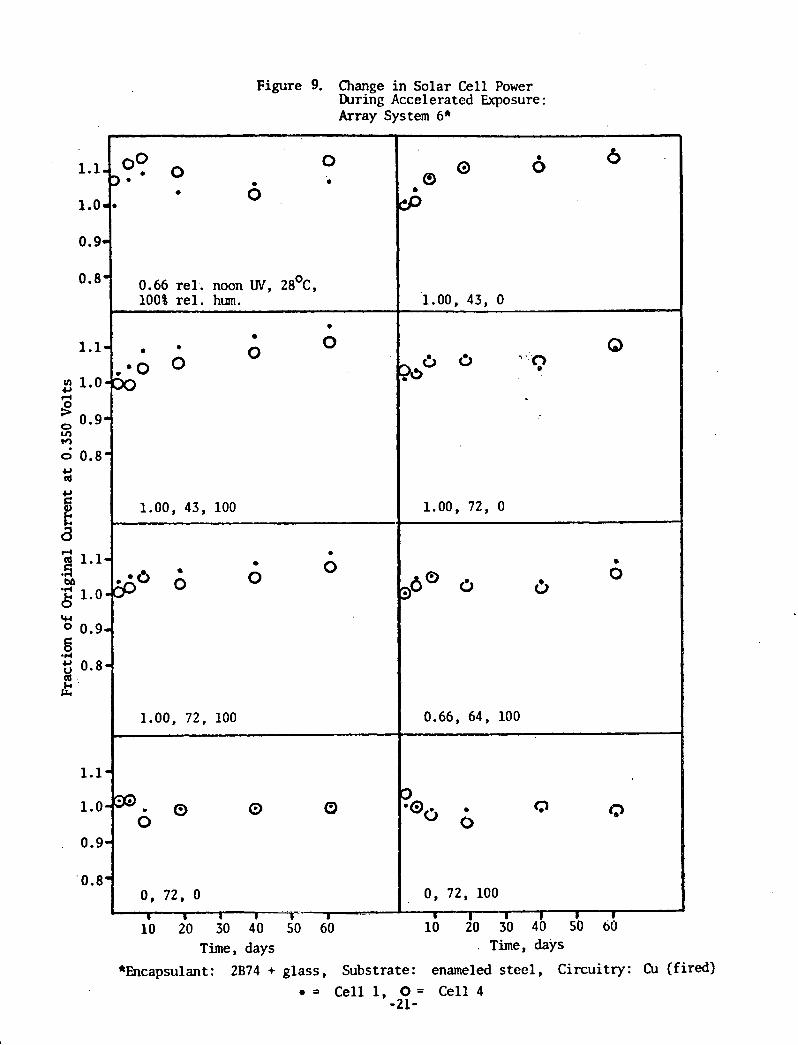
Figure 9. Change in Solar Cell Power During Accelerated Exposure : Array System 6*
Time, days . Time, days
"Encapsulant: 2B74 + glass, Substrate: enameled steel, Circuitry: Cu (fired) = Cell 1, 0 = Cell 4
-21-
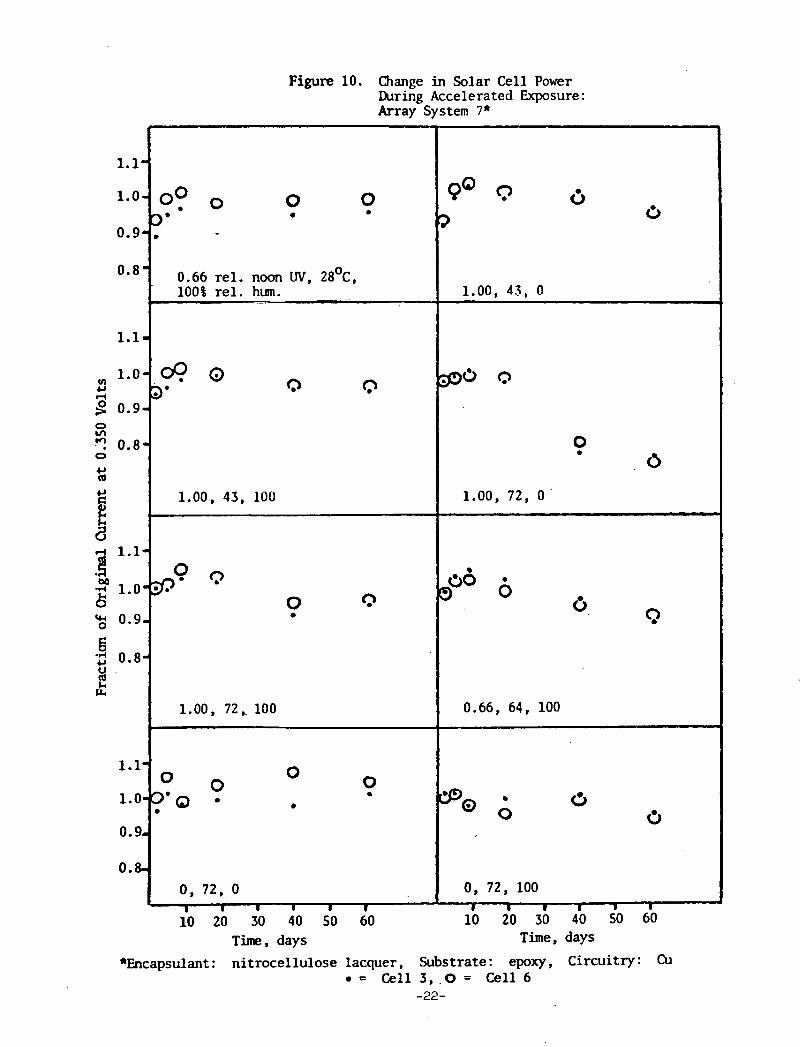
Figure 10. Change in Solar Cell Power During Accelerated Exposure : Array System 7*
*Encapsulant : nitrocellulose lacquer, Substrate : epoxy, Circuitry: Cu t Cell 3, .0 = Cell 6
-22-
0 f?
1.00, 43, 0
0 0
0 . o
1.00, 72, 0
1.1-
1.0-
0.91.
Ow8'
1.1-
VI 1.0- C, 4
3 0.9- 0 V)
? 0.8- 0
C, a C,
i! a 3 lw1- M
+
oo ' 0 0 0' a
0.66 rel. noon W, 28Oc, 100% rel. hum. -- .
@ @ 3'
1.00, 43, 10U
2 , Q -4 1.0-p 6
0.9-
6 -2 0.8- 0 . a k L4
1.1-
1.0-0'
0.9-
0.8-
Time, days Time, days
1.00, 72,. 100
O o Q .
0, 72, 0 4 I 8 8 n 8 I
0.66, 64, 100
@@ 6
I 0, 72, 100 I I I I 8 I
10 20 30 40 50 60 10 20 30 40 50 60
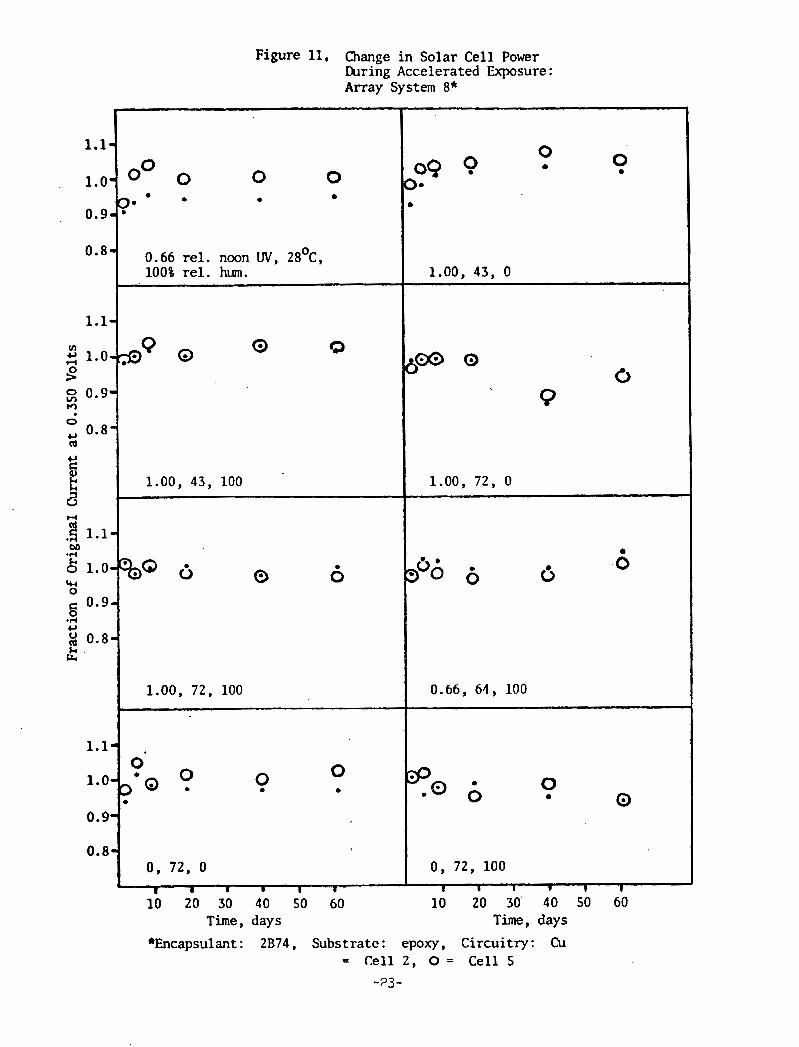
Figure 11, Change i n Solar Cell Power h r i n g Accelerated Exposure: Array System 8*
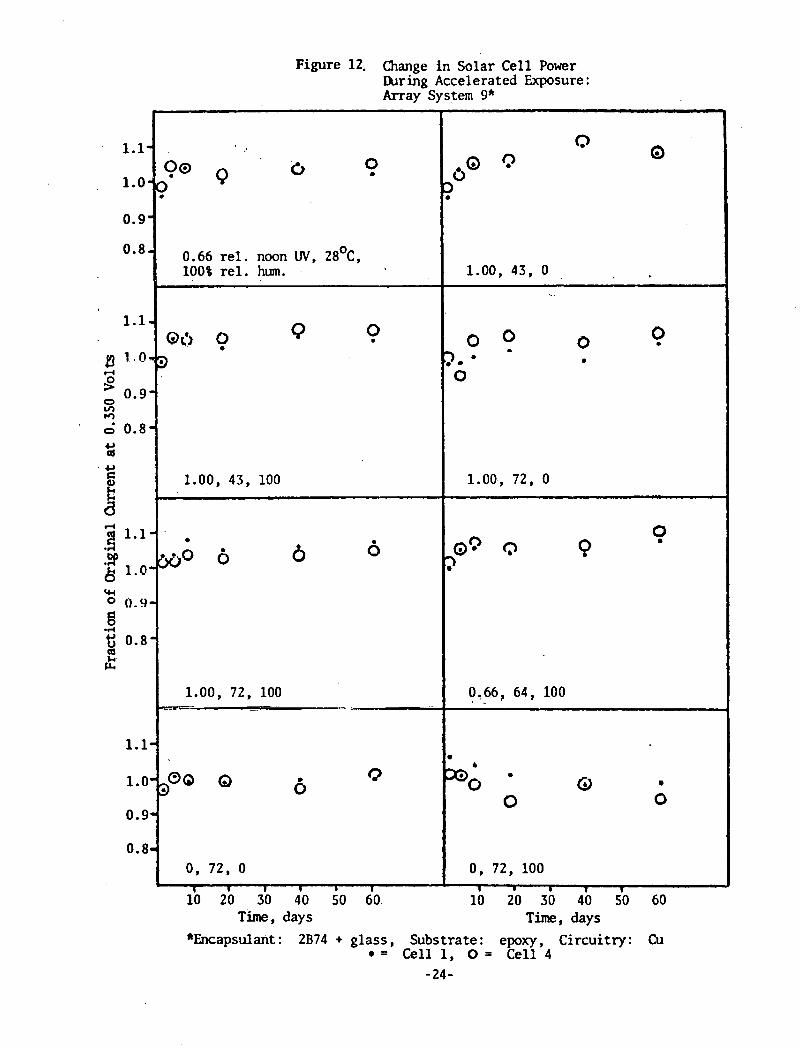
Figure 12. Change in Solar Cell Power bring Accelerated Exposure: Array System 9"
Time, days Time, days
*Encapsulant : 2B74 + glass, Substrate : epoxy, Circuitry: Cu = Cell 1, 0 = Cell 4
1 , O O REL, - $,QXI REL* UV, 7 2 ' ~ ~ OX R,-Hl 72%) l O O X R. W
0.66 REL, UVJ 0 REL, UYj 0 REL, UV, 64% C, 1 0 0 % R , H, 7 2 O ~ j 0 % R, Ha 720cJ 1 0 0 % R , I.
FIGURE 13, ENCAPSULANT SYSTEM #7 (NITROCELLULOSE LACQUER ENCAPSULANT, EPOXY SUBSTRATE) AFTER 61 DAYS ACCELERATED EXPOSURE NOTE: FRACTION OF ORIGINAL POWER IS SHOWN FOR EACH CELL,
-25-
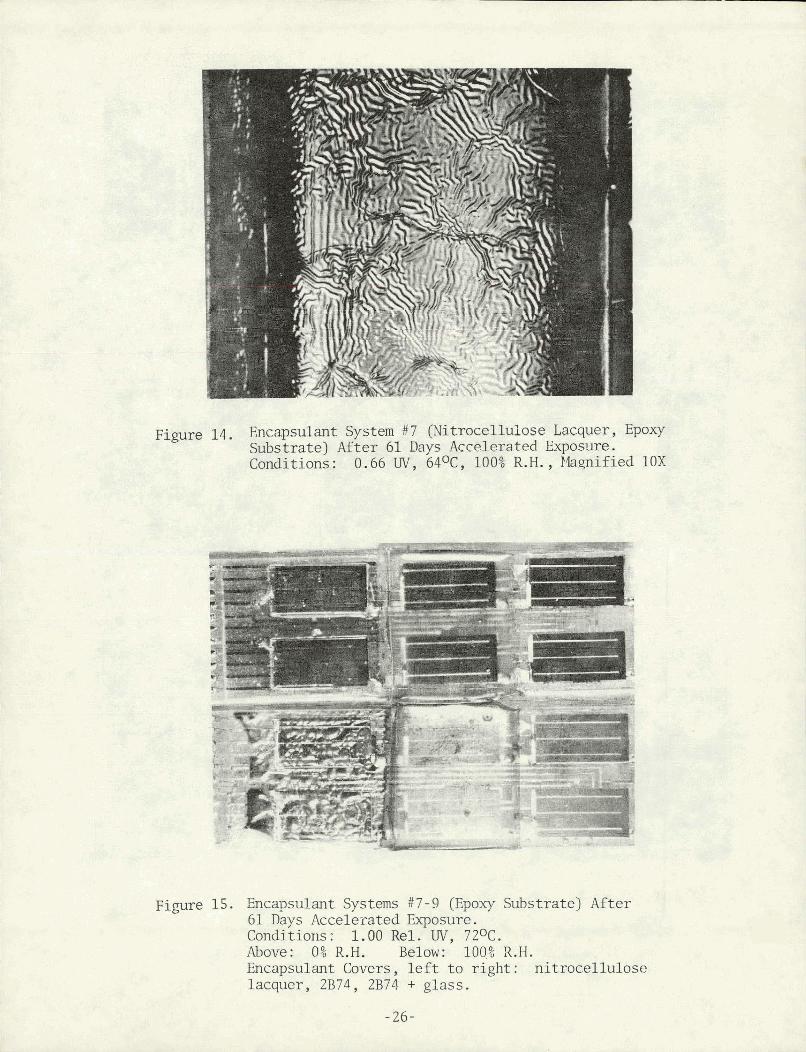
Figure 14. Encapsulant System X 7 (Nitrocellulose Lacquer, Epoxy2 S,&b,trate] After 61 Days AcceXg~ated Exposure, Cand'tions,; 0.66 W, ,64OC, 16.09 R.H., lkgnif ied lox
Figure 15. Encapsulant Systems #7-9 (Epo-uy Substrate) After 61 Days Accelerated Exposure. Conditio~is: 1.00 Rel. W, 72OC. Above: 0% R.H. Below: loo,% R.H. Encapsulant Covers, l e f t t o r ight : nitrocellulose lacquer, 2B74, 2B74 + glass.
1.00 REL, UVj @cJ 1fl(I% R a H s I.'. --. , . - , N .< s<., L.--
8 ts:'=.r@; - + -* - I.~..: iJ7,:1~: ;FIGURE 16. ENCAPSULANT SYSTEMS AFTER 61 DAYS ACCELERATED EXPOSURE
,. , . :,'f I 11 T:?,,; [?- -';(; - 8 .- -
A' - ,- iTb,:o*; - -7 , -. - FOLLOWED BY 12 DAYS STEAM EXPOSURE. . - -
/ , - - - ' , I - -,<A,;:< '-#j , - LEFT: SYSTEM #I (NO COMRj CERAMIC. SUBSTRATE) ,-,-- .8 8 .I _ . ., ' . > ;,--
CENTER : SYSTEM ICY (ACRYLI c LACQUER, ENAMELED STEEL SUBSTRATE) - - . - C RIGHT: SYSTEM #7 (NITROCELLULOSE LACQUER# EPOXY SUBSTRATE)
NOTE: FRACTION OF ORIOJVL POWER I S SHOWN FOR EACH CELLS -27-
1.00 REL, UV, 7 Z 0 c , 0% R . H .
0.66 BL, UY, 6 4 ' ~ ~ 100% R,W,
1
1 11 1 1 1-/ I '645* · .
A h-
1. 11 bill:1 . 11/4 t-9 .1 pv Li
0.96 '* 1 2 0,9 30,29 0.75 1.02 31 0.99
ra. ./.: '
I ,.8 91+
*11,1' ' ' . ' .b i -
1:ill 1 & 1 Ii-,115, f
F. /1 1. 1, 1 4.1 4 1 1 ,.. ..,4. . 3 . 1 . 343 40
bil;Ip 4 4 1 ''
. ,... :,r.!.:' .V.-7 .*b · t., I
r . , . .. .,-./,A .'»:«»'-»----... ...; A
0 REL. UV, 72'C, 0% R.H.
26)1111 1 1, C9* %1 1' 1 1 1 '111
1 4 - 11. 1 1 1#
... -r -, i.- , -4 I,·i.' *IN WS 4
lillI 1 0 :,9. 4 '111
0,983 1
0.93 , 0.891 0.99 0,72 10.39
A F
1:I.-Ul*
.1 1
/9 Ger.'2 B ,../ 1 / -1 9.A i: '/
b t mk li I ' ' 'F A b , ., . * --9=--4
0 REL. UV, 72'C, 100% R.H.
FIGURE 16. CONTINUED
*BY PROBING
-29-
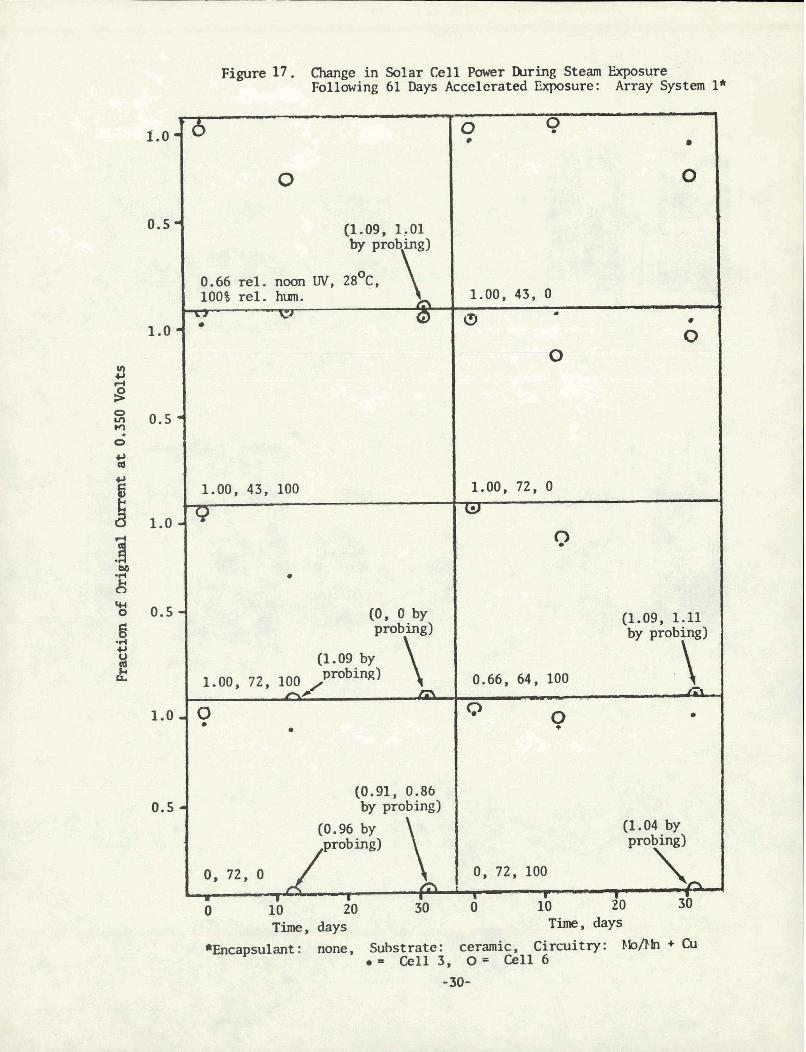
Figure 17. Change in Solar Cell Power bring Steam Exposure Following 61 Days Accelerated Exposure: Array System l*
8 7
0 ? 1.0- 6 a
0
0.5 d (1.09, 1,Ol
by probing)
0.66 rel. noan W, 28O~, 100% rel. hum. \m 1.00, 43, 0
- L I
W ' a m
1.0 - 0 0
3 r(
S: 0.5 - ? 0
s 1.00, 43, 100 1.00, 72, 0
S '"0 0.5-
Q (1.09, 1.11
-4
1.0 - 0 0
(0.91, 0.86 0.5 - by probing)
(1.04 by
0, 72, 0 * v
0 10
px 30
Time, days Time, days
*Encapsulant : none, Substrate: ceramic, Circuitry: FbRb + CU e = Cell 3, 0 = Cell 6
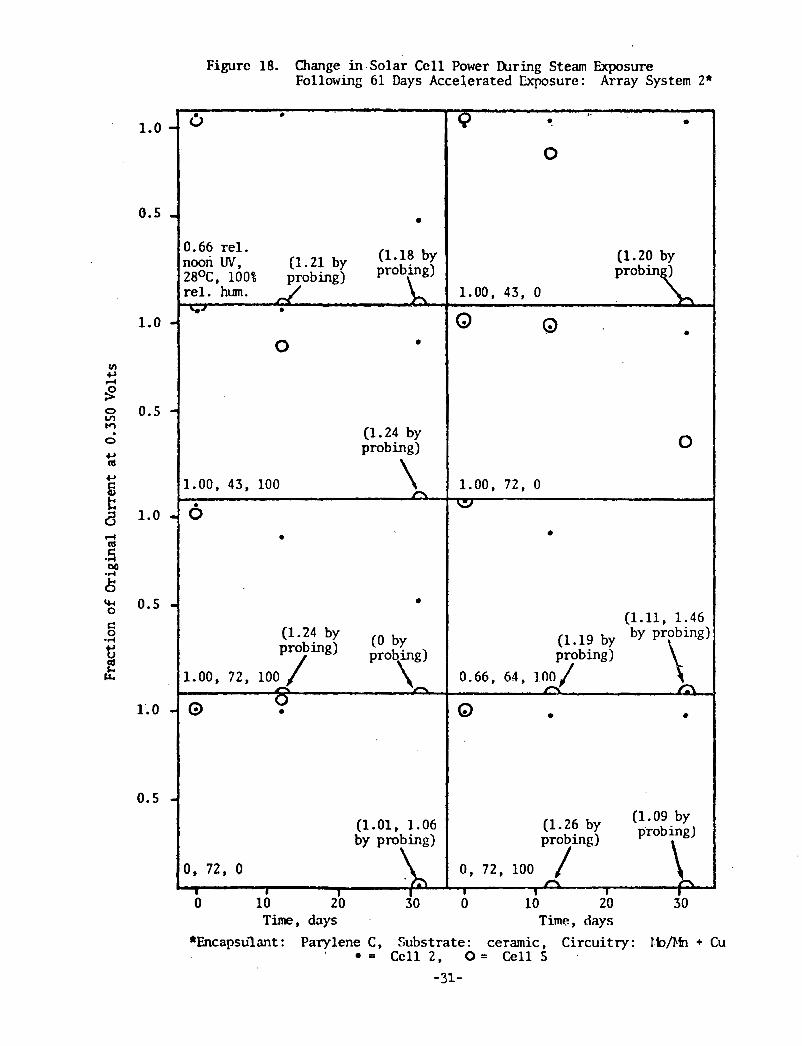
Figure 18. Change in.Solar Cell Power hring Steam Exposure Following 61 Days Accelerated Cxposure: Array System 2"
Time, days Time, days
*Encapsulant: Parylene C, Substrate: ceramic, Circuitry: IbDh + Cu = Cell 2, 0 = Cell 5
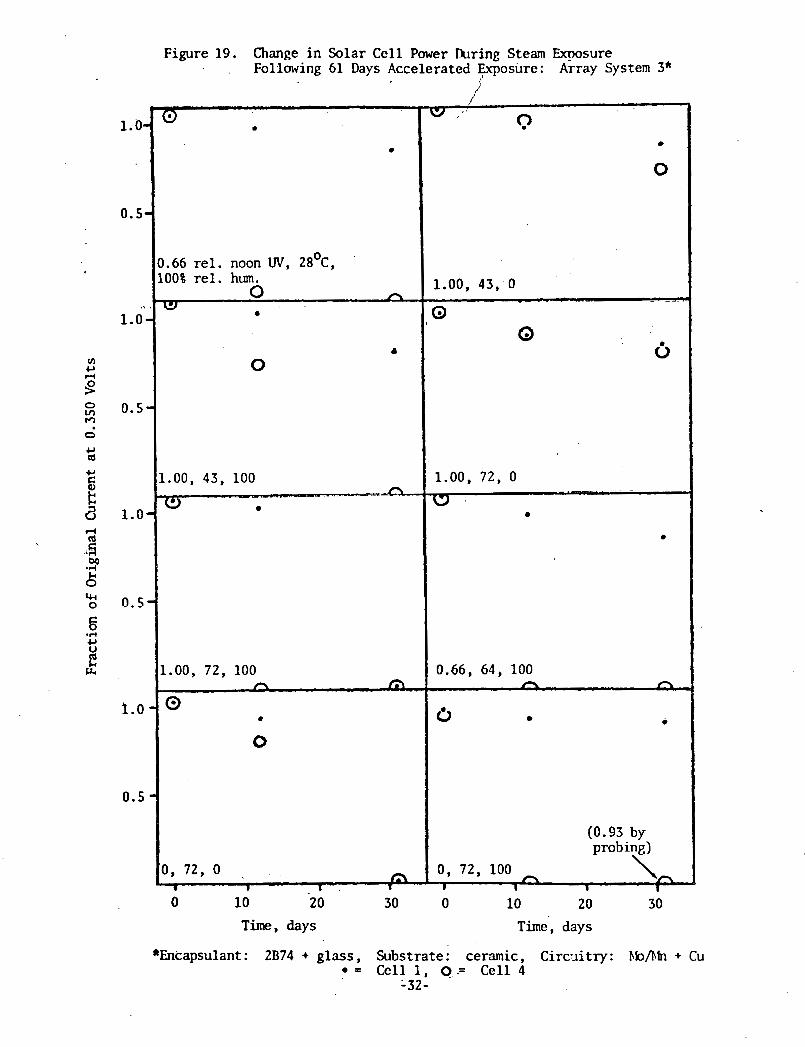
Figure 19. Change i n Solar Cell Power b r i n g Steam Exposure Following 61 Days Accelerated Exposure : Array System 3"
I' i
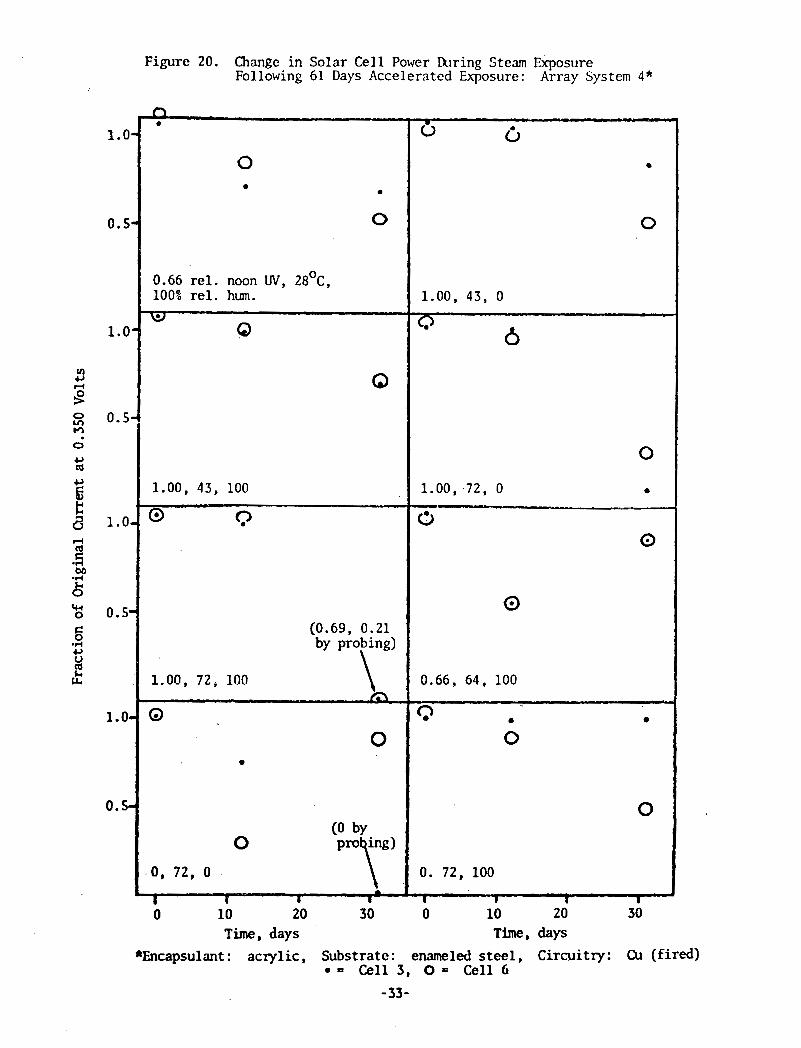
Figure 20. Change in Solar Cell Power bring Steam Exposure Following 61 Days Accelerated Exposure: Array System 4*
Time, days Time, days
*Encapsulant: acrylic, Substrate: enameled steel, Circuitry: Cu (fired) = Cell 3, 0 = Cell G
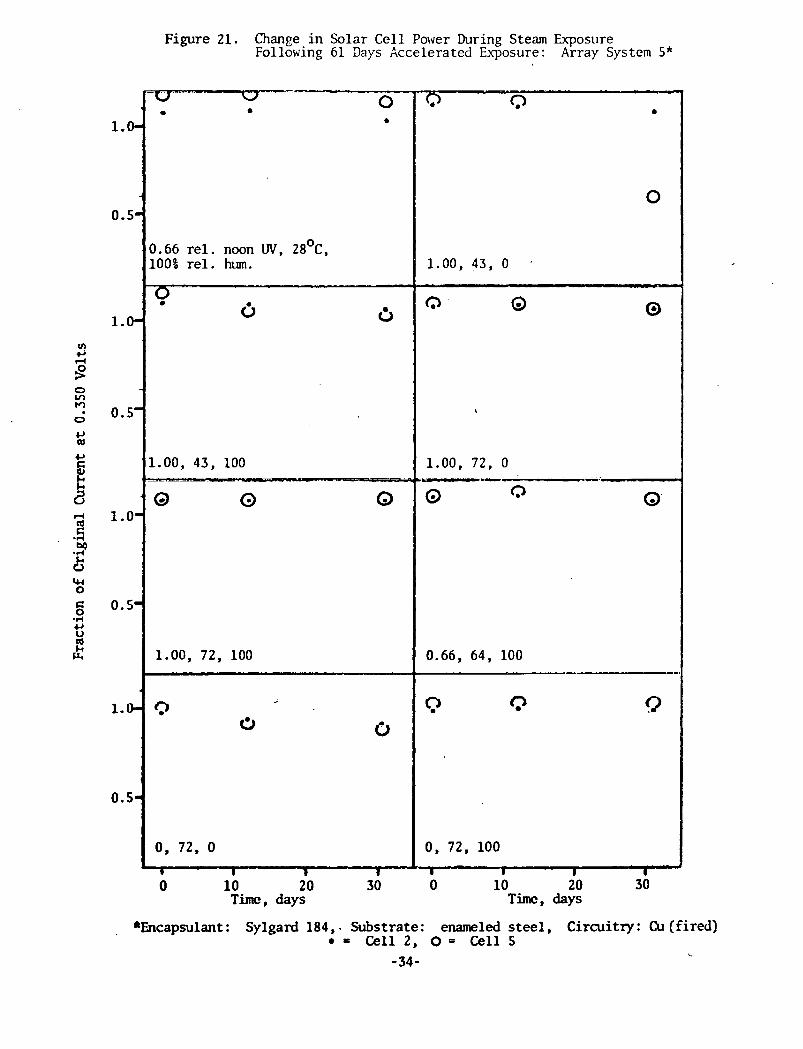
Figure 21. Change in Solar Cell Power During Steam Exposure Following 61 3ays Accelerated Exposure: Array System 5"
0 -
Q
0
1.00, 43, 0 - I
0 0 0
b
1.0-
0.5-
1.0-
V) w r(
0 In )rl
0.5- 0
C, a
0 0
0.66 rel. noon W, 28'~, 100% rel. hum.
0 -- -- I
f t,
e,
E 8 ]
1.00, 43, 100 - --
0 0 0 -. <--
0 0 0
0.66, 64, 100 --.
Q Q Q
0, 72, 100
I I I r 3 . . i
1.0 -2 ag
8 IW 0
0.5- .d e, U a k ~4
1.b
0.5-
0 10 20 30 0 10 20 30 Tim, days Timc, days
*Encapsulant : Sylgard 184, . Substrate: enameled steel, Circuitry: Cu ( f i ~ . = Cell 2, O = Cell 5 -34-
1.00, 72, 100
Q -
0 0
0, 72, 0
I I 1 I
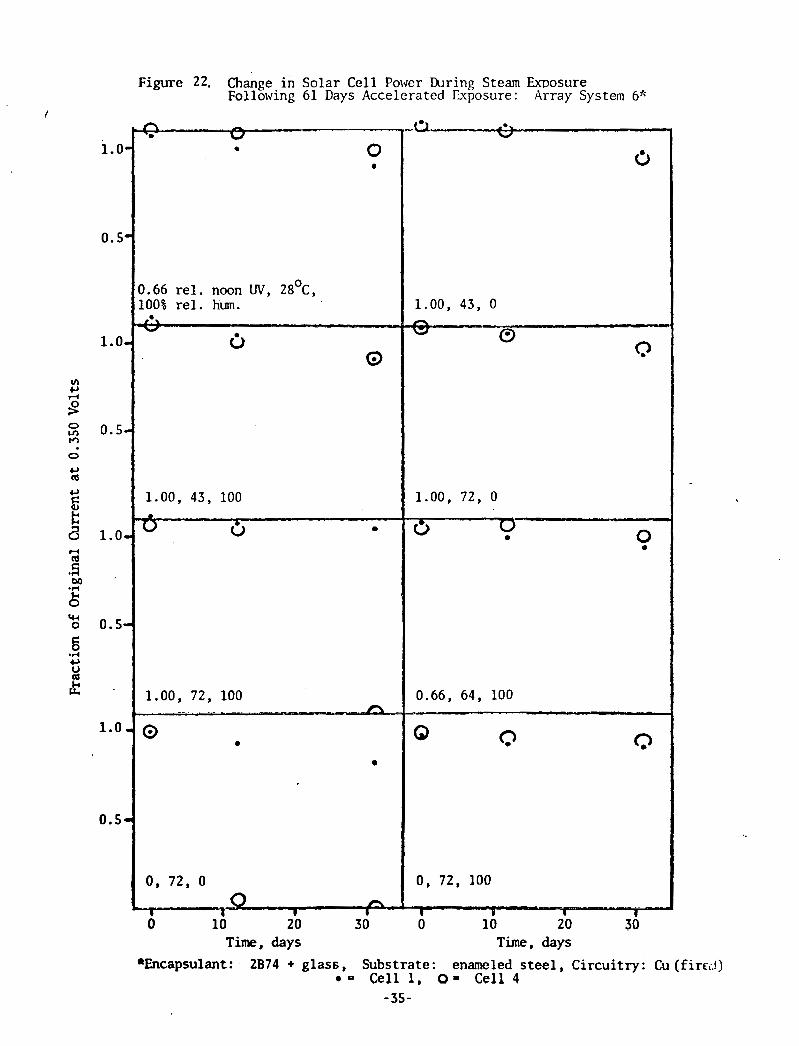
Figure 22. Change in Solar Cell Power During Steam W o s u r e Following 61 Days Accelerated rxposure: Array System 6"
Time, days Time, days
'Encapsulant: 2B74 + glass, Substrate: enamcled steel, Circuitry: Cu (fircc.!) = Cell 1, O = Cell 4
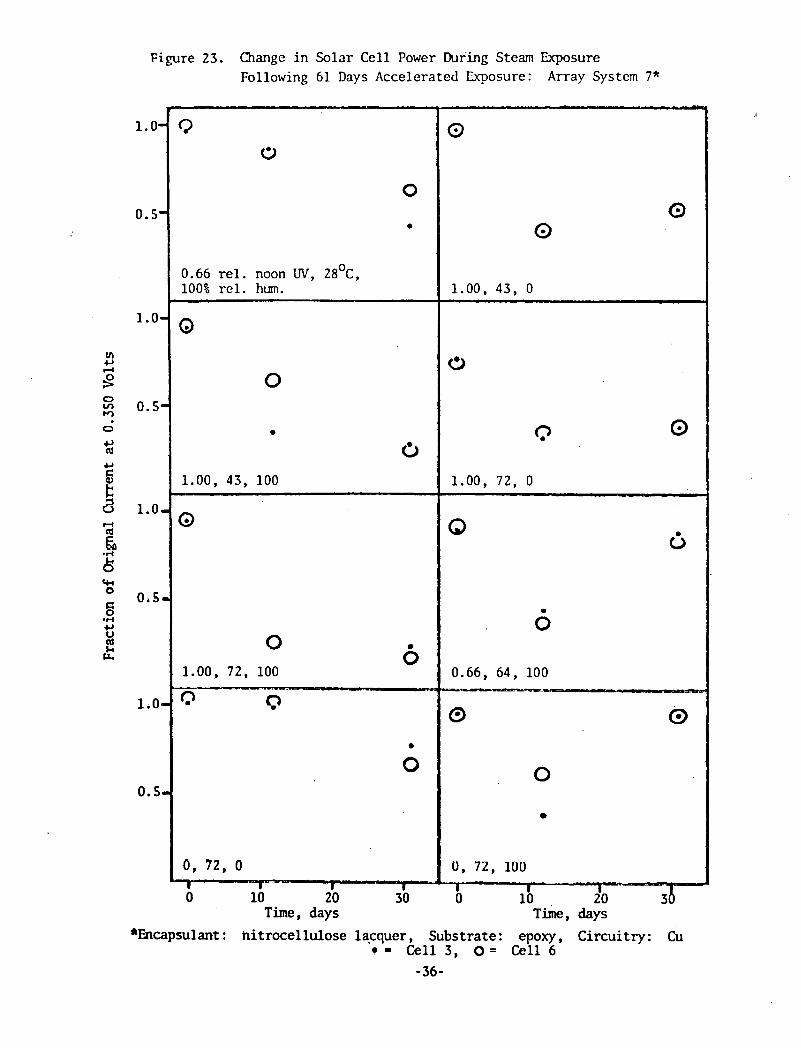
Figure 23. Change in Solar Cell Power During Steam Exposure Following 61 Days Accelerated l o s u r e : Array System 7*
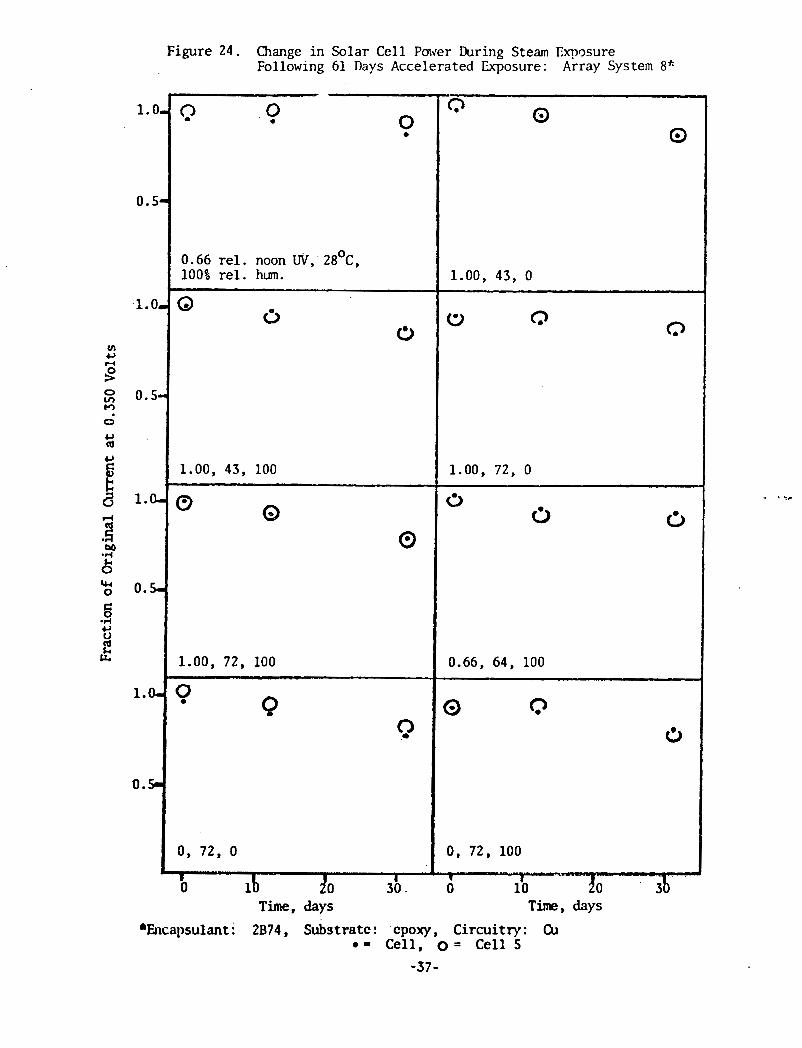
Figure 24. Change in Solar Cell Pager hring Steam Eqosure Following 61 Days Accelerated Exposure: Array System 8"
Time, days Time, days
*Blcapsulant: 2B74, Substrate: cpoxy, Circuitry: (XI = Cell, 0 = Cell 5
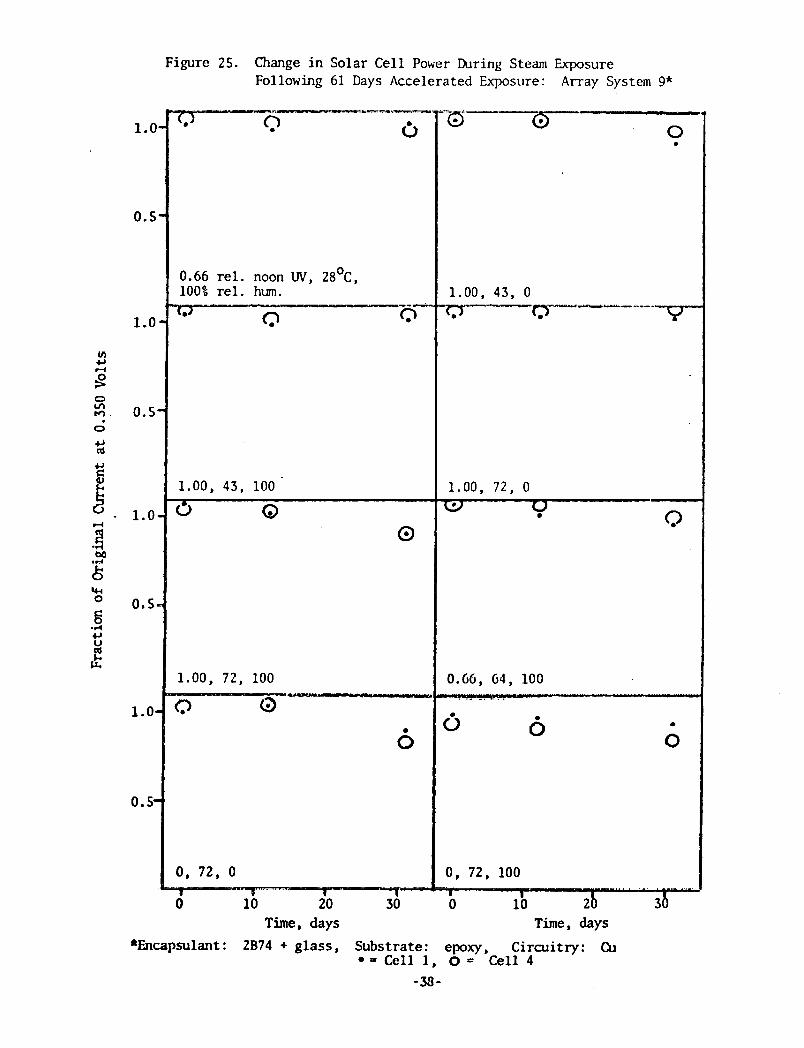
Figure 25. Change in Solar Cell Power During Steam Exposure Following 61 Days Accelerated Exposure: Array System 9*
Time, days Time, days
*Encapsulant: 2B74 + glass, Substrate: epoxy, Circuitry: (ZI = Cell 1, 0 = Ce"l1 4
-38-
SYSTEM #7 SYSTEM #7 SYSTEM #7 0.66 REL, UVj M°CJ 100% RIM, 0 REL UV, 72'~) 0% RbH. 0 REL. UV, 720cJ 100% R,H.
t I GURE 26, ENCAPSULANT SYSTEMS AFTER 61 UAYS ACCELERATED ~XPOSURE
FOLLOWED BY 31 DAYS STEAM EXPOSURE. SYSTEM #4: ACRYLIC LACQUER, ENAMELED STEEL SUBSTRATE
*BY PROBING SYSTEM #7 : NITROCELLULOSE LACQUER, EPOXY SUBSTRATE
NOTE: FRACTION OF ORIGINAL POWER I S SHOWN FOR EACH CELL8
-39-
loglo (time, min.)
Figure 27. Increase in Absorbance of Plastic F i b in Solar Fufnace at' 1400 Suns vs. Xenon Lamp at 1 Sun.
X Polystyrene exposed to xenon lamp (1.00 rel. noon W, 26O~, 100% R.H.), arbitrary time sc;? Lexan exposed to xenon lamp (same basisj .
2 hxan in solar furnace, under water at 35'~. 33 cal ./an. /sec. (about 1400 suns). * Polystyrene in solar furnace (same basis).
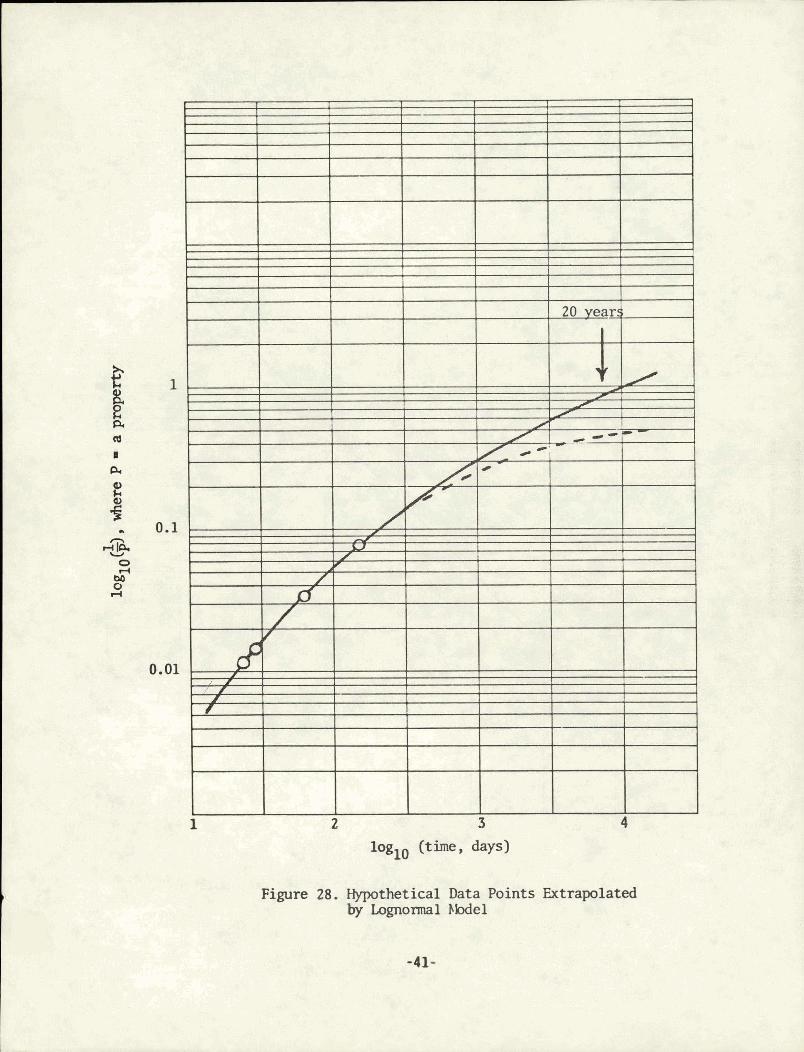
Figure 28. Hypothetical Data Points Extrapolated by Lognormal bbdel
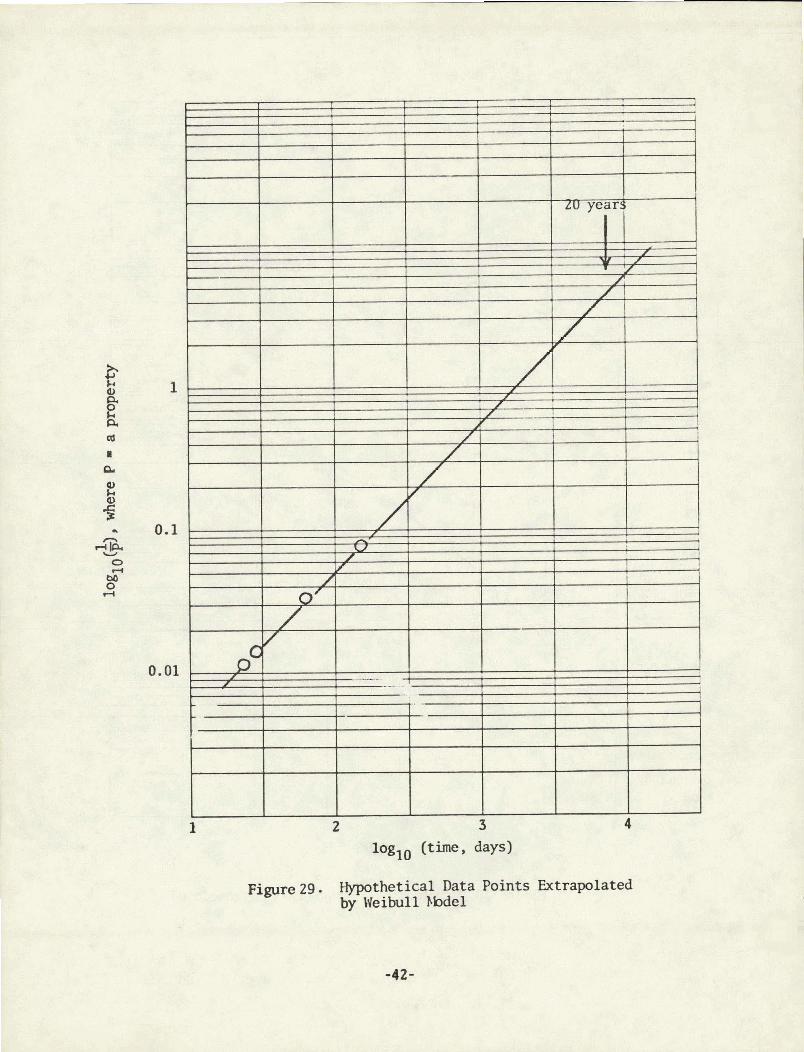
Figure 29. Hypothetical Data Points Extrapolated by Weibull hbdel
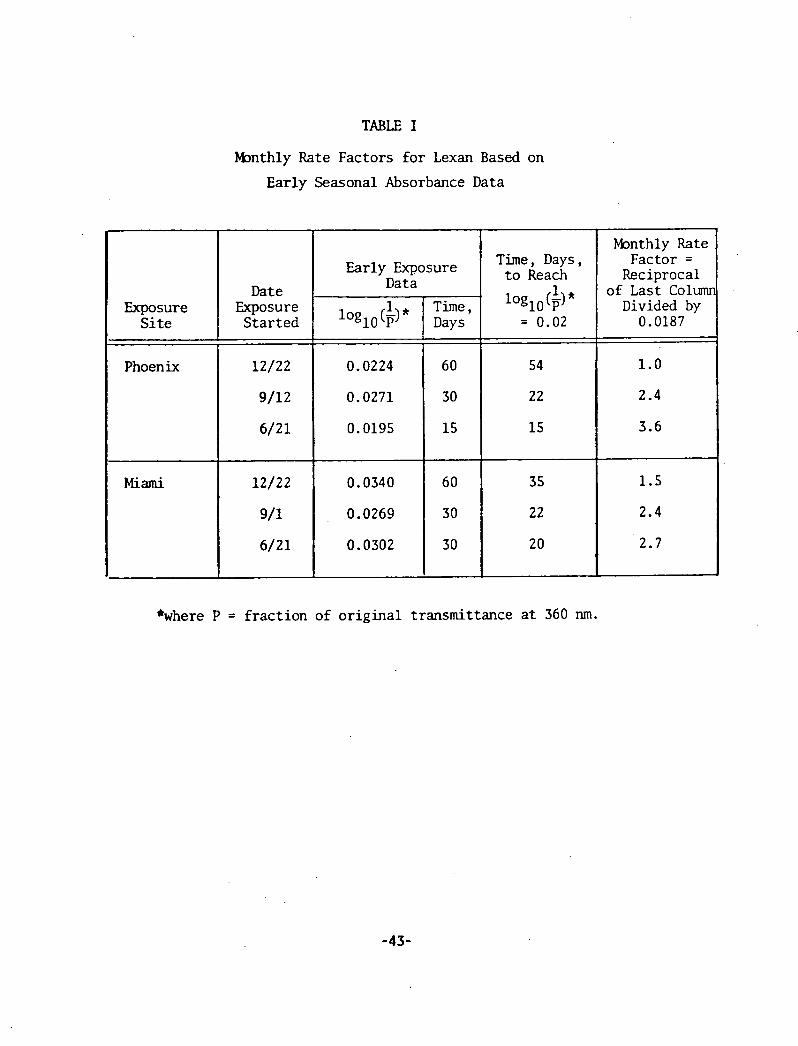
TABLE I
b n t h l y Rate Factors f o r Lexan Based on
Early Seasonal Absorbance Data
*where P = f r a c t i o n of o r i g i n a l transmittance a t 360 nm.
Monthly Rate Factor =
Reciprocal of Last Column
Divided by 0.0187
1.0
2.4
3.6
1.5
2.4
2.7
Time, Days, t o Reach
loglo (;I * = 0.02
54
22
15
3 5
2 2
20
Exposure S i t e
Phoenix
Miami
Date Exposure
S ta r t ed
12/22
9/12
6/21
12/22
9/1
6/21
Early Exposure Data
loglO(i)*
0.0224
0.0271
0.0195
0.0340
0.0269
0.0302
Time, Days
6 0
30
15
6 0
3 0
3 0
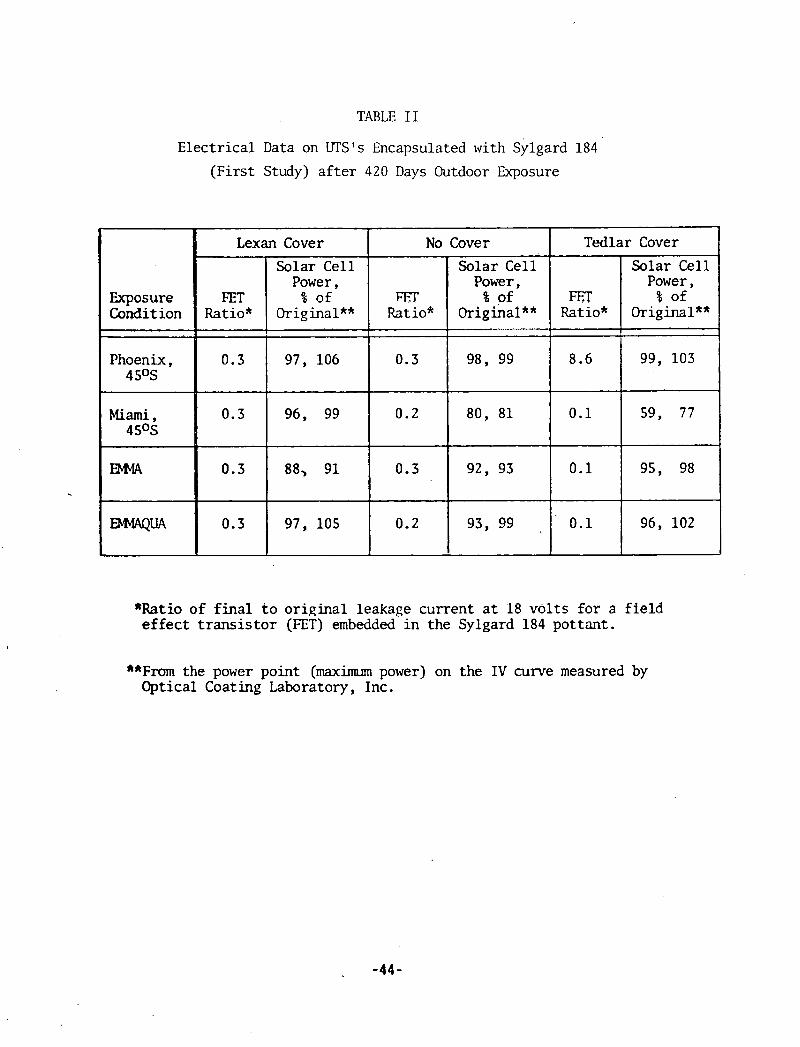
TABLE I1
Elec t r i ca l Data on UTS1s Encapsulated with Sylgard 184
( F i r s t Study) a f t e r 420 Days Outdoor Exposure
*Ratio of f i n a l t o o r i g i n a l leakage current a t 18 v o l t s for a f ield e f f e c t t r a n s i s t o r (FET) embedded i n the Sylgard 184 pot tant .
**From the power point (maximum power) on the IV curve measured by Optical Coating Laboratory, Inc.
,
Exposure Condition
Phoenix, 4 50s
Miami, 4 50s
EMA
W U A
Tedlar Cover
FET Ratio*
8.6
0.1
0.1
0.1
Solar Cell Power,
% of OriginalR*
99, 103
59, 77
95, 98
96, 102
Lexan Cover No Cover
FET Ratio*
0.3
0.3
0.3
0.3
FIT Ratio*
0.3
0.2
0.3
0.2
Solar Cell Power,
% of Original**
97, 106
96, 99
88, 91
97, 105
Solar Cel l Power,
% of Original**
98, 99
80, 81
92, 93
93, 99
I
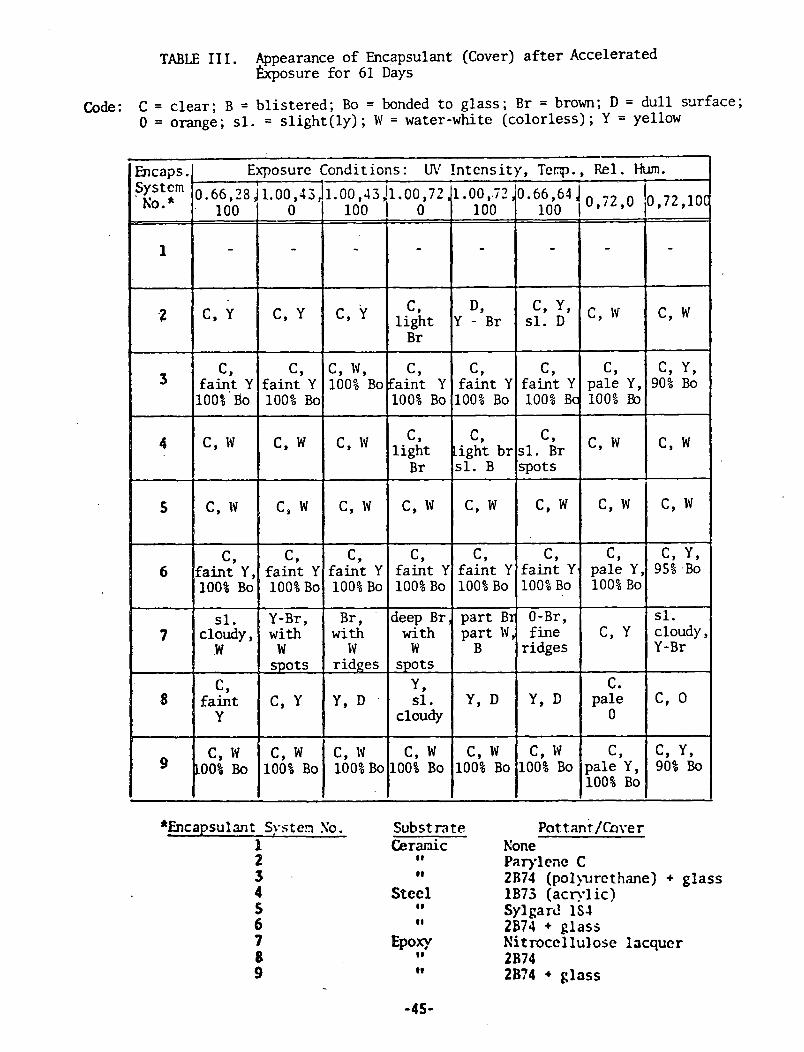
TABLE I1 I . Appearance of Encapsulant (Cover) after Accelerated hcposure for 61 Days
Code: C = clear; B = blistered; Bo = bonded to glass; Br = brown; D = dull smface; 0 = orange; sl. = slight (ly) ; W = water-white (colorless) ; Y = yellow
*Encapsulan t Systes So. 1
Encaps.
si:t:m 1
Subst M te Ceramic
8 I
~ 0 t . t a n i / ~ n ~ e r None Parylcne C 2B74 (pol>-urethane) + glass lB73 (acrylic) Sylgarc! 1S-I 2074 + glass Nitroccllulosc lacquer 2874 2874 + glass
Exposure Conditions: Ur Intensity, Temp., Rel. Hum.
'0.66,?8 j 1.00 ,~;Ji.oo ,43!1.00,72 ,.l.oo,.i? ;0.66,611 ,;* ,o 0,72 ,lOC 100 0
-
100
-
100 1 0 1 100 I
- - - I
- - -
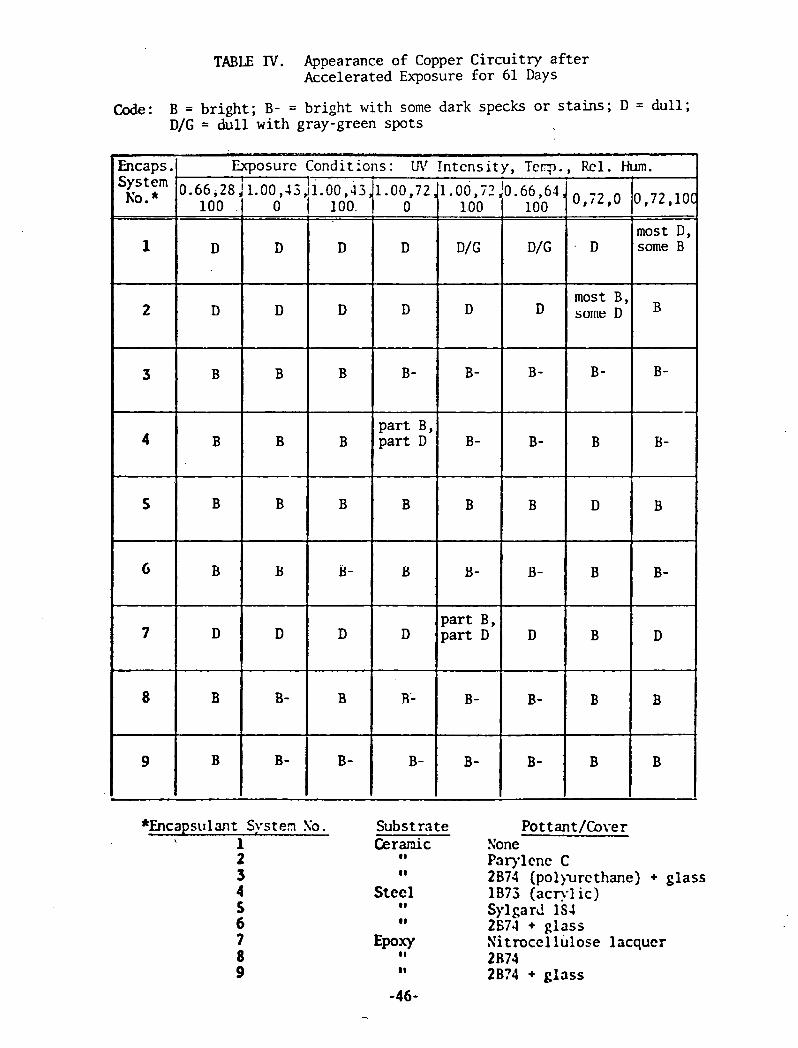
TABLE IV. Appearance of Copper Circuitry after Accelerated Exposure for 61 Days
Code: B = bright; B- = bright with some dark specks or stains; D = dull; DIG = dull with gray-green spots
*Encapsulmt Systen So. \ 1
1
2
3
4
5
G
7
8
9
Substrate Ceranic
8 I
2 ~ 7 4 (poljurcthane) + glass 1073 (acnl ic)
D
D
B
B
B
B
D
B
B
Sylgarc! 1SJ 2B74 + glass Sitroccllulose lacquer 2R74 2B?J + glass
D
D
B
B
B
B
D
B-
B -
0
D
D
B -
part B, part D
B
B
D
R-
B -
D
D
B
B
B
B-
D
B
B-
100
D/G
D
B -
B-
B
B-
part B, part D
B -
B -
100
D/G
B-
B -
B
B -
D
B -
B -
. D
.most B, s u ~ l l t : D
B-
B
D
B
B
B
B
m o s t D, some B
R
B-
B -
B
I B -
D
B
B
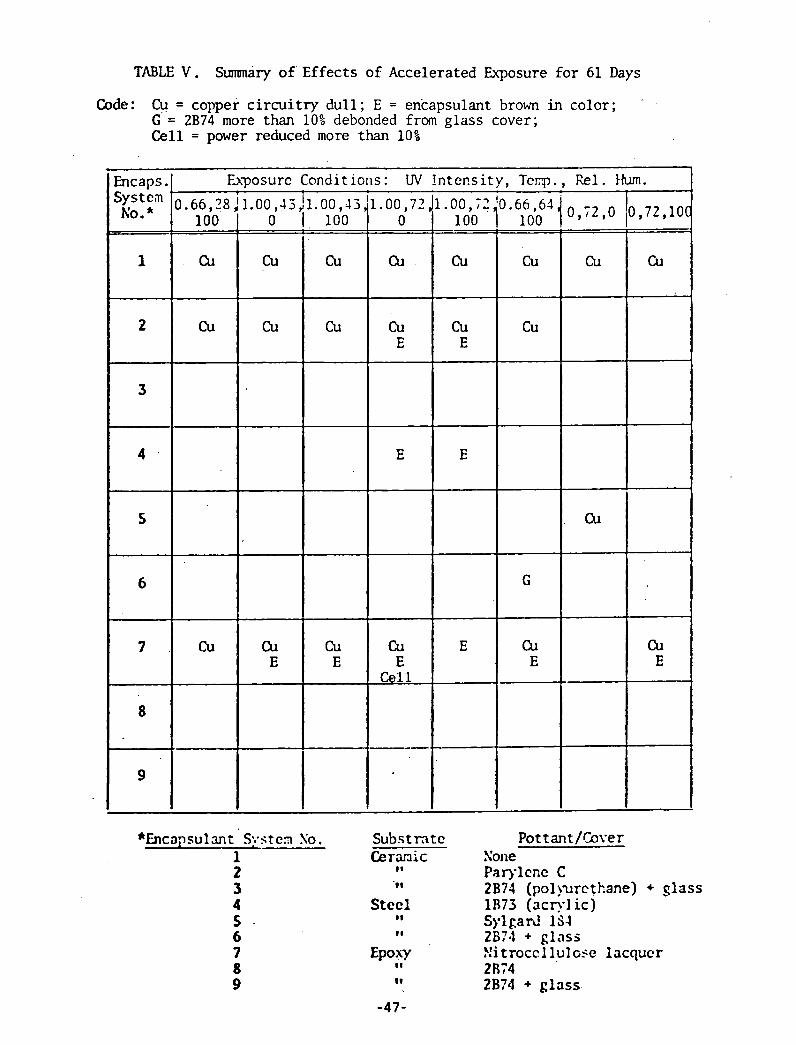
TABLE V . Summary of' Effec ts of Accelerated Exposure f o r 61 Days
Code: Cu = copper c i r c u i t r y d u l l ; E = encapsulant brown in color ; G = 2B74 more than 10% debonded from glass cover; C e l l = power reduced more than 10%
*Encapsul an t S;:st cn So. 1 2 3 4 5 6 7 8 9
Encaps.
s n I
1
2
3
4
-
5
6
7
P o t t a n t / k v e r Sane P a r y l c ~ c C 2B74 (pol !-urethane) + @ a s s 1R73 (scryl ic) Sylgard 1S- l 2B74 + g l a s s ?!i t r o c c l l u l cse l acquer 2R74 2B74 + glass.
-
F ~ p o s u r c Conditions:
--.
W I n t e n s i t y , T c q . , k1. fiurn.
0.66.28; 100
Cu
Cu
Cu
11 .00 ,7? 0
Cu
Cu E
E
Cu E
Cell
1.00 , ~ j ) l . 0 0 , ~ 3 j1.00,72 '0.66.64 1 0 , 7 2 , 1 0 C 0
Cu
Cu
Cu E
I 100
Cu
Cu
Cu E
I
Cu
Cu E
Cu
Cu
100
Cu
cu E
E
E
100
Cu
Cu
G
Cu E
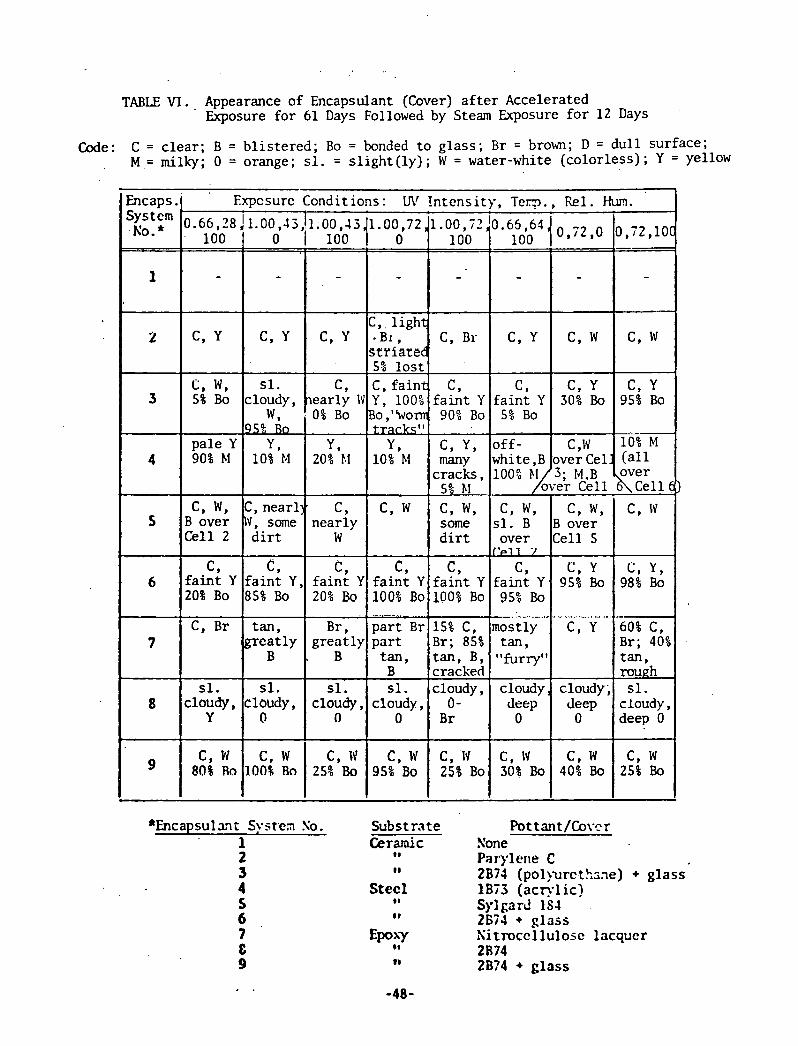
TABLE VI . , Appearance of Encapsulant (Cover) a f t e r Accelerated Exposure fo r 61 Days Followed by Steam Exposure f o r 1 2 Days
Code: C = c l ea r ; B = b l i s t e r ed ; Bo = bonded t o g l a s s ; B r = brown; D = d u l l surface; M = milky; 0 = orange; sl. = s l i gh t (1y ) ; W = water-white (co lor less ) ; Y = yellow
*Encapsulan: Systrm So. 1
1
Encaps. Expcsurc Conditions: U\' In t ens i ty , T e n . , k1. Hum.
'0.66,?8!1.00,~j,!1.00,~j 1.00,72,1.00, i?~0.65,61 -No.* , loo 0 1 100 l o 100 100
Subs t ra te Ceramic
#I
( #
Steel #I
e I
1
2
3
4
5
. .
6
7
8
Pottant/Co\-nr None Par-yler~e C 2 ~ 7 3 (po1)urctksne) + g l a s s 1B73 ( a c ~ l ic]
-
C, Y
C, W , 5% Bo
pa le Y 90% M
C, W , B over Cel l 2
c, f a i n t Y 20% Bo
C, B r
sl. cloudy,
Y
C, W 80% Rn
Sylgarc! IS1 2674 + glass Xit rocc l lu lose lacquer 2R74 2B74 + glass
-
C , Y
sl. cloudy,
W , 95% BO
Y , 10% M
C, nearl) . \V, some
d i r t
C, f a i n t Y , 85% Bo
t an , g rea t ly
B
sl. cloudy, 0
C, w t O O % Rn
-
C , Y
C, nearly W . 0% Bo
Y , 20% bl
C , nearly
W
c , f a i n t Y 20% Bo
-
B r , g r ea t ly
B
sl. cloudy,
0
C, W 25% Bo
-
C , . l i g h t -BI, striared 5% l o s t C , f a i n t Y , 100%
Bo ,"won t r a rks I !
Y , 10% M
C , W
C , f a i n t Y 100% Bo .,..
p a r t ~r p a r t
t an , B sl.
cloudy, 0
C, W 95% Bo
-
C, B r
C , f a i n t Y 90% Bo
C , Y , many
cracks, 5% bl
C , W , some d i r t
C , f a i n t Y 100% Bo
15% C , B r ; 85% tan , B, cracked cloudy, 0-
B r
C, .IV 25% Bo
-
C, Y
c , f a i n t Y
5% Bo
o f f - white,B
-
C, W
C, Y 30% Bo
c,w over Cel:
-
C, W
C , Y 95% Bo
I& M ( a l l
100: 11 '3; M.B over h v e r Cell c e l l 62
C , W , sl. B over
('~11 ;I
c, f a i n t Y - 95% Bo -,.., ... . 7
mostly tan ,
"furry"
cloudy, deep
0
C, W 30% Bo
C , W , Bove r Cell 5
C , Y 95% Bo
.. . .... ~.~...... .,,., .. . C , Y
cloudy; Jeep
0
C, W 40% Bo
C , W
C , Y , 98% Bo
..- 601 C , ' Br; 40% tan , rough sl.
cloudy, deep 0
C, W 25% Bo
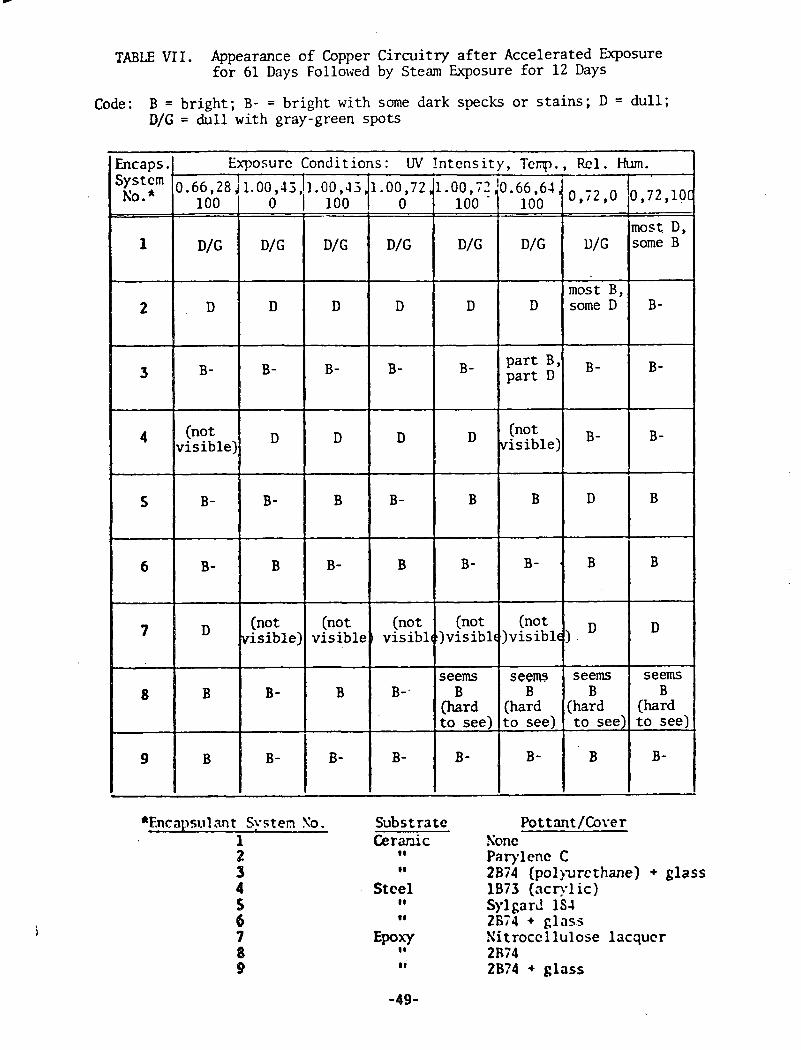
TABLE VII. Appearance of Copper Circuitry after Accelerated Exposure for 61 Days Followed by Steam Exposure for 12 Days
Code: B = bright; B- = bright with some dark specks or stains; D = dull; DIG = dull with gray-green spots
*Encapst11 ant Systen So. 1
Encaps.
1
Substrate Pottmt/Cover Ceranic Sonc
g t Pax-ylenc C 8N 2B74 (po1)urethane) + glass
Steel lB73 (acvl ic) t t Sylgarc! 1S-l t t 2674 4 glass
EPOXY Sitroccllulose lacquer t t
8 t 2874 2874 4 glass
7
Exposurc Conditions: UV Intensity, Tcmp., k1. Hum.
8
9
0.66,28 j 1.00,4~,~l.00,~3,1.00,72,1.00,7~ 0 1 100 100 I
B
B
. .
,72 ,lO;
most D, some B
0
D/G D/G DIG D/G
B -
B-
,:* ,0
L)/G
10.66 - 64 ,
B
B -
100
D/G
100
D/G
B-.
B -
seems B
(hard to see)
B -
seem B
(hard to see)
B-
seems B
(hard to see)
B
seems B
(hard to see)
B-
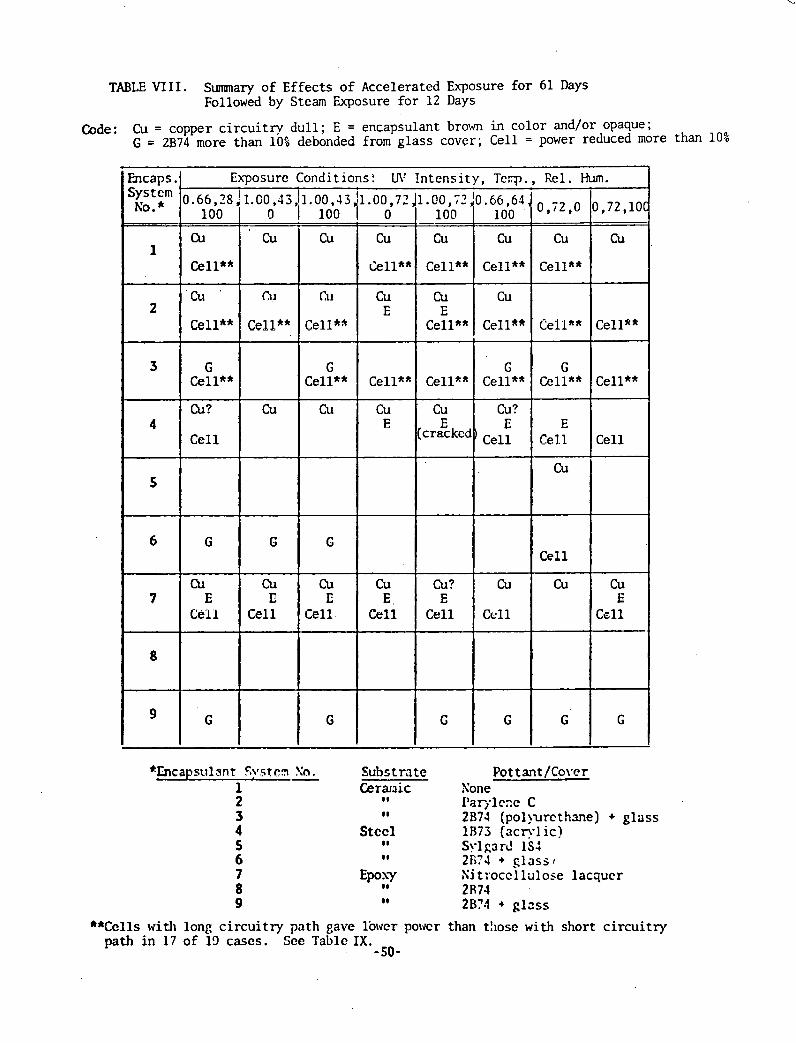
TABLE VIII . Summary of Effects of Accelerated Exposure for 61 Days Followed by Steam Exposure for 12 Days
Code: Cu = copper circuitry dull ; E = encapsulant brown in color and/or opaque; G = 2B74 more than 10% debonded from glass cover; Cell = power reduced more than 10%
Substrate Ceranic
8 l
8 1
Stccl 8 l
88
Epohy e l
D l
Encaps.
SySt~m NO.
1
2
3
4
5
6
Pottant/Cpver Xone I'arylc;..~ C 2B71 (po1)urcthme) + glass 1R73 (acrylic) Sylprc! 1s: 2875 + glass) Sit:occllillose lacquer 2R74 2B?4 + gl~ss
**Cells with long circuitry path gave lhicr powcr than those with short circuitry path in 17 of 13 cases. See Tablc IX.
-50-
Hum.
0,72,10C
Cu
Cell*"
Cell**
Cell
cu E
C~ll
G
Rel.
0,i2,0
Cu
Cell**
Cell**
G Cell**
E Cell
Cu
Cell
Cu 7 E E
Cell Cell Ccll
8
1 G G G G G
Exposurc Conditions: U\' Intensity, Tcrp.,
0.66,?8:1.~0,~jJl.00,~3 '1.00,72,J1.@0,i~J0.66,62, 100
cu
Cell**
cu
100
Cu
Cell**
Cu
Cell**
G Cell**
Cu?
Cell
G
0 I 100 1 0 , 100 - Cu
Cell**
Cu
Cu
Cell**
Cu
Cu
Cll
Cu
cu E
Cell**
Cu E
cu
Cell**
Cu
C
E Cell** 1 Cell** CellA*
G Cell**
Cu
C
Cell**
cu E
(crackcd)
G Cell**
Cu? E
Cell
Cu? Cu
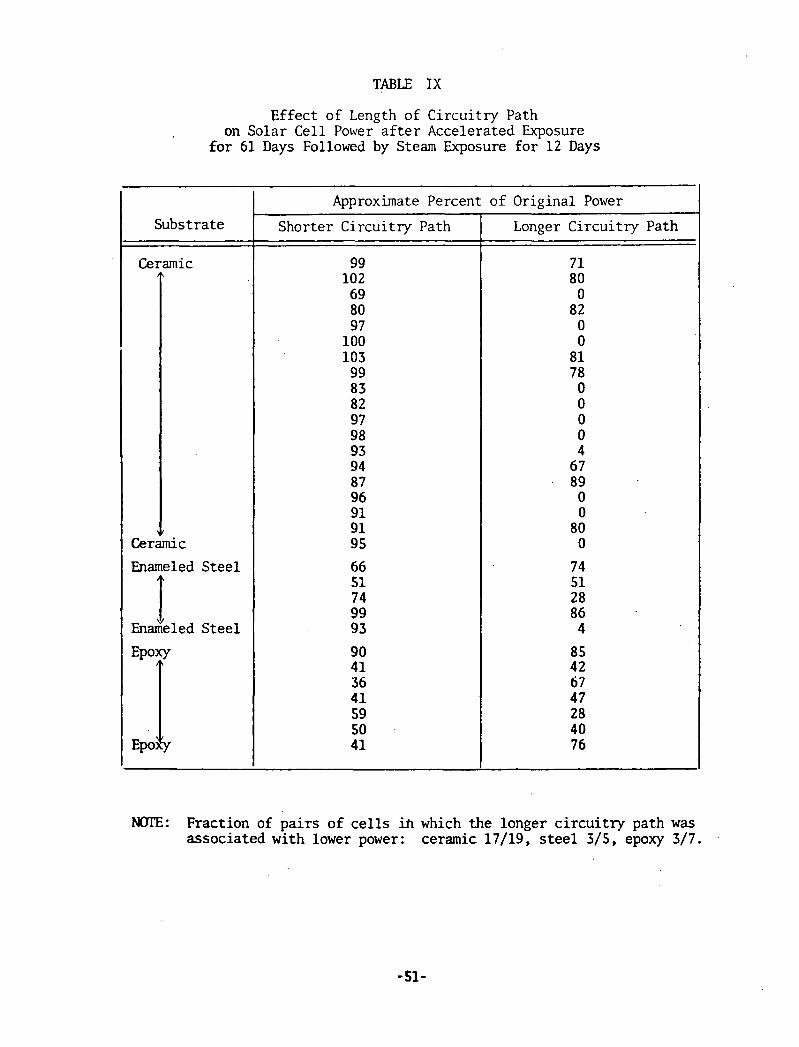
TABLE IX
Effect of Length of Circuitry Path on Solar Cell Power a f t e r Accelerated Exposure
f o r 61 Days Followed by Steam Exposure f o r 1 2 Days
NOTE: Fraction of pa i r s of c e l l s in which the longer c i r cu i t ry path was associated with lower power: ceramic 17/19, s t e e l 3/5, epoxy 3/7.
Substrate
Ceramic
Approximate Percent
Shorter Circuitry Path
99 102 69 80 97
100 103 99 8 3 8 2 97 98 93 94 8 7 96 91 9 1 9 5
66 51 7 4 99 9 3
9 0 4 1 36 4 1 59 50 41
v
of Original Power
Longer Circuitry Path
7 1 8 0 0
82 0 0
8 1 7 8 0 0 0 0 4
6 7 89 0 0
8 0 0
74 51 2 8 86 4
8 5 42 67' 47 2 8 4 0 76
A
Ceramic
Enameled Steel
1 Enameled Steel
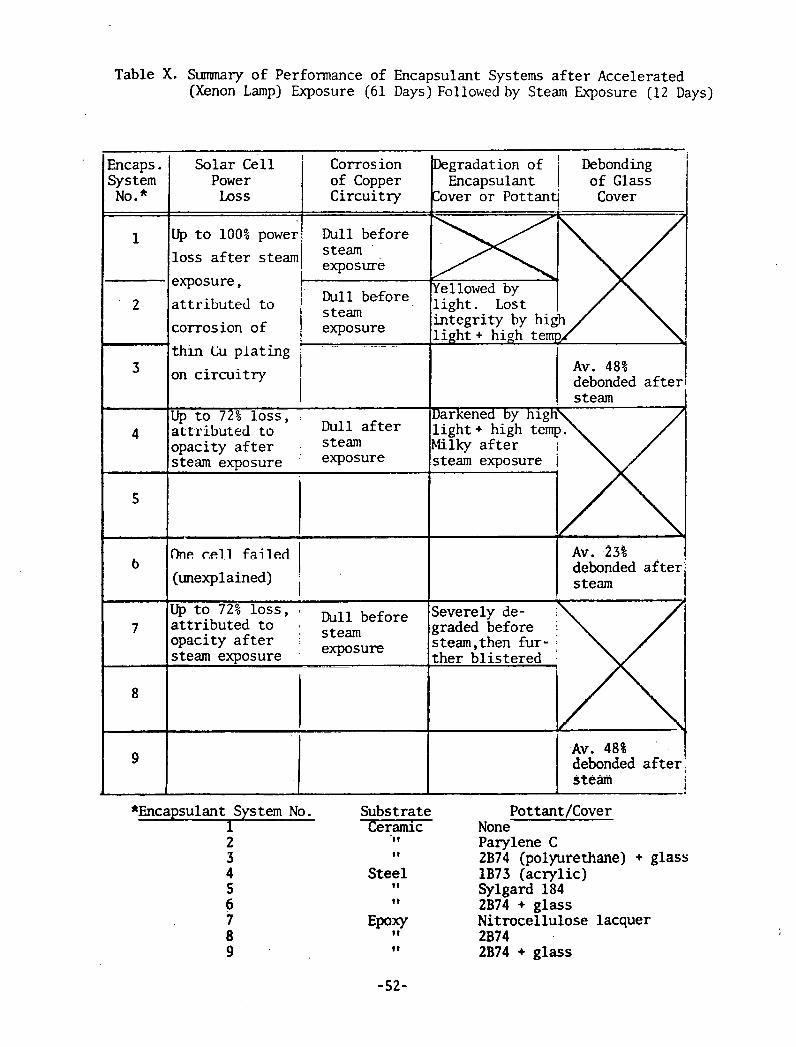
Table X. Summary of Performance of Encapsulant Systems a f t e r Accelerated (Xenon Lamp) Exposure (61 Days) Followed by Steam Exposure (12 Days)
loss a f t e r steam
con-osion of
t h ln Cu plat ing
debonded a f t e r
*Encapsulant Sys tern No. 1
Substrate Ceranuc
Steel I I
Pottant/Cover None Parylene C 2B74 (polyurethane) + glass 1B73 (acrylic) Sylgard 184 2B74 + glass Nitrocellulose lacquer 2B74 2B74 + glass
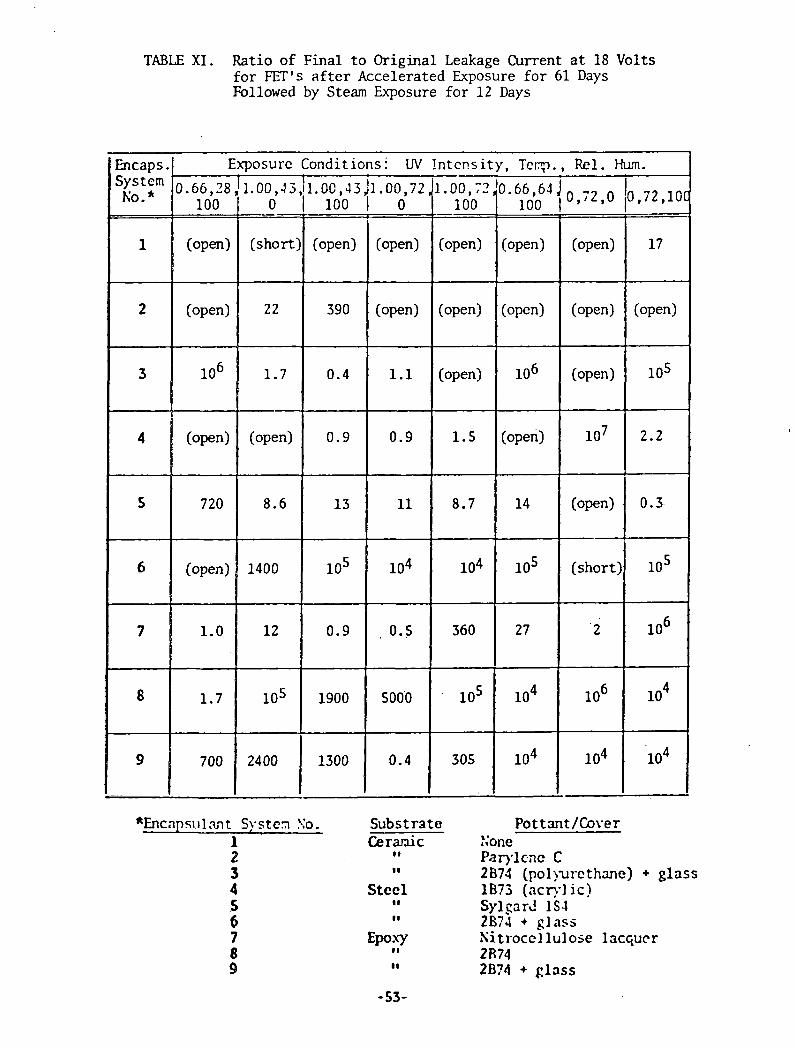
TABLE XI. Ratio of Final to Original Leakage Current at 18 Volts for FET's after Accelerated Exposure for 61 Days Followed by Steam Exposure for 12 Days
II
Steel I I
Encaps. System NO. *
1
Pottant/Cover Xane Parylcnc C 2B73 (poly~rcthme) + glass 1673 (acq-I ic) Sylgard IS4 2674 + glass Sitx-occl lulose laccjucr 2R74 2B74 + glass
Exposure Conditions i UV Intensity, Tcq., Rcl. Huv.
100
(open)
8
9
' 0 ~ 6 6 , ? 8 ~ 1 ~ 0 0 , ~ j ~ 1 ~ 0 0 , ~ 3 ~ 1 ~ 0 0 ~ 7 2 ~ 1 ~ 0 0 , ~ ~ 0 ~ 6 6 , 6 1 ] ~ , ; ~ , ~ 0,72,10C
1.7
700
100 I 0 I 100 I 0
lo5
2400
100 I
1900
1300
500'0
0.4
(open)
I
(short) (open)
lo5
305
(open) (open) (open)
lo4
lo4
17
lo6
lo4
lo4
lo4
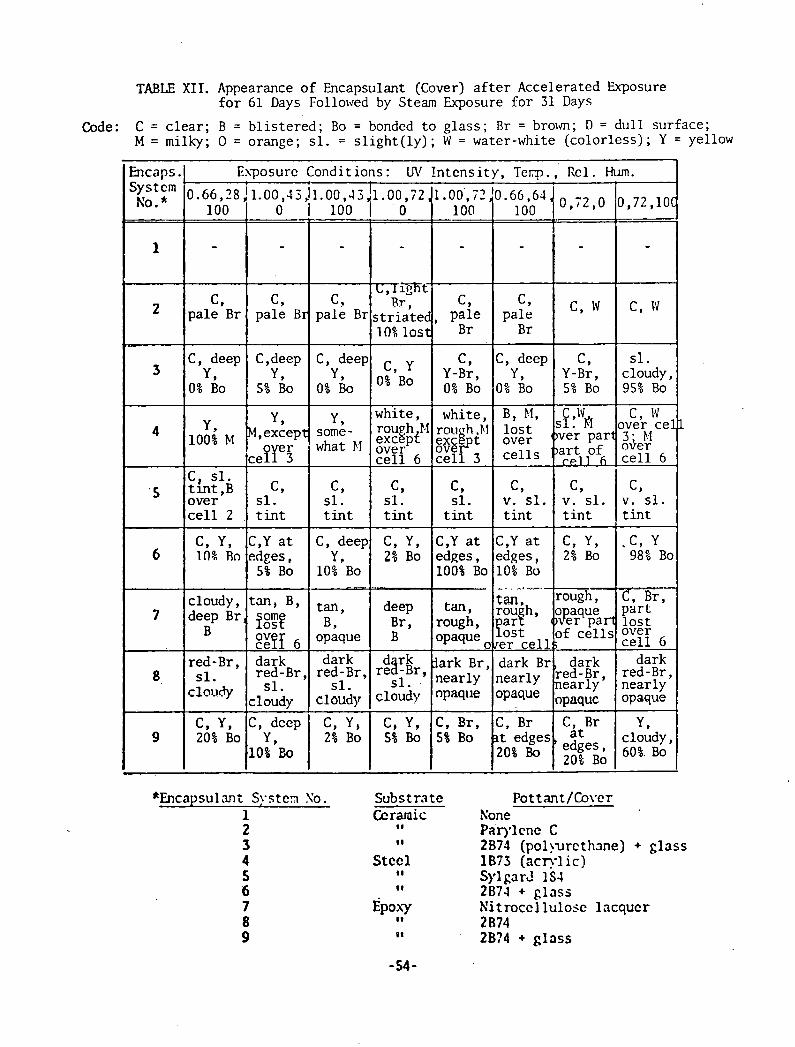
TABLE X I I. Appearance of Encapsulant (Cover) a f t e r Accelerated Exposure f o r 61 Days Followed by Steam Exposure fo r 31 Days
Code: C = c l ea r ; B = b l i s t e r e d ; Bo = bonded t o g lass ; B r = brown; D = du l l surface; M = milky; 0 = orange; sl . = s l i gh t (1y ) ; W = water-white (co lor less ) ; Y = yellow
*Encapsul.mt S!'sten So. 1 2 3 4 5 6 7 '8 9
Encaps.
Sc:IEm
1
- -
3
Sub.s t ra t c Ceramic
I t
I I
Stccl II
#I
Pottant/Co\'cr Xone Piirylcnc C 2B74 (pol>urcthsne) + g la s s 1873 ( a c n l i c ) Sylgarc! IS4 2B73 + g l a s s N i tmcc l lu losc lacquer 2R74 2B14 + glass
Hum.
0,72,10C
-
C , W
sl . cloudy, 95% Bo
E.\posurc Conditions: UV In t ens i ty , Tcrp. , Rcl.
C , 1 i over c e l l 3 ; El
6
c, v. s l . tint
. C , Y 98% Bo
' 0 . 6 6 , 2 8 ~ 1 . 0 0 , 4 ~ ~ 1 . 0 0 , ~ ~ ~ 1 . 0 0 , 7 2 ~ 1 . 0 0 , i ? ~ 0 . 6 6 , 6 ~ , 100
-
c, pa le B r
C, deep y ,
O%Bo
white, rough 1.1 except over c e l l 6
c, sl . t i n t
C , Y , 2% Bo
y , some- what FI
0 , 7 2 , 0
-
C, W
C , Y-Br, 5% Bo
C 1i s l ; $1
100
-
c, pa le
B r
C , Y-BY, 0% Bo
white, rou ~h .F1
r s
6
8
9
100
-
c, pale
B r
C, deep Y ,
0% Bo
B, W, l o s t
0 I 100 I 0
Opaque o fe r c e l l $
cxS$t c e l l 3
c, sl.
tint
C ,Ya t e d ~ e s , 100% Bo
-
c, pale Br
C ,deep y ,
5 % B o
C, sl. tmt,B over c e l l 2
C, Y , 10% Rn
cloudy, B r ~
B
red-Br, sl.
clnurty
C , Y , 20% Bo
d r k r e a - ~ r ,
s l . cloudy
C , Y , 5% Bo
over
-
c. pale B r
C , deep y ,
O%Bo
c, s l . tint
C , Y a t edges,
5% Bo
t an , B ,
f:!! g!ff 6 dark red-Br ,
S1. ,-laudy
C ,deep Y ,
10% Eo
ark B r , iearly "paq'le
C , B r , 5% Bo
Part
L ,I TgTt Rr ,
s t r ia ted , l O % l o s t
C 9 Y
O% B"
c, sl. tint
C , deep y p
10% Bo
tan , B,
Opaque dark
red-Br , sl .
cloudy
C , Y , 2% Bo
c e l l s
c, v. sl. t i n t
C,Y a t edges, 10% Bu
... -.
dark red-Br , nearly Opaque
y , cloudy, 60% Bo
dark B r nearly Opaque
C , R r a t edges, 20%
"7:1e$ c,
v. sl. tint
C , Y , 2% Bo
dark ked-Br, nearly .p,q,,
C , B r at
edges , 20% Bo
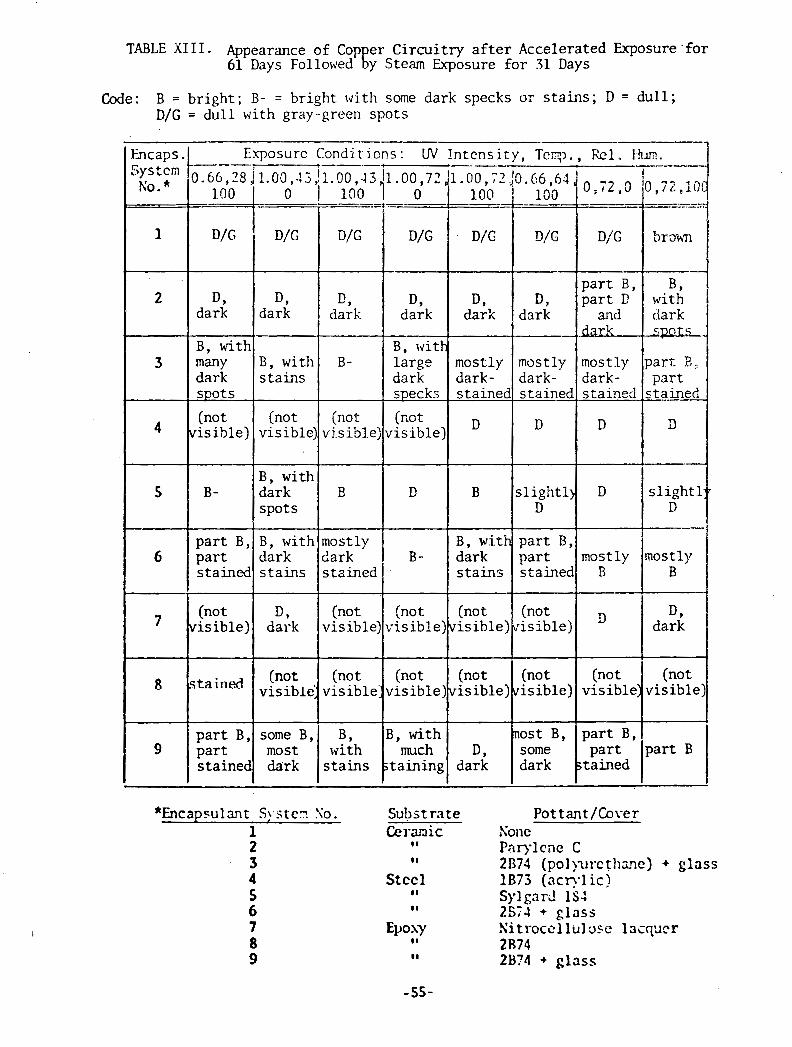
TABLE XIII. Appearance of Cop er Circuitry after Accelerated Exposure .for E 61 Days Followed y Steam Exposure for 31 Days
Code: B = bright; B- = bright with some dark specks or stains; D = dull; D/G = dull with gray-green spots
*Encapsulmt S!.ster! So. 1
Pot tant/Cover Sollc Parylcne C 2B74 (pol ?urc t h a e ) + glass 1B73 (acq-1 i c ) Syl g;~ ri! I S: 2574 + glass Si tl-occl lul3se l a i q x r 2R74 2B74 + glass
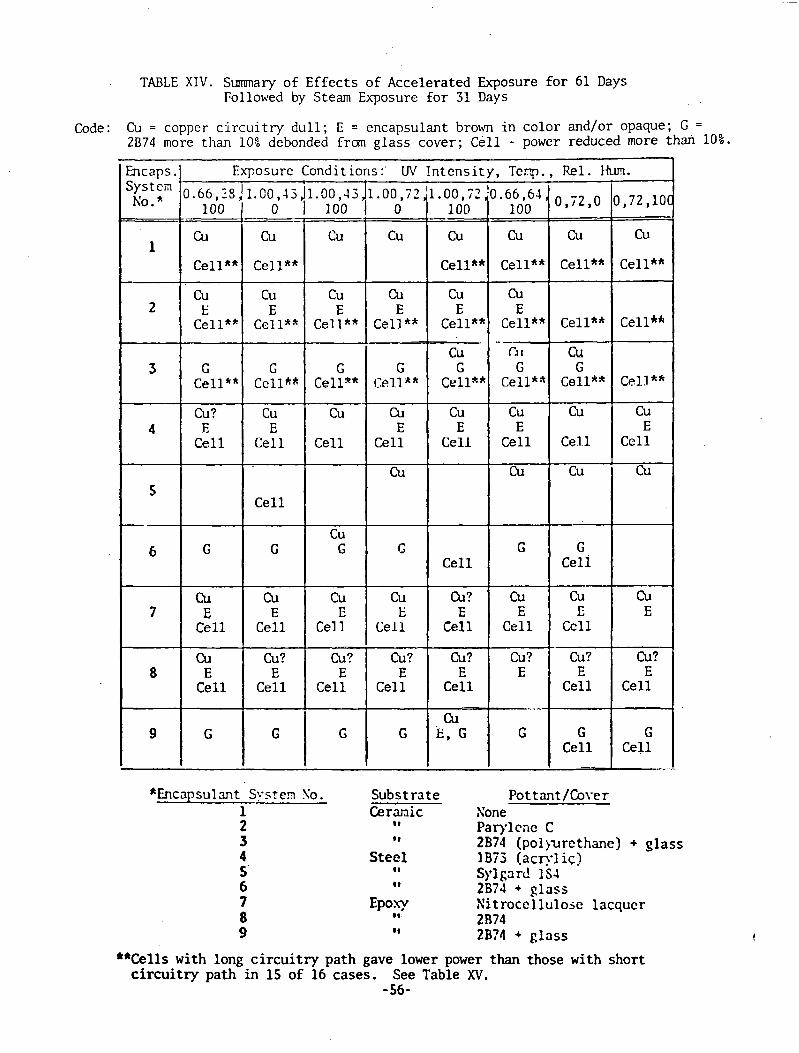
TABLE XIV. Summary of Effects of Accelerated Exposure for 61 Days Followed by Steam Exposure f o r 31 Days
Code: Cu = copper c i r c u i t r y d u l l ; E = encapsulant brown i n color and/or opaque; G = 2B74 more than 10% debonded from glass cover; Cel l - power reduced more than 10%.
*Encapsulmt Sysren So. 1
Encaps.
S ~ ~ ~ ~ "
1
2
3
4
5
6
7
8
9
Subs t ra te Ce rmic
Steel 8 I
8 8
Pottant/Cover Sone Parylcnc C 2B74 ( p o l ~ u r c t h m e ) + glass I B73 (acryl ic! Sy lp rc ! IS4 2674 + g l a s s S i t rocc l lu losc lacqucr 2 874 2B74 + g l a s s
Hum.
0,72,10L
cu
Cell**
Cell**
Cell**
cu E
Cel l
Cu
Cu E
Cu? E
Cell.
G Cell
",--
**Cells with long c i r c u i t r y path gave lower power than those with short c i r c u i t r y path i n 15 of 16 cases. See Table XV.
- 56-
Rel.
cu
Cell**
Cell**
cu G
Cell**
Cu
Cel.1
cu
G c e l i
Cu E
Ccll
Cu? E
Cell
G Cel l
Ex-posurc Conditions :' UV In t cns i ty , Tcrp.,
100
cu
Cell**
Cu E
Cell** --
Cl I G
Cell*"
Cu E
Cel l
Cu
G
Cu E
Cell
Cu? E
.. . -.
G
100
Cu
Cell**
cu E
Cell**
cu G
Crll**
Cu E
Ccl l
Cel l
Cu? ' E
Cell
Cu? E
Cell
cu k, G
100
Cu
CellA*
Cu E
Cell**
G Cell**
Cu? E
Cel l
G
CLl E
C e l l
Cu E
Cell
G
0 . 6 6 , ~ 8 ! 1 . 0 0 . 4 ~ j l . 0 0 , 1 3 ] 1 . 0 0 , 7 2 ~ 1 . 0 0 , i 2 ~ 0 . 6 6 , 6 ~ , ~ , ~ ~ , ~ 0 I
-
Cu
Cell**
Cu E
Cell*"
G Cell**
Cu E
Cel l
Cel l
G
Cu E
Cell
Cu? E
Cell
G
100 I Cu
Cu E
Cell**
G Cell**
Cu
Cell
Cu G
Cu E
Cell
Cu? E
Cell
G
0
cu
Cu E
Cell** -.
G r:el.l"*
Cu E
Cell
Cu
G
Cu E
Cel l
Cu? E
Cell
G
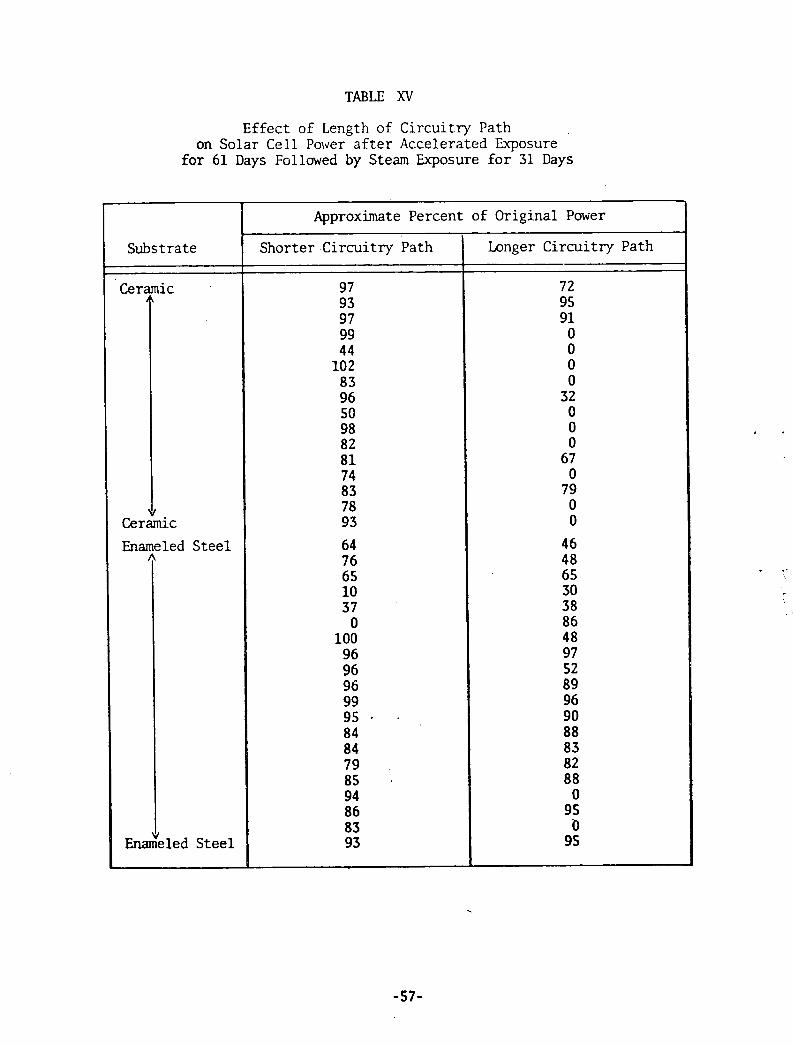
TABLE XV
Effect of Length of Circuitry Path on Solar Cell Power a f t e r Accelerated Exposure
for 61 Days Followed by Steam Exposure for 31 Days
Substrate
Ceramic
v Ceramic
Enameled Steel A
~nam"e1ed Steel J
7
Approximate Percent
Shorter Circui t ry Path
9 7 93 9 7 99 4 4 102 8 3 96 50 98 82 8 1 74 8 3 78 93
64 7 6 6 5 10 3 7 0
100 96 96 96 99 95 . . 84 8 4 79 85 - 94 86 83 93
of Original Power
Longer Circuitry Path
72 95 91 0 0 0 0 32 0 0 0
6 7 0 7 9 0 0
4 6 48 65 30 3 8 86 48 97 52 89 96 90 8 8 8 3 8 2 88 0 95 0 95
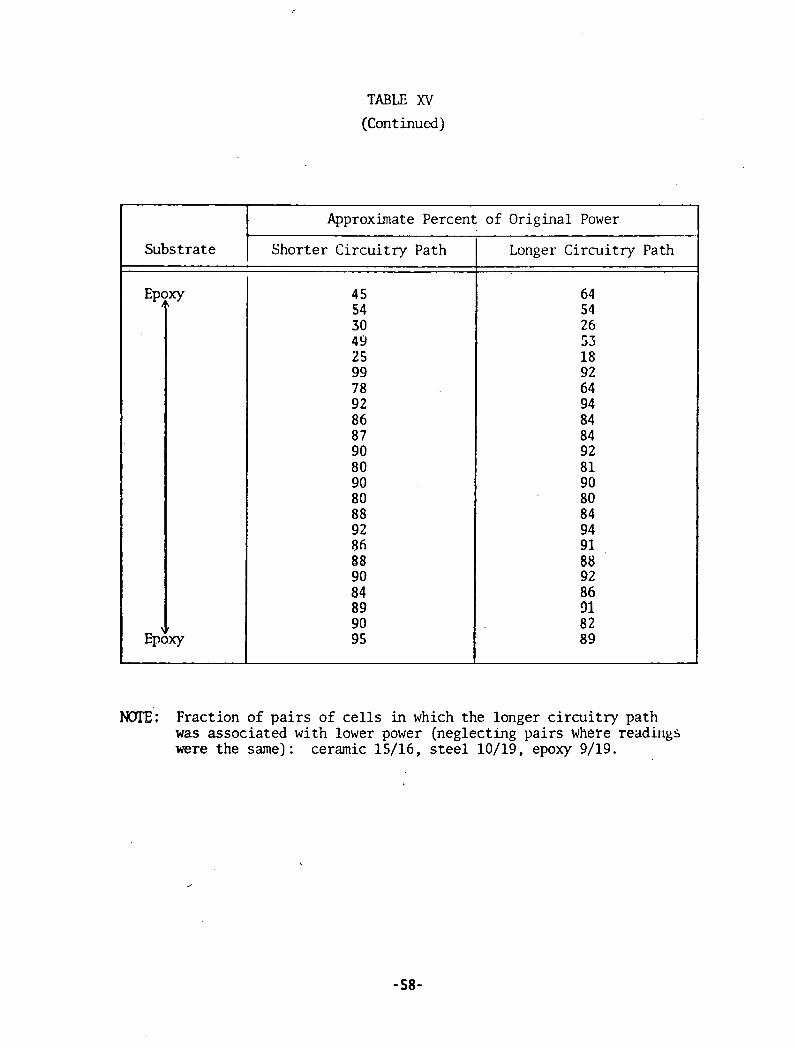
TABLE XV
(Continued)
NOTE': Fraction of p a i r s of c e l l s in which the longer c i r cu i t r y path was associated with lower power (neglectmg pa i r s where readings were the same) : ceramic 15/16, s t e e l 10/19, epoxy 9/19.
Substrate
Approximate Percent of Original Power
Shorter Ci rcu i t ry Path Longer Circui t ry Path
64 54 2 6 53 18 92 64 94 84 8 4 9 2 81 90 80 84 94 91 8 8 92 8 6 91 8 2 8 9
E P ~ V
EP&
45 54 30 49 2 5 99 7 8 92 86 8 7 9 0 80 90 8 0 8 8 92 8 h 8 8 90 84 8 9 90 95
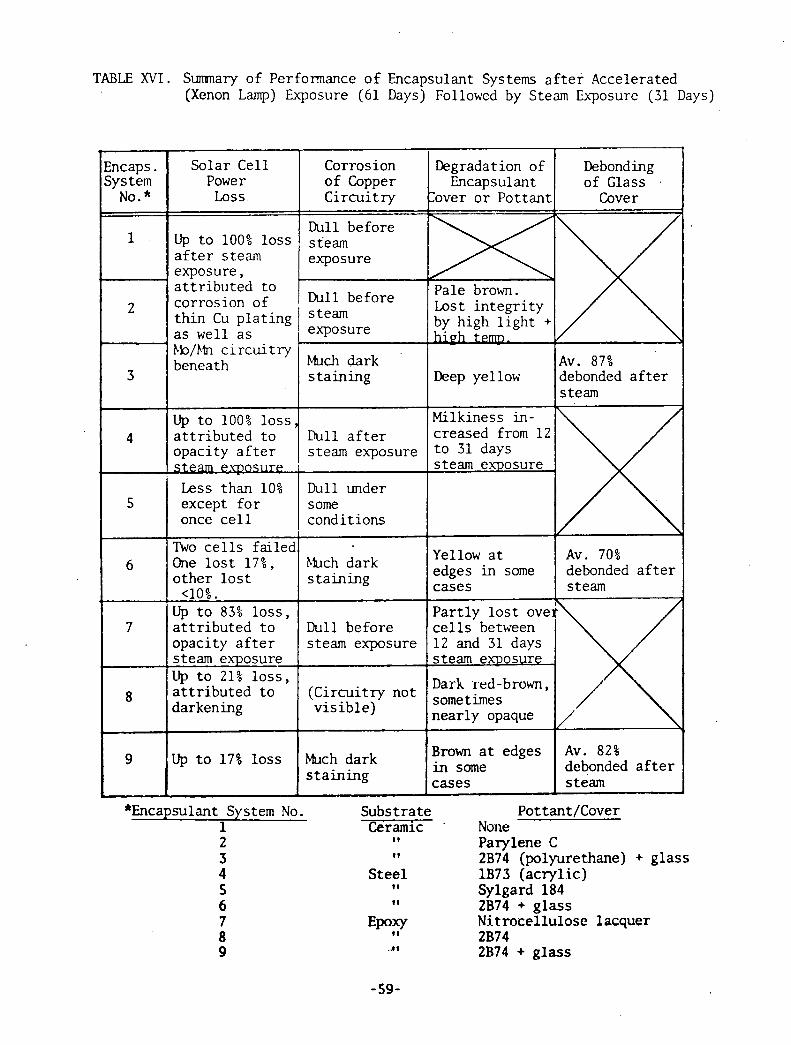
TABLE X V I . S m a r y of Performance o f Encapsulant Systems a f t e r Accelerated (Xenon Lamp) Exposure (61 Days) Followed by Steam Exposure (31 Days)
"Encapsulant System No. 1
Subst ra te Ceramic
I I
11
S t e e l 11
I t
Debonding of Glass
Cover
Parylene C 2B74 (polyurethane) + g lass 1B73 (acrylic) Sylgard 184 2B74 + g lass Nitrocellulose lacquer 2B74 2B74 + g lass
Encaps. Sys tem
No. * Corrosion of Copper C i rcu i t ry
Solar Cell Power Loss
Dull before steam exposure
Pale brown.
Degradation of Encapsulant
:over o r Pottant
1 Up t o 100% loss a f t e r steam exposure, a t t r i b u t e d t o
2
3
4
5
6
7
8
9
corrosion of Lkrll before ~ o s t i n t e g r i t y t h i n Cu p la t ing / Steam as well a s bb/bin c i r c u i t r y beneath
Up t o 100% l o s s , a t t r i b u t e d t o opacity a f t e r st- Less than 10% except f o r once c e l l
Two c e l l s fai led One l o s t 17%, o the r l o s t
< l o % . Up t o 83% l o s s , a t t r i b u t e d t o opacity a f t e r steam e'xposure Up t o 2 1 % l o s s , a t t r i b u t e d t o darkening
Up t o 17% l o s s
exposure by high l i g h t +
'
Av. 87% debonded a f t e r steam
k c h dark s t a in ing Deep yellow
Dull a f t e r steam exposure
D u l l under some condit ions
bbch dark s t a in ing
Dull before steam exposure
(Circui t ry not v i s i b l e )
Much dark s t a i n i n g
Milkiness in - creased from 1 2 t o 31 days steam exposure ,
Yellow a t edges in some cases
Av. 70% debonded a f t e r steam
Par t ly l o s t ove c e l l s between 1 2 and 31 days steam e x ~ o s u r e
Dark x.ed-brown, Sometimes near ly opaque
Brown a t edges in some cases
Av. 82% debonded a f t e r steam
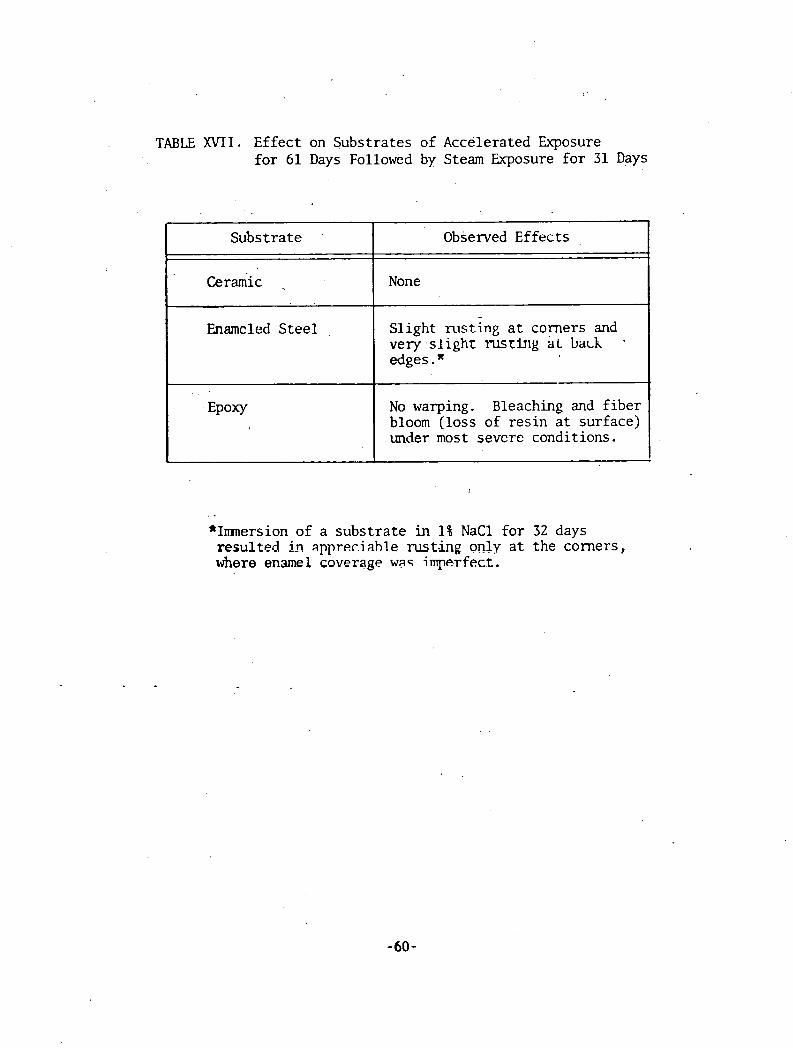
TABLE XVII. Effec t on Substrates of Accelerated Exposure f o r 61 Days Followed by Steam Exposure f o r 31 Days
*Inrnersion of a subs t ra te in 1% NaCl f o r 32 days resulted in appreciable rus t ing only a t the corners, where enamel coverage waq impwfect.
I
Subst ra te .
~ e r k i c ., . .
Enameled S t e e l ,
EPOXY
Observed Effects
None
S l igh t rus t ing a t comers and very s l ighe rusrFrig i i ~ back edges.
No warping. Bleaching and f i b e r bloom ( loss of r es in a t surface) under most sevcre conditions.
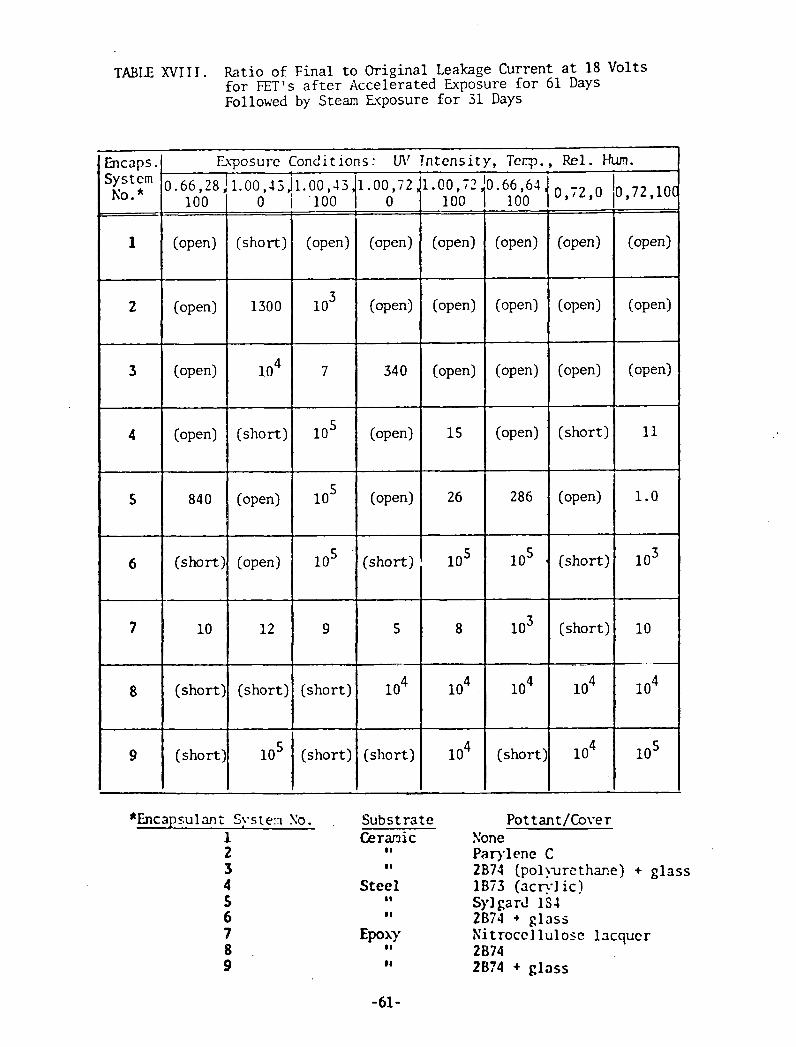
TABLE XVIII. Ratio of Final t o Original Leakage Current a t 18 Volts f o r E T ' s a f t e r Accelerated Exposure f o r 61 Days Followed by S t e m Exposure f o r 31 Days
*Encapsulan? Systern So. .
1 2 3 4 5 6 7 8 9
h c a p s .
'i:!:" 1
2
3
4
5
6
7
8
9
Subst ra te Cermic
S t e e l I * 9 I
100
(open)
(open)
(open)
(open)
840
(short)
10
(short)
(short)
Pottant/Cover Sone Parylenc C 2B74 (pol!urethane) + g l a s s 1B73 ( s c v l ic ) Sylgard 1S1 2074 + g l a s s Ki t roccl lu losc lacquer 2074 2B74 + g l a s s
Fkposurc Conditions: U\' In tens i ty , T c p . , +
Rel. Hum.
0 , i2 ,0 '0.66,28,1.00,~~jl.00,~~ 1.00,i2, '1 .00, i? o i '100 i 0
0,72,10C '0.66,61; 100 1
(open)
' (open)
(open)
15
26
10'
(open)
(open)
340
(open)
(open)
(short)
J
(short)
1300
l o 4
(short)
(open)
(open)
I 100
(open)
(open)
(open)
(open)
286
10'
lo3
l o4
(short)
(open)
l o 3
7
10'
10'
10' '
(open)
(open)
(open)
(short)
(open)
(short)
(short)
. .
l o 4
l o 4
1 2
(short)
10'
I
(open)
(open)
(open)
11
1 .0
l o 3
10
.- ,.-
l o 4
10'
9
---------
(short)
(short)
5
l o 4
(short)
8
l o4 .
l o4
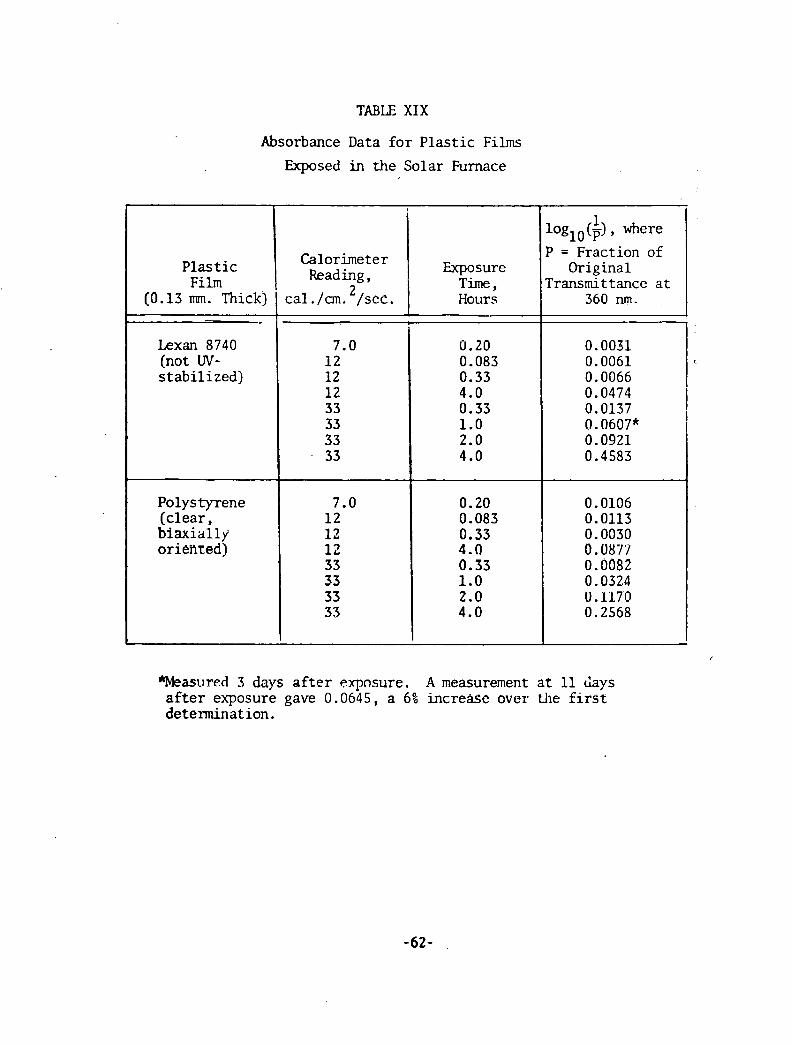
TABLE XIX
Absorbance Data f o r P l a s t i c Films
Exposed in t h e Solar Furnace
Weasurcd 3 days a f t e r expnsure. A measurement a t 11 Gays a f t e r exposure gave 0.0645, a 6% increase over the f i r s t determination.
P l a s t i c Film
(0.13 m. Thick) --
Lexan 8740 (not W- s t a b i l i z e d )
Polystyrene (c lear , blaxial ly ' orienred)
Calorimeter Reading,
2 cal ./an. /see. - -
7.0 12 12
12 3 3 33 3 3 33
7.0 12 12 1 2 3 3 3 3 33 33
1 loglo , where P = Fraction of
Original Transmittance a t
360 nm.
Exposure Time, Hours
0.20 0.083 0.33 4.0 0.33 1.0 2.0 4.0
0.20 0.083 0.33 4.0 0.33 1.0 2.0 4.0
1
0.0031 0.0061 0.0066 0.0474 1 0.0137 1). 0607*
I I
0.0921 0.4583
0.0106 0.0113 0.0030 0.087'7 0.0082 0.0324 U. 1170 0.2568
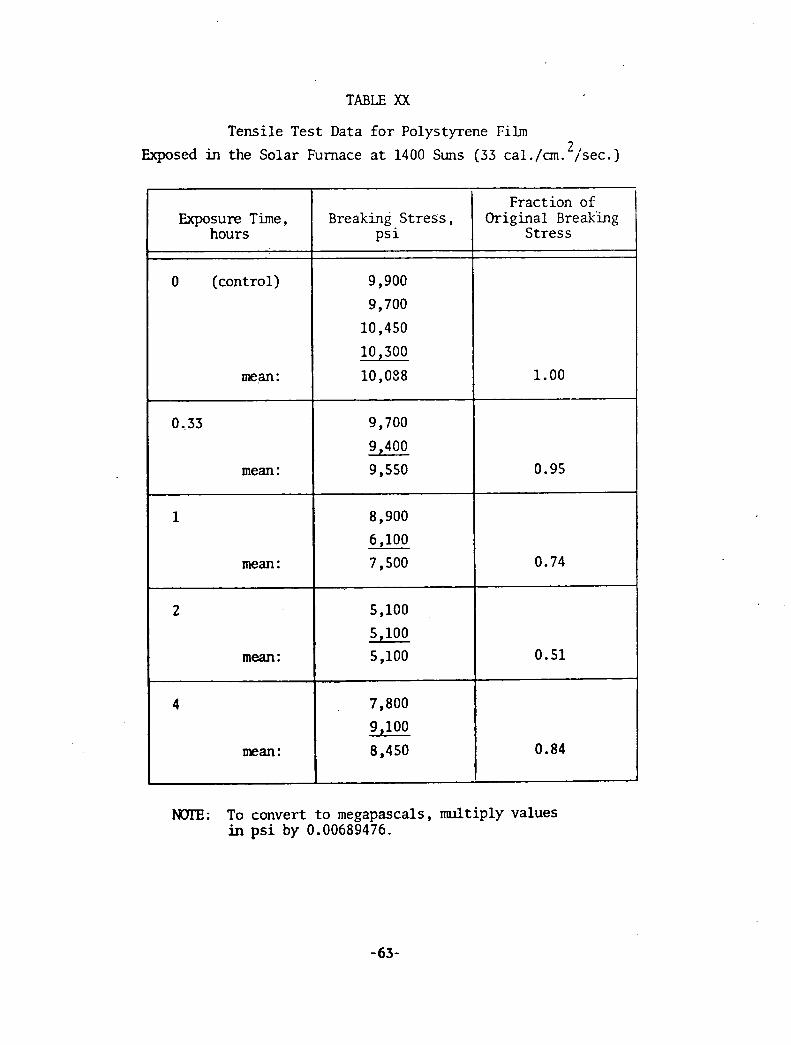
TABLE XX
Tensile Test Data for Polystyrene Film 2 Exposed in the Solar Furnace at 1400 Suns (33 cal./cm. jsec.)
N6E: To convert to megapascals, multiply values in psi by 0.00689476.
Exposure Time, hours
0 (control)
me,m :
0,33
mean :
1
mean:
2
mean :
4
man:
Breaking Stress, psi
9,900
9,700
10,450
10,300
10,088
9,700
9,400
9,550
8,900
6,100
7,500
5,100
5,100
5,100
7,800
9,100
8,450
Fraction of Original Breakkg
Stress
1.00
0.95
0.74
0.51
0.84
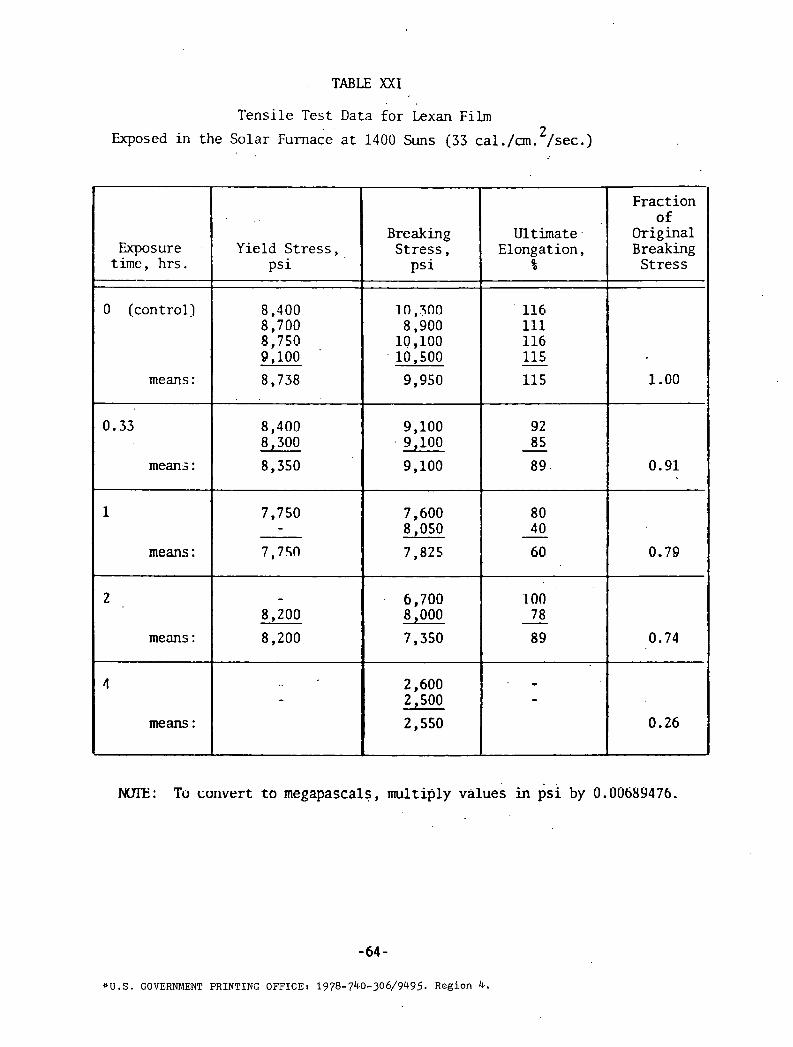
TABLE XXI
Tensi le Test Data fo r Lexan Film 2 Exposed i n the Solar urna ace' a t 1400 Suns (33 cal./an. /sec.)
M E : To corlvert t o megapascals, multiply values in psi by 0.006t19476.
Exposure -
time, hrs . -
0 (control]
means :
0.33
means :
1
means : -
2
means :
1
means:
-64-
Q U .S. GOVERNMENT PRINTING OFFICE: 1978-74,0-306/94,95. Region 4..
Fraction 0 f
Original Breaking
S t r e s s
1.00
0.91
0.79
0.74
0.26
Y i e l d s t r e s s , p s i
8,400 8,700 8,750 9,100
8,738 . .
8,400 8,300
8,350
7,750 -
7 ,7m
- 8,200
8,200
-
Breaking S t r e s s ,
p s i
1 a ,3n0 8,900
10 ,100 10,500
9,950
9,100 9,100
9,100
7,600 8,050
7,825
6,700 8,000
7,350
2,600 2,500
2,550
1
Ultimate. Elongation,
%
116 I
111 116 - 115
11 5
92 - 8 5
89.
8 0 40 - 60
100
- 78 89
. - -


![[Array, Array, Array, Array, Array, Array, Array, Array, Array, Array, Array, Array]](https://img.dokumen.tips/doc/110x75/56816460550346895dd63b8b/array-array-array-array-array-array-array-array-array-array-array.jpg)