Embed Size (px)
Citation preview


REPORT NO. 41 i
Shore Erosion and Protection Study - Stage 2
Tuktayaktuk, N.W.T.
PREPARED BY:
T.O. mlberg and V.K. Shah, Marine Directorate, D.P.W., H.Q., Ottawa
ISSUED BY:
DPW Western Region
ACKNOWLEDGEMENT
The authors acknowledge the assistance provided by the Geological Survey
Branch, Terrain Science Division, E.M.R. i n obtaining information on the si te
physiography and coast erosion and the assistance provided by the National
Research Council on laboratory tests. The assistance of the Department of
Public Works N.W.T. and the Northern and Indian Community Planning Section,
I . N . A . on compiling background and his tor ical information and of the Regional
office, Western Region, DPW on implementing f i e l d and test works and cost
estimating is also gratefully acknowledged.
ABSTRACT
The report reviews the morphology of the Tuktoyaktuk coastline and recommends
actions that may be taken to protect the coastline against shore erosion.

INDEX ii
k
L
c
Page
Terms of Reference ........................................... I Background ................................................... 1 Introduction ................................................. 4 Topography ................................................... 5 Bathymetry ................................................... 6 C l i m a t e ...................................................... 7 Coastal Geomorphology ........................................ 11 Shore Erosion ................................................ 14 Protection Works ............................................. 21 Cost Estimates ............................................... 26 Recommendations .............................................. 29
FIGURES
1 2 3A 3B 3c 4 A 4B 5 6 7 8 9 10 11 1 2 13 14 15 16 1 7 18 19 20 2 1 22 23 24
Location Map Site Plan Day - Night Regime Typical Precipitation Temperature Profile Wind C l i m a t e Extreme Winds Wave C l i m a t e Wave C l i m a t e Water Levels Current Velocity Current Velocity Current Velocity Fresh Water Layers Subsurface Profiles coastal Profiles Subsurface Temperatures - RCMP Garage Subsurface Temperatures - School Shoreline changes Mechanics of Erosion Mechanics of Erosion Mechanics of Erosion Thermally Induced Land Settlement Thermally Induced Land Settlemtnt Littoral, Morphological and Thermal Processes Longard T e s t Protection Work Longard T e s t Protection Work

25 26 27 28 29 30 31 32 33 34 35 36 37 38 39 40 41 42 43 44
Alternative 1 - Longard System Alternative 1 - Longard System Alternative 1 - Longard System Alternative 1 - Longard System Alternative 1 - Longard System Alternative 1 - Longard System Alternative 2 - "Z" Wall System Alternative 2 - "2" Wall System Alternative 2 - "ZW Wall System Alternative 2 - "Z" Wall System Alternative 2 - "Z1' Wall System Alternative 2 - "Z" Wall System Alternative 2 - I I Z " Wall System Alternative 2 - "Z" Wall System Alternative 3 - Rubble Mound Alternative 3 - Rubble Mound Alternative 3 - Rubble Mound Alternative 3 - Rubble Mound Alternative 3 - Rubble Mound Alternative 3 - Rubble Mound
VOLUME 2
APPENDICES
A Summary of 1973 Report B Topographic Maps C Hydrographic Charts D C l i m a t e E Test Bore R e s u l t s
iii

I
TERMS OF REFERENCE
Mr. S.M. Hdgson, Conmissioner of the N.W.T. by letter of February 21, 1972
requested that Public Works Canada carry out a detailed engineering
investigation on behalf of the Government of the N.W.T. t o determine the most
effective and economical way of combating the erosion of the seashore in the
vicinity of the existing school a t Tuktoyaktuk.
Assistant Commissioner C.W. Gilchrist by let ter of July 14 , 1972 advised P u b l i c
Works to extend the s i te investigation t o include the west seashore of the
Tuktoyaktuk peninsula.
The Phase I report of April 18, 1973 to Conmissioner S.M. Hodgson recommended
in par t that the more intensive si te investigation be extended t o include
Tuktoyaktuk Island,
Assistant Commissioner E. Cotterill by le t ter of March 28, 1974 approved funding i n the amount of $52,000 for a Phase I1 report.
In accordance with the recomendations of Phase I report, t he f ie ld work
carried out under t h i s report included the Tuktoyaktuk Settlement Peninsula and
Tuktoyaktuk Island.

1
Shore Erosion and Protection Study
Tuktoyaktuk, N .W. T.
Stage 2 Report
Background
This report has been prepared to discuss the causes of erosion occurring a t
Tuktoyaktuk, N.W.T. and to recommend solutions for preventing further
degradation of upland property affected by the erosion.
A large natural harbour exists a t Tuktoyaktuk. The harbour is protected by a
peninsula and a large island. The shorelines of both the Peninsula and the
island have been receding a t substantial rates. Tuktoyaktuk Island is not
inhabited and the shore erosion occurring there is not of immediate concern. A
settlement exists on Tuktoyaktuk Peninsula and certain important buildings,
among them a school, ice rink and certain other buildings located there require
protection without delay.
Because of the seriousness of the threat posed by shore erosion occurring a t - Tuktoyaktuk Peninsula the Government of the North West Territories requested
the Department in ear ly 1972 to study the problem and make recomnendations on
measures it may take to safeguard the Peninsula against erosion, (see Terms of
Reference) . c
4
The Department comnenced the study i n May 1972 and carried out l i terature
research of available reports of studies and investigations pertinent to the
subject, data acquisition of available data, consultations with specialists on
topics involved in the study, limited topographical and sounding surveys and
model tes t ing of certain experimental solutions. The analysis of the
information and material collected indicated that considerable further work was required t o understand the causes of erosion occurring a t Tuktoyaktuk and to
recommend solutions for protecting the area against further erosion. The report prepared incorporating the findings and recommendations was suhmitted i n
April 1973.

2
c
Details of the April 1973 report are presented in Appendix A. Essentially, the
following t w o actions were proposed i n the report:
(1) Provision of experimental protection works a t three sections of Tuktoyaktuk
Peninsula a t an estimated cost of approximately $530,000.
(2) A stage 2 study including certain field work to obtain information on soi l
s t ra t i f ica t ion , thermal s t ab i l i t y , topography and bathymetry of the coastal
zone a t an estimated cost of $52,000.
The Government of the North West Territories reviewed the report and made
provisions for $152,000 to install certain limited protection works c
' a t the school building and to carry out the stage 2 study as recomended in the c report.
- The design of the test shore protection works recommended i n the March 1973
report involved construction of flexible sea-walls and groins using certain
I patented steel wire gabions. This design was based on several assumptions. It
was assumed tha t the materials required to f i l l the gabions would be available
locally and that labour needed to carry out the work could be obtained from
within the area. subsequent investigations suggested that neither of these t w o
conditions could be m e t . Various enquiries were therefore made to devise an
alternative solution. A product known as the "Longard" tubes was a t that time
coming into the North American market. The "Itongard" tubes which are sausage
-
- c shaped merely require sand t o f i l l them and had been found to be functioning
c- as shore protection work units showed good possibi l i t ies and a decision was
w e l l i n Europe and in certain ice environments. The use of the "Longard" tubes
made t o proceed with the test program using these i n place of gabions. The
materials required were ordered and received for installation during the summer
of 1975. Owing to cer ta in d i f f icu l t ies encountered i n obtaining sorted sand in
time the implementation of the program, however, was postponed t o 1976.
- h
The overall estimated cost of t h i s test construction program is now $152,000.

3
The stage 2 study program was put underway as soon as the Government of the
North West Territories advised the Department i n March 1974 to proceed with the
program. The necessary f ie ld work, documentation of the f i e ld work, consultations and analyses of the data and information acquired have now been
completed and reported i n this report.
The report is divided i n two volumes. Volume 1 has been compiled to provide
the findings and recommendations of the study. The supporting documents of
the study are provided as appendices i n Volume 2.

4
n Shore Erosion and Protection Study
Tuktoyaktuk, N.W.T.
Stage 2 R e p o r t
1. Introduction
Tuktoyaktuk is located on the eastern side of Kugmallit Bay in t he Western
Arctic a t north latitude of 69O 27' and west longitude of 133O 02'. I t
is approximately 90 miles north of Inuvik and 1450 miles northwest of
Edmonton (figure 1). The area is mainly comprised of a long, narrow,
boot-shaped peninsula oriented i n approximately north-south direction, a
c o m p l e x lagoon, which has been developed as a harbour, east of the
peninsula and an island straddling the mouth of the lagoon (see figure 2 ) .
Certain dwellings exist a t the southern and southeasterly shores of
Tuktoyaktuk Harbour. A large majority of the inhabitants reside i n a
settlement developed on the peninsula. Tuktoyaktuk is used as a transfer
point, linking the Mackenzie River barge transport w i t h coastwise shipping
serving the western arctic seaboard and inland settlements and bases. As a
result of th i s the TUK settlement has grown t o be the largest of the
western a rc t i c coast settlements.
The Tuktoyaktuk shores have been receding a t considerable rates and several
buildings, among them a school, curling rink and certain other
buildings located on the peninsula, are i n need of imnediate protection.
Certain shore protection works were constructed a t the peninsula but they
were found to be inadequate and the erosion there has remained unchecked.
This study was therefore undertaken to determine the exact nature of the
erosion occurring a t Tuktoyaktuk and ways i n which it could be arrested.

5
2. Topoqraphy
Tuktoyaktuk is generally f lat . Its shoreline is demarcated by steep
cliffs. The Tuktoyaktuk peninsula is approximately 4,400 f ee t long and
1,400 feet t o 300 f e e t wide. It is 5 t o 25 f ee t above the sea level and
covers an area of approximately 16 acres. The Tuktoyaktuk Island is
approximately one mile long, and, on an average 600 feet wide. The island
is characterized by i ts f l a t top which is approximately 30 f e e t above the
sea level and c l i f f s s teep ly plunging to t he sea. The harbour runs inland
in a southwesterly direction and is approximately 7 miles long. The
terrain around the harbour is f l a t and contains numerous lakes. The
topographical survey data and maps prepared under the study are given in
Appendix "B" .

6
c
3. Bathymetry
Generally, the Tuktoyaktuk shore dips relatively very gently. The depth of
water one mile away from the shoreline is only 12 t o 13 feet. The depth
contours are however highly rugged ehowing ridge, valley, plateau and
intr icately shaped sand bar type formations, particularly offshore of the 3
feet depth contour. The depth contours from 0 to 3 feet are generally
parallel t o the shoreline. Details of the hydrographic survey carried out
and charts produced in the course of the study are included i n Appendix "Cll

7
4. Climate
The Tuktoyaktuk region lies within the sub-arctic lowland. It has 8 months
of winter and 2 months of summer, separated by one month of spring and one
month of fa l l . In the summer there is daylight round the clock. The
winter time is marked by darkness (see figure 3 A ) . The mean winter
temperature is about -2OOF and that of the summer, 40°F. I n the
extreme the temperatures can drop to -50°F i n the winter and r i s e to
8OoF i n the summer. The freeze-up occurs a t around the beginning of
October. The ice break-up takes place a t around the third week of June.
Because of the low capacity of cold a i r fo r water vapour the precipitation
i n the Tuk region, like most arctic areas, is low. Drawing 3B shows some
typical precipitation graphs. Details of the TUK climate are given i n
appendix D. Certain aspects of the ‘RIK climate that influence the shore
regime are discussed below in general terms.
Air Temperatures
Because of low temperatures and absence of wave ac t ion l i t t l e o r no
l i t t o r a l movement can be expected to occur during the ice covered periods
of the year. We are therefore more concerned w i t h the time when the ice is
no longer restricting wave action and when the coast becomes subject to
wave and thermal action, when any l i t t o ra l ac t iv i ty can occur.
Figure 3C shows a i r temperature profiles of the Tuk atmosphere. The figure
suggests that generally the above freezing temperature regime occurs from
about mid June to mid October. I n the extreme this period can be as short
as 6 weeks and as long as 6 months.
In cold years, therefore, relatively l i t t l e l i t t o r a l a c t i v i t y can be
expected to occur, other things, such as storm activity, being equal. I n
warm years comparatively more in tens i f ied l i t to ra l motion can exist.
The a i r temperature profiles generally suggest the active period, coastal
act ivi ty wise, to be approximately 4 months.

8
Wind Climate
Full wind data of Tuktoyaktuk, required to predict the wave climate
affecting the area, were not readily available when this study was begun.
Information on winds of I n w i k and Sachs Harbour which was available at the
time was therefore obtained (figure 4 A ) . A review of the wind data
suggested that for predicting the TUK wave climate winds recorded a t Sachs
Harbour were more appropriate and these data were therefore used to assess
the TUK wave climate.
Figure 4A shows that the predominant directions of the Sachs Harbour winds
are northwest and southeast. The percentage exceedances of 25 mph and
higher winds are low. This suggests that generally very f e w storms occur
a t Tuktoyaktuk.
Figure 4B shows extreme w i n d s using Sachs Harbour winds as basic data for
prediction of extreme winds that can be expected to occur a t Tuktoyaktuk.
Figure 4B shows that the return periods of storm winds such as 40 mph and
higher winds is approximately 3 years. This indicates that while on an average few storms occur a t Mc high storm act ivi ty can take place i n certain years. Heavy and more frequent storm activity has been noticed i n the l as t 3 years.
Wave Climate
Tuktoyaktuk, because of i ts location i n Kugmallit Bay, is generally w e l l
protected from wave action, except in very heavy storm conditions. Fetch
lengths wi th in the Kugmll i ty Bay, for example, the fetch i n the west direction, are small. Consequently, the waves from wi th in the bay would be
comparatively small. The Kugmallit Bay is generally shallow and its depth
contours are highly irregular. Waves from Beaufort Sea reaching
Tuktoyaktuk would, therefore, undergo considerable shoaling and refraction
and would also be relatively small, except a t high storm water levels when higher waves can penetrate into the area.

9
Figures 5 and 6 ahm the wave climate derived from the wind climate. Figure
5 shows a wave period histogram and a percentage exceedance diagram of wave
heights after shoaling and refraction. The wave period histogram shows the
waves to be mainly 3 to 6 second waves. The wave height graph shows tha t
ninety percent of t h e waves are smaller than 3 feet i n height. The maximum
wave tha t can exist a t Tuktoyaktuk is an 0 foot wave. The w i n d data show
the high wave ac t iv i ty to be from the north and northwest. However,
because of refraction, the wave attack on the shore would be more or less
frontal. Figure 6 shows the wave breaking and plunge points of waves a t
different water levels with respect to distance f r o m the 0 foot contour
towards the shore. The figure suggests that the TUK coastline is
susceptible to wave attack mainly a t high water levels.
Water Levels
The water levels a t Tuktoyaktuk are mainly influenced by t ides and storm
surges. The tidal fluctuations are generally small. The storm surges o r
set-ups a t Tuktoyaktuk are comparatively large.
The tides of Tuktoyaktuk are of the mixed semi-diurnal type. Their ranges
are relatively small. The mean sea level a t Tuktoyaktuk is a t an elevation
of 1.4' above the chart datum. The higher high waters for large and mean
tides, referred to the chart datum are + 2.3' and + 1.9' respectively and
the low waters for large and mean tides are 0.9' and 0.6' respectively.
High storm levels occur occasionally at Tuktoyaktuk. Strong storm winds
from the west t o north would tend t o raise the water level a t Tuktoyaktuk
while easterly winds would depress the water surface. Wind set-ups of 6 to
7 ' an8 wind drawdowns of approximately 3 ' have been noted to occur a t
TuklayakNr.

10
Approximate return periods of extreme storm water levels were estimated
using data on storm water level occurrences obtained from available
references and available t idal and wind records and the results are shown
i n figure 7 . Figure 7 suggests that the TUK water levels rise to the
coastal elevation only once i n every two to three year time period.
currents
Li t t le or no published information is available on currents occurring a t
Tuktoyaktuk. Measurements were therefore carried out to obtain the
information. Three locations were selected to m a k e the current
measurements. These were: (1) the south side of the peninsula, (2) the
mrth side of the peninsula and (3) an area close to the western entrance
of the harbour. Winds and t ides were also measured simultaneously w i t h currents.
The records of currents, winds and t ides were analyzed several ways.
The currents data are shown on figures 8 to 10. The drawings indicate that
generally the currents are weak, ranging from 0 to 0 .5 knots. They appear
to be mainly w i n d induced. The tidal currents can be considered to be
negligible. I n accordance with the directions of the winds, the
predominant directions of the currents are to the south and east. A t the
harbour entrance the currents are considerably influenced by the exchange
of water between the harbour and the sea and their d i rect ions a t t h i s
location are irregular. No records of currents occurring i n the area
during storms are available. The magnitude of currents occurring during
storm aonditions can be expected to be higher than those shown by the above
drawings . The instrumentation and data recording of the above measurements and the i r
analysis was carried out for DPW by the Canadian Hydrographic Service.

5 . Coastal Geomorphology 11
General
c.
The coast of Tuktoyaktuk area can be described as a shallow, embayed and
receding coast. I t is generally f lat and contains narrow beaches and steep
c l i f f s . The area is mostly underlain by fluvial sands and silts and fine
grained deltaic sands. These deposits are capped by a thin layer of a
mixture of sands, peat, lacustrine deposits, gravel and clayey till l i k e
deposits. The subsurface includes permafrost and lenses and sheets of
massive ice.
An extensive program of water sa l in i ty measurement t e s t boring and lab-
oratory analysis and measurement of subsurface temperatures was carried
out. The details are presented in Appendix "E". Major highlights of the
findings are discussed here.
Water Salinity
To estimate the corrosive power of the environment, sa l in i t ies were meas-
ured a t various locations i n the sea. The measurements were carried out
for t h i s study by the Department of Energy, Mines and Resources. The
results are shown i n figure 11. A s the drawing shows, the sea contains an
extensive layer of fresh water floating on the s a l t water. The thickness
of the freshwater layer varies depending on the occurrence of ice. Because
of the existence of fresh water, l i t t l e o r no accelerated corrosion should
resul t from the sea environment. Also the water can be u t i l i zed , i f
required, for construction.
T e s t Bore Results
About 44 boreholes were drilled to a depth of approximately 30 f t . except
one which was extended to approximately 100 f t . 34 of these were located
a t the TUK peninsula. The remaining 10 bore holes were made a t the TUK
Island. Soil samples retrieved from the test boring were analysed i n the
laboratory. The laboratory analysis included soil description, description
of subsurface ice, water content of s o i l and impure ice and grain size
analysis. The borehole locations and their logs are shown on drawing 12.
1 2
c
c
The analysis indicates that generally the subsurface shown by the boreholes
can be divided i n t o two zones. These are: (1) an active zone which is
frozen i n the winter and thaws out i n the summer and ( 2 ) a permanently
frozen zone below the active zone. The active zone consists of sands,
silts and gravel, i n places covered by peat or organic material. I n areas
where there is a cover of peat the thickness of the active zone as measured
was small, varying from 1 t o 2 feet. I n the inorganic soils, the
thicknesses of the active zones measured were relatively large. The
permanently frozen zone consists of layers of sands, s i l ts and gravel
together with ice crystals, lenses of ice and sheets of massive ice. The
thickness of the permafrost zone was not determined. It is, however, known
to straddle the sea level.
Figure 13 shows three coastal profiles of the TUK peninsula. The under-
water s o i l is similar to that of the land area. The depth to permafrost
and ice, however, increases rapidly w i t h the depth of water. I t was not
possible to extend the test boring to the submerged area. However, it
would be reasonably safe to assume that the ice layer disappears at
approximately the 6 f t . contour. The cover over the permafrost and i c e a t
the junction of the beach and land, and a t the beach, is relatively thin.
Subsurface Temperature Profiles
To determine the adequacy of the covering layer over the permafrost and ice
and t o investigate the vulnerability of the permafrost layer and ice
against thermal degradation and the resulting thaw settlement, a program
was undertaken to measure subsurface temperature profiles. Tho locations
were selected for the measurements. These were: (1) the school and ( 2 ) the
R.C.M.P. Garage areas. Four strings of thermistors were ins ta l led a t each
of the two locations, two a t the top of bank, one a t t he bank toe and the
fourth a t the waterline. Each string contained ten thermistors set a t
2 f t . spacing.

13
!the thermistor readings were taken a t in te rva ls over a period of one year
and are shown plotted on drawings 14 and 15.
Drawing 14 shows the thermistor readings of the R.C.M.P. Garage area. Generally, as may be expected, the ground surface temperatures varied over
a wide range fram rprgroxima~e.lp -2OOC i n the winter t o 5OC i n the
summer.
The temperatures a t a depth of approximately 20 f t . below the groundline
flucrtuated over a mu& mualler range fran approximately -10 i n May t o
3*C i n September. A t t he c l i f f area, t he ground was permanently frozen
below a depth of approximately 1 to 2 feet . The depth of the permafrost
t ab l e a t the beach varied. A t the waterline the depth of the permafrost was appmximately 7.5 f t . The ccnwr over the parmafrost t ab l e a t t he c l i f f
end of the beach m a thinner than that can be expscted.
0
The resul t of the thenuistor probes installed a t t h e school area, shown on
drawing 15, were similar to those of the probes of the R.C.M.P. Garage
area. The depths of the permafrost table ware 8 however, somewhat differ-
ent. The depth of the penaafroat table on the land side was approximately
5.5 f t . In the beach area, the penagfrost table was only 4 f t . fram the
g m d surface . Owing to non-availability of personnel, no readings were taken during the sumarertime and the above thermistor results do not cover the months of
June, Ju ly and August. As the temperatures during these months would be
higher, the depths of the peraurfraet table that can be expected would be greater than those indicated above. In addition, 1974 was a cold year and therefore the recorded permafrost Wet elevations can be expected to be
higher than those Uut can be axlg#rotsd to occur in an average or normil.
year.

14
6. Shore Erosion
General
Aerial photographs show that the Tuktoyaktuk shoreline has been receding a t
dramatic rates. A comparison of aer ia l photographs of 1950, 1969 and 1972
made for the study by off ic ia ls of the Department of Energy, Mines and
Resources is shown in drawing 16. Between 1950 and 1972, the coastline of
the settlement peninsula receded some 130 feet . A recession of similar
magnitude occurred a t t h e W K Island. The adjacent coastlines on ei ther
side of 'NK receded at s imilar ly high rates varying from 60 f t . t o 850 f t .
i n the same period of time.
There are two major causes of the erosion occurring a t WK. I n the warm
regions of the world the usual cause of erosion is the physical force of
the waves. I n the arct ics where ice r ich soils and massive ice w i t h i n the
so i l abound, thawing caused by the warmer temperatures i n the summer and
warmer sea water can be a major cause of shore recession and an accelerating factor i n shore erosion. Both of these phenomena appear t o
affect the Tuktoyaktuk coast.
Erosion by Wave Forces
The erosion of Tuktoyaktuk shores, attributable to the physical forces of
waves, can be seen to be taking place i n two d is t inc t ways depending upon
the shore topography. I n places where high c l i f f s exist, the c l i f fs are
degraded by undermining and removal of s l ices from them (see figure 1 7 ) .
I n areas where dunes occur, the dunes are shifted shoreward i n varying
alignments depending upon the direction of storms, (see figure 18). The
importance of these two shore erosion factors compared with the factors of
thermal erosion discussed i n the following section, cannot however be
precisely established.

15
The material removed from the c l i f f s and beaches a t TUK can be deposited
either i n the offshore areas or transported away alongshore, depending upon the size of material and wave induced and other currents. The bathymetry
of the Kugmallit Bay is highly irregular and it appears unlikely that any
large amount of s i l t a t ion is occurring there. A large majority of the
material removed f r o m the shores would therefore seem to be transported
away along the shores and deposited at obstructions occurring at the
shores. Various methods exist to estimate longshore transports. ' A
recently published method known as the wave energy flux method is used here
to evaluate the erosion caused by the physical forces of waves a t TUK.
Wave energy flux is t h e r a t e a t which wave energy is transmitted across a
plane of u n i t width perpendicular to the direction of wave advance. This
has been related to the longshore transport empirically w i t h data obtained
from several locations. The following transport rates were obtained for
the TUK coast using the wave energy flux method:
Southward 42,000 cu.yd. per annum
Northward 2,000 cu.yd. per annum
Net Southward 40,000 cu.yd. per annum
The above are adjusted quantities based on the ice free period of the year
applicable to TUK. The energy flux method has been related to transport
rates of sands. Since the beach material a t TUK contains gravel and as
greater energy is required to move gravel than is needed to move sand, the
above values may be viewed as the upper limits of sediment transport that
can occur a t Tuktoyaktuk.
The transport rates calculated above are comparatively very small and do
not reconcile with the large coastal recession rates of TUK given by the
aer ia l photographs.

16
Thermal Erosion
Thermal action is considered to be the major contributory cause of the
coastal recession occurring a t Tuktoyaktuk. There are two ways i n which
the thermal action is affecting the TUK coast. These are: (1) the melting
of the ice present i n the coastal land by warm water waves a t high storm water levels and (2) thawing of the permafrost and ice contained in the
beach and underwater so i l s , by the warm summer environment.
Figure 19 i l lustrates the effects of the warm water waves on the coastal
land a t Tuktoyaktuk. The massive ice and ice r ich so i l of the coastal land
straddle the sea water level and have l i t t le mater ia l to insulate them
against the thermal action by waves a t high water levels. As the waves
impinge on the coastal land the t h i n veneer of material that may be present
i s removed and the ice and permafrost are brought i n direct contact with
the warn sea water. Certain melting of the frozen water occurs and when
sufficient quantity of water has been removed the overburden loses the
support and collapses to form a new thin layer of insulation in place of
the preceding layer removed by wave action. This process of removal of
insulation by waves, thermal action on the ice and permafrost, collapse of
the overburden where this exists and the resulting encroachment of the sea
on the land affecting TUK is a recurring process depending on the
frequency, duration and magnitude of ~torms and the warm temperatures.
I n soils containing excess ice, a significant settlement can be expected to
take place upon thawing of the ice. I n the frozen state, the frozen soils
contain the solid soil particles, ice, i n certain cases super cooled but
unfrozen water and air . Upon thawing, the ice would be melted to water
which would drain out from the soil mass. The volme of the soil m a s s would be reduced accordingly and settlement would result.

17
The TUktOyaktuk s o i l mass not only contains excess ice but also massive
ice. Large settlements can, therefore, occur there upon thawing of the
ice.
The amount of settlement that occurs on thawing is dependent upon the i n
s i t u dry weight of the soi l and the f ina l void rat io , or porosi ty , af ter
completfon of thawing and consolidation. The i n s i t u dry weight of the
soil, before thawing has taken place, is t o a large extent governed by the
ra t io of ice content to the total volume. The f ina l void r a t io is dependent upon the type and grain size distribution of the so i l and the
overburden weight which is applied to the so i l mass. The amount of
settlement that can be expected a f t e r thawing has occurred C M be estimated
by the following expression which gives excess ice content as a r a t io of
the volume of excess ice to the original volume of so i l mass including
access ice.
where
Ex = Volume of excess ice divided by the original volume of frozen soil mass including excess ice.
W = Ratio of the weight of moisture remaining a f t e r thawing and drainage of excess moisture have taken place to the weight of the dry solids i n t he so i l mass.
'i = Ratio of the weight of the original mass of moisture contained i n the soil as frozen or unfrozen water and excess ice to the weight of the dry solids i n the soi l mass.
G a Specific gravity of the solids i n the s o i l m a s s usual ly assumed t o be 2.7.
- The factor 1.09 appearing i n the expression is the value by which the volume of ice is greater than the volume of water obtained by melting the ice. To obtain
the settlement of a frozen soil stratum, E is simply multiplied by the
thickness of the stratum. - X

18
Figures 20 and 21 show thaw settlements that can be expected at the locations
of certain bore holes a t the TUK settlement peninsula and the island, usng the
above expression. The ordinates show the depth from the ground level. The
abscissae give the settlement. For example, using Bore Hole 11 data, should
thawing occur to a depth of 1 2 feet , a settlement of approximately 7 f t . would
result at that location. Generally, the diagrams show the occurrence of excess
ice to be close to the ground surface. The cover layer w i t h excess ice varies
f r o m 2 fee t to 16 feet. Where the cover layer is small, considerable
settlement can be expected depending upon the penetration of thaw.
The depth to which t h a w can penetrate depends upon the magnitude and occurrence
of above freezing temperatures and thennal conductivity of 'the covering layer
above the soil mass containing the excess ice. There are many methods
available to calculate penetration of t h a w .
One method which is based on a degree-day concept and widely used, particularly
for approximate calculations, is utilized here to estimate the depth t o which
t h a w can penetrate a t TUK. The following formula is used to calculate the
depth of penetration of thaw:
x = a. TI
Where ,
X == Thaw depth in feet A Non dimensional coefficient (0.75 for TtX)
k ,= Thennal conductivity of material in BTU/ft. hour OF
yd Dry density of material in Ibs/cft
Ls = Latent heat of fusion of water i n BTU/lb (144 BTU/lb)
W Percent moisture content
TI = Thawing index or degree days above freezing.

19
c
Using average values of X = 0.75, k = 1.6, T I = 1,500, yd = 125,
W = 10 and Ls = 144 the depth to which thaw can be expected to
penetrate a t Tuktoyaktuk, in an average year, is 6 feet . I n a cold year
this depth would be smaller.
Conversely i n a warm year, the depth of thaw penetration would be greater.
Because of good insulating characteristics of peat moss, where th i s
material exists as a cover layer, the thaw penetration would be smaller.
In the beach areas of W K which consist of sand and gravel, thaw can
penetrate more easily and its depth of penetration could be greater.
The TUK beach areas have a thinner cover layer over the permafrost and ice
table than required for its stabil i ty. Thawing of permafrost and ice can
therefore be expected to occur i n the beach areas and because of excess ice
content, thaw settlement can be expected to take place.
As the beach is depressed by thaw settlement, the height of water over it
i n storm conditions would be greater. Because of the greater height of
water, t h e permafrost and ice table would be depressed further, causing
additional thaw settlement. The new depth of water a t t he beach would
provide access to larger waves and erosion of the coast would be
intensified.
Summary of Shore Erosion
Historical data shm that the shoreline erosion occurring at TUK has been
going on for a long time. The information also shows that the erosion
occurring a t Tuktoyaktuk is not limited to the usual erosion encountered i n the warmer environment, where the physical force of waves is the main
factor causing erosion. Considerable areas of the immediate subsurface of
Tuktoyaktuk, and, of many of the Arctic coasts, contain ice and ice r ich
so i l s and the above freezing temperatures of t h e s m e r environment coupled
with storm action render the 'NK coast l iable to thermal action of waves
and the warm summer environment.

20
A generalized review of t he l i t t o ra l , morphological and thermal processes
present a t Tuktoyaktuk is shown on drawing 22. The drawing shows a cross-
sectional view of the TUK peninsula an8 the various processes influencing
the peninsula and the adjoining areas of the peninsula. Because of pre-
poaduence of w8vm1 t he north, the TWK coasts are subject to l i t t o r a l
trm.port from ths nom t o south. As t he drawing shows, the subsurface of TUK contains ice and permafrost. The ice and permafrost layer straddle the
sea level. The thickness of the insulating cover occurring over the ice
and ice rich s t ra ta is not adequate to protect them from solar heat and
wave action and as a result, thawing and undermining of c l i f f s by warm
water waves also occur, together w i t h the depletion of l i t t o r a l by the
physical forces of wavw and currents. An analysis suggeeta the l i t t o r a l
transport to be gurll. The main cuu8es of erosion occurring a t Tv# are
conaidered t o be rlrlated to the inetability of the T~JK coasts againat
thamml action.
S h o r t term ra te s a t which the TUK aoaetline is receung are relatively
high, Between 1969 and 1972 stme parts of the TUII. coasts receded as much
as 60 feet. The long term erosion rates are, however, mnaller, indicating
that much of the erosion occurring at TUK takes glace during etora conditions.

c
21
7. Protection Works
13
There are no precedents of shore protection works i n the arct ic environ-
ment. Because of t h i s and the costs of f u l l scale protection works, the
design adopted must be fully tested prior to i t s application on a large
scale. The decision to proceed on a full scale with any design w i l l also
depend upon the cost benefit assessment of providing the protection.
Design Constraints
A primary requirement of the design is that it be of f lexible type,
structurally. Aside from t h i s , Tuktoyaktuk imposes several unusual conditions on the design. The first factor requiring careful consideration
is the nature of erosion occurring a t Tuktoyaktuk. Secondly, construction
materials, construction expertise and equipment available at Wtoyaktuk
call for careful assessment. Another parameter that requires attention i n the design is the location of Tuktoyaktuk with relation to sources of men,
materials and equipment. I n addition, the design must take into consid-
eration the length of construction season occurring a t Tuktoyaktuk.
As discussed i n the preceding section, the erosion occurring a t Tuktoyaktuk
is mainly as a result of an inadequate cover over the ice and permafrost
present i n the ground at the si te. Direct solar heat and thermal action of
warm water waves are the main agents that cause the erosion a t Tuktoyaktuk.
During normal weather conditions the water levels are low and the waves do
not impinge upon the coast. I n storm weather situations, high water levels
occur and the beach and the coastal areas are rendered liable t o direct
thermal action of warm water and thermal and physical action of waves. To
protect the beach and the coast from the thermal action, an insulating
cover is required over the area. To abate the wave action a barrier is
needed. The insulating cover and the barrier must be of f lexible type to
acconmodate any initial and long term settlement.

22
LI
Construction materials available locally are confined t o sand and gravel.
T b materials occur in offshore regions, along the coast and inland. The
locations of the offshore sources have not been surveyed. The vary l i t t l e
information available indicates there may be patches of offshore areas
containing the required quality of sand. A detailed survey is required to conffrnr the qualitry and quantity o f sand available i n the offshore areas. A detailed inventory is available of the sources of granular matsrials occurring along the coast and inland regions, made for the Department of
Indian Affairs and mrthern Developaent. Because of the threat of accelerated erosion, the removal of materials from the coastal areas is not
recamenUed. The izxventory lists several inlanu sources for the materials. The nearest source listed i n the inventory is a gentle knoll about 600 feet
by 300 feet and 25 fee t high, approximately 3.5 miles southeast of
Tuktoyaktuk. The murce is estimated t o contain approximately 100,000
cubic yards of sand and gravel. The farthest source for sand and gravel
given i n the inventory is a Kame field located on the northwest &ore of
Eskimo Lakes, about 1 7 miles southeast of Tuktoyaktuk. Approximcrtdly 1.5
million cubic yards of sand and gravel are estimated to e x i s t a t this source . While there is an abundance of sand an8 gravel wi th in short distances fram
Tuktoyaktuk there are no sitem in the vicinity of the area for any rock. Expsrienced contractors and heavy construction equipaent similarly do not
exis t i n the area.
To obtain the required materials other than sand and gravel, construction
services and equiplnsnt, one nee88 to look t o w a r d a Inuvik and areas as far as Bdmonton. The logietics are further complicated by the inaccessibility
of Tuktoyaktuk by land. Beoause of this, a l l the requisites must be either
trassported by watcmr or flown by air.

23
The timing of transporting men, materials and equipment t o Tuktoyaktuk and
implementing the work is of considerable essence as f a r as any work i n
Tuktoyaktuk area is concerned, for the construction season occurring in the
region is relatively very short. In warm years, construction can be car-
ried out for three to three and a half months. In cold years, the working
period may only las t a few weeks and a small delay can mean postponement of
work unt i l the following year.
Alternative Designs
Basically, the designs tha t can be formulated for Tuktoyaktuk, taking into
account the conditions discussed above, can be classified as experimental
or conventional.
There are two experimental solutions that appear to promise success i n
protecting the Tuktoyaktuk coast. These are: (1) Longard Tube System and
(2) 2-Wall System.
The Longard system consists of placing of flexible, sand f i l led synthet ic
f ibre tubes as seawalls and groins i n varying patterns. The tubes are made
i n several standard sizes. The tubes more comonly used a re about 40" i n
diameter and approximately 330 feet i n length. Before f i l l i ng , the tubes
are f i r s t r o l l e d o u t i n place and pumped fu l l o f water to expel air . One
end of the tube is then connected t o a sand hopper equipped w i t h a sand/
water injector. The sand slurry is forced into the tube a t high velocity. The sand settles in t he tube. The water injected with the sand flows out
through a relief valve a t the opposite end of the tube.
The main attractions of the Longard System are its apparent simplicity
and its low costs, The system has not been t r i e d in the Arctic
environment. A test program was therefore devised for installation a t
Tuktoyaktuk i n 1975. Owing to cer ta in d i f f icu l t ies , the program was
deferred to the summer of 1976.

24
The plan devised t o test the Longard System i n the Tuktoyaktuk environment
is shown on drawings 23 and 24. The plan essentially consists of two lines
of defence walls and a system of groins. The areas enclosed by the walls
and groins w i l l be f i l l e d with sand to provide the required insulating
layer over the beach. The seaward l i ne of defence is located a t the water-
line. The main function of this l ine of defence w i l l be to break the storm waves impinging upon the coast at storm water levels. This defence l ine
w i l l also act as a retaining wall for f i l l t o be placed i n between the
walls and groins. The upshore defence l ine w i l l be a double tube w i t h f i l l
behind the line. This upshore l ine of defence is located a t the c l i f f toe
and will provide protection to the cliffs. The seaward l ine of defence and
the groins projecting into the water w i l l be subject to ice action and
should they prove to be successful the upshore defence line w i l l be elimin-
ated i n the final design.
A concept of the final design using the Inngard System is s h m on drawings
25 to 30. Drawing 25 shows the protection on plan. The design essentially
consists of a line of defence close to the waterline and a system of groins
projecting i n t o the water to approximately -3 elevation. Drawings 26 to 30
show cross-sections of the design of representative areas along the coast
to be protected. As the drawings show, the defence line parallel to the
coast is located a t approximately +2 elevation. It consists of twin
Longard tubes. The lower tube w i l l be placed on gravel t o f ac i l i t a t e
drainage. The area between the tubes and the coast w i l l be f i l l e d with
granular material to provide an insulating layer over the beach required to
protect it against thaw settlement and to absorb waves to s top them from
attacking the coast. The seaward areas enclosed by the groins w i l l also be
similarly f i l led to provide protection to the underwater areas against thaw
settlement.

25
Draaings 31 t o 38 show an alternative design using a recently developed "2"
wall system. The ''Z" wall system consists of embedment of "2" shaped pre-
cast reinforced concrete panels along the coast. The plan followed i n the
drawings is similar to that shown for the Inngard System. The upshore area
w i l l be f i l l e d with granular material to provide protection to the beach
and the coast. Groins have been provided to protect the underwater area of
down to -3 elevation, Weep holes w i l l be provided in the "2" walls to
permit drainage of water. The design is essentially the same as that of
the Longard System except that the Inngard tubes are replaced by 2 wall
panels for the seawall and a system of H piles and timber planks as groins
i n place of the Iongard tube groins.
The two alternative designs discussed above using the Longard System as
alternative 1 and the "2" wall system as alternative 2 are experimental
designs. Drawings 39 to 4 4 show a conventional design using rubble stone
as alternative 3. The cross sectional profile of the rubble stone wall
very much depends upon method that may be adopted t o f i l l the upshore area.
If the f i l l is to be imported f r o m inland, only the seaward face of the
mound would require armour stone. Should offshore sources be developed for
the f i l l , both faces of the mound would need protection w i t h armour stone.
The drawings 34 to 44 have been prepared assuming the f i l l required to
protect the beach and the coast w i l l be obtained from offshore sources by
dredging and pumping the mater ia l to the f i l l s i te . The location of the
rubble mound l ine has been selected to eliminate the need for groins.
The above shore protection proposals do not cover protection works for the
TUK Island. The island is v i ta l to the harbour as a breakwater and in time
the island would also need protecting.

c
c
c
26
8. COST ESTIMATES
Alternative 1 - Longard System
1. S i t e Preparation 2. frongard Tubes 3 . F i l t e r Cloth 4. F i l l
5. Unforeseen 10% 6. Engineering and Inspection
Total Say $2,100,000 (1976$)
$ 50,000 427,000 30,000
1,365,000 $1,872,000
187,200 19,000
$2,078,200

3
27
Altarnative 2 - Y ? i t g wall System
1. Site Preparation 2. H Piles, Nuts, Bolts and Plates 3 . Timber 4. Concrete "2" Panels 5. F i l l
6. Unforeseen 10% 7 . Engineering and Inspection
Total Say $2,350,000 (1976$)
$ 22,000 103,710 110,500 485,100
$2,086,310 1,365,000
208,631 19,000
$2,313,941
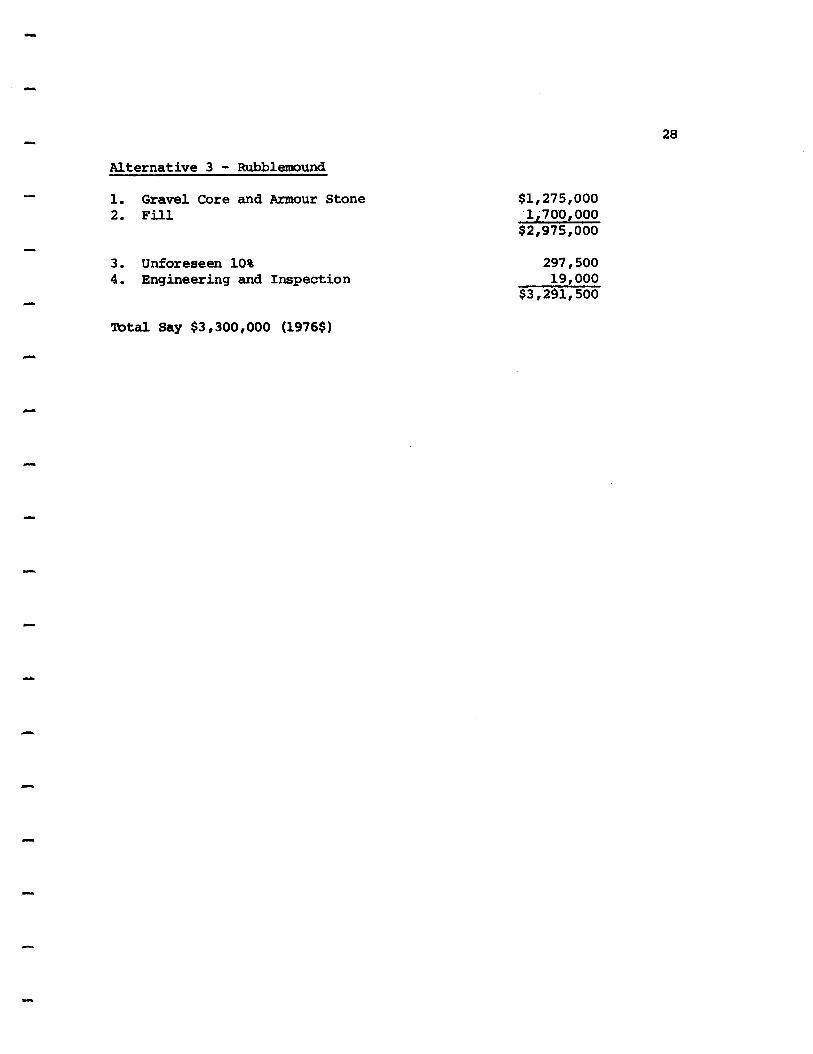
Alternative 3 - Rubblemound
1. Gravel Core and Armour Stone 2. F i l l
3 . Unforeseen 10% 4. Engineering and Inspection
Total Say $3,300,000 (1976$)
28
$1,275,000 1,700,000
$2,975,000
297,500 19,000
$3 ,‘291,500

29
9. RECOMMENDATIONS
Subject to sociological-economic and environmental considerations by others ,
our f i r s t p reference is for Alternative I - Longard System - a t an cstimatcd
cost of $2,100,000 (1976) should the emergency tes t sect ion a t the school
prove r e l i ab le up t o October 1977
I f problems develop i n t h i s tes t section our second preference would be
Alternative 2 - "Z" Wall System - a t a n estimated cost of $2,350,000 (1976) .
I t is recommended t h a t t h e whole of the settlement peninsula be protected
under one pro jec t as opposed to protecting each building or length of
shoreline individually under separate projects .
We a l so recommend that for f inancial p lanning forecast ing for the project a
cost estimate of $2,350,000 (1976) be used.
Should the shore protection work receive approval as recommended, it is
recommended t h a t it be coordinated w i t h the Town Planning Group of the
Municipal Government which is examining the possibility of using dredge
spoil from within the harbour to build up indus t r ia l and housing area,
subject to t h e s u i t a b i l i t y of the dredge spoil a s f i l l r e q u i r e d i n the
protection work.
No protection work is recommended f o r Tuktoyaktuk I s l a n d a t t h i s p o i n t i n
time.
It is fur ther recommended t h a t a program be set up t o monitor the
Tuktoyaktuk shorelines on a regular basis , preferably each Spring and Fa l l .

F
F.
c
100 50 0 100 200 300 400 500 r - v 1 I 3 1
SCALE I: 15,840,000 or 1in.s 250 mile8
TUKTOYAKTUK N. W. T. SHORE EROSION B PROTECTION STUDY LOCATION MAP
Figure - I

TUKTOTAKTUU N.W. T. SmME EROSKW PROTECTION STUDY SITE PLAN
Figurn - 2

P
7
P
c
c
JAN FEE MAR APRIL MAY JUNE JULY AUG SEPT OCT Nov DEC
8 HOUGS DAYLIGHT
NOTE: THE TIMES SHOWN FOR THE BEGINNING L END OF TWILIGHT ARE CIVIL, FOR WHICH
( IN GOOD CONDITIONS6 IN THE ABSENCE OF OTHER ILLUMINATION) I S SUCH T H A T T H E SUN'S ZENITH DISTANCE I S 9 6 O . THE DEGREE OF ILLUMINATION AT THIS TIME
THE BRIGHTEST STARS ARE VISIBLE 6 THE HORIZON I S CLEARLY DEFINED.
TYPICAL DAY-NIGHT REGIME( LAT. 69'30'N)
TUKTOYAKTUK N. W.T. SHORE EROSION 8 PROTECTION STUDY TYPICAL DAY-NIGHT REGIME
FIGURE 3 A

c
c
c
c
P
A
P
r".
c
c
c
n
c
rn W X 0
- e I -
I - r
MEAN DAYS RAIN 8, SNOW PER MONTH HERSCHEL ISLAND
+
L
SEPT
CUMULATIVE RAINFALL, SNOWFALL 8, PRECIPITATION HERSCHEL ISLAND
TUKTOYAKTUK N. W . T . SHORE EROSION 81 PROTECTION STUDY
TY PlCAL PRECIPITATION GRAPHS FIGURE 3 B

n
I
c
L
c
F
n
100
80
60
40
32
20
0
- 20
-40
1 I I I I I I 1 1 i I I I I I I I I I I
JAN FEB MAR APR MAY JUNE JULY AUG SEPT OCT NOV DEC
I -60
T.UKTOYAKTUK N. W . T. SHORE EROSION 8 PROTECTION STUDY
TEMPERATURE PROFILE 7 3 E C O R D S
FIGURE 3C

SACHS HARBOUR WIND CLIMATE
NOTE: THE R A O I A l SCALE IS LOGARITHMIC GIVING THE PER- CENTAGE OF TIME THE WIND SPEED IN KNOTS IS EQUAL TO OR GREATER THAN THE VALUES I NDI CITED.
S
N
INUVIK 8 AKLAVIK WIND CLIMATE
T U K t O I I K TUK W. W. 1. SmMt LROSON ?ROfECTlON STUDY WINO CLIMATE
Figure 4 A

W
s EXTREME WIND SPEEDS
0 4 8 12 16 20 24
DURATION WIND SEED RATIOS
SACHS HARBOUR - EXTREME WINDS
TUKTOYAKTUK N. W. T. s n m LRO- WO~ECTWN muor EXTREME WtNDS
Figuro 4 B

% 70
60
50
40
30
20
IO
0 -r
WAVE PERIODS ( winds N, NW 81 NE)
0 2 4 6 8 H WAVE HEIGHT FT.
3 IO
TUKTOYAKTUK - WAVE HEIGHTS (after refraction) a WAVE PERIOD
TUKTOYAKTUK N. W. T. SHORE LROSION a PROTECTION STUDY WAVE CLIMATE
Figure 5

ELEV. ABOVE CHART DATUM FT. WAVE HEIGHT FT. - p + c u o a p ~ + ~ o 0, m )c CD n + *) U " - - 0
r
TUKTOYAKTUK N. W. T. SHORE EROSION I PROTECTION STUDY WAVE CLIMATE
Figura 6

N I Reduced Variate y
0 - w
TUKTOYAKTUK - EXTREME STORM WATER LEVELS - APPROXIMATE RETURN PERIODS
TUKTOYAKTUK N. W. 1. W O R E EROSION 8 PROTECTION STUDY WATER LEVELS
Figure 7

Velocity Record Currept Meter Location #!1 1105/17/08/74 to 1605/18/08/74
~ ~~ .
0 0
'1 4 r
"1
0 .oo I .OD 2 .oo
D R Y S
TUKTOYAKTUK N . W. T. SHORE EROSION 8 PROTECTION STUDY CURRENT VELOCITY IN KNOTS
Figure 8

0 0
-1
V e l o c i t y Record C u r r e n t Meter Locat ion :I2 0 7 4 5 / 2 0 / 0 8 / 7 4 t o 073G/23/0d/ ’74
TUKTOYAKTOK N. W. 1. SHORE EROSION I PROTECTION STUDY CURRENT VELOCITY IN KNOTS
Figure 9

U ap U
S P E E D 0 - 5 0 0 .-I5 I." 1 1
I . c o
YUKTO?AKTUK N. W. 1. SHORE EROSION I PROTECTIQN STUDY CURRENT VELOCITY IN KNOTS
Figure IO

0 Surface
5" I 4. Fresh Water -\ S=0.4% to 4% I
2ol 1 Sea Water
1 S = 2 6 % to 30%
25 ' 1 1 1 1 l . r , l r , l l , l , r
1 1 I L I . 1 1 1
Jan Feb Mar Apr M a y Jun Jul Aug Sep Oct Nav Doc
WESTERN ENTRANCE
- Surface
5"
IO"
15"
20 - -
I . I ,
1 . I 1 25 ' 1 , I , , I
' I 1 1 I .
Jon Fob Mar Apr M a y Jun Jul Aug Sep Oct Nov Dec
OUTSIDE HARBOUR (North of TUKTOYAKTUK Isl.)
0
5
IO
c = I 5 0 0
20
25
0
5
IO
c LL
f 0 I S 0 a
20
25
T 1 Fresh Water
Sea Water
'Jan 'Feb 'Ma 'Apr 'May 'Jun 'JJ 'Aug 'Sep 'Oct 'Nov 'Dec '
EASTERN ENTRANCE
Surface
T
1
1 1 1 1 I I 1 i 1 1 I 1 1 1
'Jan keb 'Mar 'Apr 'May'Jun '&I 'Aug 'S IP 'Oct Nov 'Doc'
HARBOUR BASIN
TWTOYAKTUK N. W. T. SHORE EROSION a PROTECTION STUDY
SEASONAL VARIATION of FRESH WATER LAYERS at TUKTOYAKTUK
Figure - I I

.

1 Bh-4BA
10 _" " _."- - - _" - - "
Scale 1"- 1 0 0 ' h o r l z 1" = 20' vert
rn S c h o o l PROFILE OF C O A S T L I H AT SCHOOL
n Garage
PROFILE OF COASTLIIIE AT R C M P . GARAGE
TUKTOYAKTUK N W T WORE EROSION 8 PROTECTION STUDY
COASTAL PROFILES F q u r r - 13


SHORE CLIFF EROSION -----~---< -7
MWL 3 ,/ / #
( i i) BEACH PRISM SCATTERED
BEACH PRISM RESTORED AT NEW LOCATION B S W E L L WAVES
MWL 9
"
BOTTOM EROSION
( i i3 DIAGRAMATIC REPRESENTATION OF BEACH A N D SHORE CLIFF EROSION PROCESS
TUKTOYAKTUK N. W. T SHORE EROSION a PROTECTION STUDY
MECHANICS OF EROSION Figure 17

WAVE TRANSPORTING EQUILIBRIUM PROFILE POWER AT MWL /3 /LINE AT MWL
WAVE TRANSPORT1 POWER. AT STORM
OF BARIER BEACH
WAVE TRANSPORTING BARIER BEACH POWER AT MWL 7 MIGRATION2
/O;RIGINAL LOCATION y, .n I
/ --~Z/ / * *
OF BARIER BEACH&. M W L ~ . ,I- / //\
- - 0- LOCATION OF BARIE6 BEACH AFTER STORM
DIAGRAMATIC REPRESENTATION OF BEACH AND SHORE CLIFF EROSION PROCESS
TUKTOYAKTUK N. W. T. SHORE EROSION 8 PROTECTION STUOY
MECHANICS OF EROSION Figure 18

VEGETATION
SLUMP MATERIAL TILL V
- """_ -
=REGAY I CE
r"- "T-
MWL
FACE OF CLIFF BREAKING AWAY AND SLUMPING
( i 1
( i i )
( i i i).
ORIGINAL PROFILE ?; NEW 7 FROZEN -
A / PROFILE TILL BEACH PRISM
""
TUKTOYAKTUK N . W. T. SHORE EROSION 8 PROTECTION STUDY
MECHANICS OF EROSION Figure 19


c
c
L.
c
c
i -
L.
C
c
CI
c
I OF BOUNDRlES " " I \
I
LITTORAL ACTIVITY LOW OR MONE WVE EROSION e SOME SEDILTNT DEPOSITION LONOYK)RE D W T
I TnW e CONSOLIDATION P M S S I V L THAW e ! HEAT LOSS a GAIN AFFECTED -
SETTLEMENT COMPLETED COWSOUCYTION SETTLEMENT 1 BY SURFACE DEVELOPMENT I I ! I 1 T ~ A W a CONSOLIDATION
I
~
I COMPLETED ,
I ! I 1 !hVERAM ANNUAL AIR. TEMP - I0.C AVERAGE ANNUAL GROUND TEMP - a+ c
1 ' -
I I
WINTER (ICE1 0. t k & C -.BOTTOM T MF'
1 ACTIVE I SHORE CLIFF 1
I j ACTIVE \, ! ACTIVE
I e t w - \ i
ARE INFLUENCED BY WATER DEPTH. ALL TEMPERATURES ARE APPROX ONLY
DIAGRAM N g T TO SCALE
TUKTOYAKTUK N.WT. - G E N E R A L J a ZONES o f LITTORAL, MORPHOLOGICAL__-d " T HER M-A L ~ PROCE s SES
~ " - FIGURE No. 2 2

TUKTOYAKTUK N. W. T . SHORE EROSION e PROTECTION STUDY
LONGARD TUBES
TEST PROTECTION WORK
Layout Plan
Figure - 23

2'-0'' MIN. 4 2'-6" M A X , FILL WITH GRAVEL \12"xdt FOLD POCKET
SEE SECTION A-A SECTION B-B SCALE: 3/16"= 1"O"
I-DURABAG at 10' C/C I-DURABAG at IO' C/C
LONGARD FILTER MAT LONGARD FILTER MAT
WITH SAND TUBE WITH SAND TUBE
- FILLED LONGARD TUBE
LAY TUBE TO FOLLOW NATURAL BEACH GRADE
SECTION C-C SCALE: 3/16". I' -0"
TUKTOYAKTUK N. W. T . SHORE EROSION a PROTECTION STUDY
LONGARD TUBES
TEST PROTECTION WORK
S ect ions
Figure - 24