Embed Size (px)
Citation preview

20 21
The Impacts of Affordable Housing: A Literature Review
Taylor Calabrese, Student Research Assistant Andrea Beadles, Weber Housing Authority Executive Director Dr. Katharine French-Fuller, Director of Community Research
Weber State UniversityCenter for Community Engaged Learning Community Research Extension 2955 Harrison Blvd., Ste. 100Ogden, UT 84403
801-626-7879weber.edu/[email protected]

Table of Contents
01 | Acknowledgements………………………………………………..……...…3
02 | Executive Summary……………………………..……………………………4
03 | Introduction………………………………………………..…………………….7
04 | Background………………………………………………..……………………..7
Public Housing………………………………………..…………………….8
Housing Choice Vouchers…………………………..………………….9
Low-Income Housing Tax Credit……………………………..……..10
Additional Options………………………..……………………..………..12
05 | The History of Public Housing……………………………..……………..13
06 | Public Perception…………………..…………………………..………………15
07 | The Need for Affordable Housing……………………………….….…..18
Growth and Availability………………………….……………………...18
Home and Rental Prices…………………………………………….…..18
Transportation Costs……………………………………………………..20
Legacy of Racial Segregation ………………………..……………….20
Poverty and Social Impacts ……………………………………….……22
08 | Affordable Housing Outcomes …………………………………………..23
Property Values ………………………………………………………….…24
Crime …………………………………………………………………………….27
Social Impacts ….……………………………………………………………30
09 | Policies and Practices ………………………………………………………..32
Local Policies and Practices ………………………………………….32
National Policies and Practices …………………………………....35
Recommendations …..……………………………………………….…35
10 | Conclusion………………………………………………………………..……….38
11 | References ………………………………………………………………………..39
TABL
E O
F CO
NTE
NTS

AcknowledgementsThe Center for Community Engaged Learning – Community Research Extension at Weber State
University wants to extend our gratitude to Community Research Fellow Dr. Jenny Gnagey, Weber
Housing Authority Executive Director Andrea Beadles, Director of Community Research Katharine
French-Fuller, and Data and Community Research Coordinator Yesenia Quintana for their
contributions to this report. We also want to thank Ogden Civic Action Network (OgdenCAN) for
commissioning the project.
Suggested citation: Calabrese, T., Beadles, A., & French-Fuller, K. (2021). The Impacts of Affordable
Housing: A Literature Review. Center for Community Engaged Learning – Community Research
Extension.
3

Executive Summary
As of July 2021, there is an urgent demand for affordable housing in Utah’s cities. The
sales prices of homes and the prices of rent have dramatically increased over only a few
years. As a result, around one-fourth of Utah homeowners and almost half of Utah renters
are considered cost-burdened (U.S. Census Bureau, 2019a; U.S. Census Bureau,
2019b). The shortage of units also contributes to this housing crisis and means that more
Utahns are housing unstable. Researchers estimate there is a 30% deficit between
available units and needed units (Wood et al., 2020). Housing instability can contribute
to a large number of problems for individuals, such as worsened physical and mental
health, developmental delays in children, and homelessness (Chetty et al., 2016; Chyn,
2018; Desmond, 2012; Ludwig et al., 2005; Medina et al., 2020; Warren & Font, 2015).
Affordable housing is a solution that addresses this instability.
Multiple studies have analyzed the outcomes of affordable housing developments. The
three main types of affordable housing programs that researchers have studied are public
housing, Housing Choice Vouchers (HCV), and the Low-Income Housing Tax Credit
(LIHTC). In total, these three federal programs assist millions of families and individuals
with housing in the United States (Diamond & McQuade, 2019; Fischer et al., 2021; U.S.
Department of Housing and Urban Development, n.d.-b.). Each of these programs
reduces housing costs and requires a certain percentage of its units or vouchers to be
designated for very-low income households.
There are some misconceptions about how affordable housing affects surrounding
neighborhoods. Neighbors who live near prospective sites of affordable housing
developments tend to fear the developments will decrease property values, increase
crime rates, worsen traffic, or produce other negative, sweeping effects (Dillman et al.,
2017; Einstein et al., 2018; Ellen et al., 2012; Tighe, 2012). However, a majority of
empirical literature shows that each of these claims are disputable. In fact, most studies
show that affordable housing has either no effect or positive effects on property values
and crime rates, though these observations can vary by neighborhood (Ahrentzen, 2008;
Albright et al., 2013; Baum-Snow & Marion, 2009; Diamond & McQuade, 2019; Dillman
et al., 2017; Ellen et al., 2012; Freedman & Owens, 2011; Griffiths & Tita, 2009). These
results were consistent for public housing, HCVs, and LIHTC developments.
4

Four studies of high-poverty neighborhoods have shown that affordable housing tends to
increase property values (Baum-Snow & Marion, 2009; Diamond & McQuade, 2019; Dillman
et al., 2017; Ellen et al., 2007). For example, one study found that neighborhood values
increased by 6.5% after a LIHTC development was built nearby (Diamond & McQuade,
2019). Some studies have also observed the effects on values in low-poverty or moderate-
poverty areas. Three of these found no effect on values (Albright et al., 2013; Baum-Snow &
Marion, 2009; Dillman et al., 2017), while one found a decrease of 2.5% in values (Diamond
& McQuade, 2019). Researchers stated that some important factors that may contribute to
positive effects on property values are the property’s architecture or increases in income
diversification (Diamond & McQuade, 2019; Dillman et al., 2017; Eskic, 2021; Housing and
Neighborhood Development & The Redevelopment Agency, 2019).
Some also fear that the addition of affordable housing developments will increase crime.
However, multiple studies have found that developments tend to be placed in areas where
crime is already high (Ellen et al., 2012; Schill & Wachter, 1995; Woo & Joh, 2015). This
explains their association but does not establish causation. Three studies found that
affordable housing developments actually had a mitigating effect on crime in high-poverty
neighborhoods (Diamond & McQuade, 2019; Freedman & Owens, 2011; Woo & Joh, 2015).
Freedman and Owens (2011) found that for every increase of one LIHTC development in a
high-poverty area, aggravated assaults decreased by 1.8%. Few studies explicitly focus on
crime in low-poverty and moderate-poverty neighborhoods, but two found no significant
effects (Albright et al., 2013; Diamond & McQuade, 2019). A study on voucher households
and a study on public housing also found that affordable housing did not increase crime in
surrounding neighborhoods, but neither of these specified the characteristics of the
neighborhoods they observed (Ellen et al., 2012; Griffiths & Tita, 2009). Researchers posit
that a few factors contributed to the observed beneficial effects. They hypothesized that
crime rates decreased or remained neutral when developments used efficient management
and security measures, and when developers rehabilitated run-down neighborhoods
(Albright et al., 2013; Dillman et al., 2017; Tillyer & Walter, 2019; Woo & Joh, 2015).
Additionally, providing stable housing for those in need can drastically improve their social
outcomes. In examining social outcomes, several studies analyzed how HCVs improved
individuals’ and families’ lives (Carlson et al., 2012; Chetty et al., 2016; Chyn, 2018; Gubits
et al., 2016; Kim & Garcia, 2019; Leech, 2013; Ludwig et al., 2005; Nguyen et al., 2017).
These studies revealed that voucher subsidies have reduced the number of families on
welfare, reduced a family’s likelihood of returning to a homeless shelter, reduced rates of
domestic violence, and more (Carlson et al., 2012; Gubtis et al., 2016; Kim & Garcia, 2019;
Ludwig et al., 2005). HCV children were also less likely to use drugs, drop out of high school,
or participate in crime (Chetty et al., 2016; Chyn, 2018; Gubtis et al., 2016; Leech, 2013).
5

To achieve these outcomes and improve the affordability of housing, Ogden and many
other Utah cities have followed numerous best practices. One of the most important
practices these cities have followed was utilizing flexible zoning. Flexible zoning is vital for
affordable housing because it allows high density housing to be built, which in turn
improves the stock of units while maintaining affordability (Eskic, 2021; Freemark, 2020;
Kiani et al., 2020; Tighe, 2012; Wood et al., 2020). Other common practices these cities
followed were creating housing plans, incorporating accessory dwelling unit ordinances,
and using tax increment financing (Kiani et al., 2020; Wood et al., 2020). Cities outside
of Utah have also rehabilitated run-down lots and turned them into housing projects
(Wood et al., 2020), which the city of Ogden may also participate in during the next few
years (Shaw, 2021).
Researchers and developers have produced guides that provide recommendations to
those interested in creating or maintaining affordable housing. In a guide directed
towards developers in Utah, the SLC Housing and Neighborhood Development and the
SLC Redevelopment Agency (2019) outlined some general steps they could follow to build
affordable housing. These steps included identifying a target population, assessing zoning
codes and available funding, applying for the proper permits, and monitoring property
management once construction is complete. In a separate guide, housing experts from
around the world provided critical success factors that policymakers and other state
leaders could use to enhance affordable housing. A few of the critical factors the experts
agreed upon were political commitment to affordable housing, incentives for developers,
accessibility to amenities, and transparency (Adabre & Chan, 2019). Fortunately, a
variety of available options for affordable housing can address the high demand and
produce effective outcomes.
6

Table 1. Federal Programs
Program Year Created Department Subsidy Type
Public Housing 1937 HUDSubsidized housing units created by HUD, operated by local housing authorities
Housing Choice Vouchers or Project-Based Section 8
1974 HUD
Tenant-based: Subsidy that a family can take with them to any unit they want Project-based: Subsidy given directly to private landlord
Low-Income Housing Tax Credit (LIHTC)
1986 IRS Tax credit given to developers
Introduction
The nation and, in particular, the state of Utah face an affordable housing crisis. The common
definition for affordable housing is a housing payment that requires no more than 30% of the resident’s
income (Center for Neighborhood Technology [CNT], 2017; Office of Policy Development and Research
[PD&R], 2020). Housing prices are increasing at rapid rates while wages lag behind, and the availability
of units continues to decrease. Although some citizens are publicly opposed to new affordable housing
units near their community, research has shown such units can reduce crime, increase property values,
and have positive social impacts on thousands of families. There are numerous examples of effective
affordable housing policies and practices in Ogden and Utah, as well as examples and recommendations
from other programs that can be used to improve them further.
Background
The federal government and the state of Utah fund affordable housing projects through several
programs. The literature mainly focuses on three types of federal programs: public housing, Housing
Choice Vouchers, and the Low-Income Housing Tax Credit. Researchers study these programs most
frequently because they are the primary sources of funding for affordable housing developments in the
United States (Congressional Research Service [CRS], 2021; Dillman et al., 2017; Kiani et al., 2020;
PD&R, 2020; Tillyer & Walter, 2019).
7

Public Housing
Public housing is a government subsidy that provides units with low rents for families to
live in (U.S. Department of Housing and Urban Development [HUD], n.d.-b). Around 45% of the
literature analyzed in this report that studied affordable housing outcomes analyzed public housing
or used it as a control group (Ahrentzen, 2008; Chetty et al., 2016; Chyn, 2018; Ellen et al., 2007;
Griffiths & Tita, 2009; Leech, 2013; Ludwig, 2005; Nguyen et al., 2017; Tillyer & Walter, 2019).
Public housing is vital to the housing crisis because it improves the stock and affordability of
housing by providing 1.1 million low-cost units to low-income families (National Low Income
Housing Coalition [NLIHC], 2019). It is overseen by the U.S. Department of Housing and Urban
Development (HUD) and is the oldest housing subsidy in the United States (NLIHC, 2019).
This subsidy provides a variety of units ranging from single-family homes to high-rise
apartments—available for low-income families, individuals with disabilities, and elderly individuals
(HUD, n.d.-b). The buildings are provided by the government and are solely used for affordable
housing. HUD provides federal funding to a public housing authority (PHA), and the PHA is then
responsible for owning, building, operating, and improving the housing (PD&R, 2020; Schill &
Wachter, 1995). Tenants pay 30% of their income towards rent, while HUD pays the remaining
amount of rent to the PHA (PD&R, 2020). Approximately 970,000 families in the U.S. reside in
public housing (HUD, n.d.-b).
The PHA checks individuals’ references before they are approved, and the individual must
either be a U.S. citizen or have an eligible immigration status (HUD, n.d.-b). To be eligible, families
must also meet specific income requirements. Families who are considered lower-income have
incomes of no more than 80% AMI, or the Area Median Income (HUD, n.d.-b). Families who qualify
as very low-income must have an income below 50% AMI (HUD, n.d.-b). Public housing units are
required to designate at least 40% of their units for those with incomes less than 30% AMI, and the
remaining units must be for those with incomes at or below 80% AMI (NLIHC, n.d.).
Different areas have different income limits, and the limits vary based on family size
(PD&R, 2020). For example, in the Ogden-Clearfield area, the standard AMI for FY 2021 is
$90,900, which is based on a family of four (HUD, 2021-a). To qualify as lower-income, a single
person household would have to have an income of no more than $50,750. A lower-income four-
person household would have to have an income of no more than $72,500 (HUD, 2021-a). A
single-person household qualifies as very low-income with an income of $31,750, whereas a four-
person household would qualify with an income of $45,300 (HUD, 2021-a).
8

9
Once families apply for public housing, they are put on a waitlist (NLIHC, 2019; PD&R,
2020). The amount of time they wait on a list is difficult to project, as housing authorities cannot
predict how long some families will be living in public housing (Ogden Housing Authority [OHA],
n.d.). The current projections for Ogden Housing Authority’s (OHA) public housing waitlist is six
months to one year for a one-bedroom unit for a senior citizen. The waitlist is approximately one
year for a one-bedroom, two-bedroom, or three-bedroom unit for all other families (OHA, n.d.).
Housing Choice Vouchers (HCV)
While a great deal of focus and research is on the public housing program (Tillyer &
Walter, 2019), Housing Choice Vouchers (HCV) are another helpful resource. Approximately
60% of the literature reviewed for this report that discussed affordable housing outcomes
studied this program or similar vouchers (Ahrentzen, 2009; Carlson et al., 2012; Chetty et al.,
2016; Chyn, 2018; Ellen et al., 2007; Ellen et al., 2012; Kim & Garcia, 2019; Leech, 2013; Lens
et al., 2011; Lens, 2013; Ludwig, 2005; Nguyen et al., 2017). This program is also known as
Section 8. HUD created Section 8 Certificates in 1974 and Section 8 Vouchers in 1983, but
legislation formally replaced both the Section 8 Certificates and Vouchers with the HCV
program in 1998 (PD&R, 2020). The program requires that at least 75% of vouchers go towards
households with incomes below 30% AMI, and the remaining vouchers go towards households
with incomes at or below 80% AMI (NLIHC, n.d.). These vouchers are estimated to assist around
2 million households (Fischer et al., 2021).
There are two types of vouchers under the HCV program, which are tenant-based
vouchers and project-based vouchers. Both of these vouchers are considered subsidies, but
tenant-based vouchers are the most prevalent type of HCV subsidy (PD&R, 2020). The benefit
of these vouchers is that families can choose where to live in the private market while still
retaining the subsidy (PD&R, 2020). To administer this program, HUD creates a contract with
a public housing authority (PHA), and the PHA then subcontracts with a private landlord. The
housing that the landlords provide must meet HUD standards and requirements (PD&R, 2020).
Households generally pay 30% of their income to private landlords for rent, while the
government pays the remainder to the landlords (PD&R, 2020). However, unlike the old Section
8 Certificates, the current HCVs do not require landlords to limit rent (PD&R, 2020). Because
there are no rent limits, families must pay any difference in cost above the Fair Market Rent, or
FMR (PD&R, 2020). The FMR is determined by the 40th percentile of the rent that recent
movers paid in non-luxury units (PD&R, 2020). In the Ogden-Clearfield area, the FMR for FY
2021 is $812 for a one-bedroom unit, $1,021 for a two-bedroom unit, $1,432 for a three-
bedroom unit, and $1,707 for a four-bedroom unit (HUD, 2021-b).

10
As with public housing, there is a waitlist for individuals and families interested in
receiving a voucher. The wait time to obtain a voucher through OHA is around two to three years
(OHA, n.d.). Weber Housing Authority also has a waitlist for vouchers, and their wait time is almost
three years, or 33 months (Affordable Housing Online, 2021).
Although tenant-based HCV households can take their subsidies with them when they
move, their options are still limited. Individuals and families may not know where affordable
housing is located, and they may struggle to find locations where vouchers are accepted (Ellen et
al., 2012). HCV families may find it difficult to find a home for various reasons, whether due to
illegal landlord discrimination or a lack of vacant homes that meet the standards that HUD
requires (Ellen et al., 2012; Lens, 2013). Once they find a home, though, HCV families are likely
to move to a neighborhood of the same quality or higher quality than the neighborhood they
resided in before receiving the voucher (Carlson et al., 2012).
Project-based vouchers differ from tenant-based vouchers in that the subsidies do not
move with the families. Instead, private landlords enter into contracts with HUD and directly
receive the subsidies from HUD (PD&R, 2020). These subsidies account for the difference in cost
from what the tenant pays and what the rent actually costs (PD&R, 2020).
Low-Income Housing Tax Credit (LIHTC)
The Established in 1986, the Low-Income Housing Tax Credit (LIHTC) is one of the
newest and largest federal programs to encourage affordable housing (CRS, 2021; National
Housing Law Project [NHLP], n.d.). Around 45% of the literature that discussed affordable
housing outcomes in this document studied this program (Ahrentzen, 2009; Albright et al., 2013;
Baum-Snow & Marion, 2009; Diamond & McQuade, 2019; Deng, 2011; Ellen et al., 2007;
Freedman & Owens, 2011; Tillyer & Walter, 2019; Woo & Joh, 2015). The federal government
considers this program to be the “primary policy tool for encouraging the development and
rehabilitation of affordable rental housing” (CRS, 2021). The number of credits grows by around
100,000 each year, and the program funded over 20% of all multifamily developments between
1987 and 2008 (Diamond & McQuade, 2019). Even if LIHTC may not significantly reduce the
rates of rent, it can at least “improve the stock” of housing that’s available (Freedman & Owens,
2011). This credit is one of the most effective forms of developing and improving affordable
housing, as well as the most widely used (Woo & Joh, 2015).

.
Unlike public housing or HCVs, LIHTC is administered by the IRS and state housing finance
agencies, or HFAs (NHLP, n.d.). Utah’s HFA is the Utah Housing Corporation (Housing and
Neighborhood Development [HAND] & The Redevelopment Agency [RDA], 2019). To receive the
funding, the HFA must create a qualified allocation plan (QAP), and the plan must prioritize both low-
income households and the maintenance of affordable rent for as long as possible (CRS, 2021). The
process to receive these tax credits is highly competitive, as states receive two to four times more
requests than there is funding available (Baum-Snow & Marion, 2009; Diamond & McQuade, 2019).
There are many examples of developments in Ogden that use LIHTC. Two of these are Liberty
Junction at 2353 Junction Way and Imagine Jefferson at 510 25th Street (Affordable Housing Online,
n.d.-a; Affordable Housing Online, n.d.-b). The rent is set at 30% of the AMI designated for that unit
(Affordable Housing Online, n.d.-a; Affordable Housing Online, n.d.-b). For example, in units designated
for families at or below 50% AMI, the rent is set by, first, assuming 1.5 people per bedroom; second,
finding the monthly income for a family this size at 50% AMI; and third, calculating 30% of this monthly
income (NHLP, 2018). As a result, households who make exactly 50% AMI and who live with 1.5 people
per bedroom will pay exactly 30% of their income towards rent, whereas households with incomes lower
than 50% AMI will pay a greater portion of their income towards rent. In other words, the rents for these
units are fixed to a certain extent, and they are less affordable for households with the lowest incomes.
Figure 1. Liberty Junction
11

12
Figure 2. Imagine Jefferson
Additional Options
Public housing, HCVs, and LIHTC are the main subjects of the literature review, but other federal
programs fund affordable housing as well. Other programs include the U.S. Department of Agriculture’s
Rural Housing Service, the Indian Housing Program, HOME, and Community Development Block Grants
(PD&R, 2020).
On a local level, the Olene Walker Fund is responsible for funding many affordable housing
options in Utah. Through low-rate loans, the fund is usually used to assist developers when they cannot
obtain enough funding from the three main federal programs. As of 2020, the fund provided 903 current
loans and funded 21,688 units (Utah Housing and Community Development Division, 2020). The fund
provided 939 multifamily units with an average subsidy of $22,383, as well as 46 single family units with
an average subsidy of $22,201 (Utah Housing and Community Development Division, 2020). For
example, in Weber County, the fund supports the project Senior Living on Washington Boulevard, which
is currently under construction and is also receiving LIHTC funding (Utah Housing and Community
Development Division, 2020).

13
History of Public Housing
The history of public housing illustrates how perceptions about affordable housing have evolved
over time. The first public housing efforts took place during the 1930s as a result of the struggles that
families experienced during the Great Depression (Orlebeke, 2000; Purdy & Kwak, 2007; Schill &
Wachter, 1995; Semuels, 2015). To address the unaffordability of housing during this time, the
government provided housing authorities with loans, which the authorities then paid back with tenant
rent (Schill & Wachter, 1995; Semuels, 2015). This program was officialized with the 1937 Housing Act
(HUD, 2012; NLIHC, 2019; Purdy & Kwak, 2007; Schill & Wachter, 1995; Semuels, 2015). Similar to
today, historically the concept of new public housing received a great deal of backlash from citizens
(Orlebeke, 2000; Semuels, 2015), despite the fact that the housing authorities carefully screened
tenants (Schill & Wachter, 1995; Semuels, 2015).
After World War II, aspects of these loans changed, and segregation within public housing
became more prominent (Michney, 2007; NLIHC, 2019; Schill & Wachter, 1995; Semuels, 2015). In
1949, housing authorities actively segregated projects, and in 1954, the Housing and Home Finance
Agency deemed that “separate but equal” still applied to housing even after the Supreme Court
invalidated the statute for public education (NLIHC, 2019). Also in 1949, Congress restricted income
limits more than before, which meant that only those with the lowest incomes remained in public housing
(Schill & Wachter, 1995). Therefore, higher-income families had the resources to move out at faster
rates, and Semuels’s (2015) article implies that these families were mostly White. Because of this,
Semuels (2015) concludes that rates of White flight out of public housing increased. This de facto
segregation continued into the 1970s, and White families who remained in public housing units
continued to receive better amenities than all of the other families (Michney, 2007; NLIHC, 2019). As
of 1995, these projects were still “extremely segregated” (Schill & Wachter, 1995).
Because the federal government was more reluctant to subsidize these units due to lack of care
from management, and because the budgets for public housing decreased, the quality of public housing
continued to deteriorate (NLIHC, 2019; Semuels, 2015). Even though the rent was still fixed at the same
rates, there was even less funding available because the only families left in the projects were those with
lower incomes (Semuels, 2015). This was because in 1969 Congress passed the Brooke Amendment,
which required public housing projects to charge no more than a certain percentage of a resident's
income (HUD, 2012; Schill & Wachter, 1995; Semuels, 2015). However, this made it “nearly
impossible” (Semuels, 2015) for housing authorities to afford maintenance for these public properties
(Schill & Wachter, 1995).

14
Some of this dysfunction also included harrowing stories of violent crime. The specific example
of failed housing that comes to mind for many is Cabrini-Green in Chicago (Tillyer & Walter, 2019; Voegeli,
2018). This project was built between the 1940s and 1960s in various stages, and it became infamously
known for its crime and poverty (Vale, 2012; Voegeli, 2018). Some called it a “nightmare vision of public
housing” (Voegeli, 2018), while others labeled it as “Little Hell” (Vale, 2012). Snipers or gang members
dwelled high in the towers and killed other gang members or police officers as they passed through the
development (Voegeli, 2018). One of the most infamous stories from Cabrini-Green was when a 7-year-
old boy walking with his mother was shot and killed while on the street outside the complex in 1992 (Vale,
2012; Voegeli, 2018).
In 1973, Nixon created a moratorium on new public housing projects, with the exception of
projects for the elderly (HUD, 2012; NLIHC, 2019; Orlebeke, 2000). In the following year, the Housing
and Community Development Act created the Section 8 program, so it began to replace public housing
as the most widely used subsidy (HUD, 2012; NLIHC, 2019; Orlebeke, 2000). In 1999, the Faircloth
Amendment officially prohibited the expansion of any more public housing units (HUD, n.d-a). As of
2017, the maximum number of public housing units that can exist in Ogden is 200, which is the exact
number that currently exists (HUD, 2017).
Though there have been many successful examples of affordable housing, professor and
historian Ed Goetz stated that “the story of American public housing is one of quiet successes drowned
out by loud failures” (Semuels, 2015). Due to stories of neglect, some public officials proposed tearing
down public housing projects altogether. Between 1978 and 1989, around 15,000 units were demolished
or sold, and support for the projects continued to decrease (Purdy & Kwak, 2007; Woo & Joh, 2015).
Congress then formed the National Commission on Severely Distressed Public Housing in 1989, which
found that only 6% developments could be considered “severely distressed” (NLIHC, 2019).
Nonetheless, as a result of the commission’s recommendations, Congress created the HOPE VI program
in 1993 in order to encourage further demolition (HUD, 2004; HUD, 2012; NLIHC, 2019; Orlebeke,
2000). Overall, the program contributed to the demotion of over 50,000 public housing units (HUD, 2004;
NLIHC, 2019).
After demolition, residents were supposed to receive vouchers for other housing options, but
some never received this help. Only around 15% of residents returned to newly redeveloped properties,
while some were forced to move to more impoverished areas (NLIHC, 2019; Semuels, 2015). According
to Goetz, it was “quite clear from the record that this, in practice, was never really about improving the
lives of residents. It was really about reactivating real-estate markets in central cities that were beginning
to be rediscovered” (Semuels, 2015).

11
Despite the problems evident at Cabrini-Green, many families were saddened to see it demolished
in 2011, as they had built a close community with each other (Vale, 2012; Voegeli, 2018). Additionally,
Voegeli (2018) speculates that the infamous story of Cabrini-Green was more popular than other public
housing developments because it was the closest project to higher-income neighborhoods in Chicago. For
example, many other projects were located in high-poverty areas, but Cabrini-Green “loomed only blocks
away from Chicago’s most affluent area, the Gold Coast, and ritziest retail district, North Michigan Avenue.
The location meant that journalists, who typically lived and worked on the North Side, found the project
comparably accessible and that their ledes to Cabrini-Green crime-and-poverty stories practically wrote
themselves” (Voegeli, 2018). In reality, the complex only housed 8% of public housing residents in
Chicago, but the negative stories of this specific complex drowned out the overall positive effects
affordable housing had in other areas (Voegeli, 2018).
The history of public housing and specific examples of failed housing efforts contribute to the
negative perception some have about affordable housing. This brief historical timeline and the specific
examples like Cabrini-Green illustrate the problems public housing has faced over the 20th century. Due
to the eventual lack of care and funding for public housing, as well as the subsequent demolitions of its
units, Section 8 and LIHTC have mostly taken its place and are the subjects of most recent literature.
Public housing projects have provided these two newer programs with the opportunity to learn from the
problems that exist in public housing, such as high crime rates and a lack of security.
Public Perception
Two national surveys found that more than half of American adults support the idea of the
government providing affordable housing (Opportunity Starts at Home, 2021; Winter, 2021). However,
those who are opposed to affordable housing tend to be the most vocal about their opposition, and their
opposition does not always represent what the majority of citizens want or need. For example, while most
of the participants at city council meetings in Massachusetts stated they opposed new affordable housing
developments, a majority of its voters indicated they supported them (Einstein et al., 2018).
A term that encompasses concern from residents who live near potential sites is NIMBY, or “not
in my backyard,” and it poses a barrier to affordable housing (Woo & Joh, 2015). Affordable housing efforts
commonly receive this type of backlash from the community located near a potential site (Albright et al.,
2013; Scally, 2012). The most frequently mentioned concerns from community members are impacts on
property values, crime, neighborhood appearance, traffic, and the quality of surrounding schools (Dillman
et al., 2017; Einstein et al., 2018; Ellen et al., 2012; Tighe, 2012).
15

dsfasd
The actual sources of NIMBY-ism are complicated to pin down. Citizens’ attitudes can be
affected by a variety of interrelated factors, such as individual ideology, personal trust in the government,
and impressions of the general characters of affordable housing residents (Tighe, 2012). However,
patterns of NIMBY-ism can be seen within specific demographics who express it. For instance, residents
who participate in public meetings about affordable housing are more likely to be older, male voters and
homeowners, and they are more likely to oppose new projects (Einstein et al., 2018). Researchers found
that these attitudes can be difficult for affordable housing advocates to address, even with methods
such as disproving fear, shifting public opinion, regulating equity, and circumventing opposition (Scally,
2012). Certain phrases will trigger different levels of reactions and support, so properly framing the issue
of affordable housing is important. As an example, opposition increased as one researcher changed
survey questions from “city” to “neighborhood” (Tighe, 2012).
Historical events provide one perspective as to why some members of the public have an
unfavorable view of affordable housing in their community, but social and criminological theories provide
additional understanding as to why this is. Studies have consistently found links between crime and
poverty (Bjerk, 2010; Hipp & Yates, 2011; Mohammed et al., 2018; Pare & Felson, 2014). Certain
criminological theories, such as Merton’s (1938) or Agnew‘s (1992) strain theories, propose that poverty
contributes to crime. However, according to Hipp and Yates (2011), most studies only analyze crime
and poverty’s “linear relationship and have not tested for possible nonlinear effects.” In addition, the
relationship between crime and poverty is complex and intertwined with numerous variables (Bjerk,
2010; Mohammed et al., 2018; Pare & Felson, 2014). As a result of these complexities, as well as the
lack of consistent empirical evidence, the causal relationship between poverty and crime has been
difficult to establish (Hipp & Yates, 2011; Mohammed et al., 2018; Pare & Felson, 2014). While some
studies have found that poverty has led to crime, others have found the opposite (Hipp & Yates, 2011;
Mohammed et al., 2018). Some researchers have also “strongly contested” theories that predict that
social disorganization increases when the number of low-income families in an area increases (Albright
et al., 2013). There are other explanations that could illustrate why poverty and crime are associated
with each other but not causally connected (Hipp & Yates, 2011). One example of this is that low-income
families are more likely to be located in areas where crime is already high because they cannot afford to
live elsewhere (Albright et al., 2013; Ellen et al., 2007; Ellen et al., 2012; Pare & Felson, 2014; Schill &
Wachter, 1995; Woo & Joh, 2015).
Additionally, some criminal ecological theories suggest that the solution to crime would be
collective efficacy, which is the strengthening of bonds between community members. In theory,
affordable housing could strengthen these bonds and therefore mitigate the strains that may contribute
to involvement in crime (Ellen et al., 2012). For example, families who lived in the Cabrini-Green public
housing project said they formed strong bonds with each other by watching each other’s children,
sharing food, or caring for each other when they lost a loved one (Voegeli, 2018). Additionally, because
vouchers help reduce poverty, this could also theoretically result in a decrease of crime (Ellen et al.,
2012).
16

Others may be opposed to affordable housing because they believe it concentrates poverty into
one area (Freedman & Owens, 2011). The fear is that these projects would worsen economic segregation
because low-income families would be located farther away from higher-quality jobs, and their children
would be placed in underfunded schools with few beneficial educational opportunities compared to their
peers in low-poverty areas (Freedman & Owens, 2011). This idea generally implies that affordable housing
would limit a family’s “upward economic and social mobility” (Freedman & Owens, 2011). As a
counterpoint, affordable housing provides shelter to disadvantaged populations, so it could mitigate
poverty in the long-term (Freedman & Owens, 2011). New developments could also attract more business
and therefore resources for residents in the future, as new construction in an area is a sign of positive
economic growth (Eskic, 2021; Freedman & Owens, 2011; HAND & RDA, 2019).
In Utah, more citizens are recognizing that affordable housing is needed on a local level. In 2015,
16% of Utahns labeled the availability of affordable housing as “poor.” In 2018, that number increased
to 28% (Utah Foundation, 2018). Around 31% believe that the affordability of housing for individuals in
all income levels is also poor (Utah Foundation, 2018). In addition, they ranked affordable housing as the
second most important issue that the state of Utah should focus on improving, second to traffic (Utah
Foundation, 2018). A large number of these respondents indicated they were not cost-burdened by their
own housing, so even individuals who may not personally need affordable housing still understand the
demand for it.
For a few reasons, researchers recommend that developers carefully consider the opposition
some have towards affordable housing. First, the concerns that citizens cite are usually anecdotal (Woo
& Joh, 2015). The concerns they have over property values, crime, traffic, or other issues may not follow
the most recent empirical evidence, as discussed later in more depth. Additionally, those who are most
vocally opposed may be uninformed of the links that exist between social outcomes of health and housing.
For example, higher-income families are more vocally opposed to housing. These same families are also
less likely to believe that housing security and individual health are associated with each other (Scally,
2012), even though empirical research has consistently shown that they are (Chetty et al., 2016; Chyn,
2018; Desmond, 2012; Ludwig et al., 2005; Medina et al., 2020; Warren & Font, 2015). Another reason
that one author states for deliberating over how much weight to give public opposition is that succumbing
to this opposition “undermines 50 years of progress toward residential racial integration” (Tighe, 2012).
Not all NIMBY-ism is an indication of opposition towards racial integration, but preventing affordable
housing from being built can exclude lower-income families—a disproportionate number of which are
families of color—from certain segments of society (Tighe, 2012).
17

18
The Need for Affordable Housing
Despite the negative perception some have towards affordable housing, strong demand for it
exists in Utah and around the country. Many circumstances demonstrate this demand.
Growth and Availability
Utah was ranked as the fourth fastest growing state in 2021 and as the first fastest growing
state in the entire decade, so demand for housing is high (Eskic, 2021). There are not enough units,
affordable or otherwise, to match this huge growth. Aside from the growing population, another
explanation for the lack of units is the aging population. Older populations are not moving out of their
homes, which contributes to the shortage of free units (HAND & RDA, 2019). Approximately 30% more
units are needed than are available (Wood et al., 2020). The number of households needing housing
in Utah has increased by 220,720 since 2009, but only 185,334 more units have become available
for these households since that same year (Wood et al., 2020). Researchers from the University of
Utah predict this dilemma “will only worsen in the next five years, without the addition of at least
27,600 new housing units annually” (Wood et al., 2020).
There are larger deficits for those with lower incomes. In the state of Utah, there is a deficit of
43,185 rental units for very low-income (30-50% AMI) families, and a deficit of 46,470 rental units for
extremely low-income (no more than 30% AMI) families (Utah Housing and Community Development
Division, 2020). In Weber County, there is a deficit of 160 rental units available for low-income
households, a deficit of 2,755 rental units for very low-income households, and a deficit of 4,265 rental
units for extremely low-income households (Utah Housing and Community Development Division,
2020).
Home and Rental Prices
As of 2021, the homes and rental units that are available in Utah cost more than many
residents can afford. As stated earlier, housing is considered affordable when households pay 30% or
less of their incomes towards it. Homes are usually the most important asset of homeowners’ portfolios
(Ioannides, 2017), and national wealth produced from houses accounts for “about half the net wealth
of moderate-income households” (Wood et al., 2020). Prices of homes, their materials, and land have
been increasing exponentially over the last few years. In 2019, the SLC Housing and Neighborhood
Development and the SLC Redevelopment Agency estimated that the cost of land, labor, and materials
for development had increased by around 20–30% over the previous few years.
4

The COVID-19 pandemic has further exacerbated this problem. For example, the cost of lumber
has increased drastically. The supply of lumber decreased as sawmills closed or reduced production
during the pandemic, but demand continued to increase (National Association of Home Builders
[NAHB], 2021; Vitner et al., 2021). An increase in individuals working from home spurred home buying
and home renovations (NAHB, 2021; Vitner et al., 2021). This unbalanced supply and demand led to a
surge in lumber prices. One study found that the cost of framing lumber has increased by 250% since
April of 2020, which increases the value of a multifamily home by approximately $13,000 (Emrath,
2021).
In Weber County, the median sales price of a home was $179,200 in May of 2016 (Utah
Association of Realtors, 2021). In May of 2021, it was $339,900 (Utah Association of Realtors, 2021).
Around 24.7% of Weber County residents indicated that they were cost-burdened with their mortgage
(U.S. Census Bureau, 2019b). In the state of Utah, the median sales price of a home in May of 2016 was
$238,700, and in May of 2021, it was $410,000 (Utah Association of Realtors, 2021). About 24.4% of
Utah residents reported they were cost-burdened with their mortgage (U.S. Census Bureau, 2019a).
The costs of rent have also significantly increased. For example, the median rent in Weber
County increased from $804 in 2014 (U.S. Census Bureau, 2014b) to $973 in 2019 (U.S. Census
Bureau, 2019b). The median rent in Utah increased from $886 in 2014 (U.S. Census Bureau, 2014a)
to $1,098 in 2019 (U.S. Census Bureau, 2019a). Because of these increases, renters cannot afford to
buy homes and cannot gain equity that could be used to create wealth in the housing market (Wood et
al., 2020). Renters are also more likely to be cost-burdened than homeowners (Utah Housing and
Community Development Division, 2020). Around 43% of renters in Weber County are cost-burdened,
compared to 44% of renters who are cost-burdened statewide (U.S. Census Bureau, 2019b).
Additionally, parking regulations and zoning that restricts density can increase the costs of
housing in the long run, as they increase construction costs and restrict the amount of new housing that
can be built (Ikeda & Washington, 2015). These zoning policies also tend to prioritize homeowners more
than renters because they favor single family homes (HAND & RDA, 2019).
19

20
Transportation Costs
Home and rental prices are not the only factors that determine the affordability of an area.
Transportation is the next largest expenditure after rent for many families (CNT, 2017). In the United
States, many of the expensive homes are located closer to high-paying jobs (Ioannides, 2017).
Therefore, if families want access to jobs with better salaries but cannot afford this expensive housing,
they have to commute farther (Ioannides, 2017). This reinforces income segregation, as lower-income
families are forced to live near low-paying jobs. By contrast, “location-efficient” neighborhoods are
those where households pay around 15% or less of their income towards transportation (CNT, 2017).
These neighborhoods are compact, mixed-use, and conveniently located near jobs (CNT, 2017).
The Center for Neighborhood Technology (CNT) developed an index to quantify and rank
location-efficient neighborhoods. Currently, the CNT considers no neighborhoods in Weber County
location-efficient, as the average cost of transportation for residents consisted of 23% of their income
(CNT, 2021). The CNT (2021) ranks the county’s access to jobs at 4.6 out of 10. Public transit ranks
4.4 out of 10, and compact neighborhoods are ranked 1.1 out of 10 (CNT, 2021).
The CNT (2021) finds no location-efficient neighborhoods in Ogden specifically. Ogden
residents, on average, spend 22% of their income on transportation (CNT, 2021). They rank an Ogden
resident’s job access at 5.7 out of 10, public transit 4.4 out of 10, and compact neighborhoods 5.8 out
of 10 (CNT, 2021). Overall, transportation takes up a large portion of many families’ incomes and
affects their choice of where to live, so it is a vital factor to include when discussing affordable housing.
Legacy of Racial Segregation
Housing in Ogden and Weber County, as in other parts of the country, continues to experience
fallout from racial segregation. This mainly stems from the practice of redlining, which can be defined
as “denying a creditworthy applicant a loan for housing in a certain neighborhood even though the
applicant may otherwise be eligible for the loan” (Federal Reserve Board, n.d.). Before the Fair Housing
Act in 1968, neighborhoods in which most residents were families of color were often redlined by
banks, making it impossible for qualified residents of such neighborhoods to obtain mortgage loans.
An interactive tool created by researchers from the University of Richmond shows the redlining that
occurred in Ogden, Salt Lake City, and many other U.S. cities, and how it continues to have effects on
these cities today (Nelson et al., n.d.).
4

Beginning in 1935, the Homeowners Loan Corporation began to categorize certain
neighborhoods as “healthy,” and these healthy areas were predominantly White (Schill & Wachter,
1995). Historical maps showed that cities ranked areas from “A” to “D” depending on their
habitability and health, with “A” being the best and “D” being the worst (Nelson et al., n.d.). On
Ogden’s map, the areas on the west side of the city were mostly labeled “C” and “D” (Nelson et al.,
n.d.). An area in Ogden west of Childs Avenue was ranked as D7 and labeled as such: “This area is
inhabited by foreigners including Italians, Basques, Mexicans and some negroes. It is the warehouse
and industrial part of the city. Houses therein are poor. Any further manufacturing or industrial
development in the city will be in this section” (Nelson et al., n.d.). The full map of Ogden can be
found at: https://dsl.richmond.edu/panorama/redlining/#loc=12/41.231/-112.043&city=ogden-ut.
Figure 3. Redlining Map of Ogden, 1931
21

The Fair Housing Act outlawed redlining and this ranking system in 1968 (Federal Reserve
Board, n.d.). However, one study of 149 large U.S. cities found that negative effects were still present
as late as 2010 where these boundaries were drawn (Aaronson et al., 2020). The study found that
areas previously ranked “C” and “D” had lower property values, lower rates of homeownership, lower
rent prices, and higher vacancy rates decades after the boundaries were drawn. They also found
increased rates of racial segregation between the previous “C” and “D” areas (Aaronson et al.,
2020). This segregation can affect equality of opportunity, as “higher levels of segregation also have
wider racial and ethnic disparities in labor market engagement, high-performing schools, and toxin-
free environments” (Gourevitch et al., 2018).
Neighborhoods that were once ranked as “C” and “D” are also associated with higher rates
of health problems today. In the Ogden area that was previously labeled as D7—for example—
obesity rates, mental health problems, poverty rates, and average life expectancy are worse than for
residents who live in areas that were labeled as “A” or “B” (Nelson & Ayers, n.d.). Residents from
the former D7 have a life expectancy of 76.8, whereas residents of an area formerly labeled A3 have
a life expectancy of 79.7 (Nelson & Ayers, n.d.). Approximately 38% of D7 residents are in poverty,
whereas only 16% of A3 residents are in poverty (Nelson & Ayers, n.d.). Therefore, examining
historical redlining in the context of the present-day housing crisis is productive because doing so
illustrates the link between housing and examples of social vulnerability.
Poverty and Social Impacts
Household wages have not kept up with the cost of housing today (HAND & RDA, 2019;
Utah Housing and Community Development Division, 2020). Those who earn less are more likely to
be burdened with housing costs (Utah Housing and Community Development Division, 2020).
Around 9.4% of the total population in Weber County are in poverty, relative to 9.1% in Utah overall
(Utah Housing and Community Development Division, 2020). In the period between 2013–2017,
an overwhelming majority (86.6%) of cost-burdened renters were extremely low-income families, or
families earning less than 50% AMI (Utah Housing and Community Development Division, 2020).
Negative social consequences occur for families who cannot afford housing. Though the
causality of poverty and health is difficult to establish, individuals and families who experience
poverty or housing insecurity are more likely to have mental and physical health problems, as well
as poor residential mobility (Desmond, 2012; Medina et al., 2020; Mukherjee, 2015; Wagstaff,
2002). Eviction rates increase as housing becomes more unaffordable, as many renters cannot
afford rent increases that occur (Medina et al., 2020). Families who cannot find or afford a place to
live face the risk of becoming homeless. In Utah, the Road Home shelter staff worry that around 30%
of the families who exit the shelter will return, but they have found that providing families with
housing subsidies mitigated this concern (Kim & Garcia, 2019).
22

Housing insecurity also has negative impacts on children. Around 40% of all cost-burdened
renter households with no assistance are households with children (Warren & Font, 2015). As of 2020,
around 15,000 children lived in unstable housing in Utah (Utah Housing and Community Development
Division, 2020). Approximately 9.1% of children aged 0 to 17 in Weber County are in poverty, compared
to 9.0% of children statewide (Utah Housing and Community Development Division, 2020). Housing
insecurity is associated with developmental delays, malnutrition, and child neglect and abuse through
maternal stress (Medina et al., 2020; Warren & Font, 2015). Housing unaffordability is one aspect of
housing insecurity, and it is significantly associated with this maternal stress (Warren & Font, 2015).
Evidently, housing circumstances affect social outcomes for both adults and children. A holistic view
of these social effects, as well as the cost burdens and shortages of housing, reveals a strong need for
affordable housing in Utah today.
Affordable Housing Outcomes The history of “loud” examples of affordable housing failures makes affordable housing efforts
appear ineffective. However, the majority of research suggests otherwise. In 2015, 1.2 million
Americans lived in public housing managed by 3,300 housing authorities, many of which scored 98%
out of 100 in HUD assessments (Semuels, 2015). A great deal of the literature disputes the common
fears that result from NIMBY-ism, such as lower property values and increased crime rates. However,
not all neighborhoods are alike. Therefore, these effects are not uniform in all neighborhoods (Albright
et al., 2013; Deng, 2011; Diamond & McQuade, 2019).
A large majority of literature studying the outcomes of affordable housing was based in large
cities with populations of at least 100,000, with commonly studied cities being Chicago, Los Angeles,
New York City, Austin, and Denver (Chetty et al., 2016; Chyn, 2018; Deng, 2011; Ellen et al., 2007;
Ellen et al., 2012; Freedman & Owens, 2011; Freemark, 2020; Lens et al., 2011; Lens, 2013; Ludwig
et al., 2005; Nguyen et al., 2017; Tillyer & Walter, 2019). Though Ogden’s population of 87,000 is
smaller than in most of these cities, some studies are representative of demographics on the national
level, so these are still relevant sources of information for Ogden (Leech, 2013; Lens et al., 2011; Lens,
2013). Additionally, some studies examined projects in suburban or rural areas (Albright et al., 2013;
Carlson et al., 2012), and some included Salt Lake City (Gubits et al., 2016; Kim & Garcia, 2019). Many
researchers also suggest that smaller cities may be able to see any positive effects more easily than
larger cities (Albright et al., 2013; Ioannides, 2017; Semuels, 2015).
23

ineffective1. Also, property values tend to increase anyway, meaning that researchers struggle to
1 Studies prior to 2000 tended to use “test versus control area methodology,” which consisted of researchers comparing property values in neighborhoods with affordable housing to values in similar neighborhoods without affordable housing (Nguyen, 2005). This methodology was criticized because there could have been “differences not easily apparent to the investigator or nuances of the neighborhood that could not be captured by this type of methodology but that nonetheless affected housing prices” (Nguyen, 2005). These studies also used cross-sectional analyses, which cannot be used to determine causality or direction in values (Nguyen, 2005). More recent studies have used more rigorous methods (Ahrentzen, 2008). For example, Albright et al. (2013) used a control group time series quasi-experimental design to better predict causality.
Property Values
Historically, studies have had difficulty measuring affordable housing’s effects on
neighboring property values. This was because samples were small, and the methodology was
ineffective. Also, property values tend to increase anyway, meaning that researchers struggle to
establish causality between the presence of an affordable housing community and changes in
neighbors’ property values (Ahrentzen, 2008; Eskic, 2021; Woo et al., 2015). Most of the studies
discussed in this review observed hundreds or thousands of sales transactions or developments,
comparing values from blocks with affordable housing developments to blocks without these
developments in similar or surrounding neighborhoods (Albright et al., 2013; Deng, 2011;
Diamond & McQuade, 2019; Ellen et al., 2007). Additionally, all of the literature that studied
property values related to affordable housing specifically evaluated LIHTC developments,
occasionally in addition to other program types (Ahrentzen, 2009; Albright et al., 2013; Baum-
Snow & Marion, 2009; Deng, 2011; Diamond & McQuade, 2019; Dillman et al., 2017; Ellen et
al., 2007).
20
establish causality between the presence of an affordable housing community and changes in
neighbors’ property values (Ahrentzen, 2008; Eskic, 2021; Woo et al., 2015). Most of the studies
discussed in this review observed hundreds or thousands of sales transactions or developments,
comparing values from blocks with affordable housing developments to blocks without these
developments in similar or surrounding neighborhoods (Albright et al., 2013; Deng, 2011;
Diamond & McQuade, 2019; Ellen et al., 2007). Additionally, all of the literature that studied
property values related to affordable housing specifically evaluated LIHTC developments,
occasionally in addition to other program types (Ahrentzen, 2009; Albright et al., 2013; Baum-
Snow & Marion, 2009; Deng, 2011; Diamond & McQuade, 2019; Dillman et al., 2017; Ellen et al.,
2007).
It is worth noting the timeframe and area housing-market trends associated with the
studies looking at effects of affordable housing. As an example, a 1999 study found that
subsidized housing residents did not impact property values and that neighborhoods with values
that were already declining were more likely to see negative effects (Albright et al., 2013). Ellen et
al. (2007) similarly found that affordable housing was more likely to be placed in areas where
values were lower than in the surrounding distressed areas.
Most of the literature that researched the effect of affordable housing developments on
neighboring property values found either a statistically significant increase in neighboring property
values—usually in low-income areas—or no significant effects on values (Ahrentzen, 2008;
Albright et al., 2013; Baum-Snow & Marion, 2009; Diamond & McQuade, 2019; Dillman et al.,
2017). Like many of the other studied effects of affordable housing, the direction of the impact on
property values varied based on the neighborhood types (Diamond & McQuade, 2019; Dillman et
al., 2017).Additionally, multiple studies of various affordable housing subsidies found higher
increases in property values in neighborhoods closest to the projects in question (Ahrentzen,
2008; Albright et al., 2013; Diamond & McQuade, 2019; Dillman et al., 2017).
24

In low-income areas, affordable housing projects generally increased neighboring property
values (Baum-Snow & Marion, 2009; Diamond & McQuade, 2019; Dillman et al., 2017; Ellen et al.,
2007). Diamond and McQuade (2019) conducted their study on property values in 129 counties in
15 states, which provided them data for 16 million transactions within 1.5 miles of a LIHTC
development. They found that in neighborhoods with a median income of less than $26,000, local
property values increased by 6.5% within 0.1 miles of the development (Diamond & McQuade,
2019). Unfortunately, when property values are raised in distressed areas, this could have a
regressive effect for low-income families, as it could make it more difficult for them to remain in or
move into these areas (Ikeda & Washington, 2015).
In both moderate-poverty areas, where poverty rates are around 10%-20%, and low-poverty
or high-income areas, studies have found more “ambiguous effects” of affordable housing on
neighboring values (Dillman et al., 2017). These are labeled as ambiguous because fewer studies
have examined these specific neighborhoods, and the researchers who have completed these studies
found different results ranging from no effect to negative effects (Albright et al., 2013; Diamond &
McQuade, 2019; Dillman et al., 2017; Woo et al., 2015). For example, three studies of property
values in high-income areas found no effect on values (Albright et al., 2013; Baum-Snow & Marion,
2009; Dillman et al., 2017), whereas one study found a depreciation of 2.5% (Diamond & McQuade,
2019). In moderate-poverty areas, the variation in effects could be due to the fact the area is close to
becoming more impoverished, so neighborhood changes could result in the area tipping towards or
away from poverty. The addition of low-income families into the area could increase the
concentration of poverty, but at the same time, LIHTC is viewed as an investment in an area and
could encourage other investments (Dillman et al., 2017).
These effects also varied by the program type in some cases. In one study, LIHTC
developments positively affected property values, but public housing or developments with project-
based Section 8 negatively affected values (Ellen et al., 2007). Specifically, prices of homes within
2,000 feet of a completed LIHTC project were 3.8% higher than those farther away. Homes near
family-oriented public housing sold for 13.1% less than homes within the same census tract (Ellen et
al., 2007). However, the authors found that the gap between prices of homes near Section 8 projects
or public housing and homes farther away decreased over time (Ellen et al., 2007). The authors
noticed that this price gap between public housing neighborhoods and the control group actually
closed altogether three years after construction was completed (Ellen et al., 2007). These results
suggest that LIHTC developments could be the most beneficial for increasing values, but also that
other affordable housing types may not depreciate values in the long run.
25

Several factors may explain why property values increase in some areas. One is that revitalizing
old housing projects or building new housing developments can make an area look more attractive
(Ahrentzen, 2008; Diamond & McQuade, 2019; Dillman et al., 2017). New apartments mean more
“demand and dollars to a community,” and changing the look of old properties gives the area “more
vibrancy and buzz” (Eskic, 2021). As stated previously, new construction indicates positive economic
growth (Eskic, 2021; Freedman & Owens, 2011; HAND & RDA, 2019). In other words, whether new
affordable housing developments resulted in an increase in population density, or whether developers
chose to rehabilitate existing buildings, effects on values were the same (Diamond & McQuade, 2019;
Dillman et al., 2017). One study found that when developers chose to rehabilitate, property values were
more likely to increase when they focused on improving the external appearance of the development as
opposed to only the internal appearance (Dillman et al., 2017).
Blending the architecture into the surrounding area is one of the most important aspects of
creating affordable housing or high-density developments (Eskic, 2021; HAND & RDA, 2019). Diamond
and McQuade (2019) suggest that one reason for this is that some higher-income or White families have
preferences for “neighborhood homogeneity,” so there may be less flight from the neighborhood if
affordable housing looks similar to other developments. Many examples of affordable housing projects
have shown that it is possible to blend a project into the community. Some residents may not even notice
that a development is an affordable housing project. One example was a project in Mount Laurel, New
Jersey. Mount Laurel is known for having one of the most effective affordable housing projects, despite
facing opposition for years prior to its construction (Albright et al., 2013). When the project was built,
almost 30% of the residents living nearby were unaware that it was affordable housing, and only 13%
had ever interacted with the residents there (Albright et al., 2013). The researchers noted that the
opening of the project “was not with a bang but a whimper” (Albright et al., 2013).
The increase of property values could also be due to income diversity. LIHTC developments
often include both rent-restricted and market-rate units. If LIHTC encourages moderate-income
residents to move into an area, other higher-income residents may do the same (Diamond & McQuade,
2019; Dillman et al., 2017; Eskic, 2021). This would also improve the availability of resources for lower-
income residents in the area. An additional important factor Ahrentzen (2008) noted was having good
property management to maintain the cleanliness and appearance of the area.
Potential decreases in property values in some areas could be due to a few other factors. Some
studies have found that oversaturation of affordable housing units in one area could have a neutral or
negative effect on values, but it is difficult to establish what the threshold is due to how unique each
neighborhood and its characteristics are (Ahrentzen, 2008; Deng, 2011; Dillman et al., 2017). Baum-
Snow and Marion (2009) suggest that high turnover in the neighborhoods they studied could have
resulted from general stigma, as they found that the AMI decreased but the number of owner-occupied
units stayed the same.
26

Additionally, one analysis of LIHTC’s effect on property values found that depreciation was
more likely to occur in communities that were predominantly White (Diamond & McQuade, 2019). This
is consistent with Schelling’s “tipping point,” which suggests that White families will leave an area when
the ethnic minority share reaches around 5% to 20% (Ioannides, 2017). However, few articles
examined the causality of this phenomenon. Two studies have found that White flight to the suburbs
was causally linked to Black migration to the cities after 1940, but they found opposite directions of
causality (Boustan, 2010; Boustan & Margo, 2013). Boustan (2010) found that an increase of one
Black household in the city led to a decrease of 2.7 White households, while Boustan and Margo (2013)
found that a decrease of 1,000 White households led to an increase of 100 Black households.
Regardless, one study stated that it could be possible to desegregate an area without this decrease in
values if the aversion to low-income families is not too strong (Dillman et al., 2017)
Crime
Some studies in the past have shown that affordable housing is associated with higher crime
rates. However, this could be due to the fact that many of these studies used cross-sectional analyses
(Ellen et al., 2007; Ellen et al., 2012; Woo & Joh, 2015). This type of methodology cannot be used to
determine causation or directionality, so these previous studies could not establish whether or not
affordable housing was the direct cause of high crime rates (Ellen et al., 2007; Ellen et al., 2012; Woo
& Joh, 2015). To analyze crime, two studies in this review used Uniform Crime Reports from the FBI
(Albright et al., 2013; Freedman & Owens, 2011), while the others used census tract-level crime data
from cities (Diamond & McQuade, 2019; Ellen et al., 2012; Griffiths & Tita, 2009; Lens et al., 2011;
Woo & Joh, 2015). All of the literature on crime studied the effects on violent crime, though some also
looked at property crimes (Diamond & McQuade, 2019; Ellen et al., 2012; Tillyer & Walter, 2019; Woo
& Joh, 2015).
Multiple studies show that affordable housing developments are placed where crime or
poverty are already high, and this was true of both LIHTC and public housing (Ellen et al., 2012; Schill
& Wachter, 1995; Woo & Joh, 2015). Similarly, families with HCVs were more likely to choose to live in
areas where crime was high (Ellen et al., 2012). A study also found that only a small number of
affordable housing developments, including public housing, LIHTC units, and others, accounted for the
crime associated with them. In one study of 97 public housing and LIHTC developments, around 5% of
developments accounted for more than 72% of all violent crimes in the sample, showing that only a
small percentage is associated with high rates of crime (Tillyer & Walter, 2019).
27

The literature consistently shows that the presence of affordable housing has little impact on
crime. In many areas, crime rates either stayed neutral or even decreased, and these effects were
consistent in studies about LIHTC, HCV, and public housing (Albright et al., 2013; Diamond & McQuade,
2019; Dillman et al., 2017; Ellen et al., 2012; Freedman & Owens, 2011; Griffiths & Tita, 2009). So,
even though crime is associated with affordable housing, it cannot be concluded that affordable housing
is the cause. Rather, the association may be present because affordable housing is constructed in
neighborhoods with similar or higher crime rates compared to neighboring areas. For example, the crime
rates across Mount Laurel were all similar before the affordable housing development was built. After it
was built, there was a small decline in crime, but it was not significant because crime rates were already
decreasing in the general area (Albright et al., 2013).
As with property values, the effects on crime differed per neighborhood. Even though most
studies show no increase of crime, affordable housing of any type is more likely to have a mitigating
impact in high-poverty areas and no impact in low-poverty areas. Regardless of minority share or
program type, three studies showed violent and property crime decreased in low-income neighborhoods
where affordable housing was present (Diamond & McQuade, 2019; Freedman & Owens, 2011; Woo &
Joh, 2015). Additionally, one study indicated that one of the most common reasons residents stated
they moved into a LIHTC development was for increased safety (Diamond & McQuade, 2019). In another
study of LIHTC developments, aggravated assaults county-wide decreased by 1.8% each for every new
unit in a poor neighborhood, which saved approximately $13,000 per year “in terms of reduced violent
crime victimization” (Freedman & Owens, 2011). The researchers found that affordable housing had an
“immediate and long-lasting impact,” as the lowered crime rates lasted even after construction was
done (Freedman & Owens, 2011). Fewer studies addressed effects on crime in moderate-poverty and
high-poverty areas, but two found that LIHTC developments had no significant effects on rates (Albright
et al., 2013; Diamond & McQuade, 2019). Two studies that did not specify neighborhood types found
that the presence of public housing or voucher families did not increase crime (Ellen et al., 2012;
Griffiths & Tita, 2009).
The literature reveals that affordable housing is not likely to create crime, but there are a few
reasons it may be associated with crime. First, developments may be built in areas where crime is
already high because building there is cheaper (Tillyer & Walter, 2019; Woo & Joh, 2015). HCV families
may also choose to live in areas where the crime is high because of the cheaper cost of rent and higher
vacancy rates (Ellen et al., 2012; Lens et al., 2011). Researchers found that landlords tend to
discriminate against HCV families when the rental markets are tight, so they are forced to choose
neighborhoods where crime is already prominent (Ellen et al., 2012; Lens et al., 2011; Lens, 2013). To
mitigate this discrimination, two studies recommended that policymakers increase the choices of where
voucher holders can live by expanding the stock of housing (Ellen et al., 2012; Lens et al., 2011).
28

Researchers believe some common factors contribute to lowering crime rates. First, two studies
credited property management’s diligence in having thorough screening processes, as well as
background and credit checks (Albright et al., 2013; Dillman et al., 2017). One of the studies’ authors
also stated that property managers who conducted home visits and evicted disobedient tenants also
contributed to the lack of crime (Albright et al., 2013). Affordable housing residents stated they enjoyed
how strict management was, and they also enjoyed interacting with them frequently (Albright et al.,
2013). Due to this strong relationship, residents felt more encouraged to report any crime or suspicious
activity (Albright et al., 2013; Dillman et al., 2017). The routine activity theory can explain why these
factors would result in a reduction in crime. The theory states that crime occurs when there is a lack of
guardianship over a victim or an area. In this case, the affordable housing project reduced the
opportunity for crime because more people were watching the area, acting as guardians (Albright et al.,
2013; Dillman et al., 2017).
Having a large number of security measures can also decrease crime. In the study that analyzed
97 public housing and LIHTC developments, the authors found that security features were negatively
associated with violent crimes, as well as drug and property crimes (Tillyer & Walter, 2019). Some of
these security measures included cameras inside and outside of the development, a secured entrance
and parking area, alarms in units, and strict visitor policies that management enforced (Tillyer & Walter,
2019). The more concentrated disadvantage in the area, the less effective these were, so the authors
recommended that housing should be placed in more economically diverse and stable areas (Tillyer &
Walter, 2019). Implementing crime-reduction strategies in all areas that are economically diverse may
not have uniform results due to “different social, temporal, and physical settings,” so there may need to
be additional efforts in certain neighborhoods where disadvantage is concentrated (Tillyer & Walter,
2019).
Just as appearance affects property values, the appearance of the housing units can affect
crime rates. The broken windows theory of crime can explain this, as it suggests that crime is more likely
to occur in neighborhoods that appear distressed. When local officials develop LIHTC opportunities,
they can reduce this distressed appearance by replacing graffiti, empty lots, and generally “unappealing
elements that promote crime in neighborhoods” (Woo & Joh, 2015). Lastly, having programs on site,
such as after-school programs, can help keep children occupied. This could reduce the opportunity for
them to be involved in crime (Albright et al., 2013).
29

Social Impacts
Families experience many positive social effects when they receive certain affordable housing
subsidies, such as vouchers. All of the literature discussed in this section studied the effects of HCV or
other similar vouchers on families. To measure the social impacts vouchers had on families, all of the
studies compared them to control groups, which were usually public housing residents (Carlson et al.,
2012; Chetty et al., 2016; Chyn, 2018; Gubits et al., 2016; Kim & Garcia, 2019; Leech, 2013; Ludwig
et al., 2005; Nguyen et al., 2017). Most observed the long-term effects on families by conducting
studies that followed families for at least three to 10 years (Carlson et al., 2012; Chetty et al., 2016;
Gubits et al., 2016; Leech, 2013). Almost all used data from HUD, social assistance files, or historical
records (Gubits et al., 2016; Kim & Garcia, 2019; Ludwig et al., 2005; Nguyen et al., 2017).
Some studies found that HCV families experienced more benefits than families in homeless
shelters, project-based housing, or rapid re-housing (Gubits et al., 2016; Nguyen et al., 2017).
Vouchers are beneficial because they can allow families to see an increase in their income, which
allows them to better care for their children and move out of doubled-up living arrangements (Carlson
et al., 2012). Doubled-up households are ones in which one or more adults live with another adult who
is the head of the household (PD&R, n.d.). In addition, HCV families are also more likely to move to
areas with better opportunities and access to resources (Carlson et al., 2012).
Compared to families in shelters or public housing, HCV families were less likely to return to a
homeless shelter and more likely to find their own place to live (Carlson et al., 2012; Gubits et al.,
2016). One study found that vouchers also significantly reduced the following: the number of families
separated from the children, number of locations lived, psychological distress, instances of intimate
partner violence, evidence of drug problems, number of schools children attended, school absences,
children’s behavior problems, and food insecurity (Gubtis et al., 2016). Leech (2013) similarly found
through the National Longitudinal Survey of Youth that teenagers in subsidized housing were less likely
to participate in heavy alcohol or marijuana use compared to those in public housing. In Utah, families
who received a subsidy from the Road Home were 28.5% less likely to return to the shelter than others
(Kim & Garcia, 2019). This could be due to the fact the subsidy improved their housing stability, which
then improved their economic stability and their access to resources (Kim & Garcia, 2019).
In 1994, HUD conducted a 10-year, randomized experiment entitled Moving to Opportunity,
or MTO (National Bureau of Economic Research [NBER], 2012). This experiment provided tenant-
based vouchers to 4,600 public housing households; the study required one of the experimental groups
to use their vouchers only in low-poverty areas (NBER, n.d.). This program provided some of the “best
available evidence” as to the effects of moving families from high-poverty to low-poverty areas, so a
large portion of literature focused on this specific program in the past (Leech, 2013).
30

Ludwig et al. (2005) discovered a few statistically significant benefits of allowing families to
move to better neighborhoods. Compared to families who remained in high-poverty neighborhoods,
approximately 11% to 16% fewer families used welfare after moving to low-poverty neighborhoods
(Ludwig et al., 2005). The families in low-poverty neighborhoods were also more likely to stay off welfare
(Ludwig et al., 2005). Another common finding from the MTO experiment was that it improved
individuals’ physical and mental health (Ludwig et al., 2005). Moving to better neighborhoods can also
improve safety. Votruba and Kling (2009) analyzed the Gautreaux Assisted Housing Program in Chicago,
which was a project similar to MTO. They found that youth who moved to neighborhoods with a higher
proportion of college-educated individuals had lower mortality rates than their peers (Votruba & Kling,
2009).
The positive effects of the MTO experiment and similar studies can be seen in children as well.
In general, when children move from high- to low-poverty areas, their future earnings can increase by
$100,000 (Diamond & McQuade, 2019). Children who received vouchers to live in better areas were
more likely than those in public housing to have lower high school dropout rates, higher incomes, and
higher college attendance rates (Chetty et al., 2016; Chyn, 2018). These vouchers also reduced the
likelihood they would live in high-poverty areas as adults, which would help “reduce the
intergenerational persistence of poverty and generate positive returns for taxpayers” (Chetty et al.,
2016; Chyn, 2018). Children who received vouchers were also less likely to be arrested for violent crime
(Chyn, 2018). At the time the MTO experiment was conducted, this reduction in violent behavior in teens
would have resulted in “benefits to society on the order of $22,900 for each family assigned to the
experimental group and $20,600 for the Section 8-only group” (Ludwig et al., 2005). The positive effects
of this experiment and others were also more likely to be seen in children younger than 13, possibly due
to disruption effects (Chetty et al., 2016; Chyn, 2018). Overall, these experiments revealed that the
significant, positive effects from vouchers can be seen for both adults and children.
There is less empirical research on the effects that affordable housing has on the quality of
education in the area (Dillman et al., 2017). Nonetheless, researchers hypothesize that absences and
turnover could decrease in schools located in distressed areas because students have more stability
when provided housing (Dillman et al., 2017). One study did find that standardized test scores improved
for fifth graders after affordable housing was built nearby (Di & Murdoch, 2013).
31

Policies and Practices
In order to increase the availability of housing and decrease its costs, certain policies and
practices must be in place. No one factor or practice can be used to develop affordable housing, and
the following solutions may only produce small effects due to how specific the characteristics of each
site or neighborhood are (Tillyer & Walter, 2019; Wood et al., 2020). Examples from Ogden, Utah and
other states provide a picture as to what affordable housing can look like.
Local Policies and Practices
One policy that has had an impact on affordable housing in the state of Utah was S.B. 34,
sponsored by Senator Anderegg and Representative Potter in the 2019 General Session. This bill
requires municipalities and local communities to create a housing plan, as well as implement three of
the 23 listed strategies to improve affordability (S.B. 34, Utah 2019). Utah cities lose transportation
funding if they fail to meet these requirements (Kiani et al., 2020). In their housing plans, the cities
must describe the following: the progress they have made at incorporating housing recommendations;
the number of housing units in the county that are below 80%, 50%, and 30% AMI; and their estimated
need for more moderate-income housing within the next five years (S.B. 34, Utah 2019). Kiani et al.
(2020) described multiple affordable housing practices in 10 cities from Utah. This list included
Ogden, though it was the only city from Weber County that the authors discussed. As of 2017, Ogden
participated in multiple best practices that met the standards provided by S.B. 34, including the
creation of a housing model (Kiani et al., 2020).
Like Kiani et al. (2020), Wood et al. (2020) provide a list of best practices that are currently
being used in Utah or could be used in the future. One of the most important factors mentioned in both
reports and other literature for building affordable housing is having flexible zoning (Eskic, 2021;
Freemark, 2020; Kiani et al., 2020; Tighe, 2012; Wood et al., 2020). Zoning first appeared in the early
1900s as a way to address residents’ concerns over tall buildings, as they believed high density
housing would make the city appear “unhealthy” and less “moral” (Ikeda & Washington, 2015; Nelson
et al., n.d.). However, zoning flexibility encourages high density developments, which improves
walkability and public transportation efficiency (Wood et al., 2020). In fact, the National Personal
Transportation Survey found that traffic decreased by 38% when high density developments were
built, as “denser households typically own fewer vehicles” (Eskic, 2021). Other factors such as land,
labor, and other costs are important, but because the housing shortage and affordability is a direct
result of policy, researchers believe that policy is the main way to address the problem (Tighe, 2012;
Wood et al., 2020). For example, the regulations on land use “determine the effectiveness of all best
practices” (Wood et al., 2020).
32

High density housing is one of the most effective ways to incorporate affordable housing through
flexible zoning because it provides more units in a smaller area. In other words, developers will pay the
same cost for the land but will be able to provide more units (Eskic, 2021). Additionally, preference for
multifamily units in Utah is growing, but zoning does not always reflect these preferences (Wood et al.,
2020). Ogden and other cities in Utah have updated their zoning code to allow higher density housing
or allow for looser requirements for some older homes (Kiani et al., 2020). High density housing can also
be beneficial for the surrounding neighborhood. In Salt Lake City, these types of developments have
resulted in higher property values (Eskic, 2021). The values of homes within half of a mile of the
developments increased by 10%, whereas homes that were farther away increased by 8.6% (Eskic,
2021).
Another practice Ogden and many other Utah cities participated in is TIF, or tax increment
financing (Collard, 2020; Kiani et al., 2020). According to a report from the Utah Foundation, Utah
jurisdictions are two times more likely than other jurisdictions to use TIF for economic development
(Collard, 2020). TIF is a stable, self-financing source of funding that encourages new developments
(Kiani et al., 2020; Wood et al., 2020). Property values and taxes are likely to increase when economic
development occurs. TIF is the process of putting the original property taxes back into the same projects
while putting the predicted excess taxes towards designated developments, such as affordable housing
(Collard, 2020; Kiani et al., 2020; Wood et al., 2020). According to Wood et al. (2020), this practice also
helps to prevent further gentrification and encourages public-private partnerships. Another upside to
TIF is that it is “relatively free of controversy in Utah,” but researchers recommend that developers
should still assess the policy considerations (Wood et al., 2020). If there is no strategy as to where the
additional funds will go, they can be transferred to the Olene Walker Fund (Wood et al., 2020).
In 2016, the city of Ogden adjusted its ordinances to allow for more accessory dwelling units, or
ADUs (Kiani et al., 2020). These units are smaller dwellings located on private property and tend to
provide rent at 58% of market value (Wood et al., 2020). These units are usually either basements,
smaller homes, or garage apartments (Kiani et al., 2020). These units can benefit both renters and
owners, as owners of the property will receive a new source of income and renters will pay lower rents
(Wood et al., 2020). Additionally, developing these units takes less time, costs less to build, and creates
fewer disturbances compared to other development types (Kiani et al., 2020; Wood et al., 2020).
Because they take up less than half of the square footage of some other developments, they are also
better for the environment (Wood et al., 2020). However, zoning can act as a hindrance if it restricts
factors of the ADU such as the floor size, parking area, and occupancy size (Wood et al., 2020).
33
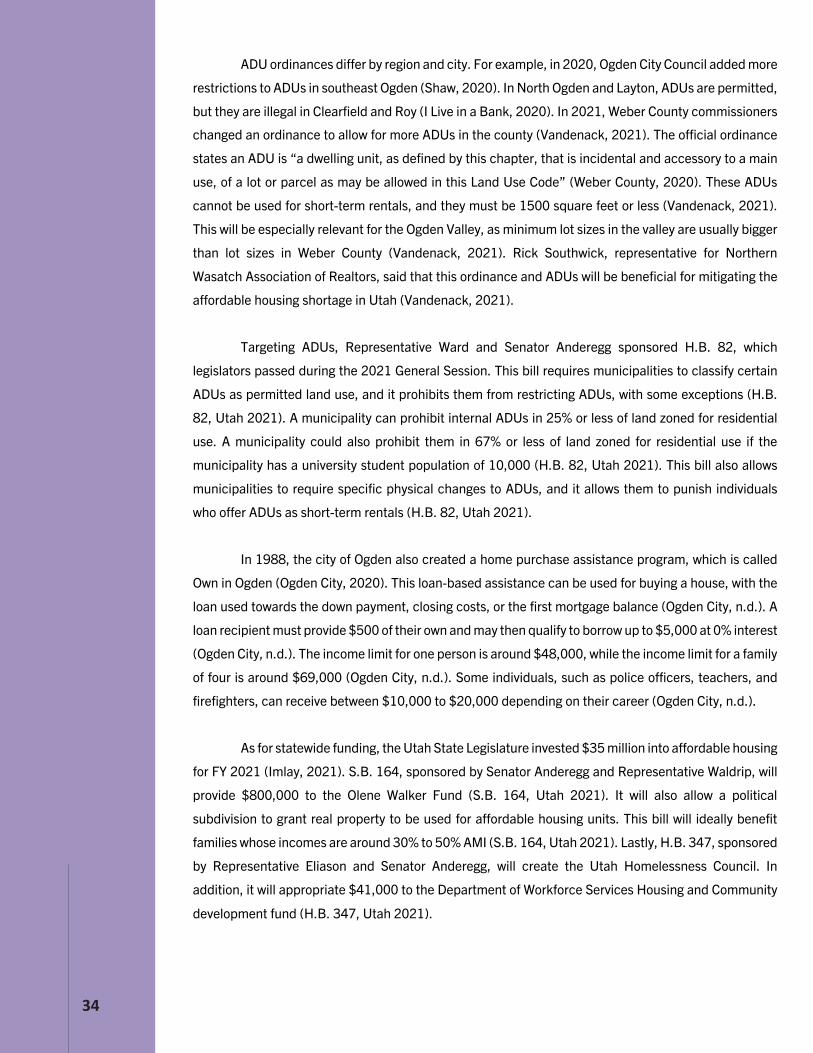
ADU ordinances differ by region and city. For example, in 2020, Ogden City Council added more
restrictions to ADUs in southeast Ogden (Shaw, 2020). In North Ogden and Layton, ADUs are permitted,
but they are illegal in Clearfield and Roy (I Live in a Bank, 2020). In 2021, Weber County commissioners
changed an ordinance to allow for more ADUs in the county (Vandenack, 2021). The official ordinance
states an ADU is “a dwelling unit, as defined by this chapter, that is incidental and accessory to a main
use, of a lot or parcel as may be allowed in this Land Use Code” (Weber County, 2020). These ADUs
cannot be used for short-term rentals, and they must be 1500 square feet or less (Vandenack, 2021).
This will be especially relevant for the Ogden Valley, as minimum lot sizes in the valley are usually bigger
than lot sizes in Weber County (Vandenack, 2021). Rick Southwick, representative for Northern
Wasatch Association of Realtors, said that this ordinance and ADUs will be beneficial for mitigating the
affordable housing shortage in Utah (Vandenack, 2021).
Targeting ADUs, Representative Ward and Senator Anderegg sponsored H.B. 82, which
legislators passed during the 2021 General Session. This bill requires municipalities to classify certain
ADUs as permitted land use, and it prohibits them from restricting ADUs, with some exceptions (H.B.
82, Utah 2021). A municipality can prohibit internal ADUs in 25% or less of land zoned for residential
use. A municipality could also prohibit them in 67% or less of land zoned for residential use if the
municipality has a university student population of 10,000 (H.B. 82, Utah 2021). This bill also allows
municipalities to require specific physical changes to ADUs, and it allows them to punish individuals
who offer ADUs as short-term rentals (H.B. 82, Utah 2021).
In 1988, the city of Ogden also created a home purchase assistance program, which is called
Own in Ogden (Ogden City, 2020). This loan-based assistance can be used for buying a house, with the
loan used towards the down payment, closing costs, or the first mortgage balance (Ogden City, n.d.). A
loan recipient must provide $500 of their own and may then qualify to borrow up to $5,000 at 0% interest
(Ogden City, n.d.). The income limit for one person is around $48,000, while the income limit for a family
of four is around $69,000 (Ogden City, n.d.). Some individuals, such as police officers, teachers, and
firefighters, can receive between $10,000 to $20,000 depending on their career (Ogden City, n.d.).
As for statewide funding, the Utah State Legislature invested $35 million into affordable housing
for FY 2021 (Imlay, 2021). S.B. 164, sponsored by Senator Anderegg and Representative Waldrip, will
provide $800,000 to the Olene Walker Fund (S.B. 164, Utah 2021). It will also allow a political
subdivision to grant real property to be used for affordable housing units. This bill will ideally benefit
families whose incomes are around 30% to 50% AMI (S.B. 164, Utah 2021). Lastly, H.B. 347, sponsored
by Representative Eliason and Senator Anderegg, will create the Utah Homelessness Council. In
addition, it will appropriate $41,000 to the Department of Workforce Services Housing and Community
development fund (H.B. 347, Utah 2021).
34

National Policies and Practices
Many jurisdictions around the country have created inclusionary housing programs (Kiani et
al., 2020; Wang & Balachandran, 2019). Only two Utah jurisdictions–Park City and Summit County–
have inclusionary housing programs (Kiani et al., 2020; Wang & Balachandran, 2019). The definition
of inclusionary housing varies by state but generally can be stated as “a set of local rules or a local
government initiative that encourages or requires the creation of affordable housing units, or the
payment of fees for affordable housing investments when new development occurs” (Wang &
Balachandran, 2019). Wang and Balachandran (2019) studied these policies in depth and found that
57% of these programs use upzoning. Upzoning, or zoning that allows denser or taller developments to
improve the stock of affordable housing, is also utilized in Ogden.
States that use inclusionary housing programs found that they provide “deeper affordability
by requiring affordable units created to be allocated across multiple income tiers, and/or offering
developers different options to serve lower-income residents” (Wang & Balachandran, 2019). Some of
the most common incentives for developers within these programs were density bonuses, fee
reductions or waivers, and expedited permitting (Kiani et al., 2020; Wang & Balachandran, 2019).
Statewide mandates made it easier to develop these programs, but the researchers emphasized the
importance of creating programs on a smaller, local level. This is due to the variability that exists in
each program, such as type, term, and income requirements (Wang & Balachandran, 2019). An
additional practice that some states are using is a form of rehabilitation. Cities in California, Virginia,
and Texas are updating zoning to reuse the lots from recently closed stores like Kmart or SHOPKO
(Wood et al., 2020). As of April 2021, Ogden City is planning to redevelop an area that contained a Rite
Aid on 26th and Monroe into an area that contains a variety of housing types, though it is unclear if this
will include affordable housing (Shaw, 2021).
Recommendations
There are many factors which municipalities, developers, and policymakers can consider
before building new affordable housing developments. Developers interested in building this type of
housing must “estimate the costs of both developing a property and maintaining it in decent condition
for up to a 50-year lifecycle” (HAND & RDA, 2019). To do this, they must look at multiple factors before
starting a new development, such as location, remediation, average unit size, project size, building
type, weather conditions, amenities, and market forces (HAND & RDA, 2019).
35

The MTO study illustrates the dilemma that can occur when trying to decide where to build new
affordable housing developments. While high-poverty areas can benefit from affordable housing due to
higher property values and lower crime rates, limiting affordable housing to these areas could have
negative impacts on the residents. Clustering low-income families in these areas can result in limited
access to jobs, failure in school, and poor health (Freedman & Owens, 2011, Leech, 2013). Because of
this, it could be beneficial to include affordable housing developments in a variety of neighborhoods (Woo
& Joh, 2015).
The SLC Housing and Neighborhood Development and the SLC Redevelopment Agency (2019)
have created a general guide for those interested in creating affordable housing:
1. Identify the population you want to serve and services you want to provide.
2. Work with a developer who has experience with building affordable housing, and create a
team that includes an architect, a contractor, legal help, financing help, and a tax-credit
investor.
3. Review zoning codes for an area and determine if any changes in zoning must occur.
4. Review what funding is available for the project and the deadlines for funding applications.
5. Contact private investors and other secondary financers, and apply for LIHTC.
6. Complete environmental and other reviews required for any approved funding.
7. Apply for permits and attend required commission and funding meetings.
8. Start construction and send reports to funders.
9. Complete construction and lease units.
10. Monitor property management to ensure they follow the funders’ and investors’ regulations.
The guide also provides a list of traditional and non-traditional financing options. These include
federal and state initiatives, as well as energy-efficient initiatives. While some of these financing options
are specific to Salt Lake City, many are available to all counties and cities in the state, including Weber
County and its cities. The full list and links to initiatives’ websites can be found at:
https://www.slc.gov/hand/wp-content/uploads/sites/12/2019/11/SLC-Affordable-Residential-
Developers-Guide-2019-v1.pdf
36

In a study that surveyed 51 affordable housing experts from across the world, Adabre and Chan
(2019) identified common critical success factors that experts found necessary for creating sustainable
affordable housing. One of the purposes of the study was to identify factors that policymakers can look
towards when implementing affordable housing plans (Adabre & Chan, 2019). Researchers identified
these housing experts by tracing and analyzing the experts’ specific titles, as well as their publications
related to affordable housing in “top tier journals” (Adabre & Chan, 2019). Over half of the experts were
from the academic sector, and 41% had over 20 years of experience with affordable housing (Adabre &
Chan, 2019). The 13 verbatim factors they found to be vital for creating sustainable affordable housing
are:
1. Mandatory inclusion of affordable unit policy in developer's projects
2. Access to low interest housing loan to developers
3. Incentives for developers to include affordable housing/sustainable designs
4. Improved supply of low cost developed land by government
5. Monitoring conditions/performance of completed houses
6. Governments' provision of housing subsidies to households
7. Adherence to project schedule
8. Adequate accessibility to social amenities
9. Good location for housing projects
10. Adequate infrastructure supply by government
11. Formulation of sound housing policies
12. Political will and commitment to affordable housing
13. Transparency in housing allocation
Policymakers and developers can look towards this guide and the Salt Lake City guide to
continue making progress towards affordable housing.
37

Conclusion
In conclusion, there are a variety of ways in which affordable housing can be funded and
developed. Available and affordable units are extremely needed in Weber County and Utah. Affordable
housing can provide individuals and families with better opportunities, incomes, and futures, and it
has the potential to improve property values and decrease crime rates in certain neighborhoods. The
claims that affordable housing increases crime and decreases property values are disputable, as few
studies could empirically and causally prove these claims. Ogden and the state of Utah have worked
diligently to address this housing crisis, but with the rising prices and the decreasing availability of
units, there is still a great deal of work to be done.
38

References Aaronson, D., Hartley, D., & Mazumder, B. (2020, August). The effects of the 1930s HOLC “Redlining” Maps
(Working Paper No. 2017-12). Federal Reserve Bank of Chicago.https://www.chicagofed.org/publications/working-papers/2017/wp2017-12
Adabre, M.A., & Chan, A.P.C. (2019). Critical success factors (CSFs) for sustainable affordable housing. Building and
Environment, 156, 203-214. https://doi.org/10.1016/j.buildenv.2019.04.030 Affordable Housing Online. (n.d.-a) Imagine Jefferson. https://affordablehousingonline.com/housing-
search/Utah/Ogden/Imagine-Jefferson/10099050 Affordable Housing Online. (n.d.-b) Liberty Junction Apartments. https://affordablehousingonline.com/housing-
search/Utah/Ogden/Liberty-Junction-Apartments/10064385 Affordable Housing Online. (2021). Weber Housing Authority. https://affordablehousingonline.com/housing-
authority/Utah/Weber-Housing-Authority/UT022 Agnew, R. (1992). Foundation for a general strain theory of crime and delinquency. Criminology, 30(1), 47-88.
https://doi.org/10.1111/j.1745-9125.1992.tb01093.x Ahrentzen, S. (2008). How does affordable housing affect surrounding property values? ASU Stardust Center.
https://s3-us-west-2.amazonaws.com/gios-web-img-docs/docs/stardust/housing-research-synthesis/research-brief.pdf
Albright, L., Derickson, E.S., & Massey, D.S. (2013). Do affordable housing projects harm suburban communities?
Crime, property values, and taxes in Mount Laurel, NJ. City Community, 12(2), 89-112. doi:10.1111/cico.12015
Baum-Snow, N., & Marion, J. (2009). The effects of low income housing tax credit developments on neighborhoods.
Journal of Public Economics, 93, 654-666. doi: 10.1016/j.jpubeco.2009.01.001 Bjerk, D. (2010). Thieves, thugs, and neighborhood poverty. Journal of Urban Economics, 68, 231-246.
doi:10.1016/j.jue.2010.06.002 Boustan, L. (2010). Was postwar suburbanization “white flight”? Evidence from the black migration. The Quarterly
Journal of Economics, 125(1), 417–443. https://doi.org/10.1162/qjec.2010.125.1.417 Boustan, L., & Margo, R.A. (2013, August). White suburbanization and African-American home ownership, 1940-
1980 (Working Paper No. 2017-12). National Bureau of Economic Research. DOI: 10.3386/w16702 Carlson, D., Haveman, R., Kaplan, T., & Wolfe, B. (2012). Long-term effects of public low-income housing vouchers
on neighborhood quality and household composition. Journal of Housing Economics, 21, 101-120. http://dx.doi.org/10.1016/j.jhe.2012.04.004
Center for Neighborhood Technology. (2017). About the index. H+T Index.
https://htaindex.cnt.org/about/#methodology Center for Neighborhood Technology. (2021). Municipality: Ogden, UT. H+T Index. https://htaindex.cnt.org/fact-
sheets/?lat=41.223&lng=-111.9738304&focus=place&gid=26514#fs
39

Chetty, R., Hendren, N., & Katz, L.F. (2016). The effects of exposure to better neighborhoods on children: New evidence from the Moving to Opportunity experiment. American Economic Review, 106(4), 855-902. DOI: 10.1257/aer.20150572
Chyn, E. (2018). Moved to opportunity: The long-run effects of public housing demolition on children. The American
Economic Review, 108(10), 3028-3056. https://doi.org/10.1257/aer.20161352 Collard, C. (2020, December). Insights on incentives: Optimizing local approaches to tax incentives in Utah. Utah
Foundation. https://www.utahfoundation.org/wp-content/uploads/782.pdf Congressional Research Service. (2021, January). An introduction to the low-income housing tax credit.
https://fas.org/sgp/crs/misc/RS22389.pdf Deng, L. (2011). Low-Income Housing Tax Credit developments and neighborhood change: A case study of Miami-
Dade County. Housing Studies, 26(6), 867-895. DOI: 10.1080/02673037.2011.593130 Desmond, M. (2012). Eviction and the reproduction of urban poverty. American Journal of Sociology, 118(1), 88-133.
https://doi.org/10.1086/666082 Di, W., & Murdoch, J.C. (2013). The impact of the low income housing tax credit program on local schools. Journal of
Housing Economics, 22(4), 308-320. https://doi.org/10.1016/j.jhe.2013.10.002 Diamond, R., & McQuade, T. (2019). Who wants affordable housing in their backyard? An equilibrium analysis of low-
income property development. Journal of Political Economy, 127(3), 1063-1117.https://www.journals.uchicago.edu/doi/abs/10.1086/701354
Dillman, K., Horn, K.M., Verrilli, A. (2017). The what, where, and when of place-based housing policy’s neighborhood
effects. Housing Policy Debate, 27(2), 282-305. http://dx.doi.org/10.1080/10511482.2016.1172103 Einstein, K.L., Palmer, M., & Glick, D. (2018). Who participates in local government? Evidence from meeting minutes.
Perspectives on Politics, 27(1), 28-46. doi:10.1017/S153759271800213X Ellen, I.G., Schwartz, A.E., Voicu, I & Schill, M.H. (2007). Does federally subsidized rental housing depress
neighborhood property values? Journal of Policy Analysis and Management, 26(2), 257-280. https://doi.org/10.1002/pam.20247
Ellen, I.G., Lens, M.C., & O’Regan, K. (2012). American murder mystery revisited: Do housing voucher households
cause crime? Housing Policy Debate, 22(4), 551-572. https://doi.org/10.1080/10511482.2012.697913 Emrath, P. (2021, April 28). Higher lumber costs add more than $35K to new home prices, $119 to monthly rent.
National Association of Home Builders. https://eyeonhousing.org/2021/04/higher-lumber-costs-add-more-than-35k-to-new-home-prices-119-to-monthly-rent/
Eskic, D. (2021, February). The impact of high-density apartments on surrounding single-family home values in
suburban Salt Lake County. Kem C. Gardner Policy Institute. https://gardner.utah.edu/wp-content/uploads/HighDensity-Feb2021.pdf
Federal Reserve Board. (n.d.). Fair Housing Act.
https://www.federalreserve.gov/boarddocs/supmanual/cch/fair_lend_fhact.pdf Fischer, W., Acosta, S., & Gartland, E. (2021, May 13). More housing vouchers: Most important step to help more
people afford stable homes. Center on Budget and Policy Priorities. https://www.cbpp.org/sites/default/files/4-14-21hous.pdf
40

Freedman, M., & Owens, G.B. (2011). Low-income housing development and crime. Journal of Urban Economics, 70(2-3), 115-131. doi:10.1016/j.jue.2011.04.001
Freemark, Y. (2020). Upzoning Chicago: Impacts of a zoning reform on property values and housing construction.
Urban Affairs Review, 56(3), 758-789. DOI: 10.1177/1078087418824672 Gourevitch, R., Greene, S., & Pendall, R. (2018, June). Place and opportunity: Using federal fair housing data to
examine opportunity across US regions and populations. Urban Institute. https://www.urban.org/research/publication/place-and-opportunity-using-federal-fair-housing-data-examine-opportunity-across-us-regions-and-populations
Griffiths, E., & Tita, G. (2009). Homicide in and around public housing: Is public housing a hotbed, a magnet, or a
generator of violence for the surrounding community? Social Problems, 56(3), 474-493. https://doi.org/10.1525/sp.2009.56.3.474
Gubits, D., Shinn, M., Wood, M., Bell, S., Dastrup, S., Solari, C.D., Brown, S.R., McInnis, D., McCall, T., & Kattel, U.
(2016). Family Options Study: 3-year impacts of housing and services interventions for homeless families. U.S. Department of Housing and Urban Development. https://www.huduser.gov/portal/sites/default/files/pdf/FamilyOptionsStudySummaryReport.pdf
H.B. 82, 2021 Gen. Sess. (Utah 2021). https://le.utah.gov/~2021/bills/static/HB0082.html H.B. 347, 2021 Gen. Sess. (Utah 2021). https://le.utah.gov/~2021/bills/static/HB0347.html Hipp, J.R. and Yates, D.K. (2011). Ghettos, thresholds, and crime: Does concentrated poverty really have an
accelerating increasing effect on crime? Criminology, 49(4), 955-990. https://doi-org.hal.weber.edu/10.1111/j.1745-9125.2011.00249.x
Housing and Neighborhood Development, & The Redevelopment Agency. (2019). Building affordable in Salt Lake
City: An affordable residential development guide. https://www.slc.gov/hand/wp-content/uploads/sites/12/2019/11/SLC-Affordable-Residential-Developers-Guide-2019-v1.pdf
I Live in a Bank. (2020, February 18). Wasatch Front city ADU status. https://iliveinabank.com/wp-
content/uploads/2020/02/Wasatch-Front-City-ADU-Status-List-2.18.2020.pdf Ikeda, S., & Washington, E. (2015, November). How land-use regulation undermines affordable housing. Mercatus
Center. https://www.mercatus.org/system/files/Ikeda-Land-Use-Regulation.pdf Imagine Jefferson [Online image]. (n.d.). Evergreene Management Group. https://www.emg-
apts.com/imagine_jefferson.htm Imlay, A. (2021, March 2). Utah affordable housing advocates celebrate $35M earmarked by Legislature. Deseret
News. https://www.deseret.com/utah/2021/3/2/22307604/2021-legislature-advocates-celebrate-legislature-earmark-35-million-affordable-housing
Ioannides, Y.M. (2017). Review of Climbing Mount Laurel: The Struggle for Affordable Housing and Social Mobility in
an American Suburb by Douglas S. Massey et al. Journal of Economic Literature, 55(2), 609-620. https://doi. org/10.1257/jel.20151292
Kiani, F.N., Dillon, A., Choi, D., Kim, J., & Siddiq, F. (2020, May). Affordable housing strategies: State-of-the-practice
in ten Utah cities. Utah Housing Coalition. https://www.utahhousing.org/uploads/2/6/4/4/26444747/affordable_housing_guide_20200720.ss.pdf
41

Kim, K., & Garcia, I. (2019). Why do homeless families exit and return the homeless shelter? Factors affecting the risk of family homelessness in Salt Lake County (Utah, United States) as a case study. International Journal of Environmental Research and Public Health, 16(22), 1-23. doi:10.3390/ijerph16224328
Leech, T.G.J. (2013). Violence among young adults receiving housing assistance: Vouchers, race, and transitions into
adulthood. Housing Policy Debate, 23(3), 543-558. DOI: 10.1080/10511482.2013.800129 Lens, M.C., Ellen, I.G., & O’Regan, K. (2011, February). Neighborhood crime exposure among Housing Choice
Voucher households. HUD Office of Policy Development and Research. https://www.huduser.gov/publications/pdf/lens_neighborhoodcrime_assistedhousingrcr08.pdf
Lens, M.C. (2013). Safe, but could be safer: Why do HCVP households live in higher crime neighborhoods? Cityscape,
15(3), 131-152. https://www.jstor.org/stable/26326834?seq=1 Liberty Junction Apartments [Online image]. (n.d.). Apartments.com. https://www.apartments.com/liberty-junction-
ogden-ut/6ehs3tt/ Ludwig, J., Duncan, G.J., & Pinkston, J.C. (2005). Housing mobility programs and economic self-sufficiency: Evidence
from a randomized experiment. Journal of Public Economics, 89, 131-156 doi:10.1016/j.jpubeco.2003.07.010
Medina, R.M., Byrne, K., Brewer, S., & Nicolosi, E.A. (2020). Housing inequalities: Eviction patterns in Salt Lake
County, Utah. Cities, 104, 1-9. https://doi.org/10.1016/j.cities.2020.102804 Merton, R.K. (1938). Social structure and anomie. American Sociological Review, 3(5), 672-682.
https://doi.org/10.2307/2084686 Michney, T.M. (2007). Constrained communities: Black Cleveland's experience with World War II public housing.
Journal of Social History, 40(4), 933-956. link.gale.com/apps/doc/A166433591/WHIC?u=ogde72764&sid=WHIC&xid=f7f2423c
Mohammed, I., Hosen, M., & Mohammad Ashraful, F. C. (2018). Does poverty lead to crime? Evidence from the
United States of America. International Journal of Social Economics, 45(10), 1424-1438. DOI:10.1108/IJSE-04-2017-0167
Mukherjee, K. (2015). Poverty as a cause and consequence of ill health. International Journal of Epidemiologic
Research, 2(4), 209-220. http://ijer.skums.ac.ir/article_14606.html National Association of Home Builders. (2021, April 30). Skyrocketing lumber prices add nearly $36,000 to the price
of a new home. https://nahbnow.com/2021/04/skyrocketing-lumber-prices-add-nearly-36000-to-the-price-of-a-new-home/
National Bureau of Economic Research. (2012). Moving to Opportunity. https://www.nber.org/programs-
projects/projects-and-centers/moving-opportunity?page=1&perPage=50 National Housing Law Project. (n.d.). Low-income housing tax credits. https://www.nhlp.org/resource-center/low-
income-housing-tax-credits/ National Housing Law Project. (2018, April 27). LIHTC admissions, rents, and grievance procedures.
https://www.nhlp.org/resources/lihtc-admissions-rents-grievance-procedures/ National Low Income Housing Coalition. (n.d.). Income targeting and expenditures for major housing
https://nlihc.org/sites/default/files/AG-2019/01-05_Income-Targeting.pdf
42

National Low Income Housing Coalition. (2019, October 17). Public housing history. https://nlihc.org/resource/public-housing-history
Nelson, R.K., & Ayers, E.L., (n.d.). Not even past: Social vulnerability and the legacy of redlining. University of
Richmond. https://dsl.richmond.edu/socialvulnerability/map/#loc=13/41.239/-111.995&city=ogden-ut Nelson, R.K., Winling, L., Marciano, R., & Connolly, N. (n.d.). Mapping inequality: Redlining in New Deal America.
University of Richmond. https://dsl.richmond.edu/panorama/redlining/#loc=5/39.1/-94.58 Nguyen, M.T. (2005). Does affordable housing detrimentally affect property values? A review of the literature. Journal
of Planning Literature, 20(1), 15-26. DOI: 10.1177/0885412205277069 Nguyen, Q.C., Acevedo-Garcia, D., Schmidt, N.M. & Osypuk, T.L. (2017). The effects of a housing mobility
experiment on participants’ residential environments. Housing Policy Debate, 27(3), 419-448. http://dx.doi.org/10.1080/10511482.2016.1245210
Office of Policy Development and Research. (n.d.). American housing survey reveals rise in doubled-up households
during recession. U.S. Department of Housing and Urban Development. https://www.huduser.gov/portal/pdredge/pdr_edge_research_012714.html
Office of Policy Development and Research. (2020). Picture of subsidized households. U.S. Department of Housing
and Urban Development. https://www.huduser.gov/portal/datasets/assthsg.html#2009-2020_query Ogden City. (n.d.). Own in Ogden. https://www.ogdencity.com/259/Own-in-Ogden Ogden City. (2020, April 21). Ogden City Council work session: April 21, 2020.
https://www.ogdencity.com/DocumentCenter/View/12367/04-21-20--OIO-Program-changes-2020-WS-Report#:~:text=1988%20The%20Own%20in%20Ogden,be%20repaid%20by%20the%20borrower
Ogden Housing Authority. (n.d.) Waiting lists. https://ogdenha.org/content/waiting-lists Opportunity Starts at Home. (2020, June 1). Public opinion polling on housing instability during the COVID-19
pandemic. https://www.opportunityhome.org/wp-content/uploads/2020/05/FINAL-COVID19-Poll-Fact-Sheet-002.pdf
Orlebeke, C.J. (2000). The evolution of low-income housing policy, 1949 to 1999. Housing Policy Debate, 11(2), 489-
520. https://doi.org/10.1080/10511482.2000.9521375 Pare, P., and Felson, R. (2014). Income inequality, poverty and crime across nations. The British Journal of Sociology,
65(3), 434-458. https://doi-org.hal.weber.edu/10.1111/1468-4446.12083 Purdy, S., & Kwak, N.H. (2007). New perspectives on public housing histories in the Americas. Journal of Urban
History, 33(3), 357-374. DOI: 10.1177/0096144206297128 S.B. 164, 2021 Gen. Sess. (Utah 2021). https://le.utah.gov/~2021/bills/static/SB0164.html S.B. 34, 2019 Gen. Sess. (Utah 2019). https://le.utah.gov/~2019/bills/static/SB0034.html Scally, C.P. (2012). The nuances of NIMBY: Context and perceptions of affordable rental housing development.
Urban Affairs Review, 49(5), 718-747. DOI: 10.1177/1078087412469341 Schill, M.H., & Wachter, S.M. (1995). The spatial bias of federal housing law and policy: concentrated poverty in
urban America. University of Pennsylvania Law Review, 143(5), 1285-1342. https://link.gale.com/apps/doc/A17237442/AONE?u=ogde72764&sid=AONE&xid=454a724a
43

Semuels, A. (2015, September 22). The power of public housing. The Atlantic. https://www.theatlantic.com/business/archive/2015/09/public-housing-success/406561/
Shaw, M. (2020, August 12). Council approves community plan for southeast Ogden, will hash out housing concerns
later. Standard-Examiner. https://www.standard.net/news/government/council-approves-community-plan-for-southeast-ogden-will-hash-out-housing-concerns-later/article_3ee80940-5ffa-5683-b9ef-39e5f94ce37e.html
Shaw, M. (2021, January 10). Ogden City will buy property on the ‘Rite Aid’ block, but environmental work needed
ahead of any construction. Standard-Examiner. https://www.standard.net/news/ogden-city-will-buy-property-on-rite-aid-block-but-environmental-work-needed-ahead-of/article_d231273d-3825-5cef-9875-c772c5289f06.html
Tighe, J. R. (2012). How race and class stereotyping shapes attitudes toward affordable housing. Housing Studies,
27(7), 962-983. DOI: 10.1080/02673037.2012.725831 Tillyer, M.S., & Walter, R.J. (2019). Low-income housing and crime: The influence of housing development and
neighborhood characteristics. Crime & Delinquency, 65(7), 969-993. DOI: 10.1177/0011128718794185 U.S. Census Bureau. (2014a). Selected housing characteristics: Utah.
https://data.census.gov/cedsci/table?q=grapi&g=0400000US49&tid=ACSDP1Y2014.DP04&hidePreview=true&moe=false
U.S. Census Bureau. (2014b). Selected housing characteristics: Weber County, Utah.
https://data.census.gov/cedsci/table?q=grapi&g=0500000US49057&tid=ACSDP1Y2014.DP04&hidePreview=true&moe=false
U.S. Census Bureau. (2019a). Selected housing characteristics: Utah.
https://data.census.gov/cedsci/table?q=grapi&g=0400000US49&tid=ACSDP1Y2019.DP04&hidePreview=true&moe=false
U.S. Census Bureau. (2019b). Selected housing characteristics: Weber County, Utah.
https://data.census.gov/cedsci/table?text=DP04&g=0400000US49_0500000US49057&tid=ACSDP1Y2019.DP04&moe=false&hidePreview=true
U.S. Department of Housing and Urban Development. (n.d.-a). Guidance on complying with the maximum number of
units eligible for Operating Subsidy pursuant to Section 9(g)(3)(A) of the Housing Act of 1937 (aka the Faircloth Limit). https://www.hud.gov/sites/documents/FRCLTH-LMT.PDF
U.S. Department of Housing and Urban Development. (n.d.-b). HUD’s public housing program.
https://www.hud.gov/topics/rental_assistance/phprog U.S. Department of Housing and Urban Development. (2004, October). HOPE VI demolition grants: FY 1996 - 2003.
https://www.hud.gov/sites/documents/DOC_9890.PDF U.S. Department of Housing and Urban Development. (2012). Public housing timeline, 1933-1993. Journal of the
American Planning Association, 78(4), 359. https://doi.org/10.1080/01944363.2012.738167 U.S. Department of Housing and Urban Development. (2017, June 30). Maximum number of units eligible for Capital
and Operating Subsidy (also known as the Faircloth Limit). https://www.hud.gov/sites/dfiles/PIH/documents/CY17-Faircloth-Limit-List.pdf
U.S. Department of Housing and Urban Development. (2021-a). FY 2021 income limits summary.
https://www.huduser.gov/portal/datasets/il/il2021/2021summary.odn
44

U.S. Department of Housing and Urban Development. (2021-b). The FY 2021 FMRs for all bedroom sizes. https://www.huduser.gov/portal/datasets/fmr/fmrs/FY2021_code/2021summary.odn
Utah Association of Realtors. (2021, May). Real estate statistics.
https://utahrealtors.com/consumers/resources/statistics/ Utah Foundation (2018, October). What’s the view from your house? Affordability concerns in Utah.
https://www.utahfoundation.org/wp-content/uploads/rr758.pdf Utah Housing and Community Development Division. (2020). State of Utah: Affordable housing report. Department of
Workforce Services. https://jobs.utah.gov/housing/reports/documents/affordablehousingreport.pdf Vandenack, T. (2021, January 10). Weber County change could bolster affordable housing options, boosters say.
Standard-Examiner. https://www.standard.net/news/government/weber-county-change-could-bolster-affordable-housing-options-boosters-say/article_17e4ce0d-54be-5bda-ad73-7bdae6fdfc95.html
Vale, L. (2012, February). Housing Chicago: Cabrini-Green to Parkside of Old Town. Places Journal.
https://placesjournal.org/article/housing-chicago-cabrini-green-to-parkside-of-old-town/?cn-reloaded=1 Vitner, M., Dougherty, C., & Cervi, N. (2021, May 7). What's driving the sharp rise in lumber prices? Stronger
economic growth worsens supply-chain challenges. Wells Fargo. https://wellsfargo.bluematrix.com/docs/html/1776e7f0-bae4-4963-897b-441ae870972b.html
Voegeli, W. (2018). Public housing’s most notorious failure. City Journal. https://www.city-journal.org/html/cabrini-
green-homes-16037.html Votruba, M.E., & Kling, J.R. (2009). Effects of neighborhood characteristics on the mortality of black male youth:
Evidence from Gautreaux, Chicago. Social Science & Medicine, 68(5), 814-823. DOI: 10.1016/j.socscimed.2008.12.018
Wagstaff, A. (2002). Poverty and health sector inequalities. Bulletin of the World Health Organization, 80(2), 97-105.
https://pubmed.ncbi.nlm.nih.gov/11953787/ Wang, M. (2017, May 3). The many failures of the New York City Housing Authority. Pacific Standard.
https://psmag.com/news/the-many-failures-of-the-new-york-city-housing-authority Wang, R., & Balachandran, S. (2019). Inclusionary housing in the United States: Prevalence, practices, and
production in local jurisdictions as of 2019. Grounded Solutions Network. https://groundedsolutions.org/sites/default/files/2021-01/Inclusionary_Housing_US_v1_0.pdf
Warren, E.J., & Font, S.A. (2015). Housing insecurity, maternal stress, and child maltreatment: An application of the
family stress model. Social Science Review, 89(1), 9-39. https://doi.org/10.1086/680043 Weber County. (2020). Weber County Ordinance 2020-27: Accessory dwelling unit regulations. https://s3-us-west-
2.amazonaws.com/municipalcodeonline.com-new/weber/ordinances/pdf/Ord_2020-27.pdf Winter, E. (2021, January). Voters want a public option for broadband, child care and housing: Likely voters also favor
massive public investments in infrastructure. Data for Progress. https://www.filesforprogress.org/memos/public-option-for-broadband-child-care-housing.pdf
Woo, A., & Joh, K. (2015). Beyond anecdotal evidence: Do subsidized housing developments increase neighborhood
crime? Applied Geography, 64, 87-96. https://doi.org/10.1016/j.apgeog.2015.09.004
45

Woo, A., Joh, K., & Van Zandt, S. (2015). Unpacking the impacts of the Low-Income Housing Tax Credit program on nearby property values. Urban Studies, 53(12), 2488-2510. DOI: 10.1177/0042098015593448
Wood, J., Eskic, D., Benway, D., Macdonald-Poelman, K. (2020, November). Housing affordability: What are best
practices and why are they important? Kem C. Gardner Policy Institute. https://gardner.utah.edu/wp-content/uploads/Best-Practices-Dec2020.pdf
46