Embed Size (px)
Citation preview

636.2.082.455/.456 :S91.147.8
MEDEDELINGEN LANDBOUWHOGESCHOOL WAGENINGEN • NEDERLAND • 70-12 (1970)
OESTROGEN EXCRETION BY THE PREGNANT BOVINE AND ITS RELATION
WITH SOME CHARACTERS OF GESTATION AND PARTURITION
A. OSINGA
Department of Animal Husbandry, State Agricultural University, Wageningen, The Netherlands
(Received 14-VIII-1970)
H. VEENMAN & ZONEN N.V. - WAGENINGEN - 1970

Mededelingen Landbouwhogeschool Wageningen 70-12 (1970)
(Communications Agricultural University) is also published as a thesis
CONTENTS
1. INTRODUCTION 1
2. REVIEW OF LITERATURE 2 2.1. Factors affecting gestation length and parturition characters 2 2.1.1. Factors affecting gestation length 2 2.1.1.1. The foetal organism 2 2.1.1.1.1. Foetal genotype 2 2.1.1.1.2. Foetal abberations 2 2.1.1.2. The maternal organism 3 2.1.1.3. Month of calving 3 2.1.1.4. Twin births 3 2.1.2. Factors affecting birth weight 3 2.1.3. Factors affecting the incidence of stillbirths and the ease of calving . . . 4 2.2. Progesterone and oestrogen during pregnancy 4 2.2.1. Progesterone and oestrogen in maternal and foetal circulation . . . . 4 2.2.2. Excretion of progesterone in the human and the cow 5 2.2.3. Oestrogens in humans and domestic animals 5 2.2.4. Possible functions of progesterone and oestrogen during gestation and
parturition 7
3. THE QUANTITATIVE CHEMICAL ESTIMATION OF OESTROGENS IN BOVINE PREGNANCY URINE 8 3.1. The estimation of the concentration of oestradiol-17a and oestrone . . 8 3.1.1. Introduction 8 3.1.2. Material and methods 9 3.1.2.1. Urine sampling 9 3.1.2.2. Chemicals 9 3.1.3. Method in detail 9 3.1.4. Séphadex-gel filtration 11 3.1.5. Enzymatic versus acid hydrolysis 12 3.1.6. The oestriol fraction in bovine pregnancy urine 13 3.2. The estimation of the oestrogen/creatinine ratio in bovine pregnancy
urine 14 3.2.1. Introduction 14 3.2.2. The estimation of the creatinine content in urine 14 3.2.2.1. Material and methods 15 3.2.2.2. Creatinine analysis, modified after Folin (1914) 15 3.2.2.3. Creatinine analysis after Edwards and Whyte (1958) 15 3.2.2.4. Results of comparison of both methods 15 3.2.2.5. Conclusions and discussion 15 3.2.3. The variation in the urinary creatinine excretion within cows 16 3.2.3.1. Material and methods 16 3.2.3.2. Results 17 3.2.3.2.1. The daily urine output 17 3.2.3.2.2. The creatine concentration 18 3.2.3.2.3. The daily creatinine output 18 3.2.3.2.4. Correlations 18 3.2.3.3. Discussion 19 3.3. Reliability of the method for oestrogen 19 3.3.1. Specificity 19 3.3.1.1. Introduction 19 3.3.1.2. The oestradiol-17a fraction 20
3.3.1.3. Characteristics of the oestrone fraction 20 3.3.1.4. The Kober-reacting constituents of the urinary oestrone fraction . . . 21 3.3.2. Precision 22 3.3.3. Accuracy as determined by recovery tests 23 3.3.4. Applicability 26 3.4. General discussion 26
4. PRELIMINARY EXPERIMENTS FOR STUDYING THE TOTAL INDIVIDUAL VARIATION IN THE QUANTITATIVE URINARY OESTROGEN EXCRETION DURING PREGNANCY 28 4.1. Introduction 28 4.2. Experiment I (1966/1967) 28 4.2.1. Material and methods 28 4.2.1.1. Material 28 4.2.1.2. Methods 29 4.2.2. Results 29 4.3. Experiment II (1967/1968) 30 4.3.1. Material and methods 30 4.3.1.1. Material 30 4.3.1.2. Methods 30 4.3.2. Results 31 4.3.2.1. Influence of stage of gestation 31 4.3.2.2. Differences between experimental farms 31 4.3.2.3. Influence of month of calving 32 4.3.2.4. Influence of birthweight of calf 35 4.3.2.5. Relationship with calf's sex 36 4.3.2.6. Crossbred versus pure bred calves 36 4.3.2.7. The relationship with other characters 37 4.4. Some integrated results of experiments I and II 37 4.4.1. Genetic influences on the oestrogen excretion rate 37 4.4.1.1. Heritability estimates 37 4.4.1.2. Differences within cows between foetuses of two consecutive years . . 38 4.4.2. Abnormal oestrogen excretion rates as related to abnormal gestations . 40 4.4.2.1. Twin pregnancies 40 4.4.2.2. A mummified calf 41 4.5. Discussion 42
5. THE DIURNAL VARIATION IN BOVINE URINARY OESTROGEN EXCRETION DURING LATE PREGNANCY 45 5.1. Introduction 45 5.2. Experimental procedures 45 5.3. Results 47 5.4. Discussion 49
6. THE VARIATION IN THE URINARY OESTROGEN EXCRETION BEFORE, DURING AND AFTER PARTURITION IN FLUMETHASONE TREATED AND NON-TREATED COWS 52 6.1. Introduction 52 6.2. Material and methods 52 6.3. Results 52 6.3.1. The changes in urinary oestrogen excretion level during the last pre-
partum days 52 6.3.2. The urinary oestrogen level during parturition 54 6.3.3. The urinary oestrogen excretion after parturition 54 6.4. Discussion 56

7. INDIVIDUAL VARIATIONS DUE TO THE EXCRETION OF OESTROGENS IN FAECES 58 7.1. Introduction 58 7.2. The analytical method 58 7.2.1. Materials 59 7.2.2. Hydrolysis 59 7.2.3. Aether extraction 60 7.2.4. Séphadex-gel filtration 60 7.2.5. Adjustment to the analytical method for urine 60 7.2.6. Reliability of the method 60 7.2.6.1. Accuracy 60 7.2.6.2. Specificity 60 7.3. A comparison between the faecal and urinary oestrogen excretion rate
in late pregnant cows 61 7.3.1. Material and methods 61 7.3.2. Results 62 7.3.2.1. Precision of the methods, as calculated from duplicate analysis . . . . 62 7.3.2.2. The excretion of oestradiol-17a in faeces and in urine 64 7.3.2.3. The ratio between faecal and urinary oestradiol-17a excretion 64 7.3.2.4. The ratio between faecal oestradiol-17a excretion and total urinary
oestrogen excretion 65 7.4. Discussion 66
8. THE INFLUENCE OF THE SIRE OF THE CALF ON THE URINARY OESTROGEN EXCRETION RATE FROM COWS AT 260 DAYS OF PREGNANCY, AS RELATED TO EASE OF CALVING 67 8.1. Introduction 67 8.2. Description of the material 67 8.3. Results 69 8.3.1. Twin calves 69 8.3.2. Differences between sires 69 8.3.3. Influence of different birth characters 69 8.3.4. Heritability estimates 71 8.4. Discussion 71
9. THE INFLUENCE OF SIRES OF THE CHAROLAIS BREED ON THE URINARY OESTROGEN EXCRETION RATE IN IDENTICAL FRIESIAN TWINS 73 9.1. Introduction 73 9.2. Materials and methods 73 9.3. Results 74 9.3.1. Birth characters 74 9.3.2. Analytical error 75 9.3.3. Oestrogen/crefctinine ratios 77 9.4. Discussion 78
10. CONCLUSIONS 79
11. SUMMARY 81
SAMENVATTING 83
12. LIST OF REFERENCES 85

1. I N T R O D U C T I O N
Several factors may cause variation in foetal development, gestation and parturition. Failures to produce viable calves may be caused by mortality, abortions, difficult births and stillbirths.
In most instances however, the mode of action and the physiological mechanisms involved are unknown.
Statistical studies from A.I.-data (VAN DIETEN, 1963; POLITIEK, 1963; STEGENGA, 1964a, b , c; SMIDT et al, 1968) show foetal-maternal interactions with respect to gestation period, birth weight, difficult births and stillbirths. These studies indicate that the length of gestation, the birthweight and the ease of calving is partially determined by the foetus. On the basis of these studies one could even postulate that the initiation of parturition is due to the foetus. The first foetal signal to the mother to start labour can either be active or permissive. This hypothesis also suggests that the foetal organism can influence a t least part of the maternal system (OSINGA, 1969).
This study was undertaken to establish the relationship of these foetal influences and the maternal system. It was postulated that individual differences in levels of circulating and excreted hormones (particularly those produced by foetal tissues during mid and late pregnancy) could explain some of the individual differences in gestation length, birth weight, stillbirths and ease of calving.
Several authors (GORSKI and ERB , 1959; DICZFALUSY and LAURITZEN, 1961 ;
FRANDSEN and STAKEMAN, 1963) have indicated that the major par t of urinary oestrogens, in the bovine as well as in the human, during mid and late pregnancy, is of placental origin. FRANDSEN and STAKEMAN (1963) postulated that the placenta uses steroidal precursors originating from the foetal adrenals.
During gestation two important temporary, active organs develop: the corpus luteum as an endocrine organ and the placenta as a nutritive, excretory, endocrine and protective organ. Another small temporary organ, the foetal zone of the adrenal cortex, develops in the foetal adrenal.
Meded. Landbouwhogeschool Wageningen 70-12 (1970)

2. REVIEW OF L I T E R A T U R E
2.1. FACTORS AFFECTING GESTATION LENGTH AND PARTURITION
CHARACTERS
2.1.1. Factors affecting gestation length 2.1.1.1. The foetal organism 2.1.1.1.1. Foetal genotype
KORTSTEE (1963) and BANERJEE-SCHOTSMAN (1964), found significant differences in average gestation lengths between calf groups of different sires. The maximum difference KORTSTEE observed between sires was 8.5 days in the Dutch Red and White and 8.2 days in the Friesian breed. Both investigators also established a relationship between the length of the gestation period of the sire himself and the length of the gestation period of his calves.
The part of the total variance in gestation length, due to additive genetic differences between calves, is about 30%. KORTSTEE (1963) estimated it to be 28.0% for the Red and White breed and 26.8% for the Friesian breed. JAFAR et al (1950) estimated it to be 32% and RENDEL (1959) 26%.
JAFAR et al (1950) concluded, that the calf genotype, including dominance deviations and sex influence, is responsible for 77 % of the variation in gestation length. The literature review by BANERJEE-SCHOTSMAN (1964) shows many investigators working in this field but studies with sufficient data are limited. However, most authors agree that the calf's genotype influences the length of the gestation period.
BRAKEL et al (1952) wondered what mechanism from the sire could affect the gestation period of his offspring. Initiation and inhibition of parturition is hormonally controlled. The foetal portion of the placenta probably has hormonal functions either related to the inhibition or initiation of parturition. This foetal placenta may be the mediating organ in the influence of the foetus on gestation length.
The influence of the calf's genotype on the length of gestation is also indicated by the observations of RIFE (1950), GERLAUGH et al (1951) and JOUBERT and BONSMA (1959). They observed that cross bred calves are carried for a period which is intermediate between the average gestation periods of the parent breeds.
From literature it is wellknown that male calves are carried 1-2 days longer than female calves (KORTSTEE, 1963).
Summarizing the data from literature it seems rather clear that gestation length is mainly determined by the foetal genotype. It may, therefore, be postulated that the initiation of parturition originates from an unknown foetal agent.
2.1.1.1.2. Foetal aberrations
In 1969, OSINGA summarized the literature concerning pregnancy and
2 Meded. Landbouwhogeschool Wageningen 70-12 (1970)

parturition as related to malformations of the foetal pituitary and foetal adrenal cortex.
In prolonged pregnancies in women (anencephalic foetus), cows and sheep (caused in sheep by veratrum-californicum) the pituitaries and adrenals are absent or only rudiments are present in the foetuses.
I t is possible to prolong gestation in sheep artificially by removing the foetal pituitary or the foetal adrenal (LIGGINS et al, 1967; DROST and HOLM, 1968).
LIGGINS (1968) induced parturition in sheep by intra uterine administration of Cortisol and ACTH to the foetus.
ADAMS and WAGNER (1969) and OSINGA, STEGENGA and JÖCHLE (1970)
induced parturition in cows by parenteral administration of a synthetic corticosteroid to the mother.
VAN RENSBURG (1965) postulated that the habitual abortions in Angora goats were due to adrenal hyperplasia of both mother and foetus.
It is evident from these data that the mechanism of the initiation of parturition originates from the foetus.
2.1.1.2. T h e m a t e r n a l o r g a n i s m
KORTSTEE (1963) and BANERJEE-SCHOTSMAN (1964) found a significant effect of the parity of the cow on gestation length. The largest difference is found between first and second parity (1 -2 days). WILCOX and ROY (1968) found, in 1304 single parturitions, no influence of parity on gestation length.
Administration of teratogenic agents (Veratrum californicum) and synthetic corticosteroids to the dams influence also the gestation period but are discussed elsewhere in this review.
2.1.1.3. M o n t h of c a l v i n g
It appears that in the Netherlands the gestation period varies from month to month. KORTSTEE (1963) and BANERJEE-SCHOTSMAN (1964) both indicate that calves born in August and September are carried for a significantly shorter period than calves born from October to January.
Literature from other countries do not always confirm these Dutch studies (reviews of KORTSTEE, 1963 and BANERJEE-SCHOTSMAN, 1964).
DICKINSON (1961) reported short gestations in April and late summer and long gestations in May and autumn.
2.1.1.4. T w i n b i r t h s
As an average twins are born 3 - 6 days earlier than singles (KORTSTEE, 1963; COMBERG and VELTEN, 1962).
2.1.2. Factors affecting birth weight
It is well known that part of the total variation in birth weight is due to the sire, the parity of the dam and the calf's sex (KASSAB, 1964; BANERJEE-SCHOTSMAN, 1964).
Largest differences between sires were found to be about 8 kg for male calves
Meded. Landbouwhogeschool Wageningen 70-12 (1970) 3

and 7 kg for female calves (BANERJEE-SCHOTSMAN, 1964). The difference in birth weight between sexes is estimated to be about 1-3 kg and between Primiparae and Pluriparae about 3-5 kg (KASSAB, 1964; BANERJEE-SCHOTSMAN,
1964). No differences in birth weight could be found between the months of calving
(KASSAB, 1964; BANERJEE-SCHOTSMAN, 1964; WILCOX and ROY, 1968).
2.1.3. Factors affecting incidence of stillbirths and the ease of calving
VAN DIETEN (1963) established significant differences between sires in the incidence of stillbirths and the ease of birth of their calves born from Primiparae as well as from Pluriparae. The differences in stillbirth frequency between sires were insignificant within groups of normal vs. abnormal parturitions. He postulated, therefore, that the frequency of stillbirths and the ease of calving are related to each other; the factors determining the stillbirth probability coincide with the factors responsible for abnormal deliveries.
Primiparae show a much higher incidence of stillbirths than Pluriparae. More male calves than female calves are stillborn; the male calves also show a higher incidence of difficult birth. No relationship is found between the gestation length and the number of stillbirths, though CLOPPENBURG (1966, cited by SMIDT et al, 1968) indicated the existence of a positive correlation between the gestation lengths longer than 280 days and the still-birth frequency in heifers. The stillborn calves are heavier than the viable calves, though there is no causal relationship between birth weight and mortality at birth. The study of VAN DIETEN (1963) showed a significant influence of month of birth on stillbirth-frequency. In Primiparae as well as in Pluriparae the frequency is low in april. In Primiparae the frequency is high in December and January and in Pluriparae the frequency is high in September and October.
GROMMERS et al (1965) confirm the influence of the dam's parity, the calf's sex, the ease of calving and the month of calving on the stillbirth-frequency. Stanchion barns or loose-housing had no influence on the stillbirth frequency.
VAN LEEUWEN (1967) concludes from the total A.I.-birth registration in the Netherlands that the differences between sires as well as between sexes in stillbirth frequency are rather high.
2.2. PROGESTERONE AND OESTROGEN DURING PREGNANCY
2.2.1. Progesterone and oestrogen in maternal and foetal circulation
During pregnancy the steroid level is increased in the human as well as in the domestic mammals. Very high concentrations of oestrogens and progesterone are found in the maternal blood circulation and the maternal excreta during late pregnancy. In earlier days one assumed, therefore, that these hormones were produced by the maternal organs, like the ovaries, with the corpora lutea and eventually the adrenals. When the biological analytical methods were replaced by chemical techniques, with higher sensitivity and specificity it was
4 Meded. Landbouwhogeschool Wageningen 70-12 (1970)

proved that the placenta was also able to produce these steroids, even in greater quantities than the ovaries do (DICZFALUSY, 1960).
Though a great resemblance exists between these hormonal mechanisms in the human and in the domestic mammals, still essential species differences are observed in synthesis.
2.2.2. Progesterone in the human and in the cow
In pregnant women progesterone is not only produced in the corpus luteum but also in the foetoplacental unit (SHORT and ETON, 1959; JOHANNISSON, 1968; RYAN and AINSWORTH, 1966).
Progesterone is not found in the bovine placenta. SHORT (1960) postulates that the increased progesterone in the pregnant cow is secreted by the maternal corpus luteum, other tissues of the ovaries and the adrenals.
WICKERSHAM and TANABE (1967) state that the functional activity of the bovine corpus luteum remains relatively constant throughout gestation.
ERB et al (1968a) observed that the bovine corpus luteum is not essential for pregnancy maintenance during days 200-237 of gestation. Ovariectomy caused a severe decrease in peripheral progesterone blood level to about 47 %, though not before 9 or more days after surgery. An extra ovarian source of progesterone, during gestation in cows, seems obvious. Since the maternal adrenal cortex hypertrophies during pregnancy, the adrenal cannot be eliminated as an increasing source of progesterone, during gestation.
2.2.3. Oestrogens in humans and domestic animals
p roduc t i on ; me t abo l i sm; excre t ion The species differences are apparent in the excreted epimeric oestrogens.
Human: mainly oestriol and little oestradiol-17ß and oestrone (DICZFALUSY and LAURITZEN, 1961).
Cow: 50-70% oestradiol-17oc, 30-40% oestrone, very little oestradiol-17ß and oestriol (MELLIN, 1965; VELLE, 1958).
Sow: mainly oestrone, little oestradiol-17ß (RAESIDE, 1963; ROMBOUTS,
1962; BOWERMAN, 1963).
Although oestrone and oestriol are present in placental and ovarian tissue, oestradiol-17ß is assumed to be the most important primary oestrogen. Oestra-diol-17<x and oestriol both are metabolites of oestradiol-17ß and oestrone. Oestradiol-17ß is biologically the most active oestrogen, and is inactivated by metabolism into less active oestrogens and by conjugation into sulfates and glucuronates. This conjugation takes place mainly in the foetal and the maternal liver. The endocrine activities of the placenta and the foetal organs, like liver and adrenals, are responsible for the biosynthesis of the oestrogens. These oestrogen producing organs are frequently called the 'foeto placental unit' (JOHANNISSON, 1968).
The extra activity of the foetal adrenal is also indicated by the fact that the foetal adrenal weight, in relation to the body weight, during the final stage
Meded. Landbouwhogeschool Wageningen 70-12 (1970) 5
of pregnancy in humans is about 10-20 times as high as after birth (NAKAYAMA et al, 1967; COMLINE and SILVER, 1961). This extra size of the foetal adrenal is due to the foetal zone of the adrenal cortex, which degenerates after delivery (JOHANNISSON, 1968; NAKAYAMA et al, 1967).
JoHANNissoN (1968) reviewed the present knowledge about the oestrogen biosynthesis in the foeto-placental unit.
The foetal adrenal cortex is able to synthesize several steroidal precursors from acetate ('de novo mechanism'). Some of these precursors, like dehydro-epiandrosterone sulfate (DHEAS) can be aromatized in placental tissue.
Starting from the normal steroidal intermediate pregnenolone, the synthesis of oestradiol-17ß requires: 1. hydroxylation ) 2. side chain hydrolysis } in the foetal adrenal cortex 3. sulphurization J 4. aromatization in the placenta
Maternal and exogenous DHEAS can be converted into oestradiol and oestrone by a pregnant woman (SIITERI and M A C D O N A L D , 1963, 1966; K N A P -
STEIN et al, 1968). The foetal production of oestriol probably does not rely too much on the maternal supply of precursors for bilaterally adrenalectomized pregnant woman showed a normal urinary oestriol excretion though the oestradiol excretion was markedly reduced (SIITERI and M A C D O N A L D , 1966). HAMMERSTEIN and NEVINNY-STICKEL (1965) observed a decreased total oestrogen level after subtotal maternal adrenalectomy, only in one patient.
A living foetus or a continuous blood flow in the placenta is required for a normal oestriol excretion pattern (CASSMER, 1959 ; KLOOSTERMAN and Huis IN 'T VELD, 1961; BELING, 1963).
GOECKE and TIMONEN (1966) postulated that the high correlation they found between urinary oestrogen level and the babies' body weight (0.469) was due to the possible relationship between birth weight and adrenal weight. The maternal and foetal livers are responsible for the inactivation of the oestrogens, though conjugation of oestrogens has been observed in the kidney as well. The conjugated oestrogens are more soluble in water than the free oestrogens and, therefore, enter more readily into the urine (literature reviewed by M E L -LIN, 1965).
Since part of the oestrogens leave the liver with the bile, part of the oestrogen will leave the pregnant animal with the faeces (EL-ATTAR and TURNER, 1957; LEVIN, 1945; ADLERCREUTZ, 1962 and WRIGHT , 1962). This has been called
the enterohepatic pathway. SANDBERG and SLAUNWHITE (1957) recovered 50% of the radio-activity of
the injected labeled oestrone and oestradiol from the bile in human patients with a biliary drainage. In normal patients 5 0 - 8 0 % of the radio activity was recovered from the urine and 7 % from stools, which suggests that reabsorption from the gut into the blood occurs.
6 Meded. Landbouwhogeschool Wageningen 70-12 (1970)
BROWN (1959) concluded that, in humans, 10% of the oestrogens will be excreted in the faeces, 65% in the urine with 25% unaccounted for. HUNT,
LEGAULT and HERRICK (1961) found reproducable ratios between the radioactivity in urine and faeces after intravenous injection of two levels of labeled oestrone in a luteal phase heifer. Therefore urinary oestrogen levels may provide a reliable means of evaluating the oestrogen metabolism rates during different reproductive states. MANER et al (1963) postulate that the placental oestrogens are not only transported to the maternal blood circulation by the umbilical cord but also directly into the vessels of the myometrium. This, at least, is the most plausible explanation for their finding that the uterine blood shows a higher oestrogen concentration than the peripheral blood. With this transport system from the foetal tissues into the maternal organism the oestrogens might act on the myometrium before they are inactivated.
2.2.4. Possible functions of progesterone and oestrogen during gestation and parturition
Much more is known about the role of these steroids during the oestrus cycle than about their function during gestation and parturition.
Several studies indicated that the contractibility of the myometrium is regulated by progesterone. It inhibits the contractibility of the uterus musculature and this mechanism is therefore called the 'progesterone block'(CSAPO, 1959; BENGTSON and SCHOFIELD, 1960). Oestrogen is antagonistic in this respect to progesterone and the net result of this antagonism depends on their respective concentrations. (RYAN and AINSWORTH, 1966; HOLM, 1964).
RUSSE (1968) reported that the myometrial ß-receptors dominate during oestrus and parturition and the a-receptors in the other periods. These ß-receptors are sensitive to nervus sympaticus impulses; these impulses cause a decrease in uterus muscle tone, which starts the parturition proces with the help of the well known Oxytocine activity (RYAN and AINSWORTH, 1966).
One might postulate that the dominance of a- and ß-receptors is due to respectively low and high oestrogen/progesterone ratios, because during both oestrus and partus this ratio is particularly high.
It is possible that other steroids interfere in this oestrogen-progesterone antagonism (OSINGA, 1969). BASSETT and THORBURN (1969), for example, observed a sudden increase in the corticosteroid content of foetal blood-plasma in sheep, just before parturition.
Since it is not clear whether progesterone levels in the late pregnant cow decline prior to parturition, the alternative mechanism for the initiation of parturition is a sudden increase in oestrogen to overcome the progesterone domination in the uterus (MELLIN et al, 1966).
In sheep and rabbit the sensitivity of the myometrium towards Oxytocine increases just prior to parturition. BENGTSON and SCHOFIELD (1960), therefore, postulated also that the parturition is initiated by the oestrogen dominance of the myometrium.
Meded. Landbouwhogeschool Wageningen 70-12 (1970) 7

3. THE Q U A N T I T A T I V E C H E M I C A L E S T I M A T I O N OF O E S T R O G E N S I N BOVINE P R E G N A N C Y U R I N E
3.1. THE ESTIMATION OF THE CONCENTRATION OF OESTRADIOL-17OC
AND OESTRONE
3.1.1. Introduction
Since 1930 attempts have been undertaken to develop chemical methods for urinary oestrogen determination. This has resulted in two reliable techniques. The first was described by BROWN in 1955 and the second by ITTRICH
(1958). Both were developed primarily for human urine, but with slight modifications they also have been applied to urines and other material of domestic animals (VELLE, 1958; MELLIN, 1965).
Data from literature prove that oestradiol-Ha1 is quantitatively the major bovine urinary metabolite during pregnancy, followed closely by oestrone.2
KLYNE and WRIGHT (1957) found oestrone in a larger quantity than oestradiol-17a in cow and goat urine. POPE and MCNAUGHTON (1957) isolated and identified oestrone in late pregnancy cow urine. VELLE (1958), using a milder form of acid hydrolysis than the former authors, estimated a larger quantity of oestradiol-17a than oestrone in some late pregnancy urine samples of cows. MELLIN (1965), MELLIN et al (1964, 1965, 1966) and ERB et al. (1968b) using a combination of enzymatic hydrolysis and acid hydrolysis showed definitely that oestradiol-17a is excreted in the largest quantities, particularly during the last four weeks of pregnancy. This group identified oestradiol-17ß in minor quantities in bovine pregnancy urine. An oestriol-like compound was present but could not be identified. NELSON and SMITH (1963) also found a small amount of oestradiol-17ß and ROMMEL and ROMMEL (1968) found oestriol.
The method used in this study was developed from those of BROWN (1955) and of BELING (1963). It involved enzymatic hydrolysis and omitted several purification steps from the original method of BROWN.
The chemical method for the quantitative estimation of oestrogens in bovine urine, developed by MELLIN, (1965) is quite complicated. The double hydrolysis is followed by aether extraction, removal of pigments, paper chromatography and fluorimetry utilizing labeled internal standards for procedural losses. Only one sample can be estimated in eight hours. Such a method is not suitable for every-day-routine use. SCHOTT and KATZMAN (1964) use acid hydrolysis in combination with an enzymatic hydrolysis with ß-glucuronidase; in their study oestradiol-17a was mainly liberated by the ß-glucuronidase and oestrone by the acid-hydrolysis. SINADINOVIÓ and VELLE (1968) found the enzymatic hydrolysis more than five times as effective for the liberation of oestradiol-17« and about 1.3 times as effective for the liberation of oestrone as compared to 1 Oestradiol-17a is abbreviated as Oe2. 2 Oestrone is abbreviated as Oel.
8 Meded. Landbouwhogeschool Wageningen 70-12 (1970)

their mild acid hydrolysis. These last authors found that the enzymatic hydrolysis is very expensive and therefore less useful.
3.1.2. Material and methods
3.1.2.1. Ur ine sampl ing The urine samples are taken from the pregnant cow by a metal catheter for
normal routine studies. For studies concerning diurnal rhythms a permanent catheter is frequently used. The catheters are stored in a 0.1 % aqueous solution of 'Hibitane'-gluconate (I.C.I.-Holland). 'Hibitane'-obstetric creme is used for the actual catheterisation.
The urine samples are stored at 4°C in stoppered plastic centrifuge tubes.
Creatinine concentration of the urine (paragraph 3.2.2.) is used for the calculation of the required sample volume for the oestrogen analysis. This required sample volume is expressed as the mgs creatinine the sample should contain. Since the oestrogen excretion increases with the stage of gestation the required volume of the urine sample should decrease with the stage of pregnancy in order to have a limited quantity of oestrogens per sample. The required creatinine quantity depends on the stage of pregnancy as follows :
days of mg approximate pregnancy creatinine sample volume
100-180 20 10-30 ml 180-210 10 5-20 ml 210-partus 5 3 - 5ml
3.1.2.2. Chemicals Generally the grades of the reagents are as recommended by BROWN (1955)
and BELING (1963). The analytical grade chemicals are obtained from MERCK
(Darmstadt). Pure crystalline oestrogens, used for reference standards, were provided by
N.V. Organon, Oss. Standardized and stabilized 'Helix pomatia'-extract and Séphadex-G25 'fine'
and 'coarse' were obtained and treated according to BELING (1963); the Sépha-dex-'medium' was not available in 1965 and therefore not used in the development of this method.
3.1.3. Me thod in de ta i l Enzymat ic hydro lys i s : The urine sample is brought to a pH of 4.1 with
an acetate buffer (BELING, 1963). About 2000 Fishman units ß-glucuronidase and 16.000 Roy units sulfatase are added to each sample. After mixing the sample with the acetate buffer and the enzymes the mixture is incubated for about 16 hours at 37 °C.
Ae the r - ex t r ac t i on : The incubated mixture is extracted twice with at least 30 ml di-aethyl-aether (if less aether is used, emulsions might occur).
Meded. Landbouwhogeschool Wageningen 70-12 (1970) 9

Without further washings (BELING, 1963) the aether is evaporated in a Soxhlet apparatus.
Me thy l a t i on : Fifty ml 1.6% NaOH, 0.9 gram boric acid and 1 ml di-methyl-sulfate is added directly to the dry residue in the flat bottomed Soxhlet extraction flask. The flask is shaken until the boric acid and dimethylsulfate has dissolved and is placed in a 37 °C water bath for about 20 minutes. This procedure is repeated once by adding another 1 ml dimethylsulfate together with 2 ml 20 % NaOH. The flask is shaken again and kept at 37 °C for another 20 minutes or allowed to stand at room temperature overnight in the dark. In order to destroy contaminating substances by oxidation 10 ml 20% NaOH and 2.5 ml 30% H 2 0 2 are added to the flask. The flask is then placed in the dark for two hours (BROWN, 1955).
Ex t r ac t ion with p e t r o l eumae the r : The contents of the flasks are transferred to a 250 ml separating funnel, extracted once with 25 ml petroleum-aether and washed twice with 5 ml aqua dest. (BROWN, 1955).
Abso rp t i on c h roma tog r aphy : The column is prepared by partly filling the chromatogram tube with petroleumaether and then adding 3 gram standardized aluminumoxide. The alumina is simply standardized by adding 9.5 % aqua dest. at least one month before use. The alumina surface is overlaid with at least 5 mm of dry acid-aethanol washed sand. The petroleumaether fraction is added to the column and the column is then eluted with: a. 12 ml of a mixture of 25% benzene in petroleumaether; the effluent is
discarded; b. 15 ml of a mixture of 40% benzene in petroleumaether; the effluent is col
lected into a Kober-tube and contains all of the oestrone methylaether; c. a further 12 ml of the same mixture of 40% benzene in petroleumaether;
the effluent is discarded; and d. 12 ml of benzene; the effluent is collected in a Kober-tube and contains all
of the oestradiol methylaether (BROWN, 1955). Appreciable amounts of oestrogens have never been found in fraction a.
and c.
Evapo ra t i on of so lvents : 0.2 ml of a 2% solution of hydrochinon and two small pieces of porous tile are added to the two Kober-tubes. Solutions are evaporated completely by heating in a water bath at 50-60°C under reduced pressure.
Blank tubes containing hydrochinon only are prepared at the same time (BROWN, 1955).
Kobe r - co lou r r eac t ion accord ing to NOCKE (1961): For oestrone and oestradiol-17a the same Kober-reagent was used. This reagent contained 20 gram hydrochinon per liter of a 66% solution of H 2S0 4 . After adding the
10 Meded. Landbouwhogeschool Wageningen 70-12 (1970)

Kober-reagent to the tubes, the tubes are shaken and placed in a boiling water bath. During heating the tubes are shaken twice. After cooling for 5 minutes in tap water a certain amount of aqua dest. is added and then the shaking and heating procudure is repeated. After the second heating time the tubes are cooled again for 5 minutes in tap water and placed in the dark for at least 10 minutes. Extinctions are read in a Beckman-B-spectrophotometer, using the ALLEN (1950) correction formula:
Ecorr. = 2 E 2 — E t — E 3
The colour reaction conditions for the oestrone and oestradiol-17a are shown in table 3.1.
TABLE 3.1. Colour reaction conditions and wavelengths for colorimetry used in the Kober-reaction, modified by NOCKE (1961).
oestradiol-17a methyleather
oestronemethyl-aether
Kober-reagent (ml) 1st heating time (min.) water added (ml) 2nd heating time (min.) wavelengths: Ei
E2
E3
2.2 4 1.0 6
486 nm 521 nm 556 nm
2.1 20 1.1 6
476 nm 516 nm 556 nm
Cal ib ra t i on -cu rve for r ou t i ne use: Standard solutions of about 1-10 [ig/ml are methylated, extracted by petroleumaether, chromatographed and coloured in the same way as the dry sample residue after aether extraction.
3.1.4. Séphadex gelfil trat ion
The BELING (1963) gelfiltration technique has been tried in order to obtain a purified fraction that could be enzymatically hydrolized.
When 1-10 ml urine was percolated into the séphadex columns and eluted
TABLE 3.2. The effectiveness of gelfiltration measured on the corrected optical densities of the Kober-colour.
experiment I:
séph. coarse (dupl.) séph fine (dupl.) without séph. (single)
experiment II :
all duplicates:
séph. coarse without séph.
sample I densities x 1000
Oe 1 Oe 2
129- 62 469^193 72-160 394-457
153 500
sample III densities x 1000
Oe 1 Oe 2
64-176 476-485 178-206 532-502
sample II densities x 1000
Oe 1 Oe 2
83-158 410-485 125-97 412-420 167 484
sample IV densities x 1000
Oe 1 Oe2
122-91 248-246 87-92 285-265
Meded. Landbouwhogeschool Wageningen 70-12 (1970) 11

with aqua dest., the fractions 33-45 ml contained most of the oestrone and oestradiol-17a, but the fractions 20-33 and 45-60 were not completely free of Kober chromogens. The distinct coloured bands, indicated by BELING
(1963) were not to be found. - "ft In two experiments (table 3.2.) a (Toj . \ son of enzymatic hydrolysis was
made with and without using the ge-^. • .Lion. As proved by the figures of table 3.2. the enzymatic hydrolysis without the previous nitrations showed no lower extinctions and better duplicate determinations; and the séphadex gel-filtration technique was discontinued in further analysis.
3.1.5. Enzymatic versus acid hydrolysis
It is hard to estimate the efficiency of the enzymatic hydrolysis. In general these studies are carried out with pure oestrogen conjugates but even then it is difficult to compare the results with the hydrolysis of urinary oestrogen conjugates. In the analysis of human urinary oestriol acid hydrolysis (BROWN, 1955) is generally practiced. This is thought to be also the most efficient method. MELLIN (1965) used a combination of enzymatic and acid hydrolysis.
It was worthwhile to investigate the effectiveness of enzymatic hydrolysis as compared to acid hydrolysis in cow urine. The acid hydrolysis was carried out according to VELLE (1958) with a final HCl-concentration of 6 volume %.
The acid hydrolysis of oestradiol-17a conjugates is not appropriate for the labile oestradiol-17<x is destroyed rather fast (VELLE, 1958; GOMES et al, 1965). This is also shown in the first experiment, in which the enzymatic hydrolysis is compared with the acid hydrolysis in 3 urine samples (table 3.3.). The acid hydrolysis of oestrone conjugates in this experiment agrees very well with the enzymatic hydrolysis, but most of the oestradiol-17a is destroyed by the acid hydrolysis. This agrees with the experiment, carried out by VELLE (1958) and SINADINOVIC and VELLE (1968) who found 3-5 times as much oestradiol-17a in a urine sample, using enzymatic hydrolysis, as after acid hydrolysis.
In the second experiment urine samples of six different pregnant cows are first enzymatically hydrolyzed and the waterphase is thereafter hydrolyzed with HCl, 6 volume %. The two aether-fractions are separately purified and analysed only for oestrone with the results shown in tabel 3.4.
TABLE 3.3. Efficiency of enzymatic vs. acid hydrolysis
Sample
1
2
3
* see paragraph 3.2.
12
jig oestrone/ g creatinine*
Enzymatic
881
981
734
acid
852 819 983 986 854 865
Meded. Landbc
(jig oestradiol-17<x/ g
Enzymatic
4298
2230
3509
mwhogeschool Wageningei
creatinine*
acid
485 417 296 296 460 496
n 70-12 (1970)
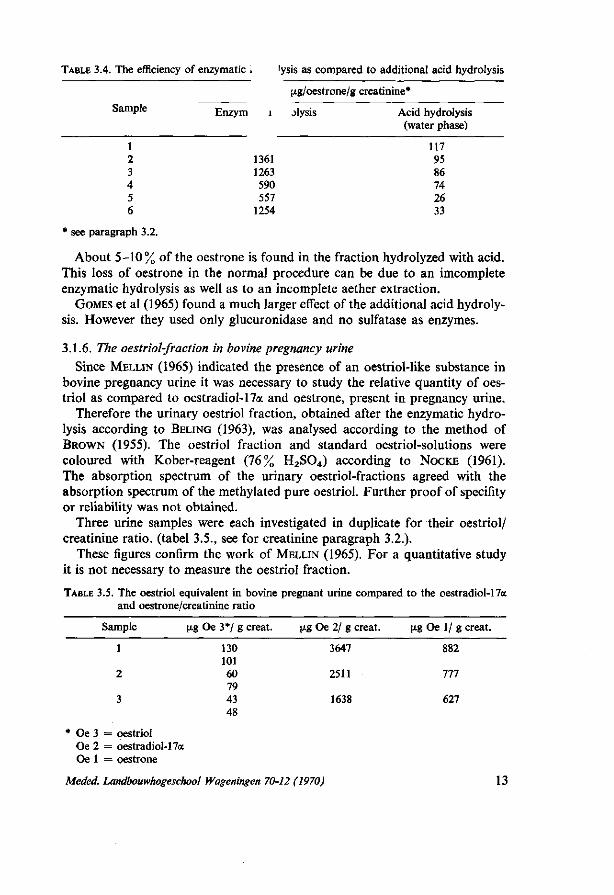
TABLE 3.4. The efficiency of enzymatic i 'ysis as compared to additional acid hydrolysis
Sample
1 2 3 4 5 6
* see paragraph 3.2.
Enzym i
1361 1263 590 557
1254
[ig/oestrone/g creatinine*
jlysis Acid hydrolysis (water phase)
117 95 86 74 26 33
About 5-10% of the oestrone is found in the fraction hydrolyzed with acid. This loss of oestrone in the normal procedure can be due to an imcomplete enzymatic hydrolysis as well as to an incomplete aether extraction.
GOMES et al (1965) found a much larger effect of the additional acid hydrolysis. However they used only glucuronidase and no sulfatase as enzymes.
3.1.6. The oestriol-fraction in bovine pregnancy urine
Since MELLIN (1965) indicated the presence of an oestriol-like substance in bovine pregnancy urine it was necessary to study the relative quantity of oestriol as compared to oestradiol-17a and oestrone, present in pregnancy urine.
Therefore the urinary oestriol fraction, obtained after the enzymatic hydrolysis according to BELING (1963), was analysed according to the method of BROWN (1955). The oestriol fraction and standard oestriol-solutions were coloured with Kober-reagent (76% H2S04) according to NOCKE (1961). The absorption spectrum of the urinary oestriol-fractions agreed with the absorption spectrum of the methylated pure oestriol. Further proof of specifity or reliability was not obtained.
Three urine samples were each investigated in duplicate for their oestriol/ creatinine ratio, (tabel 3.5., see for creatinine paragraph 3.2.).
These figures confirm the work of MELLIN (1965). For a quantitative study it is not necessary to measure the oestriol fraction.
TABLE 3.5. The oestriol equivalent in bovine pregnant urine compared to the oestradiol-17a and oestrone/creatinine ratio
Sample
1
2
3
* Oe 3 = oestriol Oe 2 = oestradiol-17a Oe 1 = oestrone
V-% Oe 3*/ g créât.
130 101 60 79 43 48
1*8 Oe 2/ g créât.
3647
2511
1638
¥•% Oe 1/ g créât.
882
777
627
Meded. Landbouwhogeschool Wageningen 70-12 (1970) 13

3.2. THE ESTIMATION OF THE OESTROGEN/CREATININE RATIO IN
BOVINE PREGNANCY URINE
3.2.1. Introduction
To measure urinary oestrogen excretion quantitatively in both pregnant women and animals it is desirable to use 24-hour urine samples (KAHMANN et al, 1969). The collection of 24-hour urine samples is also possible with cows (MEL
ON, 1965) but since it is very time consuming it is only possible in a limited number of animals. One can then work with a permanent catheter or a harnass with a collection apparatus adapted to the vulva (MELLIN, 1965; VAN ES and VOGT, 1959).
Studies concerning the individual variation in urinary oestrogens required a large number of experimental animals. Therefore a method requiring 24-hour urine samples is inconvenient.
The oestrogen concentration of a single sample, however, has no direct relationship with the 24-hour oestrogen production, because the volume of voided urine per short interval varies too much.
DE GROOT and AAFJES (1960) found that the creatinine excretion in the urine of cows was constant over the entire day (about 10 mg/min. = 14.4 g per day). They proposed that the creatinine concentration of a single sample can serve as a measure for the daily urine production. Since oestrogens, excreted during pregnancy, are primarily placental in origin, it was reasoned that they might be produced at a constant rate, not subject to diurnal variation like adrenal steroids (Vagnucci et al, 1965).
This lead to the hypothesis that the oestrogen/creatinine ratio should be constant within a day (chapter 5).
3.2.2.The estimation of the creatinine content in urine
The most common used method for the creatinine analysis in urine is the method described by FOLIN in 1914. This method is based on the fact that creatinine forms an orange colour with picric acid and sodium hydroxyde. The creatinine concentration is calculated from the linear relationship (up to 3 mg creatinine per sample) between the quantity of creatinine and the colour intensity.
The method used in this study is slightly different from FOLIN'S method, but the principle is the same. The extinction of the orange colour is not measured at the wavelength with the absorption maximum but on the slope of the spectral curve (at 534 nm). This is done because the yellow colour of picric acid influences the extinction at the absorption maximum of picric acid.
In literature only EDWARDS and WHITE (1958) have advocated to measure the extinction of the creatinine colour complex at the absorption maximum (490 nm). Therefore this method has been compared with the standard method used in this study.
14 Meded. Landbouwhogeschool Wageningen 70-12 (1970)
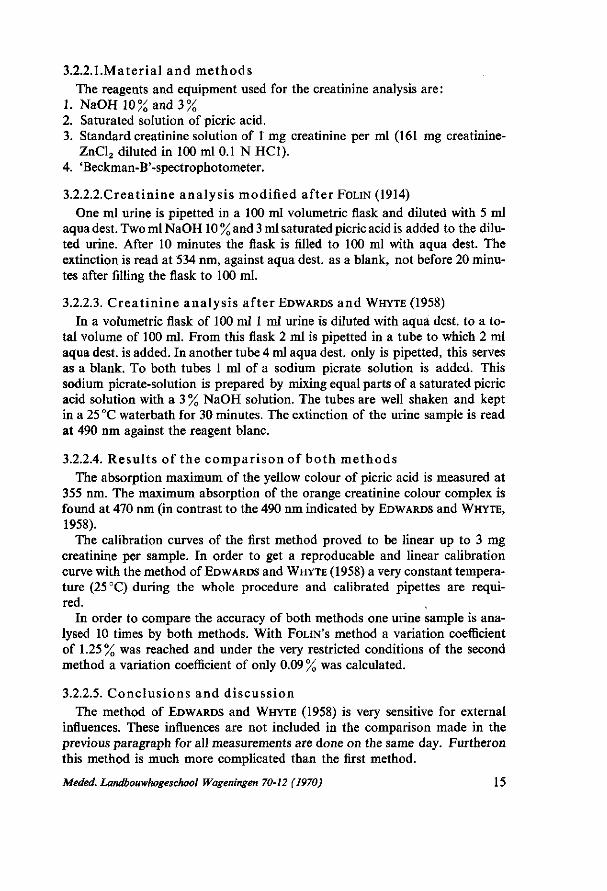
3.2.2.1.Material and me thods The reagents and equipment used for the creatinine analysis are :
1. NaOH 10% and 3% 2. Saturated solution of picric acid. 3. Standard creatinine solution of 1 mg creatinine per ml (161 mg creatinine-
ZnCl2 diluted in 100 ml 0.1 N HCl). 4. 'Beckman-B'-spectrophotometer.
3.2.2.2.Creatinine analysis modified after FOLIN (1914) One ml urine is pipetted in a 100 ml volumetric flask and diluted with 5 ml
aqua dest. Two ml NaOH 10 % and 3 ml saturated picric acid is added to the diluted urine. After 10 minutes the flask is filled to 100 ml with aqua dest. The extinction is read at 534 nm, against aqua dest. as a blank, not before 20 minutes after filling the flask to 100 ml.
3.2.2.3. C rea t in ine analys is after EDWARDS and WHYTE (1958) In a volumetric flask of 100 ml 1 ml urine is diluted with aqua dest. to a to
tal volume of 100 ml. From this flask 2 ml is pipetted in a tube to which 2 ml aqua dest. is added. In another tube 4 ml aqua dest. only is pipetted, this serves as a blank. To both tubes 1 ml of a sodium picrate solution is added. This sodium picrate-solution is prepared by mixing equal parts of a saturated picric acid solution with a 3 % NaOH solution. The tubes are well shaken and kept in a 25 °C waterbath for 30 minutes. The extinction of the urine sample is read at 490 nm against the reagent blanc.
3.2.2.4. Resul ts of the compar i son of bo th me thods The absorption maximum of the yellow colour of picric acid is measured at
355 nm. The maximum absorption of the orange creatinine colour complex is found at 470 nm (in contrast to the 490 nm indicated by EDWARDS and WHYTE,
1958). The calibration curves of the first method proved to be linear up to 3 mg
creatinine per sample. In order to get a reproducable and linear calibration curve with the method of EDWARDS and WHYTE (1958) a very constant temperature (25 °C) during the whole procedure and calibrated pipettes are required.
In order to compare the accuracy of both methods one urine sample is analysed 10 times by both methods. With FOUNT'S method a variation coefficient of 1.25% was reached and under the very restricted conditions of the second method a variation coefficient of only 0.09 % was calculated.
3.2.2.5. Conc lus ions and d i scuss ion The method of EDWARDS and WHYTE (1958) is very sensitive for external
influences. These influences are not included in the comparison made in the previous paragraph for all measurements are done on the same day. Furtheron this method is much more complicated than the first method.
Meded. Landbouwhogeschool Wageningen 70-12 (1970) 15

In this study all creatinine analyses were carried out with the method described in paragraph 3.2.2.2.
3.2.3. The variation in the urinary creatinine excretion within cows
The variation in creatinine excretion between cows is mainly related to differences in body weight ( D E GROOT and AAFJES, 1960; FIELD, 1964). If the urinary oestrogen excretion is not related to the cow's body weight a negative correlation should show up between body weight and oestrogen/creatinine ratios ; this has not been proved yet.
High fluctuations in the daily creatinine production, within cows, would be a difficulty for the application of the oestrogen/creatinine rat io; in addition ALBIN and CLANTON (1966) suggest an increasing creatinine output with the stage of pregnancy. ERB . et al (1970) did not find a significant difference in the creatinine excretion per kg body weight between cycling cows and pregnant cows.
In order to study these variations in the daily creatinine output, urine samples were collected in cooperation with the I.B.S.1 who carried out a balance-trial with late pregnant, dry cows.
3.2.3.1. Material and methods
Six dry cows, all pregnant for about 7 months, were placed in metabolism stalls on January 10th 1970. The daily output of urine and faeces was collected separately with the method, described by VAN E S and VOGT (1959). For preservation 200 ml 18% HCl was put in the flasks before collection started.
The identical twins, cows 1 and 4, were pregnant with their 4th calf, the others were pregnant with their second calf.
From January 13th until March 9th samples are taken, in the morning, from the total urine output of the previous 24 hours.2
The leaking urine was collected as much as possible quantitatively and when the volume of the leaking urine was more than 0.5 liter this was also sampled. Leaking urine was only observed incidentally.
Between January 19th and February 4th, as part of the I.B.S.-study, 45 gram cysteine-HCl was administrated to cows 1, 2 and 3. F rom February 4th to the end of the trial 65 gram cysteine-HCl was administrated to cows 4, 5 and 6.
Using analysis of variance, data concerning the daily urine output, the creatinine concentration and the daily creatinine output were tested for significant differences between weeks, within cows. The standard deviation, within weeks, was used for the calculation of the coefficient of variation. The correlation between the 3 characters was also calculated within weeks.
The differences between cows were not tested in this experiment.
1 Institue for Biological and Chemical Research on Field Crops and Herbage, Wageningen. 2 From cow number 3 urine samples could be collected only during 6 weeks, because this cow
delivered her calf 3 weeks earlier than was anticipated at the start of the experiment.
16 Meded. Landbouwhogeschool Wageningen 70-12 (1970)
1 2 3 4 5 6
** P < O.Ol
8.52 7.20 8.31 9.18 8.61 7.02
Mean:
10.56 14.03 13.48 9.80 6.50
10.83
10.87
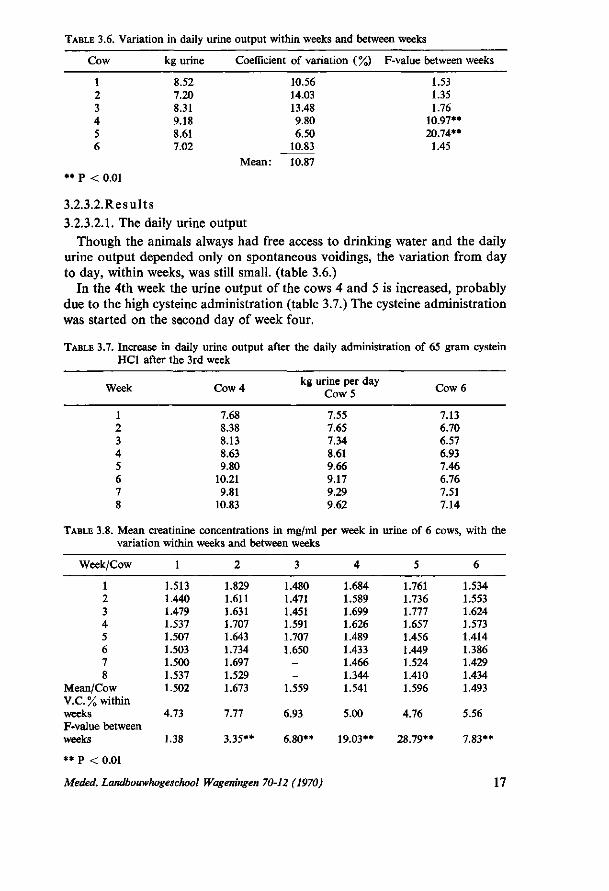
TABLE 3.6. Variation in daily urine output within weeks and between weeks
Cow kg urine Coefficient of variation ( %) F-value between weeks
1.53 1.35 1.76
10.97** 20.74** 1.45
3.2.3.2.Results 3.2.3.2.1. The daily urine output
Though the animals always had free access to drinking water and the daily urine output depended only on spontaneous voidings, the variation from day to day, within weeks, was still small, (table 3.6.)
In the 4th week the urine output of the cows 4 and 5 is increased, probably due to the high cysteine administration (table 3.7.) The cysteine administration was started on the second day of week four.
TABLE 3.7. Increase in daily urine output after the daily administration of 65 gram cystein HCl after the 3rd week
„ , , ^ A k g u r i n e P e r d a y /- c Week Cow 4 Cow 5 w
1 7.68 7.55 7.13 2 8.38 7.65 6.70 3 8.13 7.34 6.57 4 8.63 8.61 6.93 5 9.80 9.66 7.46 6 10.21 9.17 6.76 7 9.81 9.29 7.51 8 10.83 9.62 7.14
TABLE 3.8. Mean creatinine concentrations in mg/ml per week in urine of 6 cows, with the variation within weeks and between weeks
Week/Cow
1 2 3 4 5 6 7 8
Mean/Cow V.C.% within weeks F-value between
1
1.513 1.440 1.479 1.537 1.507 1.503 1.500 1.537 1.502
4.73
2
1.829 1.611 1.631 1.707 1.643 1.734 1.697 1.529 1.673
7.77
3
1.480 1.471 1.451 1.591 1.707 1.650
--
1.559
6.93
4
1.684 1.589 1.699 1.626 1.489 1.433 1.466 1.344 1.541
5.00
5
1.761 1.736 1.777 1.657 1.456 1.449 1.524 1.410 1.596
4.76
6
1.534 1.553 1.624 1.573 1.414 1.386 1.429 1.434 1.493
5.56
weeks 1.38 3.35** 6.80** 19.03** 28.79** 7.83**
** P < 0.01
Meded. Landbouwhogeschool Wageningen 70-12 (1970) 17

3.2.3.2.2. The creatinine concentration The standard deviation for this character is lower than for the daily urine
output and therefore the weekeffects are more easily observed (table 3.8.). Even in cows 2 and 3 a week effect is found, probably due to the low cysteine doses administrated in the second and third week.
3.2.3.2.3. The daily creatinine output The opposite directions in which the week-effects work in the daily urine out
put and the creatinine concentration cause the fact that almost no effect is measurable in the product of these two characters, being the total daily creatinine output (table 3.9.). Only in cow 5 a significant week effect is observed, though no specific trend is shown in table 3.10.
TABLE 3.9. Variation in the daily creatinine output within weeks and between weeks
Cow g creatinine V.C. % F-value week-effect
1 2 3 4 5 6
* P < 0.05
12.778 11.949 12.834 14.013 13.604 10.465
Mean
10.00 10.42 9.70 9.61 5.99
11.01
9.46
1.45 0.64 1.17 1.57 2.24* 1.34
TABLE 3.10. Mean daily creatinine production in grams per week in cow 5.
Week Cow 5
1 13.279
2 13.262
3 13.034
4 14.191
5 14.063
6 13.306
7 14.144
8 13.555
3.2.3.2.4. Correlations The correlation coefficients, calculated per cow, between days, within weeks,
between the three characters, are shown in table 3.11.
TABLE 3.11. Correlation coefficients between daily urine output, creatinine concentration and daily creatinine output
Cow
1 2 3 4 5 6
r A , B
-0.348** -0.608** -0.694** -0.317** -0.474** -0.153
TA, AB
0.905** 0.718** 0.834** 0.864** 0.735** 0.879**
TB, AB
0.081 0.095
-0.189 0.192 0.239* 0.334**
+ A = kg urine per day B = mg Creatinine per ml urine
AB = gram creatinine per day * = P < 0.05 ** = P < 0.01
18 Meded. Landbouwhogeschool Wageningen 70-12 (1970)
The negative correlation, between the daily urine output and the creatinine concentration, does not prevent a significant relation between the daily output of urine and creatinine.
3.2.3.3. D iscuss ion The administration of cysteine was part of the I.B.S.-study. It had an opposite
influence on the urine output and creatinine concentration. It is wellknown that other factors as well are able to increase the daily urine output and consequently decrease the creatinine concentration. The intake of drinking water or the intake of roughage with a high water content (grazing) are such factors.
This study shows that although the daily urine output and creatinine concentration may change significantly, this has no significant consequences for the daily creatinine output.
The suggestion of ALBIN and CLANTON (1966) that the creatinine excretion increases with the stage of pregnancy was not confirmed by this study.
The relatively low coefficients of variation concerning the daily urine output and creatinine concentration might be due to the well conditioned circumstances of the experimental cows. Grazing and lactating cows might be expected to show a much larger variation in daily urine output and consequently in creatinine concentration. The coefficient of variation for daily creatinine excretion (9.46%) agrees quite well with the figure (10.8%) presented by FIELD (1964).
The variation in the creatinine excretion per day is for a large part due to variation in the daily urine output.
3.3. RELIABILITY OF THE METHOD FOR OESTROGEN
3.3.1. Specificity
3.3.1.1. I n t r oduc t i on
Evidence for the specificity is mostly deduced indirectly. From the great number of analyses some idea is obtained about the specificity. The principle of the analysis is not different from the methods described by BROWN (1955) and VELLE (1958) so the specificity of the proposed method must not be different either. Like VELLE (1958), the same similarity between the absorption spectra of the Kobercoloured oestrogen fractions from pregnant cow's urine and methylated standard oestrogens was found. It would be worthwhile to estimate also the specific physical characters of the oestrogen fractions like melting point, molecular weight, boiling point, density, refraction and solubility. This, however, requires the isolation of large quantities of oestrogens from the urine and not many laboratories are so well equipped to carry out such a procedure.
Specificity of the method can also be proved by comparing the Rf-values of the urinary oestrogen-fractions in thin layer chromatography with the Rf-values of pure oestrogens. This investigation is carried out in cooperation with the biochemical laboratory of the institute of Gynaecology and Obstetrics of the Veterinary Faculty in Utrecht (miss Dr. v. d. HORST).
Meded. Landbouwhogeschool Wageningen 70-12 (1970) 19

3.3.1.2. The oestradiol-17a f rac t ion A methylated urinary oestradiol-17<x fraction, containing about 5 \ig oestra-
diol-17a, and pure oestradiol-17a methylaether were placed on a silicagel thin layer with a mobile phase of 70 % cyclohexane + 30 % aethylacetate. After a 45 minutes development in a sandwich room the chromatogram was dried at 120°C and sprayed with 1% vanilline in orthophosphoric acid (50%) and again dried at 120 CC in 10 to 20 min. Both the sample and the pure oestradiol-17« caused a purple spot at 9.5 cm with the effluent front on 15 cm. A weak violet spot was observed at 7.3 cm, probably caused by oestradiol-17ß. Oestra-diol-17ß is a minor constituent of the oestradiol-fraction according to MELLIN
(1965). Probably no significant impurities occur in the oestradiol fraction.
3.3.1.3. Cha rac te r i s t i c s of the oes t rone f rac t ion A methylated urinary oestrone fraction, containing about 5 [xg oestrone and
5 (xg methylated pure oestrone were placed on a silicagel thin layer glassplate. Chloroform and benzene (50/50) was used as a mobile phase and the chromatogram was developed in a chromatography tank for 45 minutes; the effluent front was then about 15 cm from the starting line. The plate was then dried and sprayed with the following agents : 1. Anisaldehyde (0.5 ml anisaldehyde + 50 ml acetic acid + 1.0 ml concen
trated H2S04). 2. Vanilline (1 % in 50 % orthophosphoric acid). 3. 2, 4, dinitrophenylhydrazine (DNPH). 4. An aqueous solution of 1 % FeCl3 + 1 % K3Fe (CN)6.
After drying the plates at 120°C the results, found in table 3.12. were obtained.
TABLE 3.12. Thin layer chromatography of the urinary oestrone fraction
Spot distance from start to spot
in cm anis
aldehyde Vanilline DNPH FeCl3 +
K3Fe(CN)6 Rf-value
1 0-1 2 5.0 3* 6.5 4 7.5 5 8.3 6 10.2
Legends of table: P
+
yellow orange violet orange grey violet
= negative = present = trace
— -
grey orange purple violet
+ + + + + + + + +
0.07 0.33 0.43 0.50 0.55 0.68
+ + = weak + + + = positieve
* = spot corresponding with methylated pure oestrone
20 Meded. Landbouwhogeschool Wageningen 70-12 (1970)

FIG. 3.1. Thin layer chroma-togram of a urinary oestrone fraction.
CD
CD
CD
CD
\ww \mwwt tmm\mm\w /////////////////////////////////>///
i • 11 i : 11 i : i ; ! 1111 • : i i : i ! i M : i : i • : r : i
C D
C D
C D
C D
C D
C D
A B c
-EFFLUENT FRONT
3.3.1.4. The Kobe r - r eac t i ng cons t i t uen t s of the u r ina ry oes t rone f rac t ion
In order to study which of the 6 fractions of table 3.12. react with the Kober-reagent, three methylated urinary oestrone fractions, each containing about 20 fj.g oestrone, were transferred to a silicagel thin layer plate on a horizontal line. After development of the chromatogram both edges (A and C in fig. 3.1.) were sprayed and coloured with anisaldehyde. In the three fractions respectively 6, 4 and 4 spots did appear. The corresponding parts B (fig. 3.1.) of the chromatograms, in between the coloured spots A and C, were scraped off. The scrapings were eluted 3 times with aceton. For this purpose the scrapings were intensively mixed with 5 ml aceton and centrifuged at 3000 r.p.m., for 3 to 4 minutes. After adding 0.2 ml 2 %-hydrochinon in ethanol to the total aceton-eluate and evaporation of solvents the eluted spots are coloured according to NOCKE (1961).
As is shown in table 3.13. only spot number 2 contains a significant amount of a Kober-reacting compound, corresponding with methylated pure oestrone.
TABLE 3.13. Kober reaction of the chromatogram spots of 3 methylated urinary oestrone fractions
Spot no.
1 2+ 3 4 5 6
Corrected extinction at 516 nm
Fraction I
8 512 49 37 23 25
II
246 5 2 9
III
813 0
14 20
V-%
Fraction I
0.11 7.17 0.69 0.52 0.32 0.35
Destrone equivalent
II
3.44 0.07 0.03 0.13
III
11.38 0.00 0.20 0.28
+ corresponds to methylated pure oestrone
From this experiment one may conclude that the Kober-reaction is specific for the oestrone-methyl aether from the methylated urinary oestrone fraction. The impurities of this fraction do not react, or react only slightly with the Kober reagent.
Meded. Landbouwhogeschool Wageningen 70-12 (1970) 21
3.3.2. Precision
As a measure of the precision of the method the standard deviation of a series of duplicate analyses of different urine samples was estimated. A large series of duplicate analyses was carried out in 1966. From a series of 133 duplicate analyses of oestrone, varying in content from .70-16.0 fxg per sample the standard deviation was estimated at 0.52 [xg per sample, using the formula:
s = V d2/2 N The coefficient of variability, being s/M = 0.52/4.186 x 100 =12.4%.
2.567 x 0.52 The fiducial range M ± t.s./^n = 4.186 ± — = 4.186 ± 0.96;xg.
M = average of all duplicate analyses s = standard deviation between duplicates d = difference between duplicates N — number of duplicate analyses n = 2 for duplicate analyses t = 2.567 for P = 0.01 (t test for significance).
This 0.96 \ig is considered to be a criterion for the sensitivity of the method, being the least amount per sample distinguishable from zero (EECHAUTE et al, 1965).
From the duplicate analyses of 140 urine samples for oestradiol-17<x, ranging in content from 0.70-36 [Ag, the following figures were calculated: standard deviation s = 1.48 [ig.
the coefficient of variability s/M x 100 = 12.0% the fiducial range M ± t.s./\/n = 12.31 ± 2.72 ;xg
The least amount distinguishable from zero is 2.72 pig. In 1968 four urine samples were analysed, each 10 to 12 times, to investigate
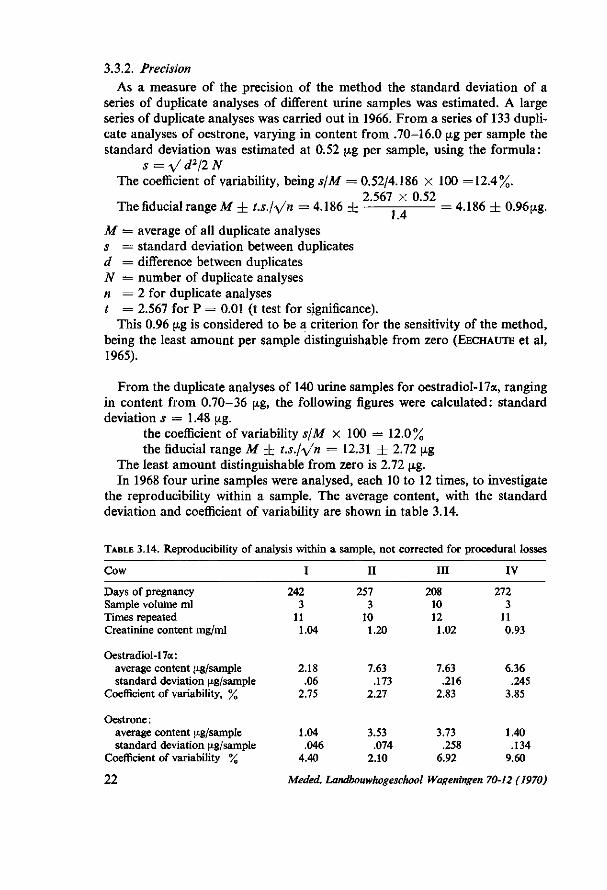
the reproducibility within a sample. The average content, with the standard deviation and coefficient of variability are shown in table 3.14.
TABLE 3.14. Reproducibility of analysis within a sample, not corrected for procedural losses
Cow
Days of pregnancy Sample volume ml Times repeated Creatinine content mg/ml
Oestradiol-17a: average content (j.g/sample standard deviation (xg/sample
Coefficient of variability, %
Oestrone : average content (/.g/sample standard deviation fig/sample
Coefficient of variability %
I
242 3
11 1.04
2.18 .06
2.75
1.04 .046
4.40
II
257 3
10 1.20
7.63 .173
2.27
3.53 .074
2.10
III
208 10 12 1.02
7.63 .216
2.83
3.73 .258
6.92
IV
272 3
11 0.93
6.36 .245
3.85
1.40 .134
9.60
22 Meded. Landbouwhogeschool Wageningen 70-12 (1970)

The precision of the method did increase from 1966 to 1968; this must be the result of more experience with the techniques. The standard deviation seems to depend on the total sample content. It will be the same for the smallest amount distinguishable from zero. This means that the sensitivity, expressed as [xg per sample, will increase with lower sample content. The values, calculated from the series of duplicate analyses, should be considered as an average sensitivity measure.
3.3.3. Accuracy as determined by recovery tests
Experiment I: Oestrogens added to unhydrolysed pregnancy urine. To urine samples of 12 cows about 5 [ng of standard solutions were added as
follows : a. sample without standard solution, b. sample + oestrone standard, c. sample + oestradiol-17a standard, d. sample + oestrone + oestradiol-17a standards, in which a. and c. are dupli
cate analyses for the oestrone value of the urine sample, and a. and b. are duplicate analyses for the oestradiol-17a content of the urine sample.
Experiment II: In seven tests oestrogen standards were added together (procedure d. only) to the hydrolysed urine samples and to the evaporated aether extract just before the methylation procedure.
Experiment III : In four tests oestrogen standards were also added together to 5 ml aqua dest., both with incubation with enzymes and without incubation with enzymes.
Table 3.15. shows that the recovery rates varied from 80-100%, dependent on the moment of adding the standard oestrogen solution. The test with the oestrogens, added to water, indicate that the incubation of 16 hours at 37 CC has a destructive effect on the free oestrogens. Whether this effect works also in the urinary fractions remains to be proven, though it is probably true.
TABLE 3.15. Average recovery rates
Oestrogens Oestrone Oestradiol-17a added to :
unhydrolysed urine samples: hydrolysed urine samples : dry aether extraction residu: 5 ml aqua dest. + incubation: 5 ml aqua dest. without incubation:
Av.+
81% 94% 98% 83% 89%
S.E.+
2.0 1.0 3.0 4.6 2.6
S.D.+
10.1 2.8 8.0 9.2 5.2
Av.+
86% 88% 90% 86% 94%
S.E.+
1.4 2.2 3.3 5.1 2.4
S.D.+
6.6 5.8 8.8
10.3 4.8
+ Av. = Average recovery percentage S.E. = Standard error of the mean percentage S.D. = Standard deviation
Meded. Landbouwhogeschool Wageningen 70-12 (1970) 23

o I-H
O, Ui
.2 -o
.SP •3 0 -u &* 1*
s -a 5 0
« 4
<3 -C
& 3*.
SU
S <•?
a cd d Si u lH Oi <o 'S
vd t n
S < H
O cd
o a
o 00
d ü cd o u u
O "O
S d
d
8
O
*>. d « ! •—1 rt O
O "O O "O
H ( S O N
TJ- ui ^j- \ o m <s 00 r-r-1 o --n m
3 *o m r f _ r- \o 00
0 0 0 0
© »n es v> es r- vo 00 00 f - Tj- - *
•<T TI* e s m
73
73, 73, 1 S
u 2 u 2
cm
o cd O 2 " i
• i
O O
s d
Ö
O „ CS " ! d " 1 d o cd o cd
S i §>
*-, •_, o, a £ & cd cd
i n "O "O g 00 g o es es °1 es
ro -d- Tj* \ 0 O O —t CS CS CS CS CS
•* — •* Tf cn m O ON O O O O
"t H O O I O f- t - VO l— —< --, CS CS
•-H t - OO © i-H O es m « -H CS CS
I cd
a S cd
s e s e u 2 o 2
24 Meded. Landbouwhogeschool Wageningen 70-12 (1970)
3
•a
o a c an 2 a
cd
0
ta V e S
<N . j 4) 0?
o e a.
_
6 at
c so
00 o t s - H r-i
o S o g <u Si
r^ *0 sn _rt
00 SO O r*1 so TJ- m r4 -H « © e
M r t M H •«1- m ^ - v i O O O O
Tt « ^ - in wie » o\ « — o o
(^ u-i © so O <N OS O •-H ~1 O ~H
'S, 3. s • e
I—I V3 ^ «5
'—| — HH —. O C <D G M H Ifl l . r^ o r^ q U -H v j es
a
an S.
Ö "e t» o cfi 4> o C3 Oj
cl
Ö 00
E
ê ^7
00
CS SO
c s ' N O - i w-i • * t ~ fS O O O O
^-i i n -3- <S ~H OS O f > — ! © - * ©
so so •>*• os O 0\ c i d —i o « o
CU _ o
'S, "S S E
H I» r W
«ü C a> c os c c« s
u 2 u ° , Meded. Landbouwhogeschool Wageningen 70-12 (1970) 25

3.3.4. Applicability
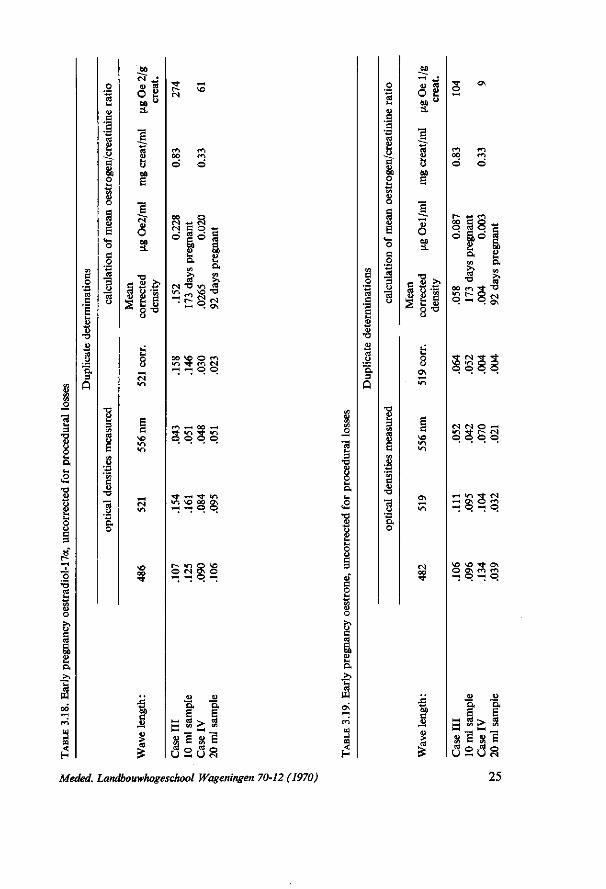
In the tables 3.16. to 3.19. a number of representative figures are shown. Oestrogens excreted during early pregnancy have been determined only in the first stage of this research. It is obvious that the sample volume should be between 50 and 500 ml in order to get reliable oestrogen estimates in pregnancies up to 100 days. Since the interest was mainly in late and mid pregnancy the routine catheter technique was not changed which limits the sample volume to about 40 ml. It should be easy though to get larger samples from the cows. Case I in table 3.16. and 3.17. shows a total daily oestrogen output of about (2923 + 535) x 14.4 = ± 50 mg (268th day of pregnancy). The daily output of case IV is about 1 mg (92nd day). These data are not corrected for procedural losses.
The diurnal rhythm studies (chapter 5) also provide information about the applicability of the method. It will be shown that the moment of urine sampling during a day is not crucial.
Another criterion of the applicability of the method is the laboratory technician's time consumed by the analysis. One person can easily perform about 48 single determinations per week without any assistance.
Bovine urine samples can be stored at 4°C, without any damage to the oestrogen content. This was proven by an experiment in which a urine sample of two cows was investigated 5 times during 2 years and 3 months (table 3.20.).
TABLE 3.20. The influence of storage of urine samples at 4°C on the oestrogen/creatinine ratios
date of analysis
1-11-1966 17-11-1966 1- 6-1967
22- 6-1967 29- 1-1969
(ig Oe2/ g créât.
551 495 544 507 756
Cow l
(J-g Oel / g créât.
250 221 221 137 297
(xg Oe2/ g créât.
1867 1808 1523 2089 2093
Cow 2
(xg Oel/ g créât.
744 625 545 489 787
3.4. GENERAL DISCUSSION
Since bovine pregnancy urine contains the labile oestradiol-17a it was considered worthwhile to try the enzymatic hydrolysis instead of the acid hydrolysis (VELLE, 1958), which probably destroys a large part of the oestradiol-17a. Some investigators have not used the enzymatic hydrolysis because of the possible presence of enzyme inhibitors in urine. KUSHINSKY and OTTERNESS
(1964) found that one can successfully get rid of those inhibitors by using the séphadex-gel filtration technique developed by BELING (1963). The results of this chapter show, however, that this gel filtration is not required for bovine pregnancy urine.
26 Meded. Landbouwhogeschool Wageningen 70-12 (1970)

Since the Kober-colour-reaction method of NOCKE (1961) is used, the optical densities of oestrone fractions are read at 482, 519 and 556 nm and of the oestradiol-17a fractions at 486, 521 and 556 nm. Discovering that the maximum absorption for oestrone was measured at a somewhat lower wave-length (516 nm) in June 1967, the oestrone fractions have since been measured at the wave-lengths of 476, 516 and 556 nm.
The fractions obtained in the described method contain very few impurities which interfere with the colorimetric measurement of the oestrogens. This is in contrast with the method described by BROWN (1955) and used for human urine. This discrepancy in results can be due to differences in human and bovine urine and/or to the différences in the method of hydrolysis (acid versus enzymatic). In urine of non-pregnant or early pregnant cows oestrogen concentrations are normally very low; in such cases it is necessary to use larger quantities of urine in order to obtain reliable results. It is probable that in such cases more impurities interfere in the colorimetric measurement of the oestrogens.
The sources of errors, that can influence the ultimate result are : a. the analysis for oestrogen content; b. the analysis for creatinine content; c. sampling errors.
Studies about the precision of the method show that an error of only 10% or less is due to the actual oestrogen analysis.
The results of the different recovery tests do not show an anlysis step where high losses occur.
The results begin to scatter considerably at the lower levels; therefore BROWN (1955) concluded that the sensitivity of the method probably depends on the sensitivity of the colour reaction and the accuracy of the colour measurements, not on the extraction procedure. So larger sample volumes could increase the reliability of the method in early pregnancy.
A higher sensitivity of the method, required for samples with a lower oestrogen content, can be obtained by replacing the colorimetry by fluorimetry. For the purpose of this study this high sensitivity was not required.
Urinary creatinine proved to be a useful endogenous indicator for daily urine production. The analytical procedure for estimating urinary creatinine content (FOLIN, 1941) shows a low coefficient of variation (1,25%).
Meded. Landbouwhogeschool Wageningen 70-12 (1970) 27

4. P R E L I M I N A R Y E X P E R I M E N T S FOR S T U D Y I N G THE TOTAL I N D I V I D U A L V A R I A T I O N IN THE
Q U A N T I T A T I V E U R I N A R Y O E S T R O G E N E X C R E T I O N D U R I N G P R E G N A N C Y
4.1. INTRODUCTION
Since little was known about the variation in urinary oestrogen excretion between individual pregnant cows, two preliminary experiments were carried out to study this variation.
The two experiments were carried out in two consecutive years, 1966/1967 and 1967/1968.
Because little was known about the individual variation in the trend of the urinary oestrogen excretion during pregnancy, in the first experiment a simple sample time-table was used.
The second experiment was designed to obtain information about the possible contribution of the stage of gestation, breed, season, herd, parity of cow, birth weight, and length of the gestation period. Therefore, in experiment II the animals were sampled at specific intervals of gestation.
4.2. EXPERIMENT I (1966/1967)
4.2.1. Material and methods
4.2.1.1. Ma te r i a l The sampling system, using catheterisation, limited the experimental animals
to those owned by research institutes. The following institutes placed their cows at our disposal: Herd I: The animal husbandry department of the Agricultural University (May 9-1966 to August 7-1967). Herd II: The institute for Research on Varieties of field crops (I.V.R.O., identical twins, November 1-1966 to May 22-1967). Herd III: The Animal Husbandry Research Institute (I.V.O., identical twins. November 8-1966 to February 7-1967).
At farm I all lactating pregnant cows were sampled once every month. During the dry period these cows were sampled once every week. This procedure was changed in February 1967 that the cows were sampled once every two weeks during the 8th month of pregnancy. Because of handling difficulties heifers were sampled only during winter time in the stable. So the heifers at farm I and all cows at farm II and III are sampled only during part of the last trimester of gestation.
A total of 57, 22 and 20 cows and heifers of herds I, II and III respectively participated in this experiment. Of these 99 animals 993 samples have been analysed with the method, described in chapter 3.
28 Meded. Landbouwhogeschool Wageningen 70-12 (1970)

Herd I included cows of all 3 Dutch breeds which were mated or inseminated by bulls of their own breed.
Herd II and III consist of identical twins of the two main Dutch breeds (Friesian and Red and White) and were mated by one Friesian bull per herd.
All animals were housed in the conventional way (stanchion barns) from November until the last of April and were placed on pasture in summer.
4.2.1.2. Methods The samples were grouped together according to the stage of gestation. The
gestation period was divided into 12 intervals from conception. A thirteenth interval consisted of samples, taken during the last 14 days before parturition (including some data of intervals 11 and 12). These data of interval 13 were corrected according to the number of days the sample was taken before parturition as shown in paragraph 4.3.1.2.
Some animals were sampled more than once during one interval. In such cases the average of the two samples has been calculated.
The samples, taken before day 150 after conception, frequently showed an oestrogen content below the sensitivity of the analytical method. Therefore, these values were less reliable and were left out of the statistical analysis. The other 9 intervals with the number of animals, sampled per interval, are shown in table 4.1.
After transformation with square root (according to paragraph 4.3.1.2.) the means and standard deviations per interval have been calculated for Oe2 and Oel. These data were also used for a comparison between years, within cows participating in both experiments.
TABLE 4.1. Mean Oe2 and Oel excretion rate and standard deviations per sampling interval in Experiment I.
Interval
4 5 6 7 8 9
10 11 12 13 + +
days of gestation
150-179 180-209 210-219 220-229 230-239 240-249 250-259 260-269 270-279
Oe2+
Mean
15.69 22.60 25.92 25.19 28.75 32.12 36.68 45.42 49.00 51.70
S.D.
4.94 6.54 7.07 6.57 6.17 7.57 9.44 9.11
11.67 10.94
Oel
Mean
11.97 15.76 17.45 17.90 19.28 22.20 24.90 27.32 27.18 27.39
f
S.D.
2.95 3.61 4.21 3.61 4.00 4.72 5.46 4.80 5.19 5.09
number of animals sampled per
interval
30 45 33 57 64 76 68 43 68 98
+ + corrected to 1 day before parturition. + expressed as square root of (i.g oestrogen/g creatinine.
4.2.2. Results As is shown in table 4.1. the excretion of Oe2 increases until parturition while
the excretion of Oel increases only until day 260-269 of pregnancy. The stand-
Meded. Landbouwhogeschool Wageningen 70-12 (1970) 29

ard deviation also depends on the stage of gestation or rather on the level of the oestrogen excretion.
Within interval a correlation coefficient of 0.59 between Oe2 and Oel could be estimated.
4.3. EXPERIMENT II (1967/1968)
4.3.1. Material and methods
4.3.1.1. Ma t e r i a l The same 3 herds participated in this experiment and a fourth herd with
identical twins of the Friesian breed was added (owned by the Bureau of Joint Services at Wageningen).
The samples were collected between the following dates : Herd I : August 7, 1967 - October 2, 1968 Herd II : November 3, 1967 - June 10, 1968 Herd III: August 9, 1967 - June 18, 1968 Herd IV: November 3, 1967 - May 7, 1968.
A total of 46, 21, 45 and 17 cows and heifers of herds I, II, III and IV respectively, participated in experiment II. They were all sampled in the following predetermined stages of gestation : 1. 180 ± 3 days 2. 210 ± 3 days 3. 240 ± 3 days 4. 260 ± 2 days 5. 270 ± 2 days 6. During the last 14 days before parturition. In short gestations only the 5 first samples were taken and in long gestations (over 280 days) frequently more than 1 sample was taken between day 270 after conception and the day of parturition.
TABLE 4.2. Results of Fisher's normality test
Sampling period
1 2 3 4 5
n
129 129 129 129 129
raw data
20.56** 21.94** 39.04** 37.94** 18.39**
Oe2
X2
square root
3.15 4.12 4.00 6.98* 2.89
(chi-•square)
raw data
21.50** 9.56**
20.58** 5.00
33.59**
Oel
square root
2.91 5.64 1.95 1.88 4.73
* P < 0.05 ** P < 0.01
4.3.1.2. Me thods With the normality test of Fisher, it was shown that with a square root-
transformation a normal distribution was approximated (table 4.2.). In tabele 4.2. the calculated x2 is presented for the raw and transformed data.
30 Meded. Landbouwhogeschool Wageningen 70-12 (1970)

From these results it was concluded that all data should be transformed and therefore all results will be presented as square roots of the \ig oestrogen/g creatinine ratios.
The data of all urine samples collected during the last 14 days of pregnancy (called sampling period 6) are averaged and corrected for the stage of pregnancy to one day before parturition according to the regression lines, shown in paragraph 6.3.1., as is shown in table 4.3.
TABLE 4.3. Correction of data for sampling period 6. C T gestation length stage of gestation QeT ^
number at sampling 039 281 days 277 days 55.0 28.4
270 days 47.0 26.8
55.0 + 47.0 + 3 x 0.63" + 10 x 0.63" Oe2 corrected = = 55.0
2 28.4 + 26.8
Oel corrected = = 27.6 2
a: Oe2 and Oel expressed as square root of \ig oestrogen/g creatinine b: Regression coefficient of Oe2 = 0.63 and of Oel = 0.00 4.3.2. Results 4.3.2.1. Influence of stage of gestation
As is shown in table 4.4 the mean oestrogen level and the standard deviation level increases with the stage of gestation.
The oestradiol-17« excretion increases until parturition but the excretion of oestrone is rather constant during the sampling periods 4, 5 and 6 (see also experiment I, paragraph 4.2.2.).
Because of this trend in the urinary oestrogen excretion rate with increasing stage of gestation, other factors are analysed within sampling periods.
TABLE 4.4. Influence of stage of gestation on urinary oestrogen excretion
Sampling period
1 2 3 4 5 6
Number of cows
129 129 129 129 129 126
Oe2+
Mean
23.51 25.77 31.56 41.26 47.69 52.14
S.D.
5.36 5.90 6.75 8.35 9.46 8.96
Oel +
Mean
16.03 18.11 22.49 29.35 30.18 30.10
S.D.
3.08 3.41 4.21 5.14 5.27 4.80
+ expressed as square root of (/.g oestrogen/g creatinine ratio.
4.3.2.2. Differences between experimental farms Figure 4.1. shows the urinary oestrogen excretion curves from cattle at each
farm. The differences between farms are significant at the 1 % level for all periods except periods 2 and 5 for Oe2 which are significant at the 5 % level and period 6 for Oe2 which shows a non significant difference.
Meded. Landbouwhogeschool Wageningen 70-12 (1970) 31
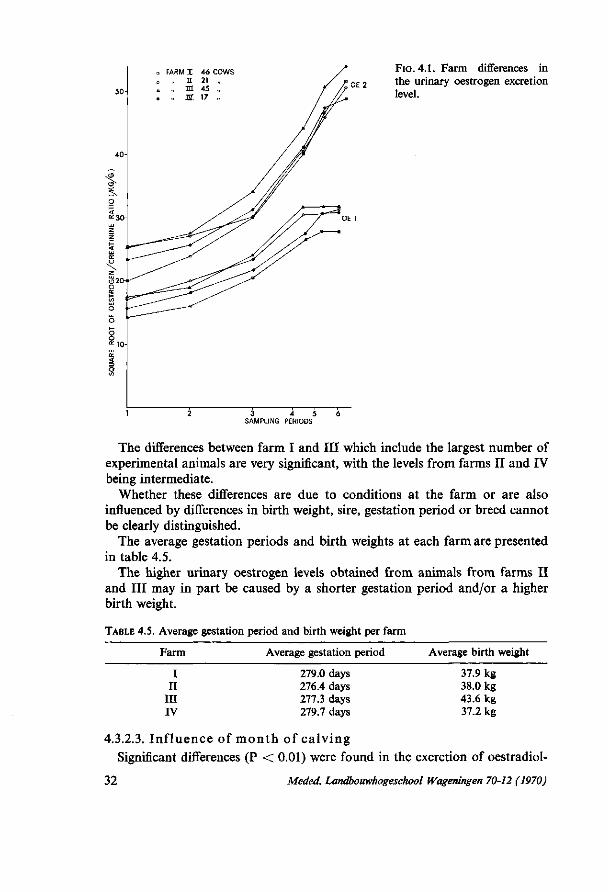
FIG. 4.1. Farm differences in the urinary oestrogen excretion level.
3 4 5 SAMPLING PERIODS
The differences between farm I and III which include the largest number of experimental animals are very significant, with the levels from farms II and IV being intermediate.
Whether these differences are due to conditions at the farm or are also influenced by differences in birth weight, sire, gestation period or breed cannot be clearly distinguished.
The average gestation periods and birth weights at each farm are presented in table 4.5.
The higher urinary oestrogen levels obtained from animals from farms II and III may in part be caused by a shorter gestation period and/or a higher birth weight.
TABLE 4.5. Average gestation period and birth weight per farm
Farm Average gestation period Average birth weight
I II
III IV
279.0 days 276.4 days 277.3 days 279.7 days
37.9 kg 38.0 kg 43.6 kg 37.2 kg
4.3.2.3. Inf luence of mon th of ca lving Significant differences (P < 0.01) were found in the excretion of oestradiol-
32 Meded. Landbouwhogeschool Wageningen 70-12 (1970)

FIG. 4.2. The influence of month of calving on the urinary excretion of oestrogens.
5s
MONTH N
2 19
• SAMPLING PERIOD 6 5 4 3 2 I
MONTH N
1 6
2 19
3 29
A 22
5 12
6 3 / 8
a 6
9 7
10 2
11 S
12 10
17a for all sampling periods and for oestrone only for period 3 (P < 0.05). For this analysis the cows were grouped together according to their month of calving (figure 4.2.).
Only a limited number of cows calved between June and December and no definite conclusions can be drawn about this period. Months 8 and 9 are only
Meded. Landbouwhogeschool Wageningen 70-12 (1970) 33
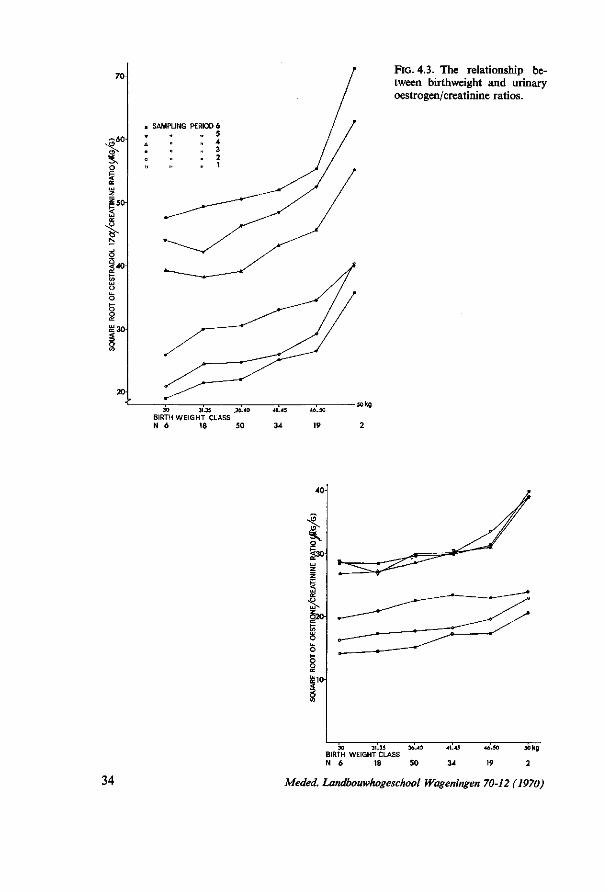
g §40-
SAMPLING PERIOD 6 5 4
FIG. 4.3. The relationship between birthweight and urinary oestrogen/creatinine ratios.
30 3 U 5 .36.40
BIRTH WEIGHT CLASS N 6 18 50
41.45
34
46.50
19 2
40-
O §30-
g 2 0
te o o
30 BIRTH N 6
31.35 WEIGHT CLASS
18
36-40
50
41.45
34
46.50
19
50 kg
2
34 Meded. Landbouwhogeschool Wageningen 70-12 (1970)
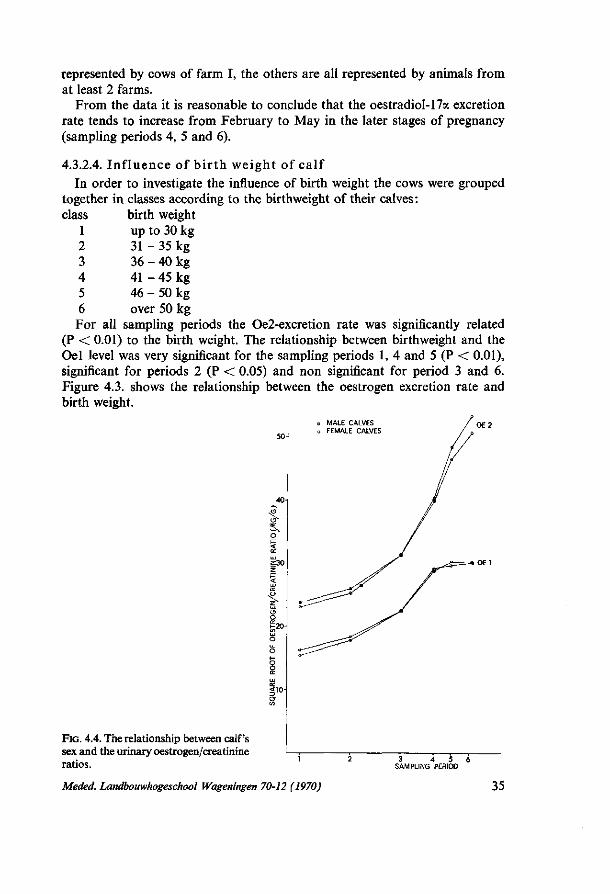
represented by cows of farm I, the others are all represented by animals from at least 2 farms.
From the data it is reasonable to conclude that the oestradiol-17a excretion rate tends to increase from February to May in the later stages of pregnancy (sampling periods 4, 5 and 6).
4.3.2.4. Inf luence of b i r th weight of calf In order to investigate the influence of birth weight the cows were grouped
together in classes according to the birthweight of their calves : class birth weight
1 up to 30 kg 2 3 1 - 3 5 kg 3 3 6 - 4 0 kg 4 4 1 - 4 5 kg 5 4 6 - 5 0 kg 6 over 50 kg For all sampling periods the Oe2-excretion rate was significantly related
(P < 0.01) to the birth weight. The relationship between birthweight and the Oel level was very significant for the sampling periods 1, 4 and 5 (P < 0.01), significant for periods 2 (P < 0.05) and non significant for period 3 and 6. Figure 4.3. shows the relationship between the oestrogen excretion rate and birth weight.
o MALE CALVES o FEMALE CALVES
5,
%
FIG. 4.4. The relationship between calf's sex and the urinary oestrogen/creatinine ratios. 3 4 5
SAMPLING PERIOD
Meded. Landbouwhogeschool Wageningen 70-12 (1970) 35

4.3.2.5. Relationship with calf's sex Though no significant differences between the sexes could be established,
figure 4.4. shows a very interesting trend for Oe2. In contrast to the other sampling periods there is no difference at all at sampling period 3. This may indicate that the oestrogen curve is already influenced by the earlier maturing character of the female calf, a fact what is proven to be valid for growth curves of young cattle (Vos, 1969).
4.3.2.6. Cross bred versus pure bred calves All 3 breeds were represented in the experiment. Eighty black and white
Friesians were distributed over all 4 farms, they were all mated by a Friesian bull. Twenty five red and whites of farm I were mated by red and white bulls and the twenty two red and white twins of farm II and III were mated by the black and white bull, used also for the black and white twins on these farms.
The Groninger type (white faced black) was represented by 2 cows in farm I, inseminated from Groninger bulls, and a twinpair on farm III mated by the Friesian bull of this farm.
In order to carry out an analysis of variance the experimental cows were grouped together according to their breed, whilst the crosses were considered as one group ;
5s
FRIESIAN , RED AND WHITE
FRIESIAN X RED AND WHITE
1 2 SAMPLING PERIOD
FIG. 4.5. Oestrogen/creatinine ratios of cows, pregnant of crossbred -versus pure bred calves.
36 Meded. Landbouwhogeschool Wageningen 70-12 (1970)
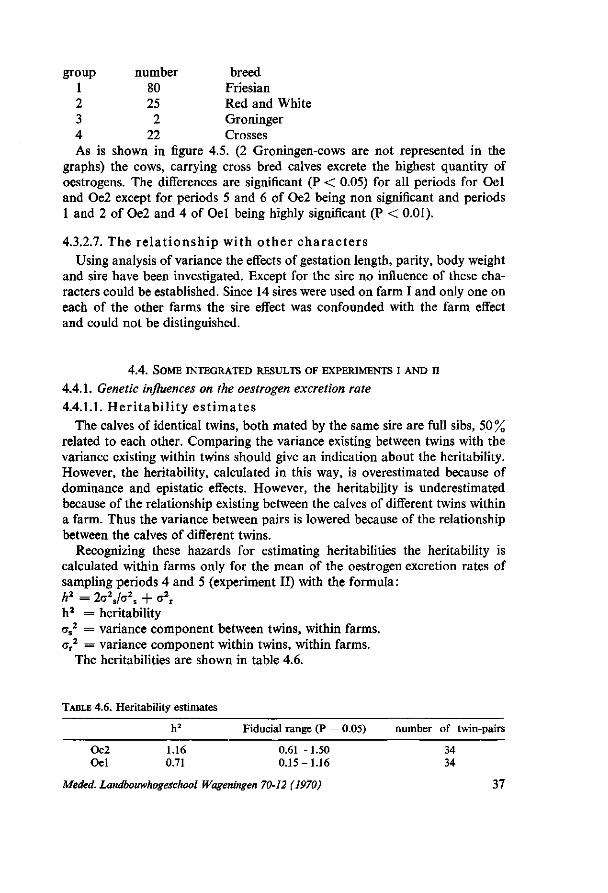
group 1 2 3 4
number 80 25 2
22
breed Friesian Red and White Groninger Crosses
As is shown in figure 4.5. (2 Groningen-cows are not represented in the graphs) the cows, carrying cross bred calves excrete the highest quantity of oestrogens. The differences are significant (P < 0.05) for all periods for Oel and Oe2 except for periods 5 and 6 of Oe2 being non significant and periods 1 and 2 of Oe2 and 4 of Oel being highly significant (P < 0.01).
4.3.2.7. The relationship with other characters Using analysis of variance the effects of gestation length, parity, body weight
and sire have been investigated. Except for the sire no influence of these characters could be established. Since 14 sires were used on farm I and only one on each of the other farms the sire effect was confounded with the farm effect and could not be distinguished.
4.4. SOME INTEGRATED RESULTS OF EXPERIMENTS I AND II
4.4.1. Genetic influences on the oestrogen excretion rate 4.4.1.1. Heritability estimates
The calves of identical twins, both mated by the same sire are full sibs, 50 % related to each other. Comparing the variance existing between twins with the variance existing within twins should give an indication about the heritability. However, the heritability, calculated in this way, is overestimated because of dominance and epistatic effects. However, the heritability is underestimated because of the relationship existing between the calves of different twins within a farm. Thus the variance between pairs is lowered because of the relationship between the calves of different twins.
Recognizing these hazards for estimating heritabilities the heritability is calculated within farms only for the mean of the oestrogen excretion rates of sampling periods 4 and 5 (experiment II) with the formula : h1 = 2a2Jo\ + a\ h2 = heritability as
2 = variance component between twins, within farms. <7r
2 = variance component within twins, within farms. The heritabilities are shown in table 4.6.
TABLE 4.6. Heritability estimates
h2 Fiducial range (P = 0.05) number of twin-pairs
Oe2 1.16 0.61-1.50 34 Oel 0.71 0.15-1.16 34
Meded. Landbouwhogeschool Wageningen 70-12 (1970) 37

4.4.1.2. Differences within cows between foetuses of two consecutive years
A total number of 60 cows of farms I, II and III participated in both experiments, so comparisons could be made between years within cows. It concerns full sib calves if in both years the cow was mated by the same sire and half sibs if a different sire was used. It was therefore anticipated that the variance between years within animals would be lower than the variance between animals within years, for the calves of one cow are as an average more related to each other than the calves of different cows.
Only a limited number of cows was mated in both years by the same sire (table 4.7.). Part of the variation of the difference between years was also caused by the difference in sire.
TABLE 4.7. Number of animals for comparison between years
Sampling Number of animals per period
period 1 2 3 4 5 6
Same sire in both years
37 14 7
37 15 8
36 14 8
33 15 12
10 0
12
Farm I 16 24 II III
For each year, the means and standard deviations were calculted within farms for Oe2, Oel and for the differences (FOe2 and FOel) of Oe2 and Oel between year 1 and year 2. Analysis of variance showed that significant differences existed within years between farms for the mean Oe2 and Oel level. Between farm differences were non significant for FOe2 and FOel.
The year differences (FOe2 and KOel) were tested for significance with the Student t-test with the formula t = V\/n/Sv in which n = number of experimental animals F = mean difference between years Sv = standard deviation of F
As is shown in table 4.8. the average excretion rate of oestrone was found to be significantly higher in 1968 than in 1967, in sampling periods 3, 4, 5 and 6 (P < 0.05 and P < 0.01 resp.).
However, this difference between years may have been caused by the improvement in the analytical method since in the second experiment a better purified urinary oestrone fraction could be obtained; an improvement also shown in chapter 5.
In order to investigate whether the variation within cows, between years (higher average relationship between calves) is lower than the variation between cows, within years a comparison was made of the standard deviation of the difference within cows between years (FOe2 and F Oel) and the calculated average standard deviations within years between cows.
38 Meded. Landbouwhogeschool Wageningen 70-12 (1970)
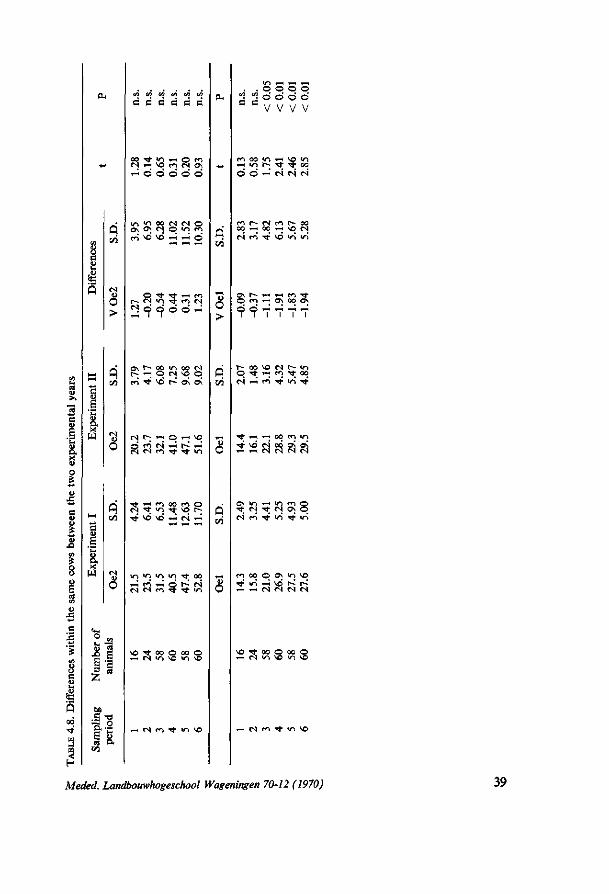
CO
>* 13 G S e C » a X u o |
C <u
S3 a S *c u tt X
HH
w
I1
•S -a 'S-2
IA IO (A « K (A
d d a d d d
*-< o o o o o
« l ^ O ^ H H O
^ ^ O O H
ON t ^ 00 >/"! 00 ( S
rn ^* vo r- ON ON
M h r t O H \ Û
Tf \ 0 VÛ ^H N rt
i ^ <o i ^ i ^ r f oo
\© -^- oo O oo O i—i ( S «O \ 0 V~i \D
H f^ ( 1 Tj- «O \ 0
Q en 00 <N
t ~
rn
CS m 00 « •^ vd
l*~ 00
»o »n
2 o O O O V V V V
O O - i N N N
? ? T 7 7 7
N oo O N h- in P ""t *"ï *"*! ^ °°. <S 1-H r 'ï ^ »O Tfr
^ - H 1 1 oo m i n
( S n Tf «o Tf i n
w o o o 0 \ ^ ^ O
^O Tf 00 Q OO »H ( S i n 'O i n
~ i <S m ^ - *n \ 0
Meded, Landbouwhogeschool Wageningen 70-12 (1970) 39
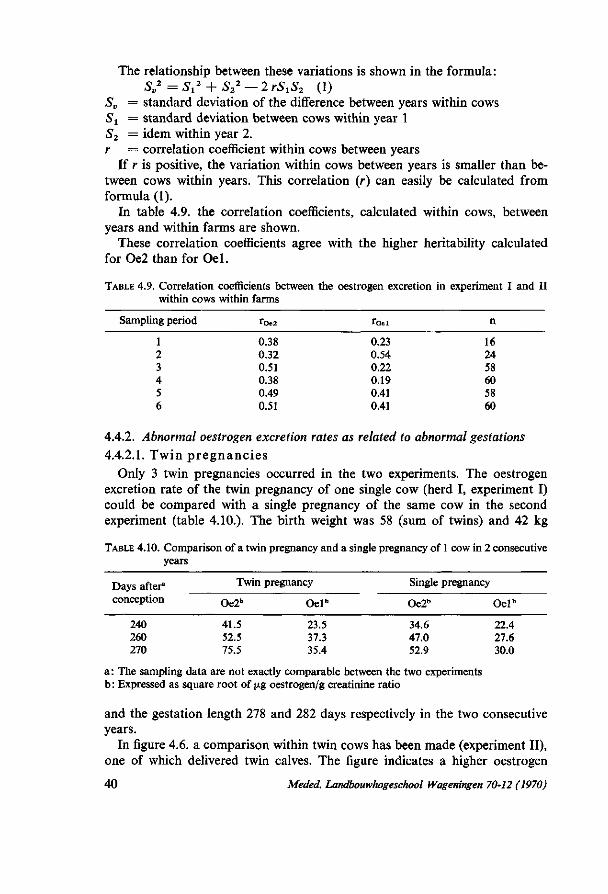
The relationship between these variations is shown in the formula: Sv
2 = S S + S22 — 2 rS^ (1)
Sv = standard deviation of the difference between years within cows St = standard deviation between cows within year 1 S2 = idem within year 2. r = correlation coefficient within cows between years
If r is positive, the variation within cows between years is smaller than between cows within years. This correlation (r) can easily be calculated from formula (1).
In table 4.9. the correlation coefficients, calculated within cows, between years and within farms are shown.
These correlation coefficients agree with the higher heritability calculated for Oe2 than for Oel.
TABLE 4.9. Correlation coefficients between the oestrogen excretion in experiment I and II within cows within farms
Sampling
1 2 3 4 5 6
period rOe2
0.38 0.32 0.51 0.38 0.49 0.51
Toel
0.23 0.54 0.22 0.19 0.41 0.41
n
16 24 58 60 58 60
4.4.2. Abnormal oestrogen excretion rates as related to abnormal gestations
4.4.2.1. Twin p regnanc ies Only 3 twin pregnancies occurred in the two experiments. The oestrogen
excretion rate of the twin pregnancy of one single cow (herd I, experiment I) could be compared with a single pregnancy of the same cow in the second experiment (table 4.10.). The birth weight was 58 (sum of twins) and 42 kg
TABLE 4.10. Comparison of a twin pregnancy and a single pregnancy of 1 cow in 2 consecutive years
Days after8
conception
240 260 270
Twin
Oe2b
41.5 52.5 75.5
pregnancy
Oel"
23.5 37.3 35.4
Single pregnancy
Oe2b Oel"
34.6 22.4 47.0 27.6 52.9 30.0
a: The sampling data are not exactly comparable between the two experiments b: Expressed as square root of |xg oestrogen/g creatinine ratio
and the gestation length 278 and 282 days respectively in the two consecutive years.
In figure 4.6. a comparison within twin cows has been made (experiment II), one of which delivered twin calves. The figure indicates a higher oestrogen
40 Meded. Landbouwhogeschool Wageningen 70-12 (1970)
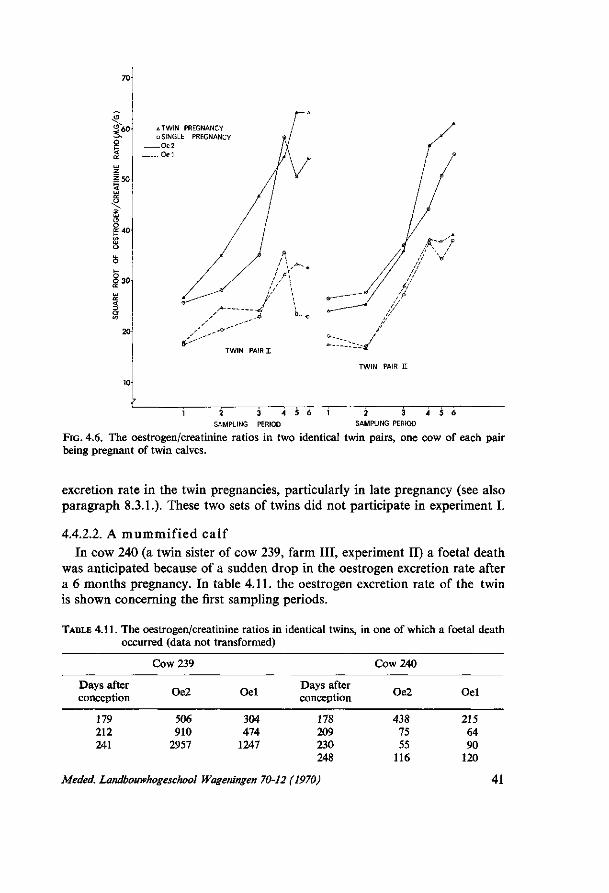
5T g
o 30
•L
«TWIN PREGNANCY o SINGLE PREGNANCY
— Oe2 — Oe 1
1 1 2 3
SAMPLING PERIOD
4 5 6 2 3 4 5
SAMPLING PERIOD
FIG. 4.6. The oestrogen/creatinine ratios in two identical twin pairs, one cow of each pair being pregnant of twin calves.
excretion rate in the twin pregnancies, particularly in late pregnancy (see also paragraph 8.3.1.). These two sets of twins did not participate in experiment I.
4.4.2.2. A mummified calf In cow 240 (a twin sister of cow 239, farm III, experiment II) a foetal death
was anticipated because of a sudden drop in the oestrogen excretion rate after a 6 months pregnancy. In table 4.11. the oestrogen excretion rate of the twin is shown concerning the first sampling periods.
TABLE 4.11. The oestrogen/creatinine ratios in identical twins, in one of which a foetal death occurred (data not transformed)
Cow 239 Cow 240
Days after conception Oe2 Oel
Days after conception Oe2 Oel
179 212 241
506 910
2957
304 474
1247
178 209 230 248
438 75 55
116
215 64 90
120
Meded. Landbouwhogeschool Wageningen 70-12 (1970) 41

At 6 months pregnancy the oestrogen excretion rate of both cows was about the same, but 30 days later the oestrogen excretion in cow 240 has decreased considerably.
On day 236 after conception cow 240 delivered a mummified calf. It is, therefore, probable that the calf died between days 178 and 209 after conception.
4.5. DISCUSSION
Because some factors are confounded with each other, the results should be interpreted cautiously. It was not possible to partition the total variance into parts caused by different factors such as season, sire, breed, farm, birth weight, sex, etc. To investigate the influence of these factors, special studies should be initiated as is done for genetic influences (chapter 8 and 9).
The increase in oestrogen excretion rate with the stage of pregnancy was obvious in both experiments though oestrone remains almost constant during the last 2 weeks of pregnancy (see also chapter 6.). The standard deviation increases with the stage of pregnancy. The Oe2-excretion rate is correlated with the Oel-excretion rate, therefore, factors affecting the Oe2-excretion rate usually also affect the Oel-excretion rate.
ERB et al (1967) found a somewhat higher oestrogen excretion rate in their experimental cows than the data of experiment I as is shown in table 4.12.
TABLE 4.12. Comparison of data of ERB et al (1967) with data of experiment I.
Days after conception
101-123 165-175 200-212 226-237 250-254 271-285
Data of ERB et al (1967)
number of cows
13 5 7 8 5
10
Total oestrogens
l^g/hour ± S.D.
322 ± 110 604 ± 149 640 ± 190 767 ± 114
2165 ± 1663 3641 ± 775
Hg/g creat.+
536 1006 1066 1278 3607 6066
Data of e
Sampling period
— 4 6 8
10 12
xperiment I
Oe2 + Oel (ig/g creat.
— 389 977
1199 1965 3140
+ Corrected with an hourly creatinine excretion of 600 mg
The data of ERB et al (1967) were expressed per hour. In order to facilitate the comparison the data are divided by 0.6 (g creatinine per hour) and are then expressed as [i.g/g creatinine. The data of paragraph 4.2.2. (square roots) are squared.
The total oestrogens reported by ERB et al (1967) include oestradiol-17ß and oestriol (10% of total oestrogens) and are corrected for procedural losses. Nevertheless the data reported by ERB et al (1967) are higher, particularly in late pregnancy. This difference can only be explained by differences in the analytical procedure, experimental animals or environmental conditions. In a later
42 Meded. Landbouwhogeschool Wageningen 70-12 (1970)

publication (1968) ERB et al have their data corrected to a 500 kg body weight. These data are somewhat lower than those shown in table 4.12.
In still another study with twinning cows the same research team (RANDEL
et al, 1968) shows oestrogen/creatinine ratios on the same level as are shown in paragraphs 4.2.2. and 4.3.2. (table 4.13.).
The rather high differences between the herds I and III concerning the excretion rates of both oestrogens might be caused by differences in sire, as well as other factors, for example management.
The influence of the month of calving coincides with the increase in daylength and light intensity. In chickens it is well known that these light factors influence the hormonal mechanisms of reproduction, ultimately shown in an increase or decrease in the ovulation rate. However, it is assumed that oestrogens are produced in the pregnant uterus by the foetus (VELLE, 1958). Therefore the relationship between external stimuli, e.g. light, and intra-uterine oestrogen production is hard to explain. This relationship requires a special investigation. GUL (1962) found an increase in urinary oestrogen excretion rate in nonpregnant heifers, shortly after having them brought to pasture.
The positive relationship between birth weight and oestrogen excretion rate agrees with the studies of GOECKE and TIMONEN (1966) and DÄSSLER (1967) with babies. This effect of birth weight seems to be independent of parity and cow's body weight for these factors are not related with the oestrogen excretion rate. It is indicated that the higher mean birth weight of farm III coincides with the higher oestrogen excretion rate of the cows of farm III, so these factors are also confounded.
The small differences in the Oe2 excretion rates in late pregnancy between the sexes might be due to differences in the mean birth weight between sexes. It is postulated that this birth weight difference as well as the differences in the oestrogen excretion rate are caused by the earlier maturity of the female calf (Vos, 1969).
The Red and White twin cows, sired by a Friesian bull show a higher mean oestrogen excretion rate than the pure breeds. This factor again is confounded with the farm-differences. An explanation for this difference might be found, however, in the principle of heterosis, which is known to play a role in fertility traits.
The high heritabilities do indicate that the oestrogen excretion rates (at 260-270 days after conception) of twin cows resemble each other much more than those of less closely related animals. The well protected oestrogen production site (uterus) may explain the relatively small influence of environmental conditions. The identical twins are kept under quite similar conditions, at least on the same farm, which also causes a low estimate for the environmental variance.
The oestrogen excretion rates of the same cows in two consecutive gestations were well correlated with each other which is in good agreement with the calculated heritabilities. The significant differences between the oestrone
Meded. Landbouwhogeschool Wageningen 70-12 (1970) 43
excretion rates of both years in late pregnancy are possibly due to improvement in the analytical technique.
Though it might be anticipated that a cow, pregnant with twins, excretes a double quantity of oestrogens because the oestrogens originate from the foetal tissues, this has not been proven to be sufficient by three twin pregnancies. It is indicated, however, that more oestrogens are excreted in twin pregnancies than in single pregnancies.
RANDEL et al (1968) also observed a much higher oestrogen/creatinine ratio in twinning cows. They compared 2 groups of 6 pregnant cows, one group pregnant with one calf, the other with twins (table 4.13.).
TABLE 4.13. Urinary oestrogen excretion rate preceding birth of twins in cows (RANDEL et al, 1968)
Stage of pregnancy (ig total oestrogen/g creatinine ± S.D.
6 single pregnancies 6 twin pregnancies
252-256 days 920 ± 320 990 ± 250 259-265 days 1260 ± 350 1610 ± 290 267-275 days 1300 ± 170 2630 ± 240
1-4 days 1600 ± 420 4720 ± 2240 before delivery
The authors did not explain why the figures of table 4.13. concerning single pregnancies are so much lower than the figures shown in table 4.12.
Higher oestrogen excretion rates in human twin pregnancies are observed by DICKEY (1969) and KELLAR et al (1959).
As indicated by KLOOSTERMAN and Huis IN 'T VELD (1961) for the human and GRUNERT and AHLERS (1969) for the bovine, a sudden drop in the oestrogen excretion rate occurs after intra uterine foetal death. This phenomenon is comparable with the decrease in the oestrogen excretion rate, occuring after foetal death, followed by mummification as described in paragraph 4.4.2.2.
44 Meded. Landbouwhogeschool Wageningen 70-12 (1970)
5. THE D I U R N A L VARIATION IN BOVINE U R I N A R Y O E S T R O G E N E X C R E T I O N D U R I N G LATE P R E G N A N C Y
5.1. INTRODUCTION
If a urine sample is taken at an arbitrary time during the day, the oestrogen content is very much dependent on the diurnal rhythm existing in the urine output per time interval. The oestrogen content of such a sample is not useful without any correction. Therefore, it should be investigated whether the oes-trogen/creatinine ratio is subject to a diurnal rhythm. In order to check this hypothesis three experiments were carried out (table 5.1).
TABLE 5.1. Experiments studying the diurnal variation in the urinary oestrogen excretion
Experiment
I
II
III
Animals
Cow 1 Cow 2, 3, 4 and 5 cow 6, 7, 8 and 9 cow 6, 7, 8 and 9 cow 10, 11, 12 and 13
Consecutive samples
34 hours 28 hours 24 hours
8 x 3 hours 1 6 x 3 hours
Date
18/19 april 1966 10/11 may 1966
2/3 sept. 1968 3/4 sept. 1968
11/13 nov. 1968
5.2. EXPERIMENTAL PROCEDURES
Studies were performed in 13 dairy cows during the last trimester of pregnancy. The stage of each individual pregnancy at the beginning of each experiment is given in table 5.2. The experimental animals were all mature cows of the two main Dutch dairy breeds. During all experiments the cows were housed in a stanchion barn and fed at about 7.00 A.M. and 5.00 P.M. At the start of each experiment an inflatable permanent catheter was placed in the bladder and inflated with about 75 ml water. The outlet of the catheter was closed with a plug (exp. I and II) or connected to a bottle with a plastic tube (exp. III). The first hourly collection was discarded. The further collections per hour, respectively per 3 hours, were made by removing the plug or emptying the bottle. The volume of these collections was measured and a sample was taken for oestrogen and creatinine analyses.
The concentrations of Oe2, Oel and creatinine in the urine samples were estimated by a single analysis.
In some cows irregularities were observed. 1. Cow 5 voided blood during the last 22 hours. 2. Cow 8 and 9 developed cystitis on September 3/4, 1968. As a result the urine
was partly spoiled after the usual storage at 4 °C. Creatinine was destroyed, but the 3-hour oestrogen yield of cow 9 could still be estimated.
3. No urine could be obtained from cow 4 on May 4, and from cow 8 on September 2, in both cases at 24.00 h.
Meded. Landbouwhogeschool Wageningen 70-12 (1970) 45

d
o •SS ï s O en zi.
+ > +i
<
8 \
^
> O
« so > °X
3 «H
0 \ h m t ^ ^ H ^ H 0 0 N i o
m vo ^O o\ \ û _. — _ _ , . r - © o o o \ m H H H N f H ( S W f H ' t N r t
l o i ^ r - ^ f ^ o o o s r s O ' - H p
^ o * n - ^ - o \ o o » n © t - - > n v o © '
<N <N ^ rt ^ ^H
es <N m r - '
*-H <s ^H es »n © \n
T j - c S O ' d - O N O ' N O N T t
© ^ H O O V O T j - f ^ v o o N o o m m T t s o ^ o r n N O N o o N
•«—( i — < ^ — i i—i *—i T-i CS ^ - V i
0\0\cncocsiriTfr<s<N©v£>
m \ o ^ t r n r - , g - > o ^ H < s \ O M r i < n O d © ' - i < N T t r - i-i «—i i—i f - i ^ j - m
^H ^ CS i-H ^H
• ö - s £ cd
o U
O M \ Û ^ H O \ r H f O Q O \ - • - • - - - • - • - • - ' - ^ I f l ! ^ >n <n m "n <n \o '
o s c S f ^ i o o s © o s > n f N © r i
^ N r j -r^i CÀ © K " t «N • . . -
© w - i t n r ^ o o w - i - ^ - T i - i n r ^ u n
T f 0 O 0 O 0 O 0 O ^ " ' ^ " ' ^ " ' ^ " v V v - v ' V V V V V V V V M f S M M M ( S < N ( S f N A -^ •*• -*• ^ A A A A A A A
c o o o o o o o o o o o c o o o o o c o o o o o
m i f i ' f l ' H M N M O O w n H H h O O ^ i n h - O O O ' - '
rtMM^"n\ûhoo^^hooo\OOHHMMntn
V û r l N O \ » Û O O i n r O c4 - H ' r^ e» © Tf av r-*
0 0 © ï - ; r o ^ O f n T f - « t ^ O
i n © o o T t o O T l - o o © T j -
«** o e o
o 3 7 3 C u
a 'o e o CU
s 3 E 00
E o
x:
'5 T3
- 8 "ë1
3 O
J 3 r^
d Vi
£ u 3 0
Ä
4> O.
' t«
S e
S t l
o. u 61) t S
D
S II
•i-J
Ui
O X! Ui
a •o o
5 3 o "3 u 00 Ui
u
s II 3 o
3 ^
. + + 46 Meded. Landbouwhogeschool Wageningen 70-12 (1970)

4. Cow 13 was treated with a synthetic corticosteroid (flumethasone : 6a-and 9a, difluoro-16a methylprednisolone).
In all experiments the variation coefficients (v.c.) were calculated respectively per 34, 28, 24 and 8 x 3 hours, concerning the 1. urine production 2. creatinine output 3. oestrogen output and 4. oestrogen creatinine ratio,
all per time interval (1 hour resp. 3 hours). The parameter-free FRIEDMAN-test (DE JONGE, 1963) was used to investigate
whether any significant difference between hours could be observed, concerning creatinine and oestrogen output and the oestrogen/creatinine ratios. In order to detect possible cyclic circadian rhythms, a parameter-free trend test was employed (DE JONGE, 1963).
5.3. RESULTS
The hourly fluctuations obtained were expressed by their averages per time interval (per hour or per three hours respectively) and by the variation coefficients (see table 5.2).
A striking similarity exists between the coefficients of variation of the creatinine and oestrogen output per time interval. These coefficients of variation seem to be correlated with the fluctuations in urine output per time interval. The average variation coefficient of the oestrogen/creatinine ratios of experiment II and III (except the second day of cow 13, because of the flumethasone-treatment as part of another experiment) was 13.6 % and 10,6 % for Oe2 and Oel respectively. The coefficient of variation of the oestrone/creatinine ratio was much higher in experiment I, being 23.1%. This varation (exp. II and III: 13.6 and 10.6 %) between time intervals is but little higher than the precision of the method (paragraph 3.3.2.). HAHNEL and STENHOUSE (1967) found 100 times as much variation, in women, between 3 diurnal intervals (6, 6 and 12 hours), within a day, as between duplicate samples. They regarded this daily variation of oestrogen excretion in late pregnancy as physiological.
The FRiEDMAN-test could be applied to the first 24 hours of the experimental cows 1 to 9. The average ranks per hour are summarized in figure 5.1. In order to compile all data of the 3 experiments in one test, the data of the first 9 cows are split up into 8 intervals of 3 hours. The ranks were given from 1 to 24 (or from 1 to 8 in figure 5.2) from the lowest to the highest ratio or output per interval. In this way 18 days, split up into 3-hour intervals could be investigated. The average ranks per interval (figure 5.2) were calculated and the significance of the differences between intervals was estimated according to FRIEDMAN (table 5.3.). Table 5.3. as well as the figures 5.1 and 5.2 show a special sequence in the creatinine output per interval and consequently also in the circadian oestrogen/creatinine ratios. Any special sequence in the excretion
Meded. Landbouwhogeschool Wageningen 70-12 (1970) 47

AVERAGE RANK 15.5
12 14 16 18 20 22 24 2 4 6 8 10 HOUR
FIG. 5.1. The average rank per hour for the excretion of oestradiol-17a, oestrone and creatinine per hour and thg oestrogen/crefttinine ratios (9 cow-days).
TABLE 5.3. FRiEDMAN-test, studying the differences in ranks between intervals
fig Oe2/interval (j.g Oe2/g. creat. mg creat./interval (j.g Oel/g. creat. (j.g Oel/interval + test statistic
3 hour-intervals (18
Ko+
490 1476 1486 2646 430
cow-days)
P
n.s. 0.90 0.90 0.999 n.s.
1 hour intervals (9
Ko +
12,298 15,362 17,824 13,616 13,369
cow-days)
P
n.s. 0.90 0.975 n.s. n.s.
48 Meded. Landbouwhogeschool Wageningen 70-12 (1970)

FIG. 5.2. The average rank per 3 hours for the excretion of oestradioI-17a, oestrone and creatinine per 3 hours and the oe-strogen/creatinine ratios (18 cow-days).
AVERAGE RANK 5.5r
3.5
5.5
3.5 L
5.5
3.5
5.5
3.5
5.5
<,
^™V,
3.5
14.00 17.00 20.00 23.00 02.00 05.00 08.00 11..00 H nUR
of oestrogens per interval has not been demonstrated. A parameter-free trend test, applied to figure 5.1 and testing the number of
series lower and higher than the mean rank of 12.5, shows a cyclic trend in the Oel/creatinine ratio (p < 0.01) and Oe2/creatinine ratio (p < 0.05). The same test, if applied evenly to the creatinine output per interval in figure 5.2, shows clearly a cyclic, circadian trend (p < 0.05).
Figures 5.1 and 5.2 show that the creatinine excretion is low at night and high during day-time. Consequently the oestrogen creatinine ratios are higher during night.
5.4. DISCUSSION
Table 5.2. indicates a rather high association between the coefficients of variation of the output of creatinine and oestrogens per time interval. The variation in the output of creatinine and oestrogens per time interval seems to be largely determined by the variation of output in urine during the individual time interval. The routine developed from 1966 to 1968 resulted in improvement in the analytical method during the latter half of this period. This seems to be the main reason for the differences in coefficients of variation between experiment I and experiments II and III.
The coefficients of variation of the oestrogen creatinine ratios (10-14%) established in 1968 (experiment II and III except the second day of cow 13) is low as compared to data of literature. In 24-hour urine volumes KLOPPER
Meded. Landbouwhogeschool Wageningen 70-12 (1970) 49
(1964) found a v.c. of 21.3%. This v.c. decreased if longer collection periods were used and was 16.6 % at 48-hour collection periods. The fluctuations in urine ouptput per time interval might relatively be smaller in the cow than in the human because of the higher quantity of urine produced by the cow per day. This may explain the relatively high variation coefficients of 40.1 % and 37.0% KLOPPER (1964) observed in humans for the oestriol output in intervals of 1 and 4 hours respectively.
DICKEY et al (1966) found considerable diurnal variations in the rate of oestrogen excretion in 5 pregnant women. The v.c. of 2-hour intervals averaged 36.2% for total oestrogens and 19.1% for the oestrogen/creatinine ratio. A high correlation of 0.855, confirmed by KAHMANN et al, (1969) in oestrogen and creatinine output per interval was thought to be responsible for this lower v.c. of 19.1 % of the oestrogen/creatinine ratio. These authors considered the oestrogen/creatinine ratio to be of more value than oestrogen determination alone in assessing foetal placental activity.
MACKAY et al. (1968) established a high correlation between the 24-hour oestrogen output and the oestrogen/creatinine ratio of a consecutive sample. However, they did not advise to use that ratio as a superior tool in the assessment of placental insufficiency.
In a recent study KLOPPER et al. (1969) estimated the variation coefficients of the 24-hour oestriol excretion and the v.c. of the ratio of 24- hour oestriol and creatinine production. The v.c. of this ratio proved to be higher than the v.c. of the daily oestriol production.
The correction with the creatinine concentration in a single urine sample is used for other urine constituents as well. SCOMMEGNA and CHATTORAJ (1967) concluded from their study that the adrenal contribution to the pregnandiol excretion could not be high because no diurnal rhythm could be established in het urinary pregnandiol/creatinine ratio. The adrenal steroid production is clearly subject to a diurnal rhythm (VAGNUCCI et al, 1965).
A disadvantage of using the oestrogen/creatinine ratio in pregnant cows arises from the observation by SURVE et al. (1967), showing a change in blood-plasma creatinine levels just before and after parturition. The consequences of this finding for the daily urinary creatinine output and its circadian variations are not clear.
A clear drawback for the use of the creatinine correction in single samples arises from the existance of a circadian rhythm in the creatinine excretion (see figure 5.2). A similar rhythm was established in sheep (high creatinine excretion between midnight and 06.00 AM) by HODGEN et al (1967). This rhythm seems to be synchronized with muscular activity which is low at night. The possible influence of muscle activity on the creatinine excretion may have its consequences for differences between loose housed or grazing cows versus cows housed in stanchion barns. This has not yet been investigated. Though the rhythm in creatinine production has proved to be statistically significant, the difference between the variation coefficients (table 5.2.) of creatinine and oestrogens excreted per interval does not indicate that this rhythm explains a
50 Meded. Landbouwhogeschool Wageningen 70-12 (1970)

large part of the total variation in the oestrogen/creatinine ratio. It should be realized, however, that the creatinine analysis is more accurate than the oestrogen analysis method. As a result a lower variation coefficient of the creatinine output per interval can be anticipated.
Because of the relatively low average v.c. (10-14%) of the oestrogen/creatinine ratios one might, nevertheless, advocate the use of these ratios in studies concerning the oestrogen excretion rate in the pregnant bovine. One should realize, however, that sampling on a specific hour might minimize the total error. The alternative of collecting 24-hour urine volumes is inconvenient in the bovine.
Meded. Landbouwhogeschool Wageningen 70-12 (1970) 51

6. THE V A R I A T I O N IN THE U R I N A R Y O E S T R O G E N E X C R E T I O N BEFORE, D U R I N G A N D A F T E R
P A R T U R I T I O N IN F L U M E T H A S O N E * T R E A T E D AND N O N - T R E A T E D COWS
6.1. INTRODUCTION
This study was set up to investigate three problems : a. The variation from day to day in the urinary oestrogen excretion in cows
during late pregnancy. b. The trend in the urinary oestrogen excretion immediately before, during and
after parturition in cows with a spontaneous parturition. c. The trend in the urinary oestrogen excretion immediately before, during and
after parturition in cows with an induced parturition by flumethasone*. VELLE (1958) indicated a sudden drop in urinary oestrogen excretion in cows
after delivery. Studies with sows (RAESIDE, 1963) show a decrease to about 10 % of the prepartum level at 2 days postpartum while MELLIN (1965) still found 50 % of the prepartum level at 4 days postpartum in cows. In human obstetrics the sudden drop in the urinary oestrogen excretion can be used as indicator for foetal distress (KLOOSTERMAN and Huis IN 'T VELD, 1961). MELLIN (1965) found a peak oestrogen excretion rate during delivery.
6.2. MATERIAL AND METHODS
The experimental animals consisted of pluriparous and primiparous dairy cows of the two main Dutch breeds. Eleven cows had a spontaneous delivery and parturition was induced in 10 other animals by parenteral administration of 5-10 mg flumethasone. This latter group was treated at about 270 days after conception and delivery occurred 2 days after treatment. The flumethasone treated animals were sampled twice a day routinely at 8.30 h and 17.00 h and the control animals were sampled, for a longer period after day 270, at least once a day. During the weekends the cows were sampled less frequently.
6.3. RESULTS
6.3.1. The changes in urinary oestrogen excretion level during the last prepartum days
In order to evaluate the day to day variation in urinary oestrogen excretion the coefficients of variation (v.c.) have been calculated. The tables 6.1 and 6.2. clearly indicate that the variation is much higher in the flumethasone treated group (mean v.c. Oe2: 25.4% vs. 13.5% and Oel: 23.7% vs. 11.2%).
In table 6.1. a rise in the oestrogen/creatinine ratio towards parturition is indicated. This figure is calculated from the difference in the ratio between the
* Synthetic corticosteroid from Syntex Research Laboratories U.S.A.
52 Meded. Landbouwhogeschool Wageningen 70-12 (1970)
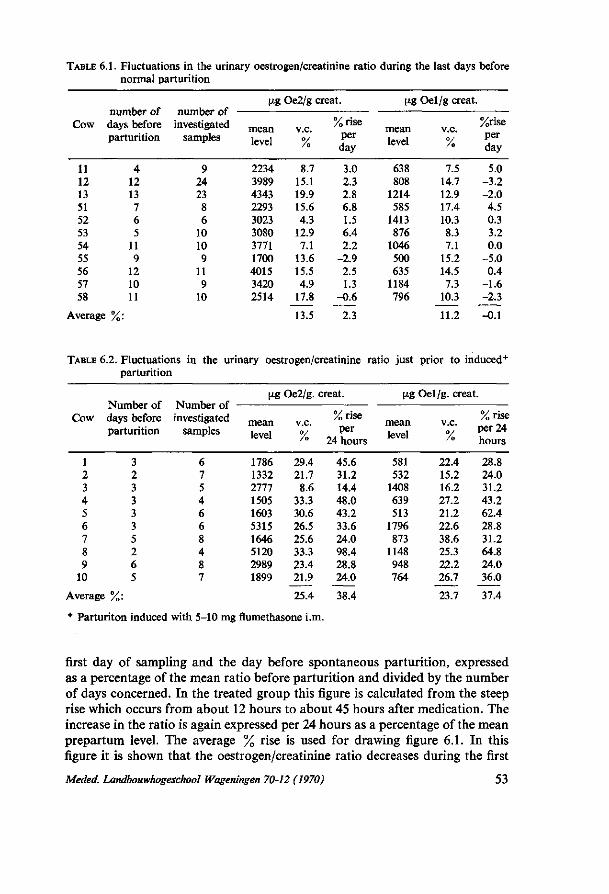
TABLE 6.1. Fluctuations in the urinary oestrogen/creatinine ratio during the last days before normal parturition
Cow
11 12 13 51 52 53 54 55 56 57 58
number of days before parturition
Average %:
4 12 13 7 6 5
11 9
12 10 11
number of -investigated
samples
9 24 23 8 6
10 10 9
11 9
10
S*g
mean level
2234 3989 4343 2293 3023 3080 3771 1700 4015 3420 2514
Oe2/g creat.
v.c.
/o
8.7 15.1 19.9 15.6 4.3
12.9 7.1
13.6 15.5 4.9
17.8
13.5
%rise per day
3.0 2.3 2.8 6.8 1.5 6.4 2.2
-2.9 2.5 1.3
-0.6
2.3
V-g
mean level
638 808
1214 585
1413 876
1046 500 635
1184 796
Oel/g creat,
v.c. °/ /o
7.5 14.7 12.9 17.4 10.3 8.3 7.1
15.2 14.5 7.3
10.3
11.2
%rise per day
5.0 -3.2 -2.0
4.5 0.3 3.2 0.0
-5.0 0.4
-1.6 -2.3
-0.1
TABLE 6.2. Fluctuations in the urinary oestrogen/creatinine ratio just prior to induced* parturition
Cow
1 2 3 4 5 6 7 8 9
10
Number of days before parturition
Average %:
3 2 3 3 3 3 5 2 6 5
Number of -investigated
samples
6 7 5 4 6 6 8 4 8 7
t*g
mean level
1786 1332 2777 1505 1603 5315 1646 5120 2989 1899
Oe2/g. i
v.c.
%
29.4 21.7 8.6
33.3 30.6 26.5 25.6 33.3 23.4 21.9
25.4
creat.
%rise per
24 hours
45.6 31.2 14.4 48.0 43.2 33.6 24.0 98.4 28.8 24.0
38.4
M-g
mean level
581 532
1408 639 513
1796 873
1148 948 764
Oel/g. creat.
v.c.
/o
22.4 15.2 16.2 27.2 21.2 22.6 38.6 25.3 22.2 26.7
23.7
%rise per 24 hours
28.8 24.0 31.2 43.2 62.4 28.8 31.2 64.8 24.0 36.0
37.4
Parturiton induced with 5-10 mg flumethasone i.m.
first day of sampling and the day before spontaneous parturition, expressed as a percentage of the mean ratio before parturition and divided by the number of days concerned. In the treated group this figure is calculated from the steep rise which occurs from about 12 hours to about 45 hours after medication. The increase in the ratio is again expressed per 24 hours as a percentage of the mean prepartum level. The average % rise is used for drawing figure 6.1. In this figure it is shown that the oestrogen/creatinine ratio decreases during the first
Meded. Landbouwhogeschool Wageningen 70-12 (1970) 53
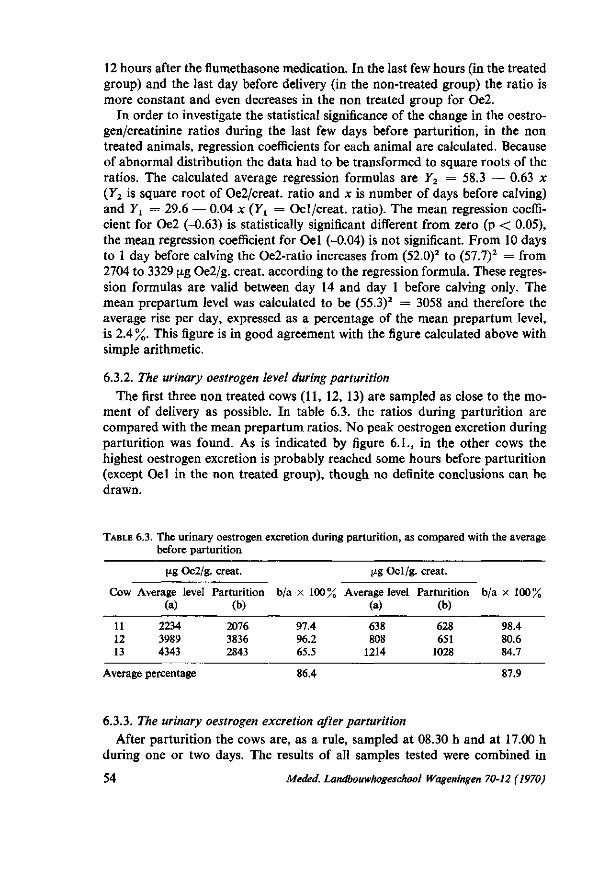
12 hours after the flumethasone medication. In the last few hours (in the treated group) and the last day before delivery (in the non-treated group) the ratio is more constant and even decreases in the non treated group for Oe2.
In order to investigate the statistical significance of the change in the oestro-gen/creatinine ratios during the last few days before parturition, in the non treated animals, regression coefficients for each animal are calculated. Because of abnormal distribution the data had to be transformed to square roots of the ratios. The calculated average regression formulas are Y2 = 58.3 — 0.63 x (Y2 is square root of Oe2/creat. ratio and x is number of days before calving) and F t = 29.6 — 0.04 x (Y1 = Oel/creat. ratio). The mean regression coefficient for Oe2 (-0.63) is statistically significant different from zero (p < 0.05), the mean regression coefficient for Oei (-0.04) is not significant. From 10 days to 1 day before calving the Oe2-ratio increases from (52.0)2 to (57.7)2 = from 2704 to 3329 [xg Oe2/g. creat. according to the regression formula. These regression formulas are valid between day 14 and day 1 before calving only. The mean prepartum level was calculated to be (55.3)2 = 3058 and therefore the average rise per day, expressed as a percentage of the mean prepartum level, is 2.4 %. This figure is in good agreement with the figure calculated above with simple arithmetic.
6.3.2. The urinary oestrogen level during parturition
The first three non treated cows (11, 12, 13) are sampled as close to the moment of delivery as possible. In table 6.3. the ratios during parturition are compared with the mean prepartum ratios. No peak oestrogen excretion during parturition was found. As is indicated by figure 6.1., in the other cows the highest oestrogen excretion is probably reached some hours before parturition (except Oel in the non treated group), though no definite conclusions can be drawn.
TABLE 6.3. The urinary oestrogen excretion during parturition, as compared with the average before parturition
[ig Oe2/g,
Cow Average level (a)
11 2234 12 3989 13 4343
. creat.
Parturition (b)
2076 3836 2843
b/a x 100%
97.4 96.2 65.5
(ig Oel/g.
Average level (a)
638 808
1214
. creat.
Parturition (b)
628 651
1028
b/a x 100%
98.4 80.6 84.7
Average percentage 86.4 87.9
6.3.3. The urinary oestrogen excretion after parturition After parturition the cows are, as a rule, sampled at 08.30 h and at 17.00 h
during one or two days. The results of all samples tested were combined in
54 Meded. Landbouwhogeschool Wageningen 70-12 (1970)

FIG. 6.1. Trend in the urinary oestrogen/ Creatinine ratios before, during and after, spontaneous and induced parturitions.
â 100 s
Oe2 IN TREATED
0e1 „
270 275 DAYS AFTER CONCEPTION
certain intervals after parturition and expressed as percentages of the mean prepartum ratios (table 6.4. and 6.5. and figure 6.1). A significant drop in urinary oestrogen excretion is apparent (figure 6.1). In both groups the decrease
TABLE 6.4. The decrease in urinary oestrogen excretion after parturition in non treated cows
Cow
11 12 13 51 52 53 54 55 56 57 58
Mean%
% Oe2 level after parturition
0-5h* 5-12h* 12-24h* 24-48h*
86.4
92.6
81.5
91.1
89.0
88.1
31.5 77.2 35.6
95.6 62.9 74.1
94.2 52.4
65.4
27.4 30.7 30.3 30.0 18.0 34.5 30.7 64.4 73.9
37.8
11.3 3.5 6.0
4.4
10.3 13.9 11.7
8.7
% Oel level after parturition
0-5h*
57.1
64.2
112.4
123.1
53.9
82.1
5-12h*
9.9 15.6 27.0
36.4 53.3 31.4
22.2 5.5
25.2
12-24h*
8.2 7.9 7.5
14.9 5.4 6.7 8.1
27.2 20.8
11.9
24-48h*
4.4 2.0 3.1
2.1
4.9 5.7 2.8
3.6
* oestrogen/creatinine ratio of one sample per cow, collected in this interval after parturition, expressed as a percentage of the mean oestrogen/creatinine ratio before parturition
Meded. Landbouwhogeschool Wageningen 70-12 (1970) 55
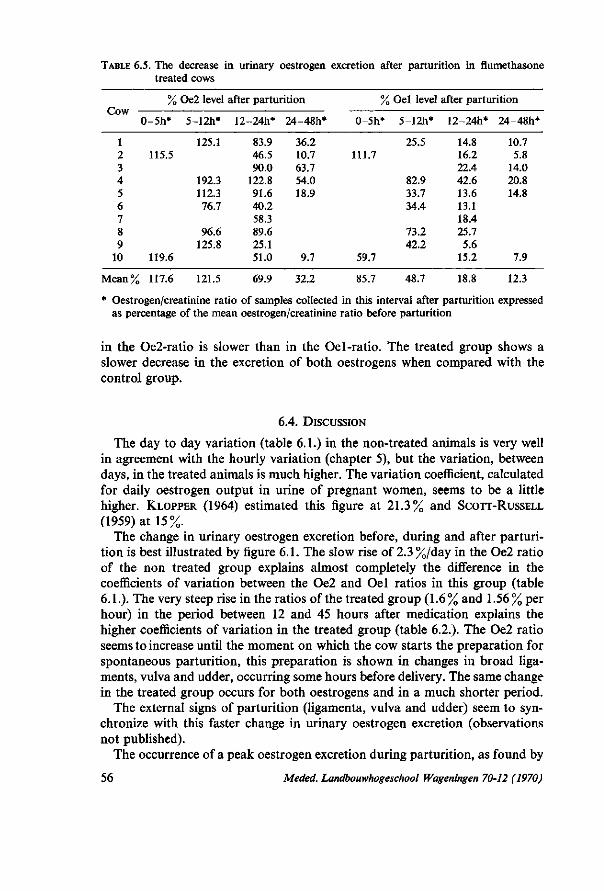
TABLE 6.5. The decrease in urinary oestrogen excretion after parturition in flumethasone treated cows
Cow % Oe2 level after parturition % Oel level after parturition
0-5h* 5-12h* 12-24h* 24-48h* 0-5h* 5-12h* 12-24h* 24-48h*
1 125.1 83.9 36.2 2 115.5 46.5 10.7 111.7 3 90.0 63.7 4 192.3 122.8 54.0 5 112.3 91.6 18.9 6 76.7 40.2 7 58.3 8 96.6 89.6 9 125.8 25.1
10 119.6 51.0 9.7 59.7
25.5
82.9 33.7 34.4
73.2 42.2
14.8 16.2 22.4 42.6 13.6 13.1 18.4 25.7 5.6
15.2
10.7 5.8
14.0 20.8 14.8
7.9
Mean% 117.6 121.5 69.9 32.2 85.7 48.7 18.8 12.3
* Oestrogen/creatinine ratio of samples collected in this interval after parturition expressed as percentage of the mean oestrogen/creatinine ratio before parturition
in the Oe2-ratio is slower than in the Oel-ratio. The treated group shows a slower decrease in the excretion of both oestrogens when compared with the control group.
6.4. DISCUSSION
The day to day variation (table 6.1.) in the non-treated animals is very well in agreement with the hourly variation (chapter 5), but the variation, between days, in the treated animals is much higher. The variation coefficient, calculated for daily oestrogen output in urine of pregnant women, seems to be a little higher. KLOPPER (1964) estimated this figure at 21.3% and SCOTT-RUSSELL
(1959) at 15%. The change in urinary oestrogen excretion before, during and after parturi
tion is best illustrated by figure 6.1. The slow rise of 2.3 %/day in the Oe2 ratio of the non treated group explains almost completely the difference in the coefficients of variation between the Oe2 and Oel ratios in this group (table 6.1.). The very steep rise in the ratios of the treated group (1.6% and 1.56% per hour) in the period between 12 and 45 hours after medication explains the higher coefficients of variation in the treated group (table 6.2.). The Oe2 ratio seems to increase until the moment on which the cow starts the preparation for spontaneous parturition, this preparation is shown in changes in broad ligaments, vulva and udder, occurring some hours before delivery. The same change in the treated group occurs for both oestrogens and in a much shorter period.
The external signs of parturition (ligamenta, vulva and udder) seem to synchronize with this faster change in urinary oestrogen excretion (observations not published).
The occurrence of a peak oestrogen excretion during parturition, as found by
56 Meded. Landbouwhogeschool Wageningen 70-12 (1970)

MELLIN (1965) could not be confirmed. Probably the peak is reached some hours before actual delivery. The observations concerning a fast decrease in urinary oestrogen excretion after parturition are in agreement with the study of RAE-SIDE (1963) with sows but MELLIN (1965) found a slower decrease in his experimental cows. The slower decrease in urinary oestrogen excretion in flumetha-sone treated cows might, at least partly, be due to the retention of the secun-dinae.
Meded. Landbouwhogeschool Wageningen 70-12 (1970) 57

7. I N D I V I D U A L VARIATIONS DUE TO THE E X C R E T I O N OF OESTROGENS IN FAECES
7.1. INTRODUCTION
The urinary oestrogen excretion is not necessarily a good measure for the total oestrogen production. The oestrogenic hormones all pass the maternal liver where they are conjugated or otherwise inactivated. The oestrogens leave the liver partly by the bile to the intestine. Another part of the oestrogens leaves the liver by the blood. Oestrogens can also be reabsorbed from the intestines into the blood. From the blood the oestrogens are excreted in the urine via the kidneys (EL-ATTAR and TURNER 1957; LEVIN, 1945; ADLERCREUTZ, 1962 and WRIGHT, 1962). The part, recovered from the faeces, depends on the species.
TERQUI et al (1968) found 90 % in the feaces of sheep and only 10 % in faeces of swine; these studies were carried out with labeled oestrogens. SANDBERG and SLAUNWHITE (1957) recovered less than 10% from human faeces. A fifty-fifty ratio between faecal and urinary oestrogens was established by EL-ATTAR and TURNER (1957) in cows. In this chapter a method will be described for analyzing the oestrogen content of bovine faeces. In literature no satisfactory method could be found so a new method was developed.
With this analytical method it was studied whether the ratio between faecal-and urinary oestrogen excretion varied between animals and between different stages of pregnancy. The faeces and urine samples were placed at our disposal by the I.B.S. (see paragraph 3.2.3).
7.2. THE ANALYTICAL METHOD
If the analytical procedures for urine, described in chapter 3, are applied to faeces two important complications occur, which inhibit a reproducable result. a. Emulsions are formed when a faecal sample is extracted with aether in a
separation funnel. For this reason in stead of aether, petroleumaether could be chosen for extraction (also with a good partition coefficient) but more plant-pigments are extracted with petroleumaether. Other volatile solvents have the same disadvantage. Therefore, oestrogens are extracted from faeces with aether in a so called perforator for solvents with a low specific gravity. In these perforators suspensions or solutions can be extracted with a solvent which can not easily be mixed with the suspension or solution. For this extraction it is necessary to obtain a fine dispersion of the solvent in the suspension or solution. This fine dispersion is obtained with a glass filterplate. b. The second complication is presented by the plantpigments from faeces.
These pigments interfere with the KoBER-colour reaction. Plantpigments do consist of molecules which are larger than oestrogen molecules. Therefore plantpigments can be separated from oestrogens by the so called molecular sieve method. The 'séphadex'-gel filtration technique is such a method. The
58 Meded. Landbouwhogeschool Wageningen 70-12 (1970)

larger pigment molecules will pass the séphadex column faster than the smaller oestrogen molecules.
By solving these two problems in this way the analytical method, as described in chapter 3, could also be used for faeces.
7.2.1. Materials The same chemicals and apparatus were used as described in chapter 3
except for the perforator for solvents with a low specific gravity and séphadex-G25 medium. The glass column had a height of 60 cm and a width of 1 cm and was filled with 50 ml of gel.
7.2.2. Hydrolysis Hydrolisis of the faecal oestrogens proved not to be essential. A comparison between a hydrolyzed and an unhydrolyzed sample (table 7.1.) shows no advantage of the hydrolysis. The 16 hour incubation period seems to have destroyed some of the free oestradiol-17a. In the investigated sample (table 7.1.) no significant amount of oestrone could be found either with or without hydrolysis.
TABLE 7.1. The influence of enzymatic hydrolysis on the oestrogen determination in one faeces sample
(ig Oe2 per gram non hydrolyzed faeces: 0.882 „ „ „ „ „ „ „ : 1.011
(xg Oe2 „ „ „ hydrolyzed faeces: 0.756
FIG. 7.1. Elution curve of oestradiol-17a in 5 gram faeces, after last pigments are visually removed from the column.
°io
^
n
220 260 ML.ELUATE
Meded. Landbouwhogeschool Wageningen 70-12 (1970) 59

7.2.3. Aether extraction
About 5 grams of faeces, homogenized in aqua dest., is moved quantitatively to the perforator and extracted continuously for about 6 hours. The aetherex-tract is evaporated to dryness on an 80 °C waterbath. After complete solution of the residue in 1.5 ml absolute alcohol 5.5 ml aqua dest. is added.
7.2.4. Sephadex gelfiltration The Séphadex-columns are prepared according to BELING (1963). The alco
holic solution of the pigments and oestrogens (paragraph 7.2.3.) is moved quantitatively with 3 x 1 ml aqua dest. on top of the Séphadex column. The column is eluted with aqua dest. The elution curve is shown in figure 7.1. This elution curve is made, starting after all pigments are removed from the column (in ±30 ml eluate). In the routine method the first 50 ml eluate (after visual disappearance of pigments) was discarded and the next 100 ml is collected for further oestrogen analysis.
7.2.5. Adjustment to the analytical method for urine The 100 ml watery fraction is buffered with 10 ml carbonate buffer (pH =
10.5) and extracted twice with 75 ml aether. After evaporation of the aether on an 80 °C waterbath the same procedure is followed as described for urine in chapter 3.
7.2.6. Reliability of the method
(Sensitivity and precision will be described in paragraph 7.3).
7.2.6.1. Accura ry In table 7.2. the relation between the extraction time (in the perforator) and
the recovery-percentages of oestrone and oestradiol-17a is presented. With an extraction time of about 4 hours sufficient Oe2 is recovered. For
this experiment a mixture of 5 ji.g Oe2 and 5 [xg Oel was added to 5 gram oestrogen-free faeces. In the routine procedure an extraction time of 6 hours was employed because Oel was analyzed also.
TABLE 7.2. Recovery of added oestrogens to faeces as a function of extraction time
Extraction time % recovery Oel % recovery Oe2
2 hours 43.9 86.2 3 „ 67.2 80.1 4 „ 81.8 103.6 5 „ 91.1 105.0
7.2.6.2. Specificity The specificity of faecal oestrogen fractions is investigated in much the same
way as is done for urinary oestrogen fractions (paragraph 3.3.1.). Duplicate faecal oestrogen fractions were obtained from 3 260-days pregnant cows. After Aluminum-oxide chromatography, the dry residues of the oestrogen
60 Meded. Landbouwhogeschool Wageningen 70-12 (1970)

methylaethers are diluted in acetone and transferred to a silicagel thin layer plate. This is done also with about 10 \ig methylated pure oestrogens.
Both the faecal oestradiol-17a fractions and the pure oestradiol-77a methyl-aether caused a purple spot at 7.5 cm and a weak grey spot at 6 cm. A weak violet spot at 5 cm was only observed in the faecal fractions, probably caused by the presence of oestradiol-17ß methylaether. Oestradiol-17a methylaether proved to be a major constituent of the concerned faecal fraction.
Thin layer chromatography of the 6 faecal oestrone fractions showed no visible violet spots corresponding to the grey-violet spot of pure oestrone methylaether at 7.5 cm. A very weak grey spot was observed at 5 cm in the standard portion as well as in the faecal fractions.
Oestrone seems not to be present in faeces of the late pregnant cow.
7.3 . A COMPARISON BETWEEN THE FAECAL AND URINARY OESTROGEN
EXCRETION RATE IN LATE PREGNANT COWS
7.3.1. Material and methods On 8 consecutive mondaymornings, between January 19 and march 9, 1970,
the output of faeces of the previous 24 hours, from 4 cows, was measured and sampled. Because of statistical reasons of the 6 available cows (paragraph 3.2.3) the identical twins were, at the outset, left out of the experiment. During the last two weeks (march 2 and march 9) one of the twins (cow 1) was used as a stand-in for cow 3 who calved 3 weeks earlier than expected. For it was not investigated whether the faeces-samples could be stored, all samples were freshly analyzed, while the analysis of duplicate samples was desirable. Because of technical limitations in the laboratory not more than 6 faeces samples could be analyzed per week.
Taking all these factors into account the experiment was designed as shown in table 7.3. The faecal samples were analyzed according to the method described in paragraph 3.2.3. The daily urine output was calculated from the average daily creatinine excretion of the concerned week and the creatinine concentration of the concerned day. This was done because of the eventual influence of the variation in the daily urine output (see paragraph 3.2.3.).
TABLE 7.3. Experimental design
week cow
2 3 5 6
1
II I
II I
2
I II I
II
3
II I
II I
4
I 11 I
II
5
II I
II I
6
I II I
II
7
II I
II I
8
I II I
II
I = single analysis of urine and faeces-samples II = duplicate analysis of urine and faeces-samples
Meded. Landbouwhogeschool Wageningen 70-12 (1970) 61

7.3.2. Results The oestrone-content of the faeces was lower than the sensitivity of the
described method (less than 1 \ig per sample, see pararagraph 7.2.6.2. and 3.3.2.) The Oe2-content was at least 10 times higher than the Oel-content. Therefore, in first instance, a comparison has been made between the Oe2-excretion in urine and in faeces. Because of the possible reasons why oestrone is excreted in such small amounts (or not al all) in faeces the Oe2-excretion is also compared with the sum of Oe2 and Oel in urine.
7.3.2.1. Precision of the methods, as calculated from duplicate analyses
Because of technical failure the faecal sample of cow 2 on february 2 was investigated by a single analysis only. Therefore 15 faeces-samples and 16 urine samples are analyzed in duplicate. Table 7.4. shows the precision of the method expressed as standard deviations and coefficients of variation. These were calculated with the formulas2 = Hd2/2N in which
S = standard deviation d = difference between the two duplicates N = number of duplicates
TABLE 7.4. Mean oestrogen content in faeces and urine with the methodological error, estimated from duplicates
mean content S.D. V.C. %
jig Oe2 per kg faeces 348 38.6 11.1 jxg Oe2 per liter urine 2307 124.1 5.4 [xg Oel per liter urine 963 43.4 4.5
20.0
mo
12,0
£10,0 J
zao
3 5,0 o
g * o o
MG OESTRADIOL 17« PER DAY IN FAECES
1,2,3,5 AND6=RESP COW 1,2,3,5 AND 6
FIG. 7.2. Mg Oestradiol-17a per 19 -i 26-1 2-2 ?-2 16-2 23-2 2-3 9-3 day in faeces.
62 Meded. Landbouwhogeschool Wageningen 70-12 (1970)

FIG. 7.3. Mg Oestradiol-17a per day in urine.
e is'
MG OESTRADIOL 1701PER DAY IN URINE
1,2,3,5 AND6rRESP.COW1.2,3,5AN0 6.
DATE 19-1 26-1 2-2 9-2 16-2 23-2 2-3 9-3
3000|
2500
2300
2100
451800| 0 s-
Q 1600
5 1400
fc »00 m O
700|
3001
/KG OESTRADIOL 170./G CREATININ^ RATIO IN URINE PER COW
l
1,2,3,5 AND6 = RESP. COW 1.2,3,5 AND6.
DATE 19.1 26-1 2.2 9-2 16-2 23-2 2.3 9-3
Meded. Landbouwhogeschool Wageningen 70-12 (1970)
FIG. 7.4. u-g Oestradiol-17a/g Creatinine ratio in urine per cow.
63
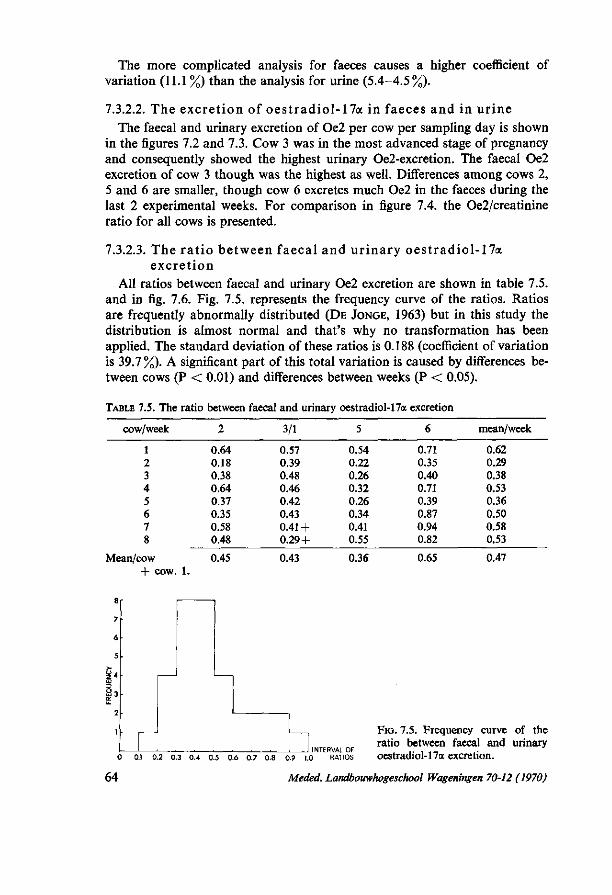
The more complicated analysis for faeces causes a higher coefficient of variation (11.1 %) than the analysis for urine (5.4-4.5%).
7.3.2.2. The excre t ion of oes t radio l -17a in faeces and in u r ine The faecal and urinary excretion of Oe2 per cow per sampling day is shown
in the figures 7.2 and 7.3. Cow 3 was in the most advanced stage of pregnancy and consequently showed the highest urinary Oe2-excretion. The faecal Oe2 excretion of cow 3 though was the highest as well. Differences among cows 2, 5 and 6 are smaller, though cow 6 excretes much Oe2 in the faeces during the last 2 experimental weeks. For comparison in figure 7.4. the Oe2/creatinine ratio for all cows is presented.
7.3.2.3. The r a t i o between faecal and u r ina ry oes t radiol -17a excre t ion
All ratios between faecal and urinary Oe2 excretion are shown in table 7.5. and in fig. 7.6. Fig. 7.5. represents the frequency curve of the ratios. Ratios are frequently abnormally distributed (DE JONGE, 1963) but in this study the distribution is almost normal and that's why no transformation has been applied. The standard deviation of these ratios is 0.188 (coefficient of variation is 39.7 %). A significant part of this total variation is caused by differences between cows (P < 0.01) and differences between weeks (P < 0.05).
TABLE 7.5. The ratio between faecal and urinary oestradiol-17a excretion
cow/week 3/1 6
0.71 0.35 0.40 0.71 0.39 0.87 0.94 0.82
mean/week
0.62 0.29 0.38 0.53 0.36 0.50 0.58 0.53
1 2 3 4 5 6 7 8
Mean/cow
0.64 0.18 0.38 0.64 0.37 0.35 0.58 0.48
0.57 0.39 0.48 0.46 0.42 0.43 0.41 + 0.29 +
0.54 0.22 0.26 0.32 0.26 0.34 0.41 0.55
0.45 0.43 0.36 0.65 0.47
+ cow. 1.
INTERVAL OF 0 0.1 0.2 0.3 0.4 0.5 0.6 0.7 0.8 0.9 1.0 RATIOS
FIG. 7.5. Frequency curve of the ratio between faecal and urinary oestradiol-17a excretion.
64 Meded. Landbouwhogeschool Wageningen 70-12 (1970)

FIG. 7.6. Ratios between faecal and urinary excretion of oestra-dioI-17a per cow.
8 fcO.60
30 .50
O U)0.40
1.2.3.5 AND 6 . RESP.COW 1.2.3.5 AND 6.
MEAN.MEAN RATIO OF ALL COWS
DATE 19.1 24.1 2 .2 9.2 16.2 23-2 '2-3 9-3
7.3.2.4. The ratio between faecal oestradiol-17<x excretion and total urinary oestrogen (Oe2 + Oel) excretion
As is shown in fig. 7.7. it does not make much difference whether the faecal Oe2 excretion is compared with the urinary Oe2 alone or with the total urinary oestrogen (oe2 + Oel) excretion. Also with this latter ratio a significant difference between cows (P < 0.01) and between weeks (P < 0.05) was established. The mean ratio between faecal Oe2 and total urinary oestrogens was 0.34.
OE 2 F = OïSTRADIOL 17CI IN FAECES IN MG PER DAY OE i UR = OESTRADIOL 17CXIN URINE IN MG PER DAY OE 2 »0E 1 URrOESTRADIOL 17CUOESTRON IN URINE IN MG PER DAY
5 0 . 4 0
s0.10 o
OE2,OE1 UR
DATE 19-1 26-1 2-2 9-2 16-2 23-2 2-3 9-3
FIG. 7.7. Mean ratios between the faecal excretion of oestradiol-17<x and urinary oestradiol-17a resp. the sum of urinary oestradiol-17a and oestrone.
Meded. Landbouwhogeschool Wageningen 70-12 (1970) 65

7.4. DISCUSSION
In the oestrogen analysis in urine as well as in faeces no correction has been made for procedural losses, because the recovery-percentages for both kinds of excreta are similar (see paragraph 3.3.3. and 7.2.6.).
The faecal contribution to the total oestrogen output in this study is about 25 %. The difference between the individual cows in this percentage will have no major consequences for the ranks if the cows are ranked according to the heigth of the urinary oestrogen excretion.
The established significant difference between weeks is mainly due to the low ratios found in the weeks 2, 3 and 5. This low ratio is probably caused by a less successfull gelfiltration, and it is postulated that recoveries have been low in those weeks. A second study is required to study this week effect in more detail.
No clear trend in the ratios can be recognized in relation to the stage of pregnancy.
66 Meded. Landbouwhogeschool Wageningen 70-12 (1970)

8. THE I N F L U E N C E OF THE SIRE OF THE CALF ON THE U R I N A R Y O E S T R O G E N E X C R E T I O N RATE
F R O M COWS AT 260 DAYS OF P R E G N A N C Y , AS R E L A T E D TO EASE OF CALVING
8.1. INTRODUCTION
In the preliminary experiments (chapter 4) the sire-influence could not be isolated from the farm influence while on farm I the number of animals per sire-group was too small for a valid statistical analysis. Therefore, a special experiment was set up to investigate this effect. This study was also planned to investigate the relationship between the urinary oestrogen excretion rate and the ease of calving. Bulls causing many difficult calvings (selected by a high stillbirth-percentage in heifers) and bulls causing few complications (with a low stillbirth percentage in heifers) were selected for this experiment. This experiment was carried out in the A.I. association 'De Kempen' at Oerle (Director Dr. VAN DIETEN) because this station keeps a complete birth registration.
8.2. DESCRIPTION OF THE MATERIAL
The proven sires 1 and 2 were selected for this experiment because they were advised by the A.I. station for use on heifers (low stillbirth percentage). The proven sires 3 and 4 were selected because they were not recommended for use
TABLE 8.1. Stillbirth percentage in heifers
. stillbirth number of» year of s t i l l b i r t h number of » percentage heifers first service Percentage heifers
in 1968 in 1968 1 2 3 4 5
3.0 5.5 9.1
20.1 33.4
270 109 102 234 207
1960 1961 1964 1958 1968
7.5 6.9
33.4
926 329
207
" = number of animals mated in that year
TABLE 8.2. Stillbirth percentage in Pluriparae in 1968
stillbirth percentage number of cows"
1 2.4 1549 2 2.4 225 3 4.1 742 4 3.8 1333 5 20.5 953
• - s ee table 8.1.
Meded. Landbouwhogeschool Wageningen 70-12 (1970) 67

TABLE 8.3. Ease of calving in Pluriparae
sire
1 2 3 4 5
year of service
1968 1968 1964 1968 1968
%easy
60.9 56.7 59.3 53.0 46.2
% normal
36.5 40.0 36.3 41.9 41.2
% abnormal
1.5 1.9 4.1 3.9
10.9
TABLE 8.4. Mean gestation length and estimated birthweight in Pluriparae in 1968
Sire
1 2 3 4 5
male calves
birthweight
(kg)
39.31 39.76 42.11 41.59. 41.16
gestation length (days)
278.3 278.8 279.9 280.3 284.2
female calves
birthweight (kg)
37.83 38.16 39.99 39.86 38.93
gestation length (days)
277.4 278.4 279.5 279.2 283.2
on heifers while the young bull number 5 was used because, during 1968, he had caused many difficult calvings and stillbirths (table 8.1.).
In the tables 8.1. to 8.4. data concerning the 5 bulls are presented. In table 8.1. the stillbirth percentages of the first year in which the bull was in use, are presented as well as data from heifers calving in 1968. The fact that bulls 1 and 2 were recommended for use on heifers seems to have caused an increase in the stillbirth percentages.
In the period between November 21st and December 13th 1968 urine samples were collected, by way of chatheterisation, from 125 cows (25 pregnant cows per sire) on day 259-261 after conception. Cows bred to each sire were spread over 22-25 farms in order to eliminate farm influences. In chapter 4 no effect of parity on oestrogen excretion rate could be established. Therefore, Primiparae as well as Pluriparae were sampled.
The urine samples were analyzed for the concentrations of: 1. creatinine 2. oestradiol-17a 3. oestrone
Birth registration was available for 121 calvings. The other 4 cows were sold to non-members of the station between sampling and calving.
From the 121 birth-registration-cards the following data were copied: 1. parity of the cow 2. gestation length 3. sex of calf 4. estimated birth weight
68 Meded. Landbouwhogeschool Wageningen 70-12 (1970)

8.3. RESULTS
All oestrogen excretion rates in this paragraph are expressed as square roots of the oestrogen/creatinine ratios. They are abbreviated as Oe2 and Oel for the square root of the oestradiol 17a and oestrone/creatinine ratio respectively.
8.3.1. Twin calves From the registration of 121 calvings 4 sets of twins were born. Because of
the higher oestrogen excretion (chapter 4) these have been left out of the further statistical analysis (table 8.5.).
TABLE 8.5. Comparison of oestrogen excretion rates in twins-vs single pregnancies within sires
3 5
twins
48.9 34.8
Oe2
singles
35.1 31.4
twins
38.1 28.3
Oel
singles
25.4 21.3
sets of twins
2 2
8.3.2. Differences between sires In table 8.6. means of Oe2 and Oel are presented with their standard devi
ations.
TABLE 8. 6. The urinary oestrogen excretion per sire group
sire
1 2 3 4 5
Mean F
* P < 0.05
number of cows
23 24 21 25 23
116
** P < 0.01
Oe2 and S.D.
32.8 38.3 35.1 32.1 31.4
33.9 3.01*
8.31 6.94 6.53 8.48 8.46
7.82
Oel and S.D.
24.1 25.2 25.4 21.7 21.3
23.5 4.70**
5.21 3.53 3.99 4.04 4.38
4.26
The analysis of variance (see F values in table 8.6.) shows significant differences for Oe2 as well as for Oel between sires. The cows, pregnant to sire 2 showed the highest oestrogen excretion rate and the cows bred to bull 4 and 5 showed the lowest rate.
8.3.3. Influence of different birth characters Though it was not a primary goal of this study it is worthwhile to study how
such characteristics as ease of calving, parity, gestation length and birthweight affected the oestrogen excretion rate within sires and between sires. This analysis, however, was incomplete because the heifers were only represented in the sire groups 1,2 and 5. Heifers show a higher frequency of difficult cal-
Meded. Landbouwhogeschool Wageningen 70-12 (1970) 69

TABLE 8.7. Birth characters in the 5 sire groups
abnormal calvings
number of heifers
mean gestation length (days)
mean birth weight (kg)
1 2 3 4 5
1 3 3 1 6
12 15 0 0 5
279.48 279.58 282.48 280.60 287.35
37.17 37.83 42.52 43.16 40.61
TABLE 8.8. Correlations calculated within sire groups
Oe2 Oel Parity" Ease ofb gestation birth calving length weight
Oe2 .683** Oel Parity» Ease of calvingb
gestation length
*: heifers = 1 ; second calvings = 2; older cows = 3 b: Easy birth = 1 ; normal birth = 2; abnormal birth * P < 0.05 ** P < 0.01
-.025 -.043
.224*
.074 -.083
-.207* -.360** .044 .247**
.086
.090
.339**
.322**
.379**
vings, a shorter gestation period and a lower birthweight. This effect is shown in table 8.7.
Correlations, between these characters and Oe2 and Oel, within sire groups, are shown in table 8.8. The correlation between parity and oestrogen excretion rate is insignificant. Though the sires, causing most stillbirths (sires 4 and 5), show the lowest oestrogen excretion rates, the Oe2 is positively correlated with the ranks for ease of calving within sire groups (.224). A negative correlation was found between the oestrogen excretion rates within sires and the gestation length. This means that a higher oestrogen excretion rate at day 260 after conception indicates a shorter gestation. The fact, that the birth weight of calves is roughly estimated by the farmers, possibly caused the insignificant correlation between birthweight and oestrogen excretion rate within sire groups. As could be anticipated the birthweight is correlated with parity, ease of calving and gestation length. Gestation length was also correlated with ease of calving (longer gestations cause more difficult calvings).
TABLE 8.9. Heritability estimates in 5 halb-sib groups
Oe2 Oel
* P < 0.05
70
h2
0.38** 0.28*
fiducial range
0.07-1.77 0.02-1.52
** P < 0.01
Meded. Landboi Meded. Landbouwhogeschool Wageningen 70-12 (1970)

8.3.4. Heritability estimates
The calves of the sire groups can be considered as half-sib groups. The heritability then can be estimated from the intraclass correlation (table 8.9.): h2 = 4rf
h2 = heritability rt = intraclass correlation
8.4. DISCUSSION
This study was primarily designed to show eventual differences in the urinary oestrogen excretion rate, between groups of cows, mated to different bulls, who were selected for the stillbirth percentages, caused by them in heifers. These differences are clearly shown in table 8.6. Sire 4 and 5 and to a lesser degree also sire 3 (see tables 8.1.-8.4.) cause a higher incidence of difficult births. Sire groups 4 and 5 also show the lowest oestrogen excretion rates. In chapter 4 a positive relationship was found between birthweight and oestrogen excretion rate and, therefore a high oestrogen excretion rate might be anticipated in the sire groups 3, 4 and 5 (tables 8.4. and 8.7.). This relatively high oestrogen level is found in sire group 3, but not in groups 4 and 5. The oestrogen level in sire group 1 seems to be in agreement with the low mean birthweight. The relatively heavy calves, in combination with a low oestrogen level, seems to be a predisposition for a difficult birthprocess. As oestrogenic hormones are required for the sensitisation of receptors in the uterus for stimuli from the nervus sympaticus and Oxytocine (RUSSE, 1968) one could postulate that when a low quantity of oestrogens is present, the myometrium of the cow is not stimulated optimally. The consequence will be that the birth canal is not well prepared; the birthprocess will then be slow and will cause a higher incidence of stillbirth.
BEISCHER et al. (1968) observed a higher frequency of abnormal deliveries in women with a low urinary oestriol excretion.
The mean oestrogen excretion rates in the experiments I and II (chapter 4) at day 260 after conception were : Exp. I: Oe2: 41.1 and Oel: 26.1 (this is the mean of period 10 and 11) Exp. II: Oe2: 41.3 and Oel : 29.4 (period 4).
If these figures are compared with the mean oestrogen levels per sire group, then the oestrogen level in this study proves to be lower than in the preliminary experiments. This might be related to the relatively high percentage stillbirths and difficult births of calves from these cows mated to these bulls. With this comparison it is realized that in the preliminary experiments more seasons and more breeds were represented. The calving month December, however, did not prove to be a month with a low mean oestrogen level.
The crossbreds (Friesians x Red and white) tended to have an increased mean oestrogen level in the preliminary experiments. The study of the relation between birth characters and the oestrogen excretion rate within sire groups
Meded. Landbouwhogeschool Wageningen 70-12 (1970) 71
was difficult because heifers were not represented in all sire groups. With correlation-analysis within sire groups no relationship was shown between parity and oestrogen excretion rate; this is in agreement with chapter 4. A negative correlation between gestation length and oestrogen excretion rate was not shown before.
Only a limited number of abnormal parturitions was observed, nevertheless, a positive correlation was observed between the ease of calving (ranks 1 to 3) and the oestradiol 17a excretion rate, within sires. This can hardly be explained.
The heritability estimates are much lower than calculated before (chapter 4) from identical twins. Therefore, the following reasons can be indicated: 1. The identical twins have a more similar environment within twins than be
tween twins. The calving season is tried to keep similar within twins for other experimental goals.
2. Heritability estimates with full sibs include more dominant and epistatic effects than with half sibs.
72 Meded. Landbouwhogeschool Wageningen 70-12 (1970)
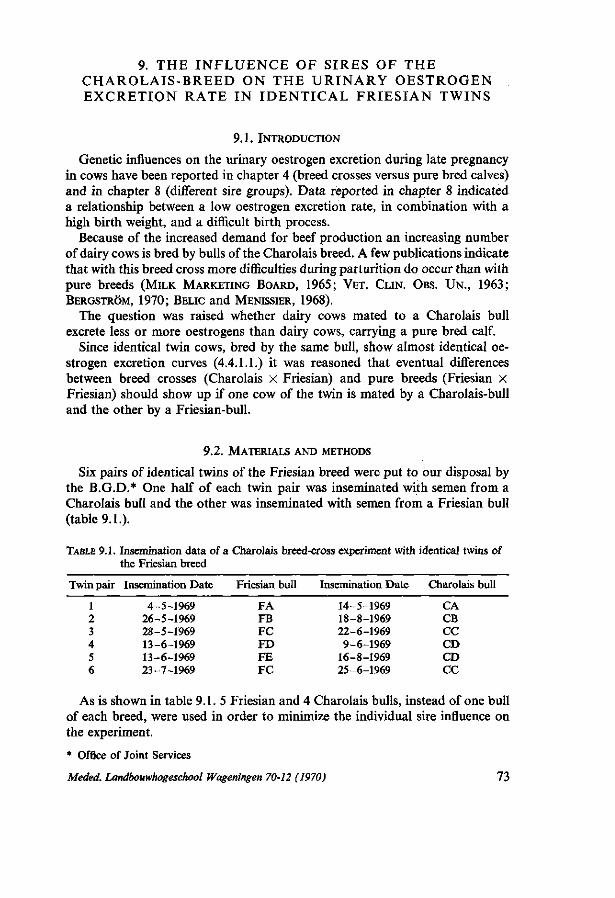
9. THE I N F L U E N C E OF S IRES OF T H E C H A R O L A I S - B R E E D ON THE U R I N A R Y OESTROGEN E X C R E T I O N RATE IN I D E N T I C A L F R I E S I A N TWINS
9.1. INTRODUCTION
Genetic influences on the urinary oestrogen excretion during late pregnancy in cows have been reported in chapter 4 (breed crosses versus pure bred calves) and in chapter 8 (different sire groups). Data reported in chapter 8 indicated a relationship between a low oestrogen excretion rate, in combination with a high birth weight, and a difficult birth process.
Because of the increased demand for beef production an increasing number of dairy cows is bred by bulls of the Charolais breed. A few publications indicate that with this breed cross more difficulties during parturition do occur than with pure breeds (MILK MARKETING BOARD, 1965; VET. CLIN. OBS. UN. , 1963; BERGSTRÖM, 1970; BELIC and MENISSIER, 1968).
The question was raised whether dairy cows mated to a Charolais bull excrete less or more oestrogens than dairy cows, carrying a pure bred calf.
Since identical twin cows, bred by the same bull, show almost identical oestrogen excretion curves (4.4.1.1.) it was reasoned that eventual differences between breed crosses (Charolais X Friesian) and pure breeds (Friesian x Friesian) should show up if one cow of the twin is mated by a Charolais-bull and the other by a Friesian-bull.
9.2. MATERIALS AND METHODS
Six pairs of identical twins of the Friesian breed were put to our disposal by the B.G.D.* One half of each twin pair was inseminated with semen from a Charolais bull and the other was inseminated with semen from a Friesian bull (table 9.1.).
TABLE 9.1. Insemination data of a Charolais breed-cross experiment with identical twins of the Friesian breed
Twin pair
1 2 3 4 5 6
Insemination Date
4-5-1969 26-5-1969 28-5-1969 13-6-1969 13-6-1969 23-7-1969
Friesian bull
FA FB FC FD FE FC
Insemination Date
14-5-1969 18-8-1969 22-6-1969 9-6-1969
16-8-1969 25-6-1969
Charolais bull
CA CB CC CD CD CC
As is shown in table 9.1. 5 Friesian and 4 Charolais bulls, instead of one bull of each breed, were used in order to minimize the individual sire influence on the experiment.
* Office of Joint Services
Meded. Landbouwhogeschool Wageningen 70-12 (1970) 73
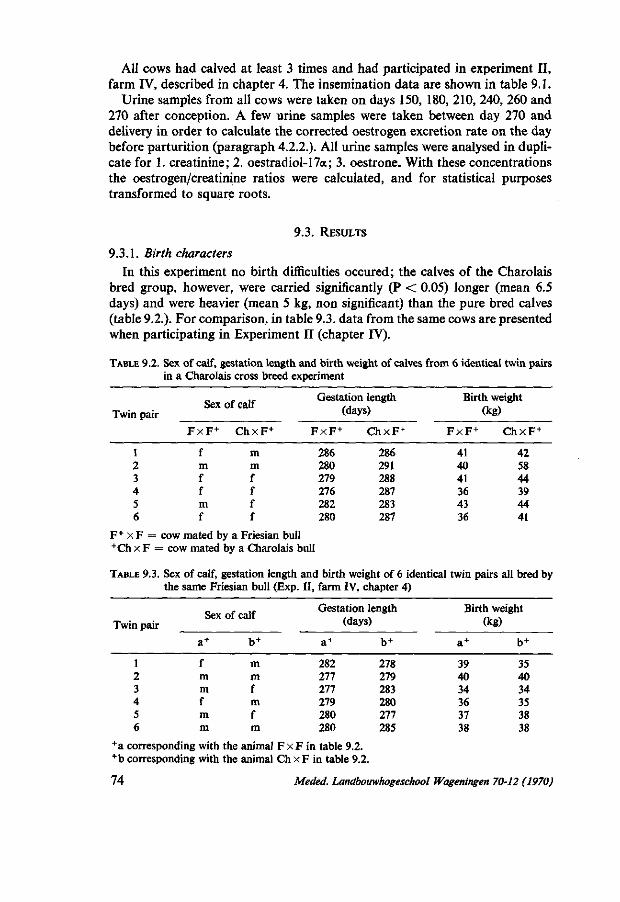
All cows had calved at least 3 times and had participated in experiment II, farm IV, described in chapter 4. The insemination data are shown in table 9.1.
Urine samples from all cows were taken on days 150, 180, 210, 240, 260 and 270 after conception. A few urine samples were taken between day 270 and delivery in order to calculate the corrected oestrogen excretion rate on the day before parturition (paragraph 4.2.2.). All urine samples were analysed in duplicate for 1. creatinine; 2. oestradiol-17a; 3. oestrone. With these concentrations the oestrogen/creatinine ratios were calculated, and for statistical purposes transformed to square roots.
9.3. RESULTS
9.3.1. Birth characters In this experiment no birth difficulties occured; the calves of the Charolais
bred group, however, were carried significantly (P < 0.05) longer (mean 6.5 days) and were heavier (mean 5 kg, non significant) than the pure bred calves (table 9.2.). For comparison, in table 9.3. data from the same cows are presented when participating in Experiment II (chapter IV).
TABLE 9.2. Sex of calf, gestation length and birth weight of calves from 6 identical twin pairs in a Charolais cross breed experiment
Twin pair
1 2 3 4 5 6
Sex of calf
F x F +
f m f f m f
ChxF +
m m f f f f
Gestation length (days)
F x F 4
286 280 279 276 282 280
ChxF +
286 291 288 287 283 287
Birth weight (kg)
F x F +
41 40 41 36 43 36
ChxF +
42 58 44 39 44 41
F + x F = cow mated by a Friesian bull +Ch x F = cow mated by a Charolais bull
TABLE 9.3. Sex of calf, gestation length and birth weight of 6 identical twin pairs all bred by the same Friesian bull (Exp. II, farm IV, chapter 4)
Twin pair
1 2 3 4 5 6
Sex of calf
a+
f m m f m m
b +
m m f m f m
Gestation length (days)
a+
282 277 277 279 280 280
b+
278 279 283 280 277 285
Birth weight (kg)
a+
39 40 34 36 37 38
b+
35 40 34 35 38 38
+a corresponding with the animal F x F in table 9.2. +b corresponding with the animal Ch x F in table 9.2.
74 Meded. Landbouwhogeschool Wageningen 70-12 (1970)

9.3.2. Analytical error In total 89 urine samples were analysed in duplicate. The average oestrogen/
creatinine ratio, standard deviation and coefficient of variation for Oe2 and Oel are shown in table 9.4.
OE 2 OE 1
. HALF OF TWINS MATED BY FRIESIAN BULL o » CHAROLAIS .. IN
GRAPH a
' lffLJSA
S,
< 4 0
O 2 0
240 260 270 P 150 180 DAYS AFTER CONCEPTION
240 260 270 P
FIG. 9.1. The square root of the oestrogen/creatinine ratios of identical twins, if one of each twin is bred by a Charolais bull (a) and if both are bred by the same bull (b).
Meded. Landbouwhogeschool Wageningen 70-12 (1970) 75

TWIN PAIR 3
240 240 270 P ISO 180 210 240 260 270 P DAYS AFTER CONCEPTION
Fig. 9.1b.
TABLE 9.4. Mean oestrogen/creatinine ratios, standard deviations and coefficients of variation of 89 urine samples, analysed in duplicate
Mean level S.D. v.c.% Oe2/creatinine ratio Oel/creatinine ratio
1441 591
130 80
9.0 13.4
76 Meded. Landbouwhogeschool Wageningen 70-12 (1970)
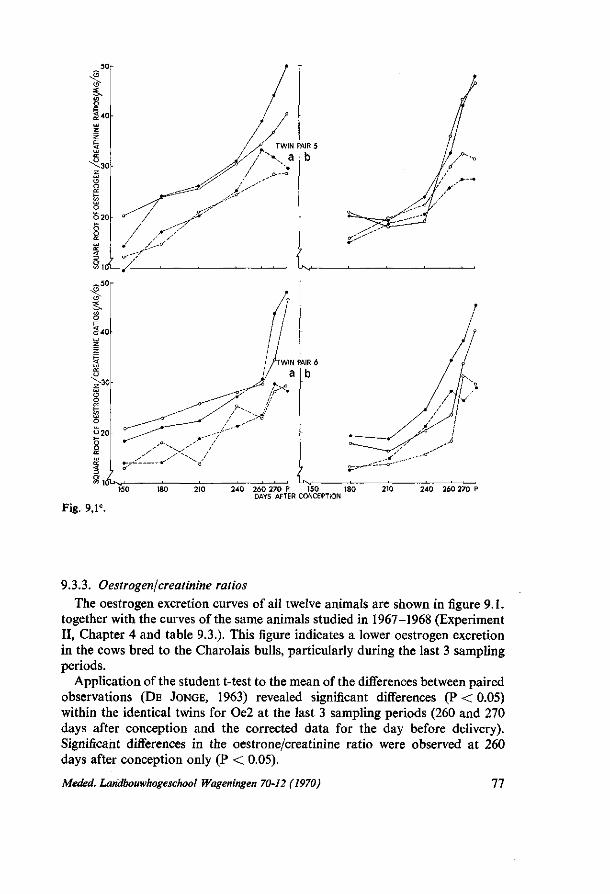
240 260 270 P 150 180 DAYS AFTER CONCEPTION
240 260 270 P
Fig. 9,lc.
9.3.3. Oestrogen/'creatinine ratios
The oestrogen excretion curves of all twelve animals are shown in figure 9.1. together with the curves of the same animals studied in 1967-1968 (Experiment II, Chapter 4 and table 9.3.). This figure indicates a lower oestrogen excretion in the cows bred to the Charolais bulls, particularly during the last 3 sampling periods.
Application of the student t-test to the mean of the differences between paired observations (DE JONGE, 1963) revealed significant differences (P < 0.05) within the identical twins for Oe2 at the last 3 sampling periods (260 and 270 days after conception and the corrected data for the day before delivery). Significant differences in the oestrone/creatinine ratio were observed at 260 days after conception only (P < 0.05).
Meded. Landbouwhogeschool Wageningen 70-12 (1970) 11

9.4. DISCUSSION
The same conclusion can be drawn from this experiment as from the experiment described in the previous chapter. Inspite of the higher birth weight the oestrogen excretion rate is lower in the cows bred to Charolais bulls. In a pure bred population (chapter 4) a higher urinary oestrogen excretion rate may be anticipated if a heavier calf is carried.
It might be postulated that the higher frequency of difficult births in Friesian cows bred to Charolais bulls is related to a lower oestrogen excretion rate in combination with a higher birth weight.
A causal relationship between the oestrogen level and the birth process cannot be derived from the experiments described in chapter 8 and 9. The relationship between birth weight and oestrogen excretion rate (chapter 4) might indicate, however, that a certain amount of oestrogen is required for a fast and smooth delivery of a calf, while for a heavier calf more oestrogens might be required. Difficult deliveries might then be expected in cows, carrying a heavy calf (cross bred as well as pure bred) and showing a low oestrogen excretion rate.
Studies on the oestrogen excretion rate in pure bred Charolais cows might provide an answer to the question as to why Friesian cows bred to Charolais bulls show a lower oestrogen excretion rate in the late stage of pregnancy than Friesian cows bred to Friesian bulls do. A more extensive study about the urinary oestrogen excretion rate in Friesian cows bred to Charolais bulls is also desirable.
78 Meded. Landbouwhogeschool Wageningen 70-12 (1970)

10. CONCLUSIONS
1. The determination of the oestrogen/creatinine ratio (ji.g/g) is a useful approximation of the urinary oestrogen excretion rate of the pregnant
bovine. A significant circadian rhythm is observed in the urinary creatinine excretion
but the contribution of this rhythm to the methodological error for oestrogen is only small. The coefficients of variation, calculated from duplicate analyses was 12.4 and 13.4% for the oestrone/creatinine ratio and 12.0 and 9.0 % for the oestradiol-17a creatinine ratio, (resp. data described in chapter 3 and 9). The coefficient of variation, calculated between intervals within days (chapter 5), was 10.6 and 13.6%, resp. for the oestrone and oestradiol-17oc/creatinine ratio.
Of the total oestrogens excreted by pregnant cows, at least 25 % is excreted via the faecal route. Concerning this percentage a significant difference between cows is observed. 2. The oestrogen/creatinine ratios (jj.g/g) as well as their standard deviations increased with the stage of gestation. From 180 days after conception to one day before parturition the mean square root of the oestradiol-17a/creatinine ratio increased from 23.51-52.14 and its standard deviation from 5.36 to 8.96. The mean square root of the oestrone/creatinine ratio increased from 180 days after conception to about 14 days before parturition from 16.03 to about 30.00 and its standard deviation from 3.08 to about 5.20. 3. The stage of gestation, the herd, the month of calving, the birthweight
of the calf and the breed of the sire, that mated the concerned cow, contribute to the total variation in the urinary oestrogen excretion. Most of these factors are confounded with each other so definite conclusions can not be drawn. 4. Parturitions, induced with flumethasone at about 270 days after conception are accompanied by a sudden increase of the urinary excretion of oestradiol-17<x as well as oestrone between 12 and 45 hours after the medication. A rapid decrease in the urinary oestrogen excretion occurs after delivery in induced as well as normal parturitions. 5. Heritabilities, estimated from 34 identical twin pairs (calves of one pair
50% related to each other) are 0.71 (0.15-1.16, fiducial limits) and 1.16 (0.61-1.50) for oestrone/ and oestradiol-17a/creatinine ratios respectively, Heritabilities, calculated from 5 groups of 25 cows, each group mated by a different bull (calves within groups 25% related to each other), are 0.28 (0.02-1.52) and 0.38 (0.07-1.77) for oestrone/ and oestradiol-17a/creatinine ratios repectively.
Similarity in the urinary oestrogen excretion rates between two consecutive pregnancies of the same cows do indicate also a rather high influence of genetic effects on the urinary oestrogen excretion rate. 6. In 2 groups of 25 cows, pregnant by sires who caused a high stillbirth fre-
Meded. Landbouwhogeschool Wageningen 70-12 (1970) 79

quency in heifers, a low average urinary oestrogen excretion rate was found when compared to three other sire groups, of which two sires were selected for a low stillbirth frequency and one bull was intermediate for this character. 7. Red and White cows, pregnant by Friesian bulls, show a higher urinary
oestrogen excretion rate than pure bred Red and Whites and pure bred Friesians. Friesian cows, bred by Charolais bulls, show a lower urinary oestrogen excretion rate in the last 3 weeks of pregnancy than do pure bred Friesian cows. 8. Birth difficulties, incidentally resulting in stillbirths, might be caused by a
coincidence of high birth weights and low urinary oestrogen excretion rates.
80 Meded. Landbouwhogeschool Wageningen 70-12 (1970)
11. SUMMARY
Previous studies indicated that genetic influences (e.g. sire of calf and breed of calf) as well as environmental influences (e.g. month of calving) are related to characters like birth weight, gestation length, ease of calving, stillbirth frequency and congenital defects. This research project was initiated to investigate the contribution of the circulating oestrogens in pregnant cows to some of these relationships. The above mentioned relationships could be accomplished via the hormonal mechanism. Variations in the parturition characteristics, therefore, might be related to quantitative variations in the hormonal equilibrium. The initiation of parturition is very much dependant on the calf's genotype, therefore this study concerns the oestrogenic hormones, for these hormones are predominantly produced by the foeto-placental unit, during gestation. In the pregnant cow progesterone seems to be produced only by maternal organs. No direct relationship with gestation is known for other steroids while peptide hormones are mainly produced by the maternal pituitary. The function of peptide hormones and of corticosteroids in the process of parturition has not been described in this study. From the available analytical methods, which were developed for the oestrogen analysis in human urine, methods were developed for the quantitative analysis of oestradiol-17<x and oestrone in urine as well as faeces of pregnant cows. The urinary oestrogen excretion rate is expressed as the oestrogen/creatinine ratio ((xg/g), because it is difficult to collect 24 hour urine samples of many experimental animals. The ratio between the oestrogen concentration and the creatinine concentration proved to be a little higher at night as a result of a significant circadian rhythm in the creatinine output.
In order to study the applicability of the analytical method and the total variation in the urinary oestrogen excretion rate, within cows and between cows, two preliminary experiments were carried out during 1966, 1967 and 1968. In total 168 cows, from 4 experimental farms, were sampled regularly, 60 of these cows participated in both experiments during 2 consecutive pregnancies. In order to study the genetic influences on the oestrogen excretion rate, the material of experiment I included 21 and experiment II 41 sets of identical twins.
All oestrogen/creatinine ratios had to be transformed to a square root, because the raw data deviated significantly from a normal distribution.
Analysis of variance showed that the oestrogen/creatinine ratios as well as their standard deviations increased with the stage of gestation. Between the mean oestrogen excretion rates of cows, grouped together according to their herds, months of calving, birth weight of calves and breed crosses or pure breeds, differences were found within the stages of pregnancy.
High heritability estimates were calculated from the data obtained from
Meded. Landbouwhogeschool Wageningen 70-12 (1970) 81

identical twins in the second experiment. High correlation coefficients could be calculated between the oestrogen excretion rates within cows of two consecutive pregnancies.
In 10 normal and 11 induced parturitions (with flumethasone) the variation in the urinary oestrogen excretion rate was studied immediately before, during and after parturition. The urinary oestradiol-17a excretion rate increases up to the last day before normal parturition and decreases within a few hours before parturition. Within two days after normal - as well as induced - parturition the urinary oestrogen excretion rate drops to such a low level that it cannot be estimated accurately enough by the applied analytical method. In induced parturitions a dramatic increase in the oestrogen excretion rate occurs between 12 hours after medication and the moment of parturition.
In combination with balance-trials the ratio between oestrogens excreted in the faeces and in the urine was found to vary within animals from week to week and between animals. During 8 weeks 32 daily collections of urine and faeces from 4 cows were analysed. This experiment showed that at least 25 % of the total oestrogens is excreted via the faecal route.
In a specially designed experiment in one a.i.-centre, 5 groups of 25 cows each group pregnant to a bull, selected for producing a high or low incidence of stillbirths in heifers, showed a relationship between stillbirth frequency and urinary oestrogen excretion rate during pregnancy. Cows bred to bulls producing a high stillbirth frequency in heifers showed a low urinary oestrogen excretion rate at 260 days. It was concluded that a difficult calving, in which parturition proceeds slowly and lasts long, might be caused by a coincidence of a high birth weight of the calf and a low oestrogen excretion rate by the dam.
Friesian cows, bred to a Charolais bull, frequently show a difficult parturition coinciding with a heavy calf. Therefore, in such cows a low urinary oestrogen excretion was anticipated.
One animal of each pair of 6 identical Friesian twins was bred to a Charolais bull and the other was bred to a Friesian bull. The excretion of oestradiol-17« was significantly lower in the cows bred to the Charolais bulls during the last three weeks of pregnancy than in the cows bred to the Friesian bulls. The excretion of oestrone was significantly lower in the cows bred to the Charolais bulls at 260 days after conception when compared to their twin sisters bred to Friesian bulls.
82 Meded. Landbouwhogeschool Wageningen 70-12 (1970)

11. S A M E N V A T T I N G
Dit onderzoek werd opgezet om de genetische en milieu invloeden te bestuderen, die een rol spelen bij de individuele variatie in oestrogène hormoon niveaus en daardoor zo mogelijk een bijdrage te leveren tot de verklaring van het normale en het afwijkende geboorteproces. Vorig onderzoek had reeds aangetoond dat genetische invloeden (b.v. de vader en het ras), maar ook milieuinvloeden (zoals maand van afkalven) een rol spelen bij diverse ge-boortekenmerken, zoals geboortegewicht, draagtijd, moeilijk afkalven, doodgeboorte en aangeboren afwijkingen.
De veronderstelling werd gemaakt, dat deze verbanden tot stand komen via het hormonale mechanisme. Variaties in de geboortekenmerken zouden daarom verband kunnen houden met kwantitatieve variaties in het hormonale evenwicht. Omdat speciaal het genotype van het kalf betrokken is bij het geboorteproces, werd deze studie gericht op het oestrogeen hormoon, een hormoon dat tijdens de graviditeit voornamelijk wordt geproduceerd door de 'foeto-pla-centaire eenheid'. Progesteron wordt bij de koe tijdens de graviditeit door maternale organen geproduceerd. Van andere Steroiden is geen direkt verband met de graviditeit bekend, terwijl de peptidehormonen hoofdzakelijk door de maternale hypofyse worden geproduceerd. De rol van peptidehormonen en ook van corticosteroïden bij het geboorteproces wordt niet beschreven.
Uit de beschikbare analysemethoden, die ontwikkeld zijn voor de bepaling van oestrogenen in humane urine, werden methodes ontwikkeld die geschikt zijn voor de kwantitatieve bepaling van oestrogenen in zowel mest als urine. Omdat het moeilijk is van alle proefdieren de dagurine produktie te meten, werd de oestrogeenproduktie uitgedrukt als een oestrogeen/creatinine verhouding, waarin de oestrogeen koncentratie wordt gedeeld door de creatinine koncentratie. Deze verhouding bleek 's nachts iets hoger te zijn dan overdag tengevolge van een dagritme in de creatinine uitscheiding. Het verschil in de verhouding tussen dag en nacht bleek echter vrij gering te zijn.
In twee experimenten, uitgevoerd tussen 1966 en 1968, werd de totale variatie bestudeerd, binnen koeien en tussen koeien. Vanwege een signifikante afwijking van een normale verdeling, werden alle oestrogeen/creatinine ratios getransformeerd met behulp van de tweedemachtswortel. Zowel het niveau als de standaard afwijking bleek toe te nemen met het drachtigheidsstadium. Tussen de gemiddelde hormoonniveaus van bedrijven, maanden van afkalven, geboortegewichtsklassen en raskruisingen versus zuivere rassen konden verschillen worden aangetoond, maar omdat verschillende van deze faktoren met elkaar verstrengeld bleken te zijn, konden hier geen definitieve konklusies aan worden verbonden.
Binnen eeneiige tweelingparen bestonden minder verschillen in de oestrogeen uitscheidingsniveaus dan tussen paren. Dit gaf aanleiding tot hoge schattingen voor de erfelijkheidsgraad op basis van dit materiaal.
Meded. Landbouwhogeschool Wageningen 70-12 (1970) 83
Verschillen tussen jaren binnen koeien konden alleen voor oestron worden aangetoond en deze verschillen zijn waarschijnlijk veroorzaakt door een grotere nauwkeurigheid in de techniek gedurende het tweede jaar. De uitscheiding van oestrogenen was binnen koeien tussen jaren aan elkaar gekorreleerd. Dit wijst ook op een vrij sterke genetische invloed.
De uitscheiding van oestradiol-17a stijgt tot op de laatste dag voor het afkalven en begint reeds voor de partus te dalen. Binnen 2 dagen na de partus is nog slechts weinig oestrogeen in de urine aantoonbaar, omdat ook oestron zéér snel daalt na de partus. Gedurende de laatste 14 dagen voor de partus blijft de uitscheiding van oestron gemiddeld op hetzelfde niveau.
Wordt de partus geïnduceerd met behulp van flumethason, dan treedt ongeveer 12 uur na de behandeling een sterke stijging van de oestrogeen-uitscheiding op tot het moment van de partus, daarna treedt een daling op, die iets minder snel is dan bij de niet behandelde dieren.
Gemiddeld vindt van de totale oestrogeen-uitscheiding minstens 25% via de darm plaats. Een signifikant verschil tussen koeien ten aanzien van dit percentage werd waargenomen.
Uit een speciaal daarvoor opgezette proef is gebleken dat de stier invloed heeft op de oestrogeen uitscheiding van de met zijn sperma geïnsemineerde koeien. De stieren, die veel doodgeboortes bij vaarzen veroorzaakten, veroorzaakten ook een laag oestrogeenniveau, op 260 dagen van de dracht, bij de van deze stieren dragende koeien. Uit dit onderzoek werd gekonkludeerd dat, wanneer een laag oestrogeenniveau samengaat met een zwaar geboortegewicht van het kalf, dit tot geboorte-moeilijkheden aanleiding kan geven, waarbij het geboorteproces traag op gang komt en/of lang duurt.
Erfelijkheidsgraden, berekend uit deze groepen, waarbij de kalveren binnen de stiergroepen voor 25 % aan elkaar zijn verwant, bleken lager te zijn, dan die berekend uit het eeneiige tweelingmateriaal.
Een onderzoek met eeneiige tweelingen toonde aan dat indien een zwartbonte koe wordt gepaard met een Charolais-stier dit ook aanleiding kan geven tot een laag oestrogeenniveau in de laatste 3 weken van de dracht. Het is mogelijk dat dit verschijnsel verband houdt met de niet zelden voorkomende moeilijke geboorten van deze gekruiste kalveren.
84 Meded. Landbouwhogeschool Wageningen 70-12 (1970)

12. REFERENCES
ADAMS, W. M. and WAGNER, W. C. (1969). The elective induction of parturition in cattle, sheep and rabbits. 106th Ann. Amer. Vet. Med. Assoc. 123 Abstract.
ADLERCREUTZ, H. (1962). Studies on oestrogen excretion in human bile. Acta Endocr. (Khb). Suppl. 72.
ALBIN, R. C. and CLANTON, D . C. (1966). Factors contributing to the variation in urinary creatinine and creatinine/Nitrogen ratios in beef cattle. J. Anim. Sei. 25: 107.
ALLEN, W. M. (1950). A simple method for analyzing complicated absorption curves, of use in the colorimetric determination of urinary steroids. J. Clin. Endocr. 10: 71.
BANERJEE-SCHOTSMAN, I. (1964). A study concerning gestation period in cattle. A biometrical contribution. Diss. Utrecht.
BASSETT, J. M. and THORBURN, G. D . (1969). Foetal plasma corticosteroids and the initiation of parturition in sheep. J. Endocr. 44: 285.
BAULD, W. S. (1956). A method for the determination of oestriol, oestrone and oestradiol-17ß in human urine by partition chromatography and colorimetric estimation. Biochem. J. 63: 488.
BELIC, M. et MENISSIER, F. (1968). Étude de quelques facteur influençant les difficultés de vêlage en croisement industriel. Ann. Zootech. 17: 107.
BEISCHER, N . A., BHARGAVA, V. L. and BROWN, J. B. (1968). The incidence and significance of low oestriol excretion in an obstetric population. J. Obstet. Gyn. Brit. Cmwelth. 75: 1024.
BELING, C. G. (1963). Gel filtration on conjugated urinary oestrogens and its application in clinical assays, Acta Endocr. (Kbh) 43: Suppl. 79.
BENGTSON, L. P H . and SCHOFIELD, B. M. (1960). Hormonal control of myometrial function during pregnancy in the sheep. J. Repr. Fert. 1: 402.
BERGSTRÖM, P. L. (1970). Personal communication. BOWERMAN, A. M. (1963). Chemical estimation of urinary estrogens of gilts. Ph. D . thesis
Iowa State Un. BRAKEL, W. J., RIFE, D . C. and SALISBURY, S. M. (1952). Factors associated with the duration
of gestation in dairy cattle. J. Dairy Sei. 35: 179. BRANDS, A. F. A. (1966). Zoötechnische aspecten van retentio secundinarum. Diss. Utrecht. BROWN, J. B. (1955). A chemical method for the determination of oestriol, oestrone and
oestradiol in human urine. Biochem. J. 60: 185. BROWN, J. B. (1959). The metabolism of oestrogens and the measurement of the excretion
products in the urine. J. Obstet. Gyn. Brit, Emp. 66: 795. CASSMER, O. (1959). Hormone production of the isolated human placenta. Acta Endocr. (Kbh)
32: Suppl. 45. COMBERG, G. and VELTEN, U. (1962). Der Einfluß von Zwillingsgeburten auf Fruchtbarkeit
und Gesundheit beim schwarzbunten Niedenjngsrind. Zuchtungsk. 34: 49. COMLINE, R. S. and SILVER, M. (1961). The release of adrenaline and' noradrenaline from the
adrenal glands of the foetal sheep. J. Physiol. (Lond.) 156: 424. CSAPO, A. (1959). Functional regulation of the myometrium. Ann. N.Y. Acad. Sei. 75: 790. DÄSSLER, C G. (1967). Korrelationen zwischen dem Geburtsgewicht des Kindes, dem Placen
tagewicht und der mütterlichen Oestriol- und Pregnandiolausscheidung bei Präeklampsie und bei chronischer Hypertonie. Arch. Gyn. 204: 157.
DICKEY, R. P. (1969). Relationship of newborn urinary estrogen to maternal urinary estrogen. Am. J. Obstet. Gyn. 104: 68.
DICKEY, R. P., BESCH, P. G., VORYS, N. and ULLERY, J. C. (1966). Diurnal excretion of estrogen and creatinine during pregnancy. Am. J. Obstet. Gyn. 94: 591.
DICKINSON, A. G. (1961). Modification of gestation length in cattle by the type of environment present at the end of pregnancy. Anim. Prod. 3 : 301.
Meded. Landbouwhogeschool Wageningen 70-12 (1970) 85
DiczFALUSY, E. (1960). Endocrine functions of the human placenta. Acta Endocr. (Khb) 34: suppl. 50.
DICZFALUSY, E. und LAURITZEN, C. (1961). Oestrogène beim Menschen. Springer Verl. Berlin.
DIETEN, S. W. J. VAN. (1963). Mortaliteit van kalveren bij de partus à terme van M.R.Y.-run-deren. Diss. Utrecht.
DROST, M. and HOLM, L. W. (1968). Prolonged gestation in ewes after foetal adrenalectomy. J. Endocr. 40: 293.
EDWARDS, K. D . G. and WHYTE, H. M. (1958). The measurement of creatinine in plasma and urine. Austr. J. Exp. Biol. 36: 383.
EECHAUTE, W., MEESTER, G. DE en LEUSDEN, I. (1965). De bepaling van oestrogenen in urine. Verh. Kon. VI. Ac. Geneesk. België. 27: 625.
EL-ATT AR, T. M. A. and TURNER, C. W. (1957). Spectrophoto-fluorimetric determination of oestrogens in urine and faeces during different stages of pregnancy. Mo. Agr. Expt. Sta. Res. Bull. 641.
ERB, R. E., RANDEL, R. D . and ESTERGREEN, V. L. (1967). Urinary estrogen excretion and levels of progesterone in blood plasma of the cow during pregnancy. J. Dairy Sei. 50: 1001.
ERB, R. E., GOMES, W. R., RANDEL, R. D., ESTERGREEN, V. L. and FROST, O. L. (1968a).
Effect of ovariectomy on concentration of progesterone in blood plasma and urinary estrogen excretion rate in the pregnant bovine. J. Dairy Sei. 51 : 420.
ERB, R. E., RANDEL, R. D., MELLIN, T. N . and ESTERGREEN, V. L. (1968b). Urinary estrogen excretion rates during pregnancy in the bovine. J. Dairy Sei. 5 1 : 416.
ERB, R. E., TILLSON, S. A. HODGEN, G. D . and PLOTKA, E. D . (1970). Urinary creatinine as an index compound for estimating rate of excretion of steroids in the domestic sow. J. Anim. Sei. 30: 79.
Es, A. J. H. VAN and VOGT, J. E. (1959). Separate collection of feces and urine of cows. J. Anim. Sei. 18: 1220.
FIELD, A. C. (1964). Studies on magnesium in ruminant nutrition. 5. The indirect determination of the intake of Mg, Ca and K by the grazing cow. Brit. J. Nutr. 18: 357.
FOLIN, O. (1914). On the determination of creatinine and creatine in urine. J. Biol. Chem. 17: 469.
FOLIN, O. (1914). On the preparation of creatine, creatinine and standard creatinine solutions. J. Biol. Chem. 17: 463.
FRANDSEN, V. A. and STAKEMAN, G. (1963). The site of production of oestrogenic hormones in human pregnancy. II. Experimental investigations on the role of the foetal adrenal. Acta Endocr. 43: 184.
GERLAUGH, P., KUNKLE, L. E. and RIFE, D . C. (1951). Crossbreeding beef cattle. A comparison of the Hereford and Aberdeen Angus breeds and their reciprocal crosses. Ohio Agric. Exp. Sta. Res. Bull. 703.
GOECKE, C. and TIMONEN, S. (1966). Estriol secretion during delivery and in the immediate post partum. Arch. Gyn. 203: 118.
GOMES, W. R., MELLIN, T. N. and ERB, R. E. (1965). Comparison of methods for hydrolysis of bovine urinary estrogen conjugates. J. Dairy Sei. 48: 993.
GORSKI, J. and ERB. R. E. (1959). Characterization of estrogens in the bovine. Endocr. 64: 707.
GROMMERS, F. J., BRANDS, A. F . A. en SCHOENMAKERS, A. (1965). Mortaliteit van kalveren bij de partus van Nederlandse runderen. Tijdschr. v. Diergeneesk. 90: 231.
GROOT, T. DE and AAFJES, J. H. (1960). On the constancy of creatinine excretion in the urine of the dairy cow. Brit. Vet. J. 116: 409.
GRUNERT, E. und AHLERS, D . (1969). Harnöstrogenbestimmung beim Rind zur Diagnose intrauterin abgestorbener Früchte. Dtsch. Tierärztl. W. sehr. 76: 501.
GUL, A. P. (1962). Changes in the estrogenic function in dairy cattle under the influence of external factors. Dokl. Akad. Nauk. S.S.S.R. 144: 613.
86 Meded. Landbouwhogeschool Wageningen 70-12 (1970)

HAHNEL, R. and STENHOUSE, N.S. (1967). Variation of total oestrogen excretion within 24 hours and from day to day. Eur. J. Steroids. 2 : 349.
HAMMERSTEIN, J. und NEVINNY-STICKEL, J. (1965). Verminderte Oestrogenausscheidung in der Schwangerschaft nach subtotaler Adrenalektomie. Acta endocr. (Kbh). 48: 375.
HODGEN, G. D . ERB, R. E. and PLOTKA, E. D . (1967). Estimating creatinine excretion in sheep. J. Anim. Sei. 26: 586.
HOLM, L. W. (1964). Pregnancy, some unanswered questions. Proc. Austr. Soc. Anim. Prod. 5 :82 .
HUNT, M. L., LEGAULT, R. R. and HERRICK, H. (1961). Metabolism of estrone-17-C14 in the luteal phase bovine. Bienn. Symp. Anim. Reprod. Knoxville Tennessee.
ITTRICH, G. (1958). Eine neue Methode zur chemischen Bestimmung der oestrogenen Hormone in Harn. Hoppe-Seylers Z. Physiol. Chem. 312: 1.
JAFAR, S. M. CHAPMAN, A. B. and CASIDA, L. E. (1950). Causes of variation in length of gestation in dairy cattle. J. Anim. Sei. 9: 593.
JOHANNISSON, E. (1968). The foetal adrenal cortex in the human. Its ultrastructure at different stages of development and in different functional states. Acta endocr. (Kbh) 58. Suppl. 130.
JONGE, H. DE (1963). Inleiding tot de medische statistiek, deel I en II Leiden. JOUBERT, D . M. and BONSMA, J. C. (1959). Gestation periods of crossbred cattle. S. Afr. J.
Agr. Sei. 2 : 215. KAHMANN, H. K., KREUTZER, J., MEULENDIJK, P. N . and LEUSDEN, H. A. VAN (1969). Corre
lation of oestriol and creatinine in human pregnancy. J. Reprod. Fert. 16: 324. KASSAB, S. A. (1964). On maternal and some other influences on birthweight, growth and
haircoat in two Dutch cattle breeds. Commun. State Agr. Univ. Wageningen, 64: 1. KELLAR, R., MACKAY, R., BROWN, J. B. and ROY, E. J. (1959). Some clinical applications
of oestrogen assay. J. Obstet. Gyn. Brit. Emp. 66: 804. KLOOSTERMAN, G. J. en Huis IN 'T VELD, L. G. (1961). De uitscheiding van oestrogène stoffen
en pregnandiol bij een geval van niet placentaire intra-uteriene sterfte. Ned. T. Verlosk. Gyn. 61 : 307.
KLOPPER, A. (1964). Variability of urinary sex steroid hormone output in pregnancy. Research on steroids, pp. 119-132. Ed. C. Cassano. Rome: II Pensiero Scientifico.
KLOPPER, A., WILSON, G. and COOKE, I. 1969). Studies on the variability of urinary oestriol and pregnanediol output during pregnancy. J. Endocr. 43: 295.
KLYNE, W. and WRIGHT, A. A. (1957). Steroids and other lipids of pregnant goat's urine. Biochem. J. 66: 92.
KNAPSTEIN, P. STRAUSS, G., WENDLBERGER, F. und OERTEL, G. W. (1968). Direkter Metabolismus von I. V. injizierten Dehydroepiandrosteron-7a-3-H-sulfat-35S am Ende der normalen Schwangerschaft. Acta Endocr. (Kbh). 58: 261.
KOBER, S. (1938). Über die Ausscheidung der Oestrogenenstoffe im Harn Trächtiger Stuten. Arch. Int. Pharmacod. Therap. 59: 61.
KORTSTEE, G. J. J. (1963). De draagtijd van het M.R.Y.- en het F.H.-vee in Nederland. Veet. Zuivelber. 6: 88.
KUSHINSKY, S. and OTTERNESS, I. (1964). Conjugated estrogens. IV. Separation of urinary estrogens by gel-filtration and the effect of endogenous inhibitor on the rate and extent of hydrolysis by ß-glucuronidase. Steroids 3 : 311.
LEEUWEN, J. F. M. VAN. (1967). Geboorteregistratie. Jaarversl. K.I. LEVIN, L. (1945). The fecal excretion of estrogens in pregnant cows. J. Biol. Chem 157: 407. LIGGINS, G. C , KENNEDY, P. C. and HOLM, L. W. (1967). Failure of initiation of parturition
after electrocoagulation of the pituitary of the fetal lamb. Am. J. Obstet. Gyn. 98: 1080. LIGGINS, G. C. (1968). Premature parturition after infusion of corticotrophin or Cortisol into
foetal lambs. J. Endocr. 42: 323. MACKAY, E. V., MACAFEE, A. C. J. and ANDERSON, C. (1968). Value of single urinary spe
cimens for estrogen estimation during pregnancy. Austr. N.Z. J. Obstet. Gyn. 8 :17. MANER, F. D. , SAFFAN B. D., WIGGINS, R. A., THOMPSON, J. D . and PREEDY, J. R. K. (1963).
Interrelationship of estrogen concentrations in the maternal circulation, fetal circulation and maternal urine in late pregnancy. J. Clin. Endocr. 23: 445.
Meded. Landbouwhogeschool Wageningen 70-12 (1970) 87

MELLIN , T. N . , ESTERGREEN, V. L. and E R B , R. E. (1964). Bovine urinary estrogen excretion before and after normal and induced parturition. J. An im. Sei. 2 3 : 910.
MELLIN, T. N . (1965). Bovine urinary estrogen excretion before and after normal and induced parturition. Ph. D . Thesis Purdue Un . Indiana.
MELLIN , T. N . and E R B , R. E . (1965). Estrogens in the bovine. J. Dairy Sei. 48 : 687. MELLIN, T. N . , E R B , R. E . and ESTERGREEN, V. L. (1965n). Quantitative estimation and
identification of estrogens in bovine urine. J. Dairy Sei. 48 : 895. MELLIN, T. N . , E R B , R. E. and ESTERGREEN, V. L. (1966). Urinary excretion of estrogen by
the bovine before and after parturition. J. Anim. Sei. 25 : 955. M I L K MARKETING B O A R D (1965). 'The Charolais trials'. Rep . Breed. Prod. Org. 15: 43. N A K A Y A M A , T., A R A I , K., YANAIHARA, T., TABEL T., SATOH, K. and NAGATOMI, K. (1967).
Oestrogen metabolism in anencephalus. Acta endocr. (Kbh). 5 5 : 369. NELSON, D . W. and SMITH, E. P. (1963). Urinary excretion of estrogenic compounds during
estrus and gestation by the bovine as determined by three assay methods. J. Dairy Sei. 46 : 135.
N O C K E , W. (1961). A study of the colorimetric estimation of oestradiol-17ß, oestrone, oe-striol and 16-epioestriol by the Kober-reaction. Biochem. J. 78 : 593.
OSINGA, A. (1969). The 'foeto-placental unit' en het geboorteproces. Tijdschr. v. Diergeneesk. 94 : 768.
OSINGA, A . , STEGENGA, T H . and JÖCHLE, W. (1970). Initiation of parturition in dairy cows with a synthetic corticosteroid. Biol. Repr. in press.
POLITIEK, R. D . (1963). D e volledige geboorteregistratie van kalveren bij een k.i.-vereniging. Veet. Zuivelber. 6: 511.
POPE, G. S. and N A U G H T O N , M. J. M C . (1957). The isolation of oestrone from the urine of cows in late pregnancy. Biochem. J. 66 : 206.
RAESIDE, J. I. (1963). Urinary oestrogen excretion in the pig during pregnancy and parturition. J. Repr. and Fert. 6: 427.
R A N D E L , R. D . , E R B . R. E. , GARVERICK, H. A . and SURVE, A . H. (1968). Urinary estrogen excretion-rate preceding birth of twins in cows. J. Dairy. Sei. 5 1 : 947.
R E N D E L , J. (1959). Factors influencing gestation length in Swedish breeds of cattle. Z. Tierz. Zucht. Biol. 7 3 : 117.
RENSBURG, S. J. VAN (1965). Adrenal function and fertility. J. S. Afr. Vet. Med. Ass . 3 6 : 491. RIFE, C. D . (1950). Unterschiede in der Länge der Tragezeit bei Aberdeen Angus- und Here-
ford-Kühen die Reinzücht- und Kreuzungskälber tragen. Tierz. Zucht. Biol. 5 8 : 124. ROMBOUTS, P. (1962). Excretion urinaire d'oestrogènes chez la truie pendant la gestation.
Ann . Biol. An im. Biochim. Biophys. 2 : 151. ROMMEL, W. und ROMMEL, P. (1958) Oestrogen ausscheidung im Rinderurin während der
ungestörten Trächtigkeit, der Geburt und im früh Puerperium. Wiss. Zeitschr. Karl Marx-Un. Leipzig. Math. Naturwiss. 8: 821.
RUSSE, M. (1968). Zur vegetativen Regulation des Myometrium. Tierz. Zucht. Biol. 84 : 307. R Y A N , K. J. and AINSWORTH, L. (1966). Comparative aspects of steroid hormones in repro
duction. In 'Comparative aspects of reproductive failure'. Springer Verl. N e w York. p . 154.
SANDBERG, A . A . and SLAUNWHITE, W. R. (1957). Studies on phenolic steroids in human subjects II. The metabolic fate and hepato-biliary-enteric circulation of C 1 4-estrone and C14-estradiol in women. J. Clin. Invest. 36 : 1266.
SCHOTT, E . W. and K A T Z M A N N , P. A . (1964). Separation and estimation of 17-a estradiol. Endocrin. 74 : 870.
SCOMMEGNA, A . and CHATTORAJ, S. (1967). Urinary pregnandiol and creatinine excretion in the female of menstrual age. Obstet, and Gynec. 30 : 242.
SCOTT RUSSELL, C. (1959). A n estimate of the errors of assaying oestradiol, oestrone and oestriol (using Brown's method). J. Obstet. Gyn . Brit. Emp. 66 : 823.
SHORT, R. V. and E T O N , B. (1195). Progesterone in blood. III. Progesterone in the peripheral b lood o f pregnant women. J. Endocr. 18: 418.
8 8 Meded. Landbouwhogeschool Wageningen 70-12 (1970)

SHORT, R. V. (1960). Blood progesterone levels in relation to parturtion. J. Reprod. Fert. 1: 61.
SnTERi, P. K. and M A C DONALD, P. (1963). The utilization of circulating dehydroandrosterone-sulfate for estrogen synthesis during human pregnancy. Steroids. 2 : 713.
SIITERI, P. K. and MAC DONALD, P. (1966). The origin of placental estrogen precursors during human pregnancy. Excerpta Med. Int. Congr. Series 132: 726.
SINADINOVIC, J. R. and VELLE, W. (1968). Some observations on hydrolysis of oestrogen conjugates in bovine urine. Formation of oestratetraenol. Acta endocr. (Khbh). 58: 243.
SMIDT, D., DANNENBERG, K. und WESELOH, E. (1968). Die Bedeutung von Geburtsvorgang und Laktation für die Fortpflanzungsleistung landwirtschaftlicher Nutztiere. Tierz. Zucht. Biol. 84: 236.
STEGENGA, T H . (1964a). Doodgeboren kalveren. Tijdschr. v. Diergeneesk. 89: 93. STEGENGA, T H . (1964b). Aangeboren afwijkingen bij rundvee. Tijdschr. v. Diergeneesk. 89:
286. STEGENGA, T H . (1964c). Enkele fysiologische beperkingen van de voortplanting bij runderen.
Tijdschr. v. Diergeneesk. 89: 1628. SURVE, A. H., RANDEL, R. D. , ERB, R. E. and GARVERICK, H. A. (1967). Prepartum and
postpartum changes in blood plasma creatinine in dairy cows. J. Dairy Sei. 50: 980. TERQUI, M., ROMBOUTS, P., FÉVRE, J. (1968). Comparative faecal and urinary excretion of
oestrogens in the ewe and sow. Ann. Biol. Anim. Biochem. Biophys. 8: 339. VAGNUCCI, A. L, HESSER, M. E., KOZAK, G. P., PAUK, G. L., LAULER, D . P. and THORN, G. W.
(1965). Orcadian cycle of urinary Cortisol in healthy subjects and in Cushing's syndrome. J. Clin. Endocr. 25: 1331.
VELLE, W. /1958). Undersokelser over naturlig forekommende 0strogener hos drevtyggere og gris. Diss. Oslo.
VETERINARY CLINICAL OBSERVATION UNIT (1963). The Charolais survey. Vet. Rec. 75: 1045. Vos, M. P. M. (1969). Het meten en wegen van runderen voor de selectie op vleesproductie.
Thesis, Wageningen. WICKERSHAM, E. W. and TABANE, T. Y. (1967). Functional status of bovine corpora lutea of
pregnancy. J. Dairy. Sei. 50: 1001. WILCOX, C. J. and ROY, D . K. (1968). Factors affecting birthweights and gestation lengths
in Jersey cattle. J. Dairy Sei. 5 1 : 629. WRIGHT, A. A. (1962). Metabolism of oestradiol-17ß by an ovariectomised ewe. J. Endocr.
24: 291.
Meded. Landbouwhogeschool Wageningen 70-12 (1970) 89


![Biology_Separate_Homeostasis_and_response · Web viewto gland B. [1 mark] _____ 3.3 Oestrogen is a reproductive hormone. Which gland secretes oestrogen? [1 mark] 3.4 A woman is not](https://img.dokumen.tips/doc/110x75/5b3328017f8b9ab5728d9ea4/biologyseparatehomeostasisandresponse-web-viewto-gland-b-1-mark-.jpg)


![Excretion [2015]](https://img.dokumen.tips/doc/110x75/55d39c87bb61eb05278b46dd/excretion-2015-55d47f0693bf7.jpg)


