Embed Size (px)
Citation preview

It's not allowed to change the master It's not allowed to change the master
source/footnote 8,6
4,7
8,0
9,1
6,6
8,3
0,9
0,5
Oerlikon continues its strong
performance in Q3 2014
Investor Presentation
January 2015

It's not allowed to change the master It's not allowed to change the master
source/footnote 8,6
4,7
8,0
9,1
6,6
8,3
0,9
0,5
Agenda
1 Introduction
2 Q3 2014 Business Update
3 Outlook 2014
4 Appendix
Oerlikon Investor Presentation_January 2015Page 2

It's not allowed to change the master It's not allowed to change the master
source/footnote 8,6
4,7
8,0
9,1
6,6
8,3
0,9
0,5
Oerlikon – a global industrial player
Manmade
Fibers
Segment
Advanced
Technologies
Segment2
Drive
Systems
Segment
Surface
Solutions
Segment1
Vacuum
Segment
CHF 1 130m CHF 734m CHF 396m CHF 1 218m CHF 113m
CHF 188m CHF 26m CHF 41m CHF 176m CHF 4m
Oerlikon
Group1
Sales: CHF 3 591m
EBIT: CHF 437m
~15 500 employees
> 170 locations
35 countries
~CHF 146m in R&D
Oerlikon Investor Presentation_January 2015Page 3
1 2013 pro-forma figures; Surface Solutions Segment incl. Oerlikon Metco (Metco transaction closed on June 2, 2014)2 Divestment announced on December 23, 2014
It's not allowed to change the master It's not allowed to change the master
source/footnote 8,6
4,7
8,0
9,1
6,6
8,3
0,9
0,5
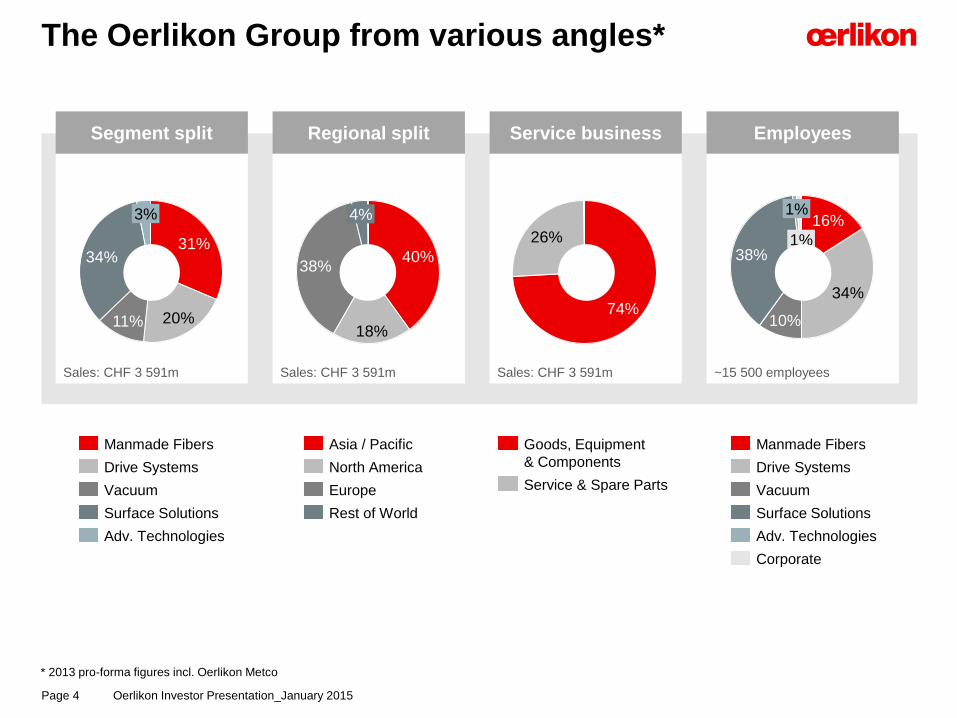
The Oerlikon Group from various angles*
Adv. Technologies
Surface Solutions
Vacuum
Drive Systems
Manmade Fibers
Rest of World
Europe
Asia / Pacific
North America
Sales: CHF 3 591m Sales: CHF 3 591m
31%
3%
34%
11% 20%
38%40%
18%
4%
Segment split Regional split
* 2013 pro-forma figures incl. Oerlikon Metco
Corporate
Manmade Fibers
Adv. Technologies
Drive Systems
Surface Solutions
Vacuum
Goods, Equipment
& Components
Service & Spare Parts
Sales: CHF 3 591m ~15 500 employees
38%
1%
34%
10%
1%
16%
74%
26%
Service business Employees
Oerlikon Investor Presentation_January 2015Page 4

It's not allowed to change the master It's not allowed to change the master
source/footnote 8,6
4,7
8,0
9,1
6,6
8,3
0,9
0,5
Oerlikon Portfolio – 11 successful strategic
transactions since 2010
Textile Segment:
Natural fibers businesses sold
Corporate:
Pilatus stake sold
Drive Systems Segment:
Poretta site sold
Coating Segment:
Hartec acquisition
Textile Segment:
Carding business sold
Coating Segment:
Rox acquisition
2011 2012 2013 2014
Coating Segment:
Metco acquisition
Solar Segment:
Segment sold
Drive Systems Segment:
Garessio site sold
Textile Segment:
Melco business sold
Oerlikon Investor Presentation_January 2015Page 5
2015
Advanced
Technologies
Segment:
Divestment
announced

It's not allowed to change the master It's not allowed to change the master
source/footnote 8,6
4,7
8,0
9,1
6,6
8,3
0,9
0,5
Looking at future development of Oerlikon
from three different perspectivesCompetencies
perspective:
Use existing competencies
to enhance product and
services offering
Megatrends
Resource scarcity
Productivity increase
Global mobility
Environmental
sustainability
Competencies
(Process) Engineering
Materials and surfaces
characteristics
Precision machinery &
equipment
Customers domain
knowledge
Services expertise
Technologies
Deposition technology
Yarn formation technology
incl. polycondensation
Materials technology
High rotation speed,
torque & balancing
technologies
Technology perspective:
Invest into complementary
or adjacent technologies
(organic and inorganic) to
strengthen existing portfolio
(e.g. Metco transaction)
Future
direction of
Oerlikon
Megatrends:
Foster products and services
offerings supporting and
leveraging visible and
sustainable megatrends
Oerlikon Investor Presentation_January 2015Page 6

It's not allowed to change the master It's not allowed to change the master
source/footnote 8,6
4,7
8,0
9,1
6,6
8,3
0,9
0,5
What does this mean for Oerlikon?
Oerlikon will:
… leverage and strengthen Best-in-Class businesses
… improve businesses which are not yet Best-in-Class
… leverage attractive end-markets
… balance market exposure (regions and end-markets)
… further strengthen its core competencies
… further reduce cyclicality and volatility
… use its cash in a disciplined and value accretive way
Oerlikon Investor Presentation_January 2015Page 7
It's not allowed to change the master It's not allowed to change the master
source/footnote 8,6
4,7
8,0
9,1
6,6
8,3
0,9
0,5
Agenda
1 Introduction
2 Q3 2014 Business Update
3 Outlook 2014
4 Appendix
Oerlikon Investor Presentation_January 2015Page 8

It's not allowed to change the master It's not allowed to change the master
source/footnote 8,6
4,7
8,0
9,1
6,6
8,3
0,9
0,5
Oerlikon delivers strong sales growth and
order intake in Q3 2014
894877
697
25.8%
Q3 2014 at
stable FX
Q3 2014Q3 2013
18.7%
Q3 2014Q3 2013
712
845
Salesin CHF million
Order intakein CHF million
Strong sales growth of 25.8 % and order intake up 18.7 % in Q3 2014
At stable exchange rates sales increased by 28.3%
EBITDA margin of 15.6 % and double-digit EBIT margin (10.2 %) for the 11th consecutive quarter –
absorbing acquisition accounting effects and one-time integration costs related to Metco transaction
EBITDA (margin)in CHF million;
in % of sales
17.0% 15.6%
EBIT (margin)in CHF million;
in % of sales
12.6% 10.2%
9088
2.3%
Q3 2014Q3 2013
15.1%
Q3 2014Q3 2013
119
137
Oerlikon Investor Presentation_January 2015Page 9

It's not allowed to change the master It's not allowed to change the master
source/footnote 8,6
4,7
8,0
9,1
6,6
8,3
0,9
0,5
FX impact on Sales, EBIT and EBIT margin
894877
+1.9%
Q3 2014
FX impact adj.
Translation
effects
17
Transaction
effects
-0.4
Q3 2014
9090
0%
Q3 2014
FX impact adj.
Translation
effects
0.2
Transaction
effects
0.2
Q3 2014
10.2 10.1
Devaluation of currencies (INR, USD, CNY)
EUR with minor deviation against CHF
1.9 % currency impact on sales
Impact on EBIT margin negligible
EBIT margin in %
Oerlikon Group Sales Q3 2014
in CHF million
Oerlikon Group EBIT Q3 2014
in CHF million
Oerlikon Investor Presentation_January 2015Page 10

It's not allowed to change the master It's not allowed to change the master
source/footnote 8,6
4,7
8,0
9,1
6,6
8,3
0,9
0,5
Surface Solutions Segment –
Overview1
Surface Solutions
Strategic position:
Two business units: Oerlikon Balzers
and Oerlikon Metco
Oerlikon Balzers is the technology
leader in Thin Film (PVD) coatings
Oerlikon Metco (transaction closed
on June 2, 2014) is the technology
leader in Thicker Layer Coating
(Thermal Spray)
Extension of product offer to new
coatings and services
1 former Coating Segment (before acquisition of Oerlikon Metco)
Automotive and aerospace sales
Usage of adv. surface solutions in various
sub-segments for functional and
decorative enhancements (watches,
medical, aerospace)
Substitution of chrome-plating technology
on automotive
Broad customer base worldwide
Over 110 coating centers in 35 countries
Oerlikon Balzers undisputed technology
leader in PVD (Physical Vapor
Deposition) coating
Oerlikon Metco undisputed technology
leader in Thermal Spray (materials and
equipment business)
Market
drivers
Customer
base
Competitive
landscape
Oerlikon Investor Presentation_January 2015Page 11

It's not allowed to change the master It's not allowed to change the master
source/footnote 8,6
4,7
8,0
9,1
6,6
8,3
0,9
0,5
Leading surface technologies
Surface treatment
THIN FILM COATING
PVD
PECVD (PACVD)
THICKER LAYER COATING
Thermal SprayNITRIDING
Plasma nitriding
Bulk
treatment
HARDENING
HEAT TREATMENT
With the acquisition of Metco Oerlikon covers
a broad range of surface treatment technologies
Oerlikon Investor Presentation_January 2015Page 12

It's not allowed to change the master It's not allowed to change the master
source/footnote 8,6
4,7
8,0
9,1
6,6
8,3
0,9
0,5
Surface Solutions Segment –
Leading surface treatment technologiesM
ark
ets
serv
ed
Pro
du
cts
ToolingTransportation
Aviation
Automotive
Marine
Cutting tools for metal
machining
Forming tools for metal
and plastic processing
Plasma Nitriding
Thin Film coatings
Thicker Layer coatings
Plastic Metallization
(ePD)
Thin Film coatings
General IndustryEnergy
Food
Pulp & Paper
Watches
Pharmaceuticals
Packaging
Consumer goods (e.g.
watches)
Medical technology
Oil & Gas
Power generation
Plasma Nitriding
Thin Film coatings
Thicker Layer coatings
Plasma Nitriding
Thin Film coatings
Thicker Layer coatings
Oerlikon Investor Presentation_January 2015Page 13
It's not allowed to change the master It's not allowed to change the master
source/footnote 8,6
4,7
8,0
9,1
6,6
8,3
0,9
0,5
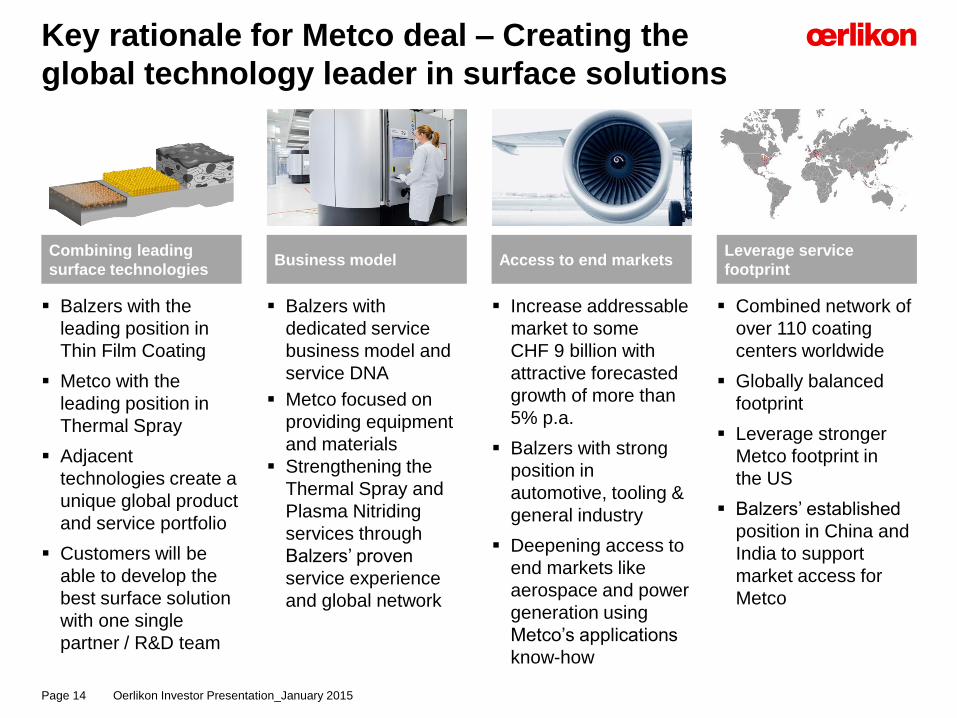
Key rationale for Metco deal – Creating the
global technology leader in surface solutions
Oerlikon Investor Presentation_January 2015Page 14
Access to end marketsLeverage service
footprint
Increase addressable
market to some
CHF 9 billion with
attractive forecasted
growth of more than
5% p.a.
Balzers with strong
position in
automotive, tooling &
general industry
Deepening access to
end markets like
aerospace and power
generation using
Metco’s applications
know-how
Combined network of
over 110 coating
centers worldwide
Globally balanced
footprint
Leverage stronger
Metco footprint in
the US
Balzers’ established
position in China and
India to support
market access for
Metco
Combining leading
surface technologiesBusiness model
Balzers with the
leading position in
Thin Film Coating
Metco with the
leading position in
Thermal Spray
Adjacent
technologies create a
unique global product
and service portfolio
Customers will be
able to develop the
best surface solution
with one single
partner / R&D team
Balzers with
dedicated service
business model and
service DNA
Metco focused on
providing equipment
and materials
Strengthening the
Thermal Spray and
Plasma Nitriding
services through
Balzers’ proven
service experience
and global network

It's not allowed to change the master It's not allowed to change the master
source/footnote 8,6
4,7
8,0
9,1
6,6
8,3
0,9
0,5
in CHF million Q3 2014 Q3 20132 Δ
Order intake 317 123 >100 %
Sales (to 3rd parties) 312 123 >100 %
EBITDA 46 36 27.8 %
EBITDA margin1 14.6 % 28.9 % -14.3 pp
EBIT 18 25 -28.0 %
EBIT margin1 5.7 % 20.4 % -14.7 pp
Surface Solutions Segment –
Q3 2014 performance
RoW
5%
Asia /
Pacific
26%
North America
18%
Europe51%
Automotive
23%
Tooling38%21%
General
Industry
Aviation
Power Generation
12%
6%
1 as % of sales; 2 excl. Oerlikon Metco (transaction closed on June 2, 2014)
Metco integration well on track
Underlying sales growth and continued
high underlying profitability
Segment profitability impacted by
acquisition accounting effects and
one-time transaction/integration costs
Continued growth in services
Automotive and tooling industry in Europe,
Asia and the United States as driver
Solid demand in aviation (some softening
in MRO) and growth in the power
generation as well as oil & gas industries
Operational
performance
Market
development
Key figures
Sales
Q3 2014
Sales
Q3 2014
Oerlikon Investor Presentation_January 2015Page 15

It's not allowed to change the master It's not allowed to change the master
source/footnote 8,6
4,7
8,0
9,1
6,6
8,3
0,9
0,5
Surface Solutions Segment –
Financial impact
Financial impact on Surface Solutions
Segment Q3 accounts:
Transaction/integration costs
of ~CHF 6 million
Inventory step up of ~CHF 13 million
Amortization of acquired identifiable intangible
assets of ~CHF 8 million
Back-up:
Financial impact on Surface Solutions
Segment Q2 accounts:
Transaction costs of ~CHF 13 million
Inventory step up of ~CHF 10 million
Amortization of acquired identifiable intangible
assets of ~CHF 3 million
Oerlikon Investor Presentation_January 2015Page 16

It's not allowed to change the master It's not allowed to change the master
source/footnote 8,6
4,7
8,0
9,1
6,6
8,3
0,9
0,5
Financial impact of Metco transaction
H1 14 H2 14 2015 2016 2017ff
>CHF 20 million >CHF 30 million >CHF 30 million >CHF 30 million
Amortization of acquired identified intangibles assets
Inventory step up
>CHF 20 million
as of closing
Integration costsTransaction costs
>CHF 20 million,
thereof CHF 6 million
already booked in 2013
>CHF 10 million >CHF 10 million <CHF 10 million
Cost synergies (cumulative)
<CHF 5 million ~CHF 5 million >CHF 10 million
Top-line synergies
Cash
ite
ms
No
n-c
ash
ite
ms
Oerlikon Investor Presentation_January 2015Page 17

It's not allowed to change the master It's not allowed to change the master
source/footnote 8,6
4,7
8,0
9,1
6,6
8,3
0,9
0,5
Financial impact of Metco transaction –
Reality check
H1 14 H2 14
>CHF 20 million
>CHF 20 million
as of closing
Transaction costs
>CHF 10 million
Cash
ite
ms
No
n-c
ash
ite
ms
>CHF 20 million,
thereof CHF 6 million
already booked in 2013
Se
pt.
30
, 2
01
4
Amortization of acquired identified intangibles assets
Inventory step up
Integration costs
Tra
nsa
cti
on
&
Inte
gra
tio
n c
os
ts
Inve
nto
ry
ste
pu
pA
mo
rtiz
ati
on
Guidance FY 2014: > CHF 24m
YTD: CHF 19m
Guidance FY 2014: >CHF 20m
YTD: CHF 23m
Guidance FY 2014: >CHF 20m
YTD: CHF 11m
Reality check as of Sept. 30, 2014
Oerlikon Investor Presentation_January 2015Page 18

It's not allowed to change the master It's not allowed to change the master
source/footnote 8,6
4,7
8,0
9,1
6,6
8,3
0,9
0,5
Surface Solutions Segment expected to
grow ~2x GDP with profitability expansion
Sales
EBIT
EBITDA
FY 2013 pro-forma
1,218
2017E
around 1,500
Mid-term expectation
Surface Solutions Segment
Based on a current global GDP
growth assumption of ~3 %
2017E
around 22.0%
current trading
14.6%
around 14.5%
2017Ecurrent trading
5.7%
CAGR: ~2x global GDP
Incl. full absorption of one-time
transaction/integration costs and
acquisition accounting effects
Incl. full absorption of one-time
transaction/integration costs and
acquisition accounting effects
Oerlikon Investor Presentation_January 2015Page 19

It's not allowed to change the master It's not allowed to change the master
source/footnote 8,6
4,7
8,0
9,1
6,6
8,3
0,9
0,5
Manmade Fibers Segment –
Overview
Manmade Fibers
Strategic position:
High-performing manmade fiber
business (high profitable growth
potential, less cyclicality)
Plant engineering and construction
Growing end markets
(e.g. apparel, technical applications,
home textiles)
Population/GDP growth and increasing per
capita consumption
Replacement of cost intensive by resource
saving equipment
Growth in technical textiles
Political encouragement in China & India
Market growth of 6 % p.a.
Market
drivers
Dedicated customer base with long-term
investment horizon (upstream integration)
and strong balance sheets, predominantly
based in China and India
25 leading companies will produce 60 % of
world demand thereof 22 companies
are Oerlikon customers
Customer
base
Concentrated competitor base, only 3
international players in the market for
filament spinning (TMT, CTAMP)
Local competitors in texturing, staple fibers
and nonwovens market
Competitive
landscape
Oerlikon Investor Presentation_January 2015Page 20

It's not allowed to change the master It's not allowed to change the master
source/footnote 8,6
4,7
8,0
9,1
6,6
8,3
0,9
0,5
Manmade Fibers Segment – High-tech
equipment for chemical yarn production
Functional wear Home textilesTechnical textiles
Mark
ets
serv
ed
Outer wear
Sports wear
Hosiery & socks
(Protective) Apparel
Carpets
Curtains
Seat covers
Upholstering
Napkins
Agrotextiles
Geotextiles
Car interior (incl. seat belts,
airbag)
Ropes
Nets
Tarpaulin
Spinning plants
Texturing machines
Plant engineering
BCF plants
Tape & Monofilament
Spinning plants
Texturing machines
Plant engineering
Spinning plants
Texturing machines
Plant engineering
Pro
du
cts
Oerlikon Investor Presentation_January 2015Page 21

It's not allowed to change the master It's not allowed to change the master
source/footnote 8,6
4,7
8,0
9,1
6,6
8,3
0,9
0,5
Customer example – Spinning plant
3 x 200 t/d Polycondensation
504 WINGS POY
144 WINGS FDY
648 spinning positions
Polycondensation
Plastic melt
Winder
Oerlikon Investor Presentation_January 2015Page 22
It's not allowed to change the master It's not allowed to change the master
source/footnote 8,6
4,7
8,0
9,1
6,6
8,3
0,9
0,5
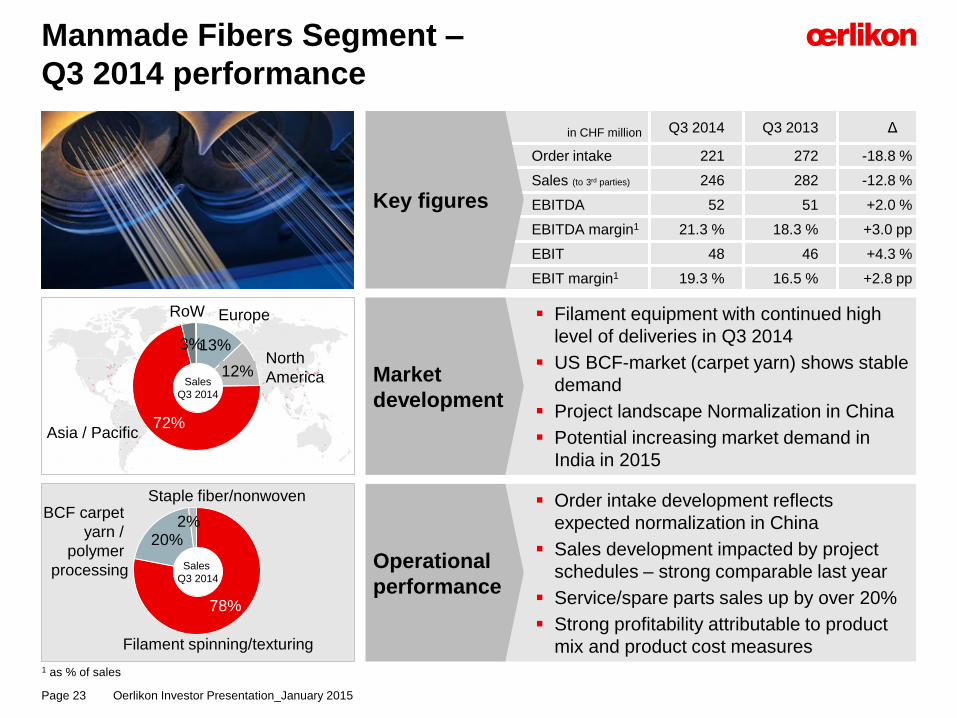
in CHF million Q3 2014 Q3 2013 Δ
Order intake 221 272 -18.8 %
Sales (to 3rd parties) 246 282 -12.8 %
EBITDA 52 51 +2.0 %
EBITDA margin1 21.3 % 18.3 % +3.0 pp
EBIT 48 46 +4.3 %
EBIT margin1 19.3 % 16.5 % +2.8 pp
Manmade Fibers Segment –
Q3 2014 performance
Order intake development reflects
expected normalization in China
Sales development impacted by project
schedules – strong comparable last year
Service/spare parts sales up by over 20%
Strong profitability attributable to product
mix and product cost measures
Operational
performance
Filament equipment with continued high
level of deliveries in Q3 2014
US BCF-market (carpet yarn) shows stable
demand
Project landscape Normalization in China
Potential increasing market demand in
India in 2015
Market
development
RoW
Asia / Pacific72%
North
America12%
Europe
13%
BCF carpet
yarn /
polymer
processing
20%
78%
Filament spinning/texturing
Staple fiber/nonwoven
Key figures
1 as % of sales
3%
2%
Sales
Q3 2014
Sales
Q3 2014
Oerlikon Investor Presentation_January 2015Page 23

It's not allowed to change the master It's not allowed to change the master
source/footnote 8,6
4,7
8,0
9,1
6,6
8,3
0,9
0,5
Drive Systems Segment –
Overview
Drive Systems
Strategic position:
Niche applications with limited
exposure to more commoditized gear
component market
Focus on difficult-to-produce, high-
performance products in high-end
applications
Expand in high-growth segments
such as energy and on-/off-highway
market
Population growth, rising middle class
and increased mobility
Migration towards higher technology in
agriculture in emerging markets
Construction and infrastructure build-up
in developing countries
Market growth GDP correlated
Concentrated customer base of global
OEMs and producers (CNH, John Deere,
Caterpillar, etc.)
Develop and expand local Chinese and
Indian customers
Many competitors worldwide competing in
the niche gear and drives market.
Competitors include both global players as
well as smaller regional producers
Market
drivers
Customer
base
Competitive
landscape
Oerlikon Investor Presentation_January 2015Page 24

It's not allowed to change the master It's not allowed to change the master
source/footnote 8,6
4,7
8,0
9,1
6,6
8,3
0,9
0,5
Drive Systems Segment –
High-tech gearing solutionsM
ark
ets
serv
ed
Pro
du
cts
TransportationOff-Highway Equipment
Agriculture
Construction
Lift equipment
Rail
Floor buse
Hybrid buses
Axles
Transmissions
Synchronizers
Clutch packs
Planetary &
electric drives
Locomotive traction
gears & assemblies
Bus axles
Gear & shaft
components for
hybrid buses
Performance Automobile
Energy/Mining
Sports cars
Specialty passenger
cars
Motorcycles
Zero-emission vehicles
Oil & Gas
Mining
Wind
Transmissions
Power take-off units
Angle drives
Gearboxes
Planetary gearboxes
Gear assemblies
Large gear components
Oerlikon Investor Presentation_January 2015Page 25

It's not allowed to change the master It's not allowed to change the master
source/footnote 8,6
4,7
8,0
9,1
6,6
8,3
0,9
0,5
in CHF million Q3 2014 Q3 2013 Δ
Order intake 190 186 +2.2 %
Sales (to 3rd parties) 194 172 +12.8 %
EBITDA 20 15 +33.3 %
EBITDA margin1 10.3 % 8.7 % +1.6 pp
EBIT 10 6 +66.7 %
EBIT margin1 5.1 % 3.4 % +1.7 pp
Drive Systems Segment –
Q3 2014 performance
RoW
Asia / Pacific
10%
North
America
31% Europe55%
Energy/Mining
10%
15%
Performance
Automobile
Construction
22%
Transportation
15%
Agriculture38%
1 as % of sales
Strong sales and slight order intake growth
Focus on operational performance and
cost resulted in margin improvements
Strengthened leadership team in China
Operational
performance
Construction machinery market continues
to be strong in North America
Lower trading in agriculture as expected
Oil & gas market (primarily off-shore)
strong and modest increase in gas
fracking equipment demand
Strong sales in high-performance auto
Market
development
Key figures
4%
Sales
Q3 2014
Sales
Q3 2014
Oerlikon Investor Presentation_January 2015Page 26

It's not allowed to change the master It's not allowed to change the master
source/footnote 8,6
4,7
8,0
9,1
6,6
8,3
0,9
0,5
Vacuum Segment –
Overview
Vacuum
Strategic position:
Vacuum solutions for process
industry, solar/coating and
R&D/analytics with limited exposure
to semiconductor market
Modularization of product offering and
streamlining of production process
Demographics and middle class
development driving process industry
growth
Construction and infrastructure with
coating of glass and solar panels
Market growth GDP correlated
Highly diversified (more than 18 000
customers )
Highly diversified competitive landscape
Big global competitors (Edwards, Pfeiffer,
Busch) as well as regional competitors
Market
drivers
Customer
base
Competitive
landscape
Oerlikon Investor Presentation_January 2015Page 27

It's not allowed to change the master It's not allowed to change the master
source/footnote 8,6
4,7
8,0
9,1
6,6
8,3
0,9
0,5
Vacuum Segment –
Creating something from nothing
Process Industry Analytics / R&D Coating / Solar / Semi
Mark
ets
serv
ed
Industrial furnaces & metallurgy
(steel degassing)
Automotive (DCT), lighting and
refrigeration
Laser, energy & electro
Apparatus and machinery
Mass spectrometers
Electron microscopes
Leak detectors and
residual gas analyzers
R&D equipment manufacturers
Universities & national labs
Space & defense
Architectural glass
Optical and decorative coatings
Solar energy: thin-film and
crystalline technology
Displays
Semiconductor
High + Fore-vacuum
Systems +
Engineering
Services
High + Fore-vacuum
Systems +
Engineering
Services
High + Fore-vacuum
Systems +
Engineering
Services
Pro
du
cts
Oerlikon Investor Presentation_January 2015Page 28

It's not allowed to change the master It's not allowed to change the master
source/footnote 8,6
4,7
8,0
9,1
6,6
8,3
0,9
0,5
in CHF million Q3 2014 Q3 2013 Δ
Order intake 97 102 -4.9 %
Sales (to 3rd parties) 99 98 +1.0 %
EBITDA 11 13 -15.4 %
EBITDA margin1 11.2 % 12.6 % -1.4 pp
EBIT 8 9 -11.1 %
EBIT margin1 7.6 % 9.0 % -1.4 pp
Vacuum Segment –
Q3 2014 performance
RoW
2%Asia /
Pacific 36%
North America
21%
Europe41%
Others
16%
Energy/Coating
R&D/
Analytics 20%
18%
Process
industry46%
1 as % of sales
Sales on previous years’ level
Order intake slightly improved sequentially
Profitability stabilized around prior
quarters’ level with potential from
investments in internal alignment
and organizational effectiveness
Overall challenging market environment
resulting in slightly lower order intake
Positive trends in process industry in
Europe (large-scale projects) and Asia
Large-scale order in steel degassing
R&D/analytics market sequentially up
Operational
performance
Market
development
Key figures
Sales
Q3 2014
Sales
Q3 2014
Oerlikon Investor Presentation_January 2015Page 29
It's not allowed to change the master It's not allowed to change the master
source/footnote 8,6
4,7
8,0
9,1
6,6
8,3
0,9
0,5
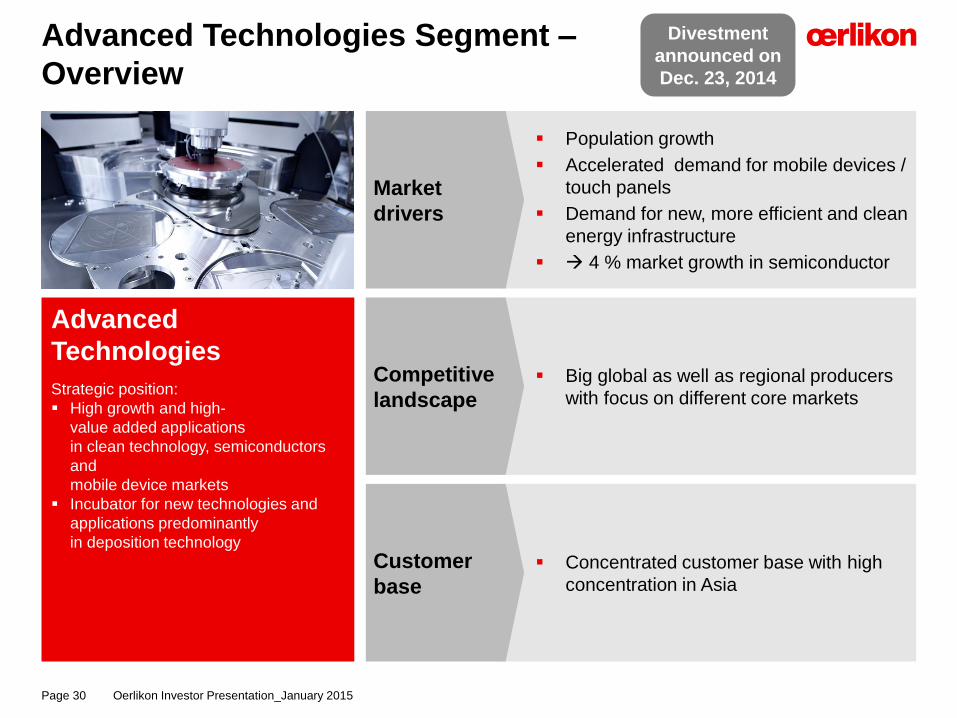
Advanced Technologies Segment –
Overview
Advanced
Technologies
Strategic position:
High growth and high-
value added applications
in clean technology, semiconductors
and
mobile device markets
Incubator for new technologies and
applications predominantly
in deposition technology
Population growth
Accelerated demand for mobile devices /
touch panels
Demand for new, more efficient and clean
energy infrastructure
4 % market growth in semiconductor
Concentrated customer base with high
concentration in Asia
Big global as well as regional producers
with focus on different core markets
Market
drivers
Customer
base
Competitive
landscape
Oerlikon Investor Presentation_January 2015Page 30
Divestment
announced on
Dec. 23, 2014
It's not allowed to change the master It's not allowed to change the master
source/footnote 8,6
4,7
8,0
9,1
6,6
8,3
0,9
0,5
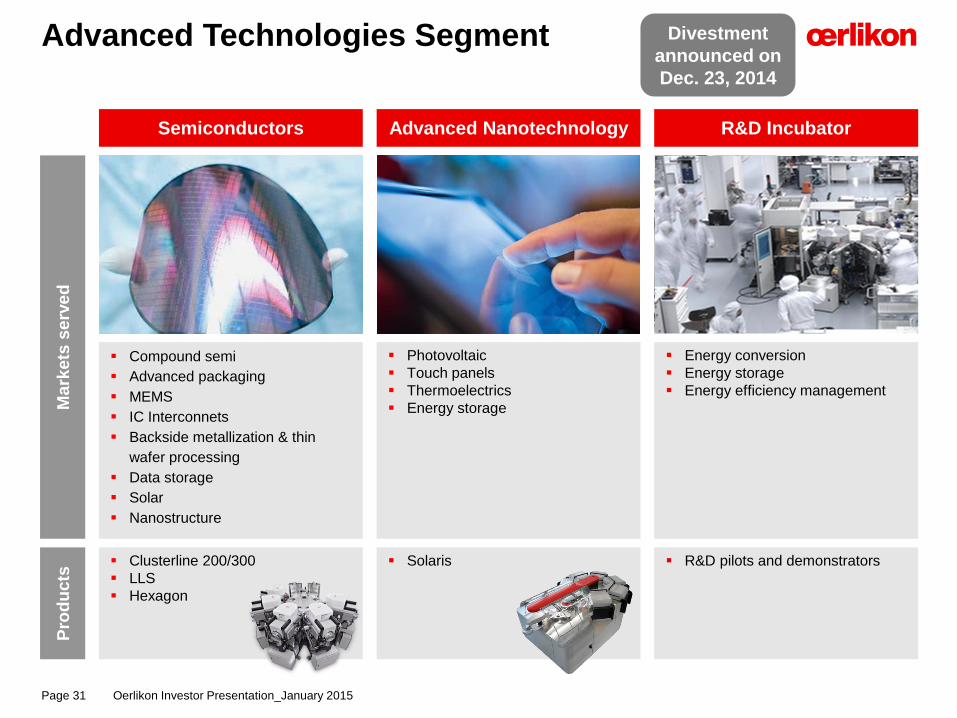
Advanced Technologies Segment
Semiconductors R&D IncubatorAdvanced Nanotechnology
Mark
ets
serv
ed
Compound semi
Advanced packaging
MEMS
IC Interconnets
Backside metallization & thin
wafer processing
Data storage
Solar
Nanostructure
Energy conversion
Energy storage
Energy efficiency management
Photovoltaic
Touch panels
Thermoelectrics
Energy storage
Clusterline 200/300
LLS
Hexagon
R&D pilots and demonstrators Solaris
Pro
du
cts
Oerlikon Investor Presentation_January 2015Page 31
Divestment
announced on
Dec. 23, 2014

It's not allowed to change the master It's not allowed to change the master
source/footnote 8,6
4,7
8,0
9,1
6,6
8,3
0,9
0,5
in CHF million Q3 2014 Q3 2013 Δ
Order intake 20 29 -31.0 %
Sales (to 3rd parties) 26 22 +18.2 %
EBITDA 1 0 n/a
EBITDA margin1 5.0 % 2.1 % +2.9 pp
EBIT 0 -1 n/a
EBIT margin1 1.6 % n/a n/a
Advanced Technologies Segment –
Q3 2014 performance
15%
Europe50%
Asia / Pacific
35%
North America
16%
Others Advanced Nano
Semiconductor
84%
0%
1 as % of sales
Order intake lower due to order push-outs
Sales increase driven by semiconductor
Profitability at break-even - affected by
continued high R&D investments
Connectivity and Internet of Things are
main drivers in semiconductor industry
Slower-than-expected recovery in
advanced packaging - growth expected
into 2015
Postponement of advanced nano-
technology equipment investments to 2015
Operational
performance
Market
development
Key figures
Sales
Q3 2014
Sales
Q3 2014
Oerlikon Investor Presentation_January 2015Page 32
Divestment
announced on
Dec. 23, 2014

It's not allowed to change the master It's not allowed to change the master
source/footnote 8,6
4,7
8,0
9,1
6,6
8,3
0,9
0,5
Agenda
1 Introduction
2 Q3 2014 Business Update
3 Outlook 2014
4 Appendix
Oerlikon Investor Presentation_January 2015Page 33

It's not allowed to change the master It's not allowed to change the master
source/footnote 8,6
4,7
8,0
9,1
6,6
8,3
0,9
0,5
2014 Outlook confirmed –
Upside on profitability
Sales
EBIT
EBITDA
>15%
2014E2013 reported
2,883
2014 Group Guidance
Consolidating Metco for seven
months and with full absorption of
Metco impacts, Oerlikon expects,
compared to 2013 reported figures
based on stable exchange rates:
Order intake growth
to exceed 10 %
Sales growth to exceed 15 %
EBITDA1 margin to exceed 15 %
EBIT1 margin to exceed 10 %
1 including full absorption of all related transaction/integration costs and acquisition accounting effects
492
2014E2013 reported
Impacted by Metco
transaction (one-offs)
Gross margin effect
from inventory
step-up
Transaction costs
Integration costs
2014E2013 reported
366
Impacted by Metco
transaction
One-offs (same as
for EBITDA)
Amortization of
acquired identifiable
intangible assets
Consolidation of Metco
for 7 months
>15% margin
prev.: around 15%
>10% margin
prev.: around 10%
Oerlikon Investor Presentation_January 2015Page 34

It's not allowed to change the master It's not allowed to change the master
source/footnote 8,6
4,7
8,0
9,1
6,6
8,3
0,9
0,5
Agenda
1 Introduction
2 Q3 2014 Business Update
3 Outlook 2014
4 Appendix
Oerlikon Investor Presentation_January 2015Page 35
It's not allowed to change the master It's not allowed to change the master
source/footnote 8,6
4,7
8,0
9,1
6,6
8,3
0,9
0,5
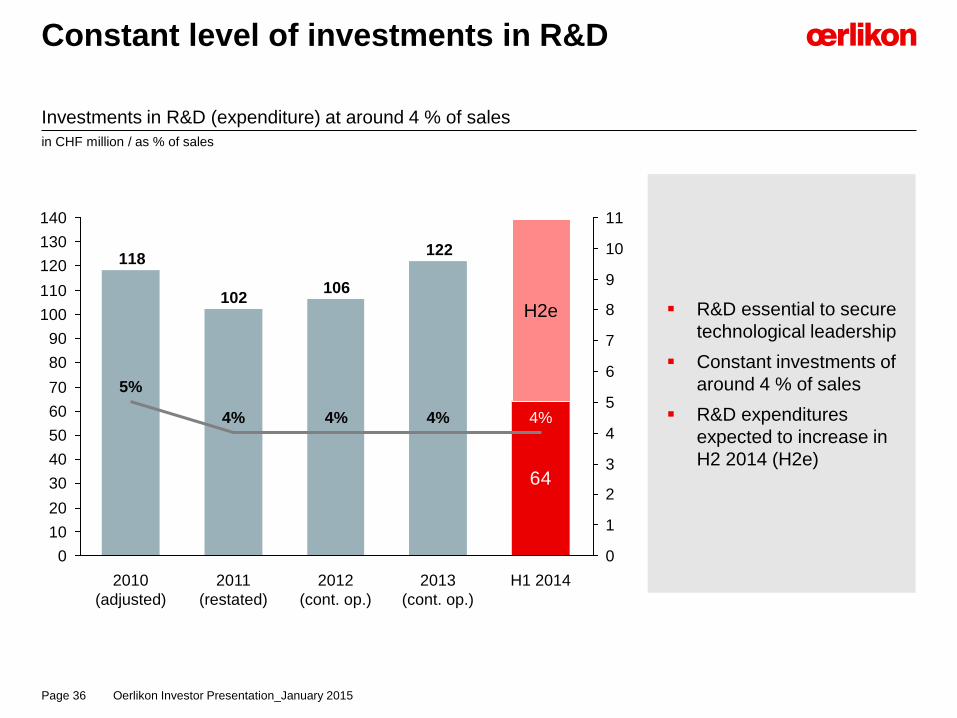
Constant level of investments in R&D
64
122
106102
118
0
10
20
30
40
50
60
70
80
90
100
110
120
130
140
0
1
2
3
4
5
6
7
8
9
10
11
4%
2010
(adjusted)
5%
H1 2014
H2e
4%
2013
(cont. op.)
4%
2012
(cont. op.)
4%
2011
(restated)
Investments in R&D (expenditure) at around 4 % of sales
in CHF million / as % of sales
R&D essential to secure
technological leadership
Constant investments of
around 4 % of sales
R&D expenditures
expected to increase in
H2 2014 (H2e)
Oerlikon Investor Presentation_January 2015Page 36

It's not allowed to change the master It's not allowed to change the master
source/footnote 8,6
4,7
8,0
9,1
6,6
8,3
0,9
0,5
Strong balance sheet
Cash and cash equivalents
Trade receivables
Inventories
Property, plant and equipment
Total other assets
Total assets
Current and non-current loans and borrowings
Total liabilities
Total equity
Total equity ratio
Net cash
Total other liabilities
Goodwill and intangible assets
Non-current post-employment benefit provisions
Trade payables
Current customer advances
803
536
595
882
1 745
395
4 956
804
569
735
2 814
2 142
43 %
2
370
336
H1 2014 FY 2013in CHF million
1 280
425
404
742
943
300
4 094
303
546
440
2 010
2 084
51 %
981
314
407
Oerlikon Investor Presentation_January 2015Page 37

It's not allowed to change the master It's not allowed to change the master
source/footnote 8,6
4,7
8,0
9,1
6,6
8,3
0,9
0,5
Net working capital expected to decrease
in H2 2014
425
108125
289302
4%
FY 2011
(reported)
7%
FY 2010
(reported)
8%4%
H1 2014FY 2013
(cont. op.)
FY 2012
(cont. op.)
12%
Net working capital1 FY 2009 – H1 2014
in % of 12 months rolling sales (incl. Metco pro forma sales); in CHF million
Higher asset base
(Metco acquisition) and
less customer advances
led to increase in net
working capital
Customer advances at
CHF 336 million
(decrease mainly related
to Manmade Fibers)
Lower net working capital
expected for H2 2014
due to active net working
capital management
1 Net working capital is defined as trade receivables + inventories – trade payables – current customer advances
Oerlikon Investor Presentation_January 2015Page 38

It's not allowed to change the master It's not allowed to change the master
source/footnote 8,6
4,7
8,0
9,1
6,6
8,3
0,9
0,5
Mid-term target corridor
55
65
-15%
H1 2014H1 2013
(cont. op.)
71
65
+9%
H1 2014H1 2013
(cont. op.)
CapEx allocation in 2014 to emphasize in H2
as planned – stabilize around targeted ratio
in CHF million
CapExin CHF million
Depreciation & amortization
CapEx / depreciation &
amortization ratio1
1.43
0.75
0.0
0.2
0.4
0.6
0.8
1.0
1.2
1.4
1.6
H1 20142013
(cont.
op.)
1.43
FY 2012
(cont.
op.)
FY 2011
(adj.)
1.20
FY 2010
(adj.)
0.77
1 Excluding impairment
Oerlikon Investor Presentation_January 2015Page 39

It's not allowed to change the master It's not allowed to change the master
source/footnote 8,6
4,7
8,0
9,1
6,6
8,3
0,9
0,5
Consolidated cash flow statement
803
222
-477
Cash and cash
equivalents at
the end of the
period
Translation
adjustments on
cash and cash
equivalents
-2
Financing
activities
411
Investing
activities
-971
Changes in net
current assets
-137
Operating activities
before changes in
net current assets
Cash and cash
equivalents at
the beginning
of the period
1.280
Dividends paid -91
Interest paid -12
Proceeds from
capital increase 30
Proceeds from issue
of financial debt 489
Other -5
Total 411
Receivables -18
Inventories -39
Payables/liabilities 3
Customer advances -78
Hedge accounting -5
Total -137
Consolidated cash flow statement H1 2014
in CHF million
CAPEX PP&E -46
CAPEX intangibles -9
Acquisition of subsidiaries, net of cash acq. -914
Interest and Other (net) -2
Total -971
Oerlikon Investor Presentation_January 2015Page 40

It's not allowed to change the master It's not allowed to change the master
source/footnote 8,6
4,7
8,0
9,1
6,6
8,3
0,9
0,5
R&D and Capex on Segment level
CapEx / Depreciation & Amortization H1 2014
CapEx H1 2014
Depreciation & Amortization H1 2014
R&D expenses H1 2014
Oerlikon Investor Presentation_January 2015Page 41
Adv. Technologies
15%
Surface
Solutions
31%
Vacuum
20%
Drive Systems12%
Manmade Fibers
22%
Adv. Technologies
Surface
Solutions 42%
Vacuum
10%
Drive Systems32%
Manmade Fibers
13%
CHF
65m
CHF
71m
Adv. Technologies
2%
Surface Solutions 40%
Vacuum
14%
Drive Systems33%
Manmade Fibers
11%
CHF
55m
Surface
Solutions
0,76
Vacuum
1,14
Drive
Systems
0,82
Manmade
Fibers
0,67
Adv.
Techn.
0,50
Oerlikon Group3%

It's not allowed to change the master It's not allowed to change the master
source/footnote 8,6
4,7
8,0
9,1
6,6
8,3
0,9
0,5
Asset allocation and employees
on Segment level
Employees (FTE) by Region H1 2014
Employees (FTE) by Segment H1 2014
Operating Assets H1 2014
Net operating assets H1 2014
Oerlikon Investor Presentation_January 2015Page 42
Adv. Technologies
4%
Surface
Solutions
52%
Vacuum
7%
Drive Systems34%
Manmade Fibers
3%
Adv. Technologies
3%
Surface
Solutions43%
Vacuum
7%
Drive Systems30%
Manmade Fibers
17%
CHF
2 772m
CHF
3 943m
Corporate
1%
Adv. Technologies
1%
Surface Solutions 38%
Vacuum
10%Drive Systems
34%
Manmade Fibers
16%
15 790
2%
RoW
Asia / Pacific33%
North America
14%
Europe51%15 790

It's not allowed to change the master It's not allowed to change the master
source/footnote 8,6
4,7
8,0
9,1
6,6
8,3
0,9
0,5
as of December 31, 2014, indexed; 100 percent = closing price per December 30, 2013
Oerlikon share price development
as of December 31, 2014
Oerlikon shareholder structure1
Oerlikon shares
57.4%
Free float
(incl. 0.4 %
treasury shares)
42.6%
Renova Group
70,0
80,0
90,0
100,0
110,0
120,0
130,0SMI Stoxx Europe 600 Oerlikon SMIM
1 Based on 339 758 576 shares outstanding and latest notification by Renova (as of January 6, 2015 of 144 764 860 shares)
Listed on Swiss Exchange (SIX) since 1973
Securities symbol: OERL
Securities number 81 682
ISIN: CH0000816824
No. of shares outstanding: 339 758 576 shares
(as of December 31, 2014)
Re-entry to Swiss SMIM on April 17, 2012
Addition to STOXX Europe 600 as of June 18, 2012
Oerlikon shares
Oerlikon Investor Presentation_January 2015Page 43

It's not allowed to change the master It's not allowed to change the master
source/footnote 8,6
4,7
8,0
9,1
6,6
8,3
0,9
0,5
Coverage –
7 Buy/Accumulate & 4 Hold/Neutral
Broker Analyst Recommendation Date of last
update
Target
price
AlphaValue Pierre-Yves Gauthier Buy 01.01.2015 15.00
Bank am Bellevue Alessandro Foletti Hold 31.10.2014 13.00
Berenberg Bank Sebastian Künne - suspended -
Credit Suisse Patrick Laager Outperform 24.11.2014 16.00
Baader Helvea Reto Amstalden Neutral 07.01.2015 14.00
Kepler Cheuvreux Will Mackie - Suspended -
MainFirst Michael Inauen Outperform 17.11.2014 16.50
Mirabaud Securities LLP Thomas Baumann Buy 05.01.2015 16.50
RBC Capital Markets Wasi Rizvi Outperform 23.12.2014 15.00
Société Générale Christophe Quarante Hold 07.01.2015 13.00
UBS André Rudolf von Rohr Buy 23.12.2014 16.00
Vontobel Michael Foeth Buy 23.12. 2014 17.00
Zürcher Kantonalbank Armin Rechberger Marketweight 23.12.2014 -
Consensus 7 positive
4 neutral15.20
Oerlikon Investor Presentation_January 2015Page 44

It's not allowed to change the master It's not allowed to change the master
source/footnote 8,6
4,7
8,0
9,1
6,6
8,3
0,9
0,5
Preferred technology supplier to technology leaders in their respective industries
Global customer base and world-leading brand names
Strong long-term customer relationships
Oerlikon Customer Base
(Selection)
Oerlikon Investor Presentation_January 2015Page 45

It's not allowed to change the master It's not allowed to change the master
source/footnote 8,6
4,7
8,0
9,1
6,6
8,3
0,9
0,5
Financial Calendar 2015
Oerlikon Investor Presentation_January 2015Page 46
February 24, 2015 Q4 / FY 2014 results and publication of Annual Report 2014
- Annual Press Conference
April 8, 2015 Annual General Meeting of Shareholders
- KKL Lucerne
April 28, 2015 Q1 2015 Results
- Media & Analyst Conference Call
August 4, 2015 Q2 / HY 2015 results and publication of Interim Report 2015
- Media & Analyst Conference Call
October 27, 2015 Q3 / 9M 2015 results
- Media & Analyst Conference Call

It's not allowed to change the master It's not allowed to change the master
source/footnote 8,6
4,7
8,0
9,1
6,6
8,3
0,9
0,5
Investor Relations Contact
Oerlikon Investor Presentation_January 2015Page 47
OC Oerlikon Management AG, Pfäffikon
Churerstrasse 120
CH – 8808 Pfäffikon SZ
Switzerland
Andreas Schwarzwälder
Head of Investor Relations
Phone: +41-58-360-9622
Mobile: +41-79-810-8211
E-mail: [email protected]

It's not allowed to change the master It's not allowed to change the master
source/footnote 8,6
4,7
8,0
9,1
6,6
8,3
0,9
0,5
Oerlikon has made great efforts to include accurate and up-to-date information in thisdocument. However, we make no representation or warranties, expressed or implied, as tothe accuracy or completeness of the information provided in this document or any oralcommunication in connection therewith and we disclaim any liability whatsoever for the useof it.
This presentation is based on information currently available to management. The forward-looking statements contained herein could be substantially impacted by risks and influencesthat are not foreseeable at present, so that actual results may vary materially from thoseanticipated, expected or projected. Oerlikon is under no obligation to (and expresslydisclaims any obligation to) update or alter its forward-looking statements, whether as aresult of new information, future events or otherwise or to correct any inaccuracies therein.
All information provided in this document is not intended as, and may not be construed as,an offer or solicitation for the purchase or disposal, trading or any transaction in any Oerlikonsecurities. Investors must not rely on this information for investment decisions.
Disclaimer
Oerlikon Investor Presentation_January 2015Page 48