Embed Size (px)
Citation preview

DRAFT DOCUMENTDecember 3, 2007
OECD GUIDELINE FOR TESTING OF CHEMICALS
PROPOSAL FOR A NEW GUIDELINE
Phototransformation of Chemicals in Water – Direct Photolysis
INTRODUCTION
1. This guideline provides guidance for conducting phototransformation in water studies to de-termine the potential effects of solar irradiation on chemical pollutants in surface water.Such studies determine phototransformation kinetics, products, and product pathways re-sulting from either direct (or indirect) aqueous photolysis. It is based on current and /orproposed methods (references (1) - (11)) and on relevant literature on environmental aqueousphotochemistry. This guideline deals with direct photolysis.
2. A glossary of definitions (11) and symbols/units are provided in Annexes 1 and 2, respectively.
ENVIRONMENTAL SIGNIFICANCE AND USE
3. Chemical pollutants and/or their transformation products that are potentially susceptibleto direct photolysis include those that are transported to surface water by direct point dis-charge and/or by runoff from urban and/or rural areas. Chemical pollutants in surface wateralso often originate from transformation of other chemicals via hydrolysis, photolysis, andbiotransformation.
4. Direct photolysis in natural water involves the transformation of a chemical resulting fromthe direct absorption of a solar photon (references (12) - (18)). Direct photolysis has to bedistinguished from indirect photolysis, a second important abiotic degradation pathway in theenvironment. Indirect photolysis in natural water sometimes involves the transformation ofa chemical due to energy transfer from naturally occurring photosensitizers in electronicallyexcited triplet states (12) (13) (19) (20). However, indirect photolysis more often involvesthe transformation of a chemical due to reactions with transient oxidants such as hydroxylradicals, molecular oxygen in a singlet electronic state (”singlet oxygen”), and peroxy radicals(references (12) and (21) - (31)). Both triplet state photosensitizers and transient oxidants re-sult from the absorption of solar photons by chromophoric dissolved organic matter (CDOM)and nitrate ion (12) (31) (32) (33) (34).
1

5. Direct photolysis can be an important dissipation pathway for some chemical pollutants thatexhibit significant light absorption above the 290 nm cutoff of solar irradiation at the earth’ssurface. Indirect photolysis can also be an important dissipation pathway for some chemicalpollutants that come in contact with photosensitizers in electronically excited triplet statesor with short-lived photochemically generated oxidants such as hydroxyl radicals and singletoxygen. In some cases both direct and indirect photolysis can contribute significantly to thedissipation of a chemical in natural waters.
6. The direct and indirect phototransformation of chemicals in natural water bodies is a complexprocess which depends on a number of factors such as:
(a) the chemical structure and electronic absorption spectrum of the chemical;
(b) the concentration, composition, and absorption spectra of CDOM (from which photo-sensitizers and singlet oxygen arise);
(c) the concentration of nitrate (the primary source of hydroxyl radicals); and
(d) the solar photon irradiance to which the chemical, CDOM and nitrate are exposed.
7. The solar photon irradiance to which a chemical, CDOM, and nitrate are exposed depend onnumerous factors including the latitude, season, and the physical and chemical properties ofthe water body (12) (18) (35) (36). Important properties of the water body which contributeto the attenuation of solar irradiation with depth include the concentration and compositionof CDOM and suspended particulates. The mixing and stratification properties of the waterwill help determine the horizontal and vertical distribution of the chemical, CDOM, andnitrate.
8. The results of phototransformation in water studies are used in conjunction with physicalchemical properties and data from other studies (abiotic hydrolysis; biotransformation; ad-sorption/desorption) to help assess the overall environmental transformation and transportof chemical pollutants. The results of phototransformation in water studies are also used tohelp develop inputs for environmental fate computer models, and to help develop protocolsfor conducting other aquatic laboratory and/or aquatic field studies.
PRINCIPLE OF THE STUDYScope and approach
9. This part of the test guideline is designed to provide some or all of the following data and/orinformation depending upon specific needs:
• Direct photolysis rate constants for test chemicals determined in the laboratory usingfiltered xenon arc lamp or sunlight irradiation and extrapolated to natural water (axenon arc lamp filtered to remove irradiation < 290 nm will be referred to throughoutthe rest of the document as a filtered xenon arc lamp).
2

• The transformation pathway and the identities, concentrations, and rates of formationand decline of phototransformation products resulting from direct photolysis.
• As an optional part the quantum yield and resulting estimated direct photolysis rateconstants for test chemicals for various types of water bodies (defined by depth and lightattenuation), seasons, and latitudes of interest.
10. This guideline is designed as a tiered approach. Each tier is triggered by the results of theprevious tier. The tiered approach for direct photolysis tests is shown in Annex 3.
Pseudo first-order kinetics of direct photolysis
11. The rate of decline of a test chemical in a direct photolysis study is generally assumed tofollow pseudo first-order kinetics (e.g., time series data are fit to a pseudo first-order kineticsmodel):
dc
dt= −k · c (1)
The integrated form of equation 1 is:
c = c0 · exp(−k · t) (2)
The ln transformed version of equation 2 is:
ln(c) = ln(c0) − k · t (3)
The pseudo first-order rate constant is determined by using non-linear regression to fit datato equation 2 or using linear regression to fit data to equation 3.
The half-life can be determined by substituting the pseudo first-order rate constant into thefollowing equation:
t1/2 =ln2k
(4)
where
c = test chemical concentration at time t (mol L−1)c0 = initial test chemical concentration at time t = 0 (mol L−1)k = pseudo first-order rate constant (s−1)t = time (s)t1/2 = half-life (s)
3

Note:Usually SI-units should be used. However, in the equations provided in this guideline, unitsfor half-lives, pseudo first-order rate constants and photon irradiances on a number basis are(for illustrative purposes) given in days, day−1, and cm−2 day−1, respectively. However, otherunits of time such as hours or seconds may be used as long as there is consistency within thesame equation. Units of concentration are given in mol L−1. For clarity the direct photolysisrate constant will be termed kd throughout the rest of the document. For a summary ofcommon units used in this guideline but deviating from the SI-system see Annex 2.
Direct photolysis
12. To undergo transformation via direct photolysis, a chemical molecule must first absorb a pho-ton. The absorption of a photon by a molecule results in a transition from an electronic groundstate to an electronically excited state of the molecule. To be absorbed by the molecule, theenergy of the photon (which is inversely proportional to its wavelength) must correspond tothe difference between the ground and a possible excited electronic state of the molecule (12).Within the UV-Visible wavelength of interest (290-800 nm), photon energies range from 150kJ mol−1 at 800 nm to slightly greater than 400 kJ mol−1 at 290 nm (11) (37).
13. The absorption of a photon is a necessary, but often not a sufficient condition, for a moleculeto undergo transformation via direct photolysis (12) (14) (37). The absorbed energy mustfirst be sufficient to cause the transformation via bond cleavage, rearrangement, oxidation,or reduction. Then, phototransformation to form new molecular structures must competewith other possible deactivation processes such as quenching, other radiationless processes,and radiative processes. Consequently, the fraction of photon excited molecules that actuallyundergo phototransformation (i.e. the quantum yield) is generally much less than 1 (usually< 0.1 and sometimes < 0.01) (14) (22). The mechanistic aspects of phototransformationreactions at a molecular level are beyond the scope of this guideline (see reference (38) forfurther information).
14. It can be shown that for an optically dilute solution (absorbance Aλ < 0.02 for λ ≥ 290nm)of a chemical in pure water exposed to polychromatic irradiation above the cutoff of solarirradiation at the earth’s surface of 290 nm, the direct photolysis rate constant (assumingthe quantum yield is independent of wavelength) is given by (12) (14) - (18) (see Annex 4,Derivations of Selected Equations, on page 46):
kd =2.3j
l
DsysΦ
800∑290
ελ · I0λ (5)
where:
4

kd = direct photolysis rate constant (day−1)Φ = quantum yield (independent of wavelength)ελ = molar absorption coefficient (M−1 cm−1) at wavelength λ
I0λ = spectral photon irradiance, on number basis (cm−2 day−1 nm−1)over a 1 nm interval centered at wavelength λ
l = light pathlength (cm)Dsys = depth of irradiated system (cm) = volume of irradiated system/incident
areaj = conversion factor to make units consistent with the L mol−1 cm−1 unit
of the molar absorption coefficient and the mol L−1 unitof concentration (j = 6.02 · 1020 L cm−3 mol−1)
Note:The term (l/Dsys) in equation 5 approximately cancels out for rectangular photolysis cellsexposed to irradiation from a filtered xenon arc lamp and for which Dsys = Dcell. However,that would not be true for cylindrical photolysis cells or for any photolysis cells exposedto solar irradiation where the pathlength l has a more complicated dependency on Dcell.Methods for determining the pathlength of cylindrical cells exposed to filtered xenon-arclamps are discussed in references (12) and (17). Pathlength determinations as a functionof the depth of a system, Dsys exposed to solar irradiation are discussed in references (12)and (18). In addition, note that if the quantum yield is not independent of wavelength, itmust remain inside of the summation in equation 5.
15. Equation 5 is applicable to solar as well as filtered xenon arc lamp irradiation. However, thefollowing equation is often used to determine the direct photolysis rate constant for opticallydilute solutions of test chemicals in pure water in photolysis cells or in near surface, clearnatural water exposed to solar irradiation (2) (12) (see Annex 4, Derivations of SelectedEquations, on page 47):
kd(solar) = Φ800∑290
ελ · Lλ (6)
where:
kd(solar) = direct photolysis rate constant (day−1)Φ = quantum yield (independent of wavelength)ελ = molar absorption coefficient (M−1 cm−1) at wavelength λ
Lλ = average daily solar spectral photon irradiance, on amount basis(mmol cm−2 day−1 ∆nm−1) over wavelength interval ∆λ
centered at wavelength λ
5

16. Equations 1, 5 and 6 show that direct photolysis kinetics are theoretically pseudo-first orderonly if the photon irradiance remains constant over time. Photon irradiances from filteredxenon arc lamps at any given wavelength remain, in general, relatively constant over time.This is one of the primary advantages in using filtered xenon arc lamps. However, solar photonirradiances at any given wavelength vary cyclically over 24-hour periods. Nevertheless, thedata obtained from studies conducted in natural sunlight (in which the rate constant reflectsan average over the entire study duration) generally do fit a single, pseudo-first order rateconstant model reasonably well. The reason is that changes in the average pseudo first-order rate constant over time as the study progresses is generally relatively small and notsystematic. This is particularly valid for studies conducted for one to several weeks or for 2-4hours mid-day. It may not be as valid for studies lasting 4 hours to several days or for thoseconducted beyond 30 days.
Summary of the proposed tiered approach for direct photolysis
Tier 1: Theoretical screen
17. Estimate a maximum possible direct photolysis rate constant for the test chemical in thenear surface of a clear natural water as follows. Measure the test chemical molar absorp-tion coefficients from 290 nm to 800 nm, and use tabular solar irradiance for summer and(preferably) 40o or 50o latitude over the same wavelength interval. Estimate a maximumpossible direct photolysis rate by assuming the quantum yield in equation 6 is equal to oneand by substituting the molar absorption coefficients and tabular solar irradiance values, Lλ,into equation 6 (2) (12). Determine if the estimated maximum possible direct photolysis rateconstant would theoretically result in estimated direct photolysis losses greater than 50% ofan initial concentration over 30 days. If maximum possible losses are < 50%, no furtherdirect photolysis work is performed. If the maximum possible losses > 50%, proceed to Tier2 (experimental study).
Tier 2 - Experimental study
Determination of the direct photolysis rate constant
18. Determine the rate of decline in the concentration of the test chemical and correspondingdirect photolysis rate constant in buffered pure water exposed to a filtered xenon arc lamp(recommended) or sunlight. Determine if the direct photolysis rate constant would result indirect photolysis losses equal to or greater than 20% of an initial concentration over a periodequivalent to 30 days in the near surface of a clear natural water body exposed to summersunlight. If estimated losses are < 20%, no further direct photolysis work is performed. Ifestimated losses ≥ 20%, identify major transformation products. An optional task is theadditional determination of the quantum yield.
6

Identification of major transformation products
19. Determine the rate of formation and decline of phototransformation products of the testchemical in buffered pure water exposed to a filtered xenon arc lamp (recommended) orsunlight. Isolate and identify the major transformation products. In this guideline, majortransformation products are defined as those accounting for ≥ 10% of the applied test chemicalin an individual sample at any sampling time.
Determination of the quantum yield and its use to estimate direct photolysis rateconstants (optional)
20. Determine the quantum yield for direct photolysis of the test chemical in buffered pure waterusing monochromatic irradiation (12), polychromatic artificial irradiation (8) or sunlight (2).The pseudo first-order rate constant for direct phototransformation and thus the life-timeof a test chemical in water can be calculated from the quantum yield (18) (39). Hence,once the quantum yield has been determined, use it as input to computer programs such asGCSOLAR (18) or ABIWAS (35) (36) to help to estimate direct photolysis rates for the testchemical applicable to any types of surface waters (defined by depth and light attenuation),seasons, and latitudes of interest (2).
APPLICABILITY OF THE TEST GUIDELINE
21. This test guideline is applicable to chemical substances for which analytical methods withsufficient accuracy and precision are available and validated (if required). If data are neededon transformation products, adequate quantitative analytical methods must also be avail-able/developed for them.
22. If a non-ionic test chemical is somewhat susceptible to hydrolysis, the test may still be appli-cable as long as a dark control is used to account for the hydrolysis rate (2) (4) (5). However,photolysis tests should be conducted at a pH at which the hydrolysis rate of the chemical isminimized (5) (40). The rate constant determined from the dark controls should be identicalto the hydrolysis rate constant and can be subtracted from the overall rate constant deter-mined from the irradiated solutions to give the direct photolysis rate constant. However, insome cases, the test chemical may undergo rapid hydrolysis (i.e., hydrolysis half-life of < 1day) within the environmentally relevant pH range of 4-9 at 20-25 oC (41). In such cases, thephotolysis study should instead be conducted on the major hydrolysis product(s) (≥ 10% ofapplied as the test chemical).
23. The test is not applicable to highly volatile compounds such as fumigants and some organicsolvents. However, in some cases, where the Henry’s Law constant of the test chemicaland/or anticipated transformation products may indicate the potential for fairly substantialvolatilization rates from water, the study may still be applicable provided that precautions are
7

taken. Such precautions include using minimal head-space, adequate sealing in the photolysiscells to minimize volatile losses during the study (2) (4) or trapping. Trapping volatilesbecomes more difficult, but preferred, when employing sacrificial sampling on numerous smallphotolysis cells than when employing aliquot sampling on a smaller number of much largertest vessels. However, with the proper equipment and experimental set-up, it can be done asshown by Ruzo (42).
24. Unlabelled or labelled test chemicals can be used to measure the rate of phototransforma-tion. Labelled material is required for studying the pathway of phototransformation and forestablishing a mass balance. 14C-labelling is recommended but other isotopes, such as 13C,15N, 32P, may also be useful. As far as possible, the label should be positioned in the moststable part(s) of the molecule1. The chemical and radiochemical purity of the test chemicalshould be at least 95 %.
25. Before carrying out any of the phototransformation tests, the following information on thetest chemical should be available:
(a) Solubility in water [OECD Guideline 105].
(b) Solubility in organic solvents
(c) Vapor pressure [OECD Guideline 104]
(d) Henry’s Law Constant2
(e) Abiotic hydrolysis as a function of pH [OECD Guideline 111]
(f) n-octanol/water partition coefficient [OECD Guidelines 107 and 117]
(g) pKa(s) of ionisable substances [OECD Guideline 112]
Note:The temperatures at which the physical chemical properties listed above were determinedshould generally be reported.
26. The n-octanol/water partition coefficient and aqueous solubility supply some information onthe potential of the test chemical to significantly adsorb to glassware and reaction vessels.However, any additional information on the glassware adsorption potential of the test chemicalshould be known to ensure that such characteristics are taken into account in preparingglassware and reaction vessels for the study.
1For example, if the test chemical contains one ring, labelling on this ring is required; if the test chemical containstwo or more rings, separate studies may be needed to evaluate the fate of each ring and to obtain suitable informationon formation of phototransformation products.
2Henry’s Law constant estimated from solubility in water and vapour pressure or measured. Henry’s Law constantsfor some chemicals may also be found in: http://webbook.nist.gov/chemistry
8
27. An appropriate analytical method of known accuracy, precision and sensitivity for the quan-tification and identification of the test chemical and its phototransformation products shouldbe available. The analytical detection limit for the test chemical and its phototransformationproducts should also be known (see paragraph 31).
REFERENCE SUBSTANCES
28. Reference substances should be used for the characterisation and/or identification of photo-transformation products by spectroscopic and chromatographic methods.
QUALITY CRITERIARecovery
29. Extraction and analysis of, at least, duplicate samples immediately after the addition of thetest chemical gives a first indication of the repeatability of the analytical method and of theinitial recoveries for the test chemical. Recoveries for later stages of the experiments are givenby the respective mass balance obtained with labelled material. Recoveries should range from90 to 100 % for labelled chemicals (43) and from 70 to 110 % for non-labelled chemicals (7).
Repeatability and sensitivity of analytical method
30. Repeatability of the analytical method (excluding the initial extraction efficiency) to quantifytest chemical and phototransformation products can be checked by duplicate analysis of thesame extract, incubated long enough for formation of phototransformation products.
31. The limit of detection (LOD) of the analytical method for the test chemical and for thephototransformation products should be at least 0.01 mg kg−1 water (as test chemical) or 1% of the applied dose whichever is lower. The limit of quantification (LOQ) should also bespecified.
Accuracy of transformation data
32. Regression analysis of the concentration of the test chemical as a function of time gives theappropriate information on the reliability of the phototransformation curve and allows thecalculation of the confidence limits for half-lives (in case of pseudo first-order kinetics) orDT50 values and, if appropriate, DT90 values.
9

TEST MATERIALSTest vessels
33. All glassware and reaction vessels/photolysis cells used in the photolysis studies should besterilized by autoclaving (2) (3) (4) (12) or any other suitable non-chemical method (2).Chemical sterilization is not recommended since chemical reagents may leave residues thatcould absorb in the 290 to 800 nm region and/or behave as photosensitizers.
Test chemical application
34. The test chemical should be directly dissolved in the aqueous media at a concentration whichshould not exceed half its solubility. For test chemicals with low aqueous solubility, a co-solvent may be used to prepare the test solution. However, the amount of co-solvent usedmust be as little as possible and preferably not exceed 1% by volume in the test solution (40).Co-solvent percentages up to 10% may be used, but if more than 10% co-solvent is requiredto dissolve the test chemical, the study should not be performed. The selected co-solventmust not solvolyse the test chemical, must not absorb in the 290 to 800 nm region, and mustnot be a photosensitizer. Acetone is an example of a solvent that is a photosynthesizer, andshould not be used. Acetonitrile is a generally recommended co-solvent.
35. The initial concentration of the test chemical for quantum yield determinations and directphotolysis studies should be such that the absorbance at any wavelength above 290 nm (max-imum absorption wavelength included) is less than 0.02. These optically dilute, also referredto as ”optically thin” solutions generally have a concentration of < 10−4 M. Nevertheless,the initial concentration of the test chemical should be at least 10 times greater than thequantification limit of the analytical method.
36. Because oxygen can affect the rates and even pathways of photodegradation reactions, testsolutions should be saturated with air at the beginning of the study (4). A buffer solutionthat has been autoclaved should be given sufficient time to aerate prior to dispensing intothe vessels. It is not recommended to autoclave small amounts of buffer in individual vesselsbecause driving the air out may change the volume.
Test media for direct photolysis studies
37. Guidance for preparing test media for direct photolysis is provided in Annex 5.
38. For direct photolysis studies, the test media should be sterilized aqueous buffer solutionsat the appropriate pH (for sterilisation methods see paragraph 33). The water should be”pure water”. The buffers should be identical or comparable to those used in the hydrolysisstudies (41) and should not absorb between 290 and 800 nm or be photosensitizers. Also, thebuffers should not adversely affect the solubility of the test chemical.
10

39. For non-ionisable test chemicals the tests should be conducted at a pH at which the testchemical is hydrolytically most stable in the pH range 4-9.
40. If the test chemical is appreciably ionic anywhere within a 4 to 9 pH range, the study shouldbe conducted in one or more aqueous buffers at any of the pH 4 , 7, and/or 9. Selectionof the pH (s) at which the study should be conducted depends on the electronic absorptionspectra at each pH. Spectra showing absorption bands between 290 and 800 nm or shorterwavelengths tailing above 290 nm together with estimates of maximum photolysis rates (Tier1) are the criteria for selecting the pH(s). Refer to Tier 1 for further details.
Light sources
41. For direct photolysis studies the recommended light source should be a filtered xenon arclamp capable of simulating natural sunlight in the 290 to 800 nm region or sunlight (44).The spectral photon irradiance of the filtered xenon arc lamp as a function of wavelengthshould be determined at least at the beginning and the end of the study using one or moreactinometers or a spectral radiometer. If sunlight is used, average daily solar spectral photonirradiances (Lλ) as a function of wavelength should be determined for the season and latitudeclosest to those of the experiment using solar irradiance tables and a spectral radiometer.
42. If a filtered xenon arc lamp is used, the photon irradiance incident on the test vessels shouldbe adequate to cause substantial decline of the test chemical over a several day experimentalperiod. The transformation rate constant and corresponding half-life obtained with a filteredxenon arc lamp can be adjusted to solar equivalents from a comparison of solar photon irradi-ance to lamp photon irradiance because of the linear relationship between the transformationrate and photon irradiance (see equation 13 on page 20).
43. If sunlight is used, the study should be conducted during the season when and at the latitudewhere the concentration of the test chemical is expected to be highest in the environment.For pesticides, that would be the season when and the latitude where it is typically applied.
44. If a filtered xenon arc lamp (see Annex 7) and sacrificial sampling of multiple test vesselsare used, an appropriate experimental set-up should be used to ensure that all of the testvessels receive the same incident photon irradiance. Self-contained, commercially availablexenon photolysis units in the projection or ”working plane” configuration produce uniformirradiances (45) (46). A commonly used configuration is the ”merry-go-round” photochemicalreactor (12). Merry-go-round photochemical reactors are commercially available (46) (47)(see Annex 7). Besides the ”merry-go-round” the second often used experimental setup is an”optical bench”, discussed in Annex 7. Another example of an experimental set-up is shownin reference (39) and an experimental set-up that includes trapping of volatiles appears inreferences (42).
11

Other photolytic equipment and reagents
45. Photolytic equipment includes:
• Optical cells of appropriate material (generally quartz) and path length for measuringUV-VIS spectra.
• Appropriate optical filters to cut-off radiation below 290 nm and above 800 nm.
• When monochromatic irradiation is used in the determination of the quantum yield,the appropriate filter systems must be used to isolate the desired wavelength (12)(44). Monochromatic irradiation at the desired wavelength can also be achieved witha monochromator in conjunction with a suitable polychromatic light source such as amercury or xenon arc lamp. An example of a useful optical bench is shown in Annex7. (Filters for isolating the 313 and 366 nm wavelengths from a mercury arc lamp arediscussed in reference (12)).
• Specially designed reaction cuvettes/photolysis cells to contain test solutions (exposedand dark control) and chemical actinometers, when needed. The recommended materialis quartz.
• Appropriate apparatus designed to contain the light source, filters, sample, holders, reac-tion vessels/actinometers such as the photochemical ”merry-go-round” reactor. Severalappropriate designs are shown in Annex 7.
• Photometer or spectral radiometer to measure photon irradiance as a function of wave-length.
46. Photolytic reagents include:
• All of the water used in the direct photolysis tests must be of high purity and free ofany absorbing or photosensitizing chemical species. For example, the U.S.EPA OPPTS835.2210 (2) recommends using reagent water meeting ASTM Type IIA standards, asdescribed in ASTM D1193-99 Standard Specification for Reagent Water (see Annex 5:Test Media). ”Milli-Q” water is one example of high purity water. In this guideline,the water used in the preparation of stock, test and buffer solutions is referred as ”purewater”.
• Appropriate chemical reagents to be used as actinometers.
• Appropriate aqueous buffers such as phosphate for pH 7, acetate for pH 4 and boratefor pH 9 for compatibility with hydrolysis studies. Phosphate buffers are usually recom-mended for direct photolysis studies (2) (12) but only cover pH range 5 to 8. Cautionshould be applied when using phosphate buffers because they might promote catalyticeffects.
12

Analytical equipment and chemical reagents
47. In addition to standard laboratory equipment, the following is required:
• Spectrophotometer to acquire spectral data in the UV-VIS range. For example, singlebeam, diode array instruments that allow sensitive, rapid acquisition of digitized spectralabsorbance data.
• Appropriate analytical instrumentation to measure the concentration of the test chemicalin exposed and dark control samples, such as HPLC, GLC, TLC, etc.
• Suitable instrumentation for identification purposes, such as MS, HPLC/MS, GC/MS,LC/MS, GC-FTIR, NMR, etc.
• When radiolabelled test chemicals are used, liquid scintillation counters (LSC) and in-strumentation for radiochromatography should be available.
• Appropriate extraction apparatus.
• Equipment to sterilise reaction vessels and other glassware used in the preparation ofstock and test solutions.
48. Chemical reagents include:
• Reagent grade chemicals and solvents free of any photosensitizer.
• Scintillation liquid (for radiolabelled chemicals).
TEST METHODOLOGYTest conditions
49. The temperature during photolysis studies may vary by as much as 10 degrees but should bemaintained within the range of 20 to 30 oC. (25 ± 5)oC and monitored periodically
50. The pH of buffered solutions should be maintained within 0.1 pH units. The pH should bechecked during the course of the study, if feasible.
51. Dark control solutions should be used for all quantum yield determinations and for all directphotolysis studies and should be kept at the same temperature as the irradiated samples.
Study duration, sampling, and replication
52. The study duration should be sufficient to determine the DT75 (two half-lives if declineis first-order) of the test chemical and (if applicable) the formation and decline of majortransformation products until they have declined to < 25% of their maximum concentration.However, the maximum study duration should not exceed the equivalent of 30 days of sunlightexposure during an appropriate season and at an appropriate latitude.
13

53. Based upon equating photons absorbed by the test chemical per unit volume, the maximumdirect photolysis study duration (using continuous filtered xenon arc lamp irradiation) that isequivalent to 30 days of sunlight exposure will be only a few days and is given by (see Annex4, Derivations of Selected Equations, on page 48):
max. direct photolysis duration (days) =30 j
2.3Dcell
lxenon
800∑290
ελLλ
800∑290
ελI0λ
(7)
where:
30 = 30 days of solar irradiationj = conversion factor (j = 6.02 · 1020 L cm−3 mol−1, for details see eq. 5)Dcell = depth of irradiated cell (cm) = volume of irradiated cell/incident arealxenon = light pathlength in cell exposed to a filtered xenon arc lampελ = molar absorption coefficient (M−1 cm−1) at wavelength λ
I0λ = spectral photon irradiance, on number basis (cm−2 day−1 nm−1)over a 1 nm interval centered at wavelength λ
Lλ = average daily spectral solar photon irradiance, on amount basis(mmol cm−2 day−1 ∆nm−1) over wavelength interval ∆λ
centered at wavelength λ
Note:For rectangular box cells, the term Dcell/lxenon cancels out because lxenon = Dcell. However,that will not be true for cylindrical cells (12).
54. Although equation 7 allows for flexibility in choosing an experimental photon irradiance froma filtered xenon arc lamp, practical considerations somewhat limit the range of experimentalirradiances that should be used. In general, it is recommended that the experimental photonirradiance from a filtered xenon lamp be adjusted to be somewhat comparable to that ofsunlight (at noon for short several hour studies or 24 hour average for several day to weeksstudies). The reason is the experimental irradiance should not be so intense that photolyticprocesses other than those that would occur under natural sunlight are initiated. Also, if theparent is susceptible to hydrolysis at the experimental pH and the hydrolytic products aresusceptible to direct photolysis, time should be allowed for them to form.
55. A preliminary range-finding study should be performed to help determine the number ofsamples to be collected and the timing of their collection. For linear and non-linear regressions
14

on test chemical data in definitive or upper tier tests, the minimum number of samplescollected should be five and seven, respectively. The greatest number of samples taken shouldgenerally be during the first part of the study where the slope of the concentration versustime series for the test chemical is generally greatest. If an accurate determination of therates of formation and decline of major transformation products is desired, the number ofsamples taken should generally be greater and somewhat more dispersed throughout the studyduration. The number of sampling times can be less in range finding or lower tier tests.
56. Either aliquot or sacrificial sampling can be used. Sacrificial sampling of entire photolysiscells at each sampling time is often preferred over withdrawing aliquots of test solutions ateach sampling time. The reason is that it helps to maintain aseptic conditions and allowsfor mass balance determinations at each sampling time. The use of sacrificial sampling isparticularly necessary in cases where mass balance determinations are needed such as whenthe test chemical and/or its transformation products are volatile and/or adsorb strongly to thephotolysis cells (5). Future sampling descriptions in this document will be for the generallypreferred sacrificial sampling, but aliquot sampling from larger irradiated and dark controlreaction vessels is acceptable as long as the resulting mass balance is adequate and asepticconditions are properly maintained.
57. Replicates (preferably a minimum of two ) of each experimental determination of kineticparameters are recommended to determine variability and reduce uncertainty in the deter-mination of kinetic parameters. However, the uncertainty in the determination of kineticparameters can also be reduced by increasing the number of sampling intervals within eachexperiment, particularly when the rates of formation and decline of major transformationproducts are being determined. In such cases, a minimum of two replicate determinations ofkinetic parameters may be adequate. With generally limited resources, the researcher needsto weigh the pros and cons of experimental replication versus increased numbers of samplingtimes per experiment in designing the study.
Calculations
58. Basic calculations/equations, including the following one used to determine whether going tohigher tiers is triggered, are included within the body of the guideline:
% loss over 30 days solar = 100 · (1 − exp [−ksolar · 30)]) (8)
where:
ksolar = pseudo first-order direct photolysis rate constant fortest chemical exposed to solar irradiation (day−1)
30 = t = 30 days of irradiation
15

59. Calculations/equations for the kinetics of the formation and decline of major photoproductsare optional. The necessary non-linear regressions can be readily performed with the use ofcommercially available spreadsheets and/or statistical software.
Determination of the spectral photon irradiance from a filtered xenon arc lamp
60. The spectral photon irradiance from a filtered xenon arc lamp can be determined with theuse of low and/or high optical density actinometers alone or preferably in conjunction witha spectral radiometer (48). The advantage in using a spectral radiometer to determine thespectral photon irradiance is convenience, as it avoids changing actinometers. However, spec-tral radiometers are expensive and are not always readily available. Furthermore, even if aspectral radiometer is generally used to determine the spectral photon irradiance, it should beperiodically calibrated against photon irradiances determined with actinometers. Calibrationis necessary because of the difference between the exposure surface of a spectral radiometerand that of the photolysis cuvette or tubes used to contain the actinometers (48).
61. By determining the monochromatic first-order direct photolysis rate constant for a low opticaldensity actinometer of known quantum yield in pure water in a photolysis cell irradiated withmonochromatic irradiation, the incident spectral photon irradiance at the wavelength of theirradiation can be determined from the following equation (48) (see Annex 4, Derivations ofSelected Equations, on page 49):
I0λ(xenon) =j
2.3Dcell
lxenon
kdλ(act)
Φactελ(act)(9)
where:
I0λ(xenon) = spectral photon irradiance, on number basis (cm−2 day−1 nm−1)over a 1 nm interval centered at wavelength λ
j = conversion factor (j = 6.02 · 1020 L cm−3 mol−1, for details see eq. 5)kdλ(act) = monochromatic direct photolysis rate constant (day−1, pseudo first-order)
of an actinometer exposed to monochromatic irradiation at wavelength λ
Φact = the quantum yield of the actinometerελ(act) = molar absorption coefficient (M−1 cm−1) of the actinometer at wavelength λ
Dcell = depth of irradiated cell (cm) = volume of irradiated cell/incident arealxenon = light pathlength (cm) in cell exposed to a filtered xenon arc lamp
62. Equation 9 only gives the spectral photon irradiance at one wavelength, but it can be usedat different individual wavelengths wherever another monochromatic direct photolysis rateconstant is determined for one or more low optical density actinometers. The determination of
16

the spectral photon irradiance at several different individual wavelengths spread throughoutthe wavelength range in which an estimate of the spectral photon irradiance is desired shouldbe sufficient to determine the spectral photon irradiance from a filtered xenon arc lamp as acontinuous function of wavelength. Because spectral photon irradiance from a filtered xenonarc lamp is smooth, interpolation from known spectral photon irradiances at several differentwavelengths can be readily done (48).
63. By determining the polychromatic zero-order direct photolysis rate constant for a high opticaldensity actinometer of known quantum yield in pure water in a photolysis cell irradiatedwith a filtered xenon arc lamp, the sum of the incident spectral photon irradiance over theabsorption spectrum of the actinometer above 290 nm can be determined from the followingequation (48) (see Annex 4, Derivations of Selected Equations, on page 50):
λ = final∑λ = initial
I0λ(xenon) =j Dcell
Φactkdλ(act)(zero order) (10)
where:
λ = initial = initial wavelength of actinometer absorption (if ≥ 290 nm)λ = final = final wavelength of the actinometer absorption (if ≤ 800 nm)I0λ(xenon) = spectral photon irradiance, on number basis (cm−2 day−1 nm−1)
over a 1 nm interval centered at wavelength λ
j = conversion factor (j = 6.02 · 1020 L cm−3 mol−1, for details see eq. 5)Dcell = depth of irradiated cell (cm) = volume of irradiated cell/incident areaΦact = the quantum yield of the actinometerkdλ(act)(zero order) = monochromatic direct photolysis rate constant (zero order)
of an actinometer exposed to monochromatic irradiationat wavelength λ (mol L−1 day−1)
64. By using more than one high optical density actinometer with absorption bands at differentwavelengths, the sum of the spectral photon irradiances over any desired range including theentire range between 290 and 800 nm can be determined. Further experimental details ofprocedures for determining the spectral photon irradiance from and for calibrating xenon arclamps are provided in references (35) (48) (49) (50).
Performance of direct photolysis studyTier 1 - Theoretical screen.
65. For a test chemical which does not ionize significantly within a pH range of 4 to 9, a singleUV-Visible absorption spectrum should be measured at a single pH within the 4 to 9 rangewhere the hydrolysis rate, if any, is minimized. If the chemical is stable to abiotic hydrolysis,
17

the spectrum should be measured at pH 7. The pH at which a direct photolysis study on anon-ionic test chemical is conducted should be the same as the pH at which the spectrumis determined. For a test chemical that is appreciably ionized anywhere within a 4 to 9 pHrange, UV- Visible absorption spectra should be measured at pH 4, 7, and 9.
66. Electronic absorption spectra of the test chemical should be obtained in appropriate solventsystems at desired pH with a spectrometer capable of recording UV-VISIBLE spectra between290 and 800 nm. Because the higher energy (shorter wavelength) bands of many chemicalsmay sometimes tail into wavelengths above 290 nm, it is recommended that the spectrum berecorded 30 to 40 nm below 290 nm. The procedure to record, assign absorption band maxima,band-widths and determine decadic molar absorption coefficients has been described elsewhere(OECD Guideline 101). To obtain an adequate absorption spectrum, it may sometimes benecessary to enhance the solubility of the test chemical by using aqueous methanol, ethanol,or acetonitrile. It is recommended that UV-VISIBLE spectra of test chemical be also obtainedin the pure co-solvent.
67. If the test chemical absorbs above the 290 nm cutoff of solar irradiation at the earth’s surfacewith ελ > 2 M−1 cm−1 over at least 15 nm, estimate a maximum possible direct photolysisrate by assuming that the quantum yield is equal to one in equation 6 (2):
kd(max) =λ = 800∑λ = 290
ελLλ (11)
where:
kd(max) = maximum possible direct photolysis rate constant (day−1)ελ = molar absorption coefficient (M−1 cm−1) at wavelength λ
Lλ = average daily solar photon irradiance, on amount basis (mmol cm−2 day−1)over wavelength interval ∆λ centered at wavelength λ.
68. In estimating the maximum possible photolysis rate constant, the average daily solar spectralphoton irradiances Lλ substituted into equation 11 should be those for summer at (preferably)40o or 50o latitude. Values of Lλ can be readily obtained from tables (2) (12) (18). As analternative to the use of equation 11 and tables of Lλ, the maximum direct photolysis rateconstant can be readily estimated by inputting molar absorption coefficients and a quantumyield equal to one into computer programs such as GCSOLAR (18) or ABIWAS (35) (36).
Criteria for deciding whether to go to Tier 2
69. Determine if the maximum possible direct photolysis rate constant for the test chemical inthe near surface of a clear natural water exposed to an average daily solar photon irradiance
18

would result in estimated direct photolysis losses ≥ 50% of an initial concentration over 30days of sunlight exposure by substituting kmax (solar) for k(solar) in equation 8.
70. If estimated direct photolysis losses (assuming a maximum direct photolysis rate constant) areless than 50% of the initial concentration over a 30-day period, direct photolysis is consideredto be an insignificant process. In such a case, no further direct photolysis work is performed.
71. If estimated direct photolysis losses (assuming a maximum direct photolysis rate constant)are greater than or equal to 50% of the initial concentration over a 30-day period, go to Tier2 (experimental study).
Tier 2 - Experimental study
72. Dissolve the test chemical in sterilized, buffered pure water and place an optically dilutesolution in photolysis test vessels. Expose at least half of the test vessels to a filtered xenonarc lamp or sunlight and allow an equal number or fewer of the test vessels to serve as darkcontrols. To account for volatile losses of test chemical and /or transformation products, testvessels should be attached to suitable traps for the collection of organic volatiles and CO2.
73. Determine the concentrations of the test chemical in the irradiated test vessels and in thedark control test vessels at adequate enough sampling intervals to approximately determinethe direct photolysis rate constant of the test chemical.
74. At each sampling interval, sacrifice an irradiated photolysis cell for analysis. The numberof sampling intervals for which a dark control is also sacrificed for analysis should dependupon a prior knowledge of the rate of hydrolysis of the test chemical at the experimentalpH. For example, if the test chemical is susceptible to appreciable rates of hydrolysis at theexperimental pH, a dark control cell should be sacrificed for analysis each time an irradiatedcell is sacrificed. However, if the test chemical is stable to hydrolysis at the experimental pH,a minimum of 3 sampling intervals for the dark control will be adequate.
75. If the data follow first-order kinetics, compute irradiated and dark control rate constants forthe test chemical by using linear regression on equation 3 or non-linear regression on equation2.
76. Once the irradiated and dark control rate constants for the test chemical have been deter-mined, compute the approximate laboratory direct photolysis rate constant from the followingequation:
kd = kirradiated − kdark (12)
19

Estimation of direct photolysis rate constants in near surface clear natural water fromlaboratory values
77. Estimate a direct photolysis rate constant for the test chemical in near surface clear naturalwater exposed to average daily solar spectral photon irradiances Lλ from the direct photolysisrate constant in a photolysis cell exposed to continuous spectral photon irradiances from afiltered xenon arc lamp using the following equation (see Annex 4, Derivations of SelectedEquations, on page 51):
kd(solar) =j
2.3Dcell
l
kd(xenon)
800∑290
ελLλ
800∑290
ελI0λ(xenon)
(13)
where:
kd(solar) = average daily direct photolysis rate constant (day−1) for the test chemicalin the near surface of clear natural water exposed to average dailysolar spectral photon irradiances Lλ
kd(xenon) = direct photolysis rate constant (day−1) for the test chemical in bufferedpure water in photolysis cells exposed to constant filteredxenon arc lamp irradiances I0λ(xenon)
ελ = molar absorption coefficient of the test chemical(M−1 cm−1) at wavelength λ
Dcell = depth of irradiated cell (cm) = volume of irradiated cell/incident areal = light pathlength in cell exposed to a filtered xenon arc lamp (cm)I0λ(xenon) = incident filtered xenon arc lamp spectral photon irradiance, on number basis
(cm−2 day−1 nm−1) over a 1 nm interval centered at wavelength λ
Lλ = 24 hour average daily solar spectral photon irradiance, on amount basis(mmol cm−2 day−1 ∆nm−1) over wavelength interval ∆λ
centered at wavelength λ for the weakly absorbing near surfaceof clear natural water bodies
j = conversion factor (j = 6.02 · 1020 L cm−3 mol−1, for details see eq. 5)
78. To use equation 13, the spectral photon irradiance from the filtered xenon arc lamp that isincident on the photolysis cells (I0λ) must be determined as a function of wavelength usingactinometers or a spectral radiometer. The solar spectral photon irradiances as a functionof wavelength for the near surface of clear natural waters (Lλ) for various mid-seasons andlatitudes are readily available (2) (12).
20

Criteria for deciding whether to identify major transformation products and (optional)to determine quantum yields
79. Determine if the direct photolysis rate constant for the test chemical in the near surface ofa clear natural water exposed to sunlight would result in direct photolysis losses > 20% ofan initial concentration over 30 days of sunlight exposure by substituting kd(solar) for ksolar inequation 8.
80. If direct photolysis losses (assuming the direct photolysis rate constant) are less than 20% ofthe initial concentration over a 30-day sunlight exposure period, direct photolysis is consideredto be an insignificant process. In such a case, no further direct photolysis work is performed.
81. If direct photolysis losses (assuming the direct photolysis rate constant) are greater than orequal to 20% of the initial concentration over a 30-day sunlight exposure period, identifymajor transformation products and (optional) determine the quantum yield.
Determination of the quantum yield (optional)
82. Determine the quantum yield of the test chemical in buffered solutions using monochromaticirradiation (12), filtered xenon-arc lamp polychromatic irradiation (8) or sunlight polychro-matic irradiation (2). Each has advantages and disadvantages compared to the others (seeAnnex 6).
Determination of the quantum yield using monochromatic irradiation
83. Place solutions of the test chemical and the selected optically low density actinometer inseparate but identical photolysis cells. Irradiate at least half of the photolysis cells withmonochromatic irradiation of wavelength λ and let an equal or fewer number (dependingupon the hydrolytic stability of the test chemical) serve as dark controls. Determine theconcentration of the test chemical in the irradiated cells and in the dark controls at adequateenough sampling intervals to determine the monochromatic direct photolysis rate constantof the test chemical (kdλ(chem)) and of the actinometer (kdλ(act)) at the wavelength λ ofirradiation. At each sampling interval, sacrifice an irradiated photolysis cell for analysis.The number of sampling intervals for which a dark control is also sacrificed for analysisshould depend upon a prior knowledge of the rate of hydrolysis of the test chemical at theexperimental pH.
84. The decline of a test chemical or actinometer concentrations at low optical density shouldfollow pseudo first-order kinetics so that the monochromatic irradiated and the dark controlrate constants can be determined by using linear regression on equation 3 or non-linearregression on equation 2. The decline of a test chemical or actinometer at high opticaldensity should follow zero-order kinetics so that the monochromatic irradiated and the dark
21

control rate constants can be determined by using linear regression on the following zero-orderkinetics equation:
c = c0 − k · t (14)
85. Once the monochromatic irradiated and dark control rate constants for the test chemical andthe actinometer have been determined, the monochromatic direct photolysis rate constant ofthe test chemical (kdλ(chem)) and of the actinometer (kdλ(act)) at wavelength λ are given by:
kdλ(chem or act) = kλ(irradiated)(chem or act) − kλ(dark)(chem or act) (15)
Note:In a sterilized aqueous buffer, the dark control rate constant (kdark) should be equal to thehydrolysis rate constant at the pH of the buffer.
86. Determine the molar absorption coefficients of the test chemical (ελ(chem)) and (if a lowoptical density actinometer is being used) of the actinometer (ελ(act)) at the wavelength λ ofthe monochromatic irradiation using the Beer-Lambert law assuming that ελ c is � than theattenuation coefficient αλ of the test medium:
ελ(chem or act) =Aλ(chem or act)
l · c(chem or act)(16)
where:
ελ(chem or act) = molar absorption coefficient of the test chemical or actinometer(M−1 cm−1) at wavelength λ
Aλ(chem or act) = absorbance of test chemical or actinometer solution at wavelength λ
l = light pathlength (cm) generally equivalent to Dcell
Dcell = depth of irradiated cell (cm) = volume of irradiated cell/incident areac(chem or act) = concentration of test chemical or actinometer solution (mol L−1)
87. The quantum yield of an optically dilute test chemical determined using monochromaticirradiation and a low optical density (low absorbance) actinometer is given by (12) (44) (seeAnnex 4, Derivations of Selected Equations, on page 51):
Φchem = Φactkdλ(chem) ελ(act)
kdλ(act) ελ(chem)(17)
where:
22

Φchem = the quantum yield of the test chemicalΦact = the quantum yield of the actinometerkdλ(chem) = monochromatic direct photolysis rate constant (day−1, pseudo first-order)
of a test chemical exposed to monochromatic irradiation at wavelength λ
kdλ(act) = monochromatic direct photolysis rate constant (day−1, pseudo first-order)of an actinometer exposed to monochromatic irradiation at wavelength λ
ελ(chem) = molar absorption coefficient of the test chemical(M−1 cm−1) at wavelength λ
ελ(act) = molar absorption coefficient of the actinometer(M−1 cm−1) at wavelength λ
88. The quantum yield of an optically dilute test chemical determined using monochromaticirradiation and a high optical density (high absorbance) actinometer is given by (12) (44)(see Annex 4, Derivations of Selected Equations, on page 51):
Φchem =Φact
2.3 ελ(chem) Dcell
kdλ(chem)
kdλ(act)(zero order)(18)
where:
Φchem = the quantum yield of the test chemicalΦact = the quantum yield of the actinometerελ(chem) = molar absorption coefficient of the test chemical
(M−1 cm−1) at wavelength λ
kdλ(chem) = monochromatic direct photolysis rate constant(day−1, pseudo first-order) of a test chemical exposed tomonochromatic irradiation at wavelength λ
kdλ(act)(zero order) = monochromatic direct photolysis rate constant(mol L−1 day−1, zero-order) of an actinometer exposed tomonochromatic irradiation at wavelength λ
Dcell = depth of irradiated cell (cm) = volume of irradiated cell/incident area
89. The quantum yield of a test chemical at high optical density (high absorbance) determinedusing monochromatic irradiation and a high optical density (high absorbance) actinometer isgiven by (12) (44) (see Annex 4, Derivations of Selected Equations, on page 52):
Φchem = Φact
kdλ (chem)(zero order)
kdλ (act)(zero order)(19)
where:
23
Φchem = the quantum yield of the test chemicalΦact = the quantum yield of the actinometerkdλ(chem)(zero order) = monochromatic direct photolysis rate constant
(mol L−1 day−1, zero-order) of a test chemical exposed tomonochromatic irradiation at wavelength λ
kdλ(act)(zero order) = monochromatic direct photolysis rate constant(mol L−1 day−1, zero-order) of an actinometer exposed tomonochromatic irradiation at wavelength λ
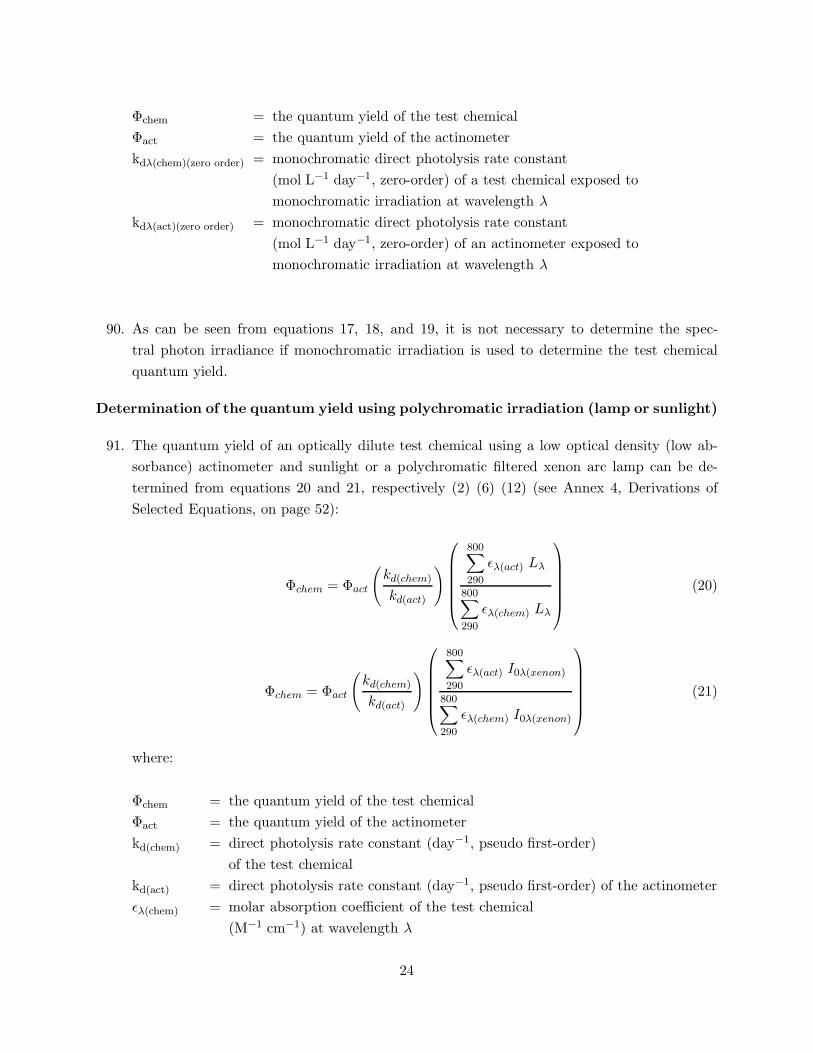
90. As can be seen from equations 17, 18, and 19, it is not necessary to determine the spec-tral photon irradiance if monochromatic irradiation is used to determine the test chemicalquantum yield.
Determination of the quantum yield using polychromatic irradiation (lamp or sunlight)
91. The quantum yield of an optically dilute test chemical using a low optical density (low ab-sorbance) actinometer and sunlight or a polychromatic filtered xenon arc lamp can be de-termined from equations 20 and 21, respectively (2) (6) (12) (see Annex 4, Derivations ofSelected Equations, on page 52):
Φchem = Φact
(kd(chem)
kd(act)
)⎛⎜⎜⎜⎜⎜⎝
800∑290
ελ(act) Lλ
800∑290
ελ(chem) Lλ
⎞⎟⎟⎟⎟⎟⎠ (20)
Φchem = Φact
(kd(chem)
kd(act)
)⎛⎜⎜⎜⎜⎜⎝
800∑290
ελ(act) I0λ(xenon)
800∑290
ελ(chem) I0λ(xenon)
⎞⎟⎟⎟⎟⎟⎠ (21)
where:
Φchem = the quantum yield of the test chemicalΦact = the quantum yield of the actinometerkd(chem) = direct photolysis rate constant (day−1, pseudo first-order)
of the test chemicalkd(act) = direct photolysis rate constant (day−1, pseudo first-order) of the actinometerελ(chem) = molar absorption coefficient of the test chemical
(M−1 cm−1) at wavelength λ
24

ελ(act) = molar absorption coefficient of the actinometer(M−1 cm−1) at wavelength λ
I0λ(xenon) = incident filtered xenon arc lamp spectral photon irradiance,on number basis (cm−2 day−1 nm−1) over a 1 nm intervalcentered at wavelength λ
Lλ = average daily solar spectral photon irradiance, on amount basis(mmol cm−2 day−1 ∆nm−1) over wavelength interval ∆λ
centered at wavelength λ
92. As can be seen from equations 20 and 21, it is necessary to independently and accuratelydetermine the incident spectral photon irradiance as a function of wavelength when polychro-matic irradiation is used to determine the test chemical quantum yield.
93. The determination of the test chemical quantum yield using polychromatic irradiation andan actinometer are discussed in detail in (2) for the use of sunlight, and in (8) for the use ofa filtered xenon arc lamp.
Use of the quantum yield to estimate direct photolysis rate constants
94. The pseudo first-order rate constant for direct phototransformation and thus the life-timeof a test chemical in water can be calculated from the quantum yield (18) (39). Computerprograms such as GCSOLAR (18) or ABIWAS (35) (36) can be used to estimate directphotolysis rate constants at any given time (i.e. season), latitude, in near surface water orat any specified water body depths and light attenuation of interest. The programs can alsoaverage rate constants over any given time and/or depth interval of interest.
95. Although programs such as GCSOLAR or ABIWAS are readily available, equation 5 is oftenused to estimate the direct photolysis rate constant for optically dilute solutions of testchemicals in pure water in photolysis cells or in the near surface of clear natural waterexposed to solar irradiation (2) (12).
Identification of major transformation products
96. In Tier 4 the test chemical in buffered pure water is exposed to a filtered xenon arc lamp orsunlight. The rates of formation and decline of transformation products are determined, ifpossible. Major phototransformation products are isolated and identified. For the purposesof this guideline, a major transformation product is one accounting for ≥ 10% of the appliedradioactivity (or molar basis) in an individual sample at any time during the study.
97. If a flow-through system is used to trap volatile test chemicals and/or their transformationproducts, the following considerations should be made. The air should be passed throughmicrobial filters to keep the samples sterile. Moist air should be used to prevent evaporation.
25

98. Place the test solution in photolysis test vessels. At least half the test vessels should beexposed to a filtered xenon arc lamp or sunlight and an equal or fewer number of the testvessels should serve as dark controls.
99. Determine the concentrations of the transformation products in the irradiated test vesselsand in the dark control test vessels at adequate enough sampling intervals.
100. At each sampling interval, sacrifice an irradiated photolysis cell for analysis. The number ofsampling intervals for which a dark control is also sacrificed for analysis should depend uponthe rate of hydrolysis of the test chemical at the experimental pH.
101. Identify and quantify major phototransformation products using analytical methods and cri-teria indicated in paragraph 27.
102. In cases where data follow first-order kinetics and the parent test chemical rapidly transforms,use the same first-order methods applied to the test chemical to also estimate first-order directphotolysis rate constants and corresponding half-lives for any major primary transformationproducts formed from the parent which are still at substantial concentrations (e.g. at ≥ 10%of applied) after the parent has degraded to negligible levels.
103. In cases where primary or secondary transformation products are being substantially formedover the same time period they are being substantially lost, their direct photolysis rate con-stants and corresponding half-lives cannot be readily estimated as they were for the parent.However, as an option, attempts can be made to estimate first-order rate constants for theformation and decline of major transformation products using non-linear regression to fit con-centration versus time series data to various equations derived from assumed transformationpathways.
REPORTING OF DATA AND RESULTS
104. The degree of presentation of results depends on the complexity and purpose of the study,that is, the number of tiers. The reporting should follow IUPAC recommendations (51).
Tier 1
• Provide the UV-VISIBLE spectrum or spectra of the test chemical as the molar absorp-tion coefficients (L mol−1 cm−1) on the y-axis versus wavelengths (nm) on the x-axis.
• Provide tabular values of solar spectral photon irradiances for the season and latitudechosen to estimate maximum photolysis rate constants.
• Report the estimated maximum photolysis rate constant and associated direct photolysislosses over a 30-days sunlight-exposure period. Provide the equations and calculationsused to estimate them. Provide the rationale for selecting the season and latitude ofthe average daily solar spectral photon irradiances (Lλ) used in the calculations. Reportwhether or not the results of the calculations trigger Tier 2.
26

Tier 2
General Data and results
• If a filtered xenon arc lamp was used, provide the incident spectral photon irradiance ina graph as the photon irradiance (cm−2 s−1 nm−1) on the y-axis versus the wavelength(nm) on the x-axis.
• If sunlight was used, provide tabular values of solar spectral photon irradiances for theseason and latitude closest to those of the study.
• Provide table(s) and graph(s) which show the concentrations of the test chemical inirradiated and dark control solutions versus time. Show the best fit regression lines onthe graph(s) along with the data points.
• Report the irradiated, dark control, and approximate direct photolysis rate constantof the test chemical along with their corresponding half-lives. Provide the equations,calculations, and regression coefficients used to compute them together with regressionn and r2 values, and standard errors of coefficients (for example, slope, intercept).
• Based upon the approximate direct photolysis rate constant, report the associated es-timated direct photolysis losses over a 30-days sunlight-exposure period. Provide theequations and calculations used to estimate them. Provide the rationale for selectingthe season and latitude of the average daily solar spectral photon irradiances (Lλ) usedin the calculations. Report whether or not the results of the calculations trigger Tiers 3and/or 4.
Identification of major transformation products
• Provide table(s) and graph(s) showing the concentrations of the phototransformationproducts and mass balance determinations in irradiated and dark control solutions versustime. Show the best fit regression lines on the graphs along with the data points.
• If applicable, report the rate constants for the formation and decline of the transforma-tion products. Report the identity of the major phototransformation products (≥ 10%of the applied dose). Provide the transformation pathway model, equations, calcula-tions, and regression coefficients used to compute them together with regression n andr2 values, and standard errors of coefficients.
Quantum yields
• If a filtered xenon arc lamp was used, provide the incident spectral photon irradiance ina graph as the photon irradiance (cm−2 s−1 nm−1) on the y-axis versus the wavelength(nm) on the x-axis.
• If sunlight was used, provide tabular values of solar spectral photon irradiances for theseason and latitude closest to those of the study.
27

• For the determination of the test chemical quantum yield with the use of an actinometer,provide table(s) and graph(s) showing the concentrations of the test chemical and acti-nometer in irradiated and dark control solutions versus time. Show the best fit regressionlines on the graph(s) along with the data points.
• Report the irradiated, dark control, and direct photolysis rate constants of the testchemical and actinometer. Provide the equations, calculations, and regression coeffi-cients used to compute them together with regression n and r2 values, and standarderrors of coefficients (for example, slope, intercept).
• Report the quantum yield of the test chemical. Provide the equation and calculationused to compute it.
• Report estimated direct photolysis rate constants for the test chemical in natural waterthat are estimated from the test chemical quantum yield for seasons, latitudes, andwater body types of interest. Provide and/or describe the equations and calculations orcomputer program (e.g. GCSOLAR or ABIWAS) and inputs to estimate them.
Additional reporting requirements
General information
• Title of the study, author(s), performing laboratory (name and address), laboratory re-port identification number, date of completion. In some instances, it may be necessary toidentify who is submitting the study, their address and any other identification number.
• Name(s) of the test chemical, chemical nomenclature, Chemical Abstracts Registry Num-ber (CAS Reg. No.). A tabular format may be used to present this infomation, but itis optional.
• Physical and chemical properties applicable to the test chemical. As an option, thesephysical and chemical properties may be listed in a table.
• Report if the test chemical is the primary chemical or any transformation product re-sulting from abiotic hydrolysis and/or biotransformation. Report if the test chemical isan industrial chemical, a pharmaceutical chemical, a pesticide, etc.
• For radiolabelled test chemicals, the radiolabelled element and isotope, radiolabellingposition(s), chemical and radiolabel purity, and specific activity should be reported.
Experimental information
• Standard laboratory equipment and reagents.
• Analytical method(s) used for identifying and quantifying the test chemical. The reportshould include a brief description of the method, reference standards, instrumentation,accuracy and precision, LOD and LOQ. Results of independent laboratory validation (ifrequired).
28

• Quality Control (QC) results such as analytical recoveries and relative percent standarddeviations for replicate analyses.
Specific experimental information related to photolysis (51)
• Experimental conditions, reagents, reaction vessels and other information relevant toeach of the tiers comprising the study. This may include:
– Temperature
– Solvent and/or buffers used for preparing stock and test solutions for direct photol-ysis, including dark control samples.
– Co-solvent and percent by volume used, if any.
– Nominal and actual concentration of test chemical in the test media
• Absorption Spectroscopy:
– Description of instrumentation
– Pathlength and material of optical cells
– Spectral resolution
– Concentration of test chemical in solution
– Co-solvent and percent by volume used, if any
– Temperature and pH
• Specific information on reaction vessels:
– Material (type of glass, quartz, etc)
– Geometry of the reaction vessels and positioning of the reaction vessels with respectto the light source.
– Any significant optical properties of the vessel material (wavelength cutoff, etc.)
– Illustration of the reaction vessel(s) arrangement and/or a photograph is encouragedto be included in the report.
• Xenon-light source:
– Manufacturer, model
– Filters and their purpose
– Measured spectrum of the light source between 290 and 800 nm at at least thebeginning and end of the study.
– Comparison of the spectrum of the light with that of natural sunlight for the con-ditions required for specific tiers.
• Quantum Yields:
– Experimental conditions (temperature, test media, concentration of test chemicalin test media)
29

– Description of reaction vessels (diagram and/or photograph)
– Specify if monochromatic or polychromatic irradiation was used and source
– Monochromatic wavelength and bandwidth used.
– Photometric methods, if any
– Chemical actinometer used (criteria for selection, concentration of actinometer intest media, absorption spectrum of the actinometer in the test media).
– Positioning of the actinometer with respect to the test chemical
• Computational methods for:
– Calculation of molar absorption coefficients (ελ) utilizing Beer-Lambert’s relation-ship
– Maximum photolysis reaction rate assuming Φ = 1
– Experimental photolysis reaction rate
– Quantum yield calculations
– GCSOLAR or ABIWAS calculation of reaction rates at different latitudes, seasons,time of the day, water bodies.
– Half-lives or DT50, DT75, and DT90 values and appropriate associated confidenceintervals.
30

LITERATURE
1. OECD. OECD Working Group for the Development of a Test Guideline on Phototransformationof Chemicals in Water. Rome, 21- 22 September 1998, 1998.
2. U.S. EPA. Direct Photolysis Rate in Water by Sunlight (OPPTS 835.2210). United StatesEnvironmental Protection Agency, Washington, DC, 1998.
3. U.S. EPA. Indirect Photolysis Screening Test (OPPTS 835.5270). United States EnvironmentalProtection Agency, Washington, DC, 1998.
4. ASTM. Standard Test Method for Conducting Aqueous Direct Photolysis Tests (E 896-87).American Society for Testing and Materials, Philadelphia PA, 1987.
5. U.K. DOE. Determination of the Stability of Substance in Simulated Sunlight- A proposal fora Test Guideline. Submitted by the Department of the Environment, United Kingdom, 1993.
6. UBA. Direct Phototransformation of Chemicals in Water - A proposal for a Test Guideline.Submitted by UBA, Berlin, Germany, 1992.
7. M. Lynch, Ed. Procedures for Assessing the Environmental Fate and Ecotoxicity of Pesticides.In: Aqueous Photolysis, Chapter 10, pp. 28–30. SETAC - Europe Publication, 1995.
8. ECETOC. The Phototransformation of Chemicals in Water: Results of a Ring Test. ECETOCTechnical Report No 12, Brussels, Belgium, 1984.
9. B. Van Henegouven. Sunlight induced Degradation of Chemicals in Surface Water. Report ofCentre for Bio-Pharmaceutical Sciences, Leiden, The Netherlands, 1990.
10. OECD. Guidance Document on Direct Phototransformation of Chemicals in Water. OECDEnvironmental Health and Safety Publication. Series on Testing and Assessment No.7, Paris,France, 1997.
11. S. E. Braslavsky. Glossary of terms used in photochemistry 3rd Edition (IUPAC Recommenda-tions 2006). Pure Appl. Chem., 79 (2007) 293–465.
12. A. Leifer. The Kinetics of Environmental Aquatic Photochemistry. Theory and Practice. ACSProfessional Reference Book. American Chemical Society, Washington, D. C., 1988.
13. T. Mill and W. Mabey. Photodegradation in water. In: W. Neely and G. Blau (Eds.), Environ-mental Exposure from Chemicals, Chapter 8, pp. 175–216. CRC Press, Boca Raton, 1985.
14. J. Harris. Rates of Direct Aqueous Photolysis. In: W. Lyman and W. Reehl and D. Rosen-blatt (Eds.), Handbook of Chemical Property Estimation Methods. Environmental Behavior ofOrganic Compounds. McGraw-Hill Publishers, New York, NY, 1982.
31
15. T. Mill, W. Mabey, D. Bomberger, T. Chou, D. Henry and J. H. Smith. Laboratory Protocolsfor Evaluation of the Fate of Organic Chemicals in Air and Water (EPA 600/3-82-002). U.S.Environmental Protection Agency, Washington, D.C., 1982.
16. T. Mill, J. Davenport, D. Dulin, W. Mabey and R. Bawol. Evaluation and Optimization ofPhotolysis Screens (EPA 560/5-81-003). U.S. Environmental Protection Agency, Washington,D.C., 1981.
17. R. Zepp. Quantum yields for reaction of pollutants in dilute aqueous solutions. Environ. Sci.Technol., 12 (1978) 327–329.
18. R. Zepp and D. Cline. Rate of direct photolysis in aquatic environment. Environ. Sci. Technol.,11 (1977) 359–366.
19. P. Boule, C. Guyon and J. Lemaire. Photochemistry and Environment IV : Photochemicalbehaviour of monochlorophenols in aqueous dilute solution. Chemosphere, 11 (1982) 1179–1188.
20. P. Boule, C. Guyon, A. Tissot and J. Lemaire. Specific phototransformation of xenobiotic com-pounds : chlorobenzene and chlorophenols. In: R. G. Zika and W. J. Cooper (Eds.), Pho-tochemistry of Environmental Aquatic Systems, Volume 327, p. 10. ACS Symposium Series,1987.
21. R. Zepp, G. Baughman and P. Schlotzhauer. Comparison of photochemical behavior of varioushumic substances in Water. I. Sunlight induced reactions of aquatic pollutants photosensitizedby humic substances. Chemosphere, 10 (1981) 109–117.
22. T. Mill. Predicting photoreaction rates in surface water. Chemosphere, 38 (1999) 1379–1390.
23. P. Brezonik and J. Fulkerson-Brekken. Nitrate-induced photolysis in natural waters: Controls onconcentrations of hydroxy radical photo-intermediates by natural scavenging agents. Environ.Sci. Technol., 32 (1998) 3004–3010.
24. P. Vaughan and N. Bough. Photochemical formation of hydroxy radical by constituents ofnatural waters. Environ. Sci. Technol., 32 (1998) 2947–2953.
25. N. Blough and R. Zepp. Reactive oxygen species in natural waters. In: C. Foote and G. Valentineand A. Greenberg and J. Liebman (Eds.), Active Oxygen in Chemistry, pp. 280–333. Chapmanand Hall, New York, NY, 1995.
26. S. Mabury and D. Crosby. The relationship of the hydroxyl reactivity to pesticide persistence. In:G. Helz and R. Zepp and D. Crosby (Eds.), Aquatic and Surface Photochemistry, Chapter 10,pp. 149 – 161. Lewis Publishers, Boca Raton, Florida, USA, 1994.
32

27. R. G. Zepp, J. Hoigne and H. Bader. Nitrate-induced photooxidation of trace organics in water.Environ. Sci. Technol., 21 (1987) 443–450.
28. W. Haag and J. Hoigne. Singlet oxygen in surface waters. III. Steady state concentrations invarious types of waters. Environ. Sci. Technol., 20 (1986) 341–348.
29. W. Haag, J. Hoigne, E. Gassmann and A. Braun. Singlet oxygen in surface waters. II. Quan-tum yields of its production by some natural humic materials as a function of wavelength.Chemosphere, 13 (1984) 641–650.
30. T. Mill, D. Hendry and H. Richardson. Free radical oxidants in natural waters. Science, 207(1980) 886–889.
31. W. Draper and D. Crosby. Hydrogen peroxide and hydroxyl radical: Intermediates in indirectphotolysis reactions in water.. J. Agric. Food Chem., 29 (1981) 699–702.
32. R. Zepp, P. Schlotzhauer and R. Sink. Photosensitized transformations involving electronicenergy transfer in natural waters: Role of humic substances. Environ. Sci. Technol., 19 (1985)74–81.
33. C. Wolff, M. Halmans and H. Van der Heijde. The formation of singlet oxygen in surface waters.Chemosphere, 10 (1981) 59–62.
34. R. Zepp, N. Wolfe, G. Baughman and R. Hollis. Singlet oxygen in natural waters. Nature, 267(1977) 421–423.
35. R. Frank and W. Klopffer. Spectral solar photo irradiance in Central Europe and the adjacentNorth Sea. Chemosphere, 17 (1988) 985–994.
36. R. Frank and W. Klopffer. A convenient model and program for the assessment of abioticdegradation of chemicals in natural waters. Ecotox. Environ. Safety, 17 (1988) 323–332.
37. J. G. Calvert and J. N. Pitts. Photochemistry. Wiley, New York, USA, 1966.
38. N. Turro. Modern Molecular Photochemistry. University Science Books, Sausalito, California,USA, 1991.
39. J. Lemaire, J. A. Guth, D. Klais, J. Leahey, W. Merz, J. Philp, R. Wilmes and C. J. M. Wolff. Ringtest of a method for assessing the phototransformation of chemicals in water. Chemosphere,14 (1985) 53–77.
40. U.S. EPA. Standard Evaluation Procedure: Aqueous Photolysis Studies. Hazard EvaluationDivision. (EPA-540/9-85-014). Office of Pesticide Programs, U.S. Environmental ProtectionAgency, Washington, D.C., 1985.
33

41. OECD. OECD Guideline for the Testing of Chemicals. Hydrolysis as a Function of pH. TestGuideline 111. Organisation for Economic Co-operation and Development, April 13 2004.
42. L. Ruzo, K. Shepler and R. Toia. Pesticide hydrolysis and photolysis studies: Guideline challengesand experimental approaches. In: M. Leng and E. Leovey and P. Zubkoff (Eds.), AgrochemicalEnvironmental Fate - State of the Art, Chapter 8, pp. 77–91. Lewis Publishers, Boca Raton,Florida, USA, 1995.
43. (EU). Commission Directive 95/36/EC amending Council Directive 91/414/EEC concerningthe placing of plant protection products on the market. Annex I: Fate and behaviour in theEnvironment. European Union, 1995.
44. R. G. Zepp. Experimental Approaches to Environmental Photochemistry. In: O. Hutzinger(Eds.), Handbook of Environmental Photochemistry, Volume 2, Part B, pp. 19–40. Springer-Verlag, New York, NY, 1982.
45. B. C. Faust. Generation and use of simulated sunlight in photochemical studies of liquidsolutions. Rev. Sci. Instrum., 64 (1993) 577–578.
46. Z. Drozdowicz, Ed. The Book of Photon Tools. Oriel Instruments, Stratford, Connecticut006615, USA, 1999.
47. Atlas Electric Devices Company. 114 Ravenswood Avenue. Oriel Instruments, Chicago, Illinois60613 USA, 1999.
48. T. Mill. Documents on Calibration of Lamp and Indirect Photoreaction Estimation Methods.U.S. Environmental Protection Agency, Office of Pesticide Programs under PR Number 9W-2901-NASA, 2000.
49. W.-U. Palm, R. Kopetzky and W. Ruck. OH-radical reactivity and direct photolysis of triph-enyltin hydroxide in aqueous solution. J. Photochem. Photobiol. A, 156 (2003) 105–114.
50. W.-U. Palm and C. Zetzsch. Investigation of the photochemistry and quantum yields of triazinesusing polychromatic irradiation and UV-spectroscopy as analytical tool. Int. J. Environ. Anal.Chem., 65 (1996) 313–329.
51. IUPAC. Recommended Standards for Reporting Photochemical Data (1984). Pure Appl. Chem.,56 (1984) 939–934.
52. D. Dulin and T. Mill. Development and evaluation of sunlight actinometers. Environ. Sci.Technol., 15 (1982) 815–820.
53. R. G. Zepp, M. M. Gumz, W. Miller and H. Gao. Photoreaction of Valerophenone in AqueousSolutions. J. Phys. Chem. A, 102 (1998) 5716–5722.
34
54. S. L. Murov, I. Carmichael and G. L. Hug. Handbook of Photochemistry (2nd Ed.). Marcel Decker,New York, 1993.
55. M. Millet, W.-U. Palm and C. Zetzsch. Abiotic degradation of halobenzonitriles - investigationof the photolysis in solution. Ecotox. Environ. Safety, 41 (1998) 44–50.
56. H. Heller and J. Langan. A new reusable chemical actinometer. EPA Newsletter, (1981) 71–73.
57. D. Bahnemann. Ultra-small metal oxide particles: preparation, photophysical characterizationand photocatalytic properties. Isr. J. Chem., 33 (1993) 115–136.
58. G. Gauglitz and S. Hubig. Photokinetische Grundlagen moderner Aktinometer. Z. Phys. Chem.N. F., 139 (1984) 237–246.
59. G. Gauglitz and S. Hubig. Chemical actinometry in the UV by azobenzene in concentratedsolutions: A convenient method. J. Photochem., 30 (1985) 121–125.
60. H. J. Kuhn, S. E. Braslavsky and R. Schmidt. Chemical actinometry (IUPAC Technical Report).Pure Appl. Chem., 76 (2004) 2105–2146.
61. F. G. Moses, R. S. H. Liu and B. M. Monroe. The ’Merry-Go-Round’ Quantum Yield Apparatus.Mol. Photochem., 1 (1969) 245–249.
62. M. B. Swanson, W. A. Ivancic, A. M. Saxena, J. D. Allton, G. K. O’Brien, T. Suzuki, H. Nishizawa
and M. Nokata. Direct Photolysis of Fenpyroximate in a Buffered Aqueous Solution under aXenon Lamp. J. Agric. Food Chem., 43 (1995).
35

ANNEX 1Definitions and Units
General Definitions
DT50 (Disappearance time 50) is the time within which the concentration of the test chemicalis reduced by 50%; it is different from the half-life t1/2 when transformation does not followfirst-order kinetics.
DT75 (Disappearance time 75) is the time within which the concentration of the test chemicalis reduced by 75%.
DT90 (Disappearance time 90) is the time within which the concentration of the test chemicalis reduced by 90%.
Half-life t1/2 is the time taken for 50% transformation of a test chemical when the transformationcan be described by first-order kinetics; in this case it is independent of concentration.
Lifetime Lifetime of a molecular entity, which decays by first-order kinetics, is the time needed fora concentration of the entity to decrease to 1/e of its original value, i.e., c(t = τ) = c(t = 0)/e.Statistically, it represents the life expectation of the entity. It is equal to the reciprocal ofthe sum of the first-order rate constants of all processes causing the decay of the molecularentity.
Limit of detection (LOD) is the concentration of a substance below which the identity of thesubstance cannot be distinguished from analytical artefacts.
Limit of quantification (LOQ) is the concentration of a substance below which the concentra-tion cannot be determined with an acceptable accuracy.
Test chemical means any chemical, whether the parent compound or relevant transformationproducts.
Transformation products refers to all substances resulting from biotic or abiotic transformationreactions of the test chemical including CO2.
Photochemical Definitions
The definitions and units thereafter are taken from the Glossary of terms used in photochemistry(IUPAC Recommendations 2006) (11). Commonly used and SI units are provided. Cited withpermission from the International Union of Pure and Applied Chemistry.
Absorbance (A), [Dimensionless] - Logarithm to the base 10 (linear absorbance) of the inci-dent (prior to absorption) spectral radiant power, P0
λ divided by the transmitted spectralradiant power, Pλ:
36

A(λ) = lg
(P0
λ
Pλ
)= −logT(λ)
In practice, A(λ) is the logarithm to the base 10 of the spectral radiant power of ultravi-olet, visible, or infrared radiation transmitted through a reference sample divided by thattransmitted through the investigated sample, both observed in identical cells. T(λ) is the(internal) transmittance at the defined wavelength. The terms absorbancy, extinction, andoptical density should no longer be used.
Absorption Coefficient (a), [m−1 or cm−1] Absorbance divided by the optical pathlength, l.
Actinometer Chemical system for the determination of the number of photons integrally or pertime interval absorbed into the defined space of a chemical reactor. This name is commonlyapplied to systems used in the ultraviolet and visible wavelength ranges. Examples of a chem-ical actinometer are iron(III) oxalate solutions. Examples of physical devices are bolometers,thermopiles and photodiodes. Actinometers give a reading that can be correlated to thenumber of photons detected. Examples of actinometers are given in Annex 6 on page 55.
Beer-Lambert Law The absorbance of a beam of collimated monochromatic radiation in a ho-mogeneous isotropic medium is proportional to the absorption pathlength, l, and to theconcentration, c. This law holds only under the limitations of the Lambert Law and for ab-sorbing species exhibiting no concentration dependent aggregation. The law can be expressedas,
A(λ) = lg
(P0
λ
Pλ
)= ε(λ) · c · l
or
Pλ = P0λ · 10−A(λ) = P0
λ · 10−ε(λ)·c·l
where the proportionality constant, ε(λ), is called the molar (decadic) absorption coefficientand P0
λ and Pλ are, respectively, the incident and transmitted spectral radiant power. For lin cm and c in mol dm3 or M, ε will result in dm3 mol−1 cm−1 or M−1 cm−1. These are thecommonly used units. The SI unit for ε is m2 mol−1.
Chromophore That part of a molecular entity consisting of an atom or group of atoms in whichthe electronic transition responsible for a given spectral band is approximately localized.
Depth of Penetration (of light), [m] The inverse of the absorption coefficient. If the decadicabsorption coefficient, a, is used, the depth of penetration (a−1) is the distance at which thespectral radiant power, Pλ decreases to one tenth of its incident value, P0
λ.
37

Einstein A mole of photons. Widely used, although it is not an SI unit. Einstein sometimes isdefined as the energy of one mole of photons. This latter use is discouraged.
Energy Transfer Process by which a molecular entity is excited (e.g., by absorption of ultraviolet,visible, or infrared radiation or by chemiexcitation) and a phenomenon (a physical or achemical process) originates from the excited state of another molecular entity, which hasinteracted with the originally absorbing entity. In mechanistic photochemistry, the term hasbeen reserved for the photophysical process in which an excited state of a molecular entity(the donor) is deactivated to a lower-lying state by transferring energy to a second molecularentity (the acceptor), which is thereby raised to a higher energy state. The excitation may beelectronic, vibrational, rotational or translational. The donor and acceptor may be two partsof the same molecule, in which case the process is called intramolecular energy transfer.
Excited State A state of higher energy than the ground state of a chemical entity. In photo-chemistry an electronically excited state is usually meant.
Fluence (H0,F0), [J m−2] At a given point in space, the radiant energy, Q, incident on an smallsphere from all directions divided by the cross-sectional area of that sphere. The term is usedin photochemistry to specify the energy delivered in a given time interval (e.g., by a laserpulse).
Frequency (ν or ω), [s−1 or rad · s−1] The number of waveperiods per unit time. The linearfrequency, ν, is the number of cycles per unit time. For the angular frequency, the symbolω (= 2πν) is used.
Ground State The lowest energy state of a chemical entity. In photochemistry, ground electronicstate is usually meant.
Intensity Traditional term indiscriminately used for photon flux, fluence rate, irradiance, or radi-ant power. In terms of an object exposed to radiation, the term should now be used only forqualitative descriptions.
Intensity (of a spectral feature) Describes the magnitude of the particular feature in the spec-trum.
Irradiance (E), [W m−2] The radiant flux or radiant power, P, of all wavelengths incident on aninfinitesimal element of surface containing the point under consideration divided by the areaof the element (dP/dS, simplified expression: E= P/S when the radiant power is constant overthe surface area considered). For a parallel and perpendicular incident beam not scattered orreflected by the target or its surrounding fluence rate (E0) is an equivalent term. E =
∫λ Eλdλ,
where Eλ is the spectral irradiance at wavelength λ.
38

Lambert Law The fraction of light absorbed by a system is independent of the spectral radiantpower (P0
λ). This law holds only if P0λ is small, scattering is negligible, and multiphoton
processes, excited state populations, and photochemical reactions are negligible.
Lamp A source of incoherent radiation.
Merry-Go-Round Reactor, Turntable Reactor Apparatus in which several samples are ro-tated around a radiation source in order to expose each to equal amounts of radiation.
Molar Absorption Coefficient, Molar Decadic Absorption Coefficient, [dm3 mol−1 cm−1,M−1 cm−1] Absorbance divided by the absorption pathlength, l, and the concentration, c:
ε(λ) =1
c · l · lgP0
λ
Pλ=
A(λ)c · l
where P0λ and Pλ are, respectively, the incident and transmitted spectral radiant power. The
term molar absorptivity for molar absorption coefficient should be avoided. In common usagefor l/cm and c/mol dm–3 (M), ε(λ) results in dm3 mol–1 cm–1 (M–1 cm–1, the most commonlyused unit), which equals 0.1 m2 mol–1 (coherent SI units).
Optical Bench An apparatus for observation and measurement of optical phenomena (definitionnot taken from (11)). In (12) an optical bench for photochemical experiments is termed a”photochemical optical bench” (POB).
Photochemical Reaction This term is generally used to describe a chemical reaction caused byabsorption of ultraviolet, visible, or infrared radiation.
Photochemistry Branch of chemistry concerned with the chemical effects of ultraviolet, visible,or infrared radiation.
Photodegradation The photochemical transformation of a molecule into lower molecular weightfragments, usually in an oxidation process. This term is widely used in the destruction(oxidation) of pollutants by UV-based processes.
Photolysis Bond cleavage induced by ultraviolet, visible, or infrared radiation. Term often usedincorrectly to describe irradiation of a sample, although in the combination flash photolysisthis usage is accepted.
Photon The quantum of electromagnetic energy at a given frequency. This energy, E = hν is theproduct of the Planck (h) constant and the frequency of the radiation (ν).
Photon Flux (qP), [s−1] Number of photons (quanta of radiation, NP) per time interval.
39

Photon Irradiance (EP), [m−2 s−1] Number of photons (quanta of radiation, Np) per time in-terval (photon flux), qP, incident from all upward directions on a small element of surfacecontaining the point under consideration divided by the area of the element. This quantitycan be used on a chemical amount basis by dividing EP by the Avogadro constant, the symbolthen being En,P, the name ”photon irradiance, amount basis”, SI unit is mol m–2 s–1; commonunit is einstein m–2 s–1.
Photooxidation Reactions induced by light. Common process are:
• The loss of one or more electrons from a chemical species as a result of photexcitationof that species;
• The reaction of a substance with oxygen under the influence of light. When oxygenremains in the product this latter process is also called photooxygenation. Reactionsin which neither the substrate nor the oxygen are electronically excited are sometimescalled ”photoinitiated oxidations”.
Photoreductions Reduction reactions induced by light. Common process are:
• Addition of one or more electrons to a photoexcited species;
• The photochemical hydrogenation of a substance. Reactions in which the substrate isnot electronically excited are sometimes called ”photinitiated reductions”.
Photosensitization The process by which a photochemical or photophysical alteration occurs inone molecular entity as a result of initial absorption of radiation by another molecular entitycalled a photosensitizer. In mechanistic photochemistry the term is limited to cases in whichthe photosensitizer is not consumed in the reaction.
Primary Photochemical Process (Primary Photoreaction) Elementary chemical process un-dergone by an electronically excited molecular entity yielding a primary photoproduct.
Primary (Photo)product The first observable chemical entity which is produced in the primaryphotochemical process and which is chemically different from the reactant.
Quantum (of radiation) An elementary particle of electromagnetic energy in the sense of thewave-particle duality.
Quantum Yield (Φ) The number of defined events which occur per photon absorbed by thesystem. The integral quantum yield is:
Φ(λ) =number of events
number of photons absorbed
For a photochemical reaction,
40

Φ(λ) =amount of reactant consumed or product formed
amount of photons absorbed
The differential quantum yield is
Φ(λ) =dx/dt
q0n,p · (1 − 10−A(λ))
where dx/dt is the rate of change of a measurable quantity (spectral or any other property),and q0
n,p the amount of photons (mol or its equivalent einstein) incident (prior to absorption)per time interval (photon flux, amount basis). A(λ) is the absorbance at the excitationwavelength. Strictly, the term quantum yield applies only for monochromatic excitation. Φcan be used for photophysical processes or photochemical reactions.
Radiant Energy (Q), [J] The total energy emitted, transferred or received as radiation of allwavelengths in a defined period of time (Q =
∫λ Qλdλ). It is the product of radiant power,
and time, t: Q = P · t when the radiant power is constant over the time considered.
Radiant Exposure (H), [J m−2] The irradiance, E, integrated over time of irradiation (∫
E dt,simplified expression H = E · t when the irradiance is constant over the time considered).
Radiant Power (P), [J s−1, or W] Power emitted, transferred or received as radiation.
Singlet Molecular Oxygen The oxygen molecule (dioxygen), O2, in an excited singlet state.The ground state of oxygen is a triplet 3∑ g−. The two metastable singlet states derivedfrom the ground state configuration are 1∆g and 1∑ g+. Use of the term ”singlet oxygen”alone, without mention of the chemical species is discouraged since it can also refer to anoxygen atom in a 1S or 1D excited state.
Singlet State A state having a total electron spin quantum number equal to 0.
Solvent Shift A shift in the frequency of a spectral band of a chemical species arising from itsinteraction with its solvent environment. Bathochromic shift, also known to as ”red shift”,refers to the shift of a spectral band to lower frequencies (longer wavelenghts) as result ofinteraction with the solvent Hypsochromic shift, also known as ”blue shift”, refers to the shiftof a spectral band to higher frequencies (shorter wavelengths) as a result of interaction withthe solvent.
Spectral Photon Flux (qp,λ), [s−1 m−1 or s−1 nm−1] Derivative of photon flux, number basis,qP, with respect to wavelength, λ. This quantity can be expressed on a chemical amount basisby dividing qP,λ, by the Avogadro constant, the name then is ”spectral photon flux, amountbasis”, the symbol qn,p,λ and the SI unit is mol s–1 m–1; common unit is einstein s–1 nm–1.
41

Spectral Photon Irradiance (Ep,λ), [s−1 m−3 or s−1 cm−2 nm−1] Derivative of photon irradi-ance, EP, with respect to wavelength, λ. This quantity can be expressed on a chemicalamount basis by dividing EP,λ, by the Avogadro constant, the name then is ”spectral photonirradiance, amount basis”, the symbol En,P,λ, and the SI unit is mol s–1 m–3; common unit iseinstein s–1 m–2 nm–1.
Spectral Irradiance (Eλ), [W m−3, or W m−2 nm−1] Derivative of irradiance, E, with respectto wavelength, λ.
Triplet State A state having a total electron spin quantum number of 1.
Wavelength (λ) The distance, measured along the line of propagation, between two correspond-ing points on adjacent waves. The wavelength depends on the medium in which the wavepropagates
Wavenumber (σ, ν), [m−1 or cm−1] The reciprocal of the wavelength, λ, or the number of wavesper unit length along the direction of propagation.
Xenon Lamp An intense source of ultraviolet, visible and near-infrared light produced by elec-trical discharge in xenon under high pressure.
42

ANNEX 2Symbols and Units Related to Photochemistry
Table 1: Symbols and units related to photochemistry with their SI unit and commonly used units
Symbol Name SI Units Common UnitsA Absorbance Dimensionless Dimensionlessa Decadic absorption coefficient m−1 cm−1
D Attenuance Dimensionless DimensionlessH0 Fluence J m−2
E0 Fluence rate W m−2
E Irradiance W m−2 W cm−2
Molar (decadic) dm3 mol−1 cm−1 orε absorption coefficient m2 mol−1 L mol−1 cm−1
most common: M−1 cm−1
Φ Quantum yield Dimensionless DimensionlessEp Photon Irradiance s−1 m−2 s−1 cm−2
Q Radiant energy JH Radiant exposure J m−2
P Radiant Power W = J s−1
Ep,λ Spectral Photon Irradiance s−1 m−3 s−1 cm−2 nm−1
λ Wavelength m nmν; σ Wavenumber m−1 cm−1
Note:
Spectral Photon Irradiance The symbol Iλ was used in this guideline for the ”Spectral PhotonIrradiance” without exception on a number basis. For a chemical exposed to polychromaticirradiation by a number of photons over a 1 nm interval centered at wavelength λ, I0λ is usedwith the unit cm−2 s−1 nm−1. Divide I0λ by the Avogadro constant (NA = 6.022 ·1023 mol−1)to obtain the corresponding value on an amount basis (with the unit mol cm−2 s−1 nm−1 orEinstein cm−2 s−1 nm−1).
Average Daily Solar Spectral Photon Irradiance The symbol Lλ was used in this guidelinefor the ”Average Daily Solar Spectral Photon Irradiance” without exception on an amountbasis. For a chemical exposed to sunlight (a polychromatic light source) over a wavelengthinterval ∆λ centered at wavelength λ, Lλ is used with the unit mmol cm−2 day−1 ∆nm−1.Divide Lλ by the factor 1000 (which converts mmol to mol) und multiply by the Avogadroconstant (NA = 6.022 ·1023 mol−1) to obtain the corresponding value on a number basis (withthe unit cm−2 day−1 ∆nm−1).
43

ANNEX 3Proposed test scheme for direct photolysis
Direct photolysis negligibleInvestigate indirect photolysis
Optional
YES
NO
YES
NO
TIER 1: Theoretical ScreenMeasurement of absorbance
Estimation of maximumphotolysis rate constant
Isolation and identificationof major transformation products
with > 10 % of dose applied
TIER 2: Experimental StudyDetermination of photolysis rate
constant over 30 days summer sunlight
Decision criteriaPhotolysis loss > 50 %
over 30 days?
Decision criteriaPhotolysis loss > 20 %
in 30 days sunlightexposure?
Determination of quantum yield andcalculation of photolysis rate constant
and half-life
Figure 1: Proposed test scheme for direct photolysis.
44

ANNEX 4 Derivations of Selected Equations
Background equations (12):
(dc
dt
)λ
= −Φj· Iλ(abs by chem) = − Φ
j Dsys· I0λ · Fλ(abs by sys) · Fλ(abs by chem) (4-1)
dc
dt= −Φ
j
800∑290
Iλ(abs by chem) = − Φj Dsys
800∑290
I0λ · Fλ(abs by sys) · Fλ(abs by chem) (4-2)
where:
Φ = quantum yieldj = conversion factor to make units consistent with the L mol−1 cm−1 unit
of the molar absorption coefficient and the mol L−1 unit of concentration(j = 6.02 · 1020 L cm−3 mol−1)
Iλ(abs by chem) = spectral photon absorption rate by the chemical per unit volumeover a 1 nm interval centered at wavelength λ (cm−3 day−1 nm−1)
Dsys = depth of irradiated system (cm) = volume of irradiated system/incident areaI0λ = incident spectral photon irradiance over a 1 nm interval centered
at wavelength λ (cm−2 day−1 nm−1)Fλ(abs by sys) = fraction of incident photon irradiance absorbed by the systemFλ(abs by chem) = fraction of incident photon irradiance absorbed by the chemical
Fλ(abs by sys) =I0λ − Itλ
I0λ=
I0λ
(1 − 10−(αλ+ελ c) l
)I0λ
= 1 − 10−(αλ+ελ c) l (4-3)
Fλ(abs by chem) =ελ · c
αλ + ελ · c (4-4)
where:
αλ = attenuation coefficient of the system at wavelength λ (cm−1)ελ = molar absorption coefficient of the chemical at wavelength λ (L mol−1 cm−1)l = light pathlength (cm)
Inserting equations 4-3 and 4-4 into equation 4-1 gives:
(dc
dt
)λ
= − Φj Dsys
· I0λ ·(1 − 10−(αλ+ελ c) l
)·(
ελ · cαλ + ελ · c
)(4-5)
Summing equation 4-5 over all wavelengths from 290 nm to 800 nm gives:
45

dc
dt= − Φ
j Dsys
800∑290
[I0λ ·
(1 − 10−(αλ+ελ c) l
)·(
ελ · cαλ + ελ · c
)](4-6)
For solar irradiation on an aqueous system (12),
I0λ(solar)(t) = Idλ(t) + Isλ(t) (4-7)
ld ∼= Dsys · sec θ(t) (4-8)
ls = 1.2 · Dsys (4-9)
where:
I0λ(solar)(t) = total incident solar photon irradiance as a function of timeIdλ(t) = direct incident solar photon irradiance as a function of timeIsλ(t) = sky radiation incident solar photon irradiance as a function of timeld = average light pathlength for direct irradiation (cm)ls = average light pathlength for sky irradiation (cm)θ(t) =
dc
dt= − Φ
j Dsys
800∑290
[{Idλ ·
(1 − 10−(αλ+ελ c) Dsys sec θ
)+
Isλ ·(1 − 10−(αλ+ελ c) 1.2Dsys
)}·(
ελ · cαλ + ελ · c
)](4-10)
Derivation of equation 5 in the main text (12):
10−x = exp (−2.3 · x) (4-11)
Therefore,
1 − 10−(αλ+ελ c) l = 1 − exp [−2.3 · (αλ + ελ c) l] = 1 − exp (−x) (4-12)
where:
x = 2.3 · (αλ + ελ c) l = 2.3 · A (4-13)
A = absorbance of the solution
46

A series expansion of the exponential in equation 4-12 gives:
1 − exp (−x) = x +x2
2!− x3
3!+
x4
4!− x5
5!+ ... (4-14)
For an optically dilute solution of a test chemical in pure water or in shallow water or in the nearsurface of natural water, such that the absorbance of the system is < 0.02, all of the higher termsin equation 4-14 are small compared to x, such that equation 4-14 reduces to:
1 − exp (−x) ∼= x (4-15)
Combining equations 4-13 and 4-15 with equation 4-12 gives for an optically dilute solution of atest chemical in pure water or clear shallow water or in the near surface of natural water:
1 − 10−(αλ+ελ c) l = 2.3 · (αλ + ελ c) l (4-16)
Substituting equation 4-16 into equation 4-6 and canceling out the resulting identical terms in thenumerator and denominator gives for an optically dilute solution of a test chemical in pure wateror in clear shallow water or in the near surface of natural water:
dc
dt= −
(2.3j
l
DsysΦ
800∑290
ελ I0λ
)c (4-17)
By comparing equation 4-17 to equation 1 in the main text, it can be seen that for a test chemicalin an optically dilute solution in pure water or in clear shallow water or in the near surface ofnatural water, the direct photolysis rate constant is given by:
kd =2.3j
l
DsysΦ
800∑290
ελ I0λ (4-18)
where equation 4-18 is identical to equation 5 of the main text.
Derivation of equation 6 in the main text (12)By analogy to equation 4-16, it can be seen that for a solar irradiated, optically dilute solution ofa test chemical in pure water or in clear shallow water or in the near surface of natural water suchthat the absorbance of the system is < 0.02,
1 − 10−(αλ+ελ c) Dsys sec θ ∼= 2.3 · (αλ + ελ c) Dsys sec θ (4-19)
1 − 10−(αλ+ελ c) 1.2 Dsys ∼= 2.3 · (αλ + ελ c) 1.2 Dsys (4-20)
Substituting equations 4-19 and 4-20 into equation 4-10 and canceling out the resulting identicalterms in the numerator and denominator gives:
47

dc
dt= −
(2.3j
Φ800∑290
ελ Zλ(t)
)· c (4-21)
where:
Zλ(t) = Idλ(t) · sec θ + 1.2 Isλ(t) (4-22)
Equation 4-21 gives the direct photolysis rate as a function of time because the solar photonirradiance at any given wavelength varies over time as represented by Z(t) for an optically dilutesolution.
Zλ(t) =
24∫0
Zλ(t) dt
24 hours(4-23)
Mill et al (1985) defined 24 hour average solar irradience values as:
Lλ =2.3j
· Zλ (4-24)
Substituting equation 4-24 into 4-21 gives the average direct photolysis rate over a 24-hour period:
(dc
dt
)= −
(Φ
800∑290
ελ Lλ
)· c (4-25)
By comparing equation 4-24 to equation 1 in the main text, it can be seen that for an opticallydilute solution of a test chemical in pure water or clear shallow water or in the near surface ofnatural water exposed to sunlight, the 24 hour average direct photolysis rate constant is given by:
kd(solar) = Φ800∑290
ελ Lλ (4-26)
where equation 4-26 is identical to equation 6 in the main text.
Derivation of equation 7 in the main text:Rearranging equation 4-2 gives the total photon absorption rate per unit volume by the test chem-ical:
I(abs by chem) =800∑290
Iλ(abs by chem) = − j
Φdc
dt(4-27)
where:
I(abs by chem) = total photon absorption rate by the chemical per unit volume (cm−3 day−1)Iλ(abs by chem) = spectral photon absorption rate by the chemical per unit volume
over a 1 nm interval centered at wavelength λ (cm−3 day−1 nm−1)
48

Multiplying equations 4-17 and 4-25 by −j/Φ gives the total photon absorption rate per unit volumeby the test chemical in an optically dilute solution exposed to xenon arc lamp or solar irradiation,respectively:
I(xenon abs by chem) =
(2.3
l
Dsys
800∑290
ελ I0λ (xenon)
)· cxenon (4-28)
I(solar abs by chem) =
(j
800∑290
ελ Lλ
)· csolar (4-29)
The total number of photons absorbed per unit volume by a test chemical in a low optical densitysolution over X days of xenon arc lamp irradiation or over 30 days of solar irradiation are givenrespectively by:
Total number of photons abs by chemcm3
=
(X days xenon)
(2.3
l
Dsys
800∑290
ελ I0λ (xenon)
)· cxenon (4-30)
Total number of photons abs by chemcm3
=
(30 days solar)
(j
800∑290
ελ Lλ
)· csolar (4-31)
The number of days (X) of constant irradiation by a filtered xenon arc lamp that is equivalent to 30days of solar irradiation of a low absorbance water can be obtained by equating equations 4-30 and4-31, assuming that the average concentration over 30 days of solar irradiation (csolar) is equal tothe average concentration over X days of constant irradiation by a xenon arc lamp (cxenon), solvingfor X and substituting Dcell for Dsys:
X days xenon =(
30 j
2.3Dcell
l
)800∑290
ελLλ
800∑290
ελI0λ (xenon)
=(
13 jDsys
l
)800∑290
ελLλ
800∑290
ελI0λ (xenon)
(4-32)
where equation 4-32 is identical to equation 7 in the main text.
Derivation of equation 9 in the main text:Substituting equation 4-16 for an optically dilute solution (applicable to a low optical densityactinometer solution) into equation 4-5, rearranging and incorporating subscripts to designate theuse of monochromatic irradiation from a xenon arc lamp (obtained with a monochromator) gives:
49

(dc
dt
)λ
= −2.3 Φact
j
l
Dsys· ελ(act) · I0λ(xenon) · c (4-33)
By comparing equation 4-33 to equation 1 in the main text, it can be seen that the monochromaticpseudo first-order rate direct photolysis rate constant of a low optical density actinometer exposedto monochromatic irradiation from a xenon arc lamp is given by:
kdλ(act) =2.3 Φact
j
l
Dsys· ελ(act) · I0λ(xenon) (4-34)
Rearranging equation 4-34 to solve for I0λ(xenon) and substituting Dcell for Dsys:
I0λ(xenon) =j
2.3Dcell
lxenon
kdλ(act)
Φactελ(act)(4-35)
where equation 4-35 is identical to equation 9 in the main text.
Derivation of equation 10 in the main textIt holds for a high optical density actinometer solution
1 − 10−(αλ+ελ c) l ∼= 0 (4-36)
and
ελ c � αλ (4-37)
such that
ελ · cαλ + ελ · c
∼= ελ · cελ · c = 1 (4-38)
Substituting equations 4-36 and 4-38 for a high optical density actinometer solution into equation4-6, summing only over the absorption spectrum of the actinometer above 290 nm, and usingsubscripts to designate the use of a filtered xenon arc lamp gives:
dc
dt= − Φact
j Dsys
λ = final∑λ = initial
I0λ(xenon) (4-39)
Equation 4-39 is a zero-order equation such that the zero-order direct photolysis rate constant ofthe high optical density actinometer is given by:
kdλ(act)(zero order) = − Φact
j Dsys
λ = final∑λ = initial
I0λ(xenon) (4-40)
Rearranging equation 4-40 and substituting Dcell for Dsys gives:
50
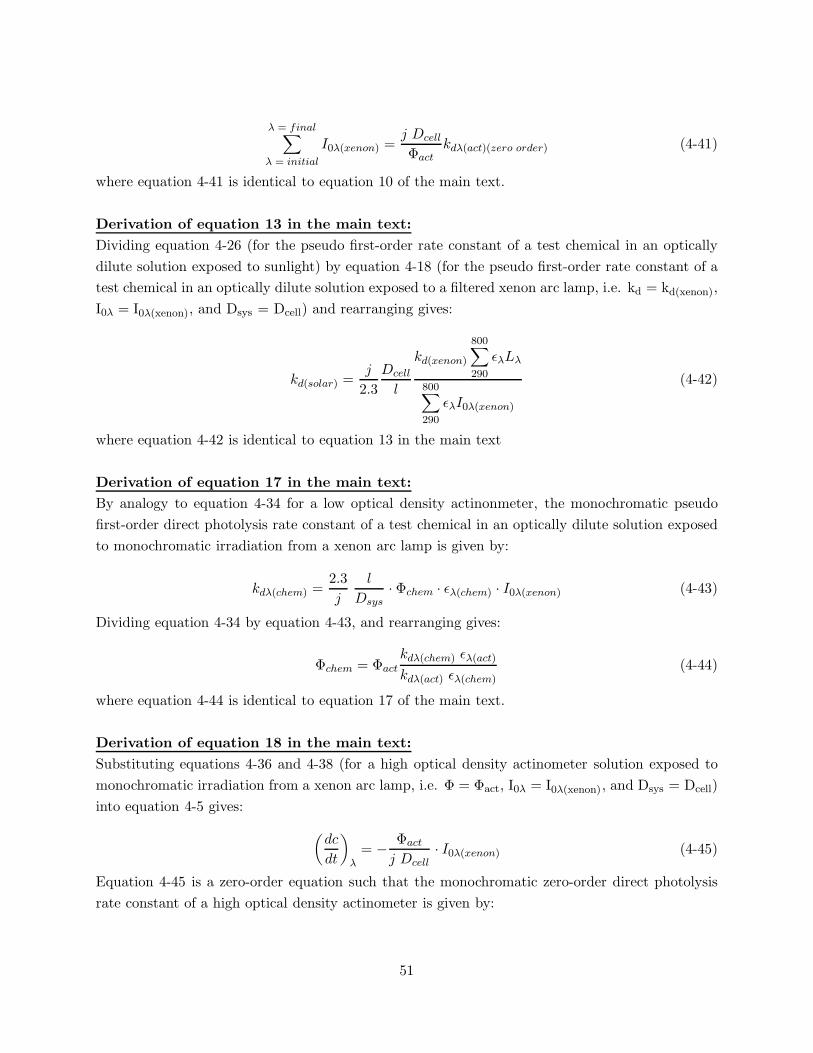
λ = final∑λ = initial
I0λ(xenon) =j Dcell
Φactkdλ(act)(zero order) (4-41)
where equation 4-41 is identical to equation 10 of the main text.
Derivation of equation 13 in the main text:Dividing equation 4-26 (for the pseudo first-order rate constant of a test chemical in an opticallydilute solution exposed to sunlight) by equation 4-18 (for the pseudo first-order rate constant of atest chemical in an optically dilute solution exposed to a filtered xenon arc lamp, i.e. kd = kd(xenon),I0λ = I0λ(xenon), and Dsys = Dcell) and rearranging gives:
kd(solar) =j
2.3Dcell
l
kd(xenon)
800∑290
ελLλ
800∑290
ελI0λ(xenon)
(4-42)
where equation 4-42 is identical to equation 13 in the main text
Derivation of equation 17 in the main text:By analogy to equation 4-34 for a low optical density actinonmeter, the monochromatic pseudofirst-order direct photolysis rate constant of a test chemical in an optically dilute solution exposedto monochromatic irradiation from a xenon arc lamp is given by:
kdλ(chem) =2.3j
l
Dsys· Φchem · ελ(chem) · I0λ(xenon) (4-43)
Dividing equation 4-34 by equation 4-43, and rearranging gives:
Φchem = Φact
kdλ(chem) ελ(act)
kdλ(act) ελ(chem)(4-44)
where equation 4-44 is identical to equation 17 of the main text.
Derivation of equation 18 in the main text:Substituting equations 4-36 and 4-38 (for a high optical density actinometer solution exposed tomonochromatic irradiation from a xenon arc lamp, i.e. Φ = Φact, I0λ = I0λ(xenon), and Dsys = Dcell)into equation 4-5 gives:
(dc
dt
)λ
= − Φact
j Dcell· I0λ(xenon) (4-45)
Equation 4-45 is a zero-order equation such that the monochromatic zero-order direct photolysisrate constant of a high optical density actinometer is given by:
51

kdλ(act)(zero order) =Φact
j Dcell· I0λ(xenon) (4-46)
Dividing equation 4-43 (for the monochromatic pseudo first-order direct photolysis rate constant ofa test chemical in an optically dilute solution exposed to monochromatic irradiation from a xenonarc lamp with Dsys = l) by equation 4-46 (for the monochromatic zero-order direct photolysis rateconstant of a high optical density actinometer exposed to monochromatic irradiation from a xenonarc lamp), and rearranging gives:
Φchem =Φact
2.3 ελ(chem) Dcell
kdλ(chem)
kdλ(act)(zero order)(4-47)
where 4-47 is identical to equation 18 in the main text.
Derivation of equation 19 in the main text:By analogy to equation 4-46 for a high optical density actinometer, the monochromatic zero-orderdirect photolysis rate constant of a test chemical at high optical density in a solution exposed tomonochromatic irradiation from a xenon arc lamp is given by:
kdλ(chem)(zero order) =Φchem
j Dcell· I0λ(xenon) (4-48)
Dividing equation 4-48 by equation 4-46 and rearranging gives:
Φchem = Φact
kdλ (chem)(zero order)
kdλ (act)(zero order)(4-49)
where equation 4-49 is identical to equation 19 in the main text.
Derivation of equation 20 in the main text:Using equation 4-26 for the pseudo first-order rate constant of a test chemical in an optically dilutesolution exposed to sunlight and the same equation 4-26 for the pseudo first-order rate constant of alow optical density actinometer solution exposed to sunlight, divide both equations, and rearranginggives:
Φchem = Φact
(kd(chem)
kd(act)
)⎛⎜⎜⎜⎜⎜⎝
800∑290
ελ(act) Lλ
800∑290
ελ(chem) Lλ
⎞⎟⎟⎟⎟⎟⎠ (4-50)
where equation 4-50 is identical to equation 20 in the main text.
Derivation of equation 21 in the main text:Using equation 4-18 for the pseudo first-order rate constant of a test chemical in an optically dilutesolution exposed to a filtered xenon arc lamp and the same equation 4-18 for the pseudo first-order
52

rate constant of a low optical density actinometer solution exposed to a filtered xenon arc lamp,divide both equations, and rearranging gives:
Φchem = Φact
(kd(chem)
kd(act)
)⎛⎜⎜⎜⎜⎜⎝
800∑290
ελ(act) I0λ(xenon)
800∑290
ελ(chem) I0λ(xenon)
⎞⎟⎟⎟⎟⎟⎠ (4-51)
where equation 4-51 is identical to equation 21 in the main text.
53

ANNEX 5Preparation of Direct Photolysis Test Media
Water meeting ASTM Type IIA standards is recommended to prepare buffer solutions for directphotolysis studies. This water is described in ASTM D 1193-99- Standard Specification for ReagentWater. This document can be obtained from ASTM. In the USA, this document can be obtainedfrom:
American Society for Testing and Materials (ASTM)1961 Race StreetPhiladelphia, Pennsylvania 19103
For outside the USA, see http://www.astm.org/dist.htmA recommended procedure for preparing buffers for direct photolysis studies is given in USEPAOPPTS 835.2210 Direct Photolysis Rate in Water by Sunlight (2). This guideline recommends:
• Preparing all buffer solutions at 25 o C
• Using reagent grade chemicals free of impurities that could behave as photosensitizers
• For pHs in the range of 3 to 6, use NaH2PO4/HCl
• For pHs in the range of 6 to 8, use KH2PO4/NaOH
• For pHs in the range of 8 to 10, use H3BO3/NaOH
• Using procedures such as those described in the Handbook of Chemistry and Physics or byany well establish method.
• Always checking the pH with a well calibrated pH meter
• Using the minimum concentration of buffer
To prepare the test solutions for the direct photolysis studies, add the buffer solution to the testchemical to attain the desired pH. If necessary, adjust the pH with 1 M HCl or NaOH. It is highlyrecommended that the actual concentration of the test chemical in the test solution be determinedprior to starting the study.
54

ANNEX 6Advantages and Disadvantages of Monochromatic and Polychromatic Irradiation
1. The main advantage in using monochromatic irradiation to determine the quantum yield ofthe test chemical is that it eliminates the need to directly measure the incident monochromaticirradiation (see equations 17 through 19 in the main text). However, a disadvantage is that itwill take longer to determine the quantum yield with monochromatic irradiation than with theuse of polychromatic irradiation because the actinometer and the test chemical are absorbingphoton irradiances at just one wavelength instead of over multiple wavelengths.
2. The main advantage in using polychromatic irradiation (filtered xenon arc lamp or sunlight)instead of monochromatic irradiation to determine the test chemical quantum yield is thatthe time required to determine the quantum yield may be substantially shorter (8). Thereason is due to the absorption of photon irradiances by the actinometer and test chemicalover multiple wavelengths instead of just one wavelength. The main disadvantage in usingpolychromatic irradiation to determine the test chemical quantum yield is that, unlike withmonochromatic irradiation (see equations 20 and 21 in the main text), its use requires thedetermination of the spectral photon irradiance.
3. The advantage in using sunlight instead of a filtered xenon arc lamp, if polychromatic irra-diation is used to determine the quantum yield, is that tables of average solar intensities asa function of season and latitude are readily available. Also, if sunlight is used, it eliminatesthe necessity of having a monochromatic or polychromatic artificial light source. However,if sunlight is used, an actinometer with an adjustable quantum yield is needed so the directphotolysis rate of the actinometer can be adjusted to be comparable to that of the test chem-ical under the same irradiation conditions (2) (12). Parallel exposure of the test chemicaland actinometer to sunlight over comparable time frames minimizes errors due to changes insolar irradiance caused by fog, varying cloud cover, etc. (12) (48).
4. An example of an adjustable quantum yield actinometer is the p-nitroacetophenone - pyridine(PNAP-PYR) actinometer (52). For a 1.0·10−5 M p-nitroacetophenone solution, the quantumyield of the actinometer in experiments carried out with monochromatic irradiation at 313nm can be adjusted by varying the concentration of pyridine in the solution according to thefollowing equation (2) (12):
Φact = 0.0169 · c(pyridine) (6-1)
where:
Φact = quantum yield of the 1.0 · 10−5 M p-nitroacetophenonec(pyridine) = molar concentration of pyridine
55

5. Suitable chemical actinometers used in aqueous photochemical studies include the following:
Actinometer System Literature
(a) p-nitroacetophenone/pyridine (52)(b) p-nitroanisole/pyridine (27), (52)(c) valerophenone (53)(d) ferrioxalate (32), (24), (37), (54), (55), (49)(e) o-nitrobenzaldehyde (37), (52)(f) Reinecke’s salt (12)(g) aberchrome 540 (56), (57)(h) azobenzene (58), (59)(i) oxalic acid/uranyl sulphate (8)
6. The first two actinometers listed in the above table have adjustable quantum yields and aretherefore particularly useful when solar irradiation is used (12). The first three actinometerslisted in the table are low optical density actinometers and the last four are high optical densityactinometers. The characteristics of those actinometers including the optimal wavelengthrange for their use are discussed in references (12) and (60). Other chemical actinometers aredescribed in the IUPAC document on chemical actinometers (60).
56

ANNEX 7Experimental setups
Many different experimental setups were published to investigate photolysis reactions in solution.A commonly used configuration is the ”merry-go-round” photochemical reactor. The first originalpublication from Moses (61) already describes the detailed setup, technical sketches can be foundin (54), and a general discussion of the application of a ”merry-go-round” apparatus in photolysisstudies can be found in (12) (54). Merry-go-round photochemical reactors are commercially avail-able (46) (47) and an apparatus used in practice is shown in Figure 2.
Figure 2: A typical ”merry-go-round” apparatus for the parallel photolysis of up to 10 cuvettes(l=1 cm, V=3.5 cm) using a xenon-light source.
57

The second most common apparatus in photolysis studies is an ”Optical Bench”. The principlesetup of an optical bench is for instance discussed in (12) and an example is shown in Figure 3.Further examples used in photolysis experiments in solution include setups for uniform irradiancesusing xenon light sources (45) (46), flow-through systems (39) and setups to trap volatiles (42) (62).A ”suntest” apparatus capable to photolyze also large volumes is shown in Figure 4. Numerousdesigns from different companies of this type of irradiation apparatus are on the market.
+
-
samplecompartment
monochromator adapter casing
lampcasing
{cooling water
nitrogen inabout 2 l/min
xenon light source
{cooling water
IR absorberwith quartz windows
quartz lensf = 115 mm
beamsplitter
variableslit
quartzlens
thermostatedcuvette
with stirrer
{
optionallight source
aperture
optical filter
diode
{optical feedback
power supply
water inIR absorber
cooling waterthermostat
nitrogen inabout 2 l/min
mirror
{
power supplystirrer
{
282 mm
188 mm 285 mm 508 mm
382 mm
99 mm
variableslit
Figure 3: Scheme of an ”Optical Bench” to investigate wavelength resolved photolysis reactionsusing a monochromator.
58

Figure 4: A ”Suntest” apparatus (Heraeus, Hanau, Germany) to investigate photolysis reactionsusing a xenon lamp as polychomatic light source.
59

ANNEX 8Examples
Illustrative examples of maximum direct photolysis rates kd(max) (equation 11 on page 18), pho-toreactions of the test chemical, determination of quantum yields using artificial light sources andsunlight are already available in (2) (12) (17) (18).
Example for Tier 1: Estimation of the maximum possible direct photolysis rateconstantMaximum possible direct photolysis rate constants kd(max) (equation 11) for four test chemicalsused in a region at latitude 40o with known highest concentrations in the environment in summerneed to be estimated. Average daily solar spectral photon irradiances (Lλ) for different seasonsand latitudes can be found for instance in (2) (12) (18). As example values of Lλ at 40o latitudefor summer for λ = 297.5 − 380 nm were taken from (2) and tabulated in Table 2.
Table 2: Wavelengths and average daily spectral solar photon irradiances (Lλ) at 40o latitude forthe summer season. Amount-based data were taken from (2), number-based data were calculateddividing Lλ by 6.02 · 1020. Lλ below 296.2 nm (start wavelength of the first wavelength interval) iszero and not shown.
Wavelength and intervals Daily solar spectral photon irradianceλcenter λstart λend ∆λ Lλ (on amount basis) Lλ (on number basis)
nm nm nm nm mmol cm−2 day−1 ∆nm−1 cm−2 day−1 ∆nm−1
297.5 296.2 298.7 2.5 6.17 · 10−5 3.72 · 1016
300.0 298.7 301.2 2.5 2.70 · 10−4 1.63 · 1017
302.5 301.2 303.7 2.5 8.30 · 10−4 5.00 · 1017
305.0 303.7 306.2 2.5 1.95 · 10−3 1.17 · 1018
307.5 306.2 308.7 2.5 3.74 · 10−3 2.25 · 1018
310.0 308.7 311.2 2.5 6.17 · 10−3 3.72 · 1018
312.5 311.2 313.7 2.5 9.07 · 10−3 5.46 · 1018
315.0 313.7 316.2 2.5 1.22 · 10−2 7.35 · 1018
317.5 316.2 318.7 2.5 1.55 · 10−2 9.33 · 1018
320.0 318.7 321.2 2.5 1.87 · 10−2 1.13 · 1019
323.1 321.2 325.0 3.8 3.35 · 10−2 2.02 · 1019
330.0 325.0 335.0 10.0 1.16 · 10−1 6.99 · 1019
340.0 335.0 345.0 10.0 1.46 · 10−1 8.79 · 1019
350.0 345.0 355.0 10.0 1.62 · 10−1 9.76 · 1019
360.0 355.0 365.0 10.0 1.79 · 10−1 1.08 · 1020
370.0 365.0 375.0 10.0 1.91 · 10−1 1.15 · 1020
380.0 375.0 385.0 10.0 2.04 · 10−1 1.23 · 1020
Mean values of molar absorption coefficients ελ(chem) of the four test chemicals A-D for the corre-sponding wavelength intervals summarized in Table 2 are shown in Table 3. The maximum value
60

Table 3: Wavelength, average daily solar spectral photon irradiances (Lλ) (40o latitude, summer,see Table 2), molar absorption coefficients ελ(chem) of 4 test chemicals A-D, and the correspondingproduct Lλ · ελ(chem).
λcenter Lλ ελ(chem)/M−1 cm−1 Lλ · ελ(chem)/day−1 ∆nm−1
nm mmol cm−2 day−1 ∆nm−1 A B C D A B C D297.5 7.83 · 10−6 0 2 430 10600 0 1.23 · 10−4 2.65 · 10−2 6.55 · 10−1
300.0 4.76 · 10−5 0 2 210 11100 0 5.40 · 10−4 5.67 · 10−2 2.98 · 100
302.5 1.89 · 10−4 0 2 100 11200 0 1.66 · 10−3 8.30 · 10−2 9.33 · 100
305.0 5.40 · 10−4 0 2 50 11400 0 3.90 · 10−3 9.75 · 10−2 2.23 · 101
307.5 1.19 · 10−3 0 0 30 11400 0 0 1.12 · 10−1 4.28 · 101
310.0 2.19 · 10−3 0 0 20 11200 0 0 1.23 · 10−1 6.92 · 101
312.5 3.47 · 10−3 0 0 5 11000 0 0 4.54 · 10−2 1.00 · 102
315.0 4.97 · 10−3 0 0 0 10500 0 0 0 1.28 · 102
317.5 6.57 · 10−3 0 0 0 9890 0 0 0 1.53 · 102
320.0 8.18 · 10−3 0 0 0 9380 0 0 0 1.75 · 102
323.1 1.51 · 10−2 0 0 0 8480 0 0 0 2.84 · 102
330.0 5.44 · 10−2 0 0 0 6200 0 0 0 7.19 · 102
340.0 7.09 · 10−2 0 0 0 3050 0 0 0 4.46 · 102
350.0 8.04 · 10−2 0 0 0 960 0 0 0 1.56 · 102
360.0 9.02 · 10−2 0 0 0 179 0 0 0 3.20 · 101
370.0 9.77 · 10−2 0 0 0 24 0 0 0 4.58 · 100
380.0 1.05 · 10−1 0 0 0 5 0 0 0 1.02 · 100
of the solar photolysis rate constant kd(max) (equation 11) is obtained with Φ = 1 from kd(solar) inequation 6.Summation in equation 6 and 11 needs to be performed from λinitial = 290 nm to λfinal = 800 nm.In the case of the data presented in Table 2 and 3 the initial wavelength is λinitial = 296.2 nm(wavelength interval ∆λ = 2.5 nm, centered at 297.5 nm), defined by the daily solar spectralphoton irradiances Lλ (Lλ = 0 for λ < 296.2 nm). The final wavelength is λinitial = 385 nm(wavelength interval ∆λ = 10 nm, centered at 380 nm), defined by the absorption spectrum (ελ(D))of test chemical D (ελ(D) = 0 for λ > 385 nm).
• Test chemical A should serve as the trivial example of a compound with molar absorptioncoefficients ελ(chem) = 0 for λ ≥ 290 nm.
• Test chemical B should serve as an example of a compound with (hypothetical) molar ab-sorption coefficients ελ(chem) = 2 above the 290 nm cutoff of solar irradiation at the earth’ssurface over at least 15 nm, satisfying the criterium in paragraph 67 on page 18.
• Test chemical C should serve as an example of a compound with a weak absorption below314 nm.
61

Table 4: Estimated maximum possible direct photolysis rate constants for the four test chemicalsA-D, half-life, % loss over 30 days solar radiation used as a trigger value for higher tiers and thecorresponding decision.
Value Test ChemicalA B C D
kd(max)/day−1 0 6.22 · 10−3 5.45 · 10−1 2.35 · 103
t1/2/days ∞ 111 1.3 0.00030% loss over 30 days solar 0 17 practically 100 practically 100
Decision Direct photolysis negligible Direct photolysis possibleInvestigate indirect photolysis Go to higher tiers
• Test chemical D should serve as an example of a compound with strong absorption below 400nm
Necessary products Lλ · ελ(chem) (see equation 11) of test chemicals A-D are given in Table 3.Maximum possible direct photolysis rate constants kd(max) (equation 11), half-lives (equation 4), %loss over 30 days solar (equation 8) used as a trigger value for higher tiers and the correspondingdecisions are summarized in Table 4 for test chemicals A-D.
Example for Tier 2: Experimental studyTest chemical C was photolyzed in a thermostated ”merry-go-round” (T=25 oC) with a xenon-light source in stoppered quartz cuvettes (light pathlength l=1 cm, V=3.5 ml) for 18 hours. Tencuvettes were used and after 2 hours irradiation time a cuvette was removed and test chemical Cwas analyzed, respectively. Start concentration of test chemical C was c0 = 1 · 10−5 M in a filtered(0.45µm) aqueous solution equilibrated for some days in the laboratory and thereby saturatedwith air at the beginning of the study at T = 25 oC. Analysis was performed by HPLC withoutany clean-up steps or enrichment using directly 1 ml of the solution, respectively. In parallel avessel with the same solution used in the photolysis experiment was wrapped with aluminum foiland stored in the dark at T=25 oC. This solution served as blank and was analyzed accordingly.Concentrations obtained are shown in Figure 5.A non-linear regression (see equation 2) leads to the rate constants for the dark (blank) experimentand photolysis experiment:
kdark = 0.019 h−1 (8-1)
kirradiated = 0.063 h−1 (8-2)
Using equation 12 the photolysis rate constant is:
62

Figure 5: Experimental results obtained from direct photolysis (bullets) and in corresponding darksamples (squares) of test chemical C. Non-linear regression (lines) leads to kdark = 0.019 h−1 andkirradiated = 0.063 h−1, respectively.
kd = kirradiated − kdark = 0.063 − 0.019 = 0.044 h−1 (8-3)
The incident filtered xenon arc lamp spectral photon irradiance I0λ(xenon), obtained by actinometry,is necessary (an example of an actinometric measurement is shown below) to estimate the directphotolysis rate constant for the test chemical in near surface, clear natural water exposed to averagedaily solar spectral photon irradiances Lλ (equation 13 in the body text on page 20):
kd(solar) =j
2.3Dcell
l
kd(xenon)
800∑290
ελLλ
800∑290
ελI0λ(xenon)
(8-4)
The corresponding data are summarized in Table 5 together with the molar absorption coefficientsof test chemical C (note the different molar absorption coefficients in Table 3 and Table 5 due tothe different wavelength intervals).Care has to be taken that the units of time are identical. Hence, in equation 13 (page 20) I0λ(xenon)
63
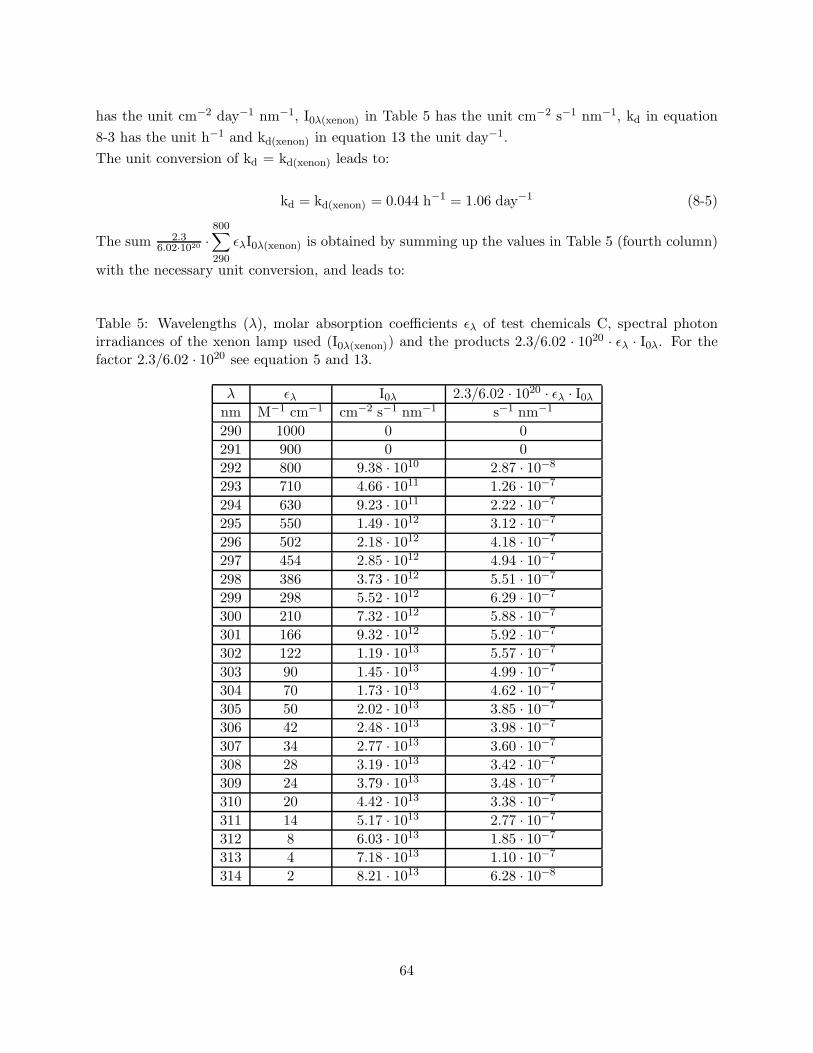
has the unit cm−2 day−1 nm−1, I0λ(xenon) in Table 5 has the unit cm−2 s−1 nm−1, kd in equation8-3 has the unit h−1 and kd(xenon) in equation 13 the unit day−1.The unit conversion of kd = kd(xenon) leads to:
kd = kd(xenon) = 0.044 h−1 = 1.06 day−1 (8-5)
The sum 2.36.02·1020 ·
800∑290
ελI0λ(xenon) is obtained by summing up the values in Table 5 (fourth column)
with the necessary unit conversion, and leads to:
Table 5: Wavelengths (λ), molar absorption coefficients ελ of test chemicals C, spectral photonirradiances of the xenon lamp used (I0λ(xenon)) and the products 2.3/6.02 · 1020 · ελ · I0λ. For thefactor 2.3/6.02 · 1020 see equation 5 and 13.
λ ελ I0λ 2.3/6.02 · 1020 · ελ · I0λ
nm M−1 cm−1 cm−2 s−1 nm−1 s−1 nm−1
290 1000 0 0291 900 0 0292 800 9.38 · 1010 2.87 · 10−8
293 710 4.66 · 1011 1.26 · 10−7
294 630 9.23 · 1011 2.22 · 10−7
295 550 1.49 · 1012 3.12 · 10−7
296 502 2.18 · 1012 4.18 · 10−7
297 454 2.85 · 1012 4.94 · 10−7
298 386 3.73 · 1012 5.51 · 10−7
299 298 5.52 · 1012 6.29 · 10−7
300 210 7.32 · 1012 5.88 · 10−7
301 166 9.32 · 1012 5.92 · 10−7
302 122 1.19 · 1013 5.57 · 10−7
303 90 1.45 · 1013 4.99 · 10−7
304 70 1.73 · 1013 4.62 · 10−7
305 50 2.02 · 1013 3.85 · 10−7
306 42 2.48 · 1013 3.98 · 10−7
307 34 2.77 · 1013 3.60 · 10−7
308 28 3.19 · 1013 3.42 · 10−7
309 24 3.79 · 1013 3.48 · 10−7
310 20 4.42 · 1013 3.38 · 10−7
311 14 5.17 · 1013 2.77 · 10−7
312 8 6.03 · 1013 1.85 · 10−7
313 4 7.18 · 1013 1.10 · 10−7
314 2 8.21 · 1013 6.28 · 10−8
64

2.36.02 · 1020
·800∑290
ελI0λ(xenon) = 8.28 · 10−5 s−1 = 7.15 day−1 (8-6)
To estimate the direct photolysis rate constant for test chemical C in near surface clear naturalwater at latitude 40o in summer the necessary sum
∑800290 ελLλ was already obtained (see Table 4):
800∑290
ελLλ = 0.545 day−1 (8-7)
Using equation 13 (with l = 1 cm and the assumption Dcell = 1 cm) the estimated direct photolysisrate constant for test chemical C in near surface clear natural water at latitude 40o in summer is:
kd(solar) =j
2.3Dcell
l
kd(xenon)
800∑290
ελLλ
800∑290
ελI0λ(xenon)
=1.06 · 0.545
7.15= 0.081 day−1 (8-8)
The % loss over 30 days solar (equation 8) with kd(solar) = 0.081 day−1 is 91%. Hence, as shownin Figure 1 and discussed in paragraph 18 (page 6), and paragraph 79 (page 21) the % loss of 91%is above the trigger value of 20% and an identification of major transformation products and anoptional determination of the quantum yield is necessary.
Determination of Quantum Yields (Optional)
Actinometry and Quantum Yield using a Monochromatic Light SourceThe direct photolysis rate constant of kdλ(chem) = 1.1 · 10−3 s−1 of a chemical E in aqueous solutionwas determined at λ = 313 nm on an optical bench in a quartz cuvette with dcell = 1 cm. Tensamples were irradiated and analyzed with a maximum irradiation time of 15 Minutes. Concen-trations were obtained by HPLC (with an uv-detector) and start concentration of chemical E wasc0(chem) = 3 · 10−6 mol L−1. Blank samples show no degradation in the dark and concentrationswere used without correction. The molar absorption coefficient in water at λ = 313 nm was foundto be ελ(chem) = 5500 M−1 cm−1. Hence, the maximum absorbance at 313 nm of chemical E wasA313(chem) = 0.0165 (”optical thin” solution). A corresponding actinometric measurement was per-formed with the same experimental setup using the iron oxalate actinometer (formation of Fe2+
from K3Fe(C2O4)3 · 3 H2O). Start concentration of the actinometer was c0(act) = 0.15 mol L−1
which leads to an absorbance of A313(act) � 2. The concentration of Fe2+ formed for differentirradiation times is shown in Figure 6.The slope of the line in Figure 6 leads to kdλ(act)(zero order) = 7.35·10−6 mol L−1 s−1. Using equation18 (paragraph 88, page 23) the quantum yield of chemical B at λ = 313 nm is therefore:
65
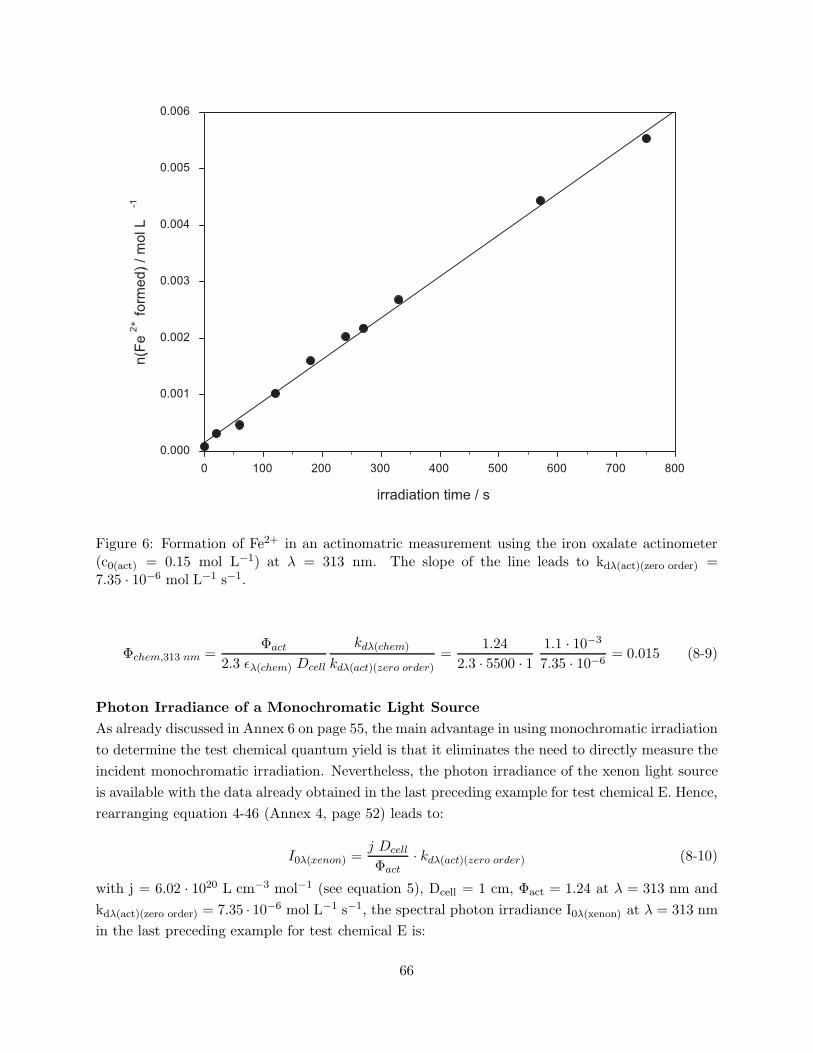
Figure 6: Formation of Fe2+ in an actinomatric measurement using the iron oxalate actinometer(c0(act) = 0.15 mol L−1) at λ = 313 nm. The slope of the line leads to kdλ(act)(zero order) =7.35 · 10−6 mol L−1 s−1.
Φchem,313 nm =Φact
2.3 ελ(chem) Dcell
kdλ(chem)
kdλ(act)(zero order)=
1.242.3 · 5500 · 1
1.1 · 10−3
7.35 · 10−6= 0.015 (8-9)
Photon Irradiance of a Monochromatic Light SourceAs already discussed in Annex 6 on page 55, the main advantage in using monochromatic irradiationto determine the test chemical quantum yield is that it eliminates the need to directly measure theincident monochromatic irradiation. Nevertheless, the photon irradiance of the xenon light sourceis available with the data already obtained in the last preceding example for test chemical E. Hence,rearranging equation 4-46 (Annex 4, page 52) leads to:
I0λ(xenon) =j Dcell
Φact· kdλ(act)(zero order) (8-10)
with j = 6.02 · 1020 L cm−3 mol−1 (see equation 5), Dcell = 1 cm, Φact = 1.24 at λ = 313 nm andkdλ(act)(zero order) = 7.35 · 10−6 mol L−1 s−1, the spectral photon irradiance I0λ(xenon) at λ = 313 nmin the last preceding example for test chemical E is:
66

I0λ(xenon) =6.02 · 1020 1
1.24· 7.35 · 10−6 = 3.57 · 1015 cm−2 s−1 nm−1 (8-11)
Quantum Yield using a Polychromatic Light SourceIf the spectral photon irradiance of a xenon light source is known at all wavelengths, as alreadydiscussed in the example for test chemical C on page 62, equation 5 can be used to calculate thequantum yield of a test chemical. Hence, rearranging equation 5 leads to:
Φ =j
2.3Dsys
l· kd
800∑290
ελ · I0λ
(8-12)
The mean quantum yield of test chemical C in the wavelength interval ∆λ = 292 − 314 nm canbe obtained using the values l = Dsys = 1 cm, kd(xenon, test chemical C) = 0.044 h−1 = 1.22 · 10−5 s−1
(page 64) and
2.36.02 · 1020
·800∑290
ελI0λ(xenon) = 7.15 day−1 = 8.28 · 10−5 s−1 (8-13)
Using equation 8-12 the quantum yield of test chemical C is therefore:
Φ =1.22 · 10−5
8.28 · 10−5= 0.15 (8-14)
67