Embed Size (px)
Citation preview

OECD DEVELOPMENT CENTRE
Working Paper No. 246
ECONOMIC GROWTHAND POVERTY REDUCTION:
MEASUREMENT AND POLICY ISSUES
by
Stephan Klasen
Research programme on:Social Institutions and Dialogue
September 2005DEV/DOC(2005)06

Economic Growth and Poverty Reduction: Measurement and Policy Issues DEV/DOC(2005)06
© OECD 2005 2
DEVELOPMENT CENTRE WORKING PAPERS
This series of working papers is intended to disseminate the Development Centre’s research findings rapidly among specialists in the field concerned. These papers are generally available in the original English or French, with a summary in the other language.
Comments on this paper would be welcome and should be sent to the OECD Development Centre, 2, rue André Pascal, 75775 PARIS CEDEX 16, France; or to [email protected]. Documents may be downloaded from: http://www.oecd.org/dev/wp or obtained via e-mail ([email protected]).
THE OPINIONS EXPRESSED AND ARGUMENTS EMPLOYED IN THIS DOCUMENT ARE THE SOLE RESPONSIBILITY OF THE AUTHOR
AND DO NOT NECESSARILY REFLECT THOSE OF THE OECD OR OF THE GOVERNMENTS OF ITS MEMBER COUNTRIES
CENTRE DE DÉVELOPPEMENT DOCUMENTS DE TRAVAIL
Cette série de documents de travail a pour but de diffuser rapidement auprès des spécialistes dans les domaines concernés les résultats des travaux de recherche du Centre de Développement. Ces documents ne sont disponibles que dans leur langue originale, anglais ou français ; un résumé du document est rédigé dans l’autre langue.
Tout commentaire relatif à ce document peut être adressé au Centre de Développement de l’OCDE, 2, rue André Pascal, 75775 PARIS CEDEX 16, France; ou à [email protected]. Les documents peuvent être téléchargés à partir de: http://www.oecd.org/dev/wp ou obtenus via le mél ([email protected]).
LES IDÉES EXPRIMÉES ET LES ARGUMENTS AVANCÉS DANS CE DOCUMENT SONT CEUX DE L’AUTEUR ET NE REFLÈTENT PAS NÉCESSAIREMENT CEUX DE L’OCDE OU DES GOUVERNEMENTS DE SES PAYS MEMBRES
Applications for permission to reproduce or translate all or part of this material should be made to: Head of Publications Service, OECD
2, rue André-Pascal, 75775 PARIS CEDEX 16, France
© OECD 2005

OECD Development Centre Working Paper No. 246 DEV/DOC(2005)06
© OECD 2005
3
TABLE OF CONTENTS
ACKNOWLEDGEMENTS.......................................................................................................................... 4
PREFACE ...................................................................................................................................................... 5
RÉSUMÉ........................................................................................................................................................ 6
SUMMARY ................................................................................................................................................... 7
I. INTRODUCTION..................................................................................................................................... 8
II. GROWTH, INEQUALITY AND POVERTY REDUCTION .............................................................. 9
III. MEASURING PRO-POOR GROWTH (INCOME DIMENSION)................................................. 11
III. MEASURING PRO-POOR GROWTH IN A NON-INCOME DIMENSION............................... 15
IV. CONCLUSION..................................................................................................................................... 23
BIBLIOGRAPHY........................................................................................................................................ 25
APPENDIX.................................................................................................................................................. 27
OTHER TITLES IN THE SERIES/ AUTRES TITRES DANS LA SÉRIE.............................................. 48

Economic Growth and Poverty Reduction: Measurement and Policy Issues DEV/DOC(2005)06
© OECD 2005 4
ACKNOWLEDGEMENTS
The author would like to thank Johannes Jütting, Bill Nicol, Dag Ehrenpreis, and participants at POVNET for helpful comments on an earlier draft. He is also grateful to Melanie Grosse and Ken Harttgen for their work on generating growth incidence curves for non-income indicators.

OECD Development Centre Working Paper No. 246 DEV/DOC(2005)06
© OECD 2005
5
PREFACE
Pro-poor growth aims at combining growth and social policies to achieve poverty reduction. Though economic growth is the basis for increasing national income, it does not necessarily result in better distribution or poverty reduction. Consequently, policies that merely concentrate on growth may only be looking at part of the development problem. To analyse these issues, the OECD’s Development Assistance Committee Poverty Network (POVNET) examines the elements of a pro-poor growth strategy and tries to identify the best policy mix to support it.
The Development Centre contributes to POVNET’s work by bringing its findings into the network’s discussions and by participating in its activities. Specifically, the Centre has considerable experience in analysing aspects of the non-income dimensions of poverty, including education, health, gender discrimination, and popular participation in decision making. This analysis is somewhat in contrast to most of the literature on measuring pro-poor growth, which only looks at income and thus ignores the multi-dimensional approach to poverty reduction as expressed, for example, in the Millennium Development Goals. There is consequently a manifest need to extend measurement of PPG and to adopt a multi-dimensional angle.
Stephan Klasen’s innovative work on how existing tools to quantify pro-poor growth (e.g. the growth incidence curve) can be used to measure progress in the area of nutrition, health and education is important for understanding the mechanisms and concepts of pro-poor growth. It is not only an original intellectual contribution, but can also be used in policy analysis. The results of the Bolivian case study clearly show that income and non-income indicators do not necessarily move in the same direction or at the same speed across the entire sample. Policies, which only focus on growth with the underlying assumption that improvements in the non-income dimensions will automatically follow, can turn out to be very inefficient and costly.
This type of analysis is central to our understanding of poverty reduction in all settings and forms an important part of the Development Centre’s 2005/2006 programme of work.
Prof. Louka T. Katseli
Director OECD Development Centre
15 September 2005

Economic Growth and Poverty Reduction: Measurement and Policy Issues DEV/DOC(2005)06
© OECD 2005 6
RÉSUMÉ
Ce document technique se propose d’élargir le débat sur « la croissance au bénéfice des pauvres ». Prendre exclusivement en compte le revenu comme dimension de la pauvreté néglige ses dimensions hors revenu. Après une étude des thèses en vue sur les liens entre croissance économique, inégalités et réduction de la pauvreté, l’article questionne la définition propre de « la croissance au bénéfice des pauvres » et la manière de la mesurer. La Bolivie présente un cas d’école illustrant l’utilité d’élargir les outils d’analyse de cette croissance aux dimensions hors revenu de la pauvreté, et elle offre de précieux nouveaux repères sur les différentes évolutions des deux sphères de la pauvreté. La croissance en Bolivie a davantage bénéficié aux pauvres dans le registre hors revenu que dans le registre du revenu. L’analyse développe qu’un recours aux outils d’une croissance bénéfique aux pauvres élargis aux dimensions hors revenu de la pauvreté améliore sensiblement notre compréhension des tendances des indicateurs de la sphère hors revenu. Une telle compréhension est fondamentale pour une appréciation judicieuse des liens entre pauvreté en matière de revenu et pauvreté hors revenu tout au long de la distribution du revenu global. C’est également important pour agir sur la pauvreté et pour définir des politiques d’intervention. Cette compréhension permet aussi d’approfondir en les comparant l’analyse des mérites relatifs de la croissance économique et des interventions directes visant à améliorer les paramètres hors revenu de la pauvreté.

OECD Development Centre Working Paper No. 246 DEV/DOC(2005)06
© OECD 2005
7
SUMMARY
The aim of this Working Paper is to broaden the debate on “pro-poor growth”. An exclusive focus on the income dimension of poverty has neglected the non-income dimensions. After an examination of prominent views on the linkages between economic growth, inequality, and poverty reduction this paper discusses the proper definition and measurement of pro-poor growth. Bolivia serves as a case study to illustrate the usefulness of applying the analytical toolbox for pro-poor growth to non-income dimensions of poverty and offers some important new insights about differences in the evolution of both poverty dimensions. Growth in Bolivia has been more pro-poor in the non-income than in the income dimension. The analysis furthermore shows that extending use of the pro-poor growth toolbox to non-income dimensions of poverty greatly improves our understanding of the trends in non-income indicators. Such understanding is pivotal for a careful assessment of the linkages between income and non-income poverty along the entire income distribution. It is equally important for poverty monitoring and for defining policy interventions. It also allows deeper analysis of the relative merits of economic growth, compared to direct intervention aimed at improving non-income dimensions of poverty.

Economic Growth and Poverty Reduction: Measurement and Policy Issues DEV/DOC(2005)06
© OECD 2005 8
I. INTRODUCTION1
The United Nations Millennium Development Goals (MDGs) have moved to the centre stage of the development debate and reducing poverty and deprivation has become a main challenge for policy makers, leading them to call for “pro-poor growth”. This concept considers both average income growth and changes in income inequality. Recent findings about the precise linkages between income growth, inequality and poverty reduction are spelt out in Section II, as are some conclusions about the determinants of pro-poor growth.
Ideally, pro-poor growth combines high growth of average income with inequality reduction (income, asset, and gender inequality) in order to have a maximum impact on poverty. While everyone would agree that this case is the first-best option, there is some debate whether (or to what extent) growth is still “pro poor” when it is only accompanied by one of the two conditions, high growth or inequality reduction. Section III will discuss these issues.
A somewhat unfortunate (and presumably unintended) side-effect of this debate has been that it is only focused on the income dimension of poverty, and thus exclusively concentrates on MDG 12. Although some may hope that achieving the income goal will also help attain other goals, this is far from guaranteed. Moreover, non-income dimensions of poverty (such as poor health and education) are intrinsically valuable as development goals (hence their status as separate MDGs, see also Sen, 1998; Klasen, 2000). Finally, progress on non-income dimensions might also help achieve MDG 1. Fortunately, the toolbox developed to assess pro-poor growth is not exclusively applicable to income poverty but can be extended to examine education-poverty, health-poverty, and the like. A second aim of the Working Paper will therefore be to illustrate the use of the pro-poor growth range of instruments for non-income dimensions of poverty. In particular, we will apply this panoply to analyse pro-poor growth in Bolivia in the dimensions of education, health, nutrition, and a composite indicator of well-being between 1989 and 1999 and compare it to pro-poor growth in the income dimension.
1. Stephan Klasen is from the University of Göttingen. 2. MDG 1 aims at the eradication of extreme poverty and hunger by halving the proportion of people who
live on less than a dollar a day and suffer from hunger.

OECD Development Centre Working Paper No. 246 DEV/DOC(2005)06
© OECD 2005
9
II. GROWTH, INEQUALITY AND POVERTY REDUCTION
Policy research has shown that the pace of poverty reduction will depend on the rate of average income growth, the initial level of inequality, and changes in the level of inequality (see, for example, World Bank, 2000; Bourguignon, 2003; Klasen, 2003). In particular, poverty reduction will be fastest in countries where average income growth is highest (see Dollar and Kraay, 2002), in countries where initial inequality is lowest (see World Bank, 2000), and in situations where income growth is combined with falling inequality (see Bourguignon, 2003). There thus is a pay-off in poverty reduction from growth, but also of lower initial inequality and reductions in inequality during the growth process. In addition, there appear to be links between initial (income or asset) inequality and growth. The majority of studies seems to suggest that high initial inequality is harmful for overall economic growth, and thus for poverty reduction, at least in environments of very high (income or asset) inequality (see, for example, World Bank, 2000; Deininiger and Squire, 1998; Klasen, 2003; Ravallion, 2000). Similar results appear to hold true for gender inequality, particularly gender inequality in education (Klasen, 2002; Knowles et al., 2002; World Bank, 2001). There consequently is a triple pay-off to lowering inequality: it reduces poverty immediately, it increases the poverty elasticity of growth, and it appears to increase economic growth.
The growth-enhancing effects of lowering inequality have been found using cross-country analysis (investigating the impact of initial inequality on subsequent economic growth, for example, Deininger and Squire, 1998). They confirm that different levels of inequality between countries have growth implications. They do not, however, necessarily imply that redistribution (i.e. changes in inequality within a country) will necessarily have a growth-enhancing effect. In fact, there are findings that suggest that redistribution can lower subsequent growth in the short-term (see, for example, Forbes 2000; Banerjee and Duflo, 2003). However, these findings are subject to methodological problems and are based on very weak data so that this important policy question (namely the impact of redistribution on growth) remains unanswered (see Klasen, 2003). This is largely due to the fact that there have been very few significant changes in inequality so that we do not have enough data points on which to base our assessment (see, for example, Forbes, 2000; Lundberg and Squire, 2003; Klasen, 2003; Banerjee and Duflo, 2003) 3.
3. A recently completed country case study of Bolivia (as part of the OPPG project) suggests that short-
term trade-offs exist for certain policies while other policies improve growth and distribution. See Klasen et al. (2004).
Economic Growth and Poverty Reduction: Measurement and Policy Issues DEV/DOC(2005)06
© OECD 2005 10
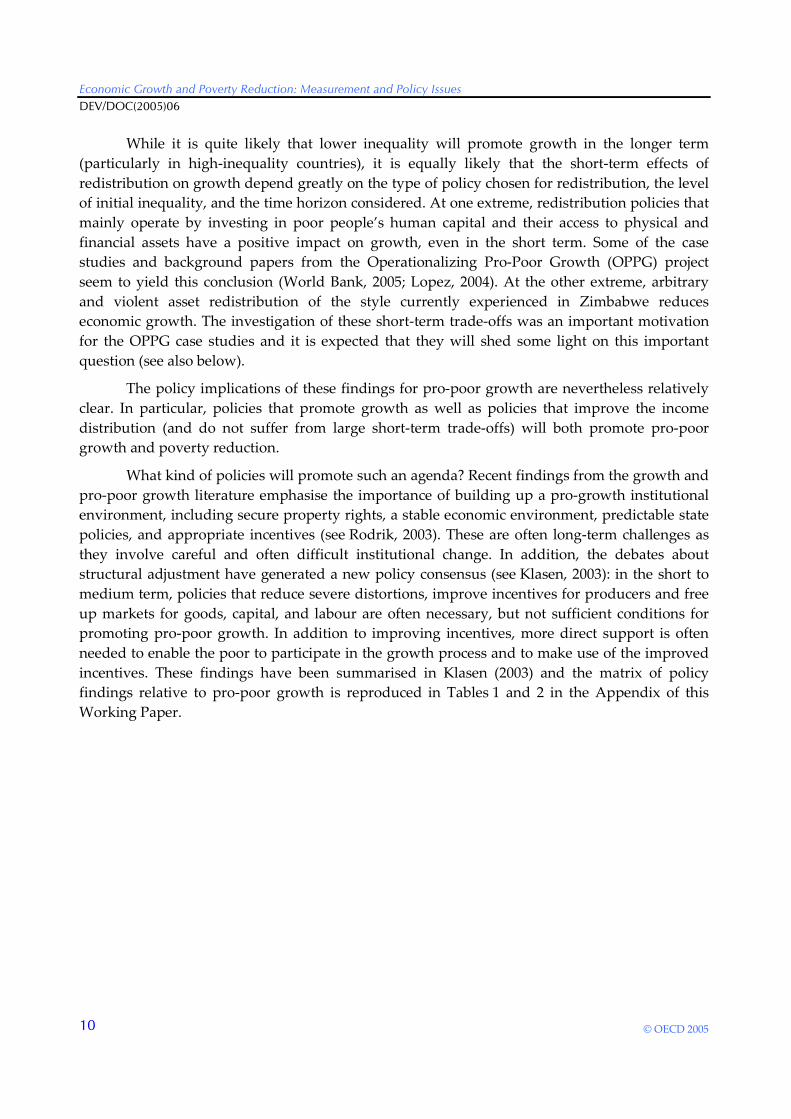
While it is quite likely that lower inequality will promote growth in the longer term (particularly in high-inequality countries), it is equally likely that the short-term effects of redistribution on growth depend greatly on the type of policy chosen for redistribution, the level of initial inequality, and the time horizon considered. At one extreme, redistribution policies that mainly operate by investing in poor people’s human capital and their access to physical and financial assets have a positive impact on growth, even in the short term. Some of the case studies and background papers from the Operationalizing Pro-Poor Growth (OPPG) project seem to yield this conclusion (World Bank, 2005; Lopez, 2004). At the other extreme, arbitrary and violent asset redistribution of the style currently experienced in Zimbabwe reduces economic growth. The investigation of these short-term trade-offs was an important motivation for the OPPG case studies and it is expected that they will shed some light on this important question (see also below).
The policy implications of these findings for pro-poor growth are nevertheless relatively clear. In particular, policies that promote growth as well as policies that improve the income distribution (and do not suffer from large short-term trade-offs) will both promote pro-poor growth and poverty reduction.
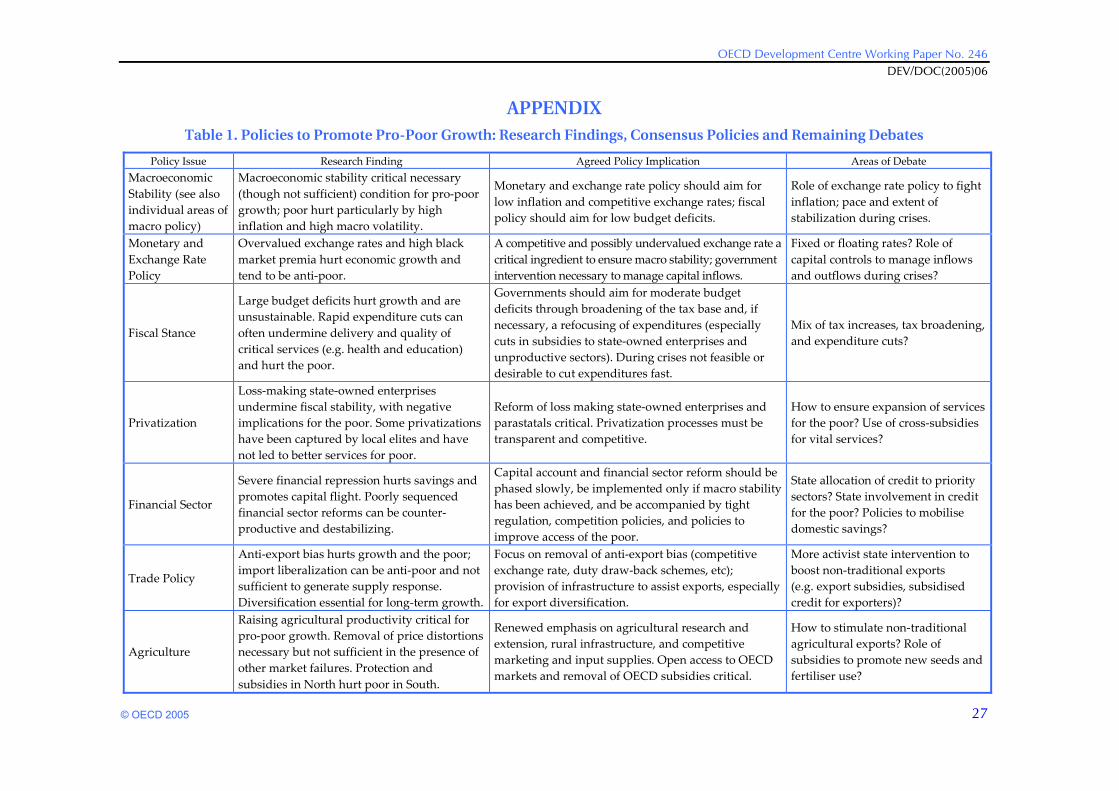
What kind of policies will promote such an agenda? Recent findings from the growth and pro-poor growth literature emphasise the importance of building up a pro-growth institutional environment, including secure property rights, a stable economic environment, predictable state policies, and appropriate incentives (see Rodrik, 2003). These are often long-term challenges as they involve careful and often difficult institutional change. In addition, the debates about structural adjustment have generated a new policy consensus (see Klasen, 2003): in the short to medium term, policies that reduce severe distortions, improve incentives for producers and free up markets for goods, capital, and labour are often necessary, but not sufficient conditions for promoting pro-poor growth. In addition to improving incentives, more direct support is often needed to enable the poor to participate in the growth process and to make use of the improved incentives. These findings have been summarised in Klasen (2003) and the matrix of policy findings relative to pro-poor growth is reproduced in Tables 1 and 2 in the Appendix of this Working Paper.

OECD Development Centre Working Paper No. 246 DEV/DOC(2005)06
© OECD 2005
11
III. MEASURING PRO-POOR GROWTH (INCOME DIMENSION)
Despite an emerging consensus on the relationship between growth, inequality and poverty reduction, there continues to be significant debate on how to conceptualise and measure pro-poor growth. While there are a number of definitions that have been proposed for pro-poor growth which differ along several dimensions (see, for example, Ravallion and Chen, 2003; Son, 2004; Kakwani and Pernia, 2000; Hanmer and Booth, 2001; McCulloch and Baulch, 1999; White and Anderson, 2000; Klasen, 2003; Duclos and Wodon, 2004), in the policy community the debate seems to have boiled down to an “absolute” and “relative” camp (see OECD, 2004). The “relative” camp is easier to characterise. It suggests that growth can only be called pro poor if the growth rate of income of the poor (suitably aggregated) exceeds the average income growth rate. In other words, growth needs to have a relative bias to the poor in the sense that the income growth of the poor exceeds the average4. The main justification for this type of approach is that, based on the research findings mentioned in the introduction, if one succeeds with biasing growth in this relative sense and (holding average growth constant), this will lead to faster poverty reduction. As mentioned for example by Datt and Ravallion (2002) on India, poverty reduction would have been faster if India had succeeded in biasing its relatively high growth during the 1990s more towards the poor (or at least the states where the poor are concentrated; see also Ravallion and Datt, 2002). One could, of course, also defend such an approach by arguing that pro-poor growth in this sense means that inequality must have been reduced (at least inequality between the poor and the non-poor. Such argumentation might be of value in its own right as suggested by many ethical and empirical approaches to welfare measurement (see Grün and Klasen, 2003)5.
As far as the “absolute” camp is concerned, there are two different kinds of “absolutes” one could have in mind. One is to say that growth is pro poor only if the absolute income-gain of the poor is larger than those on average (or those of the rich). This would be “strong absolute” pro-poor growth. As shown empirically by White and Anderson (2000), this would be a rather difficult requirement to meet as it would mean that the growth rate of the poor would have to be larger by a factor calculated as the initial income ratio of the non-poor to the poor. Thus, growth 4. There are complications here as well such as the question whether growth for every poor group (or
every poor quantile) must have exceeded average growth, or whether this is only true in average (see Duclos and Wodon, 2004 for a discussion and proposed axioms to resolve it).
5. Clear members of this camp are the contributions by Kakwani and Pernia (2000), McCulloch and Baulch (1999), and both the suggestions by Klasen (2003) as well as by Ravallion and Chen (2003) can be interpreted in this way, as well, if one compares their proposed rates of pro-poor growth with the average growth rate.

Economic Growth and Poverty Reduction: Measurement and Policy Issues DEV/DOC(2005)06
© OECD 2005 12
must be biased a lot more in favour of the poor than proposed by the “relative” definition. While in practice hard to achieve, such definition has recently gained some proponents who argue that we too often think of inequality in relative terms and disregard that absolute inequality might be widening even if relative inequality is shrinking (see Atkinson and Brandolini, 2004; Duclos and Wodon, 2004; Klasen, 2003). As will be discussed below in some more detail, this absolute approach may be particularly suitable for assessing pro-poor growth in the non-income dimension. For example, while we might agree that 5 per cent growth for the poor is “pro poor” if it exceeds the average rate of 4 per cent even though the latter is much larger in absolute magnitudes, translating this to improvements in education sounds quite different. To illustrate this idea: it would be hard to argue that a 20 per cent increase in years of schooling is pro poor (because the increase of the non-poor was, say, only 10 per cent) if education of the poor only expanded by a quarter of a year and that of the non-poor by a year.
The other “absolute”, which has been the focus of much policy discussion, goes in an entirely different direction and suggests that we can speak of pro-poor growth if the growth rate of the poor (suitably aggregated) is greater than 0 (see OECD, 2004). One may call this “weak absolute” pro-poor growth. The main argument in support of this view is that, in the end, all that matters for poverty reduction is high income growth for the poor, not how that growth compares to the growth of the non-poor. The empirical argument used is that high but inequality-increasing growth in a country such as China over the past ten years should be viewed as preferable to low but equitable growth in a country such as Ghana, if the absolute income increases of the poor are larger in the former than in the latter. On the other hand, taking this argument to the extreme could be quite problematic (see World Bank, 2005). Arguing that any income growth of the poor is pro poor even if it was much lower than average income growth (and thus distribution worsened) seems to hark back to old notions that all that is needed is some “trickling down”6.
Table A below summarises the different measurements and illustrates the strength of the respective arguments (see also World Bank, 2005 for a related discussion). It shows a country where, in the initial situation, the poor earn $100 and the rich $500 on a per capita basis. In year 1, the incomes of the poor grow by 3 per cent while those of the non-poor grow by 2 per cent. This is pro-poor growth in the relative, and the weak absolute sense. In year 2, the incomes of the poor grow by 1 per cent, those of the non-poor by 10 per cent. Only under the weak absolute definition would this be called pro-poor growth, which nicely illustrates the weakness of this definition in that hardly any of the fruits of growth have trickled down to the poor. In year 3, the incomes of the poor grow by 6 per cent and those of the rich by 9 per cent. A comparison with year 1 shows the advantages of the weak absolute definition. In year 3 the poor gain a lot more than in year 1, yet only the weak absolute definition would call this situation “pro poor”. Instead, it would be called “anti-poor” in the relative definition (while lower growth in year 1 had been called pro poor using that definition). In year 4, not only do the poor enjoy the relative income gains, but also their absolute gains exceed those of the non–poor (20 versus 15). This would be a situation of relative, weak and strong absolute pro-poor growth, as the poor gain absolutely 6. If focusing on the level of pro-poor growth, the proposal by Ravallion and Chen (2003) as well as that of
Klasen (2003) would fit into that camp.

OECD Development Centre Working Paper No. 246 DEV/DOC(2005)06
© OECD 2005
13
more than the rich. Given that this situation requires an income growth rate of the poor of 18 per cent (compared to 2 per cent for the non-poor), it nicely illustrates how difficult it is to achieve pro-poor growth using the strong absolute definition.
Table A. Different Versions of Pro-Poor Growth: Some Illustrations
Year Poor Growth (%) Non-Poor Growth (%) Pro Poor? 0 100 500 1 103 3 510 2 relative, weak absolute 2 104 1 560 10 weak absolute 3 110 6 610 9 weak absolute 4 130 18 625 2 relative, weak absolute, strong absolute
Ultimately, it appears that the question underlying this debate is whether there is a trade off between growth and inequality reduction, an issue already discussed in Section II. If there are ways to reduce inequality without compromising average income growth (or even enhancing it), then it is perfectly plausible to say that, for example, China could have had higher poverty reduction in the 1990s if it had pursued policies that would have prevented the rise in inequality without compromising its overall growth rate. This would therefore argue for a relative definition. If, however, reducing inequality will invariably have a negative growth effect, then the thought experiment underlying the relative definition (i.e. if growth had been accompanied by inequality reduction, there would have been more poverty reduction) does not make any sense as inequality reduction would have led to smaller growth (and thus smaller poverty reduction). As discussed above, we know relatively little about such trade offs (in the short or long term, in different countries, associated with different policies) which should be a major focus of policy research7.
From a policy point of view, it may be best not to get bogged down in these definitional issues, but to use an operational approach that is closely aligned to the policy goals regarding poverty reduction, which is the first MDG. In order to maximise poverty reduction, one wants to maximise the rate of income growth among the poor. Maximising the Ravallion-Chen (2003) rate of pro-poor growth would be a useful indicator for that, which averages the income growth rates
7. There really is no need to choose between this weak absolute and the relative version of the definition
but it is instead useful to combine the two as they seem to be answers to two different questions. If the question is whether growth has been pro-poor or not, it appears plausible to stick to the relative definition as one would presume pro-poor involves some bias in favour of the poor. It also gives us a sense of how much the opportunities afforded by a given rate of growth have been used to reduce poverty. If the question is about the rate of income growth of the poor, then some aggregation of the income-growth rate of the poor, such as the one inherent in the Ravallion and Chen measure would give the answer. It would then tell us how much the poor were benefiting from whatever growth happened to be in a country. Thus one could usefully make a distinction between the existence of pro poor growth, measured in the relative sense and the rate of poverty-relevant growth using an absolute measure. As shown below, one can nicely illustrate this intuition by examining the shape and position of growth incidence curves for the income and non-income dimensions.

Economic Growth and Poverty Reduction: Measurement and Policy Issues DEV/DOC(2005)06
© OECD 2005 14
of the centiles of the income distribution that were poor in the initial period8. While this approach implicitly9 follows the “weak absolute” definition, it is clear from the discussion above that maximising the Ravallion-Chen rate of pro-poor growth will be greatly enhanced if growth was also pro poor in the relative or strong absolute sense. In these cases, the growth was accompanied by declining inequality and thus has a larger impact on the incomes of the poor, which then increases the Ravallion-Chen rate of pro-poor growth. Even if we chose a policy target based on a “weak absolute” definition for pro-poor growth, striving for pro-poor growth in a relative (or even strong absolute sense) will help us achieve our target.
8. If MDG 1 is interpreted in its literal meaning, i.e. reduction of the headcount ratio by half, maximising
the Ravallion-Chen indicator is not the best policy option. Instead, one would want to merely maximise the income growth rate of the poor who are close to the poverty line, and safely ignore those far below. If MDG 1 is interpreted more broadly as broad poverty reduction, then the Ravallion-Chen measure is a useful tool.
9. If one compared the Ravallion-Chen rate of pro-poor growth with the average income growth rate, it can also be used for an assessment of pro-poor growth in the relative definition.

OECD Development Centre Working Paper No. 246 DEV/DOC(2005)06
© OECD 2005
15
III. MEASURING PRO-POOR GROWTH IN A NON-INCOME DIMENSION
So far, the discussion (including the entire literature on pro-poor growth) has focused exclusively on the income dimension. This is highly lamentable as this debate has therefore effectively narrowed to the income dimension of poverty and MDG 1, thereby neglecting all the progress made in taking a broader view of poverty which considers the non-income dimensions as well (see World Bank, 2000; Sen 1998). For example, all the OPPG case studies were explicitly charged to focus exclusively on pro-poor growth in the income dimension; all other non-income dimensions, on the other hand, were only of interest to the extent that they relate to the income poverty focus. This is also quite contrary to the spirit of the MDGs which consider non-income dimensions of well-being (particularly education, health and gender equity) as being of equal importance to income poverty.
There are three further reasons to explore measuring pro-poor growth in the non-income dimension. One great methodological advantage of the pro-poor growth debate has been the use of the growth incidence curve. This curve plots the income growth by centile of the population and thus allows policy makers to track changes along the entire income distribution. In contrast, progress towards non-income goals is usually monitored by looking at mean achievement levels (e.g. mortality or enrolment rates) while this neglects important dimension of examining the distribution of changes in achievement. Extending the methods from the pro-poor growth literature to non-income dimensions thus offers new insights for policy makers concerned about tracking the non-income MDGs (particularly MDGs 2-610). Secondly, it allows careful consideration of relationships between income and non-income dimensions of poverty along the entire distribution. Thus, we can learn whether achieving income poverty and health poverty goals are complementary along the entire distribution, or whether one needs to tackle the two separately at some point in the distribution (e.g. the very poor). This will also give some guidance regarding the respective roles of income growth versus direct intervention to make progress in these non-income MDGs.
Third, the income poverty measure is particularly weak in measuring gender differentials as it is usually based on household incomes and says little about the distribution of that income (see, for example, Klasen, 2004; Klasen, 2005). Looking at the non-income measures of well being allows policy makers to track progress by gender along the entire distribution which is impossible using income indicators. Thus, it is worth exploring to what extent the toolbox developed for pro-poor growth can be applied to non-income dimensions of poverty.
10. MDGs 2-6 concern education, gender equality, child mortality, maternal health, and diseases such as
HIV/AIDS and malaria.

Economic Growth and Poverty Reduction: Measurement and Policy Issues DEV/DOC(2005)06
© OECD 2005 16
Fortunately, it is perfectly possible to extend the pro-poor growth toolbox to non-income measures of poverty. Below, we will illustrate this using the Ravallion and Chen (2003) approach and applying it, for purely illustrative purposes, to non-income indicators in Bolivia between 1989 and 199911. The purpose of this Section, which is based on an input paper by Grosse and Harttgen (2004) that was specifically written for this study, is to examine whether this yields new insights into the performance of non-income indicators as well as their connection to income measures.
As with the income measures, we use the growth incidence curve (GIC) as the basic building block for the analysis and then calculate pro-poor growth rates using the Ravallion and Chen (2003) approach. We consider growth incidence curves for education, child survival, child vaccination, nutrition, and a composite welfare index made up of these components. The data we use are from the 1989 and 1998 Demographic and Health Survey for Bolivia. As income data are not available in that survey, they have been added using methods described in detail in Klasen et al. (2004)12. We will always present two kinds of GICs, which we call unconditional and conditional GICs, and also calculate the respective pro-poor growth rates. In the unconditional indicator, we will line up centiles according to the non-income indicator in question, e.g. from the education-poor to the education-rich, and then plot the growth of education on the y-axis. In the conditional GIC, we will line up centiles according to their per capita income, but also plot the growth of the non-income indicator on the y-axis to see how their non-income growth compares to their income growth.
A number of problems and issues need to be solved when designing growth incidence curves in these non-income dimensions. Beginning with education, our basic indicator is the average years of schooling of respondents (all of whom are women aged 15-49) and their partners in a household. A potential problem with this indicator is that it has a considerable amount of in-built inertia which is less of a problem when one considers household incomes. As most people do not accumulate more years of schooling once they reach about 25, 30 year-old women in 1989 (who will be 39 years old in 1998) will not change in their education level so that virtually all change will come from a replacement of older cohorts by younger cohorts. In order to reduce this problem, we also do an analysis where we simply concentrate on the education of female respondents who are 20-30 years old in both surveys. Secondly, while from a welfare point of view the education of all members of the household is relevant, for the economic opportunities of the household, the education of the best educated member may be most relevant
11. As the OPPG case studies were entirely focused on income poverty, what we present here
complements our analysis done in that process. 12. The imputation is based on an adaptation of the poverty mapping methodology used by the World
Bank. For details, refer to Klasen et al. (2004). The results are not entirely in agreement with the results in Klasen et al. (2004) as there we used another survey for the final year, but the analysis here is purely for illustrative purposes and not meant to focus particularly on Bolivia. The data base has the advantage of containing detailed non-income data. It has the disadvantage that this data is only available for selected members of the household. For example, education is not available for children living in the household, and nutrition, immunisation, and survival information is only available for children.

OECD Development Centre Working Paper No. 246 DEV/DOC(2005)06
© OECD 2005
17
(Basu and Forster, 1998). Thus, we also use the maximum education of all adult members of the household and of respondents aged 20-30 in both survey years. Third, we will consider percentage increases in years of schooling (analogously to the income growth rate) but also absolute increases in the years of schooling. It may be of little consolation to the poor that their years of schooling expanded by 30 per cent if that means going from an average of 0.5 years to an average of 0.65 years. Examining the absolute increases will help us to see whether education growth was pro poor in the absolute sense. Fourth, there are two issues which we can do very little about. One is that a priori it is not clear if one can treat years of education in a similar cardinal fashion as income. For example, the increase from one year to two years of education may do little if that means a person is still illiterate. On the other hand, an increase from five years to completed primary (six years) education might be much more valuable. Also, we only measure years of schooling, but ignore educational quality. This last problem could, in principle, be remedied with better data (such as test scores that are comparable over time and linked to household income data).
Matters are more difficult with the survival indicator. We use the one-year and five-year survival probability (the inverse of the infant and under five mortality rates) as well as the vaccination rate (of eight possible vaccinations against polio, DPT and measles) of children 1-5 years old13 as our indicators. The first problem is that it is difficult to devise a reliable survival indicator at the household level. Mortality probabilities within households are relatively low and contain a lot of randomness. In our sample, fewer than 10 per cent of households had experienced the death of a child before age 5. As a result, the unconditional growth incidence curve for the richest nine deciles will be flat as there is no change in survival in these households in either period. Thus, they will not yield very interesting information in those ranges and all action is in the first quintile, but it is still useful to examine the conditional growth incidence curves as they show how mortality is linked to incomes. The problem is similar, but somewhat less acute, with vaccination rates. There, children in the top three deciles have all eight vaccinations (for polio, DPT and measles) in both years and thus no potential for further growth. The conditional growth incidence curves (sorted by incomes) might also be more interesting here than the unconditional ones.
As far as nutrition is concerned, we use the average height for age Z-score of the last born child between 1-5 years in a household, as an indicator of stunting or chronic under-nutrition14. With this indicator we first face the problem that the Z-Score ranges from about -6 to +6. We remedy this in the calculation of growth incidence curves by simply adding the lowest Z-score in both data-sets to all Z-Scores to get strictly positive numbers. Two substantive problems remain. First, the Z-score is a purely probabilistic assessment of nutritional status. While it is most likely 13. We only include one-year old children as the usual vaccination schedule of eight vaccinations is only
complete at about 9-12 months. We have to stop at age 5 as data for older children is not available. 14. The Z-score is calculated as the actual height of a child at a certain age minus the median of the
reference population (the WHO reference standard), divided by the standard deviation of the reference population. We only include children over age 1 as stunting usually does not set until about 6-12 months. There will remain an age bias problem as 1-year old children are, on average, less stunted than 3-4 year old children.

Economic Growth and Poverty Reduction: Measurement and Policy Issues DEV/DOC(2005)06
© OECD 2005 18
that a low Z-score is due to nutritional problems, individual children might have small Z-scores simply because they have genetically short parents15. Conversely, chronically malnourished children might appear to be well simply due to the fact they have genetically taller parents. This can influence the ranking of households and thus make the interpretation more difficult. Lastly, it is not clear that nutritional status linearly improves with the score. In fact, children above a Z-score of 2 are extremely tall for their age and it is unclear that they are any better off than children with a Z-Score of 016. The nutrition indicator consequently also has to be treated with some caution.
The composite welfare indicator combines years of schooling, the survival rate to age 1, the average vaccination rate of children 1-5, and the stunting Z-score for the last born child, age 1-517. The indicator is created in a similar manner to the Human Development Index by subtracting an individual value from the minimum value observed in the dataset and dividing it by the range observed in the dataset18. The scores for the remaining four indicators19 that are normalised to the range of 0 to 1 are then simply averaged. Here, all the advantages and disadvantages of composite indicators come into play which we do not need to discuss at this point. We mainly use it to get a summary assessment and to deal with some of the difficulties associated with the health and nutrition indicators. A particular difficulty with using such a composite measure at the household level is that the data is not available for all indicators in each household. Either the sample has to be cut significantly and in a non-random fashion (which we call the “small sample” in the tables), or the composite score has to be generated using fewer indicators in some households (which we do in the “big sample”).
The results of the illustrative analysis are shown in Tables 3-8 and the associated Growth Incidence Curves are shown in Figures 1-13. Tables 3 and 4 show descriptive statistics for the income and non-income indicators by decile in Bolivia where the deciles are sorted according to the relevant non-income indicator in Table 3 and the income indicator in Table 4. Some points of value emerge. First, the disparity in the income indicator is larger than all non-income indicators. While the ratio from the tenth to the first decile in incomes is nearly 40:1, it is about 30:1 for the education indicators, only 4:1 for the nutrition indicator, and much lower than 2 for the mortality indicator20. This is partly related to the fact that, contrary to the income indicator, many of the non-income indicators are bounded; i.e. it is impossible to have more than a 100 per cent survival rate and not useful to have more than eight vaccinations. While education is, in principle,
15. For a related discussion, see Klasen (1999). 16. One could just treat all Z-scores over 0 as well-nourished and just consider those with numbers below 0
as undernourished. This is currently under investigation. 17. We also report results for a composite welfare indicator including income as a sixth component. 18. The HDI does not use maxima and minima defined by the data but uses “fixed” goalposts instead. For
our illustrative purposes, it seems better to use the entire variation of the data and thus use the goal posts implicit in the data.
19. The survival rate and the average vaccination rate form a sub-index for health calculated as the simple average of the scores for survival rate and average vaccination rate.
20. Given that the poorest deciles sorted by vaccination had 0 vaccinations in 1989, the ratio is not defined.

OECD Development Centre Working Paper No. 246 DEV/DOC(2005)06
© OECD 2005
19
unbounded, in practice there are limits to the number of years of schooling a person might want to acquire. With indicators that are bounded, inequality is likely to be lower as the rich have already reached the upper limit and the poor are moving towards it. This can explain some (but not all) of the smaller differences in non-income indicators21.
Second, in all income and non-income indicators, there has been an improvement in all deciles. In the education and health indicators, the improvements are particularly noticeable at the lower end, suggesting that improvements were percolating down to these groups. This last point need not be true in other places, in which overall education and health achievements are much lower and improvements might be larger for richer groups. For example, it is quite likely that the situation in some African countries looks much worse where particularly poorer sections of the population have suffered the most from overall declining education opportunities and health care access22. In such an analysis for a range of African it countries would therefore be most interesting to see how the shape of the non-income GICs differs from the ones presented here.
Third, Table 4 suggests that there is a considerable differential in some non-income indicators (especially health, nutrition and education) when households are sorted by the income indicator. The disparity is much smaller than in Table 3, suggesting that some households, which are income-poor, are not doing so badly on some non-income dimensions (see also Klasen, 2000); in the case of the survival indicator, the differences are very small (and non-existent for the under 1 survival rate). One needs to be careful when drawing policy implications from these findings. While it is clear that there is a relatively close (but far from perfect) correlation between income poverty and education poverty (and much less so between income poverty and health or nutrition poverty), this does not say anything about causality nor does it necessarily imply that income growth is the only or even the first-best policy strategy to ensure that education poverty is reduced. In particular, the correlation could be due to reverse causation (educated people are richer), or pro-rich education policies which give more education benefits (in terms of quantity or quality) to richer population groups. In the Bolivian case, there is support for both these arguments (see Klasen et al., 2004). These findings could consequently be used to make a case for focusing public resources and interventions in the education sector precisely to weaken the observed linkages between income and education growth.
Table 5 shows Gini coefficients and correlations between the income and the non-income indicators. Following from the above, Gini coefficients in non-income achievements are considerably smaller than those of the income indicator. In the case of mortality, they are very small due to the low incidence of mortality concentrated in some households. Gini-coefficients have also decreased significantly in education, vaccination and nutrition indicators, while the
21. The impact of bounded variables will also depend on the situation in the country. In a poor country
where the rich are still far away from the upper bound, the existence of the upper bound should not affect inequality and thus this bias would not be relevant.
22. Also, one would imagine that in a country with poor overall education achievements, advances in education initially favour the rich and then trickle down to other groups. As Bolivia happens to be more advanced here, we are in a stage where the poor are catching up to the rich.

Economic Growth and Poverty Reduction: Measurement and Policy Issues DEV/DOC(2005)06
© OECD 2005 20
improvement is much smaller in the income indicator. While there are positive and significant correlations between income and non-income indicators, they are smallest for the health components suggesting the randomness of mortality outcomes. On the other hand, they are largest for education and the composite welfare indices (see also Klasen, 2000).
Figure 1 shows a growth incidence curve for the income indicator (GIC) and an unconditional and (original and smoothed) conditional average educational growth incidence curve (NIGIC), calculated as the average education of the (female) respondent and her partner. Figure 2 shows the same, but now plotting absolute increases rather than growth rates. In line with the discussions of Section I, the curves can be interpreted as follows. If they are downward sloping, they indicate pro-poor growth in the relative dimension; i.e. the growth rates of the poor exceeded those of the non-poor. If the curve is downward-sloping even when absolute improvements (rather than rates) are shown (Figure 2), then growth was absolutely larger for the poor than the non-poor, which consequently meets the “strong absolute” criterion. If they are above 0 among the poor (in either Figure), the growth could be called pro poor according to the “weak absolute” definition.
Following findings are noteworthy. First, according to the income indicator, there seems to have been considerable pro-poor growth using both the relative and the weak absolute criterion (Figure 1). When switching to the education indicator, growth was also strongly pro poor using the relative and the weak absolute criterion. This is not true for the least educated households whose adult members have no education at all in the first and the second period. As indicated by the absolute NIGIC in Figure 2, this affects the 2 per cent worst-educated households23.
The educational growth rates of the education-poor (above the worst-off 6-7 per cent) have indeed been very high. However, this is largely related to the low base from which they have started. This aspect is brought out nicely by comparing the curves showing absolute and percentage increases in education in Figure 2. The absolute educational growth incidence curve is essentially flat, suggesting that the education poor have not been able to expand their education by more than the rich; in fact, by slightly less. Education growth has therefore not been pro poor in this strong absolute sense. The same is true, in much more dramatic fashion, for income growth. Figure 2 shows that the income GIC is upward sloping, suggesting that the absolute increments of incomes of the rich were much larger than those of the poor so that growth was pro rich in the strong absolute sense. Figure 1 also shows the educational growth incidence curve when households are sorted by income. That curve is much more volatile, but still shows pro-poor educational growth, albeit at a lower level, in both the relative and the weak absolute sense. It thus appears that the income-poor did experience faster educational growth 23. Given the problem that this might partly reflect that households with no education where all adults are
too old to get educated, so still had no education nine years later, the policy relevance of this finding is unclear and merits further investigation. This would certainly provide visible support to adult education initiatives to ensure that those who were left out from education in the past are able to make us for the short fall later on. Note that for those households who had zero education in the first period, the growth rate is not defined and thus not shown in Figure 1. This affects about 6-7 per cent of the worst-educated households (2 per cent of which still had zero education in the second period).

OECD Development Centre Working Paper No. 246 DEV/DOC(2005)06
© OECD 2005
21
rates. This situation is probably specific to Bolivia and need not apply elsewhere where the conditional NIGIC could look very different.
Figure 3 disaggregates the education indicator by sex to demonstrate that these non-income growth incidence curves can disaggregate by gender in ways that income incidence curves cannot. In the particular case, they show that relative educational growth has been larger for females than males, but that this is driven by lower female initial levels of education. Figure 4 shows absolute growth rates. While generally showing similar absolute growth rates (and thus indicating little gender bias in the educational expansion), there are considerably more women who began and ended the period 1989-98 with no education, an issue of particular policy relevance24.
Figures 5 and 6 examine the same curves now applied to vaccination rates. Again, we see strongly pro-poor growth in the weak absolute and the relative sense while the worst-off (the 8 pr cent worst off) are left out in terms of initial vaccination rates. Specifically, their children had no vaccinations in the first period and none in the second25. Figure 4 also shows that the absolute growth of vaccinations is particularly high in deciles 3-8. For the top decile, the (unconditional) relative or absolute NIGIC is again flat at zero. These households already had all eight vaccinations per child in 1989 and there was no further scope for improvement. This is an example of an upper-bound indicator.
Figures 7 and 8 examine survival. Here the poorest percentile appears to have suffered from worsening survival prospects (which might, however, also be due to measurement error) while the other poor have improved their survival. For the nine top deciles, the unconditional curve is flat as there was 100 per cent survival in the first and second period. The conditional NIGIC shows no real pattern, suggesting that mortality changes were largely unrelated to the position in the income distribution. In the Bolivian context where infant and child mortality is already quite low and apparently largely driven by random factors (e.g. genetic diseases, prematurity or accidents), these survival NIGICs are not particularly informative. This is likely to be different if applied to more high-mortality environments (such as those prevailing in large parts of Africa).
Figures 9 and 10 examine the stunting indicator. Again, reductions in stunting appear to have been pro poor in a weak absolute and relative sense. In particular, those who were among the 10 per cent worst nourished have been able proportionately to improve their nutrition the most, but the absolute improvements were similar across all income groups. When sorting households by income (conditional NIGIC), the pro poorness of nutritional improvements are
24. The decline in absolute levels of education in decile 8 for males and females is mostly due to a change to
the number of years of schooling required to attain a degree. This points to the potential bias of using years of schooling as the indicator of educational output.
25. It is important to note here that the 12 per cent worst off in terms of vaccination rates need not be the same households. As with the income growth incidence curve and the Ravallion-Chen framework, these assessments are based on cross-section surveys and the results refer to percentiles of the distribution, not particular households.

Economic Growth and Poverty Reduction: Measurement and Policy Issues DEV/DOC(2005)06
© OECD 2005 22
much less clear; in fact, the very income-poor did not experience much improvement in their nutritional status.
Figures 11-14 examine pro-poor growth using the composite indices using the small and the large sample. They basically summarise the results from the discussion. In particular, they suggest that composite measures of non-income well-being show pro-poor growth in the relative and the weak absolute sense. Particularly due to improvements in vaccinations and – to a lesser extent – in education, the absolute improvements were largest in deciles 3-5, while it was smaller in the poorest decile and also smaller among the rich (see NIGIC in Figures 10 and 12). In contrast to the absolute income GIC where the absolute gains were largest for the income rich, the absolute NIGIC using this indicator shows much greater improvements for the poor, with the exception of the very poor who seem to have been largely left out of these improvements. As with its constituent elements, the conditional NIGIC shows that (proportionate) improvements in this index of deprivation was not significantly larger for the income-poor than the non-poor.
The contrast between these two findings suggests that improvements in non-income indicators were generally more focused with individuals performing initially poorly on those indicators (with the exception of the very worst performers), while they were not particularly focused on the income-poor. From the perspective of achieving the non-income MDGs (2-6), this focus of improvements in non-income achievements among the more deprived is generally good news with the strong caveat that the very worst-off have been left out of these improvements. From the point of view of the allocation of public spending and public interventions, the results suggest that improvements in non-income indicators have not particularly favoured the income-poor; if that was a focus of intervention, a lot more could be done. It is also clear that these two perspectives are somewhat in conflict with each other. Focusing interventions in health and education on the income-poorest will not necessarily reach the households most deprived in those health and education indicators.
Based on the graphs, Table 7 and 8 calculate the rates of pro-poor growth using the Ravallion and Chen (2003) approach for the various income and non-income indicators and using a poverty line of 77 per cent, which was the income poverty line in Bolivia in 1989. Table 7 shows that growth in income and non-income dimensions has been pro poor in a relative sense as the rates of pro-poor growth are larger than the mean growth rates (with the exception of vaccination rates). It also shows that growth has been pro poor in a weak absolute sense as the rates are all above 0. When households are sorted by incomes (conditional), pro-poor growth has been much smaller while some of the non-income improvements affected nearly as many people with higher incomes as those with lower ones. Table 8 calculates the pro-poor growth measure using absolute improvements. In line with the graphs, the results show that improvements were pro poor using the strong definition in the health indicators, but not particularly pro poor in the education measures and anti-poor in the nutrition measure. When sorting households by income, the pro-poor growth measures are usually similar to overall absolute growth, with some indicators showing a bias in absolute improvements towards the rich and others towards the poor. This record regarding non-income indicators is certainly much more positive than with the income indicator. The absolute income gains to the rich were much larger than those of the poor.

OECD Development Centre Working Paper No. 246 DEV/DOC(2005)06
© OECD 2005
23
IV. CONCLUSION
This paper has reviewed the findings about growth, inequality and poverty reduction. A particular innovation of the paper was to clarify the debates about the definition of pro-poor growth from a policy perspective. In line with achieving MDG 1, it appears useful to target a measure such as the Ravallion-Chen measure of pro-poor growth. Maximising this weak absolute measure of pro-poor growth implies that measures to further pro-poor growth in a relative (or even strong absolute) dimension would be particularly useful (unless there are large trade-offs involved).
A second innovation was to extend the measurement techniques of pro-poor growth to the non-income dimension. The discussion has generated important new insights for measurement and monitoring as well as policy priorities. Turning first to the new insights for measurement and monitoring, the discussion has shown that it is possible and worthwhile to extend the concepts of the Growth Incidence Curve and the Ravallion and Chen measure to non-income dimensions. While some conceptual and practical difficulties need to be addressed when extending this framework (particularly with respect to the mortality indicators), it usefully shifts the focus from average achievements in these dimensions to the distribution of improvements which is critically important for monitoring progress in the non-income MDGs. The NIGICs show where the largest improvements and setbacks have occurred along the income distribution as well as the distribution of non-income measures, which is critical in order to identify the priority policy interventions for meeting the MDGs.
Second, extending this framework has the additional advantage of explicitly examining how improvements in income and non-income dimensions are related at different points of the income distribution. This is of importance as a tool for monitoring whether policies to improve poverty in non-income dimensions are reaching the income-poor.
Third, the non-income growth analysis can also be extended to examine gender differentials. While it is exceedingly difficult to say much about gender and income poverty (Klasen, 2004), it is perfectly feasible to analyse non-income growth incidence curves for education and health by gender and to see how gender differentials can be observed at different points of the distribution of these non-income indicators. This is of critical importance for monitoring progress and identifying problems regarding MDG 3. It is equally important since gender differentials are pivotal in order to address most MDGs (certainly MDGs 1-6, see Klasen, 2005).

Economic Growth and Poverty Reduction: Measurement and Policy Issues DEV/DOC(2005)06
© OECD 2005 24
Fourth, the non-income indicators suggest to not only considering growth rates in achievements but also absolute improvements. Thus, all three senses of pro-poor growth (weak and strong absolute as well as relative) generate interesting insights about changes in the distribution of non-income well-being. Their inter-relationship has been particularly interesting in the Bolivian case. In Bolivia, income growth was pro poor in the relative and weak absolute sense, but strongly anti-poor in the strong absolute sense (as it is likely to be in most other countries). When considering non-income dimensions of pro-poor growth, the picture is generally more favourable while growth has been pro poor even in the strong absolute sense for some indicators, with the important exception of the extremely poor, who often experienced no improvements in their education or vaccination indicators. Examining how this differs across countries would be particularly worthwhile.
Regarding policy priorities, the findings from this paper also yield new insights. First, the analysis can be used for targeting purposes. With this framework, the priority beneficiaries for policy interventions can be identified. This can occur using non-income indicators. If one were to fully align this analysis to achieve the MDGs, this toolbox would allow policy makers to identify the particular target groups for interventions in each income or non-income dimension. The impact of past policies on that group is immediately visible so that lessons from the past can be incorporated in the design of new programmes.
Second, the analysis yields new insights about linkages between policies favouring income growth for the achievement of non-income objectives and those that favour targeting these non-income indicators directly. While there is a clear correlation between the income and non-income dimensions of pro-poor growth, the correlation is far from perfect. Relying on income growth to solve the non-income poverty problem is unlikely to be the most effective approach to addressing non-income poverty. Moreover, targeting policy interventions in the health and education field on the income-poor – a major current policy focus and a major goal of policy research (e.g. through incidence analyses and public expenditure reviews) – is also not necessarily the best approach to target non-income dimensions of poverty. While focusing such interventions on the income-poor would go some way towards addressing non-income poverty, focusing interventions on those who are particularly deprived in the respective dimension would be more effective for combating non-income poverty and helping to achieve the non-income MDGs. With the help of the toolbox proposed here, this rather trivial (but often neglected) point can be operationalised.

OECD Development Centre Working Paper No. 246 DEV/DOC(2005)06
© OECD 2005
25
BIBLIOGRAPHY
ATKINSON, A.B. and A. BRANDOLINI (2004), “Global Inequality and Poverty: Absolute, Relative or Intermediate?”, Paper presented at the 28th General Conference of the IARIW, Cork, Ireland.
BANERJEE, A.V. and E. DUFLO (2003), “Inequality and Growth: What Can the Data Say?”, Journal of Economic Growth, 8(3), pp. 267-299.
BASU, K. and J. FOSTER (1998), “On Measuring Literacy”, Economic Journal, 108, pp. 1733-1749.
BOURGUIGNON, F. (2003), “The Growth Elasticity of Poverty Reduction”, in T. EICHER and S. TURNOVSKY, Inequality and Growth, MIT Press, Cambridge.
CHRISTIAENSEN, L., L. DEMERY and S. PATERNOSTRO (2002), “Reforms, Economic Growth, and Poverty Reduction in Africa: Messages from the 1990s”, World Bank, Washington, D.C., processed.
DATT, G. and M. RAVALLION (2002), “Is India’s Economic Growth leaving the Poor behind?”, Journal of Economic Perspectives 16, pp. 89-108.
DEININGER, K. and L. SQUIRE (1998), “New Ways of Looking at Old Issues: Inequality and Growth”, Journal of Development Economics, 57(2), pp. 259–287.
DOLLAR, D. and A. KRAAY (2002), “Growth is Good for the Poor”, Journal of Economic Growth 7.
DUCLOS, J.-Y. and Q. WODON (2004), “What is ‘Pro-Poor’?”, mimeo, World Bank, Washington, D.C.
FORBES, K.J. (2000), “A Reassessment of the Relationship between Inequality and Growth”, American Economic Review, 90(4), pp. 869-87.
GROSSE, M. and K. HARTTGEN (2004), “Measuring Pro-Poor Growth in the Non-Income Dimension”, mimeo, University of Göttingen.
GRÜN, C. and S. KLASEN (2003), “Growth, Income Distribution, and Well-being: Intertemporal and Global Comparisons”, CESifo Economic Studies, 49(4), pp. 617-59.
HANMER, L. and D. BOOTH (2001), “Pro-Poor Growth: Why do we need it?”, mimeo, ODI, London.
KAKWANI, N. and E.M. PERNIA (2000), “What is Pro-Poor Growth?”, Asian Development Review, 18(1), pp. 1-16.
KLASEN, S. (2005), “Gender and Pro-Poor Growth”, Paper prepared for the Operationalizing Pro-Poor Growth Work Program, mimeo, University of Göttingen.
KLASEN, S. (2004), “Gender-related Indicators of Well-being”, WIDER Discussion Paper 2004-07, Helsinki.
KLASEN, S. (2003), “In Search of the Holy Grail: How to Achieve Pro-Poor Growth”, in B. TUNGODDEN, N. STERN and I. KOLSTAD (eds.), Toward Pro-Poor Policies: Aid, Institutions, and Globalization, Proceedings from the Annual World Bank Conference on Development Economics Europe Conference 2003, Washington, D.C.

Economic Growth and Poverty Reduction: Measurement and Policy Issues DEV/DOC(2005)06
© OECD 2005 26
KLASEN, S. (2002), “Low Schooling for Girls, Slower Growth for All?”, World Bank Economic Review 16, pp. 345-373.
KLASEN, S. (2000), “Measuring Poverty and Deprivation in South Africa”, Review of Income and Wealth, 42 (1), pp. 33-58.
KLASEN, S. (1999), “Does Gender Inequality Reduce Growth and Development?”, World Bank Policy Research Report Working Paper No. 7, World Bank, Washington, D.C.
KLASEN, S., R. THIELE, M. GROSSE, J. LAY, J. SPATZ, and M. WIEBELT (2004), “Operationalizing Pro-Poor Growth: Country Case Study: Bolivia”, Paper presented at the Joint World Bank, KfW, and GTZ Workshop “Operationalizing Pro-Poor Growth” in Eschborn, 15-16 July 2004.
KNOWLES, S., P.K. LORGELLY and P.D. OWEN (2002), “Are Educational Gender Gaps a Break on Economic Development? Some Cross-country Empirical Evidence”, Oxford Economic Papers 54, pp. 118-149.
LOPEZ, H. (2004), “Pro-Poor, Pro-Growth: Is there a Trade-off?”, mimeo, World Bank, Washington, D.C.
LUNDBERG, M. and L. SQUIRE (2003), “The Simultaneous Evolution of Growth and Inequality”, Economic Journal 113, pp. 326-344.
MCCULLOCH, N. and B. BAULCH (1999), “Tracking Pro-Poor Growth”, ID21 Insights No. 31, Institute of Development Studies, Sussex.
OECD (2004), “Accelerating Pro-Poor Growth through Support for Private Sector Development”, mimeo, OECD, Paris.
RAVALLION, M. (2000), “Growth, Inequality and Poverty: Looking beyond Averages”, World Development, 29(11), pp. 1803-1815.
RAVALLION, M. and G. DATT (2002), “Why has Economic Growth been more Pro-Poor in Some States of India than Others?”, Journal of Development Economics 68, pp. 381-400.
RAVALLION, M. and S. CHEN (2003), “Measuring Pro-Poor Growth”, Economic Letters, 78(1), pp. 93-99.
RODRIK, D. (2003),”Growth Strategies”, mimeo, forthcoming in the Handbook of Economic Growth.
SEN, A. (1998), Development as Freedom, Knopf, New York.
SON, H.H. (2004), “A Note on Pro-Poor Growth”, Economic Letters, 82(3), pp. 307-314.
WHITE, H. and E. ANDERSON (2000), “Growth versus Distribution: Does the Pattern of Growth Matter?”, mimeo, Institute of Development Studies, Brighton.
WORLD BANK (2005), “Pro-Poor Growth: What dies the Pro-Poor add?”, “Operationalizing Pro-Poor Growth Synthesis Report”, mimeo, World Bank, Washington, D.C.
WORLD BANK (2001), Engendering Development, Oxford University Press, New York.
WORLD BANK (2000), World Development Report, Oxford University Press, New York.
OECD Development Centre Working Paper No. 246 DEV/DOC(2005)06
© OECD 2005
27
APPENDIX Table 1. Policies to Promote Pro-Poor Growth: Research Findings, Consensus Policies and Remaining Debates
Policy Issue Research Finding Agreed Policy Implication Areas of Debate Macroeconomic Stability (see also individual areas of macro policy)
Macroeconomic stability critical necessary (though not sufficient) condition for pro-poor growth; poor hurt particularly by high inflation and high macro volatility.
Monetary and exchange rate policy should aim for low inflation and competitive exchange rates; fiscal policy should aim for low budget deficits.
Role of exchange rate policy to fight inflation; pace and extent of stabilization during crises.
Monetary and Exchange Rate Policy
Overvalued exchange rates and high black market premia hurt economic growth and tend to be anti-poor.
A competitive and possibly undervalued exchange rate a critical ingredient to ensure macro stability; government intervention necessary to manage capital inflows.
Fixed or floating rates? Role of capital controls to manage inflows and outflows during crises?
Fiscal Stance
Large budget deficits hurt growth and are unsustainable. Rapid expenditure cuts can often undermine delivery and quality of critical services (e.g. health and education) and hurt the poor.
Governments should aim for moderate budget deficits through broadening of the tax base and, if necessary, a refocusing of expenditures (especially cuts in subsidies to state-owned enterprises and unproductive sectors). During crises not feasible or desirable to cut expenditures fast.
Mix of tax increases, tax broadening, and expenditure cuts?
Privatization
Loss-making state-owned enterprises undermine fiscal stability, with negative implications for the poor. Some privatizations have been captured by local elites and have not led to better services for poor.
Reform of loss making state-owned enterprises and parastatals critical. Privatization processes must be transparent and competitive.
How to ensure expansion of services for the poor? Use of cross-subsidies for vital services?
Financial Sector
Severe financial repression hurts savings and promotes capital flight. Poorly sequenced financial sector reforms can be counter-productive and destabilizing.
Capital account and financial sector reform should be phased slowly, be implemented only if macro stability has been achieved, and be accompanied by tight regulation, competition policies, and policies to improve access of the poor.
State allocation of credit to priority sectors? State involvement in credit for the poor? Policies to mobilise domestic savings?
Trade Policy
Anti-export bias hurts growth and the poor; import liberalization can be anti-poor and not sufficient to generate supply response. Diversification essential for long-term growth.
Focus on removal of anti-export bias (competitive exchange rate, duty draw-back schemes, etc); provision of infrastructure to assist exports, especially for export diversification.
More activist state intervention to boost non-traditional exports (e.g. export subsidies, subsidised credit for exporters)?
Agriculture
Raising agricultural productivity critical for pro-poor growth. Removal of price distortions necessary but not sufficient in the presence of other market failures. Protection and subsidies in North hurt poor in South.
Renewed emphasis on agricultural research and extension, rural infrastructure, and competitive marketing and input supplies. Open access to OECD markets and removal of OECD subsidies critical.
How to stimulate non-traditional agricultural exports? Role of subsidies to promote new seeds and fertiliser use?

Economic Growth and Poverty Reduction: Measurement and Policy Issues DEV/DOC(2005)06
© OECD 2005 28
Table 1. Policies to Promote Pro-Poor Growth: Research Findings, Consensus Policies and Remaining Debates (continued)
Policy Issue Research Finding Agreed Policy Implication Areas of Debate
Industrial Policy
Removal of distortions necessary but not sufficient for vibrant industrial sector, especially small and medium enterprises.
Focus on providing infrastructure and services to industrial sector.
Activist industrial policy? State credit or subsidies? Cluster initiatives?
Human Capital
Lack of human capital of the poor hurts growth and poverty reduction. Education and health services have suffered greatly under economic crises and SAPs. Credit constraints and high costs for health significant deterrent for the poor.
Increased investment in education and health, particularly basic education and primary health care; greater focus on quality; reallocation of public spending to the poor, lowering costs of primary health care and education through greater subsidies and use subsidised community insurance.
How to finance expansion of primary education and health care (especially in Africa)? Phasing out of all user fees for primary health care and education?
Asset Inequality
Asset inequality (in particular land) reduces economic growth and poverty impact of growth.
On land inequality: Removal of subsidies to large landowners, land taxes to increase land for sale; land redistribution necessary. Other asset inequalities: microcredit and subsidies for infrastructure extensions for the poor (e.g. electricity hook-ups).
On land inequality: Market- and subsidy-based land reform versus quick one-off (partly) confiscatory land reform. Other asset inequalities: role of land and inheritance taxes to reduce asset inequality?
Income Inequality
High income inequality associated with higher poverty and lower poverty impact of growth; high initial income inequality may reduce subsequent growth
Safety nets, social funds, and some targeted cash and in-kind transfers to the poor.
Increasing progressivity of tax system (e.g. luxury VAT and import duties, greater reliance on personal income tax for formal sector employed)? Scaling up of redistributive transfer programmes (e.g. Progresa)?
Gender Inequality
Gender inequality reduced growth and makes growth less pro poor.
More supply of education for girls plus targeted subsidies to boost enrolments; removal of restrictions on female control of other assets; political empowerment of women.
How to fund expansion of female education? Role of affirmative action policies in labour market?
Regional Inequality
Regional inequality can sharply reduce impact of growth on poverty; possibility of regional poverty traps.
Targeting of state transfer programmes and safety nets on regions with high poverty concentration; focus on improving infrastructure; regional inequality to be considered in programmes of decentralization and fiscal equalization.
How to promote economic growth in backward Regions? The role of regionally targeted Industrial policy? Role of incentives to move industries or people?
Population Policy
High fertility among the poor a constraint to pro- poor growth. Inequality reduction often a result of fertility decline among the poor.
Emphasis on female education and employment as well as access to reproductive health services.
Role of family planning policies? How to alter incentives for large families among the poor?
Security Physical and social security essential for pro-poor growth
Safety nets and greater physical security essential measures to promote pro-poor growth.
Public and private roles in safety net, e.g. credit and insurance provision? How extensive? How funded?

OECD Development Centre Working Paper No. 246 DEV/DOC(2005)06
© OECD 2005
29
Table 2. Process Issues in Promoting Pro-Poor Growth: Research Findings, Consensus Policies and Remaining Debates
Policy Issue Research Finding Agreed Policy Implication Areas of Debate
Governance
Poor governance, corruption, political instability and civil strife a major deterrent to investment, growth and poverty reduction. Poor suffer more under poor governance.
Reducing incentives and possibilities for corruption by simplifying rules and regulations that invite rent-seeking behavior; merit-based pay and recruitment; increase public accountability through greater transparency, better institutional oversight of governments (parliaments, independent boards), and decentralization. Donor support for conflict prevention, resolution, and post-conflict reconstruction critical.
Role of privatization to improve governance? How to improve governance when public sector is contracting? Role of the state where state capacity is weak? Reliance on parliaments or extra-parliamentary means for public oversight? How to ensure decentralization that reduces incentives and possibilities for corruption?
Private Sector
Indigenous private sector critical for employment growth and dynamic economy.
State assistance with capacity-building, finance (especially microfinance), dialogue between state and domestic private sector.
Role of national vs. Multinational companies?
Political Economy of Reform
Domestic political economy crucial for success. Pro-poor coalitions necessary to implement package.
Dialogue to replace donor conditionality. Empowerment of poor and local analytical and research capacity critical for implementation.
Role of financial aid and conditionality under some circumstances? Empowerment from outside possible/desirable?
Donor Policies
Donors can assist with pro-poor growth when aid and advice is focused on poorest countries and those with highest poverty impact of policies.
Aid should be focused on poorest countries that promote pro-poor growth, should flow through budget and be accounted for using national processes, and observe country leadership.
What to do in poor countries with poor policies? Interactions between donors and civil society? How to ensure accountability of resources?

Economic Growth and Poverty Reduction: Measurement and Policy Issues DEV/DOC(2005)06
© OECD 2005 30
Table 3. Deciles of Non-Income Indicators and Income for Bolivia, Unconditional 1989 and 1998
1 2 3 4 5 6 7 8 9 10 Mean Indicator Mean of deciles (unconditional), 1989 Income* 21.88 40.27 57.50 77.33 100.61 132.39 177.08 246.12 368.36 863.39 213.39 Education** Average education 0.42 1.74 2.76 3.75 4.81 6.27 7.99 9.68 11.61 14.59 6.32 Average education of respondents (between 20 and 30) 0.32 2.00 2.99 4.60 5.99 7.52 9.51 11.78 11.78 14.69 6.69 Maximal education per household 0.98 3.00 4.61 6.00 7.00 8.43 11.50 11.50 15.04 17.51 8.86 Maximal education of respondents (between 20 and 30) 0.34 2.00 3.00 4.60 4.60 7.11 9.52 9.52 11.81 15.03 6.58 Health Under 5 child survival rate (%) 63.42 100 100 100 100 100 100 100 100 100 96.43 Under 1 child survival rate (%) 78.33 100 100 100 100 100 100 100 100 100 97.77 Average vaccination per child (age>=1) 0.00 0.76 1.45 1.95 2.55 2.97 3.81 4.84 6.14 8.00 3.04 Nutrition Stunting z-score -4.29 -3.16 -2.68 -2.29 -2.00 -1.67 -1.36 -1.00 -0.51 0.80 -1.50 Composite welfare index Small sample 0.26 0.33 0.37 0.40 0.42 0.45 0.49 0.54 0.59 0.69 0.46 Big sample 0.12 0.28 0.35 0.42 0.48 0.54 0.59 0.65 0.73 0.86 0.50 Mean of deciles (unconditional), 1998 Income* 36.37 63.60 89.26 119.22 155.89 203.15 269.64 369.20 555.27 1242.66 352.08 Education** Average education 1.16 2.97 4.50 5.75 6.75 7.96 9.16 10.19 12.54 15.81 7.48 Average education of respondents (between 20 and 30) 0.99 3.45 5.00 6.45 7.98 8.99 9.99 9.99 13.71 16.59 8.05 Maximal education per household 1.96 4.62 6.57 8.00 9.00 10.00 10.00 13.27 16.55 18.60 9.07 Maximal education of respondents (between 20 and 30) 1.00 3.44 5.00 6.00 7.63 9.00 10.00 10.00 13.90 16.72 7.82 Health Under 5 child survival rate (%) 72.60 100 100 100 100 100 100 100 100 100 97.42 Under 1 child survival rate (%) 82.02 100 100 100 100 100 100 100 100 100 98.16 Average vaccination per child (age>=1) 0.24 2.48 3.89 4.94 5.91 6.93 7.97 8.00 8.00 8.00 5.5 Nutrition Stunting z-score -3.77 -2.61 -2.10 -1.76 -1.46 -1.17 -0.81 -0.40 0.10 1.25 -1.13 Composite welfare index Small sample 0.35 0.42 0.47 0.50 0.53 0.56 0.60 0.63 0.68 0.75 0.55 Big sample 0.20 0.38 0.46 0.51 0.56 0.61 0.66 0.70 0.76 0.88 0.57 Notes: * Real household income per capita in Bolivianos per month (1995=100). – **All variables for education are measured in single years per household. Source: Own calculations.
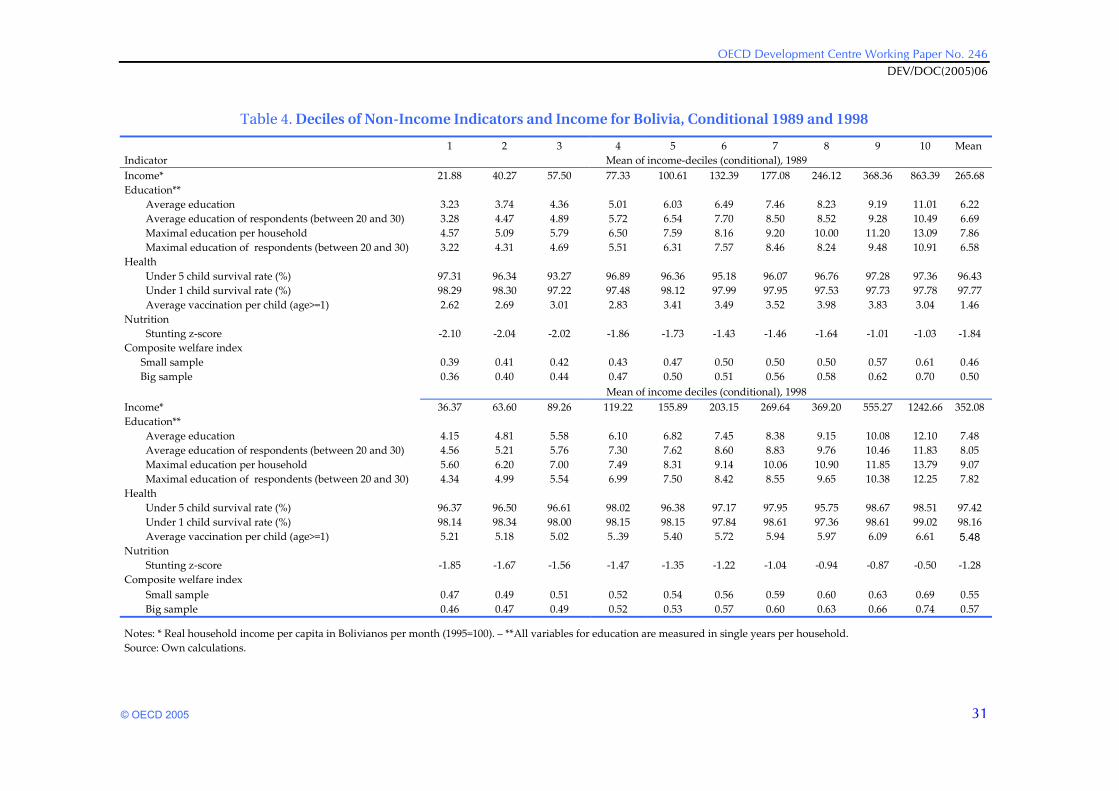
OECD Development Centre Working Paper No. 246 DEV/DOC(2005)06
© OECD 2005
31
Table 4. Deciles of Non-Income Indicators and Income for Bolivia, Conditional 1989 and 1998
1 2 3 4 5 6 7 8 9 10 Mean Indicator Mean of income-deciles (conditional), 1989 Income* 21.88 40.27 57.50 77.33 100.61 132.39 177.08 246.12 368.36 863.39 265.68 Education**
Average education 3.23 3.74 4.36 5.01 6.03 6.49 7.46 8.23 9.19 11.01 6.22 Average education of respondents (between 20 and 30) 3.28 4.47 4.89 5.72 6.54 7.70 8.50 8.52 9.28 10.49 6.69 Maximal education per household 4.57 5.09 5.79 6.50 7.59 8.16 9.20 10.00 11.20 13.09 7.86 Maximal education of respondents (between 20 and 30) 3.22 4.31 4.69 5.51 6.31 7.57 8.46 8.24 9.48 10.91 6.58
Health Under 5 child survival rate (%) 97.31 96.34 93.27 96.89 96.36 95.18 96.07 96.76 97.28 97.36 96.43 Under 1 child survival rate (%) 98.29 98.30 97.22 97.48 98.12 97.99 97.95 97.53 97.73 97.78 97.77 Average vaccination per child (age>=1) 2.62 2.69 3.01 2.83 3.41 3.49 3.52 3.98 3.83 3.04 1.46
Nutrition Stunting z-score -2.10 -2.04 -2.02 -1.86 -1.73 -1.43 -1.46 -1.64 -1.01 -1.03 -1.84
Composite welfare index Small sample 0.39 0.41 0.42 0.43 0.47 0.50 0.50 0.50 0.57 0.61 0.46 Big sample 0.36 0.40 0.44 0.47 0.50 0.51 0.56 0.58 0.62 0.70 0.50 Mean of income deciles (conditional), 1998 Income* 36.37 63.60 89.26 119.22 155.89 203.15 269.64 369.20 555.27 1242.66 352.08 Education**
Average education 4.15 4.81 5.58 6.10 6.82 7.45 8.38 9.15 10.08 12.10 7.48 Average education of respondents (between 20 and 30) 4.56 5.21 5.76 7.30 7.62 8.60 8.83 9.76 10.46 11.83 8.05 Maximal education per household 5.60 6.20 7.00 7.49 8.31 9.14 10.06 10.90 11.85 13.79 9.07 Maximal education of respondents (between 20 and 30) 4.34 4.99 5.54 6.99 7.50 8.42 8.55 9.65 10.38 12.25 7.82
Health Under 5 child survival rate (%) 96.37 96.50 96.61 98.02 96.38 97.17 97.95 95.75 98.67 98.51 97.42 Under 1 child survival rate (%) 98.14 98.34 98.00 98.15 98.15 97.84 98.61 97.36 98.61 99.02 98.16 Average vaccination per child (age>=1) 5.21 5.18 5.02 5..39 5.40 5.72 5.94 5.97 6.09 6.61 5.48
Nutrition Stunting z-score -1.85 -1.67 -1.56 -1.47 -1.35 -1.22 -1.04 -0.94 -0.87 -0.50 -1.28
Composite welfare index Small sample 0.47 0.49 0.51 0.52 0.54 0.56 0.59 0.60 0.63 0.69 0.55 Big sample 0.46 0.47 0.49 0.52 0.53 0.57 0.60 0.63 0.66 0.74 0.57
Notes: * Real household income per capita in Bolivianos per month (1995=100). – **All variables for education are measured in single years per household. Source: Own calculations.

Economic Growth and Poverty Reduction: Measurement and Policy Issues DEV/DOC(2005)06
© OECD 2005 32
Table 5. Gini-Coefficients and Correlations of Income and Non-Income Indicators for Bolivia, 1989 and 1998
Gini-coefficient Correlation
Indicator 1989 1998 Income* 0.56 0.54 GIC
Education**
Average education 0.40 0.33 0.64
Average education of respondents (between 20 and 30) 0.39 0.31 0.49
Maximal education per household 0.36 0.29 0.59
Maximal education of respondents (between 20 and 30) 0.40 0.32 0.48
Health
Under 5 child survival rate (%) 0.03 0.03 0.14
Under 1 child survival rate (%) 0.02 0.02 0.35
Average vaccination per child (age>=1) 0.41 0.29 0.30
Nutrition
Stunting z-score 0.19 0.17 0.74 Composite welfare index***
Small sample 0.16 0.13 0.62 Big sample 0.24 0.19 0.72
Composite welfare index*** (including income) Small sample 0.16 0.13 0.62 Big sample 0.25 0.20 0.78
Notes: * Real household income per capita in Bolivianos per month (1995=100). –**All variables for education are measured in single years per household. – ***The composite welfare index includes average education of household, under one survival rate, average vaccination per child (age>=1), and stunting Source: Own calculations.
Table 6. Mean Growth Rates and Pro-Poor Growth Rates for Bolivia, 1989-1998 NIGIC 1998-1998 (unconditional) NIGIC 1998-1998 (conditional)
Indicator Rate of pro-poor
growth**** Growth rate in
mean Rate of pro-poor
growth**** Growth rate in
mean Income* 4.53 3.88 4.53 3.88 Education**
Average education 3.83 1.86 1.90 1.43 Average education of respondents (between 20 and 30) 3.55 1.86 1.76 1.42 Maximal education per household 2.79 1.45 1.47 1.06 Maximal education of respondents (between 20 and 30) 3.52 1.72 1.73 1.35
Health Under 5 child survival rate (%) 0.17 0.11 0.12 0.11 Under 1 child survival rate (%) 0.05 0.03 0.03 0.04 Average vaccination per child (age>=1) 10.04 6.02 6.01 5.70
Nutrition Stunting z-score 1.65 1.29 1.01 0.91
Composite welfare index*** Small sample 2.22 1.89 1.66 1.50 Big sample 2.40 1.35 1.30 1.04
Composite welfare index*** (including income) Small sample 2.20 1.87 1.66 1.48 Big sample 2.51 1.41 1.41 1.10
Notes: * Real household income per capita in Bolivianos per month (1995=100). –**All variables for education are measured in single years per household. – ***The composite welfare index includes average education of household, under one survival rate, average vaccination per child (age>=1), and stunting.– ****The headcount is 77%. Source: Own calculations.
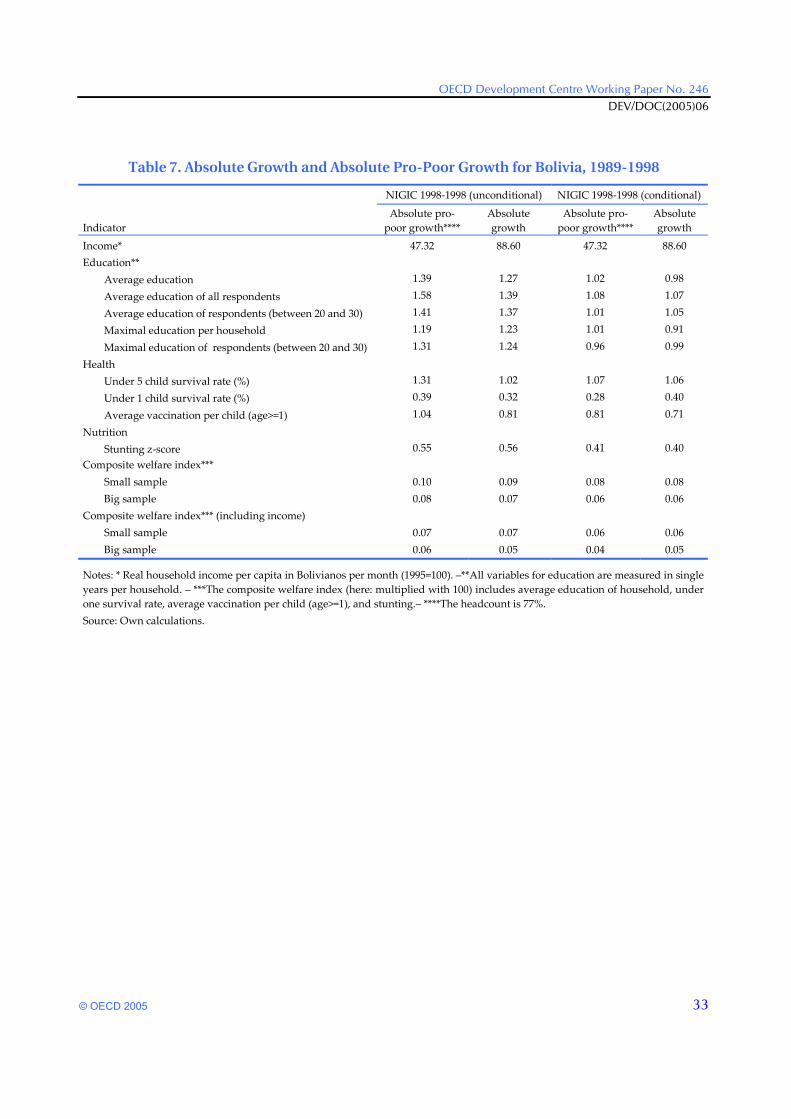
OECD Development Centre Working Paper No. 246 DEV/DOC(2005)06
© OECD 2005
33
Table 7. Absolute Growth and Absolute Pro-Poor Growth for Bolivia, 1989-1998
NIGIC 1998-1998 (unconditional) NIGIC 1998-1998 (conditional)
Indicator Absolute pro-
poor growth**** Absolute growth
Absolute pro-poor growth****
Absolute growth
Income* 47.32 88.60 47.32 88.60 Education**
Average education 1.39 1.27 1.02 0.98
Average education of all respondents 1.58 1.39 1.08 1.07
Average education of respondents (between 20 and 30) 1.41 1.37 1.01 1.05
Maximal education per household 1.19 1.23 1.01 0.91
Maximal education of respondents (between 20 and 30) 1.31 1.24 0.96 0.99
Health Under 5 child survival rate (%) 1.31 1.02 1.07 1.06
Under 1 child survival rate (%) 0.39 0.32 0.28 0.40
Average vaccination per child (age>=1) 1.04 0.81 0.81 0.71
Nutrition Stunting z-score 0.55 0.56 0.41 0.40
Composite welfare index*** Small sample 0.10 0.09 0.08 0.08 Big sample 0.08 0.07 0.06 0.06
Composite welfare index*** (including income) Small sample 0.07 0.07 0.06 0.06 Big sample 0.06 0.05 0.04 0.05
Notes: * Real household income per capita in Bolivianos per month (1995=100). –**All variables for education are measured in single years per household. – ***The composite welfare index (here: multiplied with 100) includes average education of household, under one survival rate, average vaccination per child (age>=1), and stunting.– ****The headcount is 77%. Source: Own calculations.

Economic Growth and Poverty Reduction: Measurement and Policy Issues DEV/DOC(2005)06
© OECD 2005 34
Figure 1. GIC versus Conditional and Unconditional NIGIC for Average Education
-4
0
4
8
12
16
20
Annu
al G
row
th R
ate
%
0 10 20 30 40 50 60 70 80 90 100Percentile
NIGIC conditional smoothed NIGIC conditional
NIGIC unconditional GIC

OECD Development Centre Working Paper No. 246 DEV/DOC(2005)06
© OECD 2005
35
Figure 2. Absolute Change of Unconditional NIGIC for Average Education versus Absolute Change in Income
0
100
200
300
400
500
Abso
lute
cha
nge
-2
-1
0
1
2
3
4
Abso
lute
Cha
nge
0 10 20 30 40 50 60 70 80 90 100Percentile
NIGIC conditional absolute smoothed (lhs) NIGIC conditional absolute (lhs)
NIGIC unconditional absolute (lhs) GIC absolute (rhs)
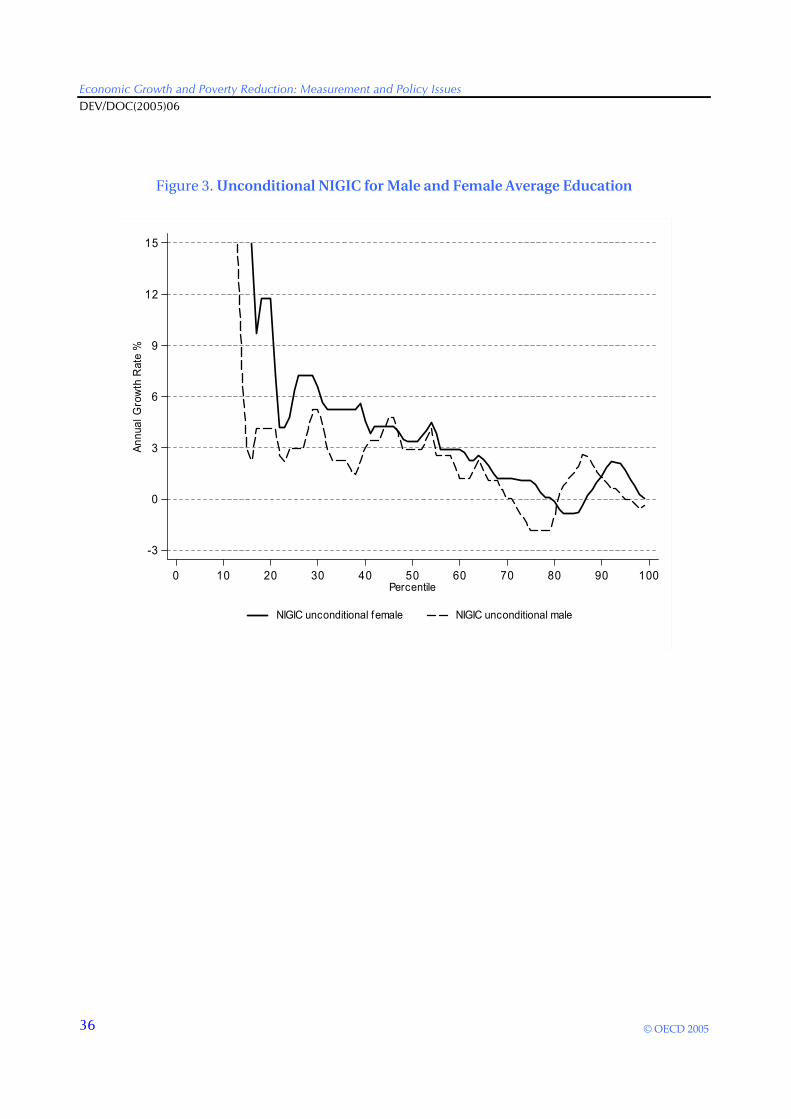
Economic Growth and Poverty Reduction: Measurement and Policy Issues DEV/DOC(2005)06
© OECD 2005 36
Figure 3. Unconditional NIGIC for Male and Female Average Education
-3
0
3
6
9
12
15
Annu
al G
row
th R
ate
%
0 10 20 30 40 50 60 70 80 90 100Percentile
NIGIC unconditional female NIGIC unconditional male

OECD Development Centre Working Paper No. 246 DEV/DOC(2005)06
© OECD 2005
37
Figure 4. Absolute Change for Male and Female Average Education
-3
-2
-1
0
1
2
3
4
5
Abso
lute
Cha
nge
0 10 20 30 40 50 60 70 80 90 100Percentile
NIGIC absolute unconditional female NIGIC absolute unconditional male

Economic Growth and Poverty Reduction: Measurement and Policy Issues DEV/DOC(2005)06
© OECD 2005 38
Figure 5. GIC versus Conditional and Unconditional NIGIC for Average Vaccination
-4
0
4
8
12
16
20
24
28
32
Annu
al G
row
th R
ate
%
0 10 20 30 40 50 60 70 80 90 100Percentile
NIGIC conditional smoothed NIGIC conditional
NIGIC unconditional GIC

OECD Development Centre Working Paper No. 246 DEV/DOC(2005)06
© OECD 2005
39
Figure 6. Absolute Change of Unconditional NIGIC for Vaccination versus Absolute Change in Income
0
100
200
300
400
500
Abso
lute
cha
nge
-2
0
2
4
6
Abso
lute
Cha
nge
0 10 20 30 40 50 60 70 80 90 100Percentile
NIGIC conditional absolute smoothed (lhs) NIGIC conditional absolute (lhs)
NIGIC unconditional absolute (lhs) GIC absolute (rhs)

Economic Growth and Poverty Reduction: Measurement and Policy Issues DEV/DOC(2005)06
© OECD 2005 40
Figure 7. GIC versus Conditional and Unconditional NIGIC for Under 5 Survival
-4
-2
0
2
4
6
Annu
al G
row
th R
ate
%
0 10 20 30 40 50 60 70 80 90 100Percentile
NIGIC conditional smoothed NIGIC conditional
NIGIC unconditional GIC

OECD Development Centre Working Paper No. 246 DEV/DOC(2005)06
© OECD 2005
41
Figure 8. Absolute Change of Unconditional NIGIC for Under 5 Survival versus Absolute Change in Income
0
100
200
300
400
500
Abso
lute
cha
nge
-10
0
10
20
30
Abso
lute
Cha
nge
0 10 20 30 40 50 60 70 80 90 100Percentile
NIGIC conditional absolute smoothed (lhs) NIGIC conditional absolute (lhs)
NIGIC unconditional absolute (lhs) GIC absolute (rhs)

Economic Growth and Poverty Reduction: Measurement and Policy Issues DEV/DOC(2005)06
© OECD 2005 42
Figure 9. GIC versus Conditional and Unconditional NIGIC for Stunting
-4
-2
0
2
4
6
8
10
Annu
al G
row
th R
ate
%
0 10 20 30 40 50 60 70 80 90 100Percentile
NIGIC conditional smoothed NIGIC conditional
NIGIC unconditional GIC

OECD Development Centre Working Paper No. 246 DEV/DOC(2005)06
© OECD 2005
43
Figure 10. Absolute Change of Unconditional NIGIC for Stunting versus Absolute Change in Income
00
100100
200200
300300
400400
500500
Abso
lute
cha
nge
Abso
lute
cha
nge
-1-1
00
11
22
33
Abso
lute
Cha
nge
Abso
lute
Cha
nge
00 1010 2020 3030 4040 5050 6060 7070 8080 9090 100100PercentilePercentile
NIGIC conditional absolute smoothed (lhs)NIGIC conditional absolute smoothed (lhs) NIGIC conditional absolute (lhs)NIGIC conditional absolute (lhs)

Economic Growth and Poverty Reduction: Measurement and Policy Issues DEV/DOC(2005)06
© OECD 2005 44
Figure 11. GIC versus Conditional and Unconditional NIGIC for Composite Welfare Index (Small Sample)
-2
0
2
4
6
8
Annu
al G
row
th R
ate
%
0 10 20 30 40 50 60 70 80 90 100Percentile
NIGIC conditional smoothed NIGIC conditional
NIGIC unconditional GIC

OECD Development Centre Working Paper No. 246 DEV/DOC(2005)06
© OECD 2005
45
Figure 12. Absolute Change of Unconditional NIGIC for Composite Welfare Index (Small Sample) versus Absolute Change in Income
0
100
200
300
400
500
Abso
lute
cha
nge
-5
0
5
10
15
20
Abso
lute
Cha
nge
0 10 20 30 40 50 60 70 80 90 100Percentile
NIGIC conditional absolute smoothed (lhs) NIGIC conditional absolute (lhs)
NIGIC unconditional absolute (lhs) GIC absolute (rhs)

Economic Growth and Poverty Reduction: Measurement and Policy Issues DEV/DOC(2005)06
© OECD 2005 46
Figure 13. GIC versus Conditional and Unconditional NIGIC for Composite Welfare Index (Big Sample)
-4
0
4
8
12
16
Annu
al G
row
th R
ate
%
0 10 20 30 40 50 60 70 80 90 100Percentile
NIGIC conditional smoothed NIGIC conditional
NIGIC unconditional GIC

OECD Development Centre Working Paper No. 246 DEV/DOC(2005)06
© OECD 2005
47
Figure 14. Absolute Change of Unconditional NIGIC for Composite Welfare Index (Big Sample) versus Absolute Change in Income
0
100
200
300
400
500
Abso
lute
cha
nge
-5
0
5
10
15
20
Abso
lute
Cha
nge
0 10 20 30 40 50 60 70 80 90 100Percentile
NIGIC conditional absolute smoothed (lhs) NIGIC conditional absolute (lhs)
NIGIC unconditional absolute (lhs) GIC absolute (rhs)

Economic Growth and Poverty Reduction: Measurement and Policy Issues DEV/DOC(2005)06
© OECD 2005 48
OTHER TITLES IN THE SERIES/ AUTRES TITRES DANS LA SÉRIE
The former series known as “Technical Papers” and “Webdocs” merged in November 2003 into “Development Centre Working Papers”. In the new series, former Webdocs 1-17 follow
former Technical Papers 1-212 as Working Papers 213-229.
All these documents may be downloaded from: http://www.oecd.org/dev/wp or obtained via e-mail ([email protected]).
Working Paper No.1, Macroeconomic Adjustment and Income Distribution: A Macro-Micro Simulation Model, by François Bourguignon, William H. Branson and Jaime de Melo, March 1989. Working Paper No. 2, International Interactions in Food and Agricultural Policies: The Effect of Alternative Policies, by Joachim Zietz and Alberto Valdés, April, 1989. Working Paper No. 3, The Impact of Budget Retrenchment on Income Distribution in Indonesia: A Social Accounting Matrix Application, by Steven Keuning and Erik Thorbecke, June 1989. Working Paper No. 3a, Statistical Annex: The Impact of Budget Retrenchment, June 1989. Document de travail No. 4, Le Rééquilibrage entre le secteur public et le secteur privé : le cas du Mexique, par C.-A. Michalet, juin 1989. Working Paper No. 5, Rebalancing the Public and Private Sectors: The Case of Malaysia, by R. Leeds, July 1989. Working Paper No. 6, Efficiency, Welfare Effects, and Political Feasibility of Alternative Antipoverty and Adjustment Programs, by Alain de Janvry and Elisabeth Sadoulet, December 1989. Document de travail No. 7, Ajustement et distribution des revenus : application d’un modèle macro-micro au Maroc, par Christian Morrisson, avec la collaboration de Sylvie Lambert et Akiko Suwa, décembre 1989. Working Paper No. 8, Emerging Maize Biotechnologies and their Potential Impact, by W. Burt Sundquist, December 1989. Document de travail No. 9, Analyse des variables socio-culturelles et de l’ajustement en Côte d’Ivoire, par W. Weekes-Vagliani, janvier 1990. Working Paper No. 10, A Financial Computable General Equilibrium Model for the Analysis of Ecuador’s Stabilization Programs, by André Fargeix and Elisabeth Sadoulet, February 1990. Working Paper No. 11, Macroeconomic Aspects, Foreign Flows and Domestic Savings Performance in Developing Countries: A ”State of The Art” Report, by Anand Chandavarkar, February 1990. Working Paper No. 12, Tax Revenue Implications of the Real Exchange Rate: Econometric Evidence from Korea and Mexico, by Viriginia Fierro and Helmut Reisen, February 1990. Working Paper No. 13, Agricultural Growth and Economic Development: The Case of Pakistan, by Naved Hamid and Wouter Tims, April 1990. Working Paper No. 14, Rebalancing the Public and Private Sectors in Developing Countries: The Case of Ghana, by H. Akuoko-Frimpong, June 1990. Working Paper No. 15, Agriculture and the Economic Cycle: An Economic and Econometric Analysis with Special Reference to Brazil, by Florence Contré and Ian Goldin, June 1990. Working Paper No. 16, Comparative Advantage: Theory and Application to Developing Country Agriculture, by Ian Goldin, June 1990. Working Paper No. 17, Biotechnology and Developing Country Agriculture: Maize in Brazil, by Bernardo Sorj and John Wilkinson, June 1990. Working Paper No. 18, Economic Policies and Sectoral Growth: Argentina 1913-1984, by Yair Mundlak, Domingo Cavallo, Roberto Domenech, June 1990. Working Paper No. 19, Biotechnology and Developing Country Agriculture: Maize In Mexico, by Jaime A. Matus Gardea, Arturo Puente Gonzalez and Cristina Lopez Peralta, June 1990. Working Paper No. 20, Biotechnology and Developing Country Agriculture: Maize in Thailand, by Suthad Setboonsarng, July 1990.

OECD Development Centre Working Paper No. 246 DEV/DOC(2005)06
© OECD 2005
49
Working Paper No. 21, International Comparisons of Efficiency in Agricultural Production, by Guillermo Flichmann, July 1990. Working Paper No. 22, Unemployment in Developing Countries: New Light on an Old Problem, by David Turnham and Denizhan Eröcal, July 1990. Working Paper No. 23, Optimal Currency Composition of Foreign Debt: the Case of Five Developing Countries, by Pier Giorgio Gawronski, August 1990. Working Paper No. 24, From Globalization to Regionalization: the Mexican Case, by Wilson Peres Núñez, August 1990. Working Paper No. 25, Electronics and Development in Venezuela: A User-Oriented Strategy and its Policy Implications, by Carlota Perez, October 1990. Working Paper No. 26, The Legal Protection of Software: Implications for Latecomer Strategies in Newly Industrialising Economies (NIEs) and Middle-Income Economies (MIEs), by Carlos Maria Correa, October 1990. Working Paper No. 27, Specialization, Technical Change and Competitiveness in the Brazilian Electronics Industry, by Claudio R. Frischtak, October 1990. Working Paper No. 28, Internationalization Strategies of Japanese Electronics Companies: Implications for Asian Newly Industrializing Economies (NIEs), by Bundo Yamada, October 1990. Working Paper No. 29, The Status and an Evaluation of the Electronics Industry in Taiwan, by Gee San, October 1990. Working Paper No. 30, The Indian Electronics Industry: Current Status, Perspectives and Policy Options, by Ghayur Alam, October 1990. Working Paper No. 31, Comparative Advantage in Agriculture in Ghana, by James Pickett and E. Shaeeldin, October 1990. Working Paper No. 32, Debt Overhang, Liquidity Constraints and Adjustment Incentives, by Bert Hofman and Helmut Reisen, October 1990. Working Paper No. 34, Biotechnology and Developing Country Agriculture: Maize in Indonesia, by Hidjat Nataatmadja et al., January 1991. Working Paper No. 35, Changing Comparative Advantage in Thai Agriculture, by Ammar Siamwalla, Suthad Setboonsarng and Prasong Werakarnjanapongs, March 1991. Working Paper No. 36, Capital Flows and the External Financing of Turkey’s Imports, by Ziya Önis and Süleyman Özmucur, July 1991. Working Paper No. 37, The External Financing of Indonesia’s Imports, by Glenn P. Jenkins and Henry B.F. Lim, July 1991. Working Paper No. 38, Long-term Capital Reflow under Macroeconomic Stabilization in Latin America, by Beatriz Armendariz de Aghion, July 1991. Working Paper No. 39, Buybacks of LDC Debt and the Scope for Forgiveness, by Beatriz Armendariz de Aghion, July 1991. Working Paper No. 40, Measuring and Modelling Non-Tariff Distortions with Special Reference to Trade in Agricultural Commodities, by Peter J. Lloyd, July 1991. Working Paper No. 41, The Changing Nature of IMF Conditionality, by Jacques J. Polak, August 1991. Working Paper No. 42, Time-Varying Estimates on the Openness of the Capital Account in Korea and Taiwan, by Helmut Reisen and Hélène Yèches, August 1991. Working Paper No. 43, Toward a Concept of Development Agreements, by F. Gerard Adams, August 1991. Document de travail No. 44, Le Partage du fardeau entre les créanciers de pays débiteurs défaillants, par Jean-Claude Berthélemy et Ann Vourc’h, septembre 1991. Working Paper No. 45, The External Financing of Thailand’s Imports, by Supote Chunanunthathum, October 1991. Working Paper No. 46, The External Financing of Brazilian Imports, by Enrico Colombatto, with Elisa Luciano, Luca Gargiulo, Pietro Garibaldi and Giuseppe Russo, October 1991. Working Paper No. 47, Scenarios for the World Trading System and their Implications for Developing Countries, by Robert Z. Lawrence, November 1991. Working Paper No. 48, Trade Policies in a Global Context: Technical Specifications of the Rural/Urban-North/South (RUNS) Applied General Equilibrium Model, by Jean-Marc Burniaux and Dominique van der Mensbrugghe, November 1991. Working Paper No. 49, Macro-Micro Linkages: Structural Adjustment and Fertilizer Policy in Sub-Saharan Africa, by Jean-Marc Fontaine with the collaboration of Alice Sindzingre, December 1991. Working Paper No. 50, Aggregation by Industry in General Equilibrium Models with International Trade, by Peter J. Lloyd, December 1991. Working Paper No. 51, Policy and Entrepreneurial Responses to the Montreal Protocol: Some Evidence from the Dynamic Asian Economies, by David C. O’Connor, December 1991. Working Paper No. 52, On the Pricing of LDC Debt: an Analysis Based on Historical Evidence from Latin America, by Beatriz Armendariz de Aghion, February 1992. Working Paper No. 53, Economic Regionalisation and Intra-Industry Trade: Pacific-Asian Perspectives, by Kiichiro Fukasaku, February 1992. Working Paper No. 54, Debt Conversions in Yugoslavia, by Mojmir Mrak, February 1992. Working Paper No. 55, Evaluation of Nigeria’s Debt-Relief Experience (1985-1990), by N.E. Ogbe, March 1992. Document de travail No. 56, L’Expérience de l’allégement de la dette du Mali, par Jean-Claude Berthélemy, février 1992. Working Paper No. 57, Conflict or Indifference: US Multinationals in a World of Regional Trading Blocs, by Louis T. Wells, Jr., March 1992. Working Paper No. 58, Japan’s Rapidly Emerging Strategy Toward Asia, by Edward J. Lincoln, April 1992.

Economic Growth and Poverty Reduction: Measurement and Policy Issues DEV/DOC(2005)06
© OECD 2005 50
Working Paper No. 59, The Political Economy of Stabilization Programmes in Developing Countries, by Bruno S. Frey and Reiner Eichenberger, April 1992. Working Paper No. 60, Some Implications of Europe 1992 for Developing Countries, by Sheila Page, April 1992. Working Paper No. 61, Taiwanese Corporations in Globalisation and Regionalisation, by Gee San, April 1992. Working Paper No. 62, Lessons from the Family Planning Experience for Community-Based Environmental Education, by Winifred Weekes-Vagliani, April 1992. Working Paper No. 63, Mexican Agriculture in the Free Trade Agreement: Transition Problems in Economic Reform, by Santiago Levy and Sweder van Wijnbergen, May 1992. Working Paper No. 64, Offensive and Defensive Responses by European Multinationals to a World of Trade Blocs, by John M. Stopford, May 1992. Working Paper No. 65, Economic Integration in the Pacific Region, by Richard Drobnick, May 1992. Working Paper No. 66, Latin America in a Changing Global Environment, by Winston Fritsch, May 1992. Working Paper No. 67, An Assessment of the Brady Plan Agreements, by Jean-Claude Berthélemy and Robert Lensink, May 1992. Working Paper No. 68, The Impact of Economic Reform on the Performance of the Seed Sector in Eastern and Southern Africa, by Elizabeth Cromwell, June 1992. Working Paper No. 69, Impact of Structural Adjustment and Adoption of Technology on Competitiveness of Major Cocoa Producing Countries, by Emily M. Bloomfield and R. Antony Lass, June 1992. Working Paper No. 70, Structural Adjustment and Moroccan Agriculture: an Assessment of the Reforms in the Sugar and Cereal Sectors, by Jonathan Kydd and Sophie Thoyer, June 1992. Document de travail No. 71, L’Allégement de la dette au Club de Paris : les évolutions récentes en perspective, par Ann Vourc’h, juin 1992. Working Paper No. 72, Biotechnology and the Changing Public/Private Sector Balance: Developments in Rice and Cocoa, by Carliene Brenner, July 1992. Working Paper No. 73, Namibian Agriculture: Policies and Prospects, by Walter Elkan, Peter Amutenya, Jochbeth Andima, Robin Sherbourne and Eline van der Linden, July 1992. Working Paper No. 74, Agriculture and the Policy Environment: Zambia and Zimbabwe, by Doris J. Jansen and Andrew Rukovo, July 1992. Working Paper No. 75, Agricultural Productivity and Economic Policies: Concepts and Measurements, by Yair Mundlak, August 1992. Working Paper No. 76, Structural Adjustment and the Institutional Dimensions of Agricultural Research and Development in Brazil: Soybeans, Wheat and Sugar Cane, by John Wilkinson and Bernardo Sorj, August 1992. Working Paper No. 77, The Impact of Laws and Regulations on Micro and Small Enterprises in Niger and Swaziland, by Isabelle Joumard, Carl Liedholm and Donald Mead, September 1992. Working Paper No. 78, Co-Financing Transactions between Multilateral Institutions and International Banks, by Michel Bouchet and Amit Ghose, October 1992. Document de travail No. 79, Allégement de la dette et croissance : le cas mexicain, par Jean-Claude Berthélemy et Ann Vourc’h, octobre 1992. Document de travail No. 80, Le Secteur informel en Tunisie : cadre réglementaire et pratique courante, par Abderrahman Ben Zakour et Farouk Kria, novembre 1992. Working Paper No. 81, Small-Scale Industries and Institutional Framework in Thailand, by Naruemol Bunjongjit and Xavier Oudin, November 1992. Working Paper No. 81a, Statistical Annex: Small-Scale Industries and Institutional Framework in Thailand, by Naruemol Bunjongjit and Xavier Oudin, November 1992. Document de travail No. 82, L’Expérience de l’allégement de la dette du Niger, par Ann Vourc’h et Maina Boukar Moussa, novembre 1992. Working Paper No. 83, Stabilization and Structural Adjustment in Indonesia: an Intertemporal General Equilibrium Analysis, by David Roland-Holst, November 1992. Working Paper No. 84, Striving for International Competitiveness: Lessons from Electronics for Developing Countries, by Jan Maarten de Vet, March 1993. Document de travail No. 85, Micro-entreprises et cadre institutionnel en Algérie, par Hocine Benissad, mars 1993. Working Paper No. 86, Informal Sector and Regulations in Ecuador and Jamaica, by Emilio Klein and Victor E. Tokman, August 1993. Working Paper No. 87, Alternative Explanations of the Trade-Output Correlation in the East Asian Economies, by Colin I. Bradford Jr. and Naomi Chakwin, August 1993. Document de travail No. 88, La Faisabilité politique de l’ajustement dans les pays africains, par Christian Morrisson, Jean-Dominique Lafay et Sébastien Dessus, novembre 1993. Working Paper No. 89, China as a Leading Pacific Economy, by Kiichiro Fukasaku and Mingyuan Wu, November 1993. Working Paper No. 90, A Detailed Input-Output Table for Morocco, 1990, by Maurizio Bussolo and David Roland-Holst November 1993. Working Paper No. 91, International Trade and the Transfer of Environmental Costs and Benefits, by Hiro Lee and David Roland-Holst, December 1993. Working Paper No. 92, Economic Instruments in Environmental Policy: Lessons from the OECD Experience and their Relevance to Developing Economies, by Jean-Philippe Barde, January 1994.

OECD Development Centre Working Paper No. 246 DEV/DOC(2005)06
© OECD 2005
51
Working Paper No. 93, What Can Developing Countries Learn from OECD Labour Market Programmes and Policies?, by Åsa Sohlman with David Turnham, January 1994. Working Paper No. 94, Trade Liberalization and Employment Linkages in the Pacific Basin, by Hiro Lee and David Roland-Holst, February 1994. Working Paper No. 95, Participatory Development and Gender: Articulating Concepts and Cases, by Winifred Weekes-Vagliani, February 1994. Document de travail No. 96, Promouvoir la maîtrise locale et régionale du développement : une démarche participative à Madagascar, par Philippe de Rham et Bernard Lecomte, juin 1994. Working Paper No. 97, The OECD Green Model: an Updated Overview, by Hiro Lee, Joaquim Oliveira-Martins and Dominique van der Mensbrugghe, August 1994. Working Paper No. 98, Pension Funds, Capital Controls and Macroeconomic Stability, by Helmut Reisen and John Williamson, August 1994. Working Paper No. 99, Trade and Pollution Linkages: Piecemeal Reform and Optimal Intervention, by John Beghin, David Roland-Holst and Dominique van der Mensbrugghe, October 1994. Working Paper No. 100, International Initiatives in Biotechnology for Developing Country Agriculture: Promises and Problems, by Carliene Brenner and John Komen, October 1994. Working Paper No. 101, Input-based Pollution Estimates for Environmental Assessment in Developing Countries, by Sébastien Dessus, David Roland-Holst and Dominique van der Mensbrugghe, October 1994. Working Paper No. 102, Transitional Problems from Reform to Growth: Safety Nets and Financial Efficiency in the Adjusting Egyptian Economy, by Mahmoud Abdel-Fadil, December 1994. Working Paper No. 103, Biotechnology and Sustainable Agriculture: Lessons from India, by Ghayur Alam, December 1994. Working Paper No. 104, Crop Biotechnology and Sustainability: a Case Study of Colombia, by Luis R. Sanint, January 1995. Working Paper No. 105, Biotechnology and Sustainable Agriculture: the Case of Mexico, by José Luis Solleiro Rebolledo, January 1995. Working Paper No. 106, Empirical Specifications for a General Equilibrium Analysis of Labor Market Policies and Adjustments, by Andréa Maechler and David Roland-Holst, May 1995. Document de travail No. 107, Les Migrants, partenaires de la coopération internationale : le cas des Maliens de France, par Christophe Daum, juillet 1995. Document de travail No. 108, Ouverture et croissance industrielle en Chine : étude empirique sur un échantillon de villes, par Sylvie Démurger, septembre 1995. Working Paper No. 109, Biotechnology and Sustainable Crop Production in Zimbabwe, by John J. Woodend, December 1995. Document de travail No. 110, Politiques de l’environnement et libéralisation des échanges au Costa Rica : une vue d’ensemble, par Sébastien Dessus et Maurizio Bussolo, février 1996. Working Paper No. 111, Grow Now/Clean Later, or the Pursuit of Sustainable Development?, by David O’Connor, March 1996. Working Paper No. 112, Economic Transition and Trade-Policy Reform: Lessons from China, by Kiichiro Fukasaku and Henri-Bernard Solignac Lecomte, July 1996. Working Paper No. 113, Chinese Outward Investment in Hong Kong: Trends, Prospects and Policy Implications, by Yun-Wing Sung, July 1996. Working Paper No. 114, Vertical Intra-industry Trade between China and OECD Countries, by Lisbeth Hellvin, July 1996. Document de travail No. 115, Le Rôle du capital public dans la croissance des pays en développement au cours des années 80, par Sébastien Dessus et Rémy Herrera, juillet 1996. Working Paper No. 116, General Equilibrium Modelling of Trade and the Environment, by John Beghin, Sébastien Dessus, David Roland-Holst and Dominique van der Mensbrugghe, September 1996. Working Paper No. 117, Labour Market Aspects of State Enterprise Reform in Viet Nam, by David O’Connor, September 1996. Document de travail No. 118, Croissance et compétitivité de l’industrie manufacturière au Sénégal, par Thierry Latreille et Aristomène Varoudakis, octobre 1996. Working Paper No. 119, Evidence on Trade and Wages in the Developing World, by Donald J. Robbins, December 1996. Working Paper No. 120, Liberalising Foreign Investments by Pension Funds: Positive and Normative Aspects, by Helmut Reisen, January 1997. Document de travail No. 121, Capital Humain, ouverture extérieure et croissance : estimation sur données de panel d’un modèle à coefficients variables, par Jean-Claude Berthélemy, Sébastien Dessus et Aristomène Varoudakis, janvier 1997. Working Paper No. 122, Corruption: The Issues, by Andrew W. Goudie and David Stasavage, January 1997. Working Paper No. 123, Outflows of Capital from China, by David Wall, March 1997. Working Paper No. 124, Emerging Market Risk and Sovereign Credit Ratings, by Guillermo Larraín, Helmut Reisen and Julia von Maltzan, April 1997. Working Paper No. 125, Urban Credit Co-operatives in China, by Eric Girardin and Xie Ping, August 1997. Working Paper No. 126, Fiscal Alternatives of Moving from Unfunded to Funded Pensions, by Robert Holzmann, August 1997. Working Paper No. 127, Trade Strategies for the Southern Mediterranean, by Peter A. Petri, December 1997. Working Paper No. 128, The Case of Missing Foreign Investment in the Southern Mediterranean, by Peter A. Petri, December 1997.

Economic Growth and Poverty Reduction: Measurement and Policy Issues DEV/DOC(2005)06
© OECD 2005 52
Working Paper No. 129, Economic Reform in Egypt in a Changing Global Economy, by Joseph Licari, December 1997. Working Paper No. 130, Do Funded Pensions Contribute to Higher Aggregate Savings? A Cross-Country Analysis, by Jeanine Bailliu and Helmut Reisen, December 1997. Working Paper No. 131, Long-run Growth Trends and Convergence Across Indian States, by Rayaprolu Nagaraj, Aristomène Varoudakis and Marie-Ange Véganzonès, January 1998. Working Paper No. 132, Sustainable and Excessive Current Account Deficits, by Helmut Reisen, February 1998. Working Paper No. 133, Intellectual Property Rights and Technology Transfer in Developing Country Agriculture: Rhetoric and Reality, by Carliene Brenner, March 1998. Working Paper No. 134, Exchange-rate Management and Manufactured Exports in Sub-Saharan Africa, by Khalid Sekkat and Aristomène Varoudakis, March 1998. Working Paper No. 135, Trade Integration with Europe, Export Diversification and Economic Growth in Egypt, by Sébastien Dessus and Akiko Suwa-Eisenmann, June 1998. Working Paper No. 136, Domestic Causes of Currency Crises: Policy Lessons for Crisis Avoidance, by Helmut Reisen, June 1998. Working Paper No. 137, A Simulation Model of Global Pension Investment, by Landis MacKellar and Helmut Reisen, August 1998. Working Paper No. 138, Determinants of Customs Fraud and Corruption: Evidence from Two African Countries, by David Stasavage and Cécile Daubrée, August 1998. Working Paper No. 139, State Infrastructure and Productive Performance in Indian Manufacturing, by Arup Mitra, Aristomène Varoudakis and Marie-Ange Véganzonès, August 1998. Working Paper No. 140, Rural Industrial Development in Viet Nam and China: A Study in Contrasts, by David O’Connor, September 1998. Working Paper No. 141,Labour Market Aspects of State Enterprise Reform in China, by Fan Gang,Maria Rosa Lunati and David O’Connor, October 1998. Working Paper No. 142, Fighting Extreme Poverty in Brazil: The Influence of Citizens’ Action on Government Policies, by Fernanda Lopes de Carvalho, November 1998. Working Paper No. 143, How Bad Governance Impedes Poverty Alleviation in Bangladesh, by Rehman Sobhan, November 1998. Document de travail No. 144, La libéralisation de l’agriculture tunisienne et l’Union européenne: une vue prospective, par Mohamed Abdelbasset Chemingui et Sébastien Dessus, février 1999. Working Paper No. 145, Economic Policy Reform and Growth Prospects in Emerging African Economies, by Patrick Guillaumont, Sylviane Guillaumont Jeanneney and Aristomène Varoudakis, March 1999. Working Paper No. 146, Structural Policies for International Competitiveness in Manufacturing: The Case of Cameroon, by Ludvig Söderling, March 1999. Working Paper No. 147, China’s Unfinished Open-Economy Reforms: Liberalisation of Services, by Kiichiro Fukasaku, Yu Ma and Qiumei Yang, April 1999. Working Paper No. 148, Boom and Bust and Sovereign Ratings, by Helmut Reisen and Julia von Maltzan, June 1999. Working Paper No. 149, Economic Opening and the Demand for Skills in Developing Countries: A Review of Theory and Evidence, by David O’Connor and Maria Rosa Lunati, June 1999. Working Paper No. 150, The Role of Capital Accumulation, Adjustment and Structural Change for Economic Take-off: Empirical Evidence from African Growth Episodes, by Jean-Claude Berthélemy and Ludvig Söderling, July 1999. Working Paper No. 151, Gender, Human Capital and Growth: Evidence from Six Latin American Countries, by Donald J. Robbins, September 1999. Working Paper No. 152, The Politics and Economics of Transition to an Open Market Economy in Viet Nam, by James Riedel and William S. Turley, September 1999. Working Paper No. 153, The Economics and Politics of Transition to an Open Market Economy: China, by Wing Thye Woo, October 1999. Working Paper No. 154, Infrastructure Development and Regulatory Reform in Sub-Saharan Africa: The Case of Air Transport, by Andrea E. Goldstein, October 1999. Working Paper No. 155, The Economics and Politics of Transition to an Open Market Economy: India, by Ashok V. Desai, October 1999. Working Paper No. 156, Climate Policy Without Tears: CGE-Based Ancillary Benefits Estimates for Chile, by Sébastien Dessus and David O’Connor, November 1999. Document de travail No. 157, Dépenses d’éducation, qualité de l’éducation et pauvreté : l’exemple de cinq pays d’Afrique francophone, par Katharina Michaelowa, avril 2000. Document de travail No. 158, Une estimation de la pauvreté en Afrique subsaharienne d’après les données anthropométriques, par Christian Morrisson, Hélène Guilmeau et Charles Linskens, mai 2000. Working Paper No. 159, Converging European Transitions, by Jorge Braga de Macedo, July 2000. Working Paper No. 160, Capital Flows and Growth in Developing Countries: Recent Empirical Evidence, by Marcelo Soto, July 2000. Working Paper No. 161, Global Capital Flows and the Environment in the 21st Century, by David O’Connor, July 2000. Working Paper No. 162, Financial Crises and International Architecture: A “Eurocentric” Perspective, by Jorge Braga de Macedo, August 2000. Document de travail No. 163, Résoudre le problème de la dette : de l’initiative PPTE à Cologne, par Anne Joseph, août 2000.

OECD Development Centre Working Paper No. 246 DEV/DOC(2005)06
© OECD 2005
53
Working Paper No. 164, E-Commerce for Development: Prospects and Policy Issues, by Andrea Goldstein and David O’Connor, September 2000. Working Paper No. 165, Negative Alchemy? Corruption and Composition of Capital Flows, by Shang-Jin Wei, October 2000. Working Paper No. 166, The HIPC Initiative: True and False Promises, by Daniel Cohen, October 2000. Document de travail No. 167, Les facteurs explicatifs de la malnutrition en Afrique subsaharienne, par Christian Morrisson et Charles Linskens, octobre 2000. Working Paper No. 168, Human Capital and Growth: A Synthesis Report, by Christopher A. Pissarides, November 2000. Working Paper No. 169, Obstacles to Expanding Intra-African Trade, by Roberto Longo and Khalid Sekkat, March 2001. Working Paper No. 170, Regional Integration In West Africa, by Ernest Aryeetey, March 2001. Working Paper No. 171, Regional Integration Experience in the Eastern African Region, by Andrea Goldstein and Njuguna S. Ndung’u, March 2001. Working Paper No. 172, Integration and Co-operation in Southern Africa, by Carolyn Jenkins, March 2001. Working Paper No. 173, FDI in Sub-Saharan Africa, by Ludger Odenthal, March 2001 Document de travail No. 174, La réforme des télécommunications en Afrique subsaharienne, par Patrick Plane, mars 2001. Working Paper No. 175, Fighting Corruption in Customs Administration: What Can We Learn from Recent Experiences?, by Irène Hors; April 2001. Working Paper No. 176, Globalisation and Transformation: Illusions and Reality, by Grzegorz W. Kolodko, May 2001. Working Paper No. 177, External Solvency, Dollarisation and Investment Grade: Towards a Virtuous Circle?, by Martin Grandes, June 2001. Document de travail No. 178, Congo 1965-1999: Les espoirs déçus du « Brésil africain », par Joseph Maton avec Henri-Bernard Solignac Lecomte, septembre 2001. Working Paper No. 179, Growth and Human Capital: Good Data, Good Results, by Daniel Cohen and Marcelo Soto, September 2001. Working Paper No. 180, Corporate Governance and National Development, by Charles P. Oman, October 2001. Working Paper No. 181, How Globalisation Improves Governance, by Federico Bonaglia, Jorge Braga de Macedo and Maurizio Bussolo, November 2001. Working Paper No. 182, Clearing the Air in India: The Economics of Climate Policy with Ancillary Benefits, by Maurizio Bussolo and David O’Connor, November 2001. Working Paper No. 183, Globalisation, Poverty and Inequality in sub-Saharan Africa: A Political Economy Appraisal, by Yvonne M. Tsikata, December 2001. Working Paper No. 184, Distribution and Growth in Latin America in an Era of Structural Reform: The Impact of Globalisation, by Samuel A. Morley, December 2001. Working Paper No. 185, Globalisation, Liberalisation, Poverty and Income Inequality in Southeast Asia, by K.S. Jomo, December 2001. Working Paper No. 186, Globalisation, Growth and Income Inequality: The African Experience, by Steve Kayizzi-Mugerwa, December 2001. Working Paper No. 187, The Social Impact of Globalisation in Southeast Asia, by Mari Pangestu, December 2001. Working Paper No. 188, Where Does Inequality Come From? Ideas and Implications for Latin America, by James A. Robinson, December 2001. Working Paper No. 189, Policies and Institutions for E-Commerce Readiness: What Can Developing Countries Learn from OECD Experience?, by Paulo Bastos Tigre and David O’Connor, April 2002. Document de travail No. 190, La réforme du secteur financier en Afrique, par Anne Joseph, juillet 2002. Working Paper No. 191, Virtuous Circles? Human Capital Formation, Economic Development and the Multinational Enterprise, by Ethan B. Kapstein, August 2002. Working Paper No. 192, Skill Upgrading in Developing Countries: Has Inward Foreign Direct Investment Played a Role?, by Matthew J. Slaughter, August 2002. Working Paper No. 193, Government Policies for Inward Foreign Direct Investment in Developing Countries: Implications for Human Capital Formation and Income Inequality, by Dirk Willem te Velde, August 2002. Working Paper No. 194, Foreign Direct Investment and Intellectual Capital Formation in Southeast Asia, by Bryan K. Ritchie, August 2002. Working Paper No. 195, FDI and Human Capital: A Research Agenda, by Magnus Blomström and Ari Kokko, August 2002. Working Paper No. 196, Knowledge Diffusion from Multinational Enterprises: The Role of Domestic and Foreign Knowledge-Enhancing Activities, by Yasuyuki Todo and Koji Miyamoto, August 2002. Working Paper No. 197, Why Are Some Countries So Poor? Another Look at the Evidence and a Message of Hope, by Daniel Cohen and Marcelo Soto, October 2002. Working Paper No. 198, Choice of an Exchange-Rate Arrangement, Institutional Setting and Inflation: Empirical Evidence from Latin America, by Andreas Freytag, October 2002. Working Paper No. 199, Will Basel II Affect International Capital Flows to Emerging Markets?, by Beatrice Weder and Michael Wedow, October 2002. Working Paper No. 200, Convergence and Divergence of Sovereign Bond Spreads: Lessons from Latin America, by Martin Grandes, October 2002. Working Paper No. 201, Prospects for Emerging-Market Flows amid Investor Concerns about Corporate Governance, by Helmut Reisen, November 2002.

Economic Growth and Poverty Reduction: Measurement and Policy Issues DEV/DOC(2005)06
© OECD 2005 54
Working Paper No. 202, Rediscovering Education in Growth Regressions, by Marcelo Soto, November 2002. Working Paper No. 203, Incentive Bidding for Mobile Investment: Economic Consequences and Potential Responses, by Andrew Charlton, January 2003. Working Paper No. 204, Health Insurance for the Poor? Determinants of participation Community-Based Health Insurance Schemes in Rural Senegal, by Johannes Jütting, January 2003. Working Paper No. 205, China’s Software Industry and its Implications for India, by Ted Tschang, February 2003. Working Paper No. 206, Agricultural and Human Health Impacts of Climate Policy in China: A General Equilibrium Analysis with Special Reference to Guangdong, by David O’Connor, Fan Zhai, Kristin Aunan, Terje Berntsen and Haakon Vennemo, March 2003. Working Paper No. 207, India’s Information Technology Sector: What Contribution to Broader Economic Development?, by Nirvikar Singh, March 2003. Working Paper No. 208, Public Procurement: Lessons from Kenya, Tanzania and Uganda, by Walter Odhiambo and Paul Kamau, March 2003. Working Paper No. 209, Export Diversification in Low-Income Countries: An International Challenge after Doha, by Federico Bonaglia and Kiichiro Fukasaku, June 2003. Working Paper No. 210, Institutions and Development: A Critical Review, by Johannes Jütting, July 2003. Working Paper No. 211, Human Capital Formation and Foreign Direct Investment in Developing Countries, by Koji Miyamoto, July 2003. Working Paper No. 212, Central Asia since 1991: The Experience of the New Independent States, by Richard Pomfret, July 2003. Working Paper No. 213, A Multi-Region Social Accounting Matrix (1995) and Regional Environmental General Equilibrium Model for India (REGEMI), by Maurizio Bussolo, Mohamed Chemingui and David O’Connor, November 2003. Working Paper No. 214, Ratings Since the Asian Crisis, by Helmut Reisen, November 2003. Working Paper No. 215, Development Redux: Reflections for a New Paradigm, by Jorge Braga de Macedo, November 2003. Working Paper No. 216, The Political Economy of Regulatory Reform: Telecoms in the Southern Mediterranean, by Andrea Goldstein, November 2003. Working Paper No. 217, The Impact of Education on Fertility and Child Mortality: Do Fathers Really Matter Less than Mothers?, by Lucia Breierova and Esther Duflo, November 2003. Working Paper No. 218, Float in Order to Fix? Lessons from Emerging Markets for EU Accession Countries, by Jorge Braga de Macedo and Helmut Reisen, November 2003. Working Paper No. 219, Globalisation in Developing Countries: The Role of Transaction Costs in Explaining Economic Performance in India, by Maurizio Bussolo and John Whalley, November 2003. Working Paper No. 220, Poverty Reduction Strategies in a Budget-Constrained Economy: The Case of Ghana, by Maurizio Bussolo and Jeffery I. Round, November 2003. Working Paper No. 221, Public-Private Partnerships in Development: Three Applications in Timor Leste, by José Braz, November 2003. Working Paper No. 222, Public Opinion Research, Global Education and Development Co-operation Reform: In Search of a Virtuous Circle, by Ida Mc Donnell, Henri-Bernard Solignac Lecomte and Liam Wegimont, November 2003. Working Paper No. 223, Building Capacity to Trade: What Are the Priorities?, by Henry-Bernard Solignac Lecomte, November 2003. Working Paper No. 224, Of Flying Geeks and O-Rings: Locating Software and IT Services in India’s Economic Development, by David O’Connor, November 2003. Document de travail No. 225, Cap Vert: Gouvernance et Développement, par Jaime Lourenço and Colm Foy, novembre 2003. Working Paper No. 226, Globalisation and Poverty Changes in Colombia, by Maurizio Bussolo and Jann Lay, November 2003. Working Paper No. 227, The Composite Indicator of Economic Activity in Mozambique (ICAE): Filling in the Knowledge Gaps to Enhance Public-Private Partnership (PPP), by Roberto J. Tibana, November 2003. Working Paper No. 228, Economic-Reconstruction in Post-Conflict Transitions: Lessons for the Democratic Republic of Congo (DRC), by Graciana del Castillo, November 2003. Working Paper No. 229, Providing Low-Cost Information Technology Access to Rural Communities In Developing Countries: What Works? What Pays? by Georg Caspary and David O’Connor, November 2003. Working Paper No. 230, The Currency Premium and Local-Currency Denominated Debt Costs in South Africa, by Martin Grandes, Marcel Peter and Nicolas Pinaud, December 2003. Working Paper No. 231, Macroeconomic Convergence in Southern Africa: The Rand Zone Experience, by Martin Grandes, December 2003. Working Paper No. 232, Financing Global and Regional Public Goods through ODA: Analysis and Evidence from the OECD Creditor Reporting System, by Helmut Reisen, Marcelo Soto and Thomas Weithöner, January 2004. Working Paper No. 233, Land, Violent Conflict and Development, by Nicolas Pons-Vignon and Henri-Bernard Solignac Lecomte, February 2004. Working Paper No. 234, The Impact of Social Institutions on the Economic Role of Women in Developing Countries, by Christian Morrisson and Johannes Jütting, May 2004. Document de travail No. 235, La condition desfemmes en Inde, Kenya, Soudan et Tunisie, par Christian Morrisson, août 2004. Working Paper No. 236, Decentralisation and Poverty in Developing Countries: Exploring the Impact, by Johannes Jütting, Céline Kauffmann, Ida Mc Donnell, Holger Osterrieder, Nicolas Pinaud and Lucia Wegner, August 2004. Working Paper No. 237, Natural Disasters and Adaptive Capacity, by Jeff Dayton-Johnson, August 2004.

OECD Development Centre Working Paper No. 246 DEV/DOC(2005)06
© OECD 2005
55
Working Paper No. 238, Public Opinion Polling and the Millennium Development Goals, by Jude Fransman, Alphonse L. MacDonnald, Ida Mc Donnell and Nicolas Pons-Vignon, October 2004. Working Paper No. 239, Overcoming Barriers to Competitiveness, by Orsetta Causa and Daniel Cohen, December 2004. Working Paper No. 240, Extending Insurance? Funeral Associations in Ethiopia and Tanzania, by Stefan Dercon, Tessa Bold, Joachim De Weerdt and Alula Pankhurst, December 2004. Working Paper No. 241, Macroeconomic Policies: New Issues of Interdependence, by Helmut Reisen, Martin Grandes and Nicolas Pinaud, January 2005. Working Paper No. 242, Institutional Change and its Impact on the Poor and Excluded: The Indian Decentralisation Experience, by D. Narayana, January 2005. Working Paper No. 243, Impact of Changes in Social Institutions on Income Inequality in China, by Hiroko Uchimura, May 2005. Working Paper No. 244, Priorities in Global Assistance for Health, AIDS and Population (HAP), by Landis MacKellar, June 2005. Working Paper No. 245, Trade and Structural Adjustment Policies in Selected Developing Countries, by Jens Andersson, Federico Bonaglia, Kiichiro Fukasaku and Caroline Lesser, July 2005.