Embed Size (px)
Citation preview
ODOUR DISPERSION STUDY
NESS ENERGY PROJECT, ABERDEEN (SCOTLAND)
IN/MA-21/0464-001/01
July, 2021
Environment Division
IN/MA-21/0464-001/01 8th July 2021 1
Odour Dispersion Study
Ness Energy Project, Aberdeen (Scotland)
INDEX
Página
1. INTRODUCTION AND OBJECTIVES ............................................................................. 2
2. ODOUR IMMISSION CRITERIA ..................................................................................... 3
3. SELECTION OF THE REPRESENTATIVE METEOROLOGICAL YEAR ........................ 4
3.1 WRF METEOROLOGYCAL DATA ........................................................................ 5
3.1 DYCE (NOAA) ......................................................................................................10
4. ODOUR EMISSION POINT SOURCE ...........................................................................16
5. DESCRIPTION AND INPUT DATA TO THE CALPUFF DISPERSION
MODEL ..........................................................................................................................18
5.1 Introduction ...........................................................................................................18
5.2 General review .....................................................................................................19
5.3 Data required for the calmet application................................................................21
5.4 Data required for the calpuff application................................................................22
5.5 Information and input data to the dispersion model ...............................................25
5.5.1 Selected area of study for modelling ..............................................................................25
5.5.2 Generation of the wind field in the study area ................................................................26
5.5.3 Definition of odour emission source ...............................................................................32
6. CONTRIBUTION OF THE PROJECT TO THE ODOUR LEVELS ..................................35
7. CONCLUSIONS ............................................................................................................37

Environment Division
IN/MA-21/0464-001/01 8th July 2021 2
Odour Dispersion Study
Ness Energy Project, Aberdeen (Scotland)
1. INTRODUCTION AND OBJECTIVES
This document presents the odour dispersion study carried out for the facilities projected
by ACCIONA in the West Tullos industrial area, at the south of Aberdeen (Scotland). The Project
consists of an “energy from waste power plan”t which will process residual household and
commercial waste that would have otherwise been disposed into landfill.
The project will have a deodorization system, so the purpose of the study is to estimate
odour levels in the surroundings and to verify through the use of modeling techniques if the
emission levels provided for this deodorization system are appropriate to verify the standards set
by the Scottish Environmental Protection Agency, SEPA.
For the development of the previous analyses, the CALPUFF dispersion model will be
used, which is included in the Guideline on Air Quality Models1 of the Unites States
Environmental Protection Agency (US EPA) and which depends, among others many factors, on
the characterization of the emissions, the meteorology and the topography of the area.
The selection of the representative meteorological year for the simulations with Calpuff
model, will be carried out analysing the period 2018-2020.
So, considering the objectives expressed above, the document presented will have the
following structure:
1. Introduction and objectives
2. Odour immission criteria
3. Selection of the representative meteorological year
4. Odour emissions point source
5. Description and input data to the CALPUFF dispersion model
6. Contribution of the Project to the odour levels
7. Conclusions
1 Appendix W to 40 cfr part 51

Environment Division
IN/MA-21/0464-001/01 8th July 2021 3
Odour Dispersion Study
Ness Energy Project, Aberdeen (Scotland)
2. ODOUR IMMISSION CRITERIA
SEPA, in “H4 Odour Management” Technical Guidance, provides ‘benchmark levels’ that
indicate the likelihood of unacceptable odour pollution. The benchmarks are based on the 98th
percentile of hourly average concentrations of odour modelled over a year at the site/installation
boundary. The benchmarks are:
- 1.5 odour units for most offensive odours;
- 3 odour units for moderately offensive odours;
- 6 odour units for less offensive odours.
Processes involving decaying animal or fish remains, processes involving septic effluent
or sludge and biological landfill odours are considered as “most offensive odours”. So, an odour
concentration of 1.5 ou/m3 is considered as target to be met at the boundary of the Plant.
Environment Division
IN/MA-21/0464-001/01 8th July 2021 4
Odour Dispersion Study
Ness Energy Project, Aberdeen (Scotland)
3. SELECTION OF THE REPRESENTATIVE METEOROLOGICAL YEAR
According to “H4 Odour Management” Technical Guidance, to represent conditions for
an “average year”, hourly meteorological data for a period of at least three should be used.
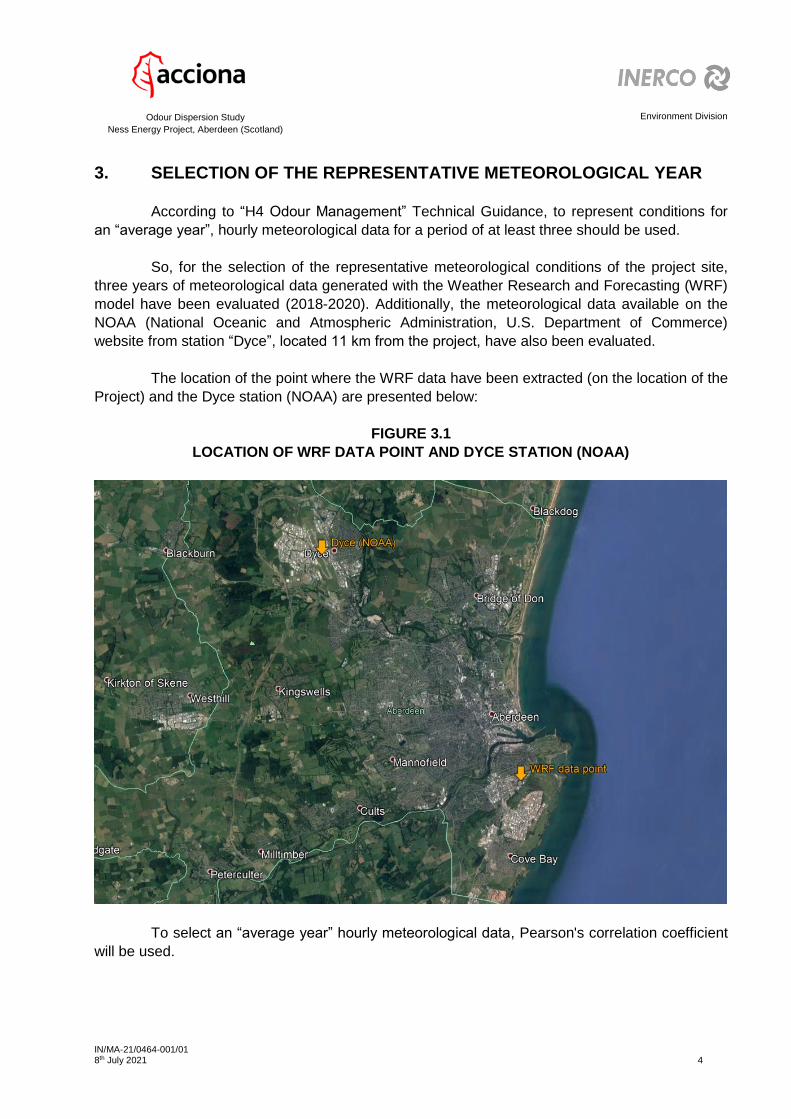
So, for the selection of the representative meteorological conditions of the project site,
three years of meteorological data generated with the Weather Research and Forecasting (WRF)
model have been evaluated (2018-2020). Additionally, the meteorological data available on the
NOAA (National Oceanic and Atmospheric Administration, U.S. Department of Commerce)
website from station “Dyce”, located 11 km from the project, have also been evaluated.
The location of the point where the WRF data have been extracted (on the location of the
Project) and the Dyce station (NOAA) are presented below:
FIGURE 3.1
LOCATION OF WRF DATA POINT AND DYCE STATION (NOAA)
To select an “average year” hourly meteorological data, Pearson's correlation coefficient
will be used.
Environment Division
IN/MA-21/0464-001/01 8th July 2021 5
Odour Dispersion Study
Ness Energy Project, Aberdeen (Scotland)
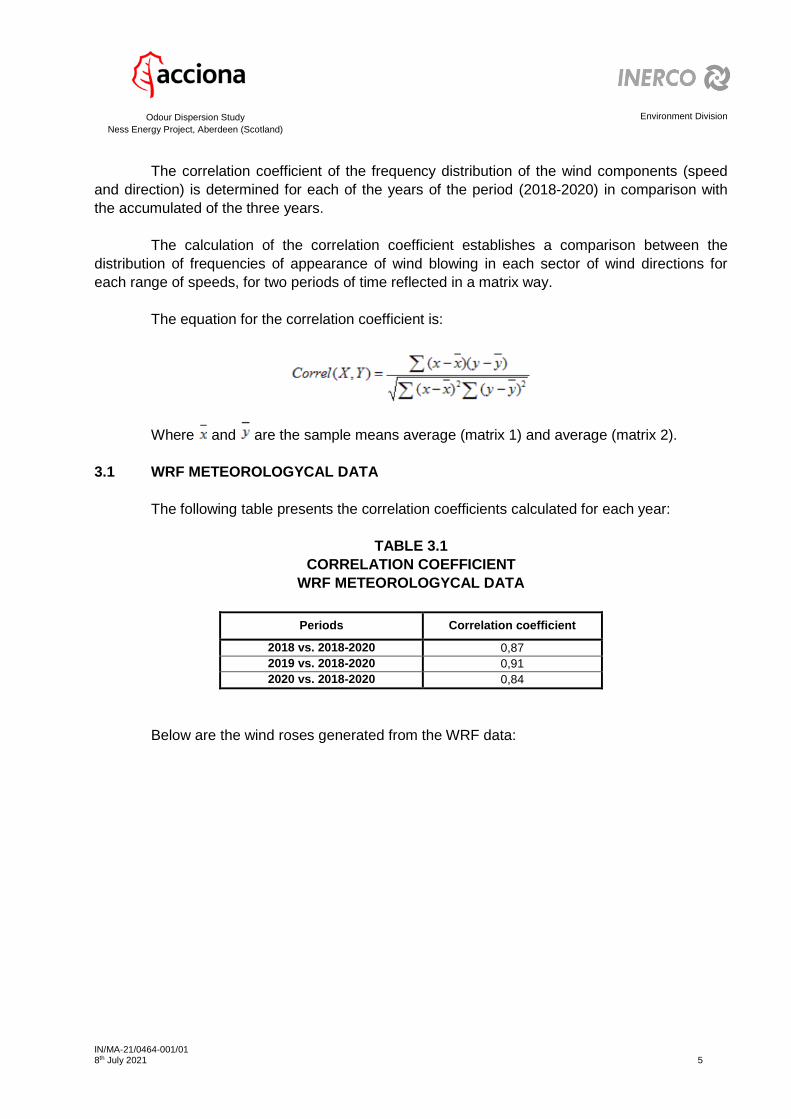
The correlation coefficient of the frequency distribution of the wind components (speed
and direction) is determined for each of the years of the period (2018-2020) in comparison with
the accumulated of the three years.
The calculation of the correlation coefficient establishes a comparison between the
distribution of frequencies of appearance of wind blowing in each sector of wind directions for
each range of speeds, for two periods of time reflected in a matrix way.
The equation for the correlation coefficient is:
Where and are the sample means average (matrix 1) and average (matrix 2).
3.1 WRF METEOROLOGYCAL DATA
The following table presents the correlation coefficients calculated for each year:
TABLE 3.1
CORRELATION COEFFICIENT
WRF METEOROLOGYCAL DATA
Periods Correlation coefficient
2018 vs. 2018-2020 0,87
2019 vs. 2018-2020 0,91
2020 vs. 2018-2020 0,84
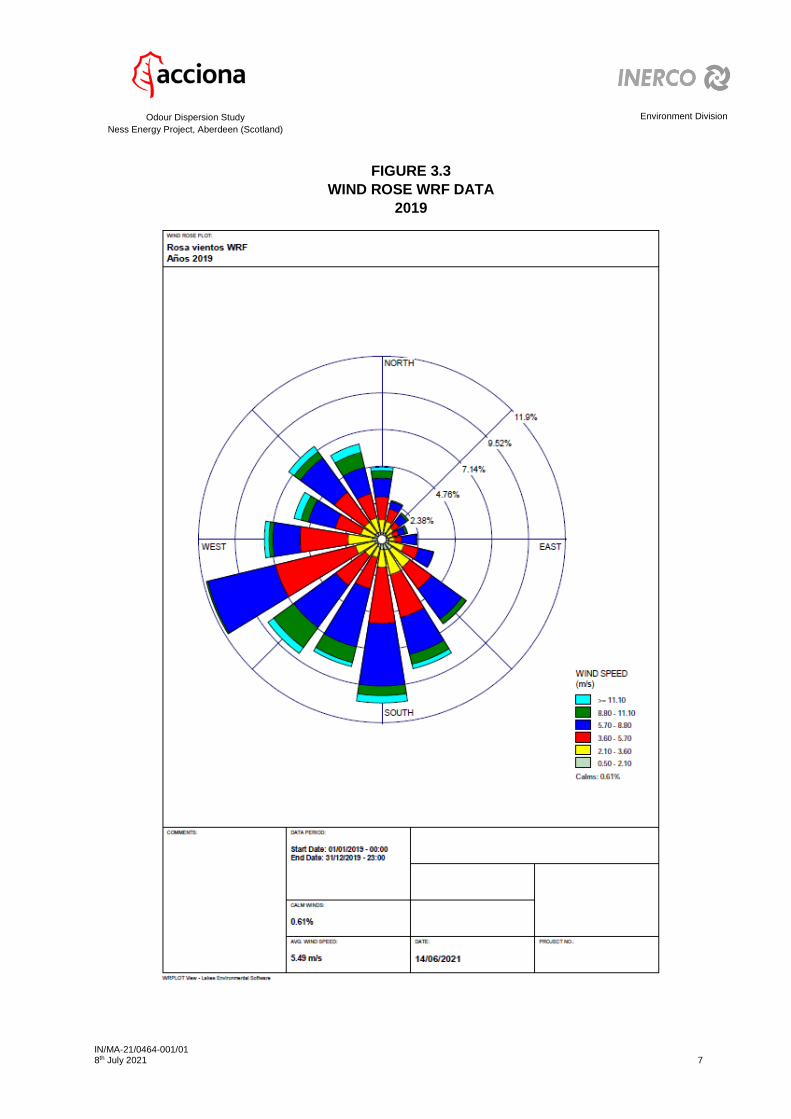
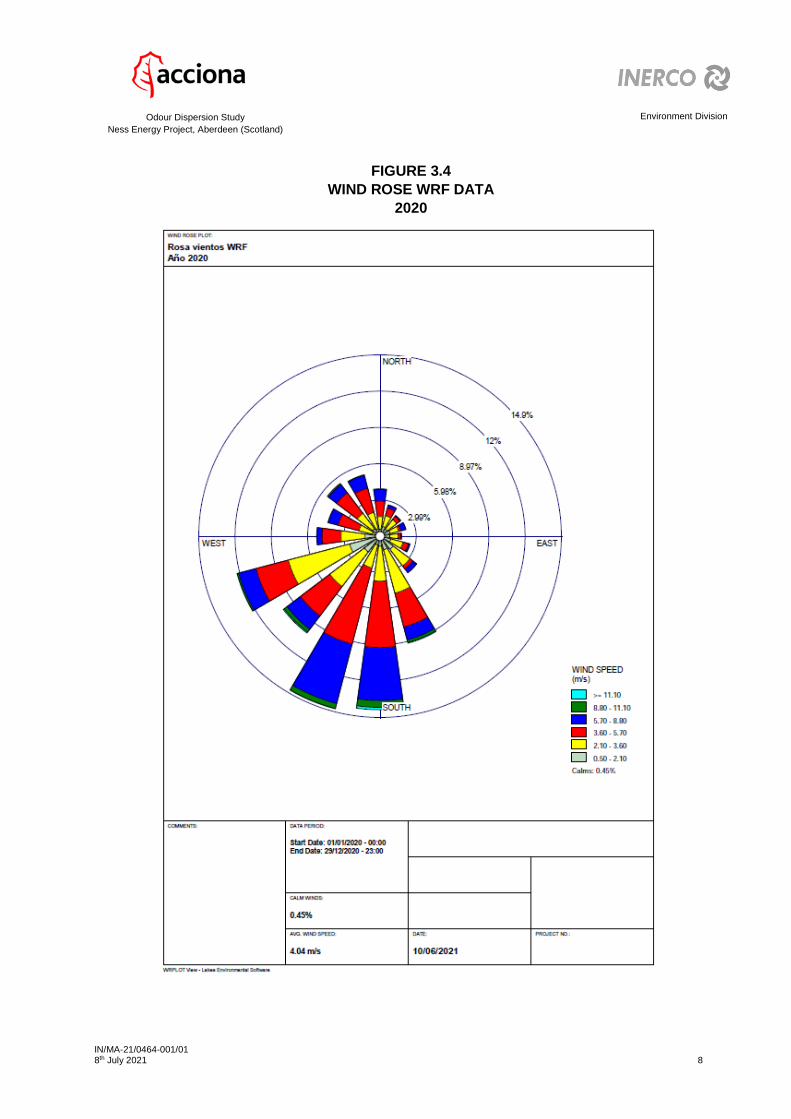
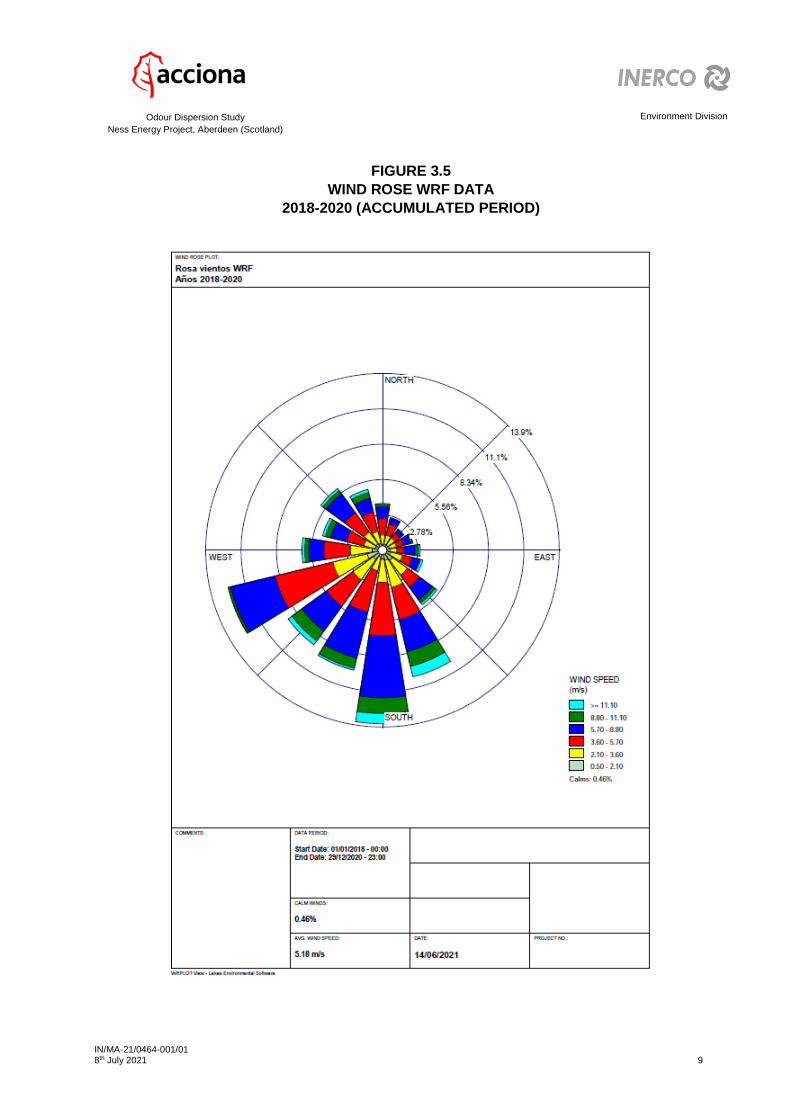
Below are the wind roses generated from the WRF data:
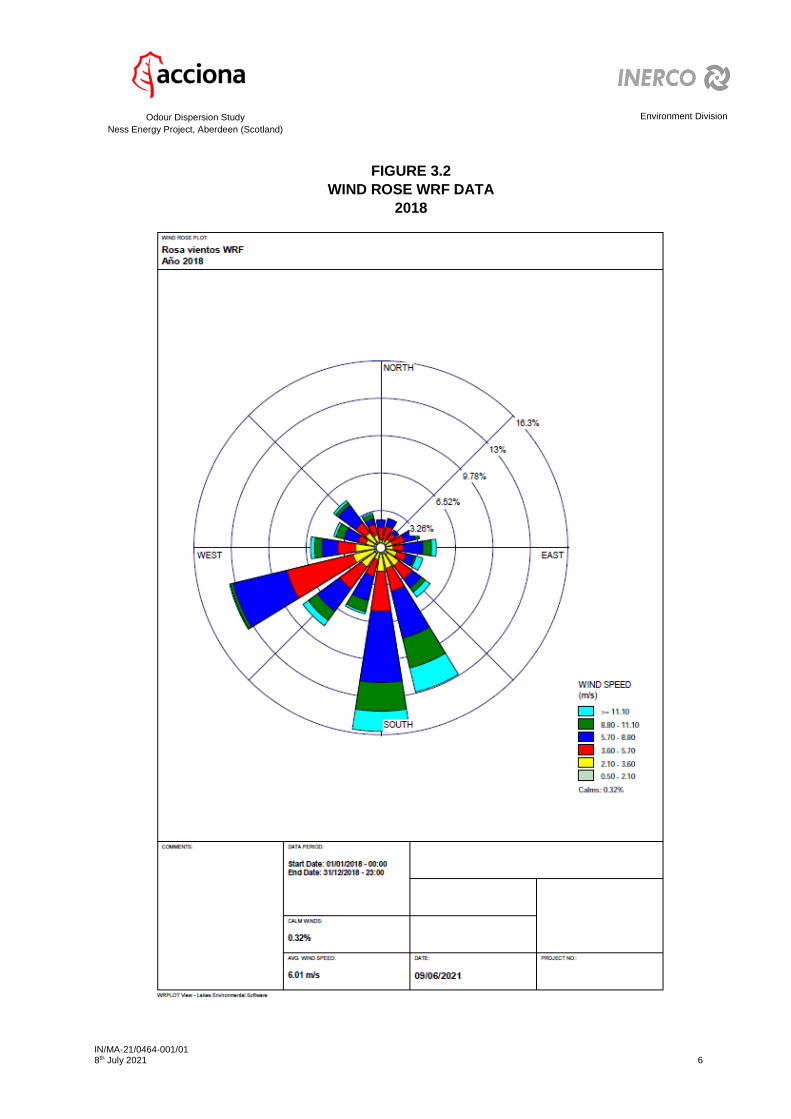
Environment Division
IN/MA-21/0464-001/01 8th July 2021 6
Odour Dispersion Study
Ness Energy Project, Aberdeen (Scotland)
FIGURE 3.2
WIND ROSE WRF DATA
2018
Environment Division
IN/MA-21/0464-001/01 8th July 2021 7
Odour Dispersion Study
Ness Energy Project, Aberdeen (Scotland)
FIGURE 3.3
WIND ROSE WRF DATA
2019
Environment Division
IN/MA-21/0464-001/01 8th July 2021 8
Odour Dispersion Study
Ness Energy Project, Aberdeen (Scotland)
FIGURE 3.4
WIND ROSE WRF DATA
2020
Environment Division
IN/MA-21/0464-001/01 8th July 2021 9
Odour Dispersion Study
Ness Energy Project, Aberdeen (Scotland)
FIGURE 3.5
WIND ROSE WRF DATA
2018-2020 (ACCUMULATED PERIOD)
Environment Division
IN/MA-21/0464-001/01 8th July 2021 10
Odour Dispersion Study
Ness Energy Project, Aberdeen (Scotland)
3.1 DYCE (NOAA)
The following table presents the correlation coefficients calculated for each year:
TABLE 3.2
CORRELATION COEFFICIENT
DYCE STATION DATA (NOAA)
Periods Correlation coefficient
2018 vs. 2018-2020 0,98
2019 vs. 2018-2020 0,98
2020 vs. 2018-2020 0,98
Below are the wind roses generated from Dyce station data (NOAA):
Environment Division
IN/MA-21/0464-001/01 8th July 2021 11
Odour Dispersion Study
Ness Energy Project, Aberdeen (Scotland)
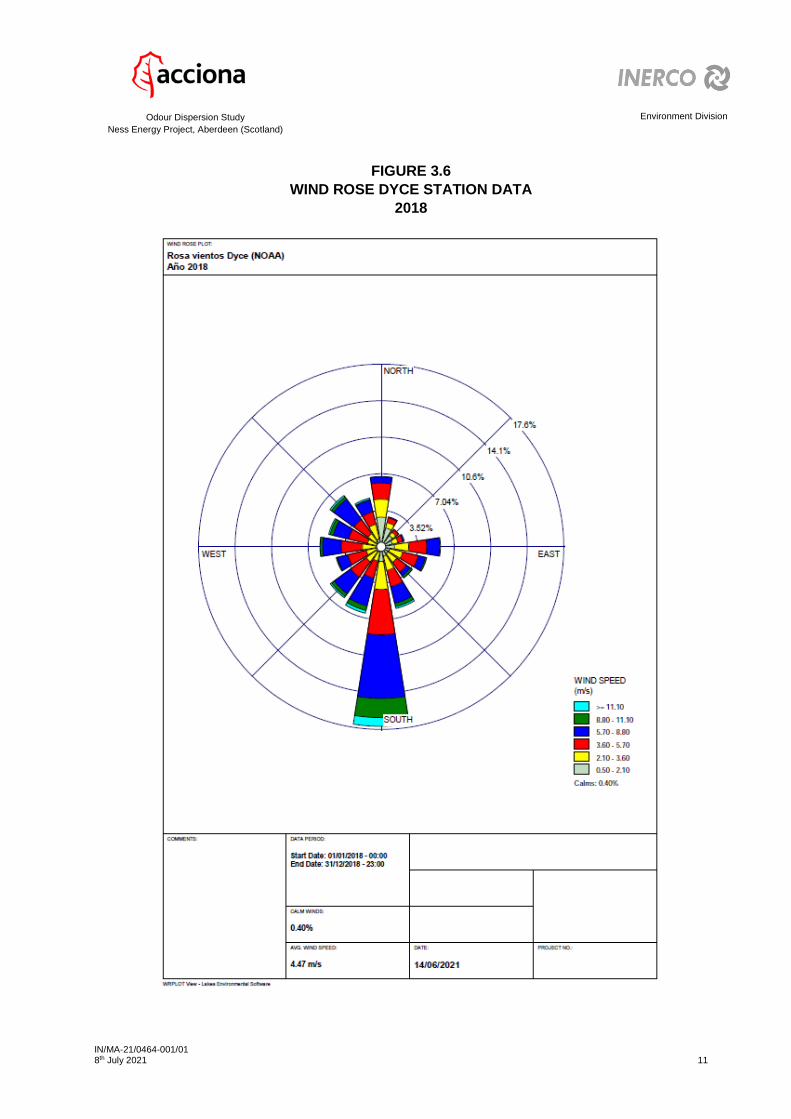
FIGURE 3.6
WIND ROSE DYCE STATION DATA
2018
Environment Division
IN/MA-21/0464-001/01 8th July 2021 12
Odour Dispersion Study
Ness Energy Project, Aberdeen (Scotland)
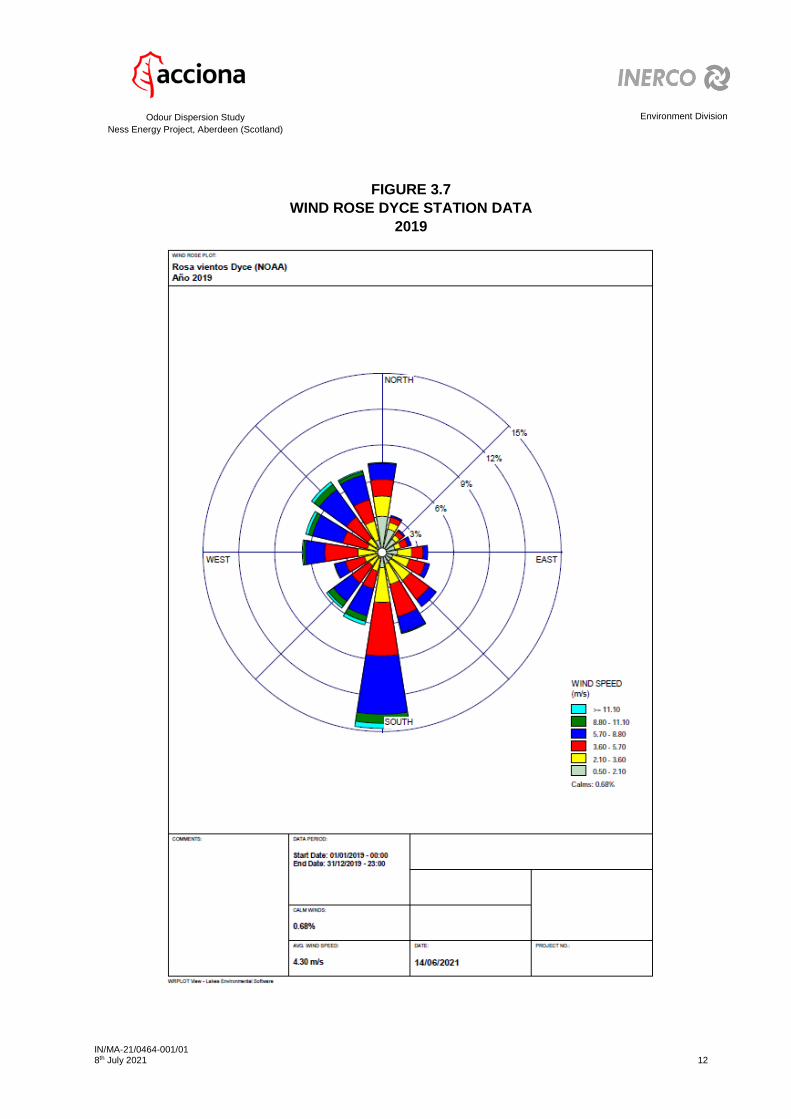
FIGURE 3.7
WIND ROSE DYCE STATION DATA
2019
Environment Division
IN/MA-21/0464-001/01 8th July 2021 13
Odour Dispersion Study
Ness Energy Project, Aberdeen (Scotland)
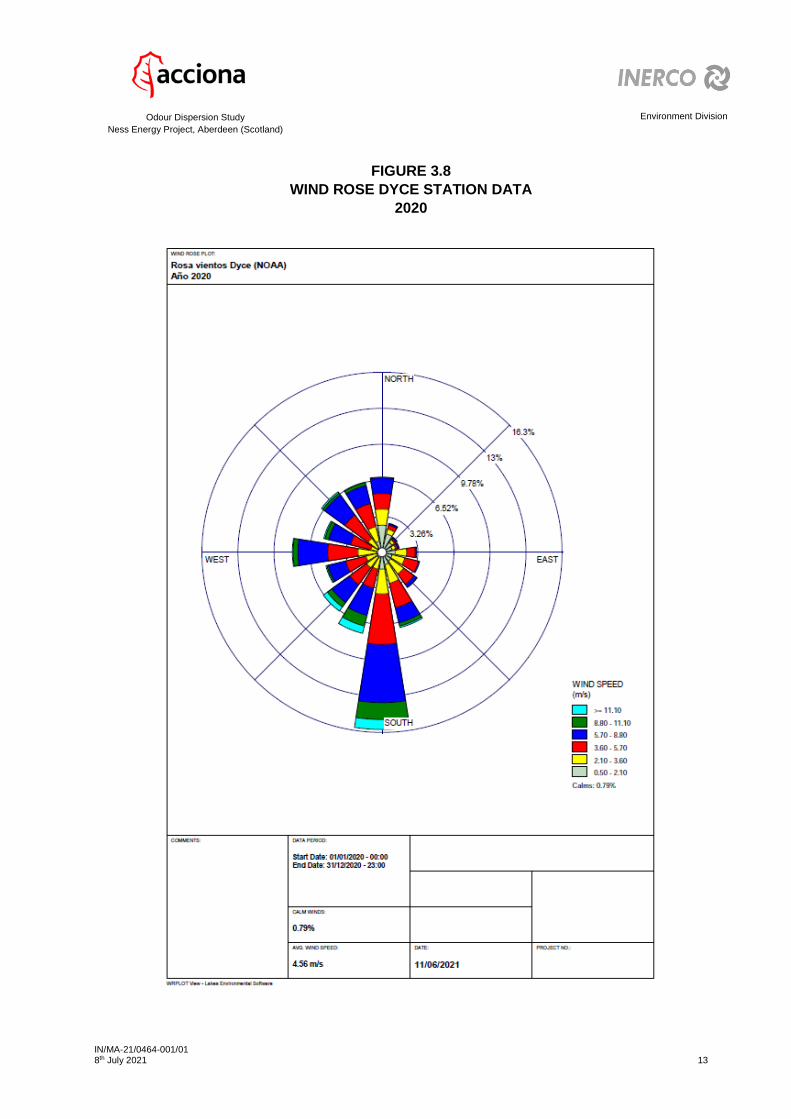
FIGURE 3.8
WIND ROSE DYCE STATION DATA
2020
Environment Division
IN/MA-21/0464-001/01 8th July 2021 14
Odour Dispersion Study
Ness Energy Project, Aberdeen (Scotland)
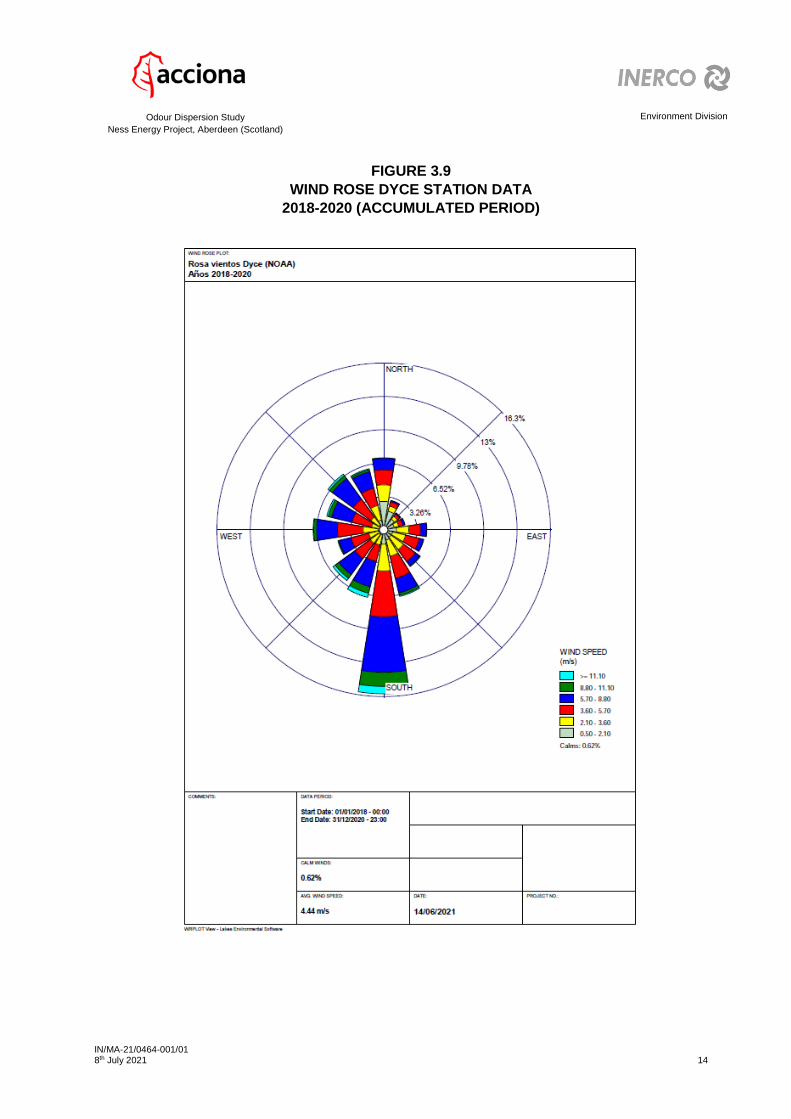
FIGURE 3.9
WIND ROSE DYCE STATION DATA
2018-2020 (ACCUMULATED PERIOD)

Environment Division
IN/MA-21/0464-001/01 8th July 2021 15
Odour Dispersion Study
Ness Energy Project, Aberdeen (Scotland)
As main conclusion after the meteorological study seen before, taking into account that
the correlation coefficient of the Dyce station (NOAA) is the same for all years, the year 2019 will
be simulated since it is the year with the highest correlation coefficient of the WRF data (0.91).

Environment Division
IN/MA-21/0464-001/01 8th July 2021 16
Odour Dispersion Study
Ness Energy Project, Aberdeen (Scotland)
4. ODOUR EMISSION POINT SOURCE
The odour emission point source is associated with the deodorization system. The
location of the stack in the Project facilities is presented below.
FIGURE 4.1
LOCATION OF THE STACK ON THE PLOT PLAN
The plant will have a deodorization system based on an adsorption process with
activated carbon. Considering the type of effluents to be treated and based on the supplier's
experience, it is expected that the efficiency of the process will allow reaching an odor
concentration in the exhaust gases around 780 ou/m3.
Environment Division
IN/MA-21/0464-001/01 8th July 2021 17
Odour Dispersion Study
Ness Energy Project, Aberdeen (Scotland)
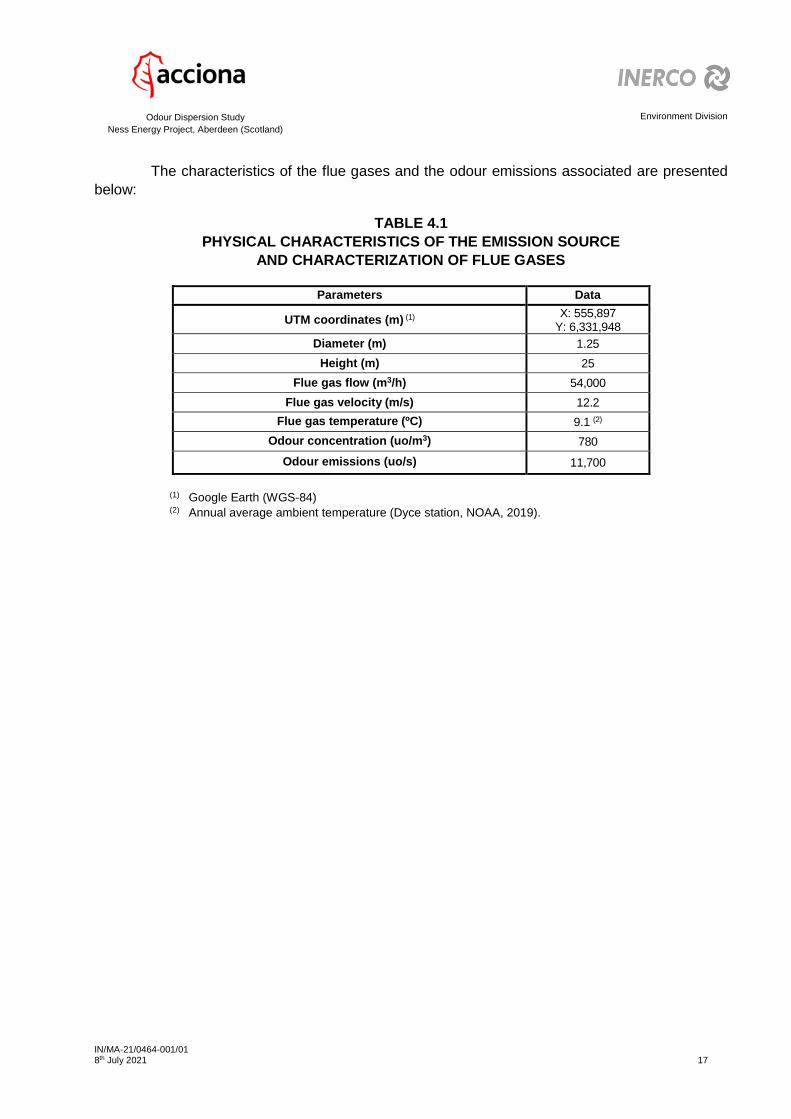
The characteristics of the flue gases and the odour emissions associated are presented
below:
TABLE 4.1
PHYSICAL CHARACTERISTICS OF THE EMISSION SOURCE
AND CHARACTERIZATION OF FLUE GASES
Parameters Data
UTM coordinates (m) (1) X: 555,897
Y: 6,331,948
Diameter (m) 1.25
Height (m) 25
Flue gas flow (m3/h) 54,000
Flue gas velocity (m/s) 12.2
Flue gas temperature (ºC) 9.1 (2)
Odour concentration (uo/m3) 780
Odour emissions (uo/s) 11,700
(1) Google Earth (WGS-84) (2) Annual average ambient temperature (Dyce station, NOAA, 2019).
Environment Division
IN/MA-21/0464-001/01 8th July 2021 18
Odour Dispersion Study
Ness Energy Project, Aberdeen (Scotland)
5. DESCRIPTION AND INPUT DATA TO THE CALPUFF DISPERSION
MODEL
5.1 INTRODUCTION
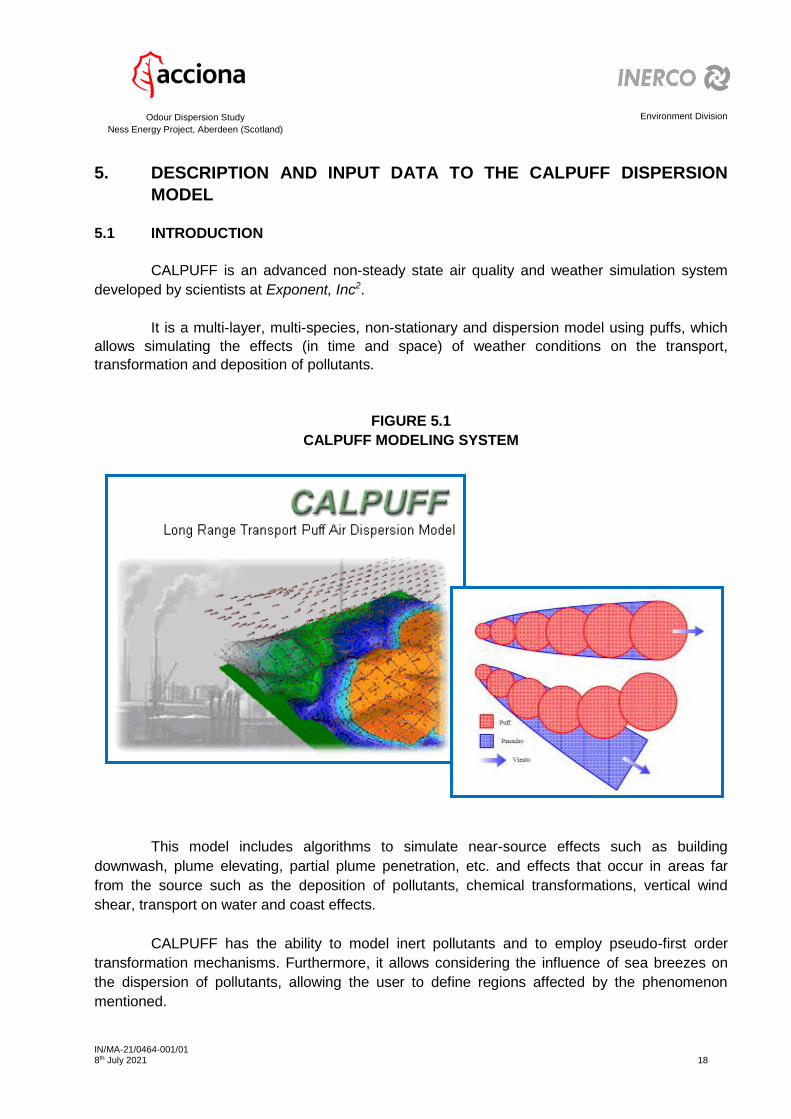
CALPUFF is an advanced non-steady state air quality and weather simulation system
developed by scientists at Exponent, Inc2.
It is a multi-layer, multi-species, non-stationary and dispersion model using puffs, which
allows simulating the effects (in time and space) of weather conditions on the transport,
transformation and deposition of pollutants.
FIGURE 5.1
CALPUFF MODELING SYSTEM
This model includes algorithms to simulate near-source effects such as building
downwash, plume elevating, partial plume penetration, etc. and effects that occur in areas far
from the source such as the deposition of pollutants, chemical transformations, vertical wind
shear, transport on water and coast effects.
CALPUFF has the ability to model inert pollutants and to employ pseudo-first order
transformation mechanisms. Furthermore, it allows considering the influence of sea breezes on
the dispersion of pollutants, allowing the user to define regions affected by the phenomenon
mentioned.
Environment Division
IN/MA-21/0464-001/01 8th July 2021 19
Odour Dispersion Study
Ness Energy Project, Aberdeen (Scotland)
The system also has the peculiarity of including simple modules of chemical
transformation, which allow studying and calculating some secondary species such as sulphates
(SO42-) and nitrates (NO3
-).
The United States Environmental Protection Agency (US EPA) presents the CALPUFF
modelling system (Guideline of Air Quality Models) as one of the systems applicable to the
transport of pollutants on a large scale (from 50 to 200 km from the source) and also for its
application at local scales where non-stationary effects can be important (calms of wind, breezes,
recirculation and other effects due to the type of terrain or coast).
5.2 GENERAL REVIEW
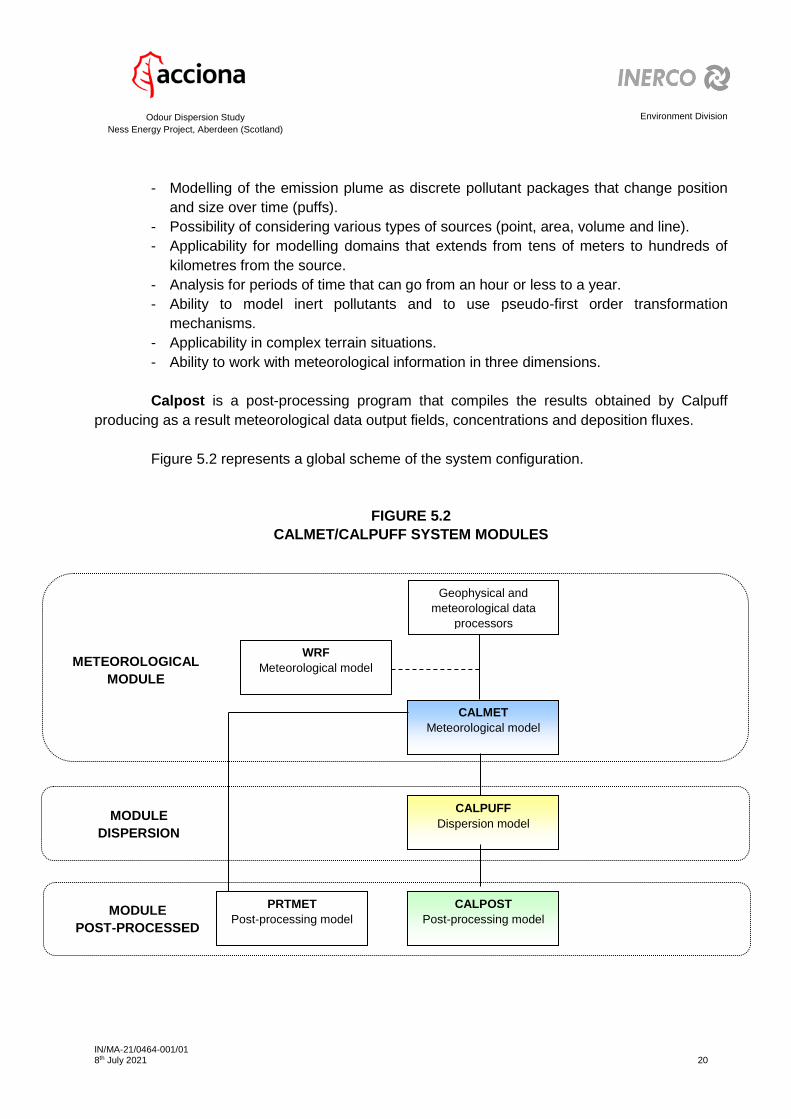
The CALPUFF model consists of three main components: Calmet, Calpuff and Calpost
and a long list of pre-processor and post-processor programs designed to provide the model with
meteorology and topographic databases in a suitable format.
Calmet is a meteorological model that develops hourly wind fields on a three-
dimensional grid that covers the entire modelling domain. In addition to reproducing the wind
fields of the region, Calmet has a micrometeorology module that describes the characteristics of
the mixing layer and develops three-dimensional temperature fields, as well as other parameters
that Calpuff uses to model the dispersion of pollutants. Additionally, Calmet has an option that
allows the use of wind fields generated by the WRF forecast model, either as the initial wind field
or as pseudo-observations together with other input data to the model.
Calpuff is a transport and dispersion model that models puffs of pollutants emitted from
the sources considered, simulating the dispersion and transformation processes along their route
and considering the wind fields designed by Calmet. The main characteristics of this pollutant
dispersion modelling system are:
2 http://www.src.com/
Environment Division
IN/MA-21/0464-001/01 8th July 2021 20
Odour Dispersion Study
Ness Energy Project, Aberdeen (Scotland)
- Modelling of the emission plume as discrete pollutant packages that change position
and size over time (puffs).
- Possibility of considering various types of sources (point, area, volume and line).
- Applicability for modelling domains that extends from tens of meters to hundreds of
kilometres from the source.
- Analysis for periods of time that can go from an hour or less to a year.
- Ability to model inert pollutants and to use pseudo-first order transformation
mechanisms.
- Applicability in complex terrain situations.
- Ability to work with meteorological information in three dimensions.
Calpost is a post-processing program that compiles the results obtained by Calpuff
producing as a result meteorological data output fields, concentrations and deposition fluxes.
Figure 5.2 represents a global scheme of the system configuration.
FIGURE 5.2
CALMET/CALPUFF SYSTEM MODULES
Geophysical and
meteorological data
processors
CALMET
Meteorological model
WRF
Meteorological model
CALPUFF
Dispersion model
CALPOST
Post-processing model
PRTMET
Post-processing model
METEOROLOGICAL
MODULE
MODULE
DISPERSION
MODULE
POST-PROCESSED
Environment Division
IN/MA-21/0464-001/01 8th July 2021 21
Odour Dispersion Study
Ness Energy Project, Aberdeen (Scotland)
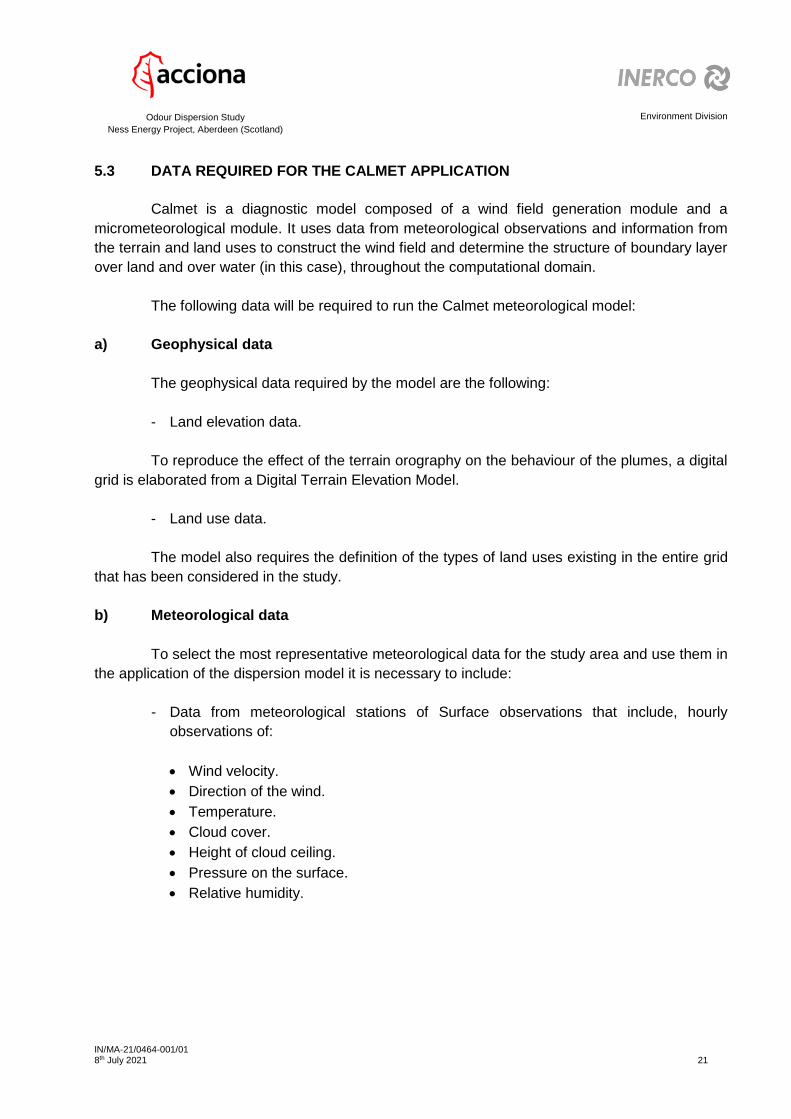
5.3 DATA REQUIRED FOR THE CALMET APPLICATION
Calmet is a diagnostic model composed of a wind field generation module and a
micrometeorological module. It uses data from meteorological observations and information from
the terrain and land uses to construct the wind field and determine the structure of boundary layer
over land and over water (in this case), throughout the computational domain.
The following data will be required to run the Calmet meteorological model:
a) Geophysical data
The geophysical data required by the model are the following:
- Land elevation data.
To reproduce the effect of the terrain orography on the behaviour of the plumes, a digital
grid is elaborated from a Digital Terrain Elevation Model.
- Land use data.
The model also requires the definition of the types of land uses existing in the entire grid
that has been considered in the study.
b) Meteorological data
To select the most representative meteorological data for the study area and use them in
the application of the dispersion model it is necessary to include:
- Data from meteorological stations of Surface observations that include, hourly
observations of:
Wind velocity.
Direction of the wind.
Temperature.
Cloud cover.
Height of cloud ceiling.
Pressure on the surface.
Relative humidity.
Environment Division
IN/MA-21/0464-001/01 8th July 2021 22
Odour Dispersion Study
Ness Energy Project, Aberdeen (Scotland)
- Data from an altitude observation station that provides representative vertical profiles
(twice a day) of:
Wind velocity.
Direction of the wind
Temperature
Pressure
- In case of needing to calculate concentration or wet deposition flows, the input of
precipitation data to the model will be required, the required hourly data being:
Precipitation rates
Precipitation type code (part of the Surface data file)
- Besides, meteorological data can be optionally included in stations located in the sea
(buoys, boats, etc.). These data can be hourly, daily, monthly or even seasonal and
must contain:
Air-sea temperature difference
Air temperature
Relative humidity
Mixing height
Wind velocity
Direction of the wind
Temperature gradients above and below the mixed layer.
- Finally, initial hourly wind field data can be included from forecast model output files
such as:
WRF model output
5.4 DATA REQUIRED FOR THE CALPUFF APPLICATION
Calpuff is a transport and dispersion model that models “packets” (puffs) of pollutants
emitted from the sources considered, simulating the dispersion and transformation processes
along its route and considering the wind fields designed by Calmet.
Environment Division
IN/MA-21/0464-001/01 8th July 2021 23
Odour Dispersion Study
Ness Energy Project, Aberdeen (Scotland)
The Calpuff atmospheric dispersion model is composed of a series of modules that must
be completed in order to carry out the model. The information to include is indicated below:
a) Emission source data and aerodynamic effect of structures
The data of the emission sources for the application of the model are geometric or
operational:
- Geometrics:
Coordinates of location and height above sea level.
Height and diameter at the stack outlet.
- Operative:
Temperature and exit velocity of the gases emitted.
Pollutant emissions
Nevertheless, the parameters to be defined for each of the emission sources will depend
on the type of source selected (point, line, area, etc.).
On the other hand, it should be noted that the CALPUFF model has the BPIP (Building
Profile Input Program) module to consider the aerodynamic effect of the structures. Therefore, the
model includes algorithms to simulate effects close to sources such as building downwash.
b) Receptors
Receptors are defined as those points where the concentration of pollutants at ground
level is to be calculated. These are obtained from a grid created in the environment of the
installation’s emission sources.
Additionally, discrete receptors are defined at those points in the study area where it is of
interest to calculate the contribution of pollutant emissions (inhabited areas, spaces of ecological
interest, etc.).
c) Other model options
Among the different options offered by the Calpuff model, it is possible to select those
that achieve a simulation closer to the reality of the process of atmospheric dispersion. The main
options are:
Environment Division
IN/MA-21/0464-001/01 8th July 2021 24
Odour Dispersion Study
Ness Energy Project, Aberdeen (Scotland)
- Dispersion
For the simulation of pollutant dispersion, the Calpuff model requires the definition of the
following issues:
· Selection of the type of element to be used in the modelling (puffs or slugs).
· Characterisation of the dispersion plume.
· Definition of the methodology used in the calculation of the dispersion coefficient.
· Direct measurement of turbulence.
· Micro-meteorological parameters.
· PGT dispersion coefficients or MESOPUFF II coefficients.
- Elevation of the plume.
Emissions from a stack can rise above the height of the stack. This is owing to the
difference in temperature between the ambient temperature and the flue gas temperature. The
vertical position of the plume depends on the magnitude of this gradient and the speed of output.
Calpuff supplies various algorithms for calculating the dimensions and development of
the plume, taking into account several factors such as:
· Calculation of the plume at different distances or calculation of the final height of
the plume.
· Stacktip downwash effect (plume below source).
· Vertical shearing.
· Partial plume penetration in the inversion layer.
- Dry deposition
Calpuff includes a module that calculates the dry deposition rates of gases and particles
as a function of the physical parameters, the meteorological conditions and the pollutant species
being modelled. The model has the option of allowing the user to enter daytime deposition rates.
- Wet deposition
Calpuff uses an empirical sweep coefficient to consider pollutant carryover and wet
deposition flows as a result of precipitation. The sweep coefficients are constituted as a function
of the type of pollutants and the type of precipitation (liquid, frost, …).
Environment Division
IN/MA-21/0464-001/01 8th July 2021 25
Odour Dispersion Study
Ness Energy Project, Aberdeen (Scotland)
- Coastal effects
Calpuff can simulate the effects of pollutant transport, dispersion and deposition on water
surfaces.
When sources are located in close proximity to large bodies of water, effects on
emissions can occur. It can be shown that, if the temperature of the water body does not change,
during the day it will have a lower mixing layer than the surrounding water.
- Chemical transformations
The model includes a module to consider chemical transformations following a 5 species
scheme (SO2, SO42-, NOx, HNO3 y NO3
-) known as MESOPUFF II or a 6 species scheme (SO2,
SO42-, NO, NO2, HNO3 y NO3
-) known as RIVAD/ARM3.
- Complex terrains.
The shock of the scattering plume on a hill is evaluated considering that the current line
(Hd) is divided in two:
· A part surrounding the hill (low Hd).
· Another part that rises above it (high Hd).
5.5 INFORMATION AND INPUT DATA TO THE DISPERSION MODEL
5.5.1 Selected area of study for modelling
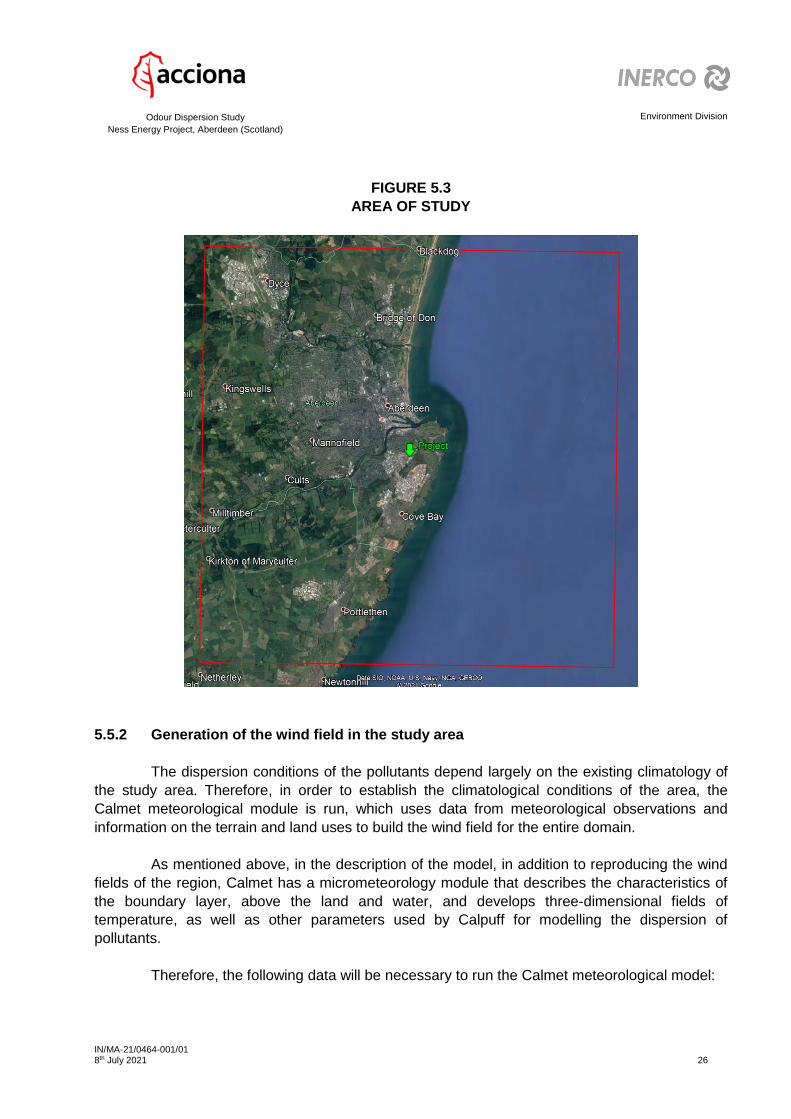
The area of study selected for the simulation of the odour dispersion from the new
facilities in Aberdeen (Scotland), consists of a square of dimensions 6 km in a North-South
direction and 6 km in an East-West direction, focused on the location of the facilities
themselves. Below is an image of the study area:
Environment Division
IN/MA-21/0464-001/01 8th July 2021 26
Odour Dispersion Study
Ness Energy Project, Aberdeen (Scotland)
FIGURE 5.3
AREA OF STUDY
5.5.2 Generation of the wind field in the study area
The dispersion conditions of the pollutants depend largely on the existing climatology of
the study area. Therefore, in order to establish the climatological conditions of the area, the
Calmet meteorological module is run, which uses data from meteorological observations and
information on the terrain and land uses to build the wind field for the entire domain.
As mentioned above, in the description of the model, in addition to reproducing the wind
fields of the region, Calmet has a micrometeorology module that describes the characteristics of
the boundary layer, above the land and water, and develops three-dimensional fields of
temperature, as well as other parameters used by Calpuff for modelling the dispersion of
pollutants.
Therefore, the following data will be necessary to run the Calmet meteorological model:
Environment Division
IN/MA-21/0464-001/01 8th July 2021 27
Odour Dispersion Study
Ness Energy Project, Aberdeen (Scotland)
5.5.2.1 Initial wind field
The final wind field generated with the Calmet meteorological module starts from an
initial wind field, generated by the Weather Research and Forecasting (WRF) weather model,
which is adjusted considering the effects of the terrain and the meteorological data from stations
available in the area.
The WRF model is a numerical climate prediction system designed for both operational
and research applications. The following entities have participated in the development of WRF:
National Center for Atmospheric Research (NCAR), National Oceanic and Atmospheric
Administration (represented by the National Center for Environmental Prediction (NCEP) and the
Forecast Systems Laboratory (FSL), Air Force Weather Agency (AFWA), Naval Research
Laboratory, University of Oklahoma and Federal Aviation Administration (FAA).
WRF reflects advanced, flexible and portable code that is efficient in computing
environments from a large number of parallel supercomputers to portable computers. Its
individual modular source code can be configured for both research and operational applications.
WRF is maintained and supported as a community model to facilitate its wide use
internationally, for research, operations and teaching. It is valid for a wide range of applications
from small scales to global simulations. These applications include real-time numerical prediction,
data assimilation study and development, parameterised physical properties research, regional
climate simulations, air quality models and ideal simulations.
The configuration of the WRF model used for the generation of meteorological data is as
follows:
Environment Division
IN/MA-21/0464-001/01 8th July 2021 28
Odour Dispersion Study
Ness Energy Project, Aberdeen (Scotland)
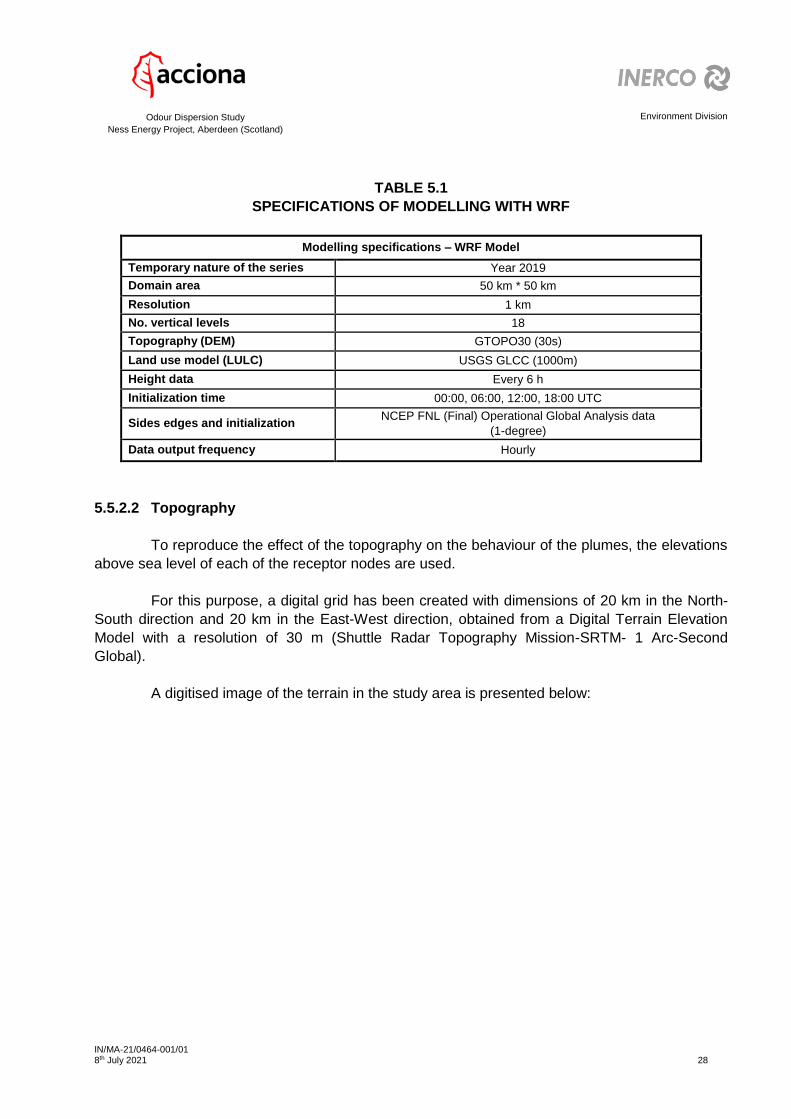
TABLE 5.1
SPECIFICATIONS OF MODELLING WITH WRF
Modelling specifications – WRF Model
Temporary nature of the series Year 2019
Domain area 50 km * 50 km
Resolution 1 km
No. vertical levels 18
Topography (DEM) GTOPO30 (30s)
Land use model (LULC) USGS GLCC (1000m)
Height data Every 6 h
Initialization time 00:00, 06:00, 12:00, 18:00 UTC
Sides edges and initialization NCEP FNL (Final) Operational Global Analysis data
(1-degree)
Data output frequency Hourly
5.5.2.2 Topography
To reproduce the effect of the topography on the behaviour of the plumes, the elevations
above sea level of each of the receptor nodes are used.
For this purpose, a digital grid has been created with dimensions of 20 km in the North-
South direction and 20 km in the East-West direction, obtained from a Digital Terrain Elevation
Model with a resolution of 30 m (Shuttle Radar Topography Mission-SRTM- 1 Arc-Second
Global).
A digitised image of the terrain in the study area is presented below:
Environment Division
IN/MA-21/0464-001/01 8th July 2021 29
Odour Dispersion Study
Ness Energy Project, Aberdeen (Scotland)
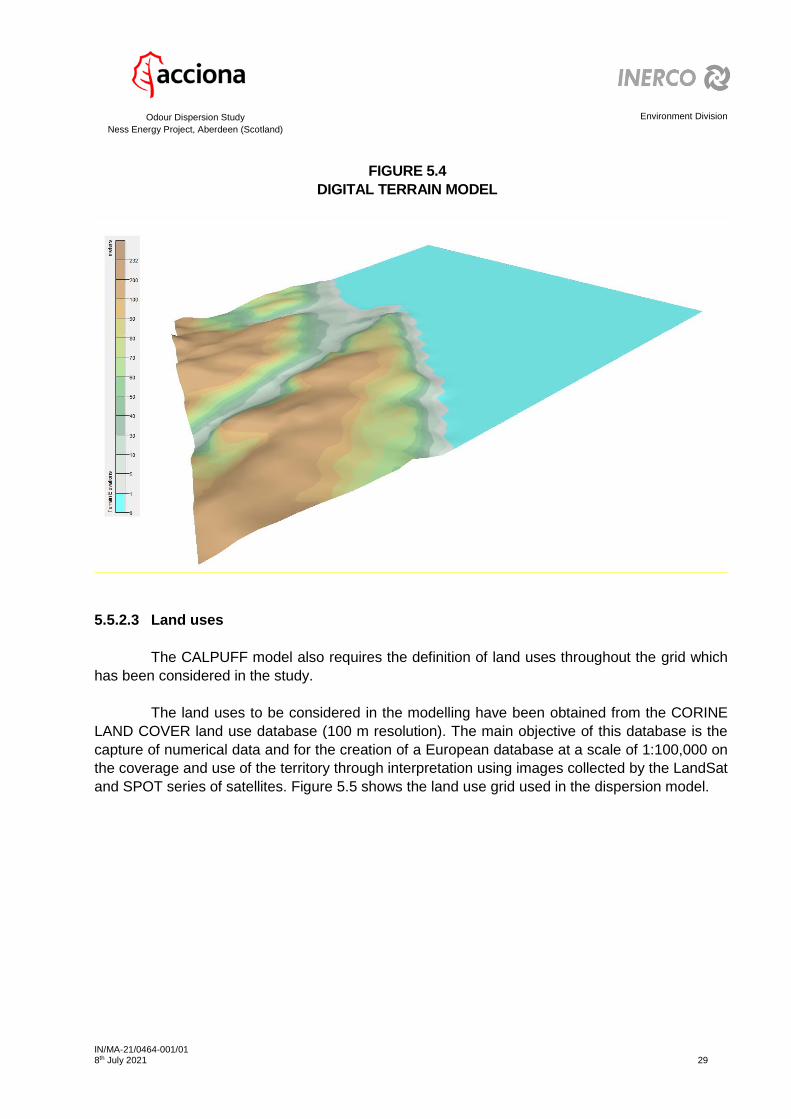
FIGURE 5.4
DIGITAL TERRAIN MODEL
5.5.2.3 Land uses
The CALPUFF model also requires the definition of land uses throughout the grid which
has been considered in the study.
The land uses to be considered in the modelling have been obtained from the CORINE
LAND COVER land use database (100 m resolution). The main objective of this database is the
capture of numerical data and for the creation of a European database at a scale of 1:100,000 on
the coverage and use of the territory through interpretation using images collected by the LandSat
and SPOT series of satellites. Figure 5.5 shows the land use grid used in the dispersion model.

Environment Division
IN/MA-21/0464-001/01 8th July 2021 30
Odour Dispersion Study
Ness Energy Project, Aberdeen (Scotland)
FIGURE 5.5
LAND USE GRID
Land Use Codes: 80 (Tree-free Plain), 55 (Seas and Oceans), 40 (Forest Lands), 20 (Agricultural Lands) y 10
(Urban or Construction Land).
5.5.2.4 Surface meteorological data and upper air data
In order to take into account surface meteorological data representative of the
climatological conditions in the area, the meteorological data from the following station have been
included in the model:
- “Dyce” station (available on the NOAA website).
Wind rose from Dyce was shown in Figure 3.7.

Environment Division
IN/MA-21/0464-001/01 8th July 2021 31
Odour Dispersion Study
Ness Energy Project, Aberdeen (Scotland)
In addition to weather data recorded on the surface, the model requires vertical weather
data profiles. Since no station is available to record meteorological upper air data, data from the
WRF forecast meteorological model have been used throughout the study area.
As an example, the wind rose generated from the WRF meteorological data at surface
level for a point on the location of the project was presented in Figure 3.2.
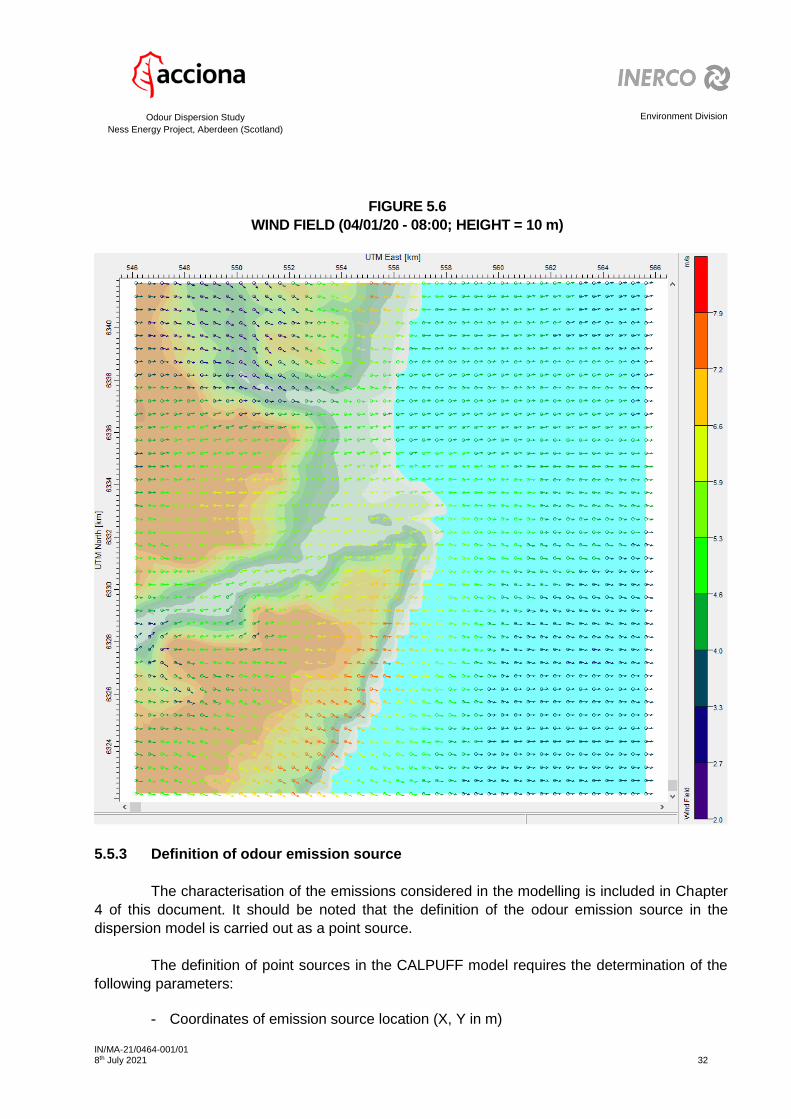
5.5.2.5 Wind field
Once the Calmet meteorological module has been executed, the hourly wind fields are
obtained in the study area for all selected heights.
Below is an image of the wind field generated by Calmet, for a specific hour and for a
height of 10 m.
As can be seen in the images of the hourly wind fields, for each point of the defined grid
a vector is obtained that defines the direction of the wind and which has a different colour
depending on the speed.
Environment Division
IN/MA-21/0464-001/01 8th July 2021 32
Odour Dispersion Study
Ness Energy Project, Aberdeen (Scotland)
FIGURE 5.6
WIND FIELD (04/01/20 - 08:00; HEIGHT = 10 m)
5.5.3 Definition of odour emission source
The characterisation of the emissions considered in the modelling is included in Chapter
4 of this document. It should be noted that the definition of the odour emission source in the
dispersion model is carried out as a point source.
The definition of point sources in the CALPUFF model requires the determination of the
following parameters:
- Coordinates of emission source location (X, Y in m)
Environment Division
IN/MA-21/0464-001/01 8th July 2021 33
Odour Dispersion Study
Ness Energy Project, Aberdeen (Scotland)
- Ground level at that point (m)
- Stack height (m)
- Stack diameter (m)
- Flue gas velocity (m/s)
- Flue gas temperature (K)
- Pollutant emission rates (g/s)
In the simulations that have been carried out, the effect of the structures of the
installation that, due to their dimensions, may have some effect on the dispersion of pollutants,
has also been considered.
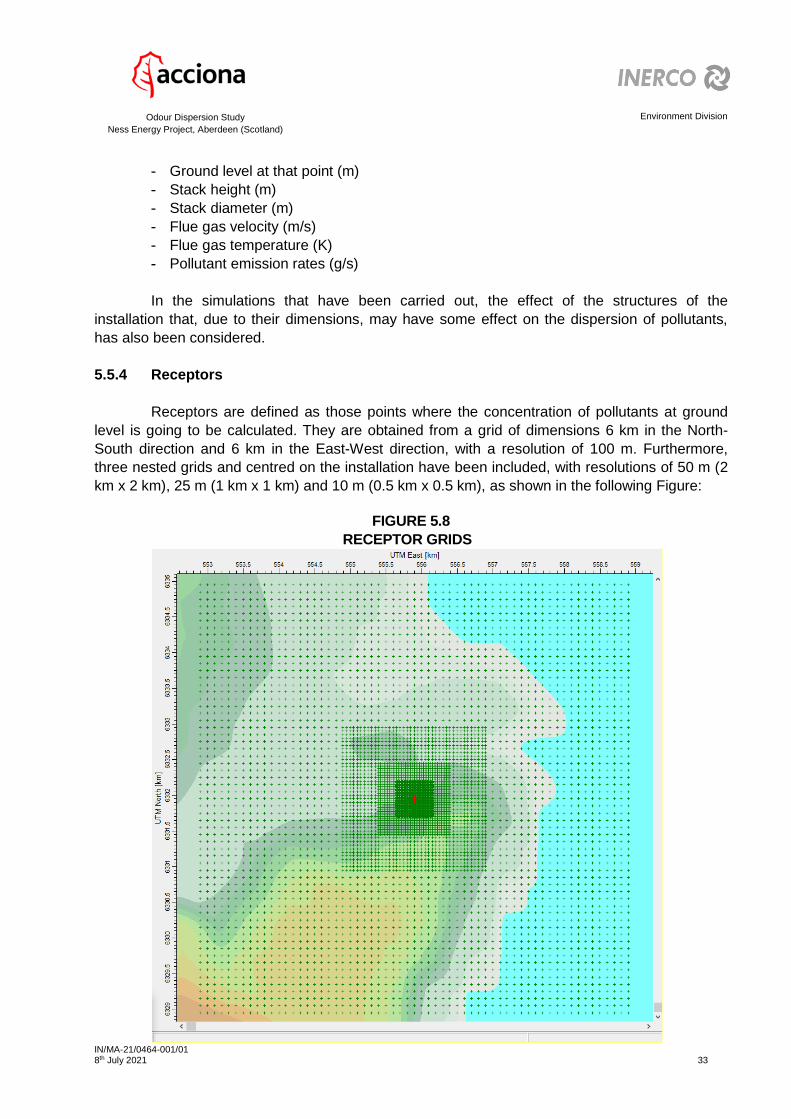
5.5.4 Receptors
Receptors are defined as those points where the concentration of pollutants at ground
level is going to be calculated. They are obtained from a grid of dimensions 6 km in the North-
South direction and 6 km in the East-West direction, with a resolution of 100 m. Furthermore,
three nested grids and centred on the installation have been included, with resolutions of 50 m (2
km x 2 km), 25 m (1 km x 1 km) and 10 m (0.5 km x 0.5 km), as shown in the following Figure:
FIGURE 5.8
RECEPTOR GRIDS
Environment Division
IN/MA-21/0464-001/01 8th July 2021 34
Odour Dispersion Study
Ness Energy Project, Aberdeen (Scotland)
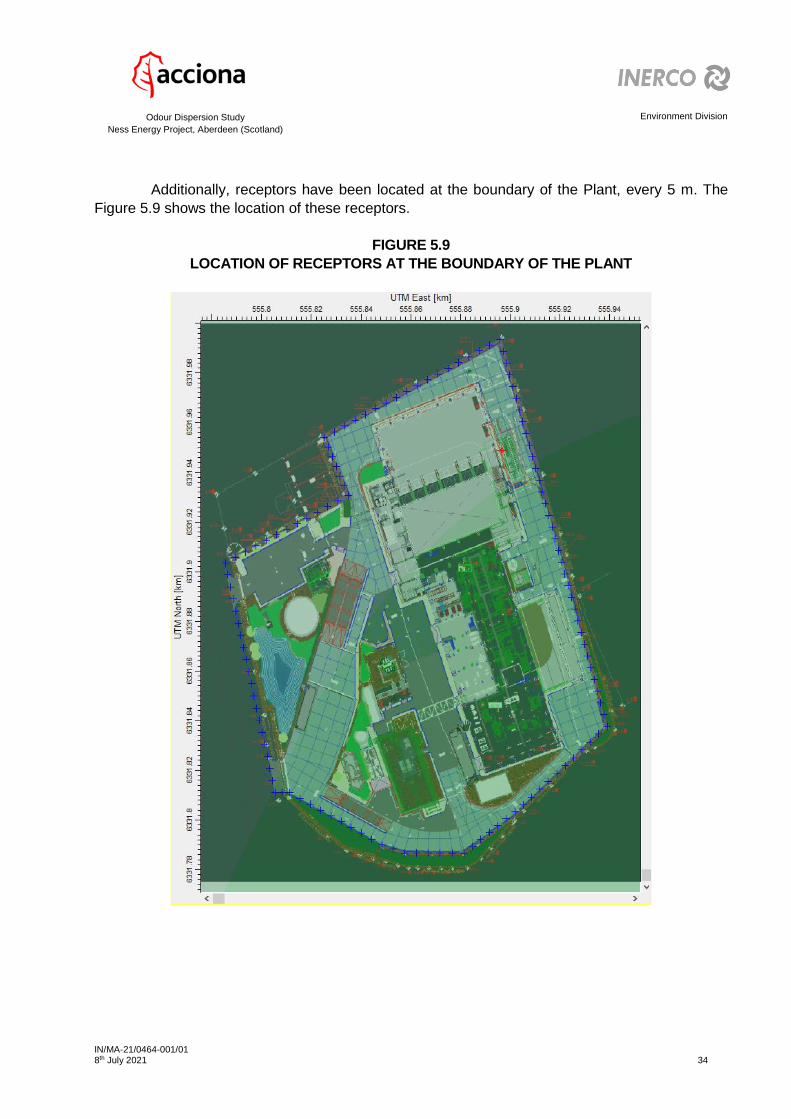
Additionally, receptors have been located at the boundary of the Plant, every 5 m. The
Figure 5.9 shows the location of these receptors.
FIGURE 5.9
LOCATION OF RECEPTORS AT THE BOUNDARY OF THE PLANT

Environment Division
IN/MA-21/0464-001/01 8th July 2021 35
Odour Dispersion Study
Ness Energy Project, Aberdeen (Scotland)
6. CONTRIBUTION OF THE PROJECT TO THE ODOUR LEVELS
Through the application of the CALPUFF model, the contribution of the Project to the 98th
percentile of the hourly mean values of odour immission has been obtained. The graphical
representation of the results in the environment of the facilities is presented in Figures 6.1 and
6.2. The levels corresponding to 1.5 and 1 ou/m3 have been represented. Since the odour
threshold is set at 1ou/m3, quantification below this level makes no physical sense.
FIGURE 6.1
CONTRIBUTION OF THE PROJECT TO THE 98th PERCENTILE
OF THE HOURLY MEAN VALUES OF ODOUR IMMISSION (I)
Environment Division
IN/MA-21/0464-001/01 8th July 2021 36
Odour Dispersion Study
Ness Energy Project, Aberdeen (Scotland)
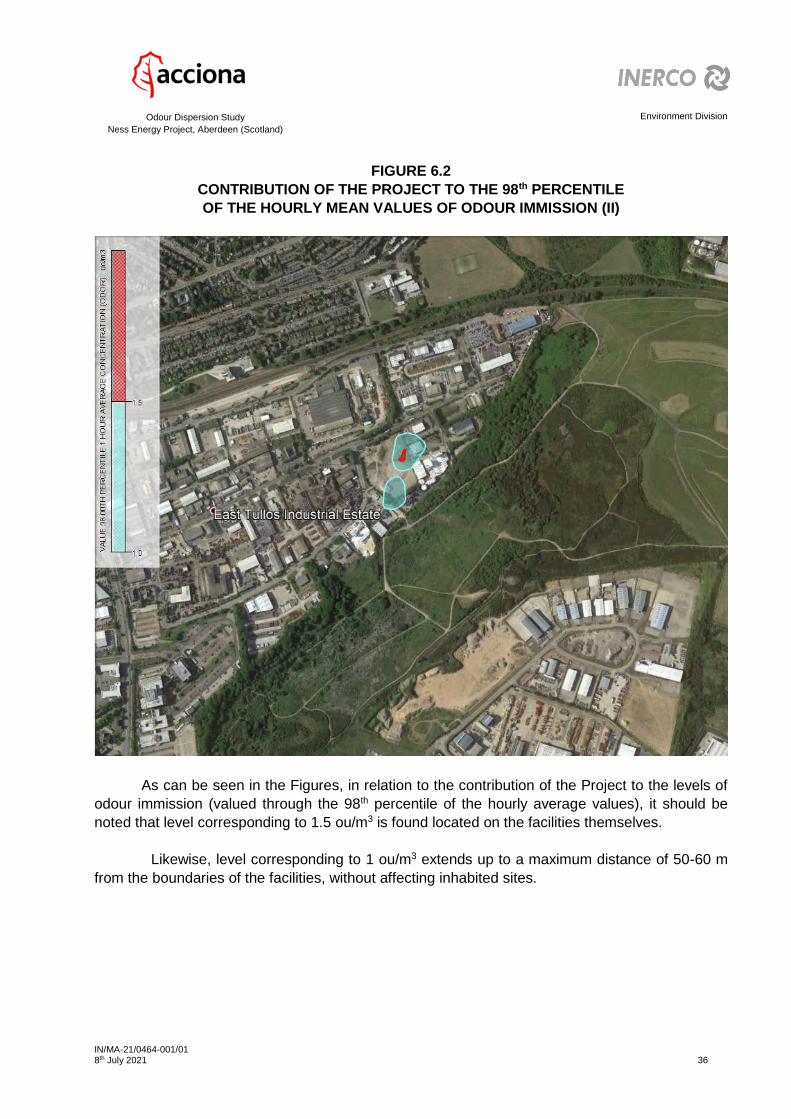
FIGURE 6.2
CONTRIBUTION OF THE PROJECT TO THE 98th PERCENTILE
OF THE HOURLY MEAN VALUES OF ODOUR IMMISSION (II)
As can be seen in the Figures, in relation to the contribution of the Project to the levels of
odour immission (valued through the 98th percentile of the hourly average values), it should be
noted that level corresponding to 1.5 ou/m3 is found located on the facilities themselves.
Likewise, level corresponding to 1 ou/m3 extends up to a maximum distance of 50-60 m
from the boundaries of the facilities, without affecting inhabited sites.

Environment Division
IN/MA-21/0464-001/01 8th July 2021 37
Odour Dispersion Study
Ness Energy Project, Aberdeen (Scotland)
7. CONCLUSIONS
This document presents the odour dispersion study carried out for a Waste Power Plant
projected by ACCIONA in the West Tullos industrial area, at the south of Aberdeen (Scotland).
According to “H4 Odour Management” Technical Guidance (SEPA), an odour
concentration of 1.5 ou/m3 has to be met at the boundary of the Plant, based on the 98th
percentile of hourly average concentrations.
From the results obtained with CALPUFF model, it is concluded that with an emission
level of 780 uo/m3, the contribution of the Project to the levels of odour immission would mainly
affect to the facilities and its surrounding. Thus, it should be noted that the level corresponding
to 1.5 ou/m3 is located within the boundary of the facilities, without affecting inhabited sites.
Seville, 8th July 2021
Signed by: Signed by:
Chemical Engineer Industrial Engineer
Master in Engineering and
Environmental management
Head of Environmental Modelling
Area


![Panasonic...Durian odour 6 Natural reduction 60tmin.] Sweat odour Nonanoic acid Natural reduction 120[min.] Garbage odour Methylmercaptan Natural reduction 601minJ Scalp odour Panasonic](https://img.dokumen.tips/doc/110x75/60d72199474aa2073d394000/panasonic-durian-odour-6-natural-reduction-60tmin-sweat-odour-nonanoic-acid.jpg)