Embed Size (px)
Citation preview
NBER WORKING PAPER SERIES
ODE TO THE SEA: WORKPLACE ORGANIZATIONS AND NORMS OF COOPERATION
Uri GneezyAndreas Leibbrandt
John A. List
Working Paper 20234http://www.nber.org/papers/w20234
NATIONAL BUREAU OF ECONOMIC RESEARCH1050 Massachusetts Avenue
Cambridge, MA 02138June 2014
The views expressed herein are those of the authors and do not necessarily reflect the views of theNational Bureau of Economic Research.
NBER working papers are circulated for discussion and comment purposes. They have not been peer-reviewed or been subject to the review by the NBER Board of Directors that accompanies officialNBER publications.
© 2014 by Uri Gneezy, Andreas Leibbrandt, and John A. List. All rights reserved. Short sections oftext, not to exceed two paragraphs, may be quoted without explicit permission provided that full credit,including © notice, is given to the source.

Ode to the sea: Workplace Organizations and Norms of CooperationUri Gneezy, Andreas Leibbrandt, and John A. ListNBER Working Paper No. 20234June 2014JEL No. C93,J0
ABSTRACT
The functioning and well-being of any society and organization critically hinges on norms of cooperationthat regulate social activities. Empirical evidence on how such norms emerge and in which environmentsthey thrive remains a clear void in the literature. To provide an initial set of insights, we overlay aset of field experiments in a natural setting. Our approach is to compare behavior in Brazilian fishermensocieties that differ along one major dimension: the workplace organization. In one society (locatedby the sea) fishermen are forced to work in groups whereas in the adjacent society (located on a lake)fishing is inherently an individual activity. We report sharp evidence that the sea fishermen trust andcooperate more and have greater ability to coordinate group actions than their lake fishermen counterparts.These findings are consistent with the argument that people internalize social norms that emerge fromspecific needs and support the idea that socio-ecological factors play a decisive role in the proliferationof pro-social behaviors.
Uri GneezyRady School of ManagementUniversity of California - San DiegoOtterson Hall, Room 4S1369500 Gilman Drive #0553La Jolla, CA [email protected]
Andreas LeibbrandtDepartment of EconomicsMonash UniversityClayton, Vic [email protected]
John A. ListDepartment of EconomicsUniversity of Chicago1126 East 59thChicago, IL 60637and [email protected]

2
1. Introduction
Throughout human history, trust, cooperation, and coordination in domains such as hunting,
trade, and warfare were necessities for human survival. Today, these behaviors are important
as ever and crucial for the well-functioning of societies and organizations. A large body of
experimental evidence suggests that the extent of these behaviors goes beyond what is
predicted by standard self-interest maximization, as some individuals exhibit pro-sociality
with genetically unrelated others in the absence of reputational benefits (see Charness and
Kuhn, 2011, and the references therein). Interestingly, the extent of these behaviors appears
to significantly differ across countries and societies (Roth et al., 1991; Hayashi et al., 1999;
Henrich et al., 2001 & 2005), and there is evidence suggesting that such behavioral
differences correlate with economic growth (Knack and Keefer, 1997) and the quality of
democracy (La Porta et al., 1997).
One likely explanation for differences in trust, cooperation, and coordination is based
on social norms, which may have emerged as an adaption to different local pressures (Sober
and Wilson, 1998; Boyd and Richerson, 2005; Durante, 2010). Social norms are patterns of
behavior that are based on shared beliefs about how individual group members should behave
in a given situation. They are enforced by internal and external sanctions, such as shame or
punishment, internalized through social learning and socialization, and may lead to an
enduring change in individuals’ motivations, such as their propensity to act pro-socially
(Durkheim, 1933; Parsons, 1933; Arrow, 1971; Fehr and Gächter, 2002). Recent
experimental studies suggest social norms are influenced by societal conditions (Henrich et
al, 2005; Herrmann et al, 2008; Henrich et al 2010; Gächter and Herrmann, 2011).
The workplace organization is a crucial part of every society. One important
dimension on which workplace organizations differ describes the extent to which work is
done in groups. The extent of group activities, in turn, may be closely related to the

3
emergence of norms of cooperation. In workplace organizations where individuals mainly
work in groups, outputs typically depend more on the cooperation of group members than in
workplace organizations where individuals mainly work on their own. This difference puts
more pressure to act cooperatively in workplace organizations characterized by high levels of
group activities and may lead to the emergence of norms of cooperation in such
environments.
In this paper, we overlay a set of field experiments on a natural setting to test the
hypothesis that group activities affect norms of cooperation. We compare distinct traditional
fishing societies that differ along one major dimension: the workplace organization. In one
society, located by the sea, fishermen need to work in groups whereas in the other society,
located around a nearby lake, fishing is an individual activity. As a result, the output of the
fishermen at the sea depends on the team’s total effort and on the cooperation of members in
the same fishing boat whereas such cooperation is unnecessary at the lake. We therefore
hypothesize that a stronger norm of cooperation exists at the sea where ecological constraints
favor joint production activities and that this led to more interpersonal trust and a better
ability to coordinate over risky activities.
We indeed find strong behavioral differences between the two fishermen societies that
are consistent with our cooperation norm hypothesis. Sea fishermen trust significantly more
and are also significantly more cooperative, return more money in the trust game, propose
more equal offers in the ultimatum game, contribute more in the public goods game, and
donate more to a charity outside their own society. We also find that sea fishermen try more
often to coordinate on the efficient Nash equilibrium in the stag-hunt game, but are not
different in their risk-taking behavior in an investment game. These findings provide initial
evidence that in our field setting norms of cooperation are significantly more pronounced in
workplace organizations that rely on teamwork.
4
An alternative explanation for the difference between societies could be self-selection
into societies/workplace organizations. We test for the role of selection by using surveys
identifying which fishermen in our participant pool have selected in or out of fishing
societies. We provide evidence that our society differences are robust to the exclusion of
fishermen who have selected in or out of fishing villages, suggesting that self-selection is not
a key driver for our behavioral results.
In addition, we report the results of experiments with women in these societies who
do not fish. We do not find society differences in cooperativeness between lake and sea
women who do not fish rendering it unlikely that other society differences than workplace
organizations drive our findings. The absence of differences between lake and sea women
also provide suggestive evidence that norms of cooperation learnt at the workplace do not
spread to other society members.
Our study is related to other experiments that investigate the role of the habitat for
altruism (Voors et al, forthcoming), antisocial behavior (Prediger et al, 2013), and
competitiveness (Leibbrandt et al, 2013).1 It is also related to Carpenter and Seki (2006 &
2011), which study fishermen and their contributions in public goods experiments. Carpenter
and Seki (2006) investigate a Japanese fishing community and differences in cooperativeness
depending on whether community members are fishermen and, if they are, whether they pool
their catch. One important difference between their and our study is that their fishermen do
not differ to the extent to which they work in groups, whereas our fishermen come from
societies where the workplace organization is such that individuals systematically either work
alone or in groups. Our study also uses validated economic experiments. Fehr and Leibbrandt
(2011) show that the economic experiments employed in this study significantly predict 1 In Leibbrandt et al (2013) we study fishermen and other society members from the same villages and their competitiveness in two experimental tasks (one of the two tasks was conducted together with the other tasks described in this study). We observe that fishermen at the lake are more willing to compete individually (but not in teams) than at the sea and that this difference emerges with work experience.

5
fishermen’s actual cooperation behavior in the field. Thus, our findings suggest that
workplace organizations can significantly affect cooperation in everyday life.
Since our findings suggest that socio-ecological factors play a decisive role in the
proliferation of cooperation norms it may help to explain the scale and variance of
cooperation in different societies reported in other studies (Roth et al., 1991; Hayashi et al.,
1999; Buchan and Croson, 2004; Henrich et al., 2001; Fehr et al., 2008; Herrmann et al.,
2008). Relatedly, our study may provide evidence in favor of endogenous preference
formation (Bowles, 1998) because our findings corroborate the idea that economic
institutions form preferences to cooperate. We find that individuals who work in teams and
need to suppress free-riding in their teams to secure their livelihoods are more cooperative in
cooperation tasks unrelated to their workplace than individuals who work on their own.
Ruling out selection, this suggests that the workplace organization has caused individuals to
learn and internalize a norm of cooperation that guides their behavior in different
environments.
These findings may also inform evolutionary models postulating that pro-social
behavior can proliferate in certain social environments (Boyd and Richerson, 1985; Gintis,
2003). These models are based on the idea that cultural evolutionary processes can yield
norms of cooperation that suppress free-riding in groups and thus emphasize the importance
of group selection. In our field setting, cooperation at work is crucial for the sea fishermen
but not for the lake fishermen. More precisely, cooperation in boats at sea is likely to increase
incomes from fishing and the surplus goes to the boat members; thus selection at the group
level favors cooperation. However, the fact that such cooperation is still costly at the
individual level and the suggestive findings that norms of cooperation at the sea do not spread
to other society members posit challenges for these evolutionary stability.

6
2. Field setting
We selected small traditional fishing societies at the sea and at a lake in Brazil which
share many characteristics but use systematically different workplace organizations. The
main difference between these two societies is that at the sea fishermen work in groups
whereas fishing is an individual activity in the other society at a nearby lake.2 As Figure 1
makes clear, the lake is connected to the sea by a river, only divided by a dam. The societies
are in close geographical proximity and the air-line distance between the lake and sea is
approximately 50 kilometers, which corresponds to the distance between the west and the
east side of the lake.
Most of our participants grew up in their village and have stayed there for decades.
48% were born in their village, approximately two-thirds report to have lived in the same
village since age 12, and on average participants have lived for 28.1 years in their village.
While there is some migration into and out of these villages (section 5), we find no evidence
for migration between the two settings despite the geographical proximity – i.e. fishermen do
not select whether they work in groups or alone. We did not meet a single fisherman who
moved from one setting to the other or went fishing in both settings. In fact, very few
fishermen have even visited the other field setting. Note that traveling from one setting to the
other is difficult and time-consuming.
The societies use different technologies to catch fish as a response to different
ecological constraints. Fishermen at our lake setting use fishing instruments that can be
handled by one person, and therefore it is not efficient to fish in teams. Probably because
there is no need for more than one person fishing, the fishermen at the lake also use small
2 One important society characteristic that is linked to pro-sociality is the level of market integration (Henrich et al, 2010). We have no reason to believe that market integration is significantly different between societies.

7
boats that render it impossible to take more than one person with them.3 At the sea setting, in
contrast, the use of small boats and light fishing instruments is inefficient and dangerous due
to the sea ecology.4 The difficult conditions at the sea caused by waves and currents in
combination with the different fish stock (typically larger and heavier fish than at the lake)
imply that sea fishermen use heaver and longer fishing instruments that can only be handled
by more than one person, and they therefore also use larger fishing boats. They work in
groups of two (27.5%), three (35.3%), or four to eight individuals (37.2%), usually with the
same group members. Thus, while fishermen at the lake spend much of their work time on
their own, fishermen at the sea are together with their group members.
The different technologies used to catch fish do not only systematically shape
workplace organizations but also imply differences in the need to cooperate and coordinate
between societies. While fishing together at the sea, many of the activities produce incentives
to free-ride on other group members’ effort. One important time-consuming and strenuous
activity is to set and collect the fishnets. As the fishnets are large and heavy, fishermen need
to jointly and simultaneously pull the fishnets out of the sea to collect the catch. However, if
effort is costly and since individual effort is not easily identifiable, there might be incentives
to provide the lowest effort acceptable. As low effort levels imply less income from fishing
(as the collecting of fishnets would take more time and thus there would be less time
available to set the fishnets again with the prospect of catching more fish), one may expect
the development of social norms that mitigate free-riding as an adaption to these local
pressures to cooperate and coordinate at the sea. In contrast, at the lake the technologies are
such that the work environment does not require such safeguards.
3 They sometimes take their wife or children to go fishing with them. However, very few fishermen go fishing with non-family members, and if they do, it is typically not on a regular basis. 4 Fishing alone at the sea in this region is also legally prohibited unless one obtains a special permit that is very costly and hardly any fisherman possesses.

8
In both societies fishermen work the whole year, and for five to seven days a week.
They are heavily dependent on the fish resources: there are almost no other types of jobs, and
fishing is often the only possible profession to provide the fishermen and their families with
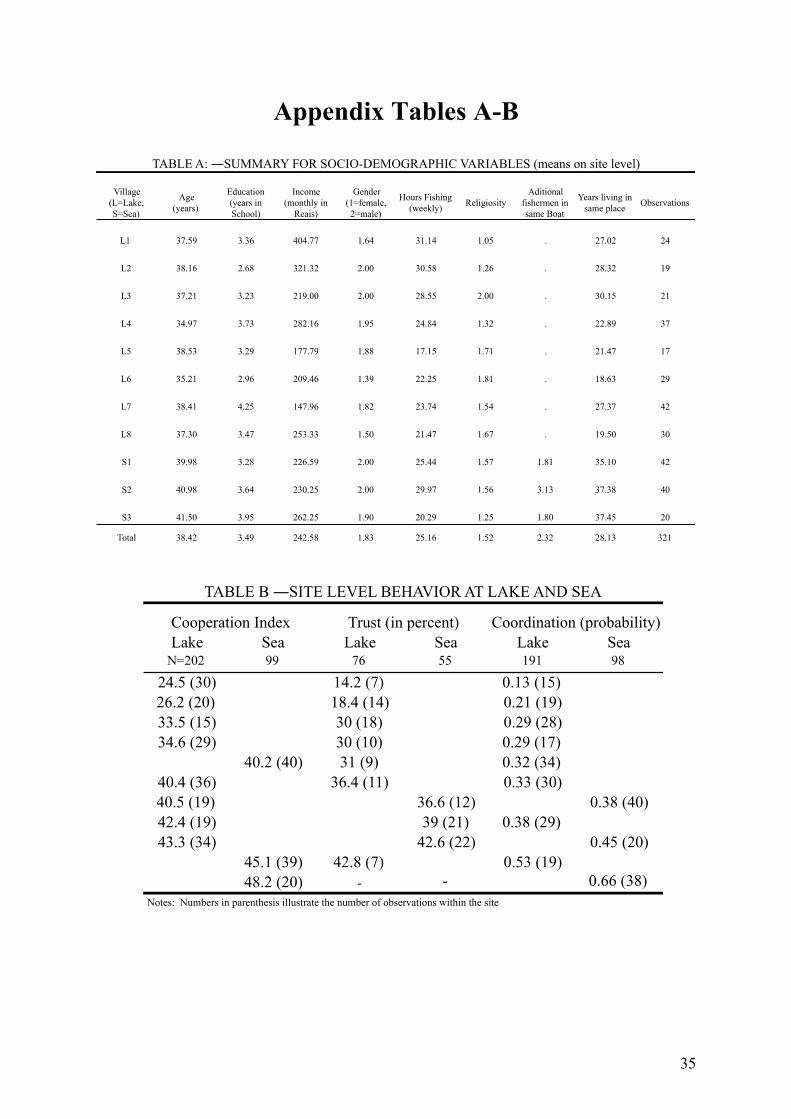
income and nutrition (a summary of relevant variables on site level is presented in Appendix
Table A). While there is variance in fishing incomes (mean = 242.6 Brazilian Reais, s.d. =
183.0), there is no significant difference across societies (lake = 246.2, sea = 235.1, p =
0.876, Mann-Whitney test, n = 312). Fishermen in both societies are also generally poor and
have few private possessions.
3. Experimental Design
Fishermen from both societies took part in several economic experiments with large
monetary incentives (average earnings were substantially higher than two average daily
incomes). The experiments were conducted in similar environments. The recruitment of the
fishermen was done with the help of local leaders who announced the experiment in advance.
Participants were promised a show up fee of five Brazilian Reais (1 Real = 0.61 US Dollar)5,
but were not told about the prospect of earning additional money. We conducted the
experiments in a central place, typically in a local school or public building. The experiments
and surveys were conducted with each fisherman individually in a way that secured that
participants could not observe the behavior or listen to the responses of other participants.
At the beginning of the experiments all participants received a code to ensure
anonymity. In all experimental sessions, an experimenter explained the experiments
individually to the participants. Before the experiments were played, a short survey was
administered to collect socio-economic data. No written instructions were used because many
5 The Brazilian currency is called Real (pl. Reais). Exchange rate from Sep 1, 2008. The mean monthly income from fishing is 242.6 Reais. Harrison and List (2004) denote our experiment as an artefactual field experiment whereas Charness et al (2013) call it an extra-lab experiment.

9
participants were illiterate. The experimenters spent approximately 45–60 minutes per
participant explaining the experiments and administering the survey. The experimenters were
local students with experience in conducting interviews.6
As experimental currency we used points. One point equaled one Brazilian Real.
Participants were not informed of their earnings until the end of the experimental session,
when they were paid privately. All experiments were played only once and anonymously, i.e.,
no participant knew the identity of his assigned partners in any of the games. We had a total
of 321 participants (219 from the lake and 102 from the sea). The participants came from
eight sites at the lake (participants in sessions: N = 17, 19, 19, 34, 15, 28, 29, 30) and three
sites at the sea (participants in sessions: N = 20, 42, 40).
Fishermen at the lake took part in two experimental sessions, one conducted in spring
2008, and the other in fall 2008. In the fall sessions, 151 fishermen took part in a trust game
(76 in the role of the trustor) and an ultimatum game. Both games were paid at the end of the
session. 128 of these 151 fishermen also took part in the spring sessions. In the spring
sessions, 191 fishermen took part in a donation game, lottery game, public goods game,
coordination game and competition game (Leibbrandt et al, 2013). The experiments were
always conducted in this order and no feedback was given throughout the experiment. To
avoid income effects, only two of the five experiments were paid out. The participants drew
two cards from a set of five cards after they played all five games to determine which games
would be counted toward payment at the end of the session.
102 fishermen at the sea participated in the same seven experiments, but they were
conducted in one experimental session in the fall 2008. Sea fishermen first took part in a trust
and ultimatum game (both paid out at the end of the whole experimental session). After they
finished the first two games, they were told that there would be five additional experiments
6 We had five experimenters in total. Four experimenters conducted experiments in both societies.
10
before the meeting ends (donation game, lottery game, public goods game, coordination
game, and competition game; always conducted in this order, two of the five games were
paid out). There was only one session per site. Besides this difference, all other features of
the experimental procedure were identical at the sea and lake sites.
In the following we present in more detail the experiments that we conducted in our
fishing societies. The complete set of instructions is reproduced in the Appendix.
The trust game (Berg et al., 1995) provides a measure of trust and trustworthiness,
two key elements for achieving efficient social exchange. In this game, we randomly
assigned participants to the role of trustor or trustee. Both player types received an
endowment of five points. In the first stage of the game, the trustor chose how many of these
five points to send to the trustee. The experimenter tripled each point sent. In the second
stage, the trustee decided how many points to return. To maximize information gathered, we
implemented the strategy method for the trustees, i.e., they chose how many points they
would like to send back conditional on each possible transfer level.
In the ultimatum game (Güth et al., 1982) participants were assigned the role of
proposers or responders. Participants assigned as trustor in the trust game, were always in the
role of the responder in the ultimatum game and trustees always in the role of the proposer.
The proposer received an endowment of ten points and had to decide how to divide this
amount between him and the responder. The responder then had to determine the minimal
acceptable offer (0 to 5 points; before knowing the actual offer). If the actual offer was below
the minimal acceptable offer, both players received zero points, otherwise the proposed share
was implemented.
In the donation game (Eckel and Grossman, 1996) we measure pro-social behavior
towards individuals outside the participants’ societies. All participants received ten points and

11
then had to decide how many of these points they like to donate to an orphanage outside their
own society.
In the public goods game, all participants were assigned to groups of three and had to
decide how many of their ten points they want to contribute to a group account. Each point
contributed increased the group members’ and their own payoff by 0.5 points. With this
parameter, contributions to the public good reduce own profits but increase total group
profits.
Unlike the back-transfer decisions in the trust game, the contribution decisions in the
public goods game, the offers in the ultimatum game, and the donations in the donation game
were blind to the experimenters on site who turned their backs when participants made their
decisions and transferred points between two envelopes marked with codes that they placed
in boxes (see instructions in the Appendix).
The stag-hunt game is a simultaneous-move coordination game in which two
participants could either choose to “hunt a stag” or “hunt a hare.” If both choose to stag, each
gets 10 points, but if one chooses a to stag while the other chooses to hare, the one choosing
to stag earns zero points. If one chooses to hare, his payoffs are seven points regardless of the
other participant’s decision. Thus, the game models a conflict between safety and cooperation
with two Nash equilibria (both players choose hare or both choose stag), but only one of
which is Pareto-efficient (both players choose stag).
The participants took also part in an investment game (Gneezy and Potters, 1997). In
this experiment, participants had to decide how many out of ten points they invest in a lottery
with a payoff of 2.5 times the invested amount and a winning probability of 50%. This lottery
was implemented in a simple manner with the help of a coin flip. . While this simple
experiment provides a relatively limited characterization of risk preferences, it is useful to
investigate whether levels of risk-aversion differ across societies and whether such potential

12
differences drive the societal differences in the trust and coordination experiment where
choices involve risks.
4. Results
Table 1 provides an overview of mean behavior at the lake and at the sea in our
experiments. We observe significant differences in five of the six experiments.
4.1 Fishing Together and Trust
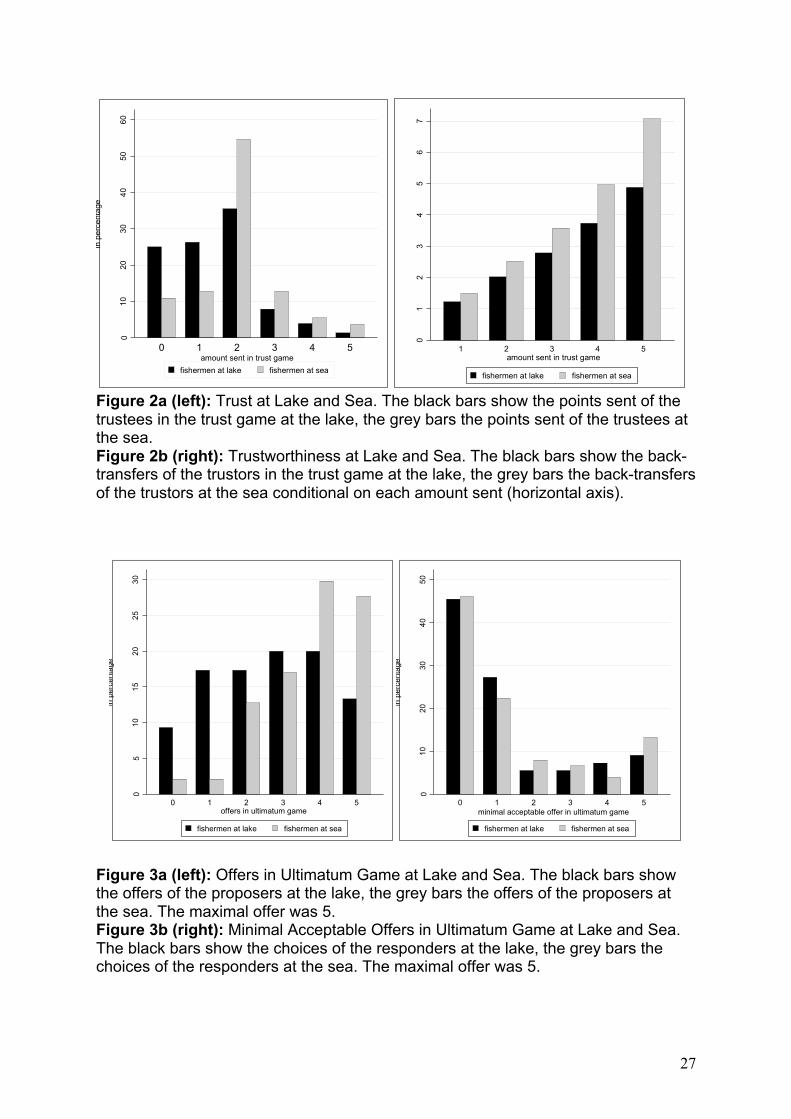
Table 1 and Figure 2a illustrate the large and significant differences in individual trust
between the lake and sea societies. Fishermen at the sea send a mean of 2 points (40% of
their endowment) to the trustees, while fishermen at the lake send a mean of only 1.43 points
(28.7%; Z = 2.946, p = 0.003, Mann-Whitney U-test, n = 131). While there are overall
relatively few participants who trust more than two points, we observe that 51.3% of the
fishermen at the lake send no more than one point, whereas the respective number is only
23.6% for the fishermen at the sea. Table B in the Appendix provides an overview of mean
behavior on site level and shows that in all but one small site at the lake mean trust is higher
in all three sites at the sea than in the other seven sites at the lake.
The trust gap between our field settings is robust to the inclusion of control variables.
In all of our regressions we control for age, education, income, and gender. In addition, for
trust, we control for risk-aversion measured in the investment game. We find that the sea
dummy in Table 1, column 1 (0 = for fishermen at lake, 1 = for fishermen at sea) is significant
at p = 0.024 and that the trust measure is 0.573 points higher at the sea. None of the control
variables is significant at conventional levels.
4.2 Fishing Together and Cooperativeness

13
Our battery of experiments allows us to investigate cooperativeness from different
angles: Trustworthiness (section 4.2.1), ultimatum game bargaining (4.2.2), donations for a
charitable purpose to society outsiders, and contributions to a public good (4.2.3). Studying
cooperativeness in four different games has also the advantage that we can get a better idea
whether society differences in cooperativeness depend on a certain game frame that reflects
daily life in each society (Henrich et al, 2005) or are robust to different game frames. At the
end of this section, we combine these different measures to present one unique measure for
cooperativeness (4.2.4).
4.2.1 Trustworthiness
There are large and significant differences in the level of trustworthiness between our
two societies. In the trust game, lake fishermen return 32.6% of the amount they received
after the experimenter tripled the sent amount, resulting in an expected payoff of 0.977 per
point sent. In contrast, sea fishermen return 43.5%, resulting in expected payoff of 1.3 points
per point sent (Mann-Whitney U-test, Z = 3.463, p = 0.0005). Figure 2b presents the mean
trustworthiness for all possible transfer levels. The mean trustworthiness is higher at the sea
than at the lake for all possible transfer levels. The differences are significant at p < 0.0022
for all transfers larger than two, and significant at p = 0.061 for a transfer of two points, and
at p = 0.101 for a transfer of one point (all p-values are from Mann-Whitney U-tests).
4.2.2 Ultimatum Game Bargaining
As shown in Table 1, sea fishermen offer on average a higher share (39.8%) than lake
fishermen (27.9%; Z = 3.712, Mann-Whitney test, p = 0.0002). Figure 3a provides a more
detailed description of the distribution of offers. The grey bars for the fishermen at the sea
show that only very few participants choose to offer zero or one point of the ten points to split

14
(4.3%) whereas more than one fourth of the lake fishermen choose such unequal offers
(26.7%). In contrast, only 13.3% of the fishermen at the lake propose to split the ten points
equally compared to 27.7% of the fishermen at the sea.
On the side of the responder in the ultimatum game, we observe no significant
differences in the minimal acceptable offers (Z = 0.201, Mann-Whitney test, p = 0.841).
Interestingly, almost half of our participants accept zero offers and few participants accept
only offers larger than 10%, i.e. one point (22% at sea, 24% lake). Figure 3b presents the
distribution of minimal acceptable offers at the lake and sea societies. The average minimal
acceptable offer (MAO) is 13.5% (12.9% at sea, 13.9% lake), which is considerably lower
than typically observed MAO’s in other settings but not unusual for South American settings
(Oosterbeek et al, 2004; Henrich et al, 2006).
After the experimental sessions, we asked sea and lake fishermen informally why they
do not reject low offers. In addition, we asked proposers in the ultimatum game about their
hypothetical willingness to reject unfair offers. Both, the discussions with the fishermen, and
the reported hypothetical willingness, provide ideas as to why MAO’s are generally low and
why there is no society difference in the willingness to punish unfair offers. The informal
discussions with sea fishermen suggest that they shy away from rejecting low offers because
they believe that participants have good reasons to propose low offers (e.g. costs for
medication) and thus do not want to reject. In contrast, many lake fishermen express that low
offers are not condemnable and that they clearly prefer to receive a small share over getting
nothing when rejecting an unfair offer. When asking proposers about their minimal
acceptable offer (MAO) imagining they were in the position of the responder we do find
society differences as expected and that the hypothetical MAO is higher for sea than for lake
fishermen (1.83 vs. 1.27 points; z=1.79, p=0.07). Moreover, if we use the hypothetical MAO
of the proposer instead of the responder as the dependent variable in our regression model,

15
we find that the difference is significant at p=0.027. The stated (but not revealed) society
difference in MAO’s suggests that sea fishermen would be more willing to reject low offers if
they had access to information about the use of earnings in the ultimatum game.
4.2.3 Charitable Donations and Public Goods Contributions
In the donation experiment, we find that sea fishermen donate a larger amount to an
orphanage (45.7% of their endowment) than lake fishermen (38.3%; Z = 2.59, Mann-
Whitney test, p < 0.001), i.e., they are more pro-social towards individuals outside their own
society (see Figure 4 for the distributions of donations in lake and sea societies). Only 17.3%
of the sea fishermen donate less than three points (out of ten) compared to 31.9% of the lake
fishermen.
Sea fishermen are also more pro-social towards other fishermen in their own society
in the public goods game. We observe that sea fishermen contribute on average 41.8% of
their endowment whereas lake fishermen contribute only 35.4% (z = 1.98, Mann-Whitney
test, p = 0.047). Only 7.1% of the sea fishermen do not contribute at all in the public goods
game as compared to 18.4% of the lake fishermen. The contributions in the public goods
game are presented in Figure 5.
4.2.4 Individual Cooperation Index
We measure cooperativeness in the trust, ultimatum, donation and public goods game
and find in all four experiments more cooperativeness at the sea societies. To investigate
whether the individual fisherman at the sea is throughout the experimental session more
cooperative than the individual fisherman at the lake we constructed for each participant a
simplistic index composed of the behavior in these four experiments (back-transfers in trust
16
game for all possible levels of trust7, offers in ultimatum game, donations in donation game,
contributions in public goods game).8 This index captures the percentage of the points that
each participant uses for cooperative purposes in the whole experiment and thus provides an
indication on the distributions of overall cooperativeness. This individual index weights the
behavior in these four experiments equally9 and is thus defined in the following manner:
Individual cooperation Index =
[14𝑡𝑜𝑡𝑎𝑙 𝑏𝑎𝑐𝑘𝑡𝑟𝑎𝑛𝑠𝑓𝑒𝑟𝑠 𝑖𝑛 𝑇𝐺
45+14𝑜𝑓𝑓𝑒𝑟 𝑖𝑛 𝑈𝐺
10+14𝑑𝑜𝑛𝑎𝑡𝑖𝑜𝑛 𝑖𝑛 𝐷𝐺
10+14𝑐𝑜𝑛𝑡𝑟𝑖𝑏𝑢𝑡𝑖𝑜𝑛 𝑖𝑛 𝑃𝐺𝐺
10]×100
Figure 6 provides an overview of this index in both societies. This figure highlights
two important differences between our two societies. First, the dashed line is shifted to the
right, which shows that the extent of cooperation is higher for fishermen at the sea in the
various games (lake: 35.61% vs. sea: 43.75%, Z = 3.616, p = 0.0003). Second, we find
evidence of variance differences. Interestingly, the distribution for fishermen at the sea is
more compressed around the 40%-45% level, suggesting the existence of a norm that
prescribes to share outcomes (almost) equally (Kolmogorov-Smirnov test that distribution of
cooperation norm between lake and sea is identical, D = 0.241, p = 0.001, corrected p-value).
Table B in the appendix shows the cooperation norm for each site.
Table 2, column 2 shows that the cooperation index is robust in our regression model.
We find that the sea dummy is significant at p = 0.029 and has a coefficient of 5.91, i.e.
fishermen at the sea have an approximately 5.9% higher score of the cooperation index.10
7 Participants could return 3 (6,9,12,15) units if 1 (2,3,4,5) unit was sent; i.e., the maximal total back-transfer is 45. 8 While we believe that this index is a simple and straightforward index, other indexes may be equally informative. For example, one could also include the transfers in the trust game into this cooperation index or weight the maximal total back-transfer differently. Tentative analyses suggest that the composition of the index does not play an important role. 9 If a participant did not take part in all four experiments, the cooperation norm is composed (and equally weighted) of the three (or two, or one) experiments in which he took part. 10 The only significant control variable is gender. However, our findings with regard to gender have to be interpreted carefully. Less than 2% of the subjects at the sea are females whereas approximately 25% of the subjects at the lake are females.

17
4.3 Fishing Together and Coordination
In the coordination game we find that fishermen at the sea choose significantly more
often to hunt the stag than fishermen at the lake; i.e., they more often attempt to coordinate on
the efficient Nash equilibrium (sea: 50% choose stag, lake: 31.9%; Fisher’s Exact test, p =
0.003). Table B in the appendix provides an overview of mean coordination behavior on site
level. The difference between the sea and the lake is robust to the inclusion of our control
variables when we estimate a Probit regression model (p = 0.036, marginal effect = 12.7%).
None of the control variables significantly predicts the choice in the coordination game at the
5%-level.
5. Selection
In this section we investigate whether selection is a likely driver behind our society
differences in cooperativeness, trust, and abilities to coordinate. Selection could explain our
findings if we observe that fishermen with certain characteristics systematically select in or
out of our lake or sea societies. More precisely, selection is a competing explanation to our
workplace organization hypothesis if we observe that at least one of the following types of
selection is present in our subject pool: selection into lake societies of fishermen who are less
than average cooperative, trusting, and willing to coordinate; selection into sea societies of
fishermen who are more than average cooperative, trusting, and willing to coordinate;
selection out of lake societies of fishermen who are more than average cooperative, trusting,
and willing to coordinate; or selection out of sea societies of fishermen who are less than
average cooperative, trusting, and willing to coordinate. We address the relevance of each of
these four types of selection in turn in the next two sections.
5.1 Selection into societies

18
We test the role of selection into societies by using surveys that reveal whether
fishermen selected into their current fishing village before they started fishing professionally.
We observe that 15.4% of our subject pool moved into one of our fishing villages after they
have already started fishing. Selection into fishing villages at the lake is more common
(21.5%) than at the sea fishing villages, where selection in is almost absent (4%) and thus
highly unlikely to play a significant role.11
We observe that our society differences in trust, cooperativeness, and abilities to
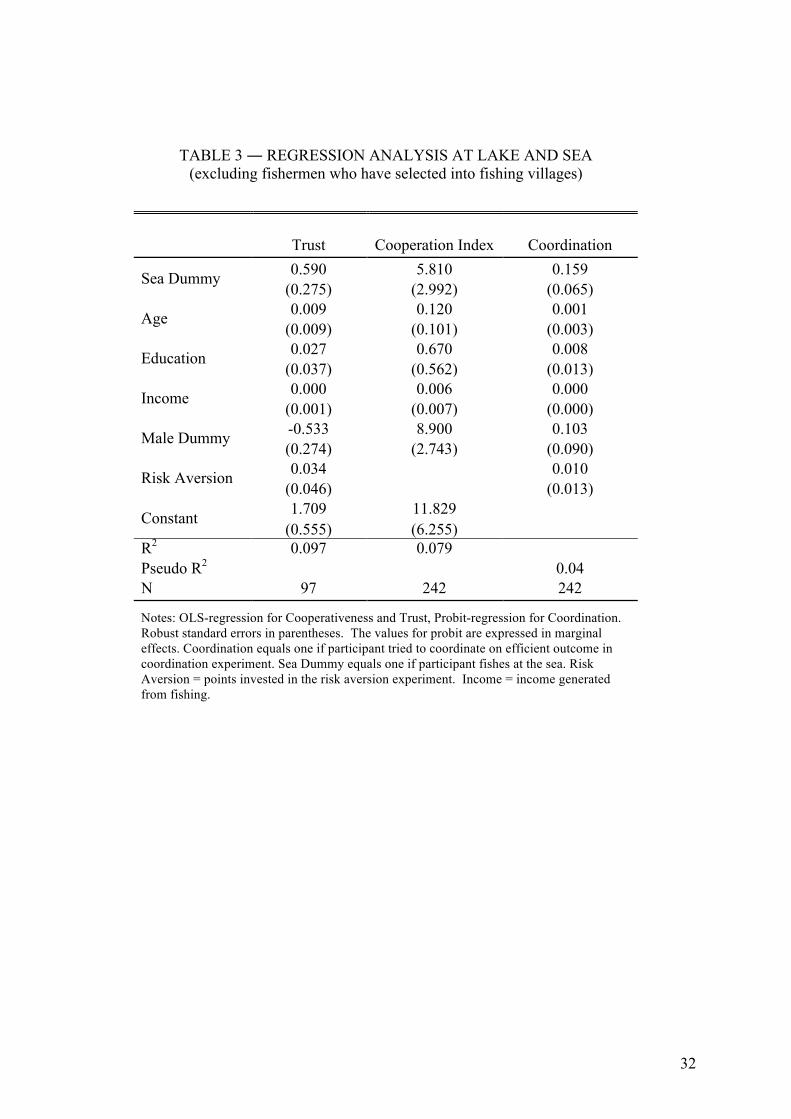
coordinate are robust to the exclusion of fishermen who have selected in. Table 3 presents the
analysis of Table 2 but restricts the sample to fishermen who did not select into fishing
villages. As we can see there are no notable differences in the society dummy in both tables
For the cooperation index, the coefficient is 5.81 and p-value is 0.053 in Table 3 and 5.91 and
p = 0.029 in Table 2. For trust, the coefficient is 0.59 and the p-value is 0.034 in Table 3 and
0.57 and p = 0.024 in Table 2. For coordination, the coefficient is 0.159 and the p-value is
0.013 in Table 3 and 0.127 and p = 0.036 in Table 2.
5.2 Selection out of societies
We test the role of selection out of societies by using surveys that show which
fishermen have stopped fishing or moved out of their society within four years after the
implementation of our experiments. More precisely, in July 2012 we were able to get
information on selection out of fishermen in seven out of eight villages from leaders at the
11 The percentage of fishermen who selected in from non-fishing villages is likely to be much lower. We have no information where fishermen lived before and we do not know whether they lived before in a neighboring fishing village (a case which we expect to be very common). Thus, our variable captures selection into a specific lake/sea village and not selection into the lake/sea society. Relatedly, one likely explanation for the larger occurrence of selection in at the lake is that there is more migration of fishermen between lake fishing villages than sea fishing villages because of the smaller geographical distance between lake villages.

19
lake and in one out of three villages from a leader at the sea.12 We observe that there is a
considerable degree of selection out at lake fishing villages. 22.4% of our 2008 subject pool
have selected out at the lake villages within four years.13 While we have only data from one
sea village, it seems that selection out is clearly lower at the sea (12.5%) and thus less likely
to play a role than at the lake villages.
Table 4 presents the behavior in our experiments for fishermen who did and did not
select out of lake fishing villages. We find no significant differences across societies. Lake
fishermen who selected out provide even insignificant lower offers in the ultimatum game
than fishermen who did not select out (p = 0.153). The cooperation norm between fishermen
who did and did not select out is very similar (35% vs. 33.7%, z = 1.013, p = 0.311). Thus,
the data speaks against explanations of society differences based on selection out of villages.
Interestingly, fishermen who selected out are marginally less risk-averse (p = 0.103), a
finding that appears to make sense as selection out is usually a risky endeavor.
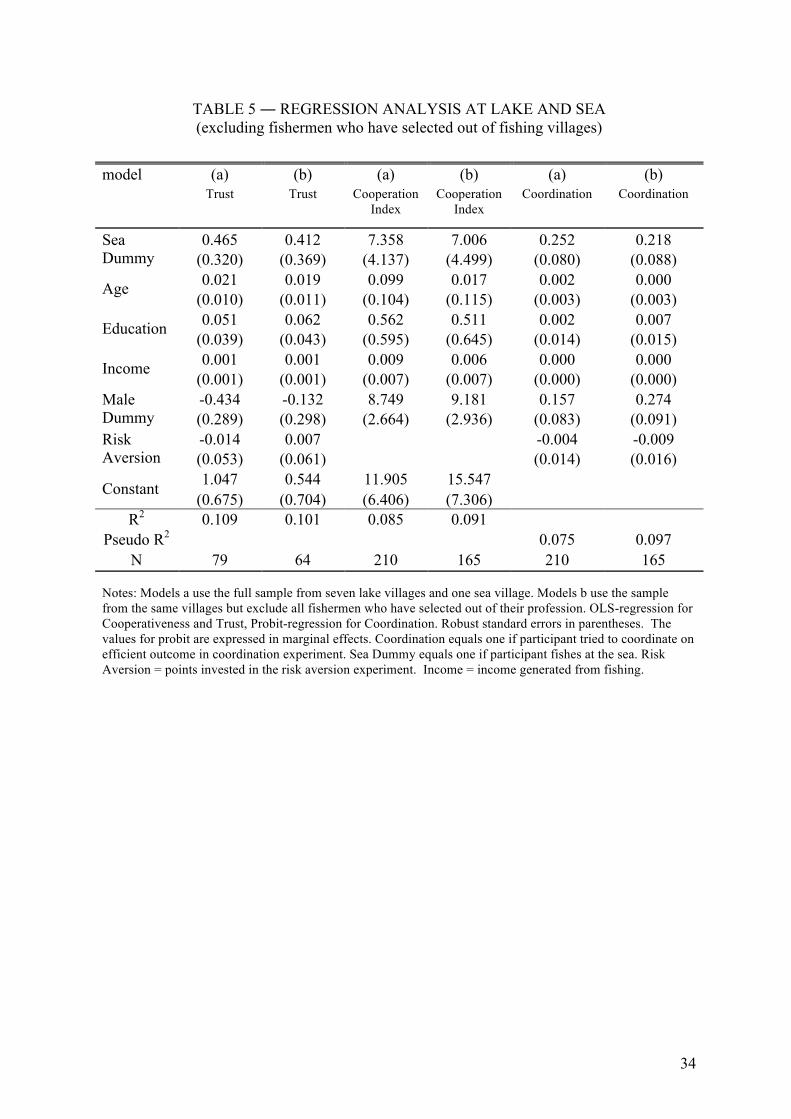
Table 5 presents an analysis of the sample of villages where we could gather
information on selection out. Note that this implies that our sample size at the sea drops from
98 to 38. Models a and b use the restricted set of villages and differ whether we exclude
fishermen who selected out (in the b-models) or not (in the a-models). First, we observe that
the coefficients between the a- and b-models are very similar for the cooperation index, trust,
and coordination. Second, we observe that the coefficients for the cooperation index and
coordination in the b-models are considerably larger than the corresponding coefficients
reported in Table 2, which uses data from all sites. This shows that the society differences in
trust, cooperativeness, and abilities to coordinate are robust after controlling for the
opportunity to self-select. 12 We were unable in 2012 to collect data from one lake and one sea village. In addition, fishing at one sea village has largely ceased due to the construction of an oil platform in front of this village. 13 According to fishermen, one important reason for the relatively high rate of selection out is a decreasing fish stock at the lake in the last few years.

20
6. Experiments with women in both societies
So far we have demonstrated that there are significant society differences in
cooperativeness between lake and sea fishermen that are unlikely to be caused by selection.
In this section, we investigate whether there are also society differences in cooperativeness
between women who live in lake and sea societies but do not fish, i.e., they are not exposed
to systematically different workplace organizations while fishing. Since women who do not
fish are typically housewives (or do not follow another profession), this analysis renders it
possible to test whether the observed society differences are driven by other potential society
differences than workplace organizations such as parental education efforts. It also renders it
possible to investigate whether a social norm of cooperation has spread to other parts of the
society.
For this reason we invited in 2012 women who do not fish from two lake and two sea
villages to take part in the same donation experiment that we conducted with fishermen. We
chose the donation experiment as we found a sharp society differences in donations and
because it measures cooperativeness towards individuals other than the participants and thus
is not subject to the composition of the participants in a given experimental session.
We do not find society differences in donations between women who do not fish.
More precisely, we observe that lake women who do not fish give on average 27% of their
endowment to the charity whereas sea women who do not fish give on average 24.1% (n = 20
vs. n = 34, z = 0.327, p = 0.744). The absence of society differences in cooperativeness
between women who do not fish corroborates our hypothesis that workplace organizations
rather than other potential society differences promote the emergence of a social norm of
cooperation because most of these differences should have also affected the women in these
societies.

21
7. Concluding Remarks
This study investigates the underpinnings of cooperation norms and tests the
hypothesis that workplaces with group activities foster their emergence. We overlay a set of
field experiments in fishing societies where local natural forces determine the extent of group
activities. Consistent with the social norm hypothesis, we find in several field experiments
that individuals are more cooperative, trusting, and coordinating if their profession is
characterized by group activities.
To test this hypothesis we chose participants that are fundamentally exposed to
different workplace organizations although they have the same profession and live in similar
environments. In addition, we chose a field setting in which selection into workplace
organizations is uncommon, collected data on society in- and outflows, controlled for
selection, and conducted experiments with society members that are not exposed to the
different workplace organizations, which altogether suggest that selection is not a main driver
of our findings.
While we cannot altogether rule out that selection contributes to the differences
observed between workplace organizations14, we believe that our study is useful to gain novel
insights into the underpinnings of cooperation norms and their relationship to workplace
organizations. One limitation of our study is that our subjects are either highly exposed to
group activities (all fishermen at the sea have worked for at least two years full-time in
teams) or are not at all exposed to group activities. Thus, the precise relationship between the
level of exposure to group activities at the workplace and the strength of cooperation norms
14 Historical selection, for example, can account for the observed society differences under the assumption that significant fractions of more (less) cooperative ancestors migrated to the sea (lake) and that they passed their cooperativeness to their offspring (via parental socialization or genes). Survey data from one of our sea villages shows low levels of historical selection at the sea (95% of the participants’ parents and 79% of the participants’ grandparents have lived in the same village) questioning that historical selection can completely account for the observed differences.

22
remains largely unclear. This presents an avenue for future research and inform managers and
policy makers who consider changes in workplace organizations.

23
References Arrow, Kenneth. (1971) “Political and economic evaluation of social effects and
externalities.” In: Intriligator, M. (Ed.), Frontier of Quantitative Economics. North
Holland, Amsterdam.
Berg, Joyce; Dickhaut, John ; McCabe Kevin. (1995) “Trust, Reciprocity, and Social
History”, Games and Economic Behavior, 10, 122-142.
Bowles, Samuel. (1998) “Endogenous Preferences: The Cultural Consequences of Markets
and other Economic Institutions”, Journal of Economic Literature, XXXVI, 75-111.
Boyd, Robert and Richerson, Peter. “Culture and the evolutionary process”, 1985,
Chicago: University of Chicago Press.
Buchan, Nancy and Croson, Rachel. (2004) “The Boundaries of Trust: Own and Other’s
Actions in the US and China”, Journal of Economic Behavior and Organization, 55,
485-504.
Carpenter, Jeffrey; Seki, Erika. “Do Social Preferences Increase Productivity? Field
experimental evidence from fishermen in Toyama Bay”, Economic Inquiry, 49(2),
612-630.
Carpenter, Jeffrey; Seki, Erika. (2006) “Competitive Work Environments and Social
Preferences: Field experimental evidence from a Japanese fishing community”,
Contributijons to Economic Analysis & Policy, 5(2), Article 2.
Charness, Gary; Kuhn, Peter. (2011) “Lab Labor: What Can Labor Economists Learn from
the Lab?” in Orley Ashenfelter and David Card, eds., Handbook of Labor Economics
, volume 4A. Amsterdam: North Holland, 229-330.
Charness, Gary; Gneezy, Uri; Kuhn, Peter. (2013) “Extra-laboratory experiments –
extending the reach of experimental economics”, Journal of Economic Behavior and
Organization, 91, 93-100.
Durante, Ruben. (2010) “Risk, Cooperation, and the Economic Origins of Social Trust: An
Empirical Investigation” Working paper.
Durkheim, Emile. “The division of labor in society”, 1933, Macmillan, New York.
Eckel, Catherine and Grossman, Philipp. (1996) “Altruism in anonymous Dictator
games”, Games and Economic Behavior, 161, 181-191.
Fehr, Ernst and Gächter, Simon. (2002) “Altruistic Punishment in Humans”, Nature, 415(6868), pp. 137-140

24
Fehr, Ernst; Hoff, Karla; Kshetramade, Mayuresh. (2008) “Spite and Development”, American Economic Review: Papers & Proceedings, 98(2), 494-499.
Fehr, Ernst and Leibbrandt, Andreas. (2011). A Field Study on Cooperativeness and
Impatience in the Tragedy of the Commons, Journal of Public Economics, 95, 1144-
1155.
Gächter, Simon; Herrmann, Benedikt. (2011) “The limits of self-governance when
cooperators get punished: Experimental evidence from urban and rural Russia“,
European Economic Review, 55(2), 193-210.
Gintis, Herb. (2003) “The Hitchhiker’s Guide to Altruism: Gene-Culture Coevolution and
the Internalization of Norms”, Journal of Theoretical Biology, 220(4), 407-418.
Gneezy, Uri and Potters, Jan (1997) “An Experiment on Risk Taking and Evaluation
Periods”, Quarterly Journal of Economics, 112(2), 631-645.
Gneezy, Uri; List, John; Leonard, Kenneth. (2009) “Gender Differences in Competition:
Evidence from a Matrilineal and a Patriarchal Society”, Econometrica, 77(5), 1637-
1664.
Güth, Werner, Schmittberger, Rolf, and Schwarze, Bernd. (1982) “An Experimental
Analysis of Ultimatum Bargaining”, Journal of Economic Behavior and
Organization, 3, pp.367-388.
Harrison, Glenn, and List, John. (2004) “Field Experiments,” Journal of Economic
Literature, 42(4), 1009-1055.
Hayashi, Nahoko; Ostrom, Elinor; Walker, James, and Toshio Yamagishi (1999)
“Reciprocity, Trust, and the Sense of Control”, Rationality and Society, 11(1), 27-46.
Henrich, Joseph, Robert Boyd, Samuel Bowles, Colin Camerer, Ernst Fehr, and
Herbert Gintis, Richard McElreath. (2001) “In Search of Homo Economicus:
Behavioral Experiments in 15 Small-Scale Societies”, American Economic Review.
91.2: 73-78.
Henrich, Joseph et al. (2005). “Economic man” in cross-cultural perspective: Behavioral
experiments in 15 small-scale societies. Behavioral and Brain Sciences, 28, 1-21.
Henrich, Joseph at al. (2006). “Costly Punishment Across Human Societies”, Science, 312,
1767-1770.
Henrich, Joseph et al. (2010). “Markets, Religion, Community Size, and the Evolution of
Fairness and Punishment. Science, 327, 1480-1484.

25
Herrmann, Benedikt; Thöni, Christian; Gächter, Simon. (2008) “Antisocial Punishment
Across Societies”, Science, 319, 1362-1367.
Knack, Steven and Keefer, Philip. (1997) “Does Social Capital have an Economic
Payoff?”, Quarterly Journal of Economics, 112(4), 1251-1288.
La Porta, Rafael; Lopez de Silane, Florencio; Shleifer, Andrei; Vishny, Robert. (1997)
“Trust in Large Organizations”, American Economic Review, 87(2), 333-338.
Leibbrandt, Andreas; Gneezy, Uri; List, John. (2013) “Rise and fall of competitiveness in
individualistic and collectivistic societies”, Proceedings of the National Academy of
Sciences of the United States of America, 110(23), 9305-9308.
Oosterbeek, Hessel; Sloof, Randolph; van de Kuilen, Gijs. (2004) “Cultural Differences in
Ultimatum Game Experiments: evidence from a Meta-Analysis”, Experimental
Economics, 7(2), 171-188.
Parsons, Talcott. “The structure of social action”, 1937, McGraw Hill.
Prediger, Sebastian; Vollan Bjoern; and Benedikt Herrmann. (2013). Does Resource
Scarcity affect Behaviour? Experimental Evidence from Southern-Namibia. Mimeo.
Roth, Alvin; Prasnikar, Vesna; Okuno-Fujiwara, Masahiro; Zamir, Shmuel. (1991)
“Bargaining and Market Behavior in Jerusalem, Ljubljana, Pittsburgh, and Tokyo: An
Experimental Study”, American Economic Review, 81(5), 1068-1095.
Sober, Elliott and Wilson, David. “Unto Others: The Evolution and Psychology of
Unselfish Behaviour”, 1998, Harvard Univ. Press, Cambridge, Massachusetts.
Voors, Maarten; Nillesen, Elenora; Bulte, Erwin; Lensink, Robert; Verwimp, Philip
and van Soest, Daan. Violent Conflict and Behavior: a Field Experiment in Burundi,
American Economic Review, forthcoming.

26
Figures 1-6
Figure 1: Field Setting. Our study was conducted in north-eastern Brazil in different societies in close proximity and in which fishing is the main and often only source of income. The societies are connected by a river, only divided by a dam, and the society at the sea is at the estuary mouth of this river. At the lake fishermen go fishing alone whereas at the sea they go fishing in teams.
27
Figure 2a (left): Trust at Lake and Sea. The black bars show the points sent of the trustees in the trust game at the lake, the grey bars the points sent of the trustees at the sea. Figure 2b (right): Trustworthiness at Lake and Sea. The black bars show the back-transfers of the trustors in the trust game at the lake, the grey bars the back-transfers of the trustors at the sea conditional on each amount sent (horizontal axis).
Figure 3a (left): Offers in Ultimatum Game at Lake and Sea. The black bars show the offers of the proposers at the lake, the grey bars the offers of the proposers at the sea. The maximal offer was 5. Figure 3b (right): Minimal Acceptable Offers in Ultimatum Game at Lake and Sea. The black bars show the choices of the responders at the lake, the grey bars the choices of the responders at the sea. The maximal offer was 5.
010
2030
4050
60
in p
erce
ntag
e
0 1 2 3 4 5
fishermen at lake fishermen at seaamount sent in trust game
01
23
45
67
aver
age
amou
nt s
ent b
ack
1 2 3 4 5
fishermen at lake fishermen at sea
amount sent in trust game
05
1015
2025
30
in p
erce
ntag
e
0 1 2 3 4 5
fishermen at lake fishermen at sea
offers in ultimatum game
010
2030
4050
in p
erce
ntag
e
0 1 2 3 4 5
fishermen at lake fishermen at sea
minimal acceptable offer in ultimatum game

28
Figure 4: Donations at Lake and Sea. The black bars show the donations in the charity experiment at the lake, the grey bars the donations at the sea.
Figure 5: Public Good Contributions at Lake and Sea. The black bars show the contributions in the public goods game at the lake, the grey bars the contributions at the sea.
05
1015
2025
30
in p
erce
ntag
e
0 1 2 3 4 5 6 7 8 9 10
fishermen at lake fishermen at sea
amount donated
05
1015
2025
30
in p
erce
ntag
e
0 1 2 3 4 5 6 7 8 9 10
fishermen at lake fishermen at sea
amount contributed in public goods game

29
Figure 6: Individual Cooperation Index at Lake and Sea. The figure shows the Kernel density for the cooperation index in both societies. The index is composed of the behavior in four experiments (back-transfers in trust game for all possible levels of trust, offers in ultimatum game, donations in donation game, contributions in public goods game) and defined in the main text. For participants who did not take part in all of these four games, we take the mean of the games in which they took part.
0.0
1.0
2.0
3de
nsity
0 20 40 60 80 100cooperation in percentage
Fishermen at LakeFishermen at Sea

30
Tables 1-5
TABLE 1 ―FISHERMEN’S BEHAVIOR AT LAKE AND SEA
Lake Sea p-value
Trust Game mean percentage Trust 28.7 40 0.003 Trustworthiness 32.6 43.5 <0.001 Ultimatum Game Offer 27.9 39.8 <0.001 Minimal acceptable offer 14 12.9 0.841 Donation Game Donation 38.3 45.7 <0.001 Public Goods Game Contributions 35.4 41.8 0.047 Coordination Game chooses efficient equilibrium 31.9 50 0.003 Risk-Aversion Game risked share 30.3 34.8 0.155
Notes: We report values from a two-sided Mann-Whitney Test for all but the Coordination Game where we use a two-sided F-Test. Trustworthiness: the numbers indicate the returned points divided by the received points. Observations for Trust and Minimal acceptable Offer (lake=76/sea=55); Trustworthiness and Offer (75/47); Donation, Coordination, Risk-Aversion Game (191/98), Public Goods Game (174/98).

31
TABLE 2 ― REGRESSION ANALYSIS AT LAKE AND SEA Trust Cooperation Index Coordination
Sea Dummy
0.573 5.909 0.127 (0.249) (2.688) (0.061)
Age 0.011 0.140 0.002 (0.008) (0.090) (0.002)
Education 0.025 0.849 0.008 (0.035) (0.535) (0.012)
Income 0.000 0.011 0.000 (0.000) (0.007) (0.000)
Male Dummy
-0.404 8.547 0.138 (0.269) (2.489) (0.082)
Risk Aversion
0.022
-0.001 (0.045)
(0.012)
Constant 1.469 9.556 (0.557) (5.746)
R2 0.087 0.088 Pseudo R2 0.034 N 111 287 287 Notes: OLS-regression for Cooperativeness and Trust, Probit-regression for Coordination. Robust standard errors in parentheses. The values for probit are expressed in marginal effects. Coordination equals one if participant tried to coordinate on efficient outcome in coordination experiment. Sea Dummy equals one if participant fishes at the sea. Risk Aversion = points invested in the risk aversion experiment. Income = monthly income in Brazilian Reais generated from fishing (self-reported). For the cooperation index there are missing observations (n = 20) due to incomplete data on risk aversion.
32
TABLE 3 ― REGRESSION ANALYSIS AT LAKE AND SEA (excluding fishermen who have selected into fishing villages)
Trust Cooperation Index Coordination
Sea Dummy 0.590 5.810 0.159 (0.275) (2.992) (0.065)
Age 0.009 0.120 0.001 (0.009) (0.101) (0.003)
Education 0.027 0.670 0.008 (0.037) (0.562) (0.013)
Income 0.000 0.006 0.000 (0.001) (0.007) (0.000)
Male Dummy -0.533 8.900 0.103 (0.274) (2.743) (0.090)
Risk Aversion 0.034
0.010 (0.046)
(0.013)
Constant 1.709 11.829 (0.555) (6.255)
R2 0.097 0.079 Pseudo R2 0.04 N 97 242 242
Notes: OLS-regression for Cooperativeness and Trust, Probit-regression for Coordination. Robust standard errors in parentheses. The values for probit are expressed in marginal effects. Coordination equals one if participant tried to coordinate on efficient outcome in coordination experiment. Sea Dummy equals one if participant fishes at the sea. Risk Aversion = points invested in the risk aversion experiment. Income = income generated from fishing.

33
TABLE 4 ―FISHERMEN'S BEHAVIOR AT LAKE (corrected for selection out of societies)
selection out?
no yes p-value Trust Game mean percentage
Trust 29.4 27.2 0.708 Trustworthiness 32.1 28.4 0.602 Ultimatum Game
Offer 26.7 17.8 0.153 Minimal acceptable offer 16.2 17.3 0.959 Donation Game
Donation 38.5 37.4 0.645 Public Goods Game
Contributions 34.8 32.6 0.455 Coordination Game
chooses efficient equilibrium 34.1 31.6 0.847 Risk-Aversion Game
risked share 28.5 35.9 0.103 Notes: We report values from a two-sided Mann-Whitney Test for all but the Coordination where we use a two-sided F-Test. Trustworthiness: the numbers indicate the average returned points divided by the number of sent points * 100.
34
TABLE 5 ― REGRESSION ANALYSIS AT LAKE AND SEA (excluding fishermen who have selected out of fishing villages)
model (a) (b) (a) (b) (a) (b) Trust Trust Cooperation
Index Cooperation
Index Coordination Coordination
Sea Dummy
0.465 0.412 7.358 7.006 0.252 0.218 (0.320) (0.369) (4.137) (4.499) (0.080) (0.088)
Age 0.021 0.019 0.099 0.017 0.002 0.000 (0.010) (0.011) (0.104) (0.115) (0.003) (0.003)
Education 0.051 0.062 0.562 0.511 0.002 0.007 (0.039) (0.043) (0.595) (0.645) (0.014) (0.015)
Income 0.001 0.001 0.009 0.006 0.000 0.000 (0.001) (0.001) (0.007) (0.007) (0.000) (0.000)
Male Dummy
-0.434 -0.132 8.749 9.181 0.157 0.274 (0.289) (0.298) (2.664) (2.936) (0.083) (0.091)
Risk Aversion
-0.014 0.007
-0.004 -0.009 (0.053) (0.061)
(0.014) (0.016)
Constant 1.047 0.544 11.905 15.547 (0.675) (0.704) (6.406) (7.306)
R2 0.109 0.101 0.085 0.091 Pseudo R2 0.075 0.097
N 79 64 210 165 210 165
Notes: Models a use the full sample from seven lake villages and one sea village. Models b use the sample from the same villages but exclude all fishermen who have selected out of their profession. OLS-regression for Cooperativeness and Trust, Probit-regression for Coordination. Robust standard errors in parentheses. The values for probit are expressed in marginal effects. Coordination equals one if participant tried to coordinate on efficient outcome in coordination experiment. Sea Dummy equals one if participant fishes at the sea. Risk Aversion = points invested in the risk aversion experiment. Income = income generated from fishing.
35
Appendix Tables A-B
Village (L=Lake, S=Sea)
Age (years)
Education (years in School)
Income (monthly in
Reais)
Gender (1=female, 2=male)
Hours Fishing (weekly) Religiosity
Aditional fishermen in same Boat
Years living in same place Observations
L1 37.59 3.36 404.77 1.64 31.14 1.05 . 27.02 24
L2 38.16 2.68 321.32 2.00 30.58 1.26 . 28.32 19
L3 37.21 3.23 219.00 2.00 28.55 2.00 . 30.15 21
L4 34.97 3.73 282.16 1.95 24.84 1.32 . 22.89 37
L5 38.53 3.29 177.79 1.88 17.15 1.71 . 21.47 17
L6 35.21 2.96 209.46 1.39 22.25 1.81 . 18.63 29
L7 38.41 4.25 147.96 1.82 23.74 1.54 . 27.37 42
L8 37.30 3.47 253.33 1.50 21.47 1.67 . 19.50 30
S1 39.98 3.28 226.59 2.00 25.44 1.57 1.81 35.10 42
S2 40.98 3.64 230.25 2.00 29.97 1.56 3.13 37.38 40
S3 41.50 3.95 262.25 1.90 20.29 1.25 1.80 37.45 20
Total 38.42 3.49 242.58 1.83 25.16 1.52 2.32 28.13 321
TABLE A: ―SUMMARY FOR SOCIO-DEMOGRAPHIC VARIABLES (means on site level)
Lake Sea Lake Sea Lake SeaN=202 99 76 55 191 98
24.5 (30) 14.2 (7) 0.13 (15)26.2 (20) 18.4 (14) 0.21 (19)33.5 (15) 30 (18) 0.29 (28)34.6 (29) 30 (10) 0.29 (17)
40.2 (40) 31 (9) 0.32 (34)40.4 (36) 36.4 (11) 0.33 (30)40.5 (19) 36.6 (12) 0.38 (40)42.4 (19) 39 (21) 0.38 (29)43.3 (34) 42.6 (22) 0.45 (20)
45.1 (39) 42.8 (7) 0.53 (19)48.2 (20) - - 0.66 (38)
TABLE B ―SITE LEVEL BEHAVIOR AT LAKE AND SEA
Cooperation Index Trust (in percent) Coordination (probability)
Notes: Numbers in parenthesis illustrate the number of observations within the site

36
Appendix – Instructions (for both societies, translated from Portuguese)
General Instructions Thank you for coming to today’s meeting. Please note that you are free to leave this meeting at any point of time. Today’s meeting starts with several games. During the games, you will have the chance to earn money. The money you earn will be paid out at the end of the meeting. No one other than me will know what you earn today. The payment will be private. You should know that the money comes from research funds and not from our own pockets or from the pocket of politicians. Please note that there is no right or wrong in playing the games, this is not a test. During today’s session you will receive a code. This ensures that everything you do – your decisions in the games and your answers in questionnaires – will remain anonymous. Instructions for Proposer in Ultimatum Game The outcome in this game will depend on your decision and the decision of another participant in this meeting. You will never know with whom you are playing and the other will not know that s/he is playing with you. Here are two envelopes. In the envelope called “yours” are 10 points and in the envelope called “other” are 0 points. Your decision: You have to propose an offer of how to divide the 10 points between you and the other participant. This means you have to decide how many of theses points you transfer from your envelope to the other envelope. You can transfer nothing, 1,2,3 up to 10 points. After you have made your decision we will ask the other participant who is playing with you if s/he accepts your offer or not. If s/he accepts, your offer will be implemented, i.e., you will get the points in your envelope and the other participant the points you transferred to his/her envelope. If s/he does NOT accept your offer, both of you do not get any point in this game. Examples: Imagine you offer 1 point to the other participant (which means you transfer 1 point to the envelope of the other) and you keep 9 points. Then, if the other participant accepts this offer, you get 9 points and s/he gets 1 point. However, if s/he rejects you will get 0 points and the other gets 0 points. Imagine you offer 5 points to the other participant (which means you transfer 5 points to the envelope of the other) and you keep 5 points. Then, if the other participant accepts this offer, you get 5 points and s/he 5 points. However, if s/he rejects, you will get 0 points and the other 0 points. Imagine you offer 3 points to the other participant (which means you transfer 3 points to the envelope of the other) and you keep 7 points. Then if the other participant accepts this offer, you get 7 points and s/he 3 points. However, if s/he rejects, you will get 0 points and the other 0 points. Imagine you offer 8 points to the other participant (which means you transfer 8 points to the envelope of the other) and you keep 2 points. Then if the other participant accepts this offer, you get 2 points and s/he gets 8 points. However, if s/he rejects, you will get 0 points and the other 0 points. Do you understand? Remember that the outcome in this game depends on your decision how many points you transfer and the decision of the other participant of whether he accepts your offer or not. The other participant will never know that s/he is playing with you, and you will never know with whom you are playing. Please make your decision now. I will now turn my back and you will transfer as many points you want from your envelope to the other envelope. Please do not tell me what you will do. When you are ready, let me know and please hand me the two envelopes. At the end of today’s meeting you will get to know whether the other participant accepted your offer. What is your offer? Would you reject on offer of 0, 1, 2, 3, 4, 5 points?

37
Instructions for Responder in Ultimatum Game The outcome in this game will depend on your decision and the decision of another participant in this meeting. You will never know with whom you are playing and the other will not know that s/he is playing with you. The other participant is asked to make a proposal of how to divide 10 points between her/him and you. Your decision is to accept or reject this proposal. If you accept, the offer of the participant will be implemented, i.e., you will get the points that were offered to you and the other participant keeps the points that he wanted for himself. If you reject, the offer will not be implemented, i.e., s/he will get 0 points in this game and you will get 0 points in this game. After your decision this game is over. Examples: Imagine s/he offers 1 point to you, which means he proposes to keep 9 points for her/himself. If you accept this offer, you get 1 point and s/he 9 points. However, if you reject, you will get 0 points and the other 0 points. Imagine s/he offers 5 points to you, which means he proposes to keep 5 points for her/himself. If you accept this offer, you get 5 points and s/he 5 points. However, if you reject, you will get 0 points and the other 0 points. Imagine s/he offers 3 points to you, which means he proposes to keep 7 points for her/himself. If you accept this offer, you get 3 points and s/he 7 points. However, if you reject, you will get 0 points and the other 0 points. Remember that the outcome in this game depends on your decision of whether you accept or not and on the offer from the other participant. The other participant will never know that s/he is playing with you and you will never know with whom you are playing. You will make your decisions now. As we do not yet know with whom you are playing, we do not know what the exact offer of the other participant was. Therefore you have to make your decision to accept or reject for all possible offers of the other participant. As soon as we know with whom you are playing, we look at the proposal of the other participant and then look into your decision about whether to accept or reject this particular offer. Do you understand? Instructions for Trustor in Trust Game The outcome in this game will depend on your decision and the decision of another participant in this meeting. You will never know with whom you are playing and the other will not know that s/he is playing with you. We will give 5 points to you and also 5 points to the other participant who is playing with you. Your decision is to decide how many points you send to the other participant. All points that you send will be tripled by us before being passed to the other participant. Then, the other participant will decide how many of the tripled points he sends back to you. Then this game is over. Your outcome in this game will be the points you kept (and did not send) plus the points returned to you from the other participant. The other participant will get the 5 points that we gave her/him at the start plus the points that you send to her/him minus the points s/he returned to you. Examples: Imagine you send 3 points to the other participant. As mentioned before, we will triple these points, which means that the other participant gets 9 points. Therefore, the other participant has now 9 points plus the 5 points from the start, i.e., s/he has 14 points. Then the other participant decides how many of her/his points s/he sends back. Imagine he sends back 0 points, then s/he will still have 14 points and you will have 5 – 3 = 2 points. Imagine he sends back 6 points, then s/he will still have 14 – 6 points = 8 points and you will have 5 – 3 + 6 points = 8 points. Imagine you send 0 points to the other participant. This means no points are sent, and the other participant cannot send any points back. Therefore the game ends with you two keeping the 5 points from the beginning of the game. Another example.

38
Imagine you send all 5 points to the other participant. As mentioned before, we will triple these points, which means that the other participant gets 15 points. Therefore, the other participant has now 15 points plus the 5 points from the start, i.e., s/he has 20 points. Then, the other participant decides how many of her/his points s/he sends back. Imagine he sends back 10 points, then s/he will still have 10 points and you will have 5 – 5 + 10 = 10 points. Imagine he sends back 2 points, then s/he will still have 20 – 2 points = 18 points and you will have 5 – 5 + 2 points = 2 points. Is this clear? Shall I repeat? How many of your 5 points do you want to transfer? How many points do you believe will the other participant send back? Instructions for Trustee in Trust Game The outcome in this game will depend on your decision and the decision of another participant in this meeting. You will never know with whom you are playing and the other will not know that s/he is playing with you. We will give 5 points to you and also 5 points to the other participant who is playing with you. The decision of the other participant is how many points s/he sends to you. Every point s/he sends to you is tripled by us before it gets to you. So, for instance, if s/he sends 3 points, 3*3 = 9 points will be added to your 5 points. Your decision is to decide how many points you send to the other participant. Your outcome in this game will be the 5 points that we gave to you at the start plus the points that were sent to you and tripled by us, minus the points you return to the other participant The outcome of the other participant will be the points he did not send plus the points you returned to her/him. Examples: Imagine s/he sends you 5 points. As mentioned before, we will triple these points, which means that you get 15 points. Therefore, you have now 15 points plus the 5 points from the start, i.e., you have 20 points. The other participant has 5 (starting amount) – 5 (the points s/he send) = 0 points. Now you decide how many points you send back. Imagine you send back 0 points, then you will still have 20 points and s/he will have 5 – 5 = 0 points. Imagine you send back 10 points, then you will still have 20 – 10 points = 10 points and s/he will have 5 – 5 + 10 points = 10 points. Another example. Imagine s/he sends you 2 points. As mentioned before, we will triple these points, which means that you get 6 points. Therefore, you have now 6 points plus the 5 points from the start, i.e., you have 11 points. The other participant has 5 (starting amount) – (the points s/he send) = 3 points. Now you decide how many points you send back. Imagine you send back 6 points, then you will still have 11 – 6 points = 5 points and s/he will have 5 – 2 + 6 points = 9 points. Imagine you send back 0 points, then you will still have 11 points and s/he will have 5 – 2 = 3 points. Is this clear? Shall I repeat? Remember that the outcome in this game depends on your decision of how many points you send back and on how many points were sent to you. The other participant will never know that s/he is playing with you and you will never know with whom you are playing. You will make your decisions now. As we do not yet know with whom you are playing, we do not know how many points the other participant actually transferred to you. Therefore you have to make your decision of how many points you send back to the other participant for all possible amounts of money s/he could transfer. As soon as we know with whom you are playing, we will look at the transfer of the other participant and then look into your decision of how many points you will send back given the actual transfer of the other participant, and then calculate your outcome in this game. Do you understand? Instructions for the remaining Games We will now play 5 different games and then the meeting is over. You will be paid according to the outcome from two of the five games. But, you will only know after you

39
played all five games which of the two games will count towards payment. After you have played all 5 games, you will draw two cards and the cards will determine which two games will be relevant for payment. This means that you should take your decisions in all five games seriously because there is a very high chance that any one game will become relevant for your payment. During the five games, we will speak of points. 1 Point is worth 1 Real in the two games that will be chosen for payment. In the other three games, the points will be not converted to Reais. (Donation Experiment) I will now give you two envelopes. In one envelope for you are 10 points, in the other are no points. Your decision is the following: You decide how many of the 10 points you take out of your envelope and transfer to the other. Each point that you transfer from your envelope to the other envelope will be donated to an orphanage. Thus, the more points you take out of your envelope, the less you have, but the more points the orphanage receives. Let me give you two examples: You transfer 9 points; this means you will receive 1 point and the orphanage 9 points. Or, you transfer 3 points which means you will receive 7 points and the orphanage will get 3 points. Of course you can transfer as many of the 10 points as you want, i.e., from zero to ten points. Do you understand? While you make your decision, I will turn my back. Please do not tell me what you plan to do. Please decide now and transfer the amount of points from this envelope to the other envelope and then put the two envelopes in the box in front of you. Tell me when you are ready! (Risk-aversion Experiment) I will now give you 10 points. They are yours. If this game is one of the two games selected for payment, it would mean that you get 10 Reais. You can play with these points, however, playing is risky: you can multiply these points or lose them. This depends on this coin. You will throw this coin and choose heads or tails. If you choose heads and heads shows up, the points you decided to play with are multiplied by 2.5. If you choose heads and tails shows up, you will lose all of the points with which you decided to play. You can decide not to play or to play with 1 – 10 points. Let me give you an example: I decide to play with 5 points, which means that I have 5 points for certain. Then I will choose heads or tails, and afterwards I will throw the coin. If I choose heads and tails shows up, I will only receive 5 points. In contrast, if heads shows up, I will receive 5 * 2.5 = 12.5 points + 5 points = 17.5 points. Do you understand? How many points do you want to risk? (Public Goods Experiment) The outcome in this game depends on your decisions and the decisions of two others in this meeting. Note that you will never know who these two others are and these two others will never know that they played with you. You and the two others will have to make the same decision. Here are two envelopes. In one envelope, which is denoted your envelope, are 10 points. These points are yours. The other, which is denoted your group envelope, is empty. You decide how many of the 10 points you transfer to your group envelope. What happens if you transfer points to your group envelope? First, of course, you will have fewer points in your envelope. Second, for every point you transfer to the group envelope, we will add 0.5 points. Thus, if you transfer (for example) 10 points, we will add 5 points and there will be 15 points in the group envelope. If you transfer nothing, we will not add points to the group envelope. What happens to the points in the group envelope? They will be equally distributed among all participants in your group including you. So, if there are 15 points in the group envelope, you and the other two in your group get 5 points. You do not know how many

40
points the others transfer to the group envelope. The other two participants in your group will also have to decide how many points they transfer to the group envelope before knowing the decisions of their group members. Let me give you an example. Imagine all three participants (including you) decide to transfer no points to the group envelope. Thus, there are no points in the group envelopes and all three participants stay with their 10 points in their private envelope. Imagine now all three participants including you decide to transfer all 10 points to the group account, i.e., there are 30+0.5x30=45 points in the group envelopes. We will then divide the 45 points equally and each of you will receive 15 points. One last example: Imagine participant 1 gives 10 points to the group envelope, participant 2 gives 0 points to the group envelope und you give 5 points to the group envelope. We will then add 0.5 points for each point in the group envelopes, i.e. there are (10+0+5)×1.5=22.5 points. Then we divide these points equally among the three participants so that all get 7.5 points in addition to the points they kept in their individual envelopes. So, participant 1 gets 0+7.5=7.5 points, participant 2 10+7.5=17.5 points and you 5+7.5=12.5 points. Note that participant 2 received more points than you and participant 1 because he did not transfer any point to the group envelope. In contrast, participant 2 received less because he transferred all 10 points to the group envelope. Do you understand? While you make your decision, I will turn my back. Please do not tell me what you plan to do. Please decide now and transfer the amount of points you want from this envelope to the other and then put the two envelopes in the box in front of you. Tell me when you are ready! (Coordination Experiment) In this game you will play with one other participant from this meeting but you do not know who, and the other participant does not know that s/he plays with you. You will not know until the end of the meeting how the other participant decided in this game. Imagine you are a hunter. You and the other participant have to make the following decision: Hunting a rabbit or a stag. The rabbit can be hunted individually but hunting the stag is only possible together. If you decide to hunt a rabbit you will get 7 points (= a rabbit is worth 7 points). If both of you decide to hunt a stag you will both get 10 points (= a stag is worth 20 points). However, if you decide to hunt the stag and the other participant the rabbit, you will get no points (because you cannot hunt the stag alone) and the other will get 7 points (the rabbit can be hunted alone). Likewise, if you decide to hunt the rabbit and the other the stag, you will get 7 points and the other 0 points. Will you hunt the rabbit or the stag? What do you believe, how will the other participant decide?