Embed Size (px)
Citation preview

October 31, 2017
IPO Review
ICICI Securities Ltd | Retail Equity Research
New India Assurance (NIA) is the largest general insurance company in
India in terms of net worth, domestic GDPI, PAT and branch count as on
FY17. As of FY17, it had issued 27.1 million policies across all product
segments. This is the highest among all general insurance companies in
India. NIA offers a comprehensive and well-diversified range of products,
including motor, health, crop/weather, fire, personal accident, marine,
engineering insurance, through multiple distribution channels.
As of June 30, 2017, NIA had 68,389 agents, 16 corporate agents, 25
bancassurance partners and 2452 offices in India. It also has a presence
across 28 other countries through a number of international branches,
agency offices and subsidiaries. Net worth (excluding fair value change
account) increased from | 9605 crore in FY13 to | 12596 crore in FY17.
The company commands robust financial position with solvency ratio as
of 2.27x (June 2017) compared to IRDAI requirement of 1.50x.
Key business aspects
Market leadership and established brand
NIA has been operating for almost a century since incorporation in 1919
and has been the largest Indian general insurance company in terms of
domestic GDPI as of FY17. Despite significant competition, NIA
maintained a leadership position with 15% market share of GDPI (FY17).
Given established brand, business reputation, large & diversified product
portfolio and multi-channel distribution network, NIA is well positioned to
capitalise on growth potential in Indian general insurance industry.
Longstanding global footprint, successful international operations
NIA has a presence in 28 international jurisdictions including the UK,
Japan and Australia. In addition, the company’s global operations are
spread across Asia Pacific, Middle East, Africa and the Caribbean. In FY17,
gross written premium (GWP) from international operations was at
| 3164.0 crore contributing ~14.2% of total GWP. NIA intends to further
expand its international presence through new regions based on existing
market knowledge, underwriting expertise and risk management.
Multi-channel distribution network but combined ratio remains high
NIA has expansive multi-channel distribution network including 68,389
individual agents, 16 corporate agents, 25 bancassurance partners and
2452 offices in India. In FY17, agent (individual and corporate agents),
brokers, and bancassurance partners contributed 42.01%, 25.75%, and
1.15%, respectively, of GDPI in India. Company reported weak combined
ratio of 119.7% in FY17 and has remained consistently above 115%.
Concerns
Catastrophic events could have material adverse effect on operations
Inability to bring down high combined ratios in future
Significant business is generated from relatively few regions
Regulation of motor insurance; changes in demand for motor vehicles
Additional risks associated with international operations
Priced at 64x P/E & 4.3x P/B (post issue FY17 PAT, NW) on higher band
At the IPO upper price band of | 800, the stock is available at a P/B
multiple of 4.3x FY17 (post issue) networth excluding fair value change.
Post issue market capitalisation is at ~| 64000 crore at the upper band.
Being slightly expensive with high combined ratios, we believe one
should subscribe only from a longer term view and not for the purpose of
accruing listing gains.
The New India Assurance Co Ltd
Price band | 770-800
Rating matrix
Rating: Subscribe only for long term
Issue Details*
Issue Opens 1-Nov-17
Issue Closes 3-Nov-16
Issue Size (| Crore) 9107-9467
Price Band (|) 770-800
No of Shares on Offer (crore) 12.0
QIB (%) 50
Non-Institutional (%) 15
Retail (%) 35
Minimum lot size (No. of shares) 18
*Retail & Employee discount: | 30/-per share
Objects of the Issue
The object of the issue is to utilize the net proceeds from fresh issue
of 2.4 crore shares towards meeting future capital requirements. And
further, to achieve benefits of listing equity shares on stock
exchanges and sell up to 9.6 crore equity shares by the selling
shareholders.
1997-98 2001-04 2006
HUL acquires 23% stake. Mitsubishi Corporation and
Shareholding Pattern Pre-Issue Post-Issue
Promoter & promoter group 100.0% 85.4%
Public 0.0% 14.6%
Financial Summary
| Crore FY14 FY15 FY16 FY17
Premiums earned - Net 10994 13354 15215 17675
Income from Investments 1286 1488 1527 1656
Claims Incurred (net) 9462 11262 13234 16300
PAT 805 1377 930 840
Valuation Summary (at | 800; upper price band)
(x) FY14 FY15 FY16 Pre Post
P/E 19.3 11.3 16.6 76.2 78.5
P/BV 1.5 1.4 1.3 5.0 4.3
FY17*
Research Analyst
Kajal Gandhi
Vasant Lohiya
Vishal Narnolia
*Factoring bonus shares issued in August 2017 and fresh issue

Page 2 ICICI Securities Ltd | Retail Equity Research
Company Background
New India Assurance (NIA) is the largest general insurance company in
India in terms of net worth, domestic gross direct premium, PAT and
number of branches as on FY17. The company has been in operation for
almost a century.
The issue involves 12 crore share on offer totalling |9600 crore. Around
2.4 crore shares are fresh issue raising |1920 crore and balance funds will
flow to the government.
As of FY17, it had issued 27.1 million policies across all product segments
which is the highest among all general insurance companies in India.
NIA’s insurance products can be broadly categorized into the following
product verticals: fire insurance; marine insurance, motor insurance, crop
insurance, health insurance and other insurance products. Between FY13
and FY17, despite increasing competition from private players, NIA has
maintained market leadership in the general insurance industry in India
and were leaders in all segments except crop insurance (source: Crisil
report). In FY17, the gross direct premium from fire, engineering, aviation,
liability, marine, motor and health insurance represented a market share
of 19.1%, 21.9%, 29.6%, 18.2%, 21.0%, 15.1% and 18.4%, respectively,
of total gross direct premium in these segments in India.
Exhibit 1: Product-wise breakup of NIA
(| crore)
Product Segment GWP % of total GWP % of total GWP % of total
Fire Insurance 3302.4 19% 3463.7 18% 3563 15%
Marine Insurance 877.2 5% 742.9 4% 714 3%
Motor Insurance 6555.7 39% 7652.5 40% 9016 39%
Crop Insurance 66.7 0% 52.3 0% 1250 5%
Health Insurance 4017.7 24% 4961.3 26% 6085 26%
Other Insurance 2166.9 13% 2354.4 12% 2602 11%
Total 16986.6 100% 19227.0 100% 23230 100%
FY15 FY16 FY17
Source: RHP, ICICIdirect.com Research
The company has developed an expansive multi-channel distribution
network that includes individual and corporate agents, brokers,
bancassurance partners and other intermediaries, as well as direct sales
and sales through online channels. As of Q1FY18, its distribution network
in India included 68,389 individual agents and 16 corporate agents,
bancassurance arrangements with 25 banks in India, and a large number
of OEM and automotive dealer arrangements through its agent and
broker network.
Further, the company has developed a pan-India branch network. As of
Q1FY18, it had 2452 offices in India across 29 states, seven union
territories and across 28 other countries globally through a number of
international branches, agency offices and subsidiaries. It also partners
with the GoI and state governments for implementation of various
government schemes including health insurance and policies for
underprivileged customer segments.
In FY15, FY16 and FY17, NIA’s gross written premium was | 16987 crore,
| 19227 crore and | 23230 crore, respectively. Gross written premium has
increased at a CAGR of 15.2% from | 13200 crore in FY13 to | 23230
crore in FY17. In FY16 and FY17, the company paid dividends (including
dividend distribution tax) of | 360 crore and | 302 crore, respectively,
while for FY17 it has declared dividend payments (including dividend
distribution tax) of | 373 crore.

Page 3 ICICI Securities Ltd | Retail Equity Research
The key highlight is that the company has funded its operations for more
than 40 years without any external capital infusion. The net worth
(excluding fair value change account) increased from | 9605 crore as of
FY13 to | 12596 crore as of FY17. The total net worth (including fair value
change account) increased from | 25470 crore as of FY13 to | 36298 crore
as of FY17. The company commands a robust financial position with a
solvency ratio as of FY17 of 2.22x, vs. the IRDAI requirement of 1.50x.
NIA has been rated A-(Excellent) by AM Best Company since 2007 and
has been rated AAA/Stable by Crisil since 2014.
Details of product portfolio
Fire insurance: The fire insurance portfolio includes fire and special perils
insurance, business interruption insurance, and large risk package
insurance policies.
Marine Insurance: The marine insurance business includes marine cargo
insurance, hull and machinery insurance and offshore oil and energy
insurance products.
Motor Insurance: The motor insurance portfolio includes liability only
(third party) policies and comprehensive motor (third party and own
damage) policies.
Crop Insurance: The crop insurance products include Pradhan Mantri
Fasal Bima Yojana farmers package insurance, weather based crop
insurance, unified package insurance schemes and horticulture/
plantation insurance.
Health Insurance: Health insurance products include individual health
products such as mediclaim, floater and premier mediclaim products;
corporate (group) health insurance products; and personal accident
products and schemes implemented for the GoI such as the Rashtriya
Swasthya Bima Yojana, PMSBY and PMJDY.
Other Insurance: The company has a broad range of general insurance
products under this category, including the following: liability insurance;
engineering insurance; aviation insurance; nuclear insurance; fidelity
guarantee and burglary insurance; householder insurance; insurance
specific commercial insurance such as banker‘s indemnity and
shopkeepers insurance; money insurance; travel insurance; and social
insurance products.
Page 4 ICICI Securities Ltd | Retail Equity Research
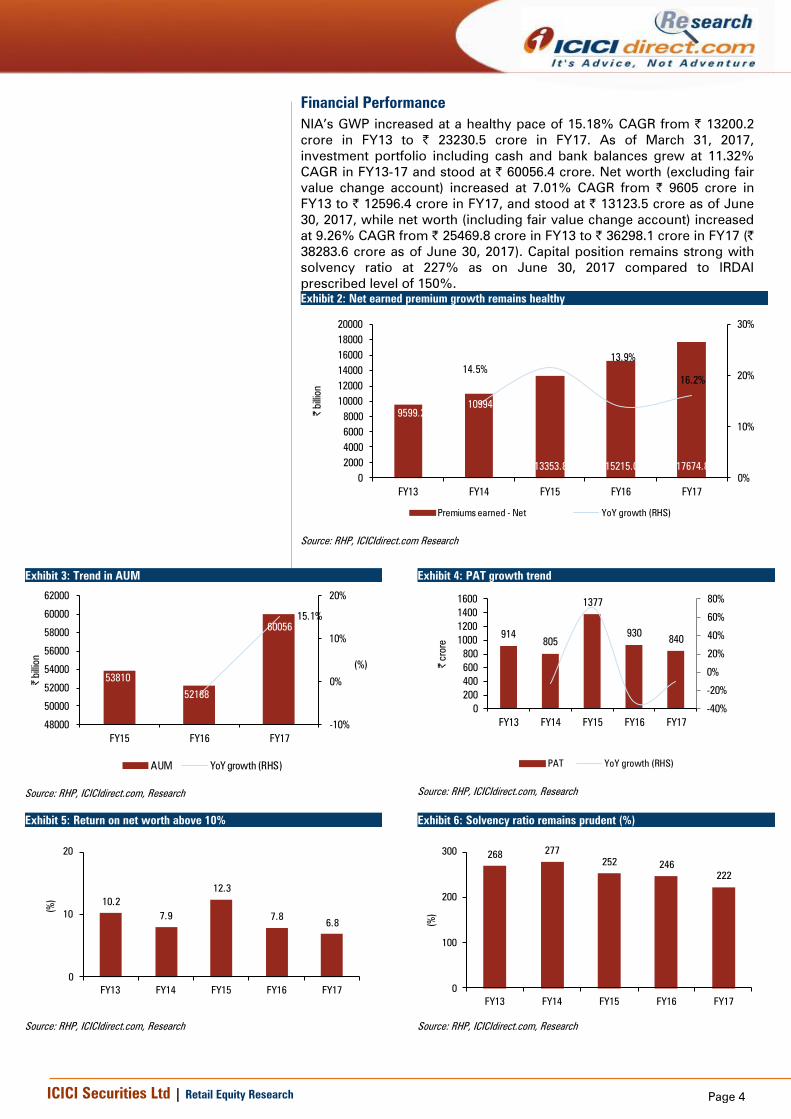
Financial Performance
NIA’s GWP increased at a healthy pace of 15.18% CAGR from | 13200.2
crore in FY13 to | 23230.5 crore in FY17. As of March 31, 2017,
investment portfolio including cash and bank balances grew at 11.32%
CAGR in FY13-17 and stood at | 60056.4 crore. Net worth (excluding fair
value change account) increased at 7.01% CAGR from | 9605 crore in
FY13 to | 12596.4 crore in FY17, and stood at | 13123.5 crore as of June
30, 2017, while net worth (including fair value change account) increased
at 9.26% CAGR from | 25469.8 crore in FY13 to | 36298.1 crore in FY17 (|
38283.6 crore as of June 30, 2017). Capital position remains strong with
solvency ratio at 227% as on June 30, 2017 compared to IRDAI
prescribed level of 150%.
Exhibit 2: Net earned premium growth remains healthy
9599.2
10994.1
13353.8 15215.0 17674.8
14.5%
21.5%
13.9%
16.2%
0%
10%
20%
30%
0
2000
4000
6000
8000
10000
12000
14000
16000
18000
20000
FY13 FY14 FY15 FY16 FY17
| b
illion
Premiums earned - Net YoY growth (RHS)
Source: RHP, ICICIdirect.com Research
Exhibit 3: Trend in AUM
53810
52188
60056
-3.0%
15.1%
-10%
0%
10%
20%
48000
50000
52000
54000
56000
58000
60000
62000
FY15 FY16 FY17
(%)
| b
illion
AUM YoY growth (RHS)
Source: RHP, ICICIdirect.com, Research
Exhibit 4: PAT growth trend
914
805
1377
930840
-40%
-20%
0%
20%
40%
60%
80%
0
200
400
600
800
1000
1200
1400
1600
FY13 FY14 FY15 FY16 FY17
| c
rore
PAT YoY growth (RHS)
Source: RHP, ICICIdirect.com, Research
Exhibit 5: Return on net worth above 10%
10.2
7.9
12.3
7.86.8
0
10
20
FY13 FY14 FY15 FY16 FY17
(%
)
Source: RHP, ICICIdirect.com, Research
Exhibit 6: Solvency ratio remains prudent (%)
268277
252246
222
0
100
200
300
FY13 FY14 FY15 FY16 FY17
(%
)
Source: RHP, ICICIdirect.com, Research
Page 5 ICICI Securities Ltd | Retail Equity Research
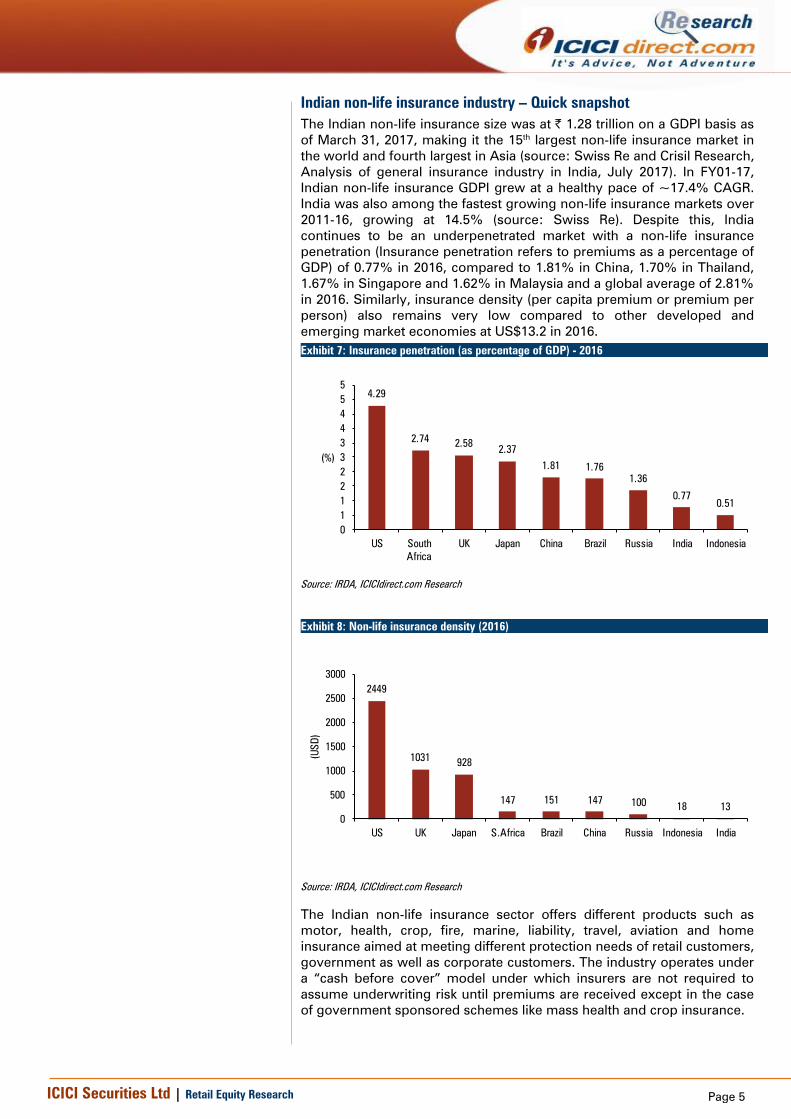
Indian non-life insurance industry – Quick snapshot
The Indian non-life insurance size was at | 1.28 trillion on a GDPI basis as
of March 31, 2017, making it the 15th largest non-life insurance market in
the world and fourth largest in Asia (source: Swiss Re and Crisil Research,
Analysis of general insurance industry in India, July 2017). In FY01-17,
Indian non-life insurance GDPI grew at a healthy pace of ~17.4% CAGR.
India was also among the fastest growing non-life insurance markets over
2011-16, growing at 14.5% (source: Swiss Re). Despite this, India
continues to be an underpenetrated market with a non-life insurance
penetration (Insurance penetration refers to premiums as a percentage of
GDP) of 0.77% in 2016, compared to 1.81% in China, 1.70% in Thailand,
1.67% in Singapore and 1.62% in Malaysia and a global average of 2.81%
in 2016. Similarly, insurance density (per capita premium or premium per
person) also remains very low compared to other developed and
emerging market economies at US$13.2 in 2016.
Exhibit 7: Insurance penetration (as percentage of GDP) - 2016
4.29
2.742.58
2.37
1.81 1.76
1.36
0.77
0.51
0
1
1
2
2
3
3
4
4
5
5
US South
Africa
UK Japan China Brazil Russia India Indonesia
(%)
Source: IRDA, ICICIdirect.com Research
Exhibit 8: Non-life insurance density (2016)
2449
1031928
147 151 147 10018 13
0
500
1000
1500
2000
2500
3000
US UK Japan S.Africa Brazil China Russia Indonesia India
(U
SD
)
Source: IRDA, ICICIdirect.com Research
The Indian non-life insurance sector offers different products such as
motor, health, crop, fire, marine, liability, travel, aviation and home
insurance aimed at meeting different protection needs of retail customers,
government as well as corporate customers. The industry operates under
a “cash before cover” model under which insurers are not required to
assume underwriting risk until premiums are received except in the case
of government sponsored schemes like mass health and crop insurance.
Page 6 ICICI Securities Ltd | Retail Equity Research
The Indian non-life insurance sector has significant growth potential
because of its under-penetration and low insurance density compared to
other economies. According to Crisil Research, GDPI for non-life insurers
are projected to grow at 15-20% CAGR in FY17-22. India’s large working
population, rising affluence, rapid urbanisation and rising awareness of
risk with higher disposable incomes is expected to continue to propel the
growth of the non-life insurance industry in India. In addition, improving
economic growth, emergence of new risks such as cyber frauds and a
strong regulatory focus on improving insurance coverage are expected to
be the key catalysts among others for this growth.
Recent catastrophic events have also highlighted the importance of
insurance in India. With only around 10% of economic losses being
insured in India, significant market potential exists for insurance as people
seek to obtain protection to reduce the impact of uninsured losses in the
event of a catastrophe.
Exhibit 9: Extent of uninsured losses in recent catastrophe events in India
Date Event Place of event
Economic
Losses
(USD bn)
Insured
Losses
(USD bn)
Un-insured
loss of
total loss
Dec, 2015 Floods Tamil Nadu and Andhra Pradesh 2.2 0.8 66%
Oct, 2014 Cyclone Hudhud Odisha and Andhra Pradesh 7.1 0.6 91%
Sept, 2014 Severe Monsoon Floods Jammu and Kashmir 6.0 0.2 96%
Sept, 2014 Severe Monsoon Floods
Assam, Bihar, Meghalaya, Uttar
Pradesh and West Bengal 6.1 0.2 96%
Oct, 2013 Cyclone Phailin Odisha 4.5 0.1 98%
Jun, 2013 Floods Uttarakhand 1.1 0.5 54%
Sept, 2009 Floods Andhra Pradesh and Karnataka 5.3 0.1 99%
Source: IRDA, ICICIdirect.com Research
Market structure
The Indian non-life insurance industry comprises 30 companies as of
March 31, 2017. These can be classified as per their domain or product
offering as under;
Multi-product insurers:
Four public sector companies offering multiple products –
National Insurance Company, The New India Assurance, Oriental
Insurance Company and United India Insurance
18 private sector companies – including ICICI Lombard, Bajaj
Allianz, HDFC Ergo, Iffco Tokio and Tata AIG
Single Product Insurers:
Six standalone private health insurance companies – Apollo
Munich, Cigna TTK, Max Bupa, Religare Health, Star Health and
Aditya Birla
Two public sector specialised single product non-life insurance
companies – Agriculture Insurance Company (AIC), and Export
Credit Guarantee Corporation (ECGC)
Besides these 30 companies, the state owned General Insurance
Corporation of India (GIC) operates as the main Indian reinsurer. The
regulator has recently allowed foreign reinsurers to set up branch offices
in India. This is expected to lead to an increase in reinsurance capacity
thereby increasing the market depth.
Page 7 ICICI Securities Ltd | Retail Equity Research
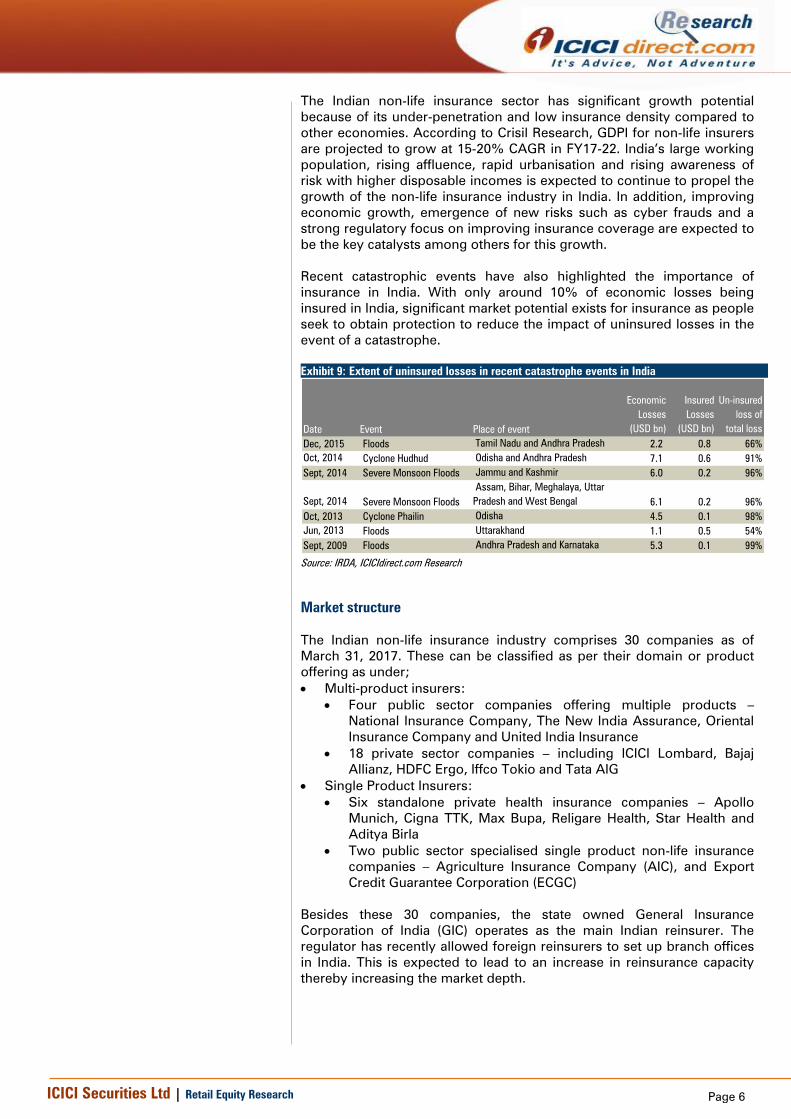
Exhibit 10: GDPI by product segment and insurer (FY17)
Source: IRDA, ICICIdirect.com Research
Structural strength to drive life insurance industry
Demographics strength: Currently, India has one of the youngest
populations in the world, with a median age of 28 years. It is estimated
that 90% of Indians will still be below the age of 60 by 2020 (according to
Crisil Research). Rapid urbanisation coupled with a high share of working
population with rising affluence and labour mobility is expected to
provide an impetus to growth in the Indian non-life insurance sector.
Exhibit 11: Indian working population
34.727.5 30.8
6.9
30.9
27.6
33.7
7.8
27.5
26
37
9.5
0
20
40
60
80
100
120
0-14 15-29 30-59 60+
(%
)
2000 2010 2020E
Source: IRDA, ICICIdirect.com Research
Page 8 ICICI Securities Ltd | Retail Equity Research
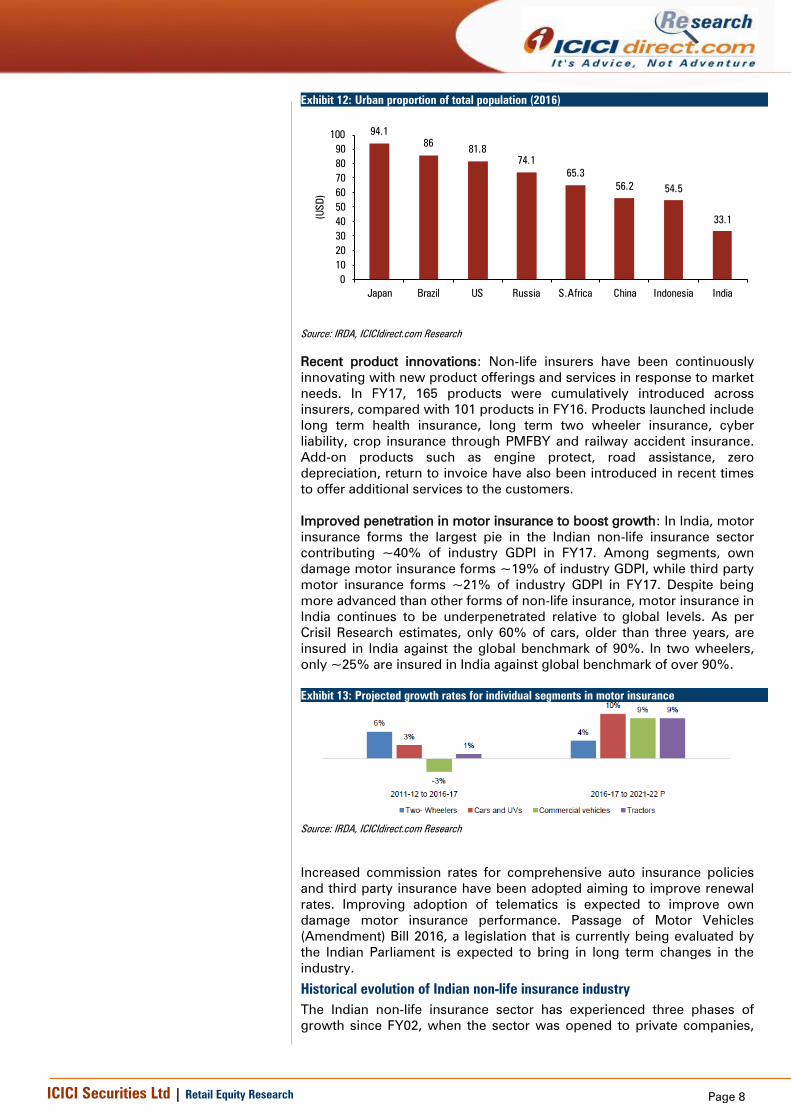
Exhibit 12: Urban proportion of total population (2016)
94.1
8681.8
74.1
65.3
56.2 54.5
33.1
0
10
20
30
40
50
60
70
80
90
100
Japan Brazil US Russia S.Africa China Indonesia India
(U
SD
)
Source: IRDA, ICICIdirect.com Research
Recent product innovations: Non-life insurers have been continuously
innovating with new product offerings and services in response to market
needs. In FY17, 165 products were cumulatively introduced across
insurers, compared with 101 products in FY16. Products launched include
long term health insurance, long term two wheeler insurance, cyber
liability, crop insurance through PMFBY and railway accident insurance.
Add-on products such as engine protect, road assistance, zero
depreciation, return to invoice have also been introduced in recent times
to offer additional services to the customers.
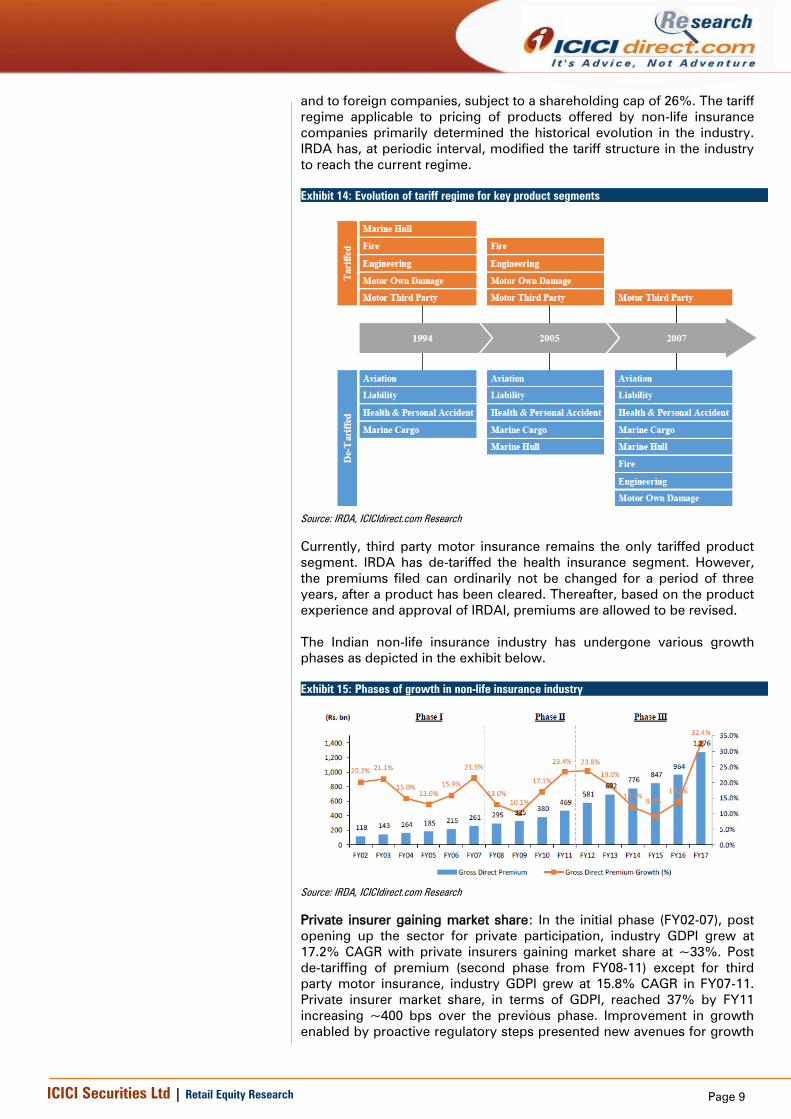
Improved penetration in motor insurance to boost growth: In India, motor
insurance forms the largest pie in the Indian non-life insurance sector
contributing ~40% of industry GDPI in FY17. Among segments, own
damage motor insurance forms ~19% of industry GDPI, while third party
motor insurance forms ~21% of industry GDPI in FY17. Despite being
more advanced than other forms of non-life insurance, motor insurance in
India continues to be underpenetrated relative to global levels. As per
Crisil Research estimates, only 60% of cars, older than three years, are
insured in India against the global benchmark of 90%. In two wheelers,
only ~25% are insured in India against global benchmark of over 90%.
Exhibit 13: Projected growth rates for individual segments in motor insurance
Source: IRDA, ICICIdirect.com Research
Increased commission rates for comprehensive auto insurance policies
and third party insurance have been adopted aiming to improve renewal
rates. Improving adoption of telematics is expected to improve own
damage motor insurance performance. Passage of Motor Vehicles
(Amendment) Bill 2016, a legislation that is currently being evaluated by
the Indian Parliament is expected to bring in long term changes in the
industry.
Historical evolution of Indian non-life insurance industry
The Indian non-life insurance sector has experienced three phases of
growth since FY02, when the sector was opened to private companies,
Page 9 ICICI Securities Ltd | Retail Equity Research
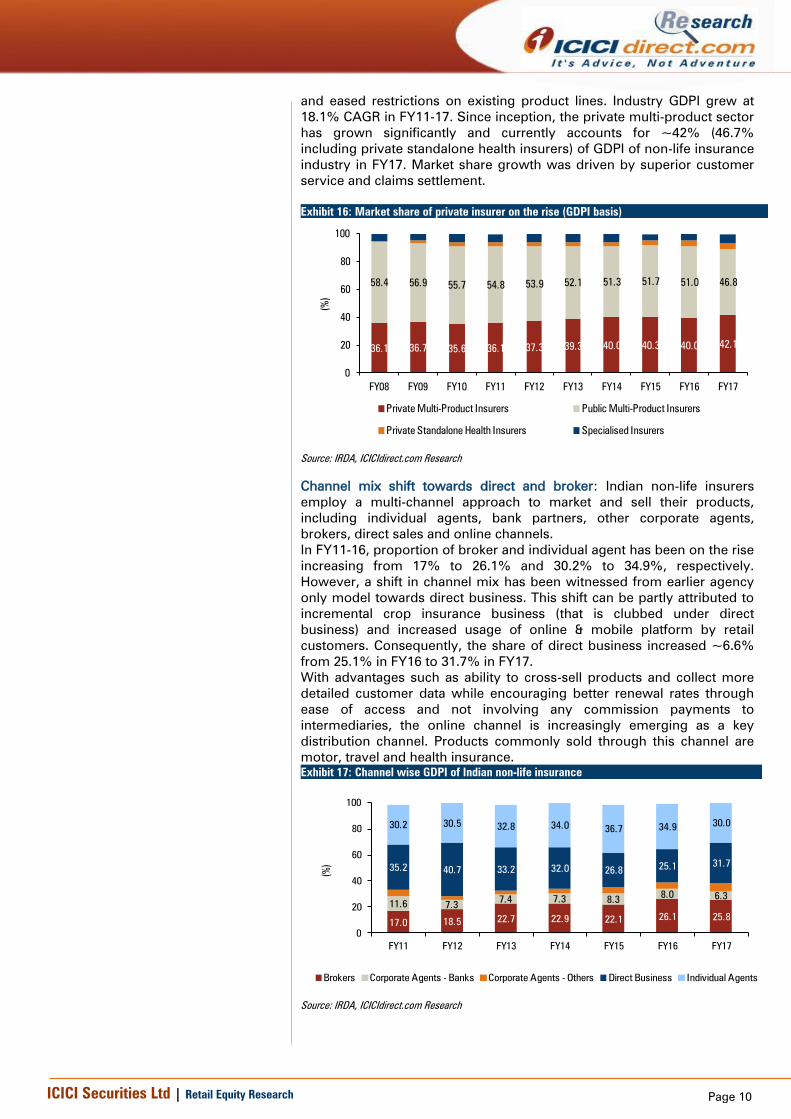
and to foreign companies, subject to a shareholding cap of 26%. The tariff
regime applicable to pricing of products offered by non-life insurance
companies primarily determined the historical evolution in the industry.
IRDA has, at periodic interval, modified the tariff structure in the industry
to reach the current regime.
Exhibit 14: Evolution of tariff regime for key product segments
Source: IRDA, ICICIdirect.com Research
Currently, third party motor insurance remains the only tariffed product
segment. IRDA has de-tariffed the health insurance segment. However,
the premiums filed can ordinarily not be changed for a period of three
years, after a product has been cleared. Thereafter, based on the product
experience and approval of IRDAI, premiums are allowed to be revised.
The Indian non-life insurance industry has undergone various growth
phases as depicted in the exhibit below.
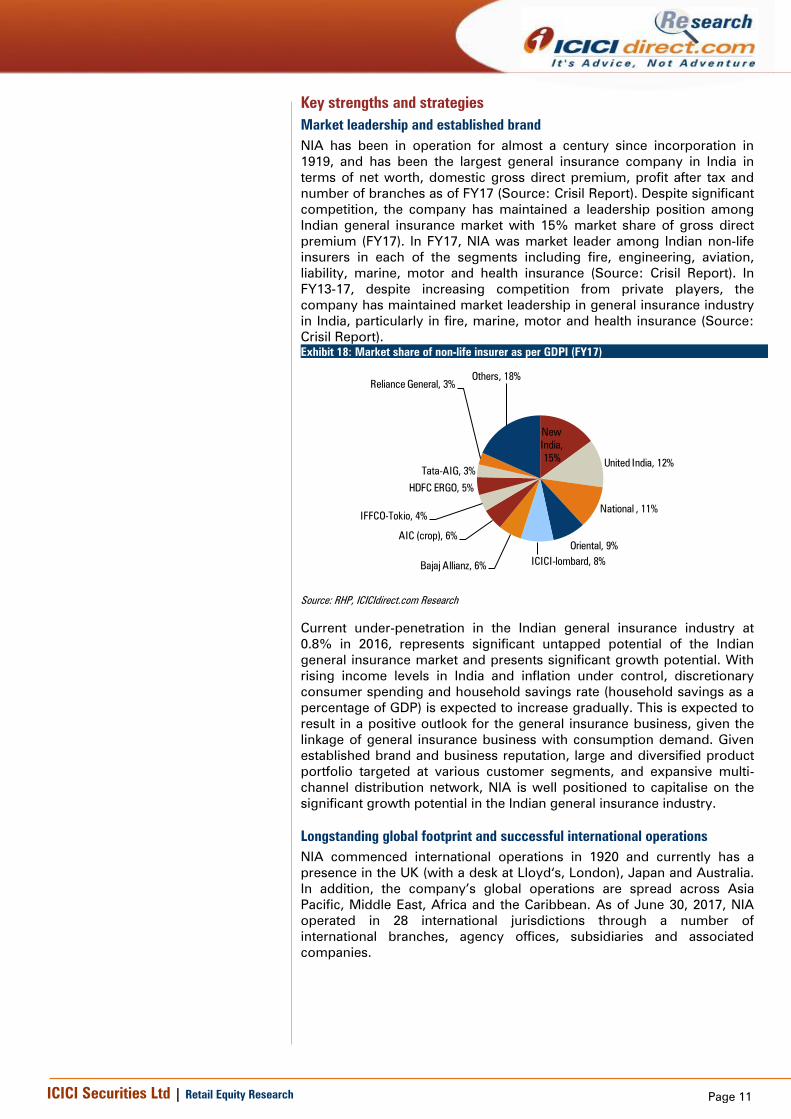
Exhibit 15: Phases of growth in non-life insurance industry
Source: IRDA, ICICIdirect.com Research
Private insurer gaining market share: In the initial phase (FY02-07), post
opening up the sector for private participation, industry GDPI grew at
17.2% CAGR with private insurers gaining market share at ~33%. Post
de-tariffing of premium (second phase from FY08-11) except for third
party motor insurance, industry GDPI grew at 15.8% CAGR in FY07-11.
Private insurer market share, in terms of GDPI, reached 37% by FY11
increasing ~400 bps over the previous phase. Improvement in growth
enabled by proactive regulatory steps presented new avenues for growth
Page 10 ICICI Securities Ltd | Retail Equity Research
and eased restrictions on existing product lines. Industry GDPI grew at
18.1% CAGR in FY11-17. Since inception, the private multi-product sector
has grown significantly and currently accounts for ~42% (46.7%
including private standalone health insurers) of GDPI of non-life insurance
industry in FY17. Market share growth was driven by superior customer
service and claims settlement.
Exhibit 16: Market share of private insurer on the rise (GDPI basis)
36.1 36.7 35.6 36.1 37.3 39.3 40.0 40.3 40.0 42.1
58.4 56.9 55.7 54.8 53.9 52.1 51.3 51.7 51.0 46.8
0
20
40
60
80
100
FY08 FY09 FY10 FY11 FY12 FY13 FY14 FY15 FY16 FY17
(%
)
Private Multi-Product Insurers Public Multi-Product Insurers
Private Standalone Health Insurers Specialised Insurers
Source: IRDA, ICICIdirect.com Research
Channel mix shift towards direct and broker: Indian non-life insurers
employ a multi-channel approach to market and sell their products,
including individual agents, bank partners, other corporate agents,
brokers, direct sales and online channels.
In FY11-16, proportion of broker and individual agent has been on the rise
increasing from 17% to 26.1% and 30.2% to 34.9%, respectively.
However, a shift in channel mix has been witnessed from earlier agency
only model towards direct business. This shift can be partly attributed to
incremental crop insurance business (that is clubbed under direct
business) and increased usage of online & mobile platform by retail
customers. Consequently, the share of direct business increased ~6.6%
from 25.1% in FY16 to 31.7% in FY17.
With advantages such as ability to cross-sell products and collect more
detailed customer data while encouraging better renewal rates through
ease of access and not involving any commission payments to
intermediaries, the online channel is increasingly emerging as a key
distribution channel. Products commonly sold through this channel are
motor, travel and health insurance.
Exhibit 17: Channel wise GDPI of Indian non-life insurance
17.0 18.522.7 22.9 22.1 26.1 25.8
11.6 7.37.4 7.3 8.3
8.0 6.3
35.2 40.7 33.2 32.0 26.825.1
31.7
30.2 30.532.8 34.0
36.7 34.930.0
0
20
40
60
80
100
FY11 FY12 FY13 FY14 FY15 FY16 FY17
(%)
Brokers Corporate Agents - Banks Corporate Agents - Others Direct Business Individual Agents
Source: IRDA, ICICIdirect.com Research
Page 11 ICICI Securities Ltd | Retail Equity Research
Key strengths and strategies
Market leadership and established brand
NIA has been in operation for almost a century since incorporation in
1919, and has been the largest general insurance company in India in
terms of net worth, domestic gross direct premium, profit after tax and
number of branches as of FY17 (Source: Crisil Report). Despite significant
competition, the company has maintained a leadership position among
Indian general insurance market with 15% market share of gross direct
premium (FY17). In FY17, NIA was market leader among Indian non-life
insurers in each of the segments including fire, engineering, aviation,
liability, marine, motor and health insurance (Source: Crisil Report). In
FY13-17, despite increasing competition from private players, the
company has maintained market leadership in general insurance industry
in India, particularly in fire, marine, motor and health insurance (Source:
Crisil Report).
Exhibit 18: Market share of non-life insurer as per GDPI (FY17)
New
India,
15%United India, 12%
National , 11%
Oriental, 9%
ICICI-lombard, 8%Bajaj Allianz, 6%
AIC (crop), 6%
IFFCO-Tokio, 4%
HDFC ERGO, 5%
Tata-AIG, 3%
Reliance General, 3%
Others, 18%
Source: RHP, ICICIdirect.com Research
Current under-penetration in the Indian general insurance industry at
0.8% in 2016, represents significant untapped potential of the Indian
general insurance market and presents significant growth potential. With
rising income levels in India and inflation under control, discretionary
consumer spending and household savings rate (household savings as a
percentage of GDP) is expected to increase gradually. This is expected to
result in a positive outlook for the general insurance business, given the
linkage of general insurance business with consumption demand. Given
established brand and business reputation, large and diversified product
portfolio targeted at various customer segments, and expansive multi-
channel distribution network, NIA is well positioned to capitalise on the
significant growth potential in the Indian general insurance industry.
Longstanding global footprint and successful international operations
NIA commenced international operations in 1920 and currently has a
presence in the UK (with a desk at Lloyd‘s, London), Japan and Australia.
In addition, the company’s global operations are spread across Asia
Pacific, Middle East, Africa and the Caribbean. As of June 30, 2017, NIA
operated in 28 international jurisdictions through a number of
international branches, agency offices, subsidiaries and associated
companies.

Page 12 ICICI Securities Ltd | Retail Equity Research
Exhibit 19: Gross written premium from various international jurisdictions (FY17)
Country GWP (| crore) % of GWP from international operations
United Arab Emirates 386.9 12%
Bahrain 130.3 4%
Kuwait 57.5 2%
Muscat 452.4 14%
Saudi Arabia 0.0 0%
Aruba 84.4 3%
Curacao 33.7 1%
Mauritius 66.7 2%
Hong Kong 71.1 2%
Philippines 47.8 2%
Thailand 21.8 1%
Australia 54.3 2%
Fiji 109.2 3%
Auckland 38.2 1%
Japan 280.6 9%
United Kingdom 1329.3 42%
Total 3164.0 100%
Source: RHP, ICICIdirect.com Research
NIA’s international operations and global footprint strengthen its business
reputation and brand, enable diversification of risk geographically and
contributes a significant portion of premium generated. In FY15, FY16 and
FY17, gross written premium from international operations were | 2840.6
crore, | 3221.84 crore and | 3164.0 crore, respectively, and contributed
17.70%, 17.54% and 14.20%, respectively, of total gross written
premium. Underwriting profits recorded in international operation were at
| 170.04 crore, | 21.71 crore and | 31.0 crore in FY15, FY16 and FY17,
respectively. The company intends to further expand operations in
additional international markets through selective targeting of new
regions based on existing market knowledge, underwriting expertise and
risk management capabilities.
Diversified product offering and product innovation capability
NIA’s strong underwriting capabilities, and relationship with reputed
reinsurers, enable it to provide a comprehensive range of insurance
products address the untapped and evolving needs of customers – both
individual and commercial. As of June 30, 2017, the company offered
more than 230 products across various business segments. NIA offers
diversified composition of insurance products with fire, motor, health,
marine, crop and other insurance segments contributing 15.34%, 38.81%,
26.19%, 3.07%, 5.38% and 11.20%, respectively, of GDPI in FY17.
Exhibit 20: Segment mix for industry players (FY17)
FY17 NIA United India National Oriental ICICI Lombard Bajaj Allianz HDFC ERGO IFFCO Tokio TATA AIG Reliance General
Fire 10% 9% 7% 9% 7% 7% 9% 5% 13% 8%
Health 33% 35% 35% 35% 20% 16% 21% 10% 11% 10%
Marine 3% 2% 2% 3% 3% 2% 2% 2% 6% 1%
Motor 40% 38% 45% 35% 42% 47% 16% 53% 49% 50%
Crop 6% 7% 4% 9% 20% 19% 35% 23% 11% 28%
Others 9% 9% 7% 10% 8% 9% 17% 7% 11% 4%
Source: RHP, ICICIdirect.com Research
NIA has maintained leadership position in the Indian general insurance
market despite increasing competition from private sector players. In
FY17, in terms of gross direct premium, NIA was market leader in each of
product segments including fire, marine, motor and health insurance with
market share of 19.1%, 21.0%, 15.1% and 18.4%, respectively (source:
Crisil report). In the recent past, NIA has introduced new products such as
Page 13 ICICI Securities Ltd | Retail Equity Research
personal accident cover for 41.2 crore individuals with RuPay cards,
nuclear operator liability insurance, cellular network policies to operators,
bonded warehouse insurance for warehouse owners and customised
insurance solutions for various large risk projects across India. Continued
focus on product innovation will enable further to appropriately respond
to market demands and maintain market leadership in a rapidly growing
and changing general insurance market in India.
Multi-channel distribution network
NIA has developed a multi-channel distribution network including
individual and corporate agents, brokers, bancassurance partners and
other intermediaries, as well as direct sales and sales through online
channels. As of June 30, 2017, the company’s distribution network
included 68,389 individual agents and 16 corporate agents. NIA has a
pan-India office network with 2452 offices in India across 29 states and
seven union territories.
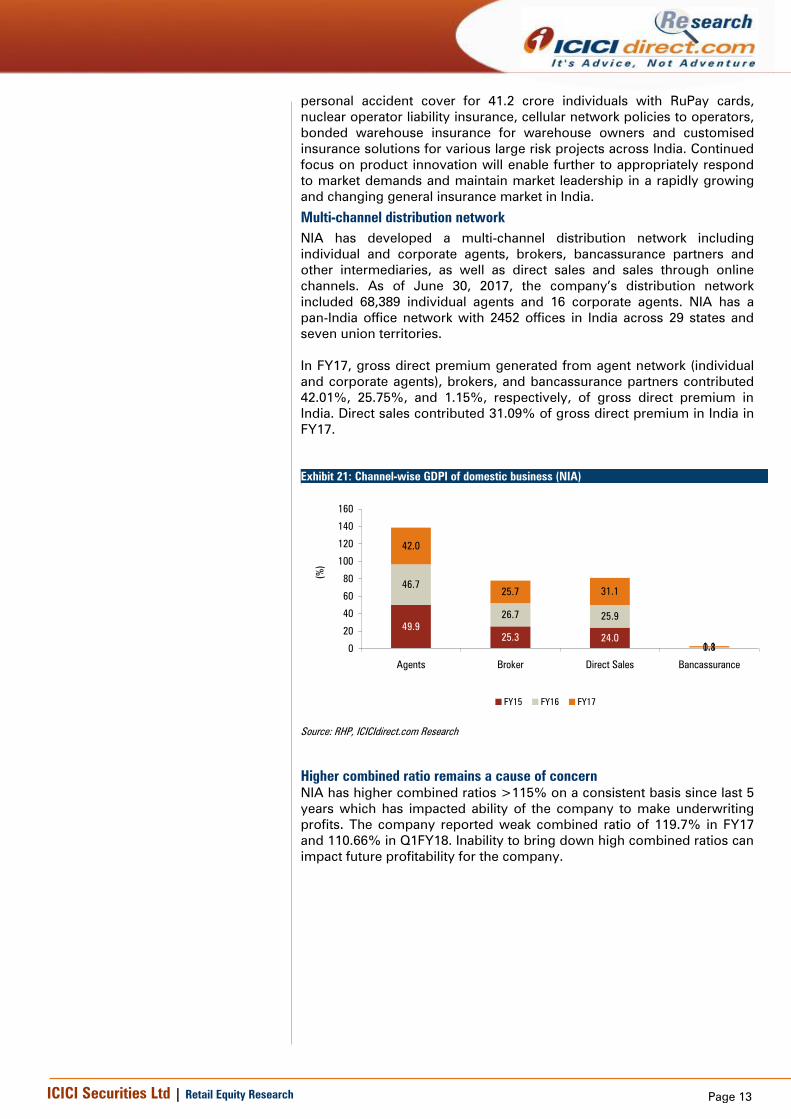
In FY17, gross direct premium generated from agent network (individual
and corporate agents), brokers, and bancassurance partners contributed
42.01%, 25.75%, and 1.15%, respectively, of gross direct premium in
India. Direct sales contributed 31.09% of gross direct premium in India in
FY17.
Exhibit 21: Channel-wise GDPI of domestic business (NIA) es
49.9
25.3 24.0
0.8
46.7
26.7 25.9
0.8
42.0
25.7 31.1
1.10
20
40
60
80
100
120
140
160
Agents Broker Direct Sales Bancassurance
(%
)
FY15 FY16 FY17
Source: RHP, ICICIdirect.com Research
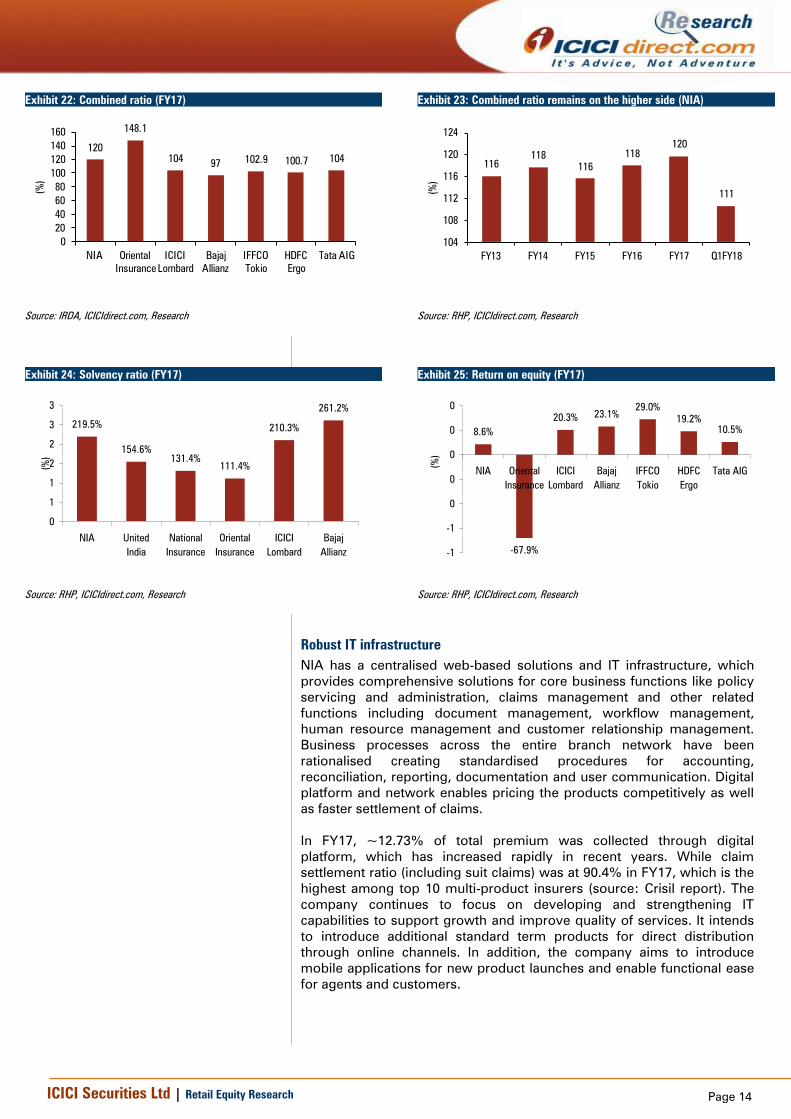
Higher combined ratio remains a cause of concern
NIA has higher combined ratios >115% on a consistent basis since last 5
years which has impacted ability of the company to make underwriting
profits. The company reported weak combined ratio of 119.7% in FY17
and 110.66% in Q1FY18. Inability to bring down high combined ratios can
impact future profitability for the company.
Page 14 ICICI Securities Ltd | Retail Equity Research
Exhibit 22: Combined ratio (FY17)
120
148.1
10497
102.9 100.7 104
0
20
40
60
80
100
120
140
160
NIA Oriental
Insurance
ICICI
Lombard
Bajaj
Allianz
IFFCO
Tokio
HDFC
Ergo
Tata AIG
(%
)
Source: IRDA, ICICIdirect.com, Research
Exhibit 23: Combined ratio remains on the higher side (NIA)
116
118
116
118
120
111
104
108
112
116
120
124
FY13 FY14 FY15 FY16 FY17 Q1FY18
(%
)
Source: RHP, ICICIdirect.com, Research
Exhibit 24: Solvency ratio (FY17)
219.5%
154.6%
131.4%
111.4%
210.3%
261.2%
0
1
1
2
2
3
3
NIA United
India
National
Insurance
Oriental
Insurance
ICICI
Lombard
Bajaj
Allianz
(%
)
Source: RHP, ICICIdirect.com, Research
Exhibit 25: Return on equity (FY17)
8.6%
-67.9%
20.3%23.1%
29.0%
19.2%
10.5%
-1
-1
0
0
0
0
0
NIA Oriental
Insurance
ICICI
Lombard
Bajaj
Allianz
IFFCO
Tokio
HDFC
Ergo
Tata AIG
(%
)
Source: RHP, ICICIdirect.com, Research
Robust IT infrastructure
NIA has a centralised web-based solutions and IT infrastructure, which
provides comprehensive solutions for core business functions like policy
servicing and administration, claims management and other related
functions including document management, workflow management,
human resource management and customer relationship management.
Business processes across the entire branch network have been
rationalised creating standardised procedures for accounting,
reconciliation, reporting, documentation and user communication. Digital
platform and network enables pricing the products competitively as well
as faster settlement of claims.
In FY17, ~12.73% of total premium was collected through digital
platform, which has increased rapidly in recent years. While claim
settlement ratio (including suit claims) was at 90.4% in FY17, which is the
highest among top 10 multi-product insurers (source: Crisil report). The
company continues to focus on developing and strengthening IT
capabilities to support growth and improve quality of services. It intends
to introduce additional standard term products for direct distribution
through online channels. In addition, the company aims to introduce
mobile applications for new product launches and enable functional ease
for agents and customers.

Page 15 ICICI Securities Ltd | Retail Equity Research
Key risks and concerns
Catastrophic events may have material adverse effect on operations
NIA has a wide range of insurance products including products that cover
losses from unpredictable events such as hurricanes, storms, monsoons,
earthquakes, fires, industrial explosions, floods, riots, terrorism, etc.
There can be no assurance that the company has been or will in future be
able to effectively cover large losses arising out of these catastrophic
events. In case the company incurs one or more large catastrophic losses,
its ability to write future business may be adversely impacted if the
company is unable to replenish its capital.
Dependence on select insurance products for premium & profitability
In FY17, the fire, motor and health insurance segments contributed
12.1%, 41.1% and 27.9% respectively, of NIA’s gross direct premium.
Any constraint in selling these products due to future regulatory changes
restricting or limiting the sale or marketing of these products, changes in
customer preference could have a material adverse effect on business
operations.
Inability to bring down high combined ratios in future
High combined ratios >115% on a consistent basis since last 5 years
impact ability of the company to make underwriting profits. Company
reported weak combined ratio of 119.7% even in FY17 and 110.66% in
Q1FY18. Inability to bring down high combined ratios can impact future
profitability for the company.
Significant portion of business is generated from relatively few regions
Maharashtra and Tamil Nadu accounted for 44.74% of NIA’s domestic
gross direct premium in FY17. Thus, it is susceptible to economic and
other trends and developments, including adverse weather conditions, in
these areas. Given NIA’s, geographic concentrations, any catastrophic
event in such locations may significantly increase catastrophic
reinsurance premiums.
Regulation of motor insurance; changes in demand for motor vehicles
In FY15, FY16 and FY17, NIA derived 38.59%, 39.80% and 38.81%
respectively, of its gross written premium from motor vehicle insurance
products. This has largely been driven by the continued growth in
demand for motor vehicles. Such growth in demand may not sustain in
the future. Further, under the Motors Vehicles Act, 1988, as amended,
there is a requirement for every person who uses (except passengers) or
causes or allows any other person to use a motor vehicle in public, to
purchase motor vehicle third-party liability insurance. If there is any
change in this requirement, the demand for third-party motor insurance
may decline, which could have an adverse effect on company’s business
as this product line contributed to 19.6% of its gross premium in FY17.
Additional risks associated with international operations
In FY15, FY16 and FY17, gross written premium from NIA’s international
operations was | 2840 crore, | 3222 crore and | 3164 crore, respectively,
and contributed 17.7%, 17.54% and 14.2%, respectively, of its ‘s gross
written premium in such periods. This business is subjects to various
risks, including currency risk, risks associated with political instability,
catastrophic risk affecting business underwritten abroad, changing market
conditions around the globe, economic downturn, which could result in
financial market disruption, and risk of compliance with local laws, any of
which could cause a material and adverse effect on NIA’s business and
prospects.
Page 16 ICICI Securities Ltd | Retail Equity Research
Financial Summary
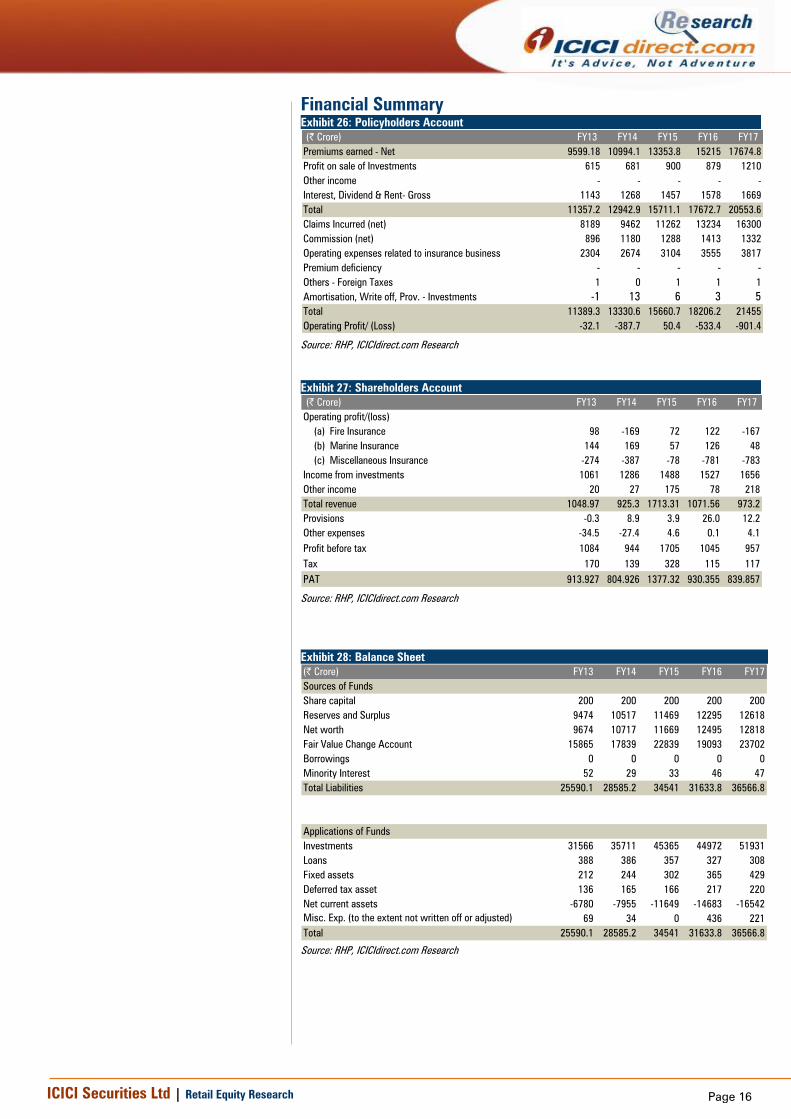
Exhibit 26: Policyholders Account
(| Crore) FY13 FY14 FY15 FY16 FY17
Premiums earned - Net 9599.18 10994.1 13353.8 15215 17674.8
Profit on sale of Investments 615 681 900 879 1210
Other income - - - - -
Interest, Dividend & Rent- Gross 1143 1268 1457 1578 1669
Total 11357.2 12942.9 15711.1 17672.7 20553.6
Claims Incurred (net) 8189 9462 11262 13234 16300
Commission (net) 896 1180 1288 1413 1332
Operating expenses related to insurance business 2304 2674 3104 3555 3817
Premium deficiency - - - - -
Others - Foreign Taxes 1 0 1 1 1
Amortisation, Write off, Prov. - Investments -1 13 6 3 5
Total 11389.3 13330.6 15660.7 18206.2 21455
Operating Profit/ (Loss) -32.1 -387.7 50.4 -533.4 -901.4
Source: RHP, ICICIdirect.com Research
Exhibit 27: Shareholders Account
(| Crore) FY13 FY14 FY15 FY16 FY17
Operating profit/(loss)
(a) Fire Insurance 98 -169 72 122 -167
(b) Marine Insurance 144 169 57 126 48
(c) Miscellaneous Insurance -274 -387 -78 -781 -783
Income from investments 1061 1286 1488 1527 1656
Other income 20 27 175 78 218
Total revenue 1048.97 925.3 1713.31 1071.56 973.2
Provisions -0.3 8.9 3.9 26.0 12.2
Other expenses -34.5 -27.4 4.6 0.1 4.1
Profit before tax 1084 944 1705 1045 957
Tax 170 139 328 115 117
PAT 913.927 804.926 1377.32 930.355 839.857
Source: RHP, ICICIdirect.com Research
Exhibit 28: Balance Sheet
(| Crore) FY13 FY14 FY15 FY16 FY17
Sources of Funds
Share capital 200 200 200 200 200
Reserves and Surplus 9474 10517 11469 12295 12618
Net worth 9674 10717 11669 12495 12818
Fair Value Change Account 15865 17839 22839 19093 23702
Borrowings 0 0 0 0 0
Minority Interest 52 29 33 46 47
Total Liabilities 25590.1 28585.2 34541 31633.8 36566.8
Applications of Funds
Investments 31566 35711 45365 44972 51931
Loans 388 386 357 327 308
Fixed assets 212 244 302 365 429
Deferred tax asset 136 165 166 217 220
Net current assets -6780 -7955 -11649 -14683 -16542
Misc. Exp. (to the extent not written off or adjusted) 69 34 0 436 221
Total 25590.1 28585.2 34541 31633.8 36566.8
Source: RHP, ICICIdirect.com Research
Page 17 ICICI Securities Ltd | Retail Equity Research
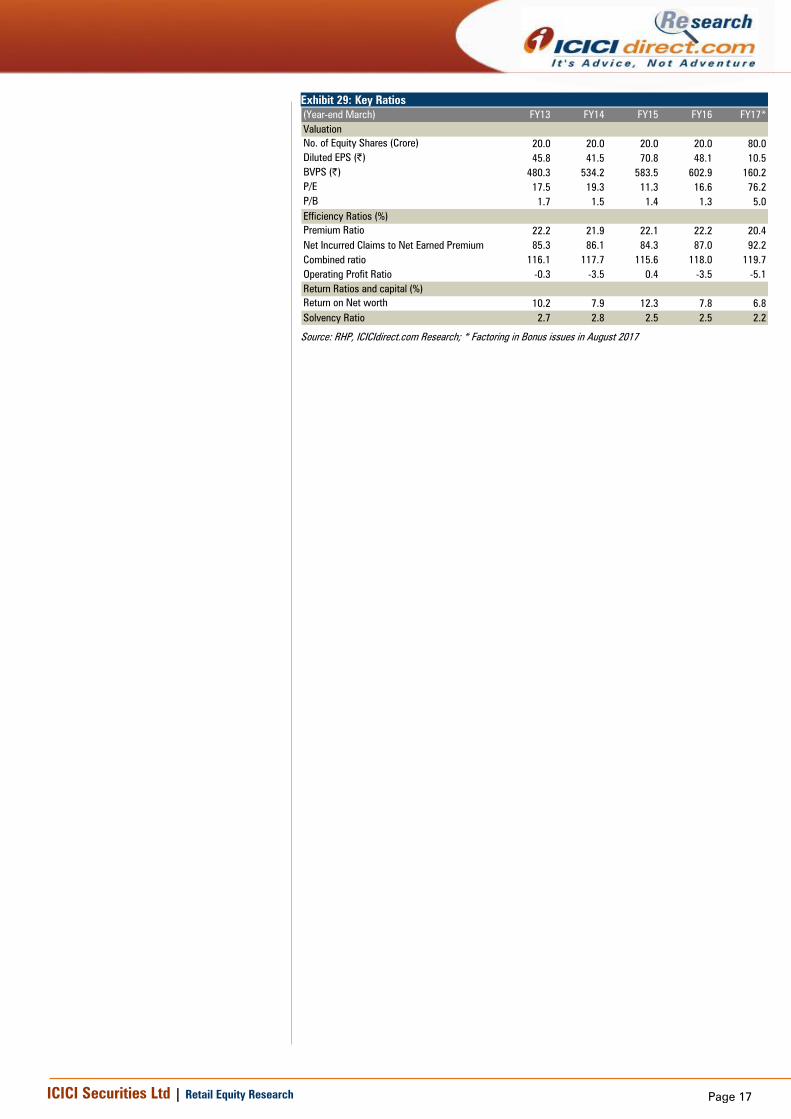
Exhibit 29: Key Ratios
(Year-end March) FY13 FY14 FY15 FY16 FY17*
Valuation
No. of Equity Shares (Crore) 20.0 20.0 20.0 20.0 80.0
Diluted EPS (|) 45.8 41.5 70.8 48.1 10.5
BVPS (|) 480.3 534.2 583.5 602.9 160.2
P/E 17.5 19.3 11.3 16.6 76.2
P/B 1.7 1.5 1.4 1.3 5.0
Efficiency Ratios (%)Expense of Management to Net Written
Premium Ratio 22.2 21.9 22.1 22.2 20.4
Net Incurred Claims to Net Earned Premium 85.3 86.1 84.3 87.0 92.2
Combined ratio 116.1 117.7 115.6 118.0 119.7
Operating Profit Ratio -0.3 -3.5 0.4 -3.5 -5.1
Return Ratios and capital (%)
Return on Net worth 10.2 7.9 12.3 7.8 6.8
Solvency Ratio 2.7 2.8 2.5 2.5 2.2
Source: RHP, ICICIdirect.com Research; * Factoring in Bonus issues in August 2017
Page 18 ICICI Securities Ltd | Retail Equity Research
RATING RATIONALE
ICICIdirect.com endeavours to provide objective opinions and recommendations. ICICIdirect.com assigns ratings to its
stocks according to their notional target price vs. current market price and then categorises them as Strong Buy, Buy, Hold
and Sell. The performance horizon is two years unless specified and the notional target price is defined as the analysts'
valuation for a stock.
Subscribe: Apply for the IPO
Avoid: Do not apply for the IPO
Subscribe only for long term: Apply for the IPO only from a long term investment perspective
Pankaj Pandey Head – Research [email protected]
ICICIdirect.com Research Desk,
ICICI Securities Limited,
1st Floor, Akruti Trade Centre,
Road No 7, MIDC,
Andheri (East)
Mumbai – 400 093

Page 19 ICICI Securities Ltd | Retail Equity Research
ANALYST CERTIFICATION
We /I, Kajal Gandhi, CA, Vasant Lohiya, CA and Vishal Narnolia, MBA, Research Analysts, authors and the names subscribed to this report, hereby certify that all of the views expressed in this research
report accurately reflect our views about the subject issuer(s) or securities. We also certify that no part of our compensation was, is, or will be directly or indirectly related to the specific recommendation(s)
or view(s) in this report.
Terms & conditions and other disclosures:
ICICI Securities Limited (ICICI Securities) is a full-service, integrated investment banking and is, inter alia, engaged in the business of stock brokering and distribution of financial products. ICICI Securities
Limited is a Sebi registered Research Analyst with Sebi Registration Number – INH000000990. ICICI Securities is a wholly-owned subsidiary of ICICI Bank which is India’s largest private sector bank and has
its various subsidiaries engaged in businesses of housing finance, asset management, life insurance, general insurance, venture capital fund management, etc. (“associates”), the details in respect of which
are available on www.icicibank.com.
ICICI Securities is one of the leading merchant bankers/ underwriters of securities and participate in virtually all securities trading markets in India. We and our associates might have investment banking
and other business relationship with a significant percentage of companies covered by our Investment Research Department. ICICI Securities generally prohibits its analysts, persons reporting to analysts
and their relatives from maintaining a financial interest in the securities or derivatives of any companies that the analysts cover.
The information and opinions in this report have been prepared by ICICI Securities and are subject to change without any notice. The report and information contained herein is strictly confidential and
meant solely for the selected recipient and may not be altered in any way, transmitted to, copied or distributed, in part or in whole, to any other person or to the media or reproduced in any form, without
prior written consent of ICICI Securities. While we would endeavour to update the information herein on a reasonable basis, ICICI Securities is under no obligation to update or keep the information current.
Also, there may be regulatory, compliance or other reasons that may prevent ICICI Securities from doing so. Non-rated securities indicate that rating on a particular security has been suspended
temporarily and such suspension is in compliance with applicable regulations and/or ICICI Securities policies, in circumstances where ICICI Securities might be acting in an advisory capacity to this
company, or in certain other circumstances.
This report is based on information obtained from public sources and sources believed to be reliable, but no independent verification has been made nor is its accuracy or completeness guaranteed. This
report and information herein is solely for informational purpose and shall not be used or considered as an offer document or solicitation of offer to buy or sell or subscribe for securities or other financial
instruments. Though disseminated to all the customers simultaneously, not all customers may receive this report at the same time. ICICI Securities will not treat recipients as customers by virtue of their
receiving this report. Nothing in this report constitutes investment, legal, accounting and tax advice or a representation that any investment or strategy is suitable or appropriate to your specific
circumstances. The securities discussed and opinions expressed in this report may not be suitable for all investors, who must make their own investment decisions, based on their own investment
objectives, financial positions and needs of specific recipient. This may not be taken in substitution for the exercise of independent judgment by any recipient. The recipient should independently evaluate
the investment risks. The value and return on investment may vary because of changes in interest rates, foreign exchange rates or any other reason. ICICI Securities accepts no liabilities whatsoever for any
loss or damage of any kind arising out of the use of this report. Past performance is not necessarily a guide to future performance. Investors are advised to see Risk Disclosure Document to understand the
risks associated before investing in the securities markets. Actual results may differ materially from those set forth in projections. Forward-looking statements are not predictions and may be subject to
change without notice.
ICICI Securities or its associates might have managed or co-managed public offering of securities for the subject company or might have been mandated by the subject company for any other assignment
in the past twelve months.
ICICI Securities or its associates might have received any compensation from the companies mentioned in the report during the period preceding twelve months from the date of this report for services in
respect of managing or co-managing public offerings, corporate finance, investment banking or merchant banking, brokerage services or other advisory service in a merger or specific transaction.
ICICI Securities or its associates might have received any compensation for products or services other than investment banking or merchant banking or brokerage services from the companies mentioned
in the report in the past twelve months.
ICICI Securities encourages independence in research report preparation and strives to minimize conflict in preparation of research report. ICICI Securities or its associates or its analysts did not receive any
compensation or other benefits from the companies mentioned in the report or third party in connection with preparation of the research report. Accordingly, neither ICICI Securities nor Research Analysts
and their relatives have any material conflict of interest at the time of publication of this report.
It is confirmed that Kajal Gandhi, CA, Vasant Lohiya, CA and Vishal Narnolia, MBA Research Analysts of this report have not received any compensation from the companies mentioned in the report in the
preceding twelve months.
Compensation of our Research Analysts is not based on any specific merchant banking, investment banking or brokerage service transactions.
ICICI Securities or its subsidiaries collectively or Research Analysts or their relatives do not own 1% or more of the equity securities of the Company mentioned in the report as of the last day of the month
preceding the publication of the research report.
Since associates of ICICI Securities are engaged in various financial service businesses, they might have financial interests or beneficial ownership in various companies including the subject
company/companies mentioned in this report.
It is confirmed that Kajal Gandhi, CA, Vasant Lohiya, CA and Vishal Narnolia, MBA, Research Analysts do not serve as an officer, director or employee of the companies mentioned in the report.
ICICI Securities may have issued other reports that are inconsistent with and reach different conclusion from the information presented in this report.
Neither the Research Analysts nor ICICI Securities have been engaged in market making activity for the companies mentioned in the report.
We submit that no material disciplinary action has been taken on ICICI Securities by any Regulatory Authority impacting Equity Research Analysis activities.
This report is not directed or intended for distribution to, or use by, any person or entity who is a citizen or resident of or located in any locality, state, country or other jurisdiction, where such distribution,
publication, availability or use would be contrary to law, regulation or which would subject ICICI Securities and affiliates to any registration or licensing requirement within such jurisdiction. The securities
described herein may or may not be eligible for sale in all jurisdictions or to certain category of investors. Persons in whose possession this document may come are required to inform themselves of and
to observe such restriction.


![Khenyei v. New India Assurance Co. Ltd. & Ors]](https://img.dokumen.tips/doc/110x75/577cb5581a28aba7118d0ee1/khenyei-v-new-india-assurance-co-ltd-ors.jpg)


