Embed Size (px)
Citation preview
October 2019 GLOBAL INVESTMENT OUTLOOK AND STRATEGY
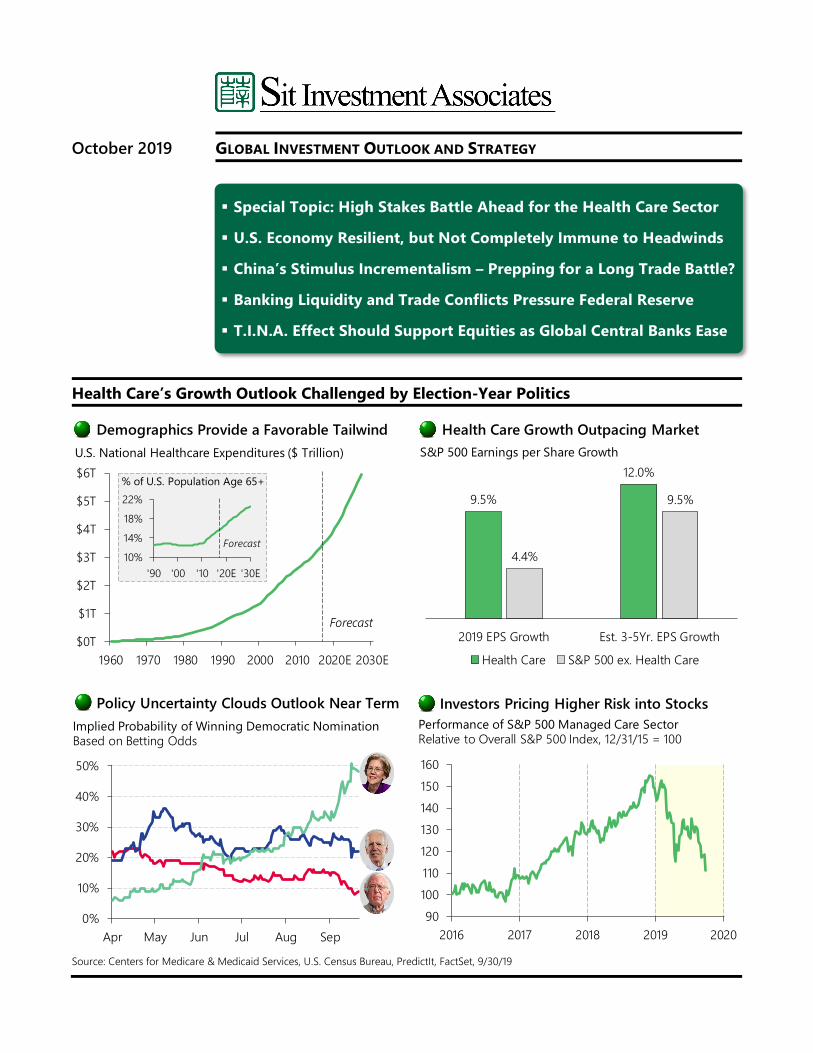
Health Care’s Growth Outlook Challenged by Election-Year Politics
Source: Centers for Medicare & Medicaid Services, U.S. Census Bureau, PredictIt, FactSet, 9/30/19
Demographics Provide a Favorable Tailwind
Investors Pricing Higher Risk into StocksPolicy Uncertainty Clouds Outlook Near Term
0%
10%
20%
30%
40%
50%
Apr May Jun Jul Aug Sep
Implied Probability of Winning Democratic NominationBased on Betting Odds
$0T
$1T
$2T
$3T
$4T
$5T
$6T
1960 1970 1980 1990 2000 2010 2020E 2030E
U.S. National Healthcare Expenditures ($ Trillion)
Forecast
10%
14%
18%
22%
'90 '00 '10 '20E '30E
% of U.S. Population Age 65+
Forecast
9.5%
12.0%
4.4%
9.5%
2019 EPS Growth Est. 3-5Yr. EPS Growth
Health Care S&P 500 ex. Health Care
S&P 500 Earnings per Share Growth
90100110120130140150160
2016 2017 2018 2019 2020
Performance of S&P 500 Managed Care SectorRelative to Overall S&P 500 Index, 12/31/15 = 100
Health Care Growth Outpacing Market
Special Topic: High Stakes Battle Ahead for the Health Care Sector
U.S. Economy Resilient, but Not Completely Immune to Headwinds
China’s Stimulus Incrementalism – Prepping for a Long Trade Battle?
Banking Liquidity and Trade Conflicts Pressure Federal Reserve
T.I.N.A. Effect Should Support Equities as Global Central Banks Ease
2 Sit Investment Associates
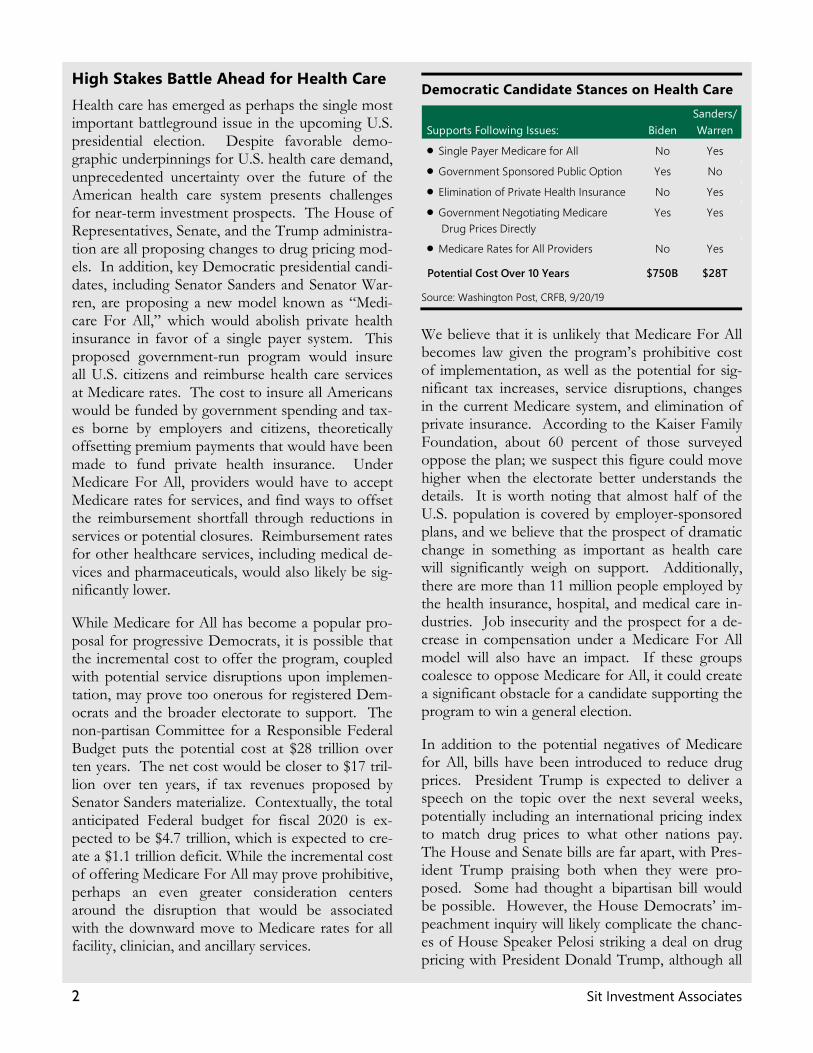
High Stakes Battle Ahead for Health Care Health care has emerged as perhaps the single most important battleground issue in the upcoming U.S. presidential election. Despite favorable demo-graphic underpinnings for U.S. health care demand, unprecedented uncertainty over the future of the American health care system presents challenges for near-term investment prospects. The House of Representatives, Senate, and the Trump administra-tion are all proposing changes to drug pricing mod-els. In addition, key Democratic presidential candi-dates, including Senator Sanders and Senator War-ren, are proposing a new model known as “Medi-care For All,” which would abolish private health insurance in favor of a single payer system. This proposed government-run program would insure all U.S. citizens and reimburse health care services at Medicare rates. The cost to insure all Americans would be funded by government spending and tax-es borne by employers and citizens, theoretically offsetting premium payments that would have been made to fund private health insurance. Under Medicare For All, providers would have to accept Medicare rates for services, and find ways to offset the reimbursement shortfall through reductions in services or potential closures. Reimbursement rates for other healthcare services, including medical de-vices and pharmaceuticals, would also likely be sig-nificantly lower. While Medicare for All has become a popular pro-posal for progressive Democrats, it is possible that the incremental cost to offer the program, coupled with potential service disruptions upon implemen-tation, may prove too onerous for registered Dem-ocrats and the broader electorate to support. The non-partisan Committee for a Responsible Federal Budget puts the potential cost at $28 trillion over ten years. The net cost would be closer to $17 tril-lion over ten years, if tax revenues proposed by Senator Sanders materialize. Contextually, the total anticipated Federal budget for fiscal 2020 is ex-pected to be $4.7 trillion, which is expected to cre-ate a $1.1 trillion deficit. While the incremental cost of offering Medicare For All may prove prohibitive, perhaps an even greater consideration centers around the disruption that would be associated with the downward move to Medicare rates for all facility, clinician, and ancillary services.
Democratic Candidate Stances on Health Care
Source: Washington Post, CRFB, 9/20/19
We believe that it is unlikely that Medicare For All becomes law given the program’s prohibitive cost of implementation, as well as the potential for sig-nificant tax increases, service disruptions, changes in the current Medicare system, and elimination of private insurance. According to the Kaiser Family Foundation, about 60 percent of those surveyed oppose the plan; we suspect this figure could move higher when the electorate better understands the details. It is worth noting that almost half of the U.S. population is covered by employer-sponsored plans, and we believe that the prospect of dramatic change in something as important as health care will significantly weigh on support. Additionally, there are more than 11 million people employed by the health insurance, hospital, and medical care in-dustries. Job insecurity and the prospect for a de-crease in compensation under a Medicare For All model will also have an impact. If these groups coalesce to oppose Medicare for All, it could create a significant obstacle for a candidate supporting the program to win a general election. In addition to the potential negatives of Medicare for All, bills have been introduced to reduce drug prices. President Trump is expected to deliver a speech on the topic over the next several weeks, potentially including an international pricing index to match drug prices to what other nations pay. The House and Senate bills are far apart, with Pres-ident Trump praising both when they were pro-posed. Some had thought a bipartisan bill would be possible. However, the House Democrats’ im-peachment inquiry will likely complicate the chanc-es of House Speaker Pelosi striking a deal on drug pricing with President Donald Trump, although all
Sanders/Supports Following Issues: Biden Warren⏺ Single Payer Medicare for All No Yes⏺ Government Sponsored Public Option Yes No⏺ Elimination of Private Health Insurance No Yes⏺ Government Negotiating Medicare Yes Yes
Drug Prices Directly⏺ Medicare Rates for All Providers No Yes
$750B $28TPotential Cost Over 10 Years
Global Investment Outlook & Strategy – October 2019 3
sides (including major Democratic Presidential candidates) continue to emphasize the importance of bringing down drug prices. This urgency is driv-en, at least in part, by most Americans’ view that drug prices are too high. Therefore, we expect drug pricing discussions to continue to pressure pharma stock price performance, at least through the Presidential election cycle, and likely beyond.
Drug Pricing Reform Differs by Political Party
Source: Barclays Research, 9/20/19
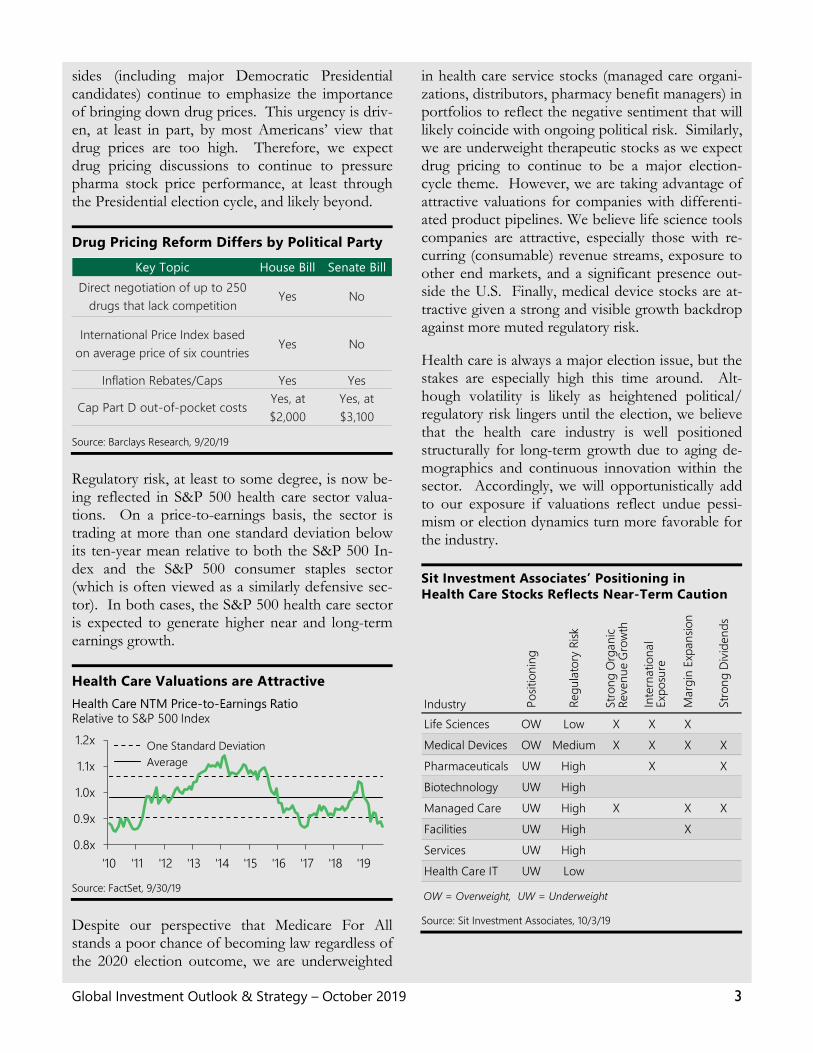
Regulatory risk, at least to some degree, is now be-ing reflected in S&P 500 health care sector valua-tions. On a price-to-earnings basis, the sector is trading at more than one standard deviation below its ten-year mean relative to both the S&P 500 In-dex and the S&P 500 consumer staples sector (which is often viewed as a similarly defensive sec-tor). In both cases, the S&P 500 health care sector is expected to generate higher near and long-term earnings growth.
Health Care Valuations are Attractive
Source: FactSet, 9/30/19
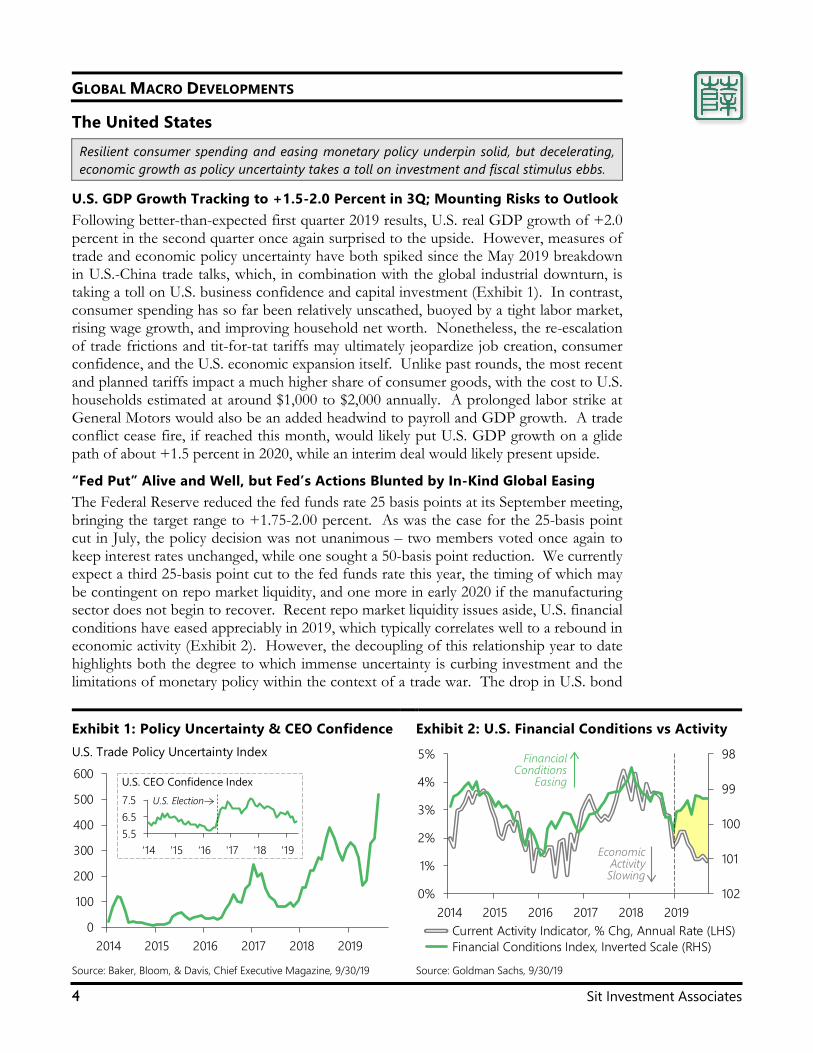
Despite our perspective that Medicare For All stands a poor chance of becoming law regardless of the 2020 election outcome, we are underweighted
in health care service stocks (managed care organi-zations, distributors, pharmacy benefit managers) in portfolios to reflect the negative sentiment that will likely coincide with ongoing political risk. Similarly, we are underweight therapeutic stocks as we expect drug pricing to continue to be a major election-cycle theme. However, we are taking advantage of attractive valuations for companies with differenti-ated product pipelines. We believe life science tools companies are attractive, especially those with re-curring (consumable) revenue streams, exposure to other end markets, and a significant presence out-side the U.S. Finally, medical device stocks are at-tractive given a strong and visible growth backdrop against more muted regulatory risk. Health care is always a major election issue, but the stakes are especially high this time around. Alt-hough volatility is likely as heightened political/ regulatory risk lingers until the election, we believe that the health care industry is well positioned structurally for long-term growth due to aging de-mographics and continuous innovation within the sector. Accordingly, we will opportunistically add to our exposure if valuations reflect undue pessi-mism or election dynamics turn more favorable for the industry.
Sit Investment Associates’ Positioning in Health Care Stocks Reflects Near-Term Caution
Source: Sit Investment Associates, 10/3/19
Key Topic House Bill Senate BillDirect negotiation of up to 250
drugs that lack competitionYes No
International Price Index based on average price of six countries
Yes No
Inflation Rebates/Caps Yes Yes
Cap Part D out-of-pocket costsYes, at $2,000
Yes, at $3,100
0.8x
0.9x
1.0x
1.1x
1.2x
'10 '11 '12 '13 '14 '15 '16 '17 '18 '19
One Standard Deviation Average
Health Care NTM Price-to-Earnings RatioRelative to S&P 500 Index
Industry Pos
ition
ing
Reg
ulat
ory
Risk
Mar
gin
Expa
nsio
n
Stro
ng D
ivide
nds
Life Sciences OW Low X X XMedical Devices OW Medium X X X XPharmaceuticals UW High X XBiotechnology UW HighManaged Care UW High X X XFacilities UW High XServices UW HighHealth Care IT UW Low
OW = Overweight, UW = Underweight
Inte
rnat
iona
lEx
posu
re
Stro
ngO
rgan
ic Re
venu
e Gr
owth
4 Sit Investment Associates
GLOBAL MACRO DEVELOPMENTS
The United States Resilient consumer spending and easing monetary policy underpin solid, but decelerating, economic growth as policy uncertainty takes a toll on investment and fiscal stimulus ebbs.
U.S. GDP Growth Tracking to +1.5-2.0 Percent in 3Q; Mounting Risks to Outlook Following better-than-expected first quarter 2019 results, U.S. real GDP growth of +2.0 percent in the second quarter once again surprised to the upside. However, measures of trade and economic policy uncertainty have both spiked since the May 2019 breakdown in U.S.-China trade talks, which, in combination with the global industrial downturn, is taking a toll on U.S. business confidence and capital investment (Exhibit 1). In contrast, consumer spending has so far been relatively unscathed, buoyed by a tight labor market, rising wage growth, and improving household net worth. Nonetheless, the re-escalation of trade frictions and tit-for-tat tariffs may ultimately jeopardize job creation, consumer confidence, and the U.S. economic expansion itself. Unlike past rounds, the most recent and planned tariffs impact a much higher share of consumer goods, with the cost to U.S. households estimated at around $1,000 to $2,000 annually. A prolonged labor strike at General Motors would also be an added headwind to payroll and GDP growth. A trade conflict cease fire, if reached this month, would likely put U.S. GDP growth on a glide path of about +1.5 percent in 2020, while an interim deal would likely present upside.
“Fed Put” Alive and Well, but Fed’s Actions Blunted by In-Kind Global Easing The Federal Reserve reduced the fed funds rate 25 basis points at its September meeting, bringing the target range to +1.75-2.00 percent. As was the case for the 25-basis point cut in July, the policy decision was not unanimous – two members voted once again to keep interest rates unchanged, while one sought a 50-basis point reduction. We currently expect a third 25-basis point cut to the fed funds rate this year, the timing of which may be contingent on repo market liquidity, and one more in early 2020 if the manufacturing sector does not begin to recover. Recent repo market liquidity issues aside, U.S. financial conditions have eased appreciably in 2019, which typically correlates well to a rebound in economic activity (Exhibit 2). However, the decoupling of this relationship year to date highlights both the degree to which immense uncertainty is curbing investment and the limitations of monetary policy within the context of a trade war. The drop in U.S. bond
Exhibit 1: Policy Uncertainty & CEO Confidence
Exhibit 2: U.S. Financial Conditions vs Activity
Source: Baker, Bloom, & Davis, Chief Executive Magazine, 9/30/19 Source: Goldman Sachs, 9/30/19
0
100
200
300
400
500
600
2014 2015 2016 2017 2018 2019
U.S. Trade Policy Uncertainty Index
5.56.57.5
'14 '15 '16 '17 '18 '19
U.S. Election
U.S. CEO Confidence Index
98
99
100
101
1020%
1%
2%
3%
4%
5%
2014 2015 2016 2017 2018 2019 Current Activity Indicator, % Chg, Annual Rate (LHS) Financial Conditions Index, Inverted Scale (RHS)
Economic ActivitySlowing
Financial Conditions
Easing
Global Investment Outlook & Strategy – October 2019 5
yields has also slowed the U.S. dollar’s steady climb. Yet, the effectiveness of Fed policy is being blunted by responses in kind by global central banks – 16 central banks reduced interest rates in the third quarter, with additional cuts expected in the fourth quarter.
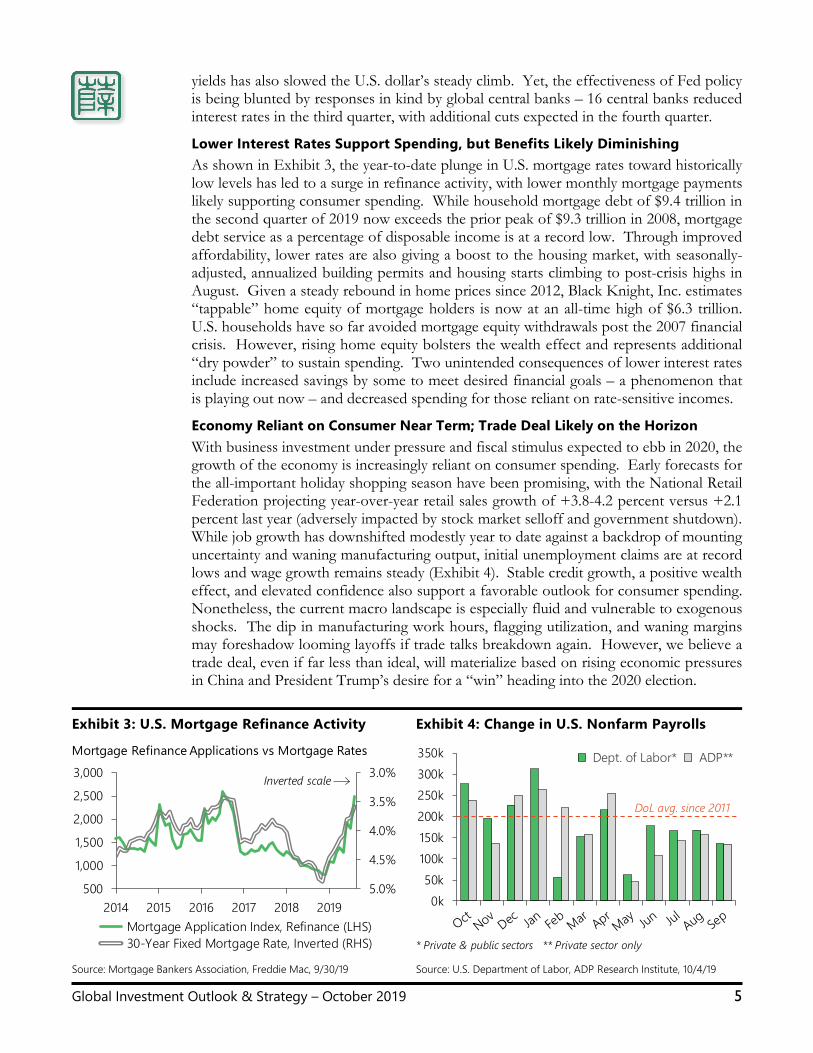
Lower Interest Rates Support Spending, but Benefits Likely Diminishing As shown in Exhibit 3, the year-to-date plunge in U.S. mortgage rates toward historically low levels has led to a surge in refinance activity, with lower monthly mortgage payments likely supporting consumer spending. While household mortgage debt of $9.4 trillion in the second quarter of 2019 now exceeds the prior peak of $9.3 trillion in 2008, mortgage debt service as a percentage of disposable income is at a record low. Through improved affordability, lower rates are also giving a boost to the housing market, with seasonally-adjusted, annualized building permits and housing starts climbing to post-crisis highs in August. Given a steady rebound in home prices since 2012, Black Knight, Inc. estimates “tappable” home equity of mortgage holders is now at an all-time high of $6.3 trillion. U.S. households have so far avoided mortgage equity withdrawals post the 2007 financial crisis. However, rising home equity bolsters the wealth effect and represents additional “dry powder” to sustain spending. Two unintended consequences of lower interest rates include increased savings by some to meet desired financial goals – a phenomenon that is playing out now – and decreased spending for those reliant on rate-sensitive incomes.
Economy Reliant on Consumer Near Term; Trade Deal Likely on the Horizon With business investment under pressure and fiscal stimulus expected to ebb in 2020, the growth of the economy is increasingly reliant on consumer spending. Early forecasts for the all-important holiday shopping season have been promising, with the National Retail Federation projecting year-over-year retail sales growth of +3.8-4.2 percent versus +2.1 percent last year (adversely impacted by stock market selloff and government shutdown). While job growth has downshifted modestly year to date against a backdrop of mounting uncertainty and waning manufacturing output, initial unemployment claims are at record lows and wage growth remains steady (Exhibit 4). Stable credit growth, a positive wealth effect, and elevated confidence also support a favorable outlook for consumer spending. Nonetheless, the current macro landscape is especially fluid and vulnerable to exogenous shocks. The dip in manufacturing work hours, flagging utilization, and waning margins may foreshadow looming layoffs if trade talks breakdown again. However, we believe a trade deal, even if far less than ideal, will materialize based on rising economic pressures in China and President Trump’s desire for a “win” heading into the 2020 election.
Exhibit 3: U.S. Mortgage Refinance Activity Exhibit 4: Change in U.S. Nonfarm Payrolls
Source: Mortgage Bankers Association, Freddie Mac, 9/30/19 Source: U.S. Department of Labor, ADP Research Institute, 10/4/19
3.0%
3.5%
4.0%
4.5%
5.0%500
1,000
1,500
2,000
2,500
3,000
2014 2015 2016 2017 2018 2019 Mortgage Application Index, Refinance (LHS) 30-Year Fixed Mortgage Rate, Inverted (RHS)
Mortgage Refinance Applications vs Mortgage Rates
Inverted scale
0k50k
100k150k200k250k300k350k Dept. of Labor* ADP**
DoL avg. since 2011
* Private & public sectors ** Private sector only
6 Sit Investment Associates
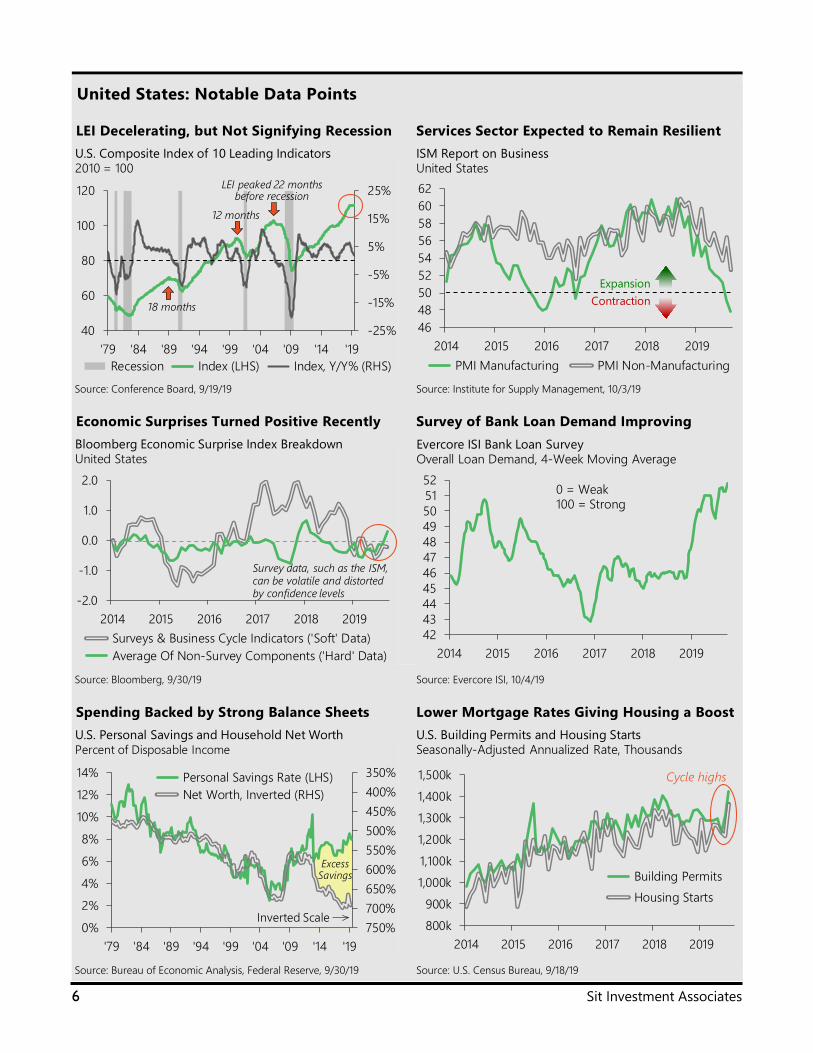
United States: Notable Data Points LEI Decelerating, but Not Signifying Recession Services Sector Expected to Remain Resilient
Source: Conference Board, 9/19/19 Source: Institute for Supply Management, 10/3/19 Economic Surprises Turned Positive Recently Survey of Bank Loan Demand Improving
Source: Bloomberg, 9/30/19 Source: Evercore ISI, 10/4/19 Spending Backed by Strong Balance Sheets Lower Mortgage Rates Giving Housing a Boost
Source: Bureau of Economic Analysis, Federal Reserve, 9/30/19 Source: U.S. Census Bureau, 9/18/19
-25%
-15%
-5%
5%
15%
25%
40
60
80
100
120
'79 '84 '89 '94 '99 '04 '09 '14 '19 Recession Index (LHS) Index, Y/Y% (RHS)
U.S. Composite Index of 10 Leading Indicators2010 = 100
LEI peaked 22 months before recession
12 months
18 months
464850525456586062
2014 2015 2016 2017 2018 2019 PMI Manufacturing PMI Non-Manufacturing
ISM Report on BusinessUnited States
ExpansionContraction
-2.0
-1.0
0.0
1.0
2.0
2014 2015 2016 2017 2018 2019 Surveys & Business Cycle Indicators ('Soft' Data) Average Of Non-Survey Components ('Hard' Data)
Bloomberg Economic Surprise Index BreakdownUnited States
Survey data, such as the ISM, can be volatile and distorted by confidence levels
4243444546474849505152
2014 2015 2016 2017 2018 2019
Evercore ISI Bank Loan SurveyOverall Loan Demand, 4-Week Moving Average
0 = Weak100 = Strong
350%400%450%500%550%600%650%700%750%0%
2%
4%
6%
8%
10%
12%
14%
'79 '84 '89 '94 '99 '04 '09 '14 '19
Personal Savings Rate (LHS) Net Worth, Inverted (RHS)
U.S. Personal Savings and Household Net WorthPercent of Disposable Income
Inverted Scale
ExcessSavings
800k900k
1,000k1,100k1,200k1,300k1,400k1,500k
2014 2015 2016 2017 2018 2019
Building Permits Housing Starts
U.S. Building Permits and Housing StartsSeasonally-Adjusted Annualized Rate, Thousands
Cycle highs
Global Investment Outlook & Strategy – October 2019 7
Europe Drop in Germany’s trade-sensitive, industrial-driven economy weighing on Euro Area growth; Spain & France faring relatively better. Brexit outcome likely not settled by Oct. 31 deadline.
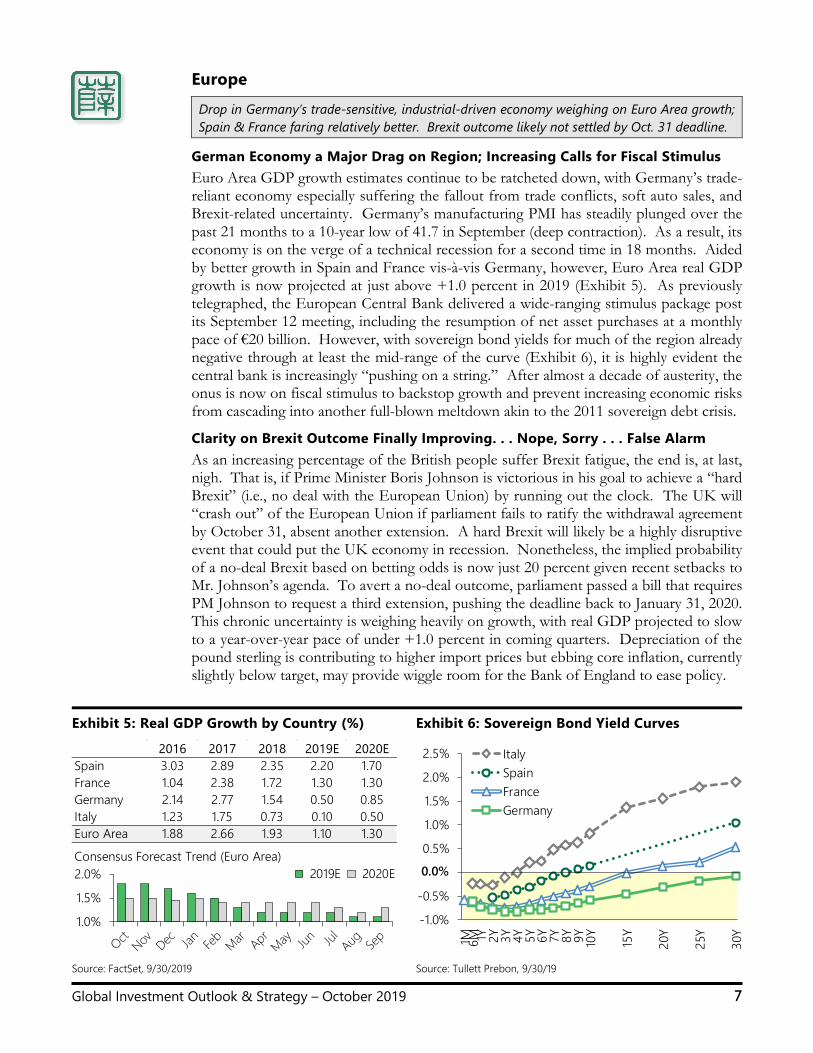
German Economy a Major Drag on Region; Increasing Calls for Fiscal Stimulus Euro Area GDP growth estimates continue to be ratcheted down, with Germany’s trade-reliant economy especially suffering the fallout from trade conflicts, soft auto sales, and Brexit-related uncertainty. Germany’s manufacturing PMI has steadily plunged over the past 21 months to a 10-year low of 41.7 in September (deep contraction). As a result, its economy is on the verge of a technical recession for a second time in 18 months. Aided by better growth in Spain and France vis-à-vis Germany, however, Euro Area real GDP growth is now projected at just above +1.0 percent in 2019 (Exhibit 5). As previously telegraphed, the European Central Bank delivered a wide-ranging stimulus package post its September 12 meeting, including the resumption of net asset purchases at a monthly pace of €20 billion. However, with sovereign bond yields for much of the region already negative through at least the mid-range of the curve (Exhibit 6), it is highly evident the central bank is increasingly “pushing on a string.” After almost a decade of austerity, the onus is now on fiscal stimulus to backstop growth and prevent increasing economic risks from cascading into another full-blown meltdown akin to the 2011 sovereign debt crisis.
Clarity on Brexit Outcome Finally Improving. . . Nope, Sorry . . . False Alarm As an increasing percentage of the British people suffer Brexit fatigue, the end is, at last, nigh. That is, if Prime Minister Boris Johnson is victorious in his goal to achieve a “hard Brexit” (i.e., no deal with the European Union) by running out the clock. The UK will “crash out” of the European Union if parliament fails to ratify the withdrawal agreement by October 31, absent another extension. A hard Brexit will likely be a highly disruptive event that could put the UK economy in recession. Nonetheless, the implied probability of a no-deal Brexit based on betting odds is now just 20 percent given recent setbacks to Mr. Johnson’s agenda. To avert a no-deal outcome, parliament passed a bill that requires PM Johnson to request a third extension, pushing the deadline back to January 31, 2020. This chronic uncertainty is weighing heavily on growth, with real GDP projected to slow to a year-over-year pace of under +1.0 percent in coming quarters. Depreciation of the pound sterling is contributing to higher import prices but ebbing core inflation, currently slightly below target, may provide wiggle room for the Bank of England to ease policy.
Exhibit 5: Real GDP Growth by Country (%) Exhibit 6: Sovereign Bond Yield Curves
Source: FactSet, 9/30/2019 Source: Tullett Prebon, 9/30/19
2016 2017 2018 2019E 2020ESpain 3.03 2.89 2.35 2.20 1.70France 1.04 2.38 1.72 1.30 1.30Germany 2.14 2.77 1.54 0.50 0.85Italy 1.23 1.75 0.73 0.10 0.50Euro Area 1.88 2.66 1.93 1.10 1.30
1.0%
1.5%
2.0% 2019E 2020EConsensus Forecast Trend (Euro Area)
-1.0%
-0.5%
0.0%
0.5%
1.0%
1.5%
2.0%
2.5%
1M 6M 1Y 2Y 3Y 4Y 5Y 6Y 7Y 8Y 9Y 10Y
15Y
20Y
25Y
30Y
ItalySpainFranceGermany
0.0%
8 Sit Investment Associates
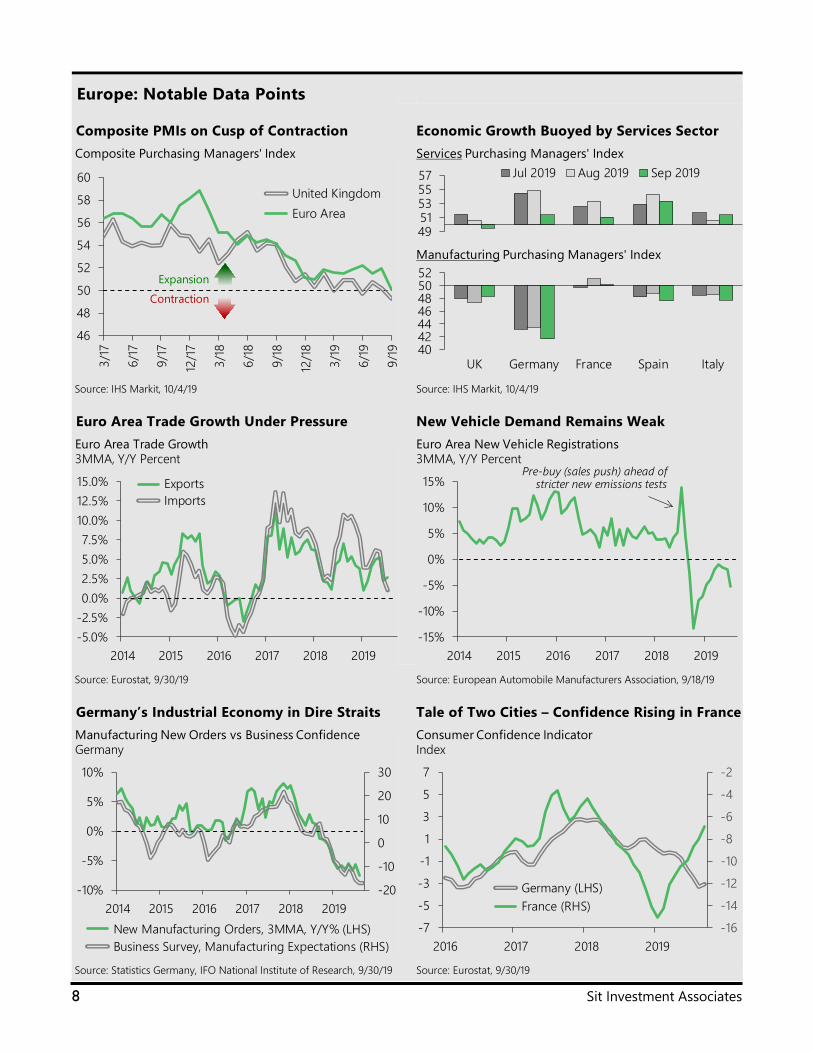
Europe: Notable Data Points Composite PMIs on Cusp of Contraction Economic Growth Buoyed by Services Sector
Source: IHS Markit, 10/4/19 Source: IHS Markit, 10/4/19 Euro Area Trade Growth Under Pressure New Vehicle Demand Remains Weak
Source: Eurostat, 9/30/19 Source: European Automobile Manufacturers Association, 9/18/19 Germany’s Industrial Economy in Dire Straits Tale of Two Cities – Confidence Rising in France
Source: Statistics Germany, IFO National Institute of Research, 9/30/19 Source: Eurostat, 9/30/19
46
48
50
52
54
56
58
60
3/17
6/17
9/17
12/1
7
3/18
6/18
9/18
12/1
8
3/19
6/19
9/19
United Kingdom Euro Area
Composite Purchasing Managers' Index
ExpansionContraction
4951535557 Jul 2019 Aug 2019 Sep 2019Services Purchasing Managers' Index
40424446485052
UK Germany France Spain Italy
Manufacturing Purchasing Managers' Index
-5.0%-2.5%0.0%2.5%5.0%7.5%
10.0%12.5%15.0%
2014 2015 2016 2017 2018 2019
Exports Imports
Euro Area Trade Growth3MMA, Y/Y Percent
-15%
-10%
-5%
0%
5%
10%
15%
2014 2015 2016 2017 2018 2019
Euro Area New Vehicle Registrations3MMA, Y/Y Percent
Pre-buy (sales push) ahead of stricter new emissions tests
-20
-10
0
10
20
30
-10%
-5%
0%
5%
10%
2014 2015 2016 2017 2018 2019 New Manufacturing Orders, 3MMA, Y/Y% (LHS) Business Survey, Manufacturing Expectations (RHS)
Manufacturing New Orders vs Business ConfidenceGermany
-16
-14
-12
-10
-8
-6
-4
-2
-7
-5
-3
-1
1
3
5
7
2016 2017 2018 2019
Germany (LHS) France (RHS)
Consumer Confidence IndicatorIndex
Global Investment Outlook & Strategy – October 2019 9
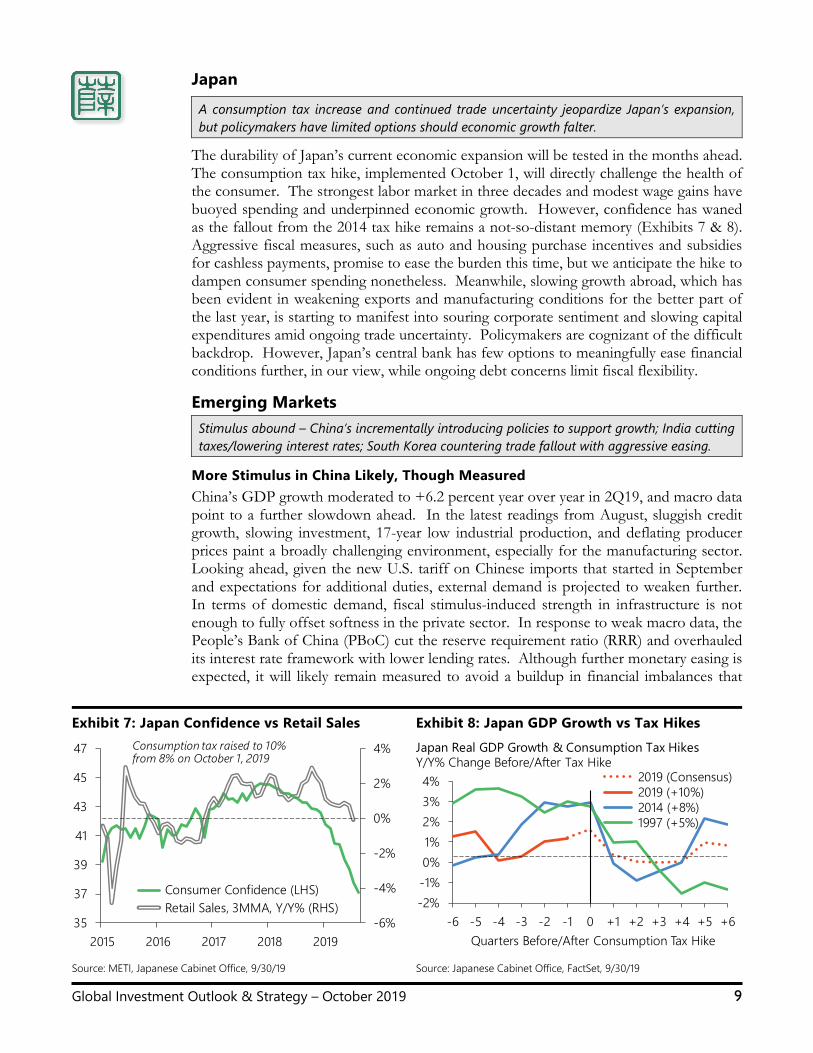
Japan A consumption tax increase and continued trade uncertainty jeopardize Japan’s expansion, but policymakers have limited options should economic growth falter.
The durability of Japan’s current economic expansion will be tested in the months ahead. The consumption tax hike, implemented October 1, will directly challenge the health of the consumer. The strongest labor market in three decades and modest wage gains have buoyed spending and underpinned economic growth. However, confidence has waned as the fallout from the 2014 tax hike remains a not-so-distant memory (Exhibits 7 & 8). Aggressive fiscal measures, such as auto and housing purchase incentives and subsidies for cashless payments, promise to ease the burden this time, but we anticipate the hike to dampen consumer spending nonetheless. Meanwhile, slowing growth abroad, which has been evident in weakening exports and manufacturing conditions for the better part of the last year, is starting to manifest into souring corporate sentiment and slowing capital expenditures amid ongoing trade uncertainty. Policymakers are cognizant of the difficult backdrop. However, Japan’s central bank has few options to meaningfully ease financial conditions further, in our view, while ongoing debt concerns limit fiscal flexibility. Emerging Markets Stimulus abound – China’s incrementally introducing policies to support growth; India cutting taxes/lowering interest rates; South Korea countering trade fallout with aggressive easing.
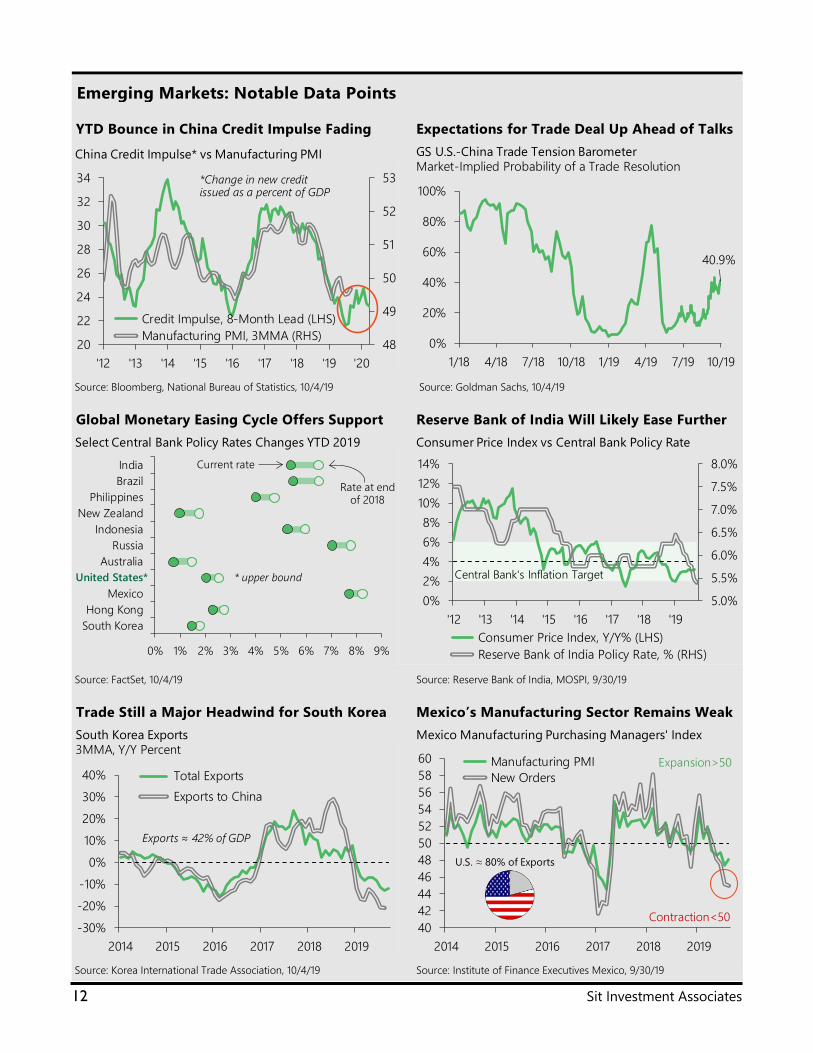
More Stimulus in China Likely, Though Measured China’s GDP growth moderated to +6.2 percent year over year in 2Q19, and macro data point to a further slowdown ahead. In the latest readings from August, sluggish credit growth, slowing investment, 17-year low industrial production, and deflating producer prices paint a broadly challenging environment, especially for the manufacturing sector. Looking ahead, given the new U.S. tariff on Chinese imports that started in September and expectations for additional duties, external demand is projected to weaken further. In terms of domestic demand, fiscal stimulus-induced strength in infrastructure is not enough to fully offset softness in the private sector. In response to weak macro data, the People’s Bank of China (PBoC) cut the reserve requirement ratio (RRR) and overhauled its interest rate framework with lower lending rates. Although further monetary easing is expected, it will likely remain measured to avoid a buildup in financial imbalances that
Exhibit 7: Japan Confidence vs Retail Sales Exhibit 8: Japan GDP Growth vs Tax Hikes
Source: METI, Japanese Cabinet Office, 9/30/19 Source: Japanese Cabinet Office, FactSet, 9/30/19
-6%
-4%
-2%
0%
2%
4%
35
37
39
41
43
45
47
2015 2016 2017 2018 2019
Consumer Confidence (LHS) Retail Sales, 3MMA, Y/Y% (RHS)
Consumption tax raised to 10% from 8% on October 1, 2019
-2%-1%0%1%2%3%4%
-6 -5 -4 -3 -2 -1 0 +1 +2 +3 +4 +5 +6Quarters Before/After Consumption Tax Hike
2019 (Consensus) 2019 (+10%) 2014 (+8%) 1997 (+5%)
Japan Real GDP Growth & Consumption Tax HikesY/Y% Change Before/After Tax Hike
10 Sit Investment Associates
could imperil future growth. We retain our real GDP growth estimate of +6.2 percent in 2019 but see high risk of growth dipping below +6.0 percent in 4Q19 and in 2020.
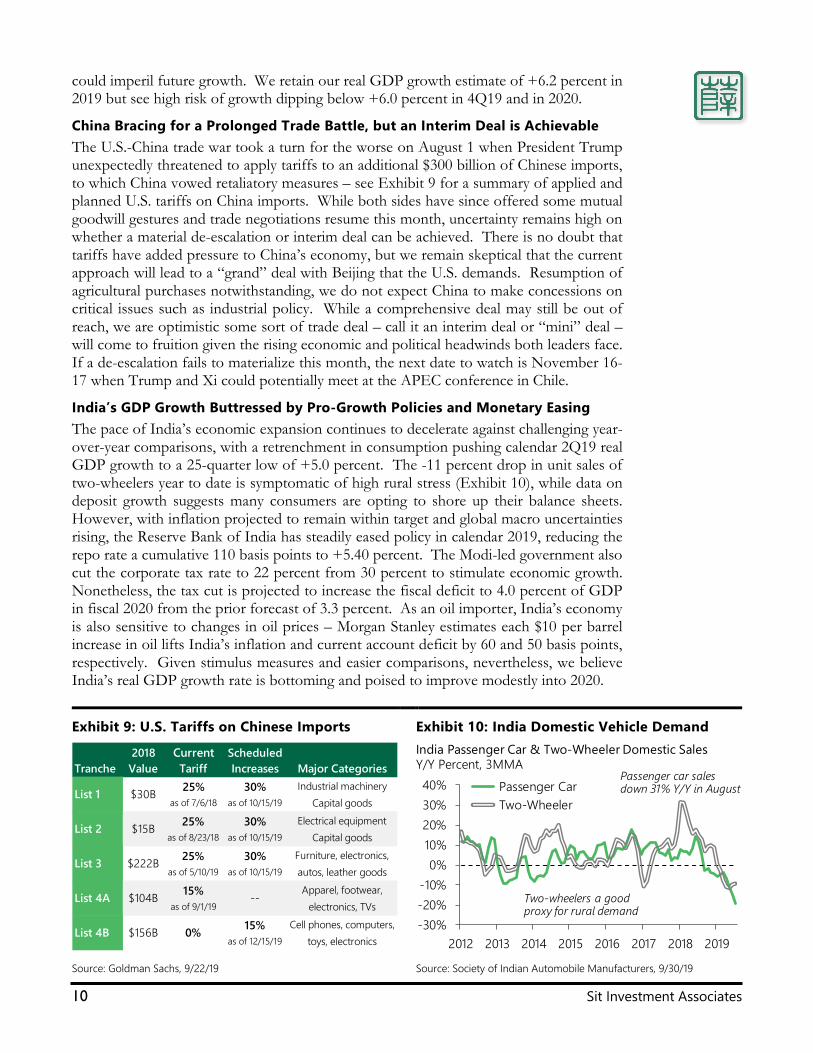
China Bracing for a Prolonged Trade Battle, but an Interim Deal is Achievable The U.S.-China trade war took a turn for the worse on August 1 when President Trump unexpectedly threatened to apply tariffs to an additional $300 billion of Chinese imports, to which China vowed retaliatory measures – see Exhibit 9 for a summary of applied and planned U.S. tariffs on China imports. While both sides have since offered some mutual goodwill gestures and trade negotiations resume this month, uncertainty remains high on whether a material de-escalation or interim deal can be achieved. There is no doubt that tariffs have added pressure to China’s economy, but we remain skeptical that the current approach will lead to a “grand” deal with Beijing that the U.S. demands. Resumption of agricultural purchases notwithstanding, we do not expect China to make concessions on critical issues such as industrial policy. While a comprehensive deal may still be out of reach, we are optimistic some sort of trade deal – call it an interim deal or “mini” deal – will come to fruition given the rising economic and political headwinds both leaders face. If a de-escalation fails to materialize this month, the next date to watch is November 16-17 when Trump and Xi could potentially meet at the APEC conference in Chile.
India’s GDP Growth Buttressed by Pro-Growth Policies and Monetary Easing The pace of India’s economic expansion continues to decelerate against challenging year-over-year comparisons, with a retrenchment in consumption pushing calendar 2Q19 real GDP growth to a 25-quarter low of +5.0 percent. The -11 percent drop in unit sales of two-wheelers year to date is symptomatic of high rural stress (Exhibit 10), while data on deposit growth suggests many consumers are opting to shore up their balance sheets. However, with inflation projected to remain within target and global macro uncertainties rising, the Reserve Bank of India has steadily eased policy in calendar 2019, reducing the repo rate a cumulative 110 basis points to +5.40 percent. The Modi-led government also cut the corporate tax rate to 22 percent from 30 percent to stimulate economic growth. Nonetheless, the tax cut is projected to increase the fiscal deficit to 4.0 percent of GDP in fiscal 2020 from the prior forecast of 3.3 percent. As an oil importer, India’s economy is also sensitive to changes in oil prices – Morgan Stanley estimates each $10 per barrel increase in oil lifts India’s inflation and current account deficit by 60 and 50 basis points, respectively. Given stimulus measures and easier comparisons, nevertheless, we believe India’s real GDP growth rate is bottoming and poised to improve modestly into 2020.
Exhibit 9: U.S. Tariffs on Chinese Imports
Exhibit 10: India Domestic Vehicle Demand
Source: Goldman Sachs, 9/22/19 Source: Society of Indian Automobile Manufacturers, 9/30/19
2018 Current ScheduledTranche Value Tariff Increases Major Categories
List 1 $30B 25%as of 7/6/18
30%as of 10/15/19
Industrial machineryCapital goods
List 2 $15B 25% as of 8/23/18
30%as of 10/15/19
Electrical equipmentCapital goods
List 3 $222B 25%as of 5/10/19
30%as of 10/15/19
Furniture, electronics, autos, leather goods
List 4A $104B 15%as of 9/1/19
--Apparel, footwear,
electronics, TVs
List 4B $156B 0% 15%as of 12/15/19
Cell phones, computers, toys, electronics
-30%-20%-10%
0%10%20%30%40%
2012 2013 2014 2015 2016 2017 2018 2019
Passenger Car Two-Wheeler
India Passenger Car & Two-Wheeler Domestic SalesY/Y Percent, 3MMA
Two-wheelers a good proxy for rural demand
Passenger car sales down 31% Y/Y in August
Global Investment Outlook & Strategy – October 2019 11
Aggressive Policy Easing in South Korea Countering Fallout from Trade Conflicts With exports accounting for over 40 percent of GDP, South Korea’s economy continues to be adversely impacted by trade conflicts and the dip in global industrial activity. Total exports declined -10 percent year to date through August, while exports to China, South Korea’s largest trade partner, tumbled -18 percent. Economic and trade uncertainty, as well as softening corporate profit growth, are also taking a toll on fixed investment. In contrast, consumption has proved resilient, driving expectations for real GDP growth of +2.0 percent in 2019 versus +2.7 in 2018. While slowing household income growth and ebbing confidence may curb private consumption going forward, domestic demand is supported by aggressive fiscal easing. The cyclically-adjusted budget deficit is currently projected to grow to -1.2 percent and -1.4 percent of GDP in fiscal years 2019 and 2020, respectively, from a surplus of +0.2 percent in 2018. With core inflation forecasted to remain well below target of +2.0 percent through 2020, the Bank of Korea also reduced its base interest rate by 25 basis points to +1.5 percent in July, with market expectations for another 25-basis cut by year-end. Although the U.S.-China trade conflict presents an ongoing downside risk, South Korea would be a notable beneficiary of a resolution.
Brazil’s Economy Barely Maintaining Escape Velocity Following 2016 Recession Brazil’s central bank lowered its benchmark interest rate by 50 basis points in September, the second such cut since July, bringing the Selic rate to an all-time low of +5.50 percent. While continued depreciation of the Brazilian real against the U.S. dollar may lift import prices, the pass-through to broader inflation should be dulled in the intermediate term by ample economic slack and sluggish demand. Prospects for benign inflationary pressures will allow the Central Bank of Brazil to maintain an accommodative stance, with another 50-basis point interest rate cut expected by year end. Despite easing financial conditions, Brazil’s GDP continues to expand at a lackluster pace of roughly +1.0 percent following a severe mid-2014 to year end 2016 recession. Slowing global growth, policy uncertainty, political scandals, and requisite fiscal austerity have diminished confidence and frustrated monetary easing. While pension reform is on track for approval this month, more will need to be done to stabilize rising government debt and support domestic growth as the country transitions from a government-model to a market-based economy. Key reforms will likely include privatization of state-owned enterprises and a tax code overhaul.
Mexico’s Economy Flirting with Recession; USMCA Passage a Potential +Catalyst Mexico’s economy has weakened appreciably year to date, narrowly avoiding a technical recession in the calendar first half, as high policy uncertainty, decelerating global growth, fiscal austerity, and lagged impact of monetary tightening are taking a toll on investment, trade, and consumption. As a result, real GDP growth is now projected to moderate to about +0.5 percent in 2019 versus an annualized average of +2.6 percent for the prior five-year period. The lack of confidence in President Andres Manuel Lopez Obrador’s economic policies (i.e., cancellation of new airport, roll back of energy reform, etc.) has contributed to weak business sentiment and a collapse in fixed investment. While core inflation of +3.8 percent in first half September remains at the high end of its target range, Mexico’s central bank cut its overnight interbank interest rate by another 25 basis points to +7.8 percent in September. Easing financial conditions should reinforce consumer spending and support economic growth. Regarding the U.S.-Mexico-Canada Agreement (aka, NAFTA 2.0), the U.S. legislature has not passed it because of concerns over labor, environment, access to medicines, and enforcement. Though we expect passage, the risk of USMCA not passing would be detrimental to Mexico’s economic growth, since the U.S. is its biggest trading partner.
12 Sit Investment Associates
Emerging Markets: Notable Data Points YTD Bounce in China Credit Impulse Fading Expectations for Trade Deal Up Ahead of Talks
Source: Bloomberg, National Bureau of Statistics, 10/4/19 Source: Goldman Sachs, 10/4/19 Global Monetary Easing Cycle Offers Support Reserve Bank of India Will Likely Ease Further
Source: FactSet, 10/4/19 Source: Reserve Bank of India, MOSPI, 9/30/19 Trade Still a Major Headwind for South Korea Mexico’s Manufacturing Sector Remains Weak
Source: Korea International Trade Association, 10/4/19 Source: Institute of Finance Executives Mexico, 9/30/19
48
49
50
51
52
53
20
22
24
26
28
30
32
34
'12 '13 '14 '15 '16 '17 '18 '19 '20
Credit Impulse, 8-Month Lead (LHS) Manufacturing PMI, 3MMA (RHS)
China Credit Impulse* vs Manufacturing PMI
*Change in new credit issued as a percent of GDP
40.9%
0%
20%
40%
60%
80%
100%
1/18 4/18 7/18 10/18 1/19 4/19 7/19 10/19
GS U.S.-China Trade Tension BarometerMarket-Implied Probability of a Trade Resolution
0% 1% 2% 3% 4% 5% 6% 7% 8% 9%
South KoreaHong Kong
MexicoUnited States
AustraliaRussia
IndonesiaNew Zealand
PhilippinesBrazilIndia
Select Central Bank Policy Rates Changes YTD 2019
Rate at end of 2018
Current rate
United States* * upper bound
5.0%
5.5%
6.0%
6.5%
7.0%
7.5%
8.0%
0%2%4%6%8%
10%12%14%
'12 '13 '14 '15 '16 '17 '18 '19 Consumer Price Index, Y/Y% (LHS) Reserve Bank of India Policy Rate, % (RHS)
Consumer Price Index vs Central Bank Policy Rate
Central Bank's Inflation Target
-30%-20%-10%
0%10%20%30%40%
2014 2015 2016 2017 2018 2019
Total Exports Exports to China
South Korea Exports3MMA, Y/Y Percent
Exports ≈ 42% of GDP
4042444648505254565860
2014 2015 2016 2017 2018 2019
Manufacturing PMI New Orders
Mexico Manufacturing Purchasing Managers' Index
Expansion>50
Contraction<50
U.S. ≈ 80% of Exports
Global Investment Outlook & Strategy – October 2019 13
FIXED INCOME: ENVIRONMENT AND STRATEGY
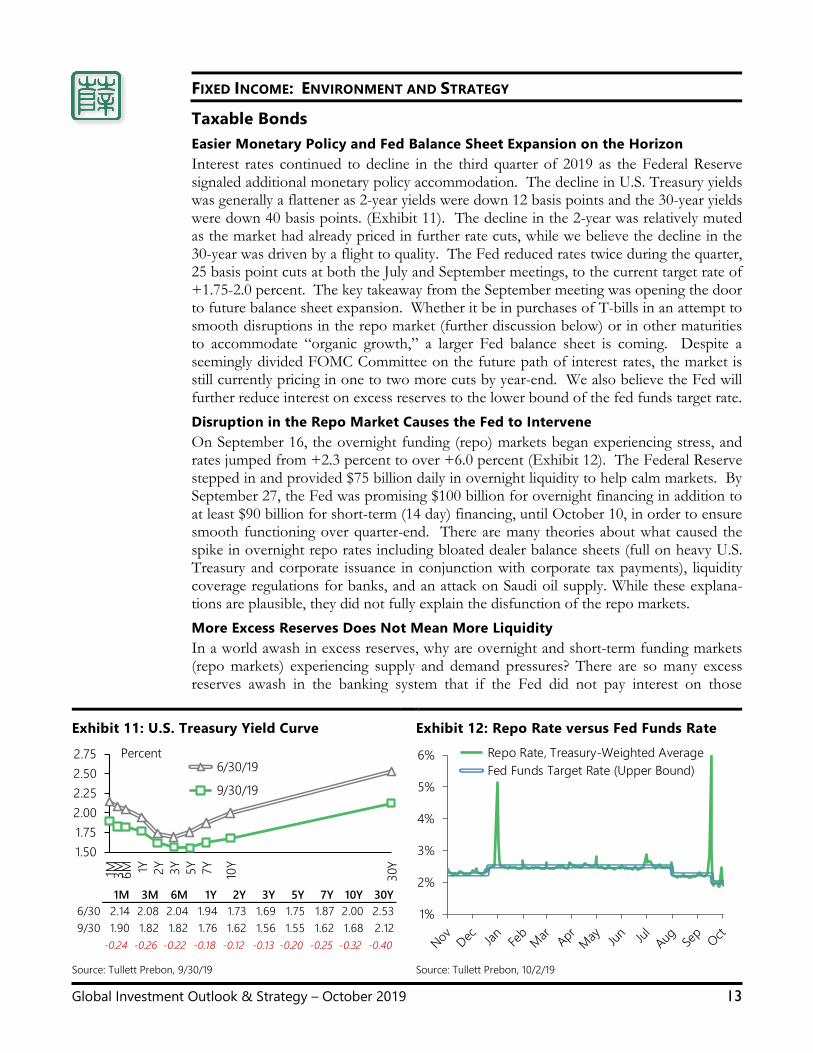
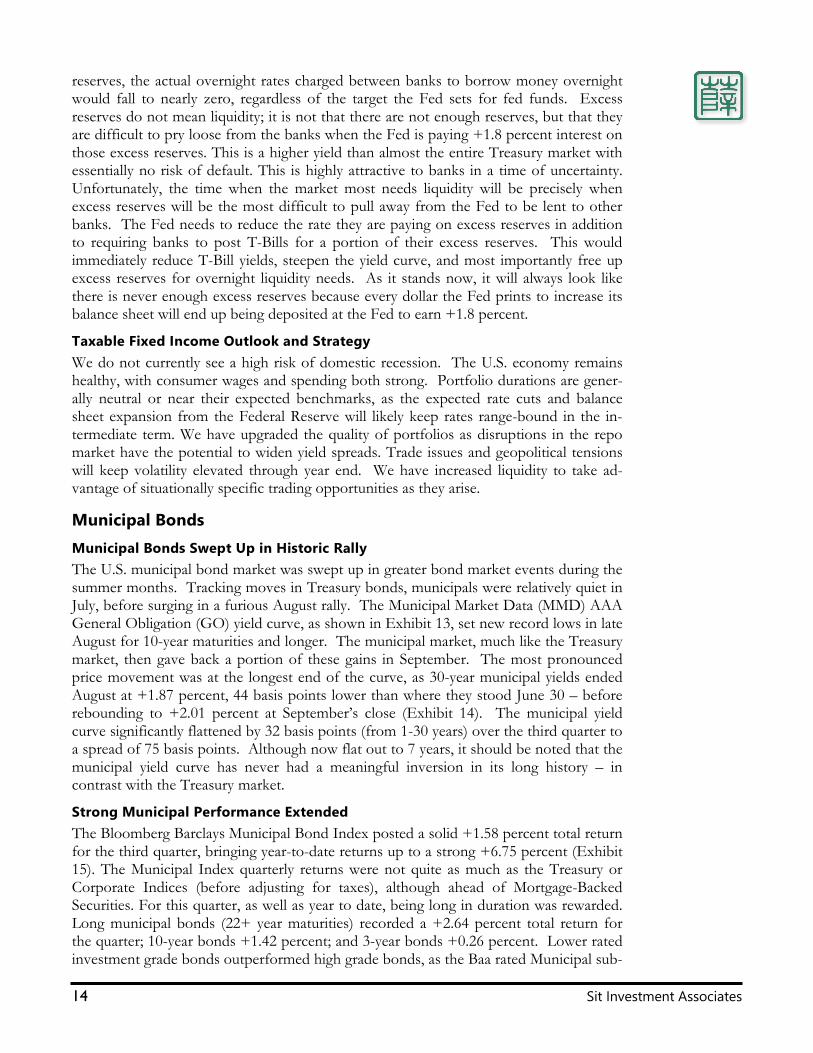
Taxable Bonds Easier Monetary Policy and Fed Balance Sheet Expansion on the Horizon Interest rates continued to decline in the third quarter of 2019 as the Federal Reserve signaled additional monetary policy accommodation. The decline in U.S. Treasury yields was generally a flattener as 2-year yields were down 12 basis points and the 30-year yields were down 40 basis points. (Exhibit 11). The decline in the 2-year was relatively muted as the market had already priced in further rate cuts, while we believe the decline in the 30-year was driven by a flight to quality. The Fed reduced rates twice during the quarter, 25 basis point cuts at both the July and September meetings, to the current target rate of +1.75-2.0 percent. The key takeaway from the September meeting was opening the door to future balance sheet expansion. Whether it be in purchases of T-bills in an attempt to smooth disruptions in the repo market (further discussion below) or in other maturities to accommodate “organic growth,” a larger Fed balance sheet is coming. Despite a seemingly divided FOMC Committee on the future path of interest rates, the market is still currently pricing in one to two more cuts by year-end. We also believe the Fed will further reduce interest on excess reserves to the lower bound of the fed funds target rate. Disruption in the Repo Market Causes the Fed to Intervene On September 16, the overnight funding (repo) markets began experiencing stress, and rates jumped from +2.3 percent to over +6.0 percent (Exhibit 12). The Federal Reserve stepped in and provided $75 billion daily in overnight liquidity to help calm markets. By September 27, the Fed was promising $100 billion for overnight financing in addition to at least $90 billion for short-term (14 day) financing, until October 10, in order to ensure smooth functioning over quarter-end. There are many theories about what caused the spike in overnight repo rates including bloated dealer balance sheets (full on heavy U.S. Treasury and corporate issuance in conjunction with corporate tax payments), liquidity coverage regulations for banks, and an attack on Saudi oil supply. While these explana-tions are plausible, they did not fully explain the disfunction of the repo markets. More Excess Reserves Does Not Mean More Liquidity In a world awash in excess reserves, why are overnight and short-term funding markets (repo markets) experiencing supply and demand pressures? There are so many excess reserves awash in the banking system that if the Fed did not pay interest on those
Exhibit 11: U.S. Treasury Yield Curve
Exhibit 12: Repo Rate versus Fed Funds Rate
Source: Tullett Prebon, 9/30/19 Source: Tullett Prebon, 10/2/19
1.501.752.002.252.502.75
1M 3M 6M 1Y 2Y 3Y 5Y 7Y 10Y
30Y
6/30/19
9/30/19
Percent
1M 3M 6M 1Y 2Y 3Y 5Y 7Y 10Y 30Y6/30 2.14 2.08 2.04 1.94 1.73 1.69 1.75 1.87 2.00 2.539/30 1.90 1.82 1.82 1.76 1.62 1.56 1.55 1.62 1.68 2.12
-0.24 -0.26 -0.22 -0.18 -0.12 -0.13 -0.20 -0.25 -0.32 -0.40
1%
2%
3%
4%
5%
6% Repo Rate, Treasury-Weighted Average Fed Funds Target Rate (Upper Bound)
14 Sit Investment Associates
reserves, the actual overnight rates charged between banks to borrow money overnight would fall to nearly zero, regardless of the target the Fed sets for fed funds. Excess reserves do not mean liquidity; it is not that there are not enough reserves, but that they are difficult to pry loose from the banks when the Fed is paying +1.8 percent interest on those excess reserves. This is a higher yield than almost the entire Treasury market with essentially no risk of default. This is highly attractive to banks in a time of uncertainty. Unfortunately, the time when the market most needs liquidity will be precisely when excess reserves will be the most difficult to pull away from the Fed to be lent to other banks. The Fed needs to reduce the rate they are paying on excess reserves in addition to requiring banks to post T-Bills for a portion of their excess reserves. This would immediately reduce T-Bill yields, steepen the yield curve, and most importantly free up excess reserves for overnight liquidity needs. As it stands now, it will always look like there is never enough excess reserves because every dollar the Fed prints to increase its balance sheet will end up being deposited at the Fed to earn +1.8 percent.
Taxable Fixed Income Outlook and Strategy We do not currently see a high risk of domestic recession. The U.S. economy remains healthy, with consumer wages and spending both strong. Portfolio durations are gener-ally neutral or near their expected benchmarks, as the expected rate cuts and balance sheet expansion from the Federal Reserve will likely keep rates range-bound in the in-termediate term. We have upgraded the quality of portfolios as disruptions in the repo market have the potential to widen yield spreads. Trade issues and geopolitical tensions will keep volatility elevated through year end. We have increased liquidity to take ad-vantage of situationally specific trading opportunities as they arise.
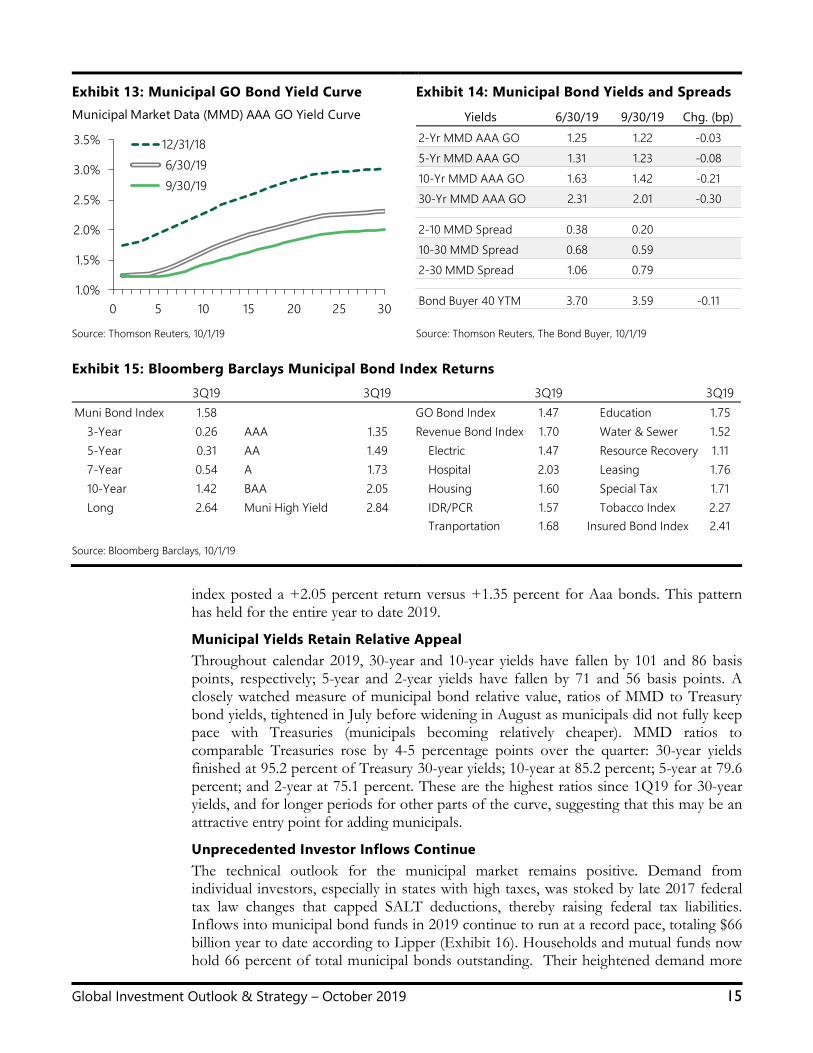
Municipal Bonds Municipal Bonds Swept Up in Historic Rally The U.S. municipal bond market was swept up in greater bond market events during the summer months. Tracking moves in Treasury bonds, municipals were relatively quiet in July, before surging in a furious August rally. The Municipal Market Data (MMD) AAA General Obligation (GO) yield curve, as shown in Exhibit 13, set new record lows in late August for 10-year maturities and longer. The municipal market, much like the Treasury market, then gave back a portion of these gains in September. The most pronounced price movement was at the longest end of the curve, as 30-year municipal yields ended August at +1.87 percent, 44 basis points lower than where they stood June 30 – before rebounding to +2.01 percent at September’s close (Exhibit 14). The municipal yield curve significantly flattened by 32 basis points (from 1-30 years) over the third quarter to a spread of 75 basis points. Although now flat out to 7 years, it should be noted that the municipal yield curve has never had a meaningful inversion in its long history – in contrast with the Treasury market.
Strong Municipal Performance Extended The Bloomberg Barclays Municipal Bond Index posted a solid +1.58 percent total return for the third quarter, bringing year-to-date returns up to a strong +6.75 percent (Exhibit 15). The Municipal Index quarterly returns were not quite as much as the Treasury or Corporate Indices (before adjusting for taxes), although ahead of Mortgage-Backed Securities. For this quarter, as well as year to date, being long in duration was rewarded. Long municipal bonds (22+ year maturities) recorded a +2.64 percent total return for the quarter; 10-year bonds +1.42 percent; and 3-year bonds +0.26 percent. Lower rated investment grade bonds outperformed high grade bonds, as the Baa rated Municipal sub-
Global Investment Outlook & Strategy – October 2019 15
Exhibit 13: Municipal GO Bond Yield Curve
Exhibit 14: Municipal Bond Yields and Spreads
Source: Thomson Reuters, 10/1/19 Source: Thomson Reuters, The Bond Buyer, 10/1/19 Exhibit 15: Bloomberg Barclays Municipal Bond Index Returns
Source: Bloomberg Barclays, 10/1/19
index posted a +2.05 percent return versus +1.35 percent for Aaa bonds. This pattern has held for the entire year to date 2019.
Municipal Yields Retain Relative Appeal Throughout calendar 2019, 30-year and 10-year yields have fallen by 101 and 86 basis points, respectively; 5-year and 2-year yields have fallen by 71 and 56 basis points. A closely watched measure of municipal bond relative value, ratios of MMD to Treasury bond yields, tightened in July before widening in August as municipals did not fully keep pace with Treasuries (municipals becoming relatively cheaper). MMD ratios to comparable Treasuries rose by 4-5 percentage points over the quarter: 30-year yields finished at 95.2 percent of Treasury 30-year yields; 10-year at 85.2 percent; 5-year at 79.6 percent; and 2-year at 75.1 percent. These are the highest ratios since 1Q19 for 30-year yields, and for longer periods for other parts of the curve, suggesting that this may be an attractive entry point for adding municipals.
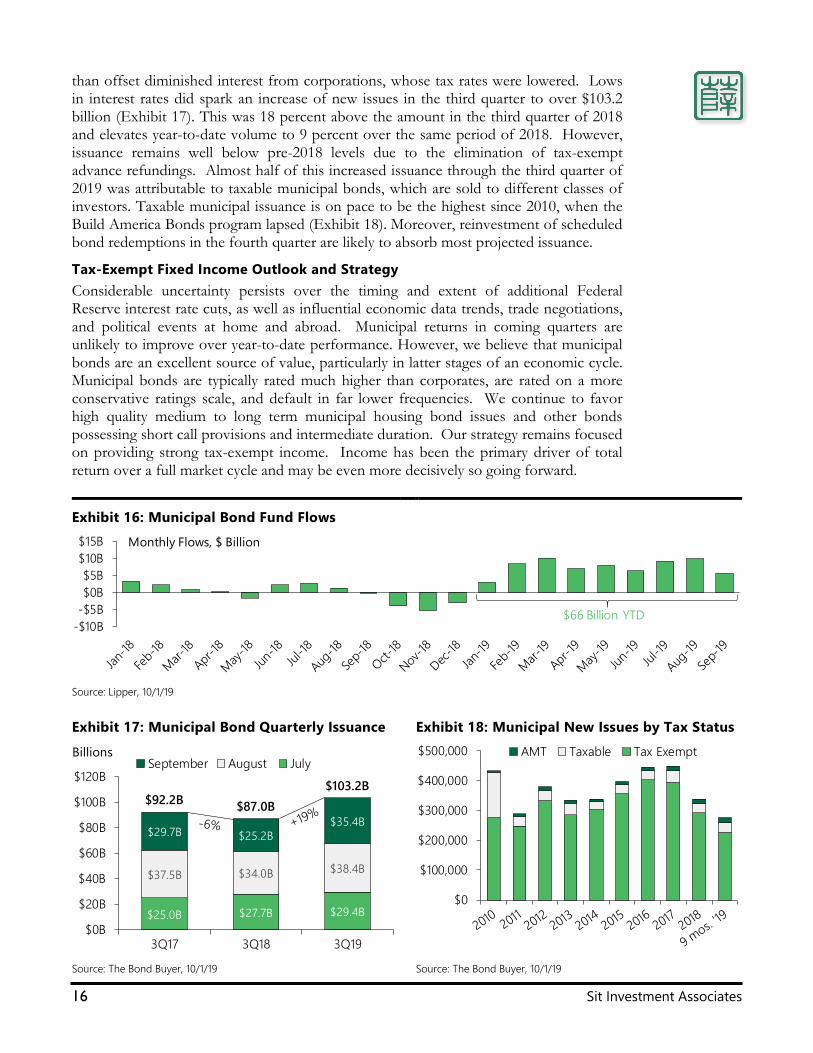
Unprecedented Investor Inflows Continue The technical outlook for the municipal market remains positive. Demand from individual investors, especially in states with high taxes, was stoked by late 2017 federal tax law changes that capped SALT deductions, thereby raising federal tax liabilities. Inflows into municipal bond funds in 2019 continue to run at a record pace, totaling $66 billion year to date according to Lipper (Exhibit 16). Households and mutual funds now hold 66 percent of total municipal bonds outstanding. Their heightened demand more
1.0%
1.5%
2.0%
2.5%
3.0%
3.5%
0 5 10 15 20 25 30
12/31/18 6/30/19 9/30/19
Municipal Market Data (MMD) AAA GO Yield Curve Yields 6/30/19 9/30/19 Chg. (bp)2-Yr MMD AAA GO 1.25 1.22 -0.035-Yr MMD AAA GO 1.31 1.23 -0.0810-Yr MMD AAA GO 1.63 1.42 -0.2130-Yr MMD AAA GO 2.31 2.01 -0.30
2-10 MMD Spread 0.38 0.2010-30 MMD Spread 0.68 0.592-30 MMD Spread 1.06 0.79
Bond Buyer 40 YTM 3.70 3.59 -0.11
3Q19 3Q19 3Q19 3Q19Muni Bond Index 1.58 GO Bond Index 1.47 Education 1.75 3-Year 0.26 AAA 1.35 Revenue Bond Index 1.70 Water & Sewer 1.52 5-Year 0.31 AA 1.49 Electric 1.47 Resource Recovery 1.11 7-Year 0.54 A 1.73 Hospital 2.03 Leasing 1.76 10-Year 1.42 BAA 2.05 Housing 1.60 Special Tax 1.71 Long 2.64 Muni High Yield 2.84 IDR/PCR 1.57 Tobacco Index 2.27
Tranportation 1.68 Insured Bond Index 2.41
16 Sit Investment Associates
than offset diminished interest from corporations, whose tax rates were lowered. Lows in interest rates did spark an increase of new issues in the third quarter to over $103.2 billion (Exhibit 17). This was 18 percent above the amount in the third quarter of 2018 and elevates year-to-date volume to 9 percent over the same period of 2018. However, issuance remains well below pre-2018 levels due to the elimination of tax-exempt advance refundings. Almost half of this increased issuance through the third quarter of 2019 was attributable to taxable municipal bonds, which are sold to different classes of investors. Taxable municipal issuance is on pace to be the highest since 2010, when the Build America Bonds program lapsed (Exhibit 18). Moreover, reinvestment of scheduled bond redemptions in the fourth quarter are likely to absorb most projected issuance.
Tax-Exempt Fixed Income Outlook and Strategy Considerable uncertainty persists over the timing and extent of additional Federal Reserve interest rate cuts, as well as influential economic data trends, trade negotiations, and political events at home and abroad. Municipal returns in coming quarters are unlikely to improve over year-to-date performance. However, we believe that municipal bonds are an excellent source of value, particularly in latter stages of an economic cycle. Municipal bonds are typically rated much higher than corporates, are rated on a more conservative ratings scale, and default in far lower frequencies. We continue to favor high quality medium to long term municipal housing bond issues and other bonds possessing short call provisions and intermediate duration. Our strategy remains focused on providing strong tax-exempt income. Income has been the primary driver of total return over a full market cycle and may be even more decisively so going forward.
Exhibit 16: Municipal Bond Fund Flows
Source: Lipper, 10/1/19
Exhibit 17: Municipal Bond Quarterly Issuance
Exhibit 18: Municipal New Issues by Tax Status
Source: The Bond Buyer, 10/1/19 Source: The Bond Buyer, 10/1/19
-$10B-$5B$0B$5B
$10B$15B Monthly Flows, $ Billion
$66 Billion YTD
$25.0B $27.7B $29.4B
$37.5B $34.0B $38.4B
$29.7B $25.2B$35.4B
$92.2B $87.0B$103.2B
$0B
$20B
$40B
$60B
$80B
$100B
$120B
3Q17 3Q18 3Q19
September August JulyBillions
$0
$100,000
$200,000
$300,000
$400,000
$500,000 AMT Taxable Tax Exempt
Global Investment Outlook & Strategy – October 2019 17
GLOBAL EQUITIES: ENVIRONMENT AND STRATEGY
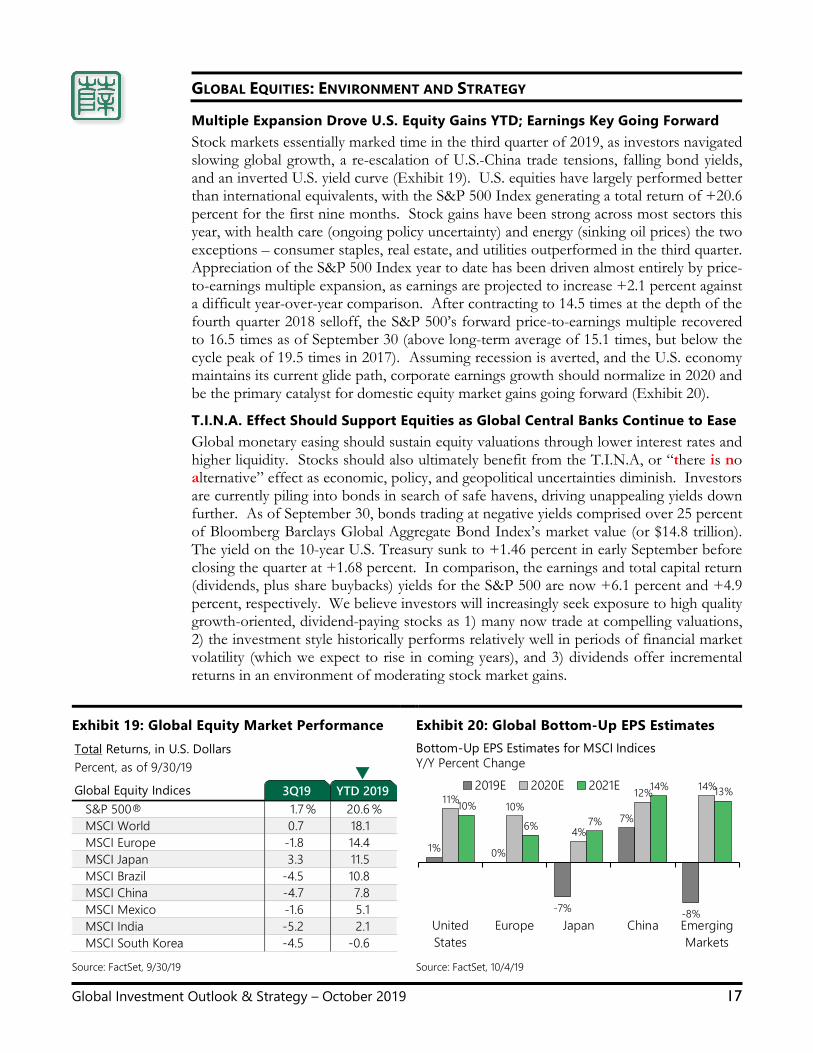
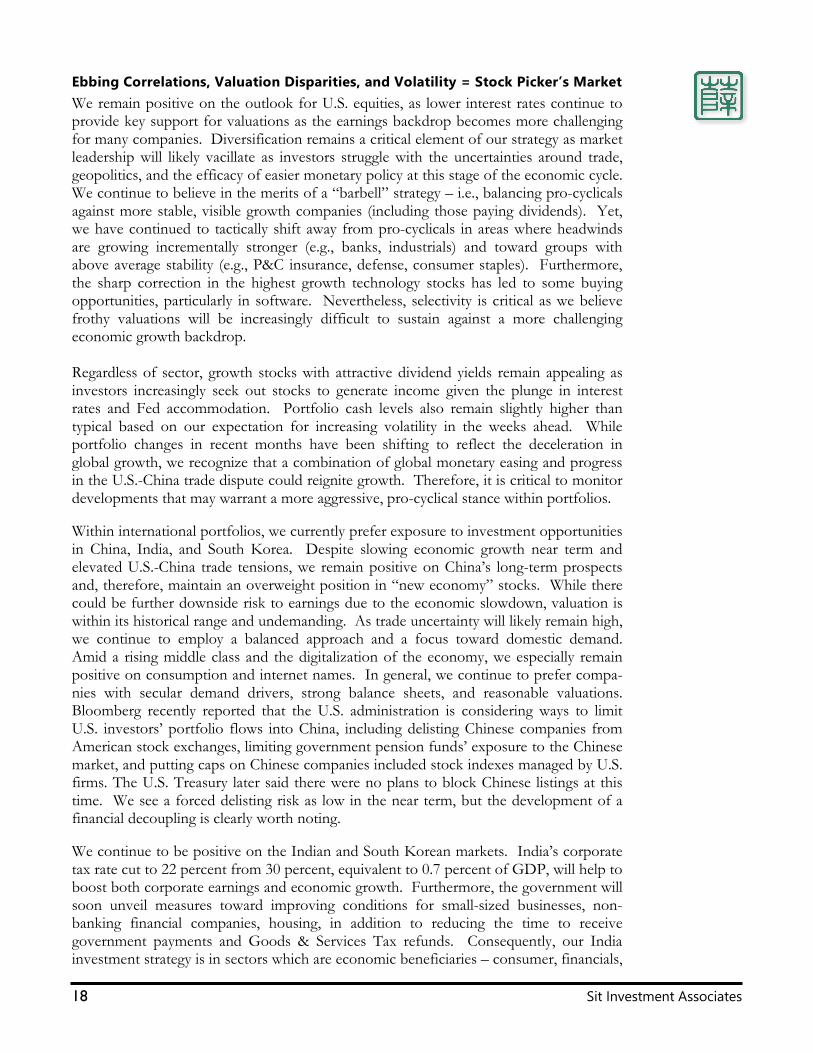
Multiple Expansion Drove U.S. Equity Gains YTD; Earnings Key Going Forward Stock markets essentially marked time in the third quarter of 2019, as investors navigated slowing global growth, a re-escalation of U.S.-China trade tensions, falling bond yields, and an inverted U.S. yield curve (Exhibit 19). U.S. equities have largely performed better than international equivalents, with the S&P 500 Index generating a total return of +20.6 percent for the first nine months. Stock gains have been strong across most sectors this year, with health care (ongoing policy uncertainty) and energy (sinking oil prices) the two exceptions – consumer staples, real estate, and utilities outperformed in the third quarter. Appreciation of the S&P 500 Index year to date has been driven almost entirely by price-to-earnings multiple expansion, as earnings are projected to increase +2.1 percent against a difficult year-over-year comparison. After contracting to 14.5 times at the depth of the fourth quarter 2018 selloff, the S&P 500’s forward price-to-earnings multiple recovered to 16.5 times as of September 30 (above long-term average of 15.1 times, but below the cycle peak of 19.5 times in 2017). Assuming recession is averted, and the U.S. economy maintains its current glide path, corporate earnings growth should normalize in 2020 and be the primary catalyst for domestic equity market gains going forward (Exhibit 20).
T.I.N.A. Effect Should Support Equities as Global Central Banks Continue to Ease Global monetary easing should sustain equity valuations through lower interest rates and higher liquidity. Stocks should also ultimately benefit from the T.I.N.A, or “there is no alternative” effect as economic, policy, and geopolitical uncertainties diminish. Investors are currently piling into bonds in search of safe havens, driving unappealing yields down further. As of September 30, bonds trading at negative yields comprised over 25 percent of Bloomberg Barclays Global Aggregate Bond Index’s market value (or $14.8 trillion). The yield on the 10-year U.S. Treasury sunk to +1.46 percent in early September before closing the quarter at +1.68 percent. In comparison, the earnings and total capital return (dividends, plus share buybacks) yields for the S&P 500 are now +6.1 percent and +4.9 percent, respectively. We believe investors will increasingly seek exposure to high quality growth-oriented, dividend-paying stocks as 1) many now trade at compelling valuations, 2) the investment style historically performs relatively well in periods of financial market volatility (which we expect to rise in coming years), and 3) dividends offer incremental returns in an environment of moderating stock market gains.
Exhibit 19: Global Equity Market Performance
Exhibit 20: Global Bottom-Up EPS Estimates
Source: FactSet, 9/30/19 Source: FactSet, 10/4/19
Total Returns, in U.S. DollarsPercent, as of 9/30/19
Global Equity IndicesS&P 500® 1.7 % 20.6 %MSCI World 0.7 18.1MSCI Europe -1.8 14.4MSCI Japan 3.3 11.5MSCI Brazil -4.5 10.8MSCI China -4.7 7.8MSCI Mexico -1.6 5.1MSCI India -5.2 2.1MSCI South Korea -4.5 -0.6
3Q19 YTD 2019▼
1% 0%
-7%
7%
-8%
11% 10%
4%
12% 14%
10%
6% 7%
14% 13%
UnitedStates
Europe Japan China EmergingMarkets
2019E 2020E 2021E
Bottom-Up EPS Estimates for MSCI IndicesY/Y Percent Change
18 Sit Investment Associates
Ebbing Correlations, Valuation Disparities, and Volatility = Stock Picker’s Market We remain positive on the outlook for U.S. equities, as lower interest rates continue to provide key support for valuations as the earnings backdrop becomes more challenging for many companies. Diversification remains a critical element of our strategy as market leadership will likely vacillate as investors struggle with the uncertainties around trade, geopolitics, and the efficacy of easier monetary policy at this stage of the economic cycle. We continue to believe in the merits of a “barbell” strategy – i.e., balancing pro-cyclicals against more stable, visible growth companies (including those paying dividends). Yet, we have continued to tactically shift away from pro-cyclicals in areas where headwinds are growing incrementally stronger (e.g., banks, industrials) and toward groups with above average stability (e.g., P&C insurance, defense, consumer staples). Furthermore, the sharp correction in the highest growth technology stocks has led to some buying opportunities, particularly in software. Nevertheless, selectivity is critical as we believe frothy valuations will be increasingly difficult to sustain against a more challenging economic growth backdrop. Regardless of sector, growth stocks with attractive dividend yields remain appealing as investors increasingly seek out stocks to generate income given the plunge in interest rates and Fed accommodation. Portfolio cash levels also remain slightly higher than typical based on our expectation for increasing volatility in the weeks ahead. While portfolio changes in recent months have been shifting to reflect the deceleration in global growth, we recognize that a combination of global monetary easing and progress in the U.S.-China trade dispute could reignite growth. Therefore, it is critical to monitor developments that may warrant a more aggressive, pro-cyclical stance within portfolios. Within international portfolios, we currently prefer exposure to investment opportunities in China, India, and South Korea. Despite slowing economic growth near term and elevated U.S.-China trade tensions, we remain positive on China’s long-term prospects and, therefore, maintain an overweight position in “new economy” stocks. While there could be further downside risk to earnings due to the economic slowdown, valuation is within its historical range and undemanding. As trade uncertainty will likely remain high, we continue to employ a balanced approach and a focus toward domestic demand. Amid a rising middle class and the digitalization of the economy, we especially remain positive on consumption and internet names. In general, we continue to prefer compa-nies with secular demand drivers, strong balance sheets, and reasonable valuations. Bloomberg recently reported that the U.S. administration is considering ways to limit U.S. investors’ portfolio flows into China, including delisting Chinese companies from American stock exchanges, limiting government pension funds’ exposure to the Chinese market, and putting caps on Chinese companies included stock indexes managed by U.S. firms. The U.S. Treasury later said there were no plans to block Chinese listings at this time. We see a forced delisting risk as low in the near term, but the development of a financial decoupling is clearly worth noting. We continue to be positive on the Indian and South Korean markets. India’s corporate tax rate cut to 22 percent from 30 percent, equivalent to 0.7 percent of GDP, will help to boost both corporate earnings and economic growth. Furthermore, the government will soon unveil measures toward improving conditions for small-sized businesses, non-banking financial companies, housing, in addition to reducing the time to receive government payments and Goods & Services Tax refunds. Consequently, our India investment strategy is in sectors which are economic beneficiaries – consumer, financials,
Global Investment Outlook & Strategy – October 2019 19
energy, information services, and industrials. Indian market valuations remain attractive, as the MSCI India Index is trading on a 2020 price-to-earnings ratio of 17.1 times based on projected earnings growth of +20 percent. In South Korea, a recovery in earnings from the technology, consumer, materials, and industrial sectors, as well as attractive valuations provide good opportunities. The South Korean market is inexpensive, with a price-to-earnings ratio of 10.0 times based on projected earnings growth of +22 percent. Our South Korea holdings are focused on technology, financial, pharmaceutical, and material stocks. We continue to underweight Europe in global portfolios. The ongoing structural issues, populism movement, weakening industrial environment, unpredictable consumer, and our belief that both the European Central Bank and Bank of England will be unable to stimulate the region make us cautious. Within all of Europe, we look for companies that have exposure to the U.S. where there appears to be more solid/steady growth. We also prefer investments in the Euro Area as the ongoing Brexit concerns will likely continue to weigh on UK stocks. Regarding specific sectors, we favor investment opportunities in the technology software and hardware industries given stronger secular growth and need for continued technology efficiencies. We also maintain significant exposure to internet-related retail companies. Portfolios remain underweight financials, specifically banks, as the negative interest rate environment is a headwind for the sector. We continue to underweight Japan. Structural challenges hinder the country’s long-run prospects as a rapidly aging population limits potential growth, a rigid labor market restricts gains in productivity and wages, and a large debt load constrains fiscal flexibility. Efforts to overcome these challenges have had limited effect as evidenced by continued subdued inflation. While Japanese equities outperformed among developed markets during the third quarter owing to attractive valuations, there is a limit to further repricing and a discount for Japan remains well-deserved in our view. We remain selective in our exposure to Japan, favoring a mix of overseas-exposed companies and defensive domestic consumption names. Exporters and multinationals exposed to faster-growing regions overseas should outgrow peers while we expect defensive holdings to hold up in a choppy growth backdrop in Japan. In Latin America, we continue to underweight Brazil and Mexico due to weak economic growth. Brazil’s risks also include passage of pension reform being delayed and lower commodity prices. These concerns result in our negative view on Brazilian stocks, despite reasonable valuations. Within Brazil, we prefer investments in the consumer and financial sectors based on improving retail spending and bank credit growth. In Mexico, economic growth remains low, because of weaker economic growth in the U.S. and a slower domestic economy. Additionally, Mexico’s 2020 budget forecast of GDP growth of +2.0 percent is too optimistic, considering cuts in public investments and lower oil production. Moreover, corporate earnings forecasts are too high, as negative earnings revisions have continued over the last six months. Our investments in Mexico are defensive, with preference towards domestic consumer staples.

NOTICE: This analysis contains the collective opinions of our analysts and portfolio managers, and is provided for informational purposes only. While the information is accurate at the time of writing, such information is subject to change at any time without notice, and therefore, so may the investment decisions of Sit Investment Associates.
sitinvest.com | sitfunds.com 612-332-3223