Embed Size (px)
Citation preview
October 2016
Kenya Power-Initiation of coverage
Kenya Power-The face of the energy sector
Recommendation: BUY
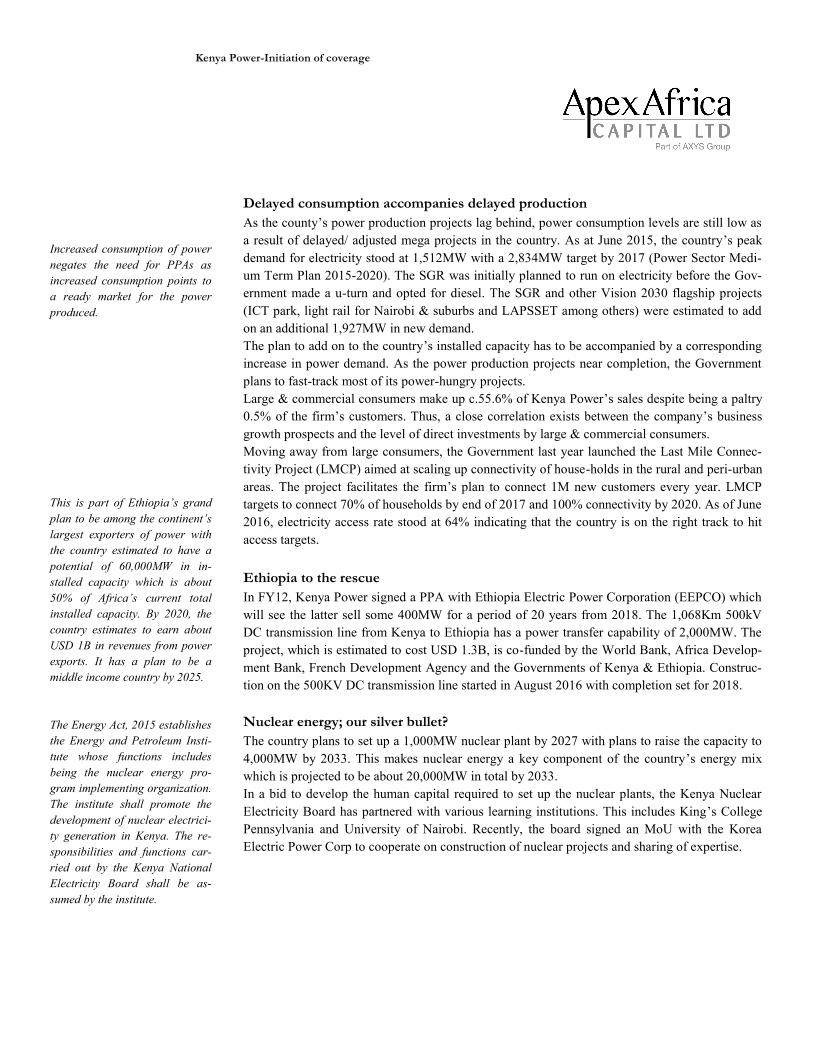
We initiate coverage on Kenya Power (KPLL) and issue a BUY recommendation on the
counter. This is informed by the 40.6% upside on the stock’s fair value of KES 12.65 as per
our estimates. Our bullish view is informed by its allure on a relative basis. Its trailing P/E
stands at 2.3x against an industry average of 11.4x and a median of 8.6x. In addition, we
forecast an 8.1% 4-year CAGR in electricity revenue to KES 106.2B in FY19F with a corre-
sponding growth (8.1% 4-year CAGR) in its bottom-line (KES 16.7B PBT in FY19F). In-
creased connectivity among domestic consumers is anticipated to drive revenues.
Positives
A growing demand for electricity will drive the firm’s top-line. We anticipate an in-
crease in the number of domestic consumers as the company and the Government’s
move to implement the Last Mile Connectivity Program. Large and industrial consum-
ers are also anticipated to be on the rise though at a slower rate. This is guided by sus-
tained Government (both central and county) focus on industrialization.
Declining system losses to boost the firm’s top-line going forward. Continued system
upgrade and automation to tame rising costs in the medium term.
Kenya Power International Limited (KPIL), the newly established subsidiary, to take
over KPLL’s business of leasing out its fibre-optic cables. An improving internet access
rate coupled with increasing demand is anticipated to boost Kenya Power’s top-line.
The interest floor dictated by the Banking Act (Amendment), 2016 to boost the firm’s
interest income from FY17F onwards.
Continued concessionary funding estimated to keep finance costs in check.
Downside risks
Gross margins to be compressed in the medium term. We however anticipate a reversal
of this in FY19F.
Negative implications of the Energy Act, 2015.
Low trading volume may be a bottleneck for large/institutional investors.
Summary FY15 FY16E FY17F FY18F FY19F
GP margin 42.7% 40.5% 41.3% 42.1% 43.6%
y/y change % -8.3% -2.2% 0.8% 0.8% 1.4%
Net earnings margin 9.5% 8.5% 8.1% 9.3% 11.0%
y/y change % -2.1% -1.1% -0.3% 1.1% 1.8%
EPS 3.81 3.75 3.82 4.61 6.01
y/y change % 2.2% -1.5% 1.8% 20.8% 30.2%
DPS 0.50 0.50 0.50 0.50 0.50
ROAE 12.8% 11.3% 10.5% 11.5% 13.4%
y/y change % -1.5% -1.5% -0.8% 1.0% 1.9%
ROAA 3.0% 2.5% 2.4% 2.7% 3.4%
y/y change % -0.6% -0.5% -0.1% 0.4% 0.6%
Source: (KPLC, ApexAfrica estimates)
Bloomberg Ticker KPLL KN
Reuters Ticker KPLC.NR
Share Statistics
Recommendation Buy
Fair Value (KES) 12.65
Price 9.00
Market Cap (KES B) 17.6
Market Cap (USD M) 173.2
Year end 30-Jun
Float 44.5%
Foreign ownership 15.5%
1 yr Avg Trading Vol (USD) 62,144
Trailing multiples
EPS (KES) 3.81
NAV (KES) 33.12
P/E (x) 2.3
P/B (x) 0.3
ROaE 12.8%
Div yield 5.7%
Price Return
Absolute Relative
3m -10.4% -0.6%
6m -19.4% 0.8%
12m -42.7% 20.8%
Source: (NSE)
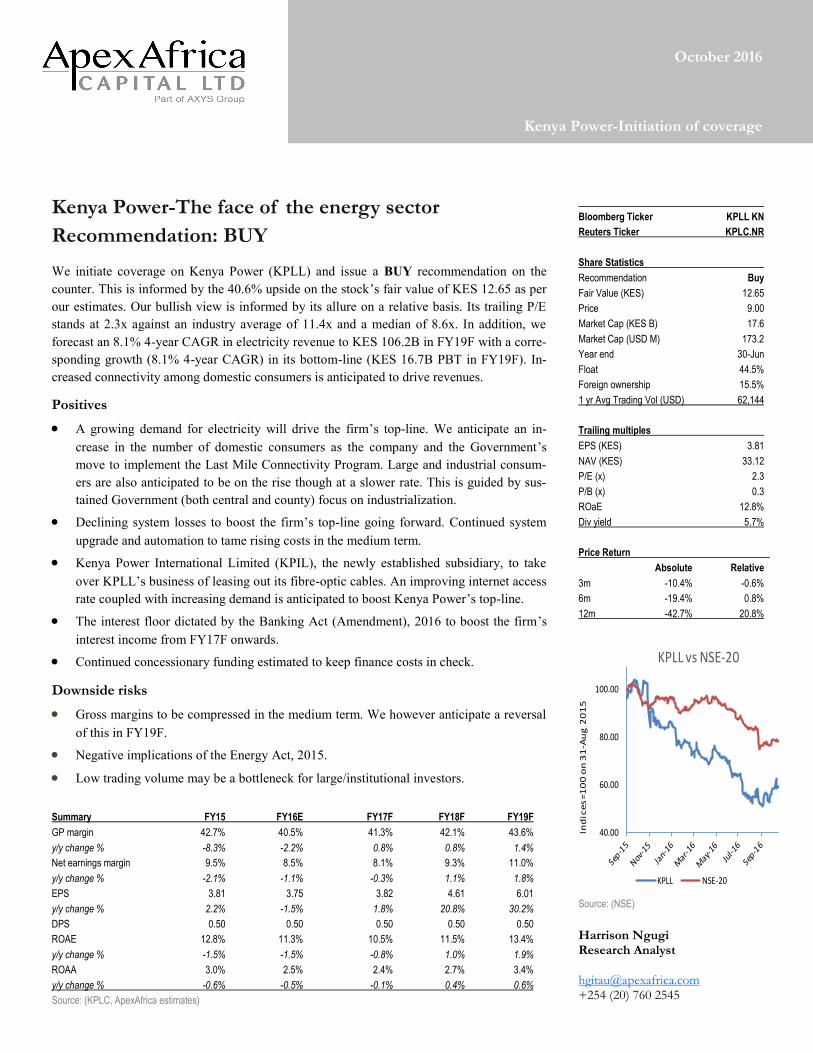
Harrison Ngugi Research Analyst [email protected] +254 (20) 760 2545
40.00
60.00
80.00
100.00
Ind
ice
s=
10
0 o
n 3
1-A
ug
20
15
KPLL vs NSE-20
KPLL NSE-20

Kenya Power-Initiation of coverage
Dented bottom-line in FY16E
We estimate a 14.7% y/y decline in FY16E PBT to KES 10.5B. Rising power purchase costs
(+15.1% y/y) to KES 51.2B and surging operating costs (+15.6% y/y) to KES 28.0B are estimat-
ed to write off the 10.9% y/y growth in electricity revenue (FY16E KES 86.3B). In addition, net
finance costs are expected to grow by 16.4% y/y to KES 3.6B in FY16E as the firm seeks debt
financing to meet its FY16E capex. Estimated ROaE is expected to decline by 150bps y/y to
11.3% in FY16E.
Growing electricity demand as power projects near completion
Against expectations, electricity consumption per capita declined by 4.4% y/y to 164.9kWh in
2015. The Government however expects this amount to grow by 23.0% y/y to hit the minimum
3,000kWh consumption per capita required to fuel the take off to a middle income country. This
in our view appears far fetched. We expect increased demand from households as the Last Mile
Connectivity Program draws near completion.
The country had set out an ambitious installed capacity target of +5,000MW by 2017, but as per
our assessments, the target is unlikely to be realized. This is as a result of stalled power projects,
some of which have been mentioned in the report. The Government expects power hungry sec-
tors of the economy to grow as increased electricity is supplied to the grid.
High leverage is here to stay
Similar to other utility companies, Kenya Power is highly geared with its 1H16 debt to equity
ratio standing at 173.4%. We expect this value to go up in FY16E to 193.7% as the firm plans to
keep capital expenditure at the same level of FY15’s capex of KES 41.9B, financed partly
through debt. Going forward, we expect a gradual decline in gearing with equity outpacing debt,
though the ratio is anticipated to remain north of 100%.
Rising costs dent the improving top-line, for now
In 1H16, the firm realized high power purchase costs brought about by the additional capacity
charges by KenGen, Gulf Power and Triumph power. We anticipate the additional costs to sup-
press the gross profit margin in FY16E.
As the firm incorporates more consumers to the cost-effective pre-paid plan, we anticipate the
firm to cut down on some of its operating costs going forward. Denting the cost management, we
anticipate network maintenance costs to grow in the medium-term as the firm moves to revamp
and expand its infrastructure. However, we expect the top-line to grow at a faster rate than the
firm’s operating costs in the long run.
On the bright side
The Banking Act (Amendment), 2016, dictates the minimum interest rate to be accorded to inter-
est earning deposits. As such, we anticipate interest income to be on the rise, and could rise even
further as the firm’s cash position strengthens.
We expect KPLL to continue sourcing for cheap concessionary loans to fund its expansion pro-
grams and consequently, we expect finance costs to remain tamed in the medium-term.
The firm has planned to spend KES 10B aimed at lowering system costs. Management estimates
that the full results from the investment are to be felt in 3-years time (FY19F). Guided by this,
we forecast a gradual decline in system losses in the medium-term. The declining system losses
are anticipated to boost the firm’s top-line going forward, bearing in mind that, according to
management, a 100bps system loss translates to c. KES 1B.
Other income is also anticipated to soar partly driven by lease of its fibre-optic cables. The firm
set up KPIL to focus on its business of leasing out its fibre-optic cables. Though it’s too early to
determine actual gains realized from this firm, we have forecast a gradual 8.1% 4-year CAGR in
other income.

Kenya Power-Initiation of coverage
An overview of the energy sector Kenya has 3 major pillars (Economic, Social and Political) intended to support the country’s
vision 2030. Availability of cheap and sufficient electricity is the backbone of the economic pil-
lar which will drive the advancement of infrastructure, agriculture, trade and manufacturing
among others. Currently, the energy sector is largely publicly owned despite incentives offered to
the private sector. We anticipate increased activity by the private sector going forward as the
country’s electricity demand grows.
Installed capacity
The country has, in the recent past, increased its installed capacity to current levels of
2,333.6MW (8.0%, 5-year CAGR). As per the Government’s power sector medium term plan
2015-2020, the country’s installed capacity by 2018 would be at 6,762MW, but in our view, this
would take an act of congress. According to the 2013-18 Kenya Power Strategic Plan, Kenya
would have a current installed capacity of 3,152MW but this isn’t the case because of delayed
projects. The generation mix was anticipated to change to: coal (28.4%), geothermal (28.0%),
natural gas (16.4%), hydro (12.4%), wind (7.9%) and co-generation (0.9%). The current mix as
explained by KPLL management is hydro (40.0%,) geothermal (46.0%), thermal (12.6%) and
others at 1.4%.
Currently, KenGen’s 1,623MW installed capacity accounts for 70% of the country’s total in-
stalled capacity. With the intent to raise the country’s installed capacity, the Government is con-
stantly encouraging Independent Power Producers (IPPs) to put up power plants. This has seen
KPLL enter into Power Purchase Agreements (PPAs) with a number of IPPs. Currently, the IPPs
collectively account for about 30% of the country’s installed capacity.
Delayed/ uncompleted Projects capacity power source initial date new date
BioJule 2MW Biogas 2016 2016
Wellhead units 25MW Geothermal 2016 2016
Cummins Power 12MW Biomass 2016 2016
Ormat 35MW Geothermal 2014 2017
Quantum 35MW Geothermal 2014 2017
Sosian 35MW Geothermal 2014 2017
Kwale International Sugar Plant 18MW Biomass 2015*** 2017
ReGen Terem 5MW Hydro 2017 2017
Kleen Energy 6MW Hydro 2017 2017
Kipeto wind farm 100MW Wind 2016 2018
Lake Turkana Wind-farm 310MW Wind 2017 2018
Africa Geothermal International Limited (AGIL) 70MW Geothermal 2017 2018
Marine Power 70MW Geothermal 2017 2018
Olkaria 1 rehabilitation (45)MW Geothermal 2018 2018
Olkaria 1 rehabilitation 50.7MW Geothermal 2018 2018
Olkaria 1- (Unit 6) 70MW Geothermal 2018 2018
Wellhead leasing 50MW Geothermal 2018 2018
Ol-Danyat Energy 10MW Wind 2018 2018
Ethiopia imports 400MW Hydro 2018 2018
Mt. Kenya CBO 0.57MW Hydro 2018 2018
Prunus Ngong wind farm 50MW Wind 2016 2019
Amu Power 1,050MW Coal 2016 2020
Kitui Coal Plant 1,000MW Coal 2016 2025
Kinangop Wind 60MW Wind 2015 Cancelled*
Dongo Kundu 700MW Liquefied Natural Gas 2015 Suspended**
Source: (Ministry of Energy and Petroleum)
Source: Company Annual reports
The PPAs signed by KPLL are under-
written by the Government through a
letter of support which mitigates compen-
sation to be paid by KPLL to IPPs incase
a claim arises.
* The Kinangop wind-park was aban-
doned by its developers following contin-
ued disputes with locals over compensa-
tion for land (Read more)
** The Dongo Kundu LNG plant was
suspended as fears arose of a possible
power over-supply. (Read more)
*** Kwale International Sugar plant was
commissioned in 2015 for own supply but
has not been feeding into the grid yet. It
is expected to feed into the grid from
2017 onwards.
0.0%
10.0%
20.0%
30.0%
40.0%
50.0%
60.0%
2012 2013 2014 2015 2016
Energy mix
hydro Geothermal thermal others
Kenya Power-Initiation of coverage
Delayed consumption accompanies delayed production
As the county’s power production projects lag behind, power consumption levels are still low as
a result of delayed/ adjusted mega projects in the country. As at June 2015, the country’s peak
demand for electricity stood at 1,512MW with a 2,834MW target by 2017 (Power Sector Medi-
um Term Plan 2015-2020). The SGR was initially planned to run on electricity before the Gov-
ernment made a u-turn and opted for diesel. The SGR and other Vision 2030 flagship projects
(ICT park, light rail for Nairobi & suburbs and LAPSSET among others) were estimated to add
on an additional 1,927MW in new demand.
The plan to add on to the country’s installed capacity has to be accompanied by a corresponding
increase in power demand. As the power production projects near completion, the Government
plans to fast-track most of its power-hungry projects.
Large & commercial consumers make up c.55.6% of Kenya Power’s sales despite being a paltry
0.5% of the firm’s customers. Thus, a close correlation exists between the company’s business
growth prospects and the level of direct investments by large & commercial consumers.
Moving away from large consumers, the Government last year launched the Last Mile Connec-
tivity Project (LMCP) aimed at scaling up connectivity of house-holds in the rural and peri-urban
areas. The project facilitates the firm’s plan to connect 1M new customers every year. LMCP
targets to connect 70% of households by end of 2017 and 100% connectivity by 2020. As of June
2016, electricity access rate stood at 64% indicating that the country is on the right track to hit
access targets.
Ethiopia to the rescue
In FY12, Kenya Power signed a PPA with Ethiopia Electric Power Corporation (EEPCO) which
will see the latter sell some 400MW for a period of 20 years from 2018. The 1,068Km 500kV
DC transmission line from Kenya to Ethiopia has a power transfer capability of 2,000MW. The
project, which is estimated to cost USD 1.3B, is co-funded by the World Bank, Africa Develop-
ment Bank, French Development Agency and the Governments of Kenya & Ethiopia. Construc-
tion on the 500KV DC transmission line started in August 2016 with completion set for 2018.
Nuclear energy; our silver bullet?
The country plans to set up a 1,000MW nuclear plant by 2027 with plans to raise the capacity to
4,000MW by 2033. This makes nuclear energy a key component of the country’s energy mix
which is projected to be about 20,000MW in total by 2033.
In a bid to develop the human capital required to set up the nuclear plants, the Kenya Nuclear
Electricity Board has partnered with various learning institutions. This includes King’s College
Pennsylvania and University of Nairobi. Recently, the board signed an MoU with the Korea
Electric Power Corp to cooperate on construction of nuclear projects and sharing of expertise.
Increased consumption of power
negates the need for PPAs as
increased consumption points to
a ready market for the power
produced.
This is part of Ethiopia’s grand
plan to be among the continent’s
largest exporters of power with
the country estimated to have a
potential of 60,000MW in in-
stalled capacity which is about
50% of Africa’s current total
installed capacity. By 2020, the
country estimates to earn about
USD 1B in revenues from power
exports. It has a plan to be a
middle income country by 2025.
The Energy Act, 2015 establishes
the Energy and Petroleum Insti-
tute whose functions includes
being the nuclear energy pro-
gram implementing organization.
The institute shall promote the
development of nuclear electrici-
ty generation in Kenya. The re-
sponsibilities and functions car-
ried out by the Kenya National
Electricity Board shall be as-
sumed by the institute.

Kenya Power-Initiation of coverage
The business model; ever evolving Kenya Power (formerly known as KPLC) was created in 1954 under the management of East
African Power and Lighting Company (EAP&L) with the purpose of transmitting power from
Uganda through the Tororo-Juja Line. After EAP&L sold its majority shareholding in Tanzania
Electric Supply Company to the Government of Tanzania, the company was rebranded to Kenya
Power and Lighting Company (KPLC).
In 1997, the need arose to separate distribution from production. Kenya Power Company, which
had been under the management of KPLC, became a separate entity responsible for publicly
funded power generation projects. Kenya Power Company was later re-launched as Kenya Elec-
tricity Generating Company (KenGen).
To address the low electricity penetration levels in rural areas, the Rural Electrification Authority
was established under Section 66 of the Energy Act, 2006. Its mandate was to accelerate the pace
of rural electrification in the country.
The Energy Regulatory Commission was established in 2007 under the Energy Act, 2006.
Among its many functions, the ERC regulates the importation, exportation, generation, transmis-
sion, distribution, supply and use of electrical energy. The commission sets, reviews and adjusts
electric power tariffs & structures and investigates tariff charges.
Aiming to distance consumers from the burden of funding transmission projects, the Government
incorporated Ketraco in 2009 to develop new transmission projects using exchequer funding. The
company’s core business is to plan, design, build and maintain high voltage electricity transmis-
sion lines and associated substations. The voltage rating of the transmission lines include 132kV,
220kV, 400kV and 500kV.
A changing regulatory framework
The Energy Act, 2015
The Energy Act, 2015 was passed by the National Assembly and is due to be presented to the
President. The Act establishes the Energy Regulatory Authority which shall be the successor to
the Energy Regulatory Commission. Upon enactment of the Act, all rights duties, obligations,
assets and liabilities of the ERC shall be automatically and fully transferred to the Authority. We
delve deeper into the impact of the Act upon enactment.
National Load Dispatch Centre
The Act hands the authority power to appoint a system operator who shall be responsible for
matching electricity demand with supply, maintaining electric power system security and arrang-
ing for the dispatch process. The system operator refers to a national load dispatch centre which
shall determine the energy mix to be fed to the grid.
Currently, Kenya Power dictates the kind of energy mix that is distributed to consumers through
the least cost generation plan. The ERC says that plans are afoot to set up the dispatch centre
which shall be managed by Ketraco. The dispatch centre is seen as an independent system opera-
tor with a helicopter view on power demand and supply, making decisions on the most optimum
and economical mix. The Act stipulates that the system operator shall not be involved directly or
indirectly in the purchase or sale of electrical energy.
Our two cents: The load dispatch centre promises a cheaper power mix though it appears
similar to what KPLL is employing. As such, the gains from running the dispatch centre are, in
our view, likely to be minute. The system operator, as stated in the Act, may levy and collect fees
and charges from the generating companies or any other licensees engaged in electricity under-
takings. The generating companies and other licensees could pass on the charges and levies to
consumers defeating the purpose of the existence of a dispatch centre.
Licensee implies any holder of
any license under the Act,
The license authorizes the impor-
tation, exportation, generation,
transmission, distribution and
supply of electrical energy.
Kenya Power-Initiation of coverage
Compensation for power outages
The legislators, when making last minute changes to the Act, included an amendment that man-
dates a licensee to compensate a consumer for losses incurred in case of power surges or outages.
Compensation shall be paid whenever the consumer incurs financial loss or incurs physical inju-
ry. Financial loss is to be compensated through a subsidy in the consumer’s power bill, with the
amount being agreed upon by the consumer and the licensee. Media reports have it that outages
and surges cased by forces of nature are not covered by the Act.
Implications: The Act presumes that the consumer and the licensee (for instance KPLL) shall
have a sit down to asses the extent of the damage incurred by the former. In reality, this is not
going to be as smooth as the Act suggests. Disagreements in assessing the compensation to be
paid may see the firm face increased litigation from disgruntled consumers, pointing to increased
costs for the licensee.
New players
The Energy Act, 2015 section 173 has opened the way allowing willing and able retailers to dis-
tribute power to consumers. The Authority shall specify the minimum financial and technical
requirements necessary for a person to be issued with a retail license. Powerhive East Africa be-
came the first private utility firm to generate, distribute and sell electricity to Kenyans. Its 100%
renewable energy serves about 1,500 people in Kisii. A second firm, PowerGen had sought ap-
proval from the ERC to generate, supply and sell power to homes using its micro-grid.
Despite the lifting of the legal barrier to entry, other barriers still exist to the benefit of Kenya
power and as such, we do not expect its market share to be dented in the medium term.
Separation of duties
The Act in section 170 (2) states that “a person requiring a supply of electrical energy shall apply
to the duly authorized retailer, but where there is no such retailer, the distribution licensee”. It
further provides that, the consumer may apply directly to the distributor if the power is to be sup-
plied at medium or high voltage. Implementation of the clause could bring about the establish-
ment of another entity to handle retail of electricity, leaving Kenya Power with the sole role of a
distributor.
Vandalism is now an economic crime
The Act classifies vandalism (and the attempt of vandalism) of energy installations and infra-
structure as an economic crime. Upon conviction, the liable person is to pay a fine of not less
than KES 5M or serve a prison sentence of 10 years or both. The provision acts as a deterrent to
vandalism which will aid KPLL’s strategies to cut commercial losses to desirable levels of about
4.5%.
Tariff setting; not yet uhuru
Despite the many changes incorporated in the Energy Act, 2015, setting of tariffs remains the
mandate of the Authority. The Government is hell-bent on offering cheap electricity to consum-
ers and as such, any attempt to raise tariffs is expected to be met with harsh criticism. KPLL had
earlier in the year sought approval from the ERC to raise tariffs in order to finance its rising op-
erational costs and the upgrade of its transmission line. The approval was however withheld.
In addition, the Schedule of Tariffs and Rates that’s currently being used was passed in 2013,
and was supposed to run up to June 2016. Electricity is a very sensitive issue, more so now that
we are drawing closer to an electioneering period. As such, we don’t expect a new schedule be-
fore the elections.
The Energy Act, 2015 section 25
establishes the Energy and Petro-
leum Tribunal for the purpose of
hearing and determining disputes
and appeals in accordance with
the Act.

Kenya Power-Initiation of coverage
Developments in the offing
Kenya Power International Limited; the new kid on the block
From 2010 onwards, Kenya Power has put up 1,800Km of optical fibre along its high-voltage
power lines-traversing through 24 counties. Since the firm does not use up all of this capacity, it
leases out the extra bandwidth to customers. The leasing earned the firm KES 259.4M (+3.5% y/
y) in FY15.
Kenya Power received the green light from its shareholders to set up Kenya Power International
Limited. The purpose of the subsidiary shall be to run KPLL’s telecoms business as well as actu-
alize its vision of the Institute of Energy Studies & Research. KPLL recently partnered with Sa-
faricom to offer fibre-to-the-home. It targets to connect 12,000 homes around Nairobi in a 12-
month pilot program. KPLL aims to diversify its revenue streams from electricity sales with the
lease of its fibre optic cables targeted to earn the company KES 1B by 2017.
Earning the greenback as we go green
The Nairobi Securities Exchange plans to launch a carbon credits trading platform which could
boost Kenya Power’s revenues. The formal trading is seen as an easier way for firms to sell their
carbon credits as opposed individual firms sourcing for buyers to negotiate deals.
Kenya Power currently has 2 Clean Development Mechanism (CDM) projects registered with
the United Nations Framework Convention on Climate Change (UNFCC). These are the Installa-
tion of Energy Efficient Transformers (IEET) and the distribution of Compact Fluorescent
Lamps (CFLs). The former is estimated reduce Carbon (IV) Oxide (CO2) emissions by 23,021
metric tonnes of per annum whereas the latter could reduce CO2 emissions by 100,000 metric
tonnes p.a.
Risk assessment Here we look into some of the risks that face Kenya Power. Some are manageable by the firm’s
management, while others are beyond its control.
A. Regulatory risks
Risks assessed are scenario based upon the implementation of the Energy Act, 2015.
Compensation for power outages
The Act dictates that distributors and retailers are to compensate consumers incase of power out-
ages that last for more than 3 hours. Financial compensation is to be paid through a subsidy in
the consumer’s power bill, which may dent the firm’s top-line. Implementation of the same is
expected to be troublesome and hence, the impact on the firm may be far-fetched.
Unbundling the retailer from the distributor
The Act allows for the establishment of a retailer who will connect users requiring low voltage.
A retailer adds on to the number of intermediaries between the producer and consumer, with the
consumers liable to finance its operations. The Government is intent on keeping the power costs
low. For this reason, we don’t expect a retailer to be set up in the short-medium term.
The 3.3M CFLs that were target-
ed for distribution could realize
power savings of 130MW.
Kenya Power-Initiation of coverage
Restrictions lifted allowing the entry of new players
The Act lifts the legal barrier that allowed KPLL to operate as a monopoly opening the way for
possible competition. Nonetheless, there exists other barriers to entry that work in KPLL’s favor.
These include;
Heavy capital expenditure required to set up and operate a distribution company.
Kenya Power has signed power purchase agreements with electricity generators
which makes it difficult for prospective competitors to access the power produced.
Pricing of electricity is done by the ERC, which means that distributors/retailers
cannot dictate prices. Regulated pricing may lead to compressed margins, discour-
aging some players.
Registration for new distributors/retailers is to be okayed by the ERC. We can only
assume that the prerequisite conditions are going to be tough, locking out some
prospective players.
The energy sector is a very sensitive sector for any economy. As such, it is highly
susceptible to changes in the regulatory framework which may put-off competition.
Kenya Power currently has diversified power sources. This, in essence, guarantees
power stability. In addition, the energy mix is based on a least cost generation plan
implying that, in essence, it would be cheaper.
Upon the competitors passing all the above hurdles, there remains switching logis-
tics by the consumers as well KPLL’s strong brand name.
B. Political (interference) risk
Ownership
The company is majority owned by the Government (50.1%). This implies that the Government
may pass resolutions that favour it at the expense of other shareholders. Though this risk exists,
the Government has used its position as the major shareholder to negotiate cheap concessionary
loans for KPLL. In addition, majority of its debt is guaranteed by the Government.
Tariff setting
Tariff setting is done by the ERC guided by the Schedule of Tariffs that is reviewed every 3
years. Kenya Power has in the recent past expressed plans to increase tariffs, a move that has
been stiffly opposed by both the Government and the ERC. The push for higher tariffs was met
with harsh criticism with the Government urging Kenya Power to cut its system losses to im-
prove its margins. The Schedule of Tariffs is up for review this year but with the elections draw-
ing ever closer, the review is likely to be shelved.
C. System losses
System losses (also known as transmission and distribution losses) refer to the difference be-
tween generated and distributed power units. There are two types of losses; commercial/non-
technical losses and technical losses.
Commercial losses are related to meter ing er rors, inaccurate meters, improper ly read me-
ters, estimated consumption due to lack of meters, unauthorized connections, vandalism and ad-
ministrative errors.
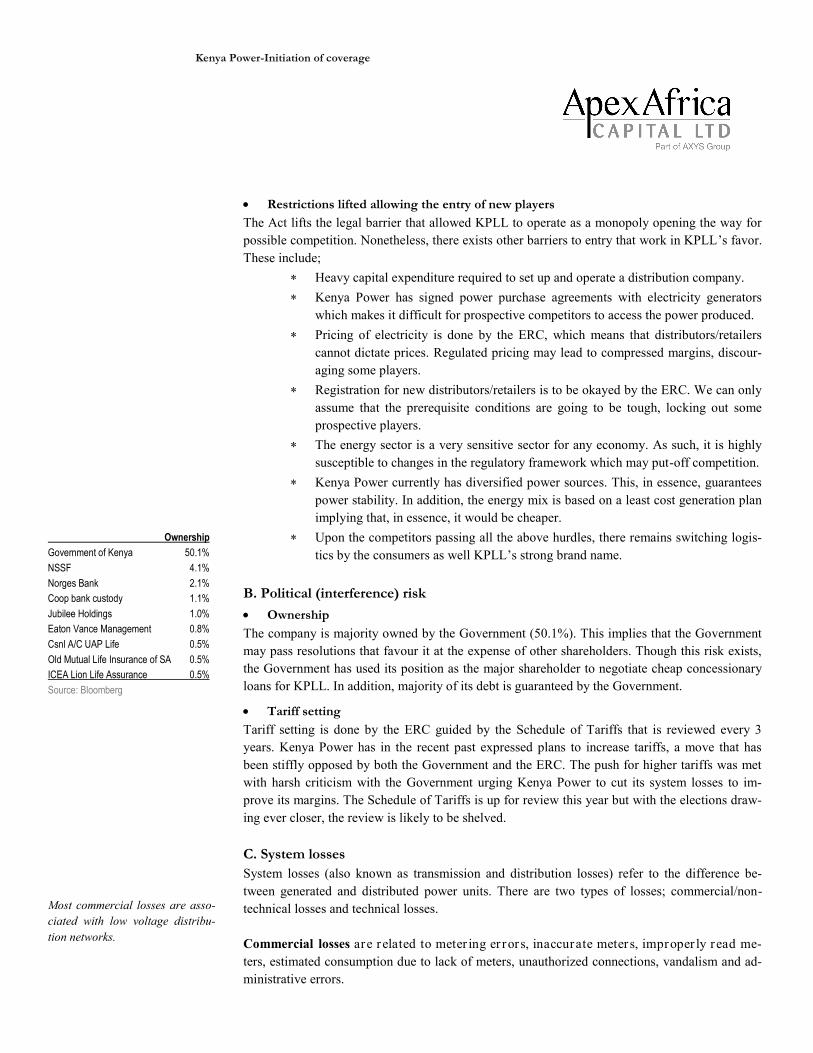
Ownership
Government of Kenya 50.1%
NSSF 4.1%
Norges Bank 2.1%
Coop bank custody 1.1%
Jubilee Holdings 1.0%
Eaton Vance Management 0.8%
Csnl A/C UAP Life 0.5%
Old Mutual Life Insurance of SA 0.5%
ICEA Lion Life Assurance 0.5%
Source: Bloomberg
Most commercial losses are asso-
ciated with low voltage distribu-
tion networks.
Kenya Power-Initiation of coverage
Technical losses refer to losses that occur due to energy dissipated in the conductors, equip-
ment used for transmission line, transformer, sub-transmission & distribution lines and magnetic
losses in transformers. The losses are inherent to the system but can be reduced to optimum lev-
els.
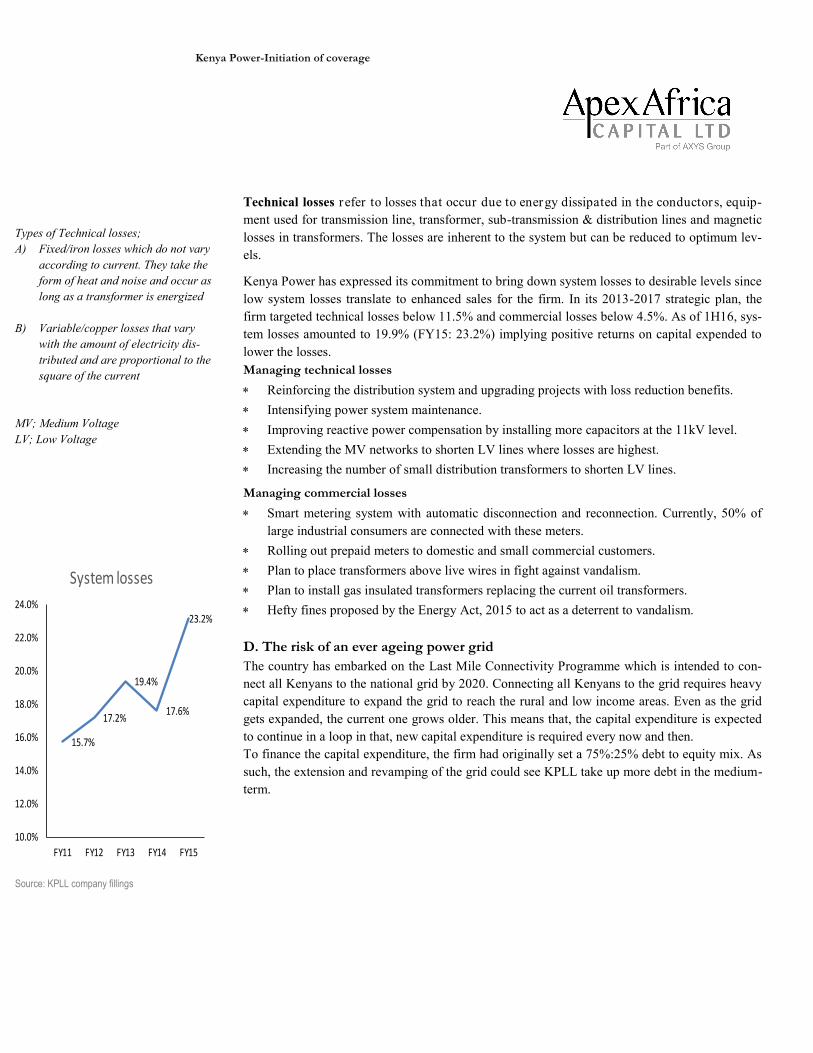
Kenya Power has expressed its commitment to bring down system losses to desirable levels since
low system losses translate to enhanced sales for the firm. In its 2013-2017 strategic plan, the
firm targeted technical losses below 11.5% and commercial losses below 4.5%. As of 1H16, sys-
tem losses amounted to 19.9% (FY15: 23.2%) implying positive returns on capital expended to
lower the losses.
Managing technical losses
Reinforcing the distribution system and upgrading projects with loss reduction benefits.
Intensifying power system maintenance.
Improving reactive power compensation by installing more capacitors at the 11kV level.
Extending the MV networks to shorten LV lines where losses are highest.
Increasing the number of small distribution transformers to shorten LV lines.
Managing commercial losses
Smart metering system with automatic disconnection and reconnection. Currently, 50% of
large industrial consumers are connected with these meters.
Rolling out prepaid meters to domestic and small commercial customers.
Plan to place transformers above live wires in fight against vandalism.
Plan to install gas insulated transformers replacing the current oil transformers.
Hefty fines proposed by the Energy Act, 2015 to act as a deterrent to vandalism.
D. The risk of an ever ageing power grid
The country has embarked on the Last Mile Connectivity Programme which is intended to con-
nect all Kenyans to the national grid by 2020. Connecting all Kenyans to the grid requires heavy
capital expenditure to expand the grid to reach the rural and low income areas. Even as the grid
gets expanded, the current one grows older. This means that, the capital expenditure is expected
to continue in a loop in that, new capital expenditure is required every now and then.
To finance the capital expenditure, the firm had originally set a 75%:25% debt to equity mix. As
such, the extension and revamping of the grid could see KPLL take up more debt in the medium-
term.
Types of Technical losses;
A) Fixed/iron losses which do not vary
according to current. They take the
form of heat and noise and occur as
long as a transformer is energized
B) Variable/copper losses that vary
with the amount of electricity dis-
tributed and are proportional to the
square of the current
MV; Medium Voltage
LV; Low Voltage
Source: KPLL company fillings
15.7%
17.2%
19.4%
17.6%
23.2%
10.0%
12.0%
14.0%
16.0%
18.0%
20.0%
22.0%
24.0%
FY11 FY12 FY13 FY14 FY15
System losses
Kenya Power-Initiation of coverage
Financial outlook
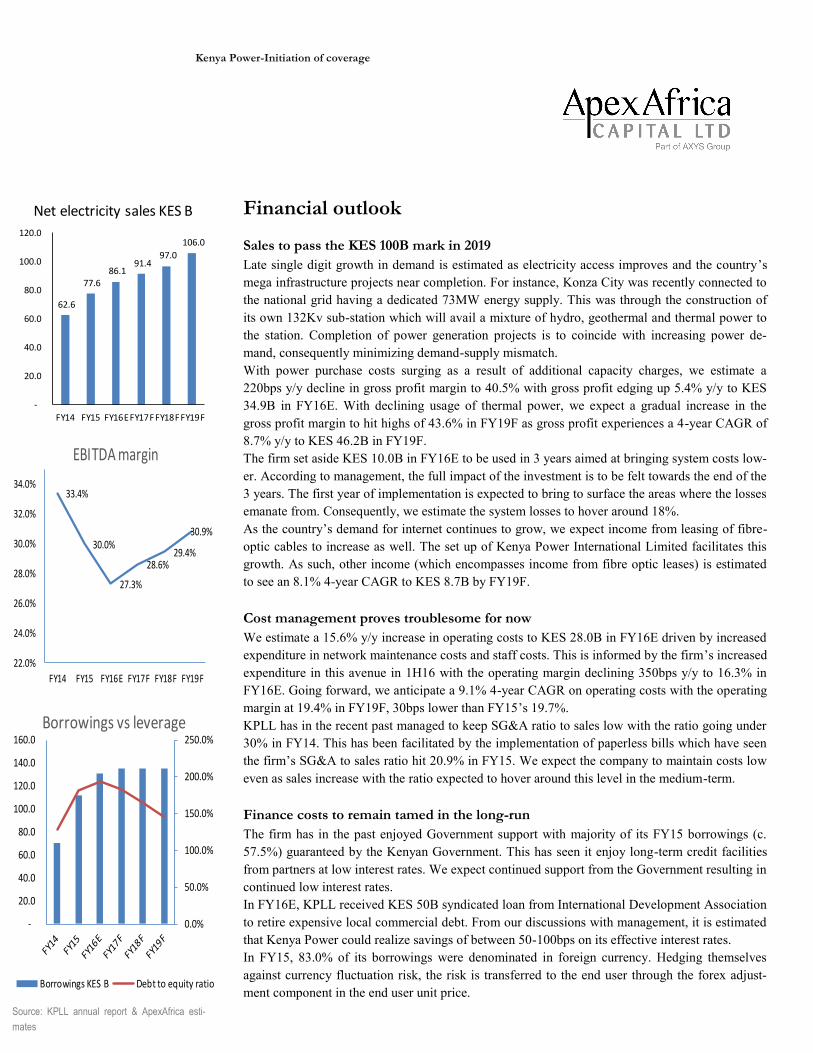
Sales to pass the KES 100B mark in 2019
Late single digit growth in demand is estimated as electricity access improves and the country’s
mega infrastructure projects near completion. For instance, Konza City was recently connected to
the national grid having a dedicated 73MW energy supply. This was through the construction of
its own 132Kv sub-station which will avail a mixture of hydro, geothermal and thermal power to
the station. Completion of power generation projects is to coincide with increasing power de-
mand, consequently minimizing demand-supply mismatch.
With power purchase costs surging as a result of additional capacity charges, we estimate a
220bps y/y decline in gross profit margin to 40.5% with gross profit edging up 5.4% y/y to KES
34.9B in FY16E. With declining usage of thermal power, we expect a gradual increase in the
gross profit margin to hit highs of 43.6% in FY19F as gross profit experiences a 4-year CAGR of
8.7% y/y to KES 46.2B in FY19F.
The firm set aside KES 10.0B in FY16E to be used in 3 years aimed at bringing system costs low-
er. According to management, the full impact of the investment is to be felt towards the end of the
3 years. The first year of implementation is expected to bring to surface the areas where the losses
emanate from. Consequently, we estimate the system losses to hover around 18%.
As the country’s demand for internet continues to grow, we expect income from leasing of fibre-
optic cables to increase as well. The set up of Kenya Power International Limited facilitates this
growth. As such, other income (which encompasses income from fibre optic leases) is estimated
to see an 8.1% 4-year CAGR to KES 8.7B by FY19F.
Cost management proves troublesome for now
We estimate a 15.6% y/y increase in operating costs to KES 28.0B in FY16E driven by increased
expenditure in network maintenance costs and staff costs. This is informed by the firm’s increased
expenditure in this avenue in 1H16 with the operating margin declining 350bps y/y to 16.3% in
FY16E. Going forward, we anticipate a 9.1% 4-year CAGR on operating costs with the operating
margin at 19.4% in FY19F, 30bps lower than FY15’s 19.7%.
KPLL has in the recent past managed to keep SG&A ratio to sales low with the ratio going under
30% in FY14. This has been facilitated by the implementation of paperless bills which have seen
the firm’s SG&A to sales ratio hit 20.9% in FY15. We expect the company to maintain costs low
even as sales increase with the ratio expected to hover around this level in the medium-term.
Finance costs to remain tamed in the long-run
The firm has in the past enjoyed Government support with majority of its FY15 borrowings (c.
57.5%) guaranteed by the Kenyan Government. This has seen it enjoy long-term credit facilities
from partners at low interest rates. We expect continued support from the Government resulting in
continued low interest rates.
In FY16E, KPLL received KES 50B syndicated loan from International Development Association
to retire expensive local commercial debt. From our discussions with management, it is estimated
that Kenya Power could realize savings of between 50-100bps on its effective interest rates.
In FY15, 83.0% of its borrowings were denominated in foreign currency. Hedging themselves
against currency fluctuation risk, the risk is transferred to the end user through the forex adjust-
ment component in the end user unit price.
Source: KPLL annual report & ApexAfrica esti-
mates
62.6
77.6 86.1
91.4 97.0
106.0
-
20.0
40.0
60.0
80.0
100.0
120.0
FY14 FY15 FY16EFY17FFY18FFY19F
Net electricity sales KES B
33.4%
30.0%
27.3%
28.6%29.4%
30.9%
22.0%
24.0%
26.0%
28.0%
30.0%
32.0%
34.0%
FY14 FY15 FY16E FY17F FY18F FY19F
EBITDA margin
0.0%
50.0%
100.0%
150.0%
200.0%
250.0%
-
20.0
40.0
60.0
80.0
100.0
120.0
140.0
160.0
Borrowings vs leverage
Borrowings KES B Debt to equity ratio

Kenya Power-Initiation of coverage
We forecast a 12.6% y/y growth in the firm’s financial costs to KES 5.6B informed by its action
in 1H16 to take up more debt to finance its capital expenditure. Though the effective interest
rates on KPLL’s debt forecast to go down by c.100bps in FY16E, increasing volume of debt is
anticipated to raise the firm’s net finance cost by 16.4% y/y to KES 3.6B in FY16E.
Late single digit growth in PBT in the medium term
We forecast an 8.1% 4-year CAGR on KPLL’s PBT in the medium term. We expect a KES
10.5B PBT for FY16E (-14.7% y/y) informed by power purchase costs and operating costs out-
pacing the growth in revenues.
Modest growth in assets as liquidity improves
We forecast a 6.6% 4-year CAGR on KPLL’s total assets in the medium term. The firm has set
an ambitious KES 109B capital expenditure from FY16E to FY19F, with FY16E’s capital ex-
penditure estimated around FY15’s 41.9B.
We expect the firm to record a current ratio of 1.41 in FY16E which may be lower than FY15’s
1.64 but is higher than 1H16’s 1.16. We expect the company to maintain its ratio around these
levels going forward.
High leverage is here to stay
Informed by its 2013-2018 strategic plan, Kenya Power had planned to use a 75:25 debt to equity
financing for its long-term projects. As such, we anticipate the firm to take up more long-term
debt going forward. Longer periods of debt maturity aid the firm to plan for its cashflows.
Comparison of actual/ApexAfrica estimates with company forecasts
Source: ApexAfrica estimates, KPLL annual reports, 2013-2018 KPLL Strategic Plan
Source: ApexAfrica estimates, KPLL annual reports
11.0 12.3
10.5 10.6
12.9
16.7
-
2.0
4.0
6.0
8.0
10.0
12.0
14.0
16.0
18.0PBT KES B
FY14 FY15 FY16E FY17F FY18F FY19F
-
30.0
60.0
90.0
120.0
150.0
180.0
210.0
FY13 FY14 FY15 FY16F FY17F FY18F
Total Revenue KES B
Actual/ ApexAfrica estimates 2013-18 KPLC strategic plan forecasts
-
5.0
10.0
15.0
20.0
25.0
30.0
35.0
FY13 FY14 FY15 FY16F FY17F FY18F
PBT KES B
2013-18 KPLC strategic plan forecasts Actual/ ApexAfrica estimates

Kenya Power-Initiation of coverage
Comparison with Umeme Energy situation in Uganda
Uganda has an installed capacity of 862MW with the potential to raise this upon completion of
the 600 MW Karuma hydropower station (2020) and the 180MW Isimba dam (2018). As of 2015,
only 11% of Uganda’s population had access to electricity. The country plans to raise this to 80%
by 2040 as per its vision 2040 master-plan.
Uganda upcoming power projects Capacity Power source Completion date
Siti I power plant 6.1MW Hydropower 2016
Siti II power plant 16MW Hydropower 2016
Nyamwamba power plant 9.2MW Hydropower 2017
Rwimi power plant 5.5MW Hydropower 2017
Muvumbe power plant 6.5MW Hydropower 2017
Lubilia power plant 5.4MW Hydropower 2017
Waki power plant 4.8MW Hydropower 2017
Sindila 5MW Hydropower 2017
Kikigati power plant 16MW Hydropower 2018
Soroti I&II 10MW Solar Unknown
Tororo South and North 10MW Solar Unknown
Nyamagasani I. 15MW Hydropower Unknown
Nyamagasani II 5MW Hydropower Unknown
Ndugutu 4.8MW Hydropower Unknown
Kyambura 7.6MW Hydropower Unknown
Nkusi 9.6MW Hydropower Unknown
Source: Energy Regulatory Authority Uganda
In 2001, the country made amendments to the Public Enterprise Reform and Divestiture Act. This
resulted in the unbundling of Uganda Electricity Board and the establishment of 3 successor com-
panies; Uganda Electricity Generation Company (UEGLC), Uganda Electricity Transmission
Company Limited (UETCL) and Uganda Electricity Distribution Company Limited (UEDCL)
The electricity players in the country are
Power producers; UEGLC, Eskom (U) Limited, Bujagali Energy Limited and other
IPPs TUELTC which buys from producers and sells to Umeme. Electricity Regulatory Authority (ERA); regulates the generation, transmission, distr i-
bution, sale and export & import of electrical energy in Uganda. In addition ERA guides the
liberalization of the electricity industry, manages licensing, rates, safety and other matters
concerning the electricity industry. The authority is also responsible for setting of tariffs. Umeme & UEDCL; Umeme is the country’s largest power distributor transmitting c. 90%
of the country’s total power. UEDCL owns the distribution system.
A brief on Umeme
Umeme took over the distribution system for the distribution and supply of electricity in Uganda
from UEDCL under a concessionary agreement for a period of 20 years, commencing 1 March
2005. Under the concession, Umeme is required to repair, upgrade, and expand the distribution
system within Uganda and such contiguous areas as Umeme and ERA may agree.
Energy comparables Kenya Uganda
Population (M) 44.2 34.6
GDP growth rate (%) 5.6 5.0
Electricity produced (GWh) 9,455.8 3,363.2
Electricity consumed (GWh) 7,826.4 3,274.6
Consumption per capita (kWh) 177.1 94.6
Installed capacity (MW) 2,333.6 867.0
Source: Economic Survey (KE) and Statistical Abstract
(UG)
Source: Umeme annual report
861
794
651
574
513
458
1H16
2015
2014
2013
2012
2011
Umeme N.o of customers (000)
Kenya Power-Initiation of coverage
Umeme operates as the primary electricity distribution company in Uganda, responsible for dis-
tributing electricity to Ugandan residents and commercial entities. UEDCL owns the distribution
network that has been leased to Umeme under the privatization agreements. Umeme purchases
electricity from UETCL, which owns and operates the high voltage transmissions network of up
to 132kV.
Top-line
Similar to Kenya, large industrial consumers make up the bulk of Umeme’s electricity sales
(72.7% as of FY15). The main revenue driver for Umeme is electricity sales with other income
derived from activities surrounding electricity transmission.
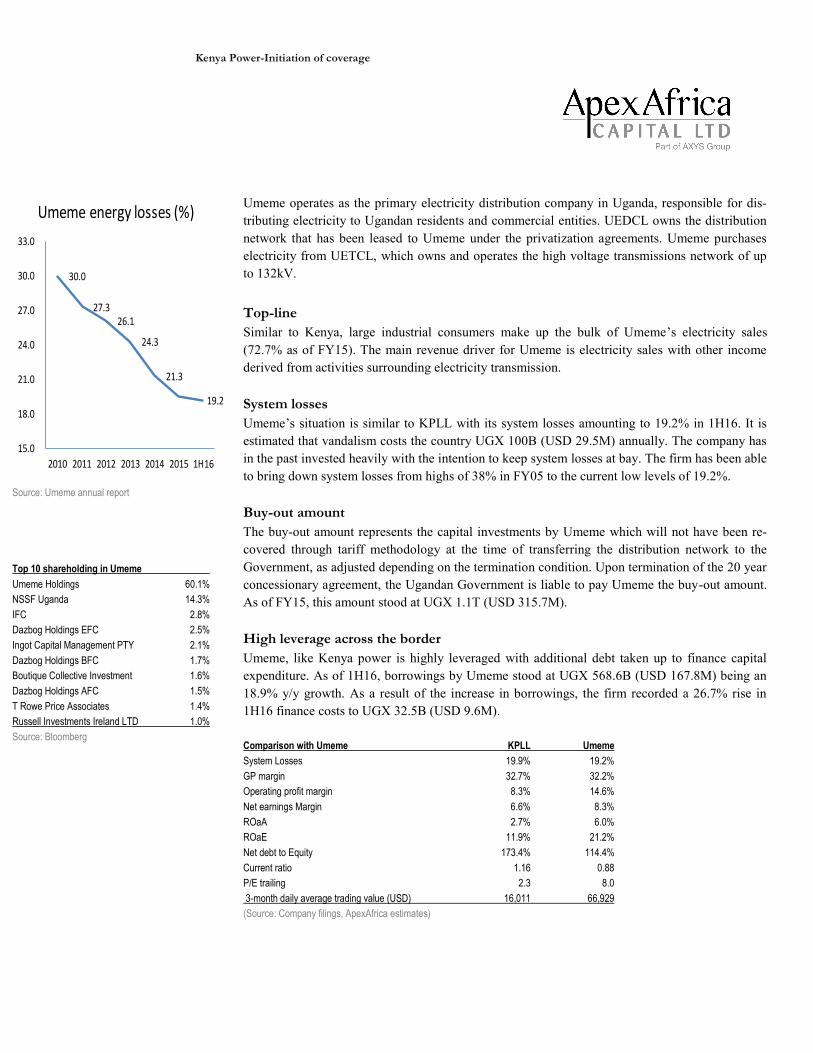
System losses
Umeme’s situation is similar to KPLL with its system losses amounting to 19.2% in 1H16. It is
estimated that vandalism costs the country UGX 100B (USD 29.5M) annually. The company has
in the past invested heavily with the intention to keep system losses at bay. The firm has been able
to bring down system losses from highs of 38% in FY05 to the current low levels of 19.2%.
Buy-out amount
The buy-out amount represents the capital investments by Umeme which will not have been re-
covered through tariff methodology at the time of transferring the distribution network to the
Government, as adjusted depending on the termination condition. Upon termination of the 20 year
concessionary agreement, the Ugandan Government is liable to pay Umeme the buy-out amount.
As of FY15, this amount stood at UGX 1.1T (USD 315.7M).
High leverage across the border
Umeme, like Kenya power is highly leveraged with additional debt taken up to finance capital
expenditure. As of 1H16, borrowings by Umeme stood at UGX 568.6B (USD 167.8M) being an
18.9% y/y growth. As a result of the increase in borrowings, the firm recorded a 26.7% rise in
1H16 finance costs to UGX 32.5B (USD 9.6M).
Comparison with Umeme KPLL Umeme
System Losses 19.9% 19.2%
GP margin 32.7% 32.2%
Operating profit margin 8.3% 14.6%
Net earnings Margin 6.6% 8.3%
ROaA 2.7% 6.0%
ROaE 11.9% 21.2%
Net debt to Equity 173.4% 114.4%
Current ratio 1.16 0.88
P/E trailing 2.3 8.0
3-month daily average trading value (USD) 16,011 66,929
(Source: Company filings, ApexAfrica estimates)
Source: Umeme annual report
Top 10 shareholding in Umeme
Umeme Holdings 60.1%
NSSF Uganda 14.3%
IFC 2.8%
Dazbog Holdings EFC 2.5%
Ingot Capital Management PTY 2.1%
Dazbog Holdings BFC 1.7%
Boutique Collective Investment 1.6%
Dazbog Holdings AFC 1.5%
T Rowe Price Associates 1.4%
Russell Investments Ireland LTD 1.0%
Source: Bloomberg
30.0
27.3 26.1
24.3
21.3
19.2
15.0
18.0
21.0
24.0
27.0
30.0
33.0
2010 2011 2012 2013 2014 2015 1H16
Umeme energy losses (%)

Kenya Power-Initiation of coverage
1H16 Kenya Power financials
Income statement 1H15 2H15 FY15 1H16 y/y change h/h change
KES M KES M KES M KES M % %
Electricity sales 37,605 40,230 77,836 41,665 10.8% 3.6%
Forex adjustment 906 2,438 3,344 4,419 387.7% 81.3%
Fuel cost adjustment 16,732 8,852 25,584 7,463 -55.4% -15.7%
Other income 2,670 3,736 6,406 3,155 18.2% -15.6%
Total income 57,914 55,256 113,170 56,702 -2.1% 2.6%
Operating expenses
Power purchase costs
Non-fuel power purchase costs 20,045 24,416 44,460 24,951 24.5% 2.2%
Fuel costs 17,150 8,685 25,835 8,072 -52.9% -7.1%
Forex costs 1,609 1,211 2,820 3,021 87.7% 149.5%
Total power purchase costs 38,804 34,311 73,115 36,044 -7.1% 5.0%
Transmission & distribution costs
Network management 3,860 4,704 8,564 5,091 31.9% 8.2%
Customer service 1,304 2,499 3,802 1,593 22.2% -36.2%
Administration 5,293 6,558 11,851 6,380 20.5% -2.7%
Total transmission & distribution costs 10,456 13,761 24,217 13,065 24.9% -5.1%
Operating profit 8,654 7,184 15,838 7,593 -12.3% 5.7%
Finance income 488 893 1,381 723 48.3% -19.1%
Finance cost (2,264) (2,701) (4,965) (2,579) 13.9% -4.5%
Profit before tax 6,878 5,376 12,254 5,737 -16.6% 6.7%
Income tax expense (2,377) (2,445) (4,822) (1,974) -16.9% -19.2%
Profit after tax 4,501 2,931 7,432 3,763 -16.4% 28.4%
EPS 2.31 1.50 3.81 1.93 -16.5% 28.7%
DPS 0.20 0.50 0.20
Ratios and margins 1H15 2H15 FY15 1H16 y/y change h/h change
GP margin 46.1% 39.6% 42.7% 39.2% -6.4% -0.3%
Operating profit margin 10.8% 6.7% 8.8% 8.3% -2.5% 1.6%
Net earnings margin 7.8% 5.3% 6.6% 6.6% -1.1% 1.3%
Return on Average Equity 16.0% 9.8% 12.8% 11.9% -4.0% 2.1%
Return on average assets 4.0% 2.3% 3.0% 2.7% -1.3% 0.4%
Current ratio 1.32 1.64 1.64 1.16 -12.5% -29.6%
Quick ratio 0.93 1.35 1.35 0.93 0.1% -31.4%
Debt/equity 140.7% 181.6% 181.6% 173.4% 32.7% -8.3%
Debt to total assets 35.8% 40.5% 40.5% 39.7% 3.9% -0.8%
Annualized P/E 2.10
Dividend yield 6.2%
Source: Kenya Power
Topline boosted by increased demand in electricity as power purchase costs come off
1H16 saw the firm increase its electricity sales by 10.8% y/y to KES 41.7M. Driving the growth,
units sold amounted to 3,632GWh (+5.6% y/y) as distribution efficiency improved by 50bps y/y
to 80.1%. The increase in units sold was attributed to the 46.2% y/y (+0.8M customers y/y)
growth in the customer base to 3.6M. In 1H16, commercial and industrial consumers grew by
4.0% y/y and domestic consumers by 10.4% y/y. The firm has a plan to connect at least 1M new
customers annually.

Kenya Power-Initiation of coverage
Power purchase costs (excluding fuel cost and foreign exchange) grew by 24.5% y/y to KES
24.9B. This was attributed to the additional capacity charges by KenGen, Gulf Power and Tri-
umph power for new power plants. A 4.9% y/y leap in units purchased to 4,532GWh further ex-
plains the increase in power purchase costs.
Fuel costs plunged 52.9% y/y to KES 8.1B due to declined use of thermal power. Units sourced
from thermal plants plummeted by 38.2% y/y to 621GWh as a result of increased of geothermal
power brought about by 2 additional Olkaria plants.
The surge in power purchase costs saw the gross profit margin decline by 640bps y/y to 39.2% as
the gross profit margin waned 6.1% y/y to KES 16.1B.
Surging operating costs write off top-line gains
Transmission and distribution costs leapt 24.9% y/y to KES 49.1B. Fueling the surge, staff costs
increased by KES 1.1B as a result of the implementation of a new structure and enhanced terms of
service for unionized staff. Geographical Information System data collection exercise saw repair
and maintenance costs go up by KES 668M.
Operating profits declined by 12.3% y/y to KES 7.6B as the operating profit margin also came
down 250bps y/y to 8.3%.
Increased finance costs pull down earnings
Finance income surged 48.3% y/y to KES 0.7B buoyed by the 170.0% y/y jump in bank and cash
balances. In addition 1H16 was characterized by high interest rates which the firm appeared to
leverage from.
On the other hand, increased borrowing by 37.0% y/y to KES 112.0B saw the firm’s finance costs
go up 13.9% y/y to KES 2.6B. The firm took on more debt to finance expansion and operation. As
of 1H16, its net debt to equity stood at 173.4% (+32.7% y/y) underscoring the firm’s high lever-
aged position.
Dividends held constant despite declining earnings
Increasing operating and finance costs saw the firm’s PBT decline 16.6% y/y to KES 5.7B. The
firm incurred an income tax charge of KES 1.9B (+16.9% y/y) with the figure encompassing a
deferred tax charge of KES 1.9B (-17.0% y/y). The firm’s net earnings for 1H16 consequently
stood at KES 3.8B (-16.4% y/y) with EPS at KES 1.93. Notwithstanding the dip in earnings, man-
agement decided to maintain interim dividend at KES 0.20.
Cash position wanes as liquidity position declines
Kenya Power’s closing cash position declined 13.1% y/y (-51.9% h/h) to KES 13.6B notwith-
standing the 7.2% y/y increase in cash flow from operating activities to KES 12.7B. Increased
cash additions to PPE (+84.4% y/y) and declined proceeds from new loans (-96.9% y/y) saw a
KES 14.7B decrease in cash and cash equivalents for the year.
With a declining cash position, the firm’s current ratio dipped 12.5% y/y (-29.6% y/y) to 1.16,
slightly above the 1.0 mark.

Kenya Power-Initiation of coverage
1H16 financials cont’d
1H15 2H15 FY15 1H16 y/y change h/h change
Statement of financial position KES M KES M KES M KES M % %
Assets
Non-current assets
PPE 172,950 196,301 196,301 217,962 26.0% 11.0%
Other non-current assets 6,819 13,129 13,129 15,561 128.2% 18.5%
Total non-current assets 179,770 209,431 209,431 233,523 29.9% 11.5%
Current assets
Inventories 14,501 11,660 11,660 9,615 -33.7% -17.5%
Trade and other receivables 16,842 25,823 25,823 25,444 51.1% -1.5%
Recoverable forex adjustment - 348 348 -
Tax recoverable - - - 36
Short-term deposits 14,719 4,272 4,272 6,657 -54.8% 55.8%
Bank and cash balances 2,563 23,958 23,958 6,920 170.0% -71.1%
Total current assets 48,626 66,062 66,062 48,672 0.1% -26.3%
Total assets 228,395 275,493 275,493 282,195 23.6% 2.4%
Equity and liabilities
Capital and reserves
Ordinary share capital 4,879 4,879 4,879 4,879
Share premium 22,021 22,021 22,021 22,021
Reserves 31,221 34,549 34,549 37,727 20.8% 9.2%
Total equity 58,121 61,449 61,449 64,626 11.2% 5.2%
Deferred income 19,789 22,014 22,014 21,051 6.4% -4.4%
Non-current liabilities
Deferred tax 21,364 24,427 24,427 26,188 22.6% 7.2%
Trade and other payables 24,392 28,073 28,073 31,406 28.8% 11.9%
Borrowings 67,873 99,289 99,289 96,787 42.6% -2.5%
Preference shares 43 43 43 43 0.0% 0.0%
Total Non-current liabilities 113,673 151,833 151,833 154,425 35.8% 1.7%
Current liabilities
Trade and other payables 19,452 26,328 26,328 25,193 29.5% -4.3%
Borrowings due within a year 13,902 12,311 12,311 15,244 9.7% 23.8%
Other current liabilities 3,459.09 1,558.60 1,558.60 1,656.49 -52.1% 6.3%
Total current liabilities 36,813 40,198 40,198 42,093 14.3% 4.7%
Total equity and liabilities 228,395 275,493 275,493 282,195 23.6% 2.4%
1H15 2H15 FY15 1H16 y/y change h/h change
Statement of cashflows KES M KES M KES M KES M % %
Cash generated from operating activities 11,865 15,746 27,610 12,722 7.2% -19.2%
Net cash used in investing activities (13,327) (26,762) (40,090) (24,571) 84.4% -8.2%
Net cash from financing activities 10,483 23,618 34,101 (2,804)
Increase/ (decrease) in cash 9,020 12,602 21,621 (14,653)
Opening cash position 6,609 15,629 6,609 28,231 327.1% 80.6%
Closing cash position 15,629 28,231 28,231 13,577 -13.1% -51.9%
Source: Kenya Power
Kenya Power-Initiation of coverage
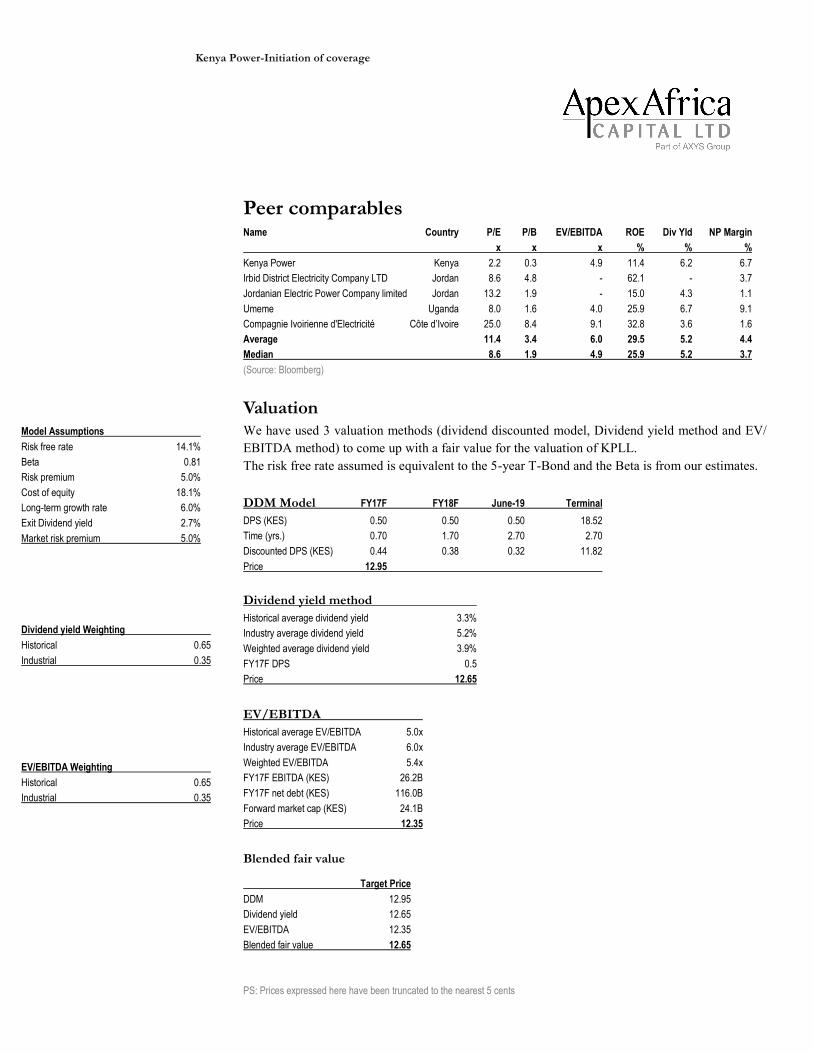
Peer comparables
Name Country P/E P/B EV/EBITDA ROE Div Yld NP Margin
x x x % % %
Kenya Power Kenya 2.2 0.3 4.9 11.4 6.2 6.7
Irbid District Electricity Company LTD Jordan 8.6 4.8 - 62.1 - 3.7
Jordanian Electric Power Company limited Jordan 13.2 1.9 - 15.0 4.3 1.1
Umeme Uganda 8.0 1.6 4.0 25.9 6.7 9.1
Compagnie Ivoirienne d'Electricité Côte d’Ivoire 25.0 8.4 9.1 32.8 3.6 1.6
Average 11.4 3.4 6.0 29.5 5.2 4.4
Median 8.6 1.9 4.9 25.9 5.2 3.7
(Source: Bloomberg)
Valuation We have used 3 valuation methods (dividend discounted model, Dividend yield method and EV/
EBITDA method) to come up with a fair value for the valuation of KPLL.
The risk free rate assumed is equivalent to the 5-year T-Bond and the Beta is from our estimates.
DDM Model FY17F FY18F June-19 Terminal
DPS (KES) 0.50 0.50 0.50 18.52
Time (yrs.) 0.70 1.70 2.70 2.70
Discounted DPS (KES) 0.44 0.38 0.32 11.82
Price 12.95
Dividend yield method
Historical average dividend yield 3.3%
Industry average dividend yield 5.2%
Weighted average dividend yield 3.9%
FY17F DPS 0.5
Price 12.65
EV/EBITDA
Historical average EV/EBITDA 5.0x
Industry average EV/EBITDA 6.0x
Weighted EV/EBITDA 5.4x
FY17F EBITDA (KES) 26.2B
FY17F net debt (KES) 116.0B
Forward market cap (KES) 24.1B
Price 12.35
Blended fair value
Target Price
DDM 12.95
Dividend yield 12.65
EV/EBITDA 12.35
Blended fair value 12.65
PS: Prices expressed here have been truncated to the nearest 5 cents
Model Assumptions
Risk free rate 14.1%
Beta 0.81
Risk premium 5.0%
Cost of equity 18.1%
Long-term growth rate 6.0%
Exit Dividend yield 2.7%
Market risk premium 5.0%
Dividend yield Weighting
Historical 0.65
Industrial 0.35
EV/EBITDA Weighting
Historical 0.65
Industrial 0.35
Kenya Power-Initiation of coverage
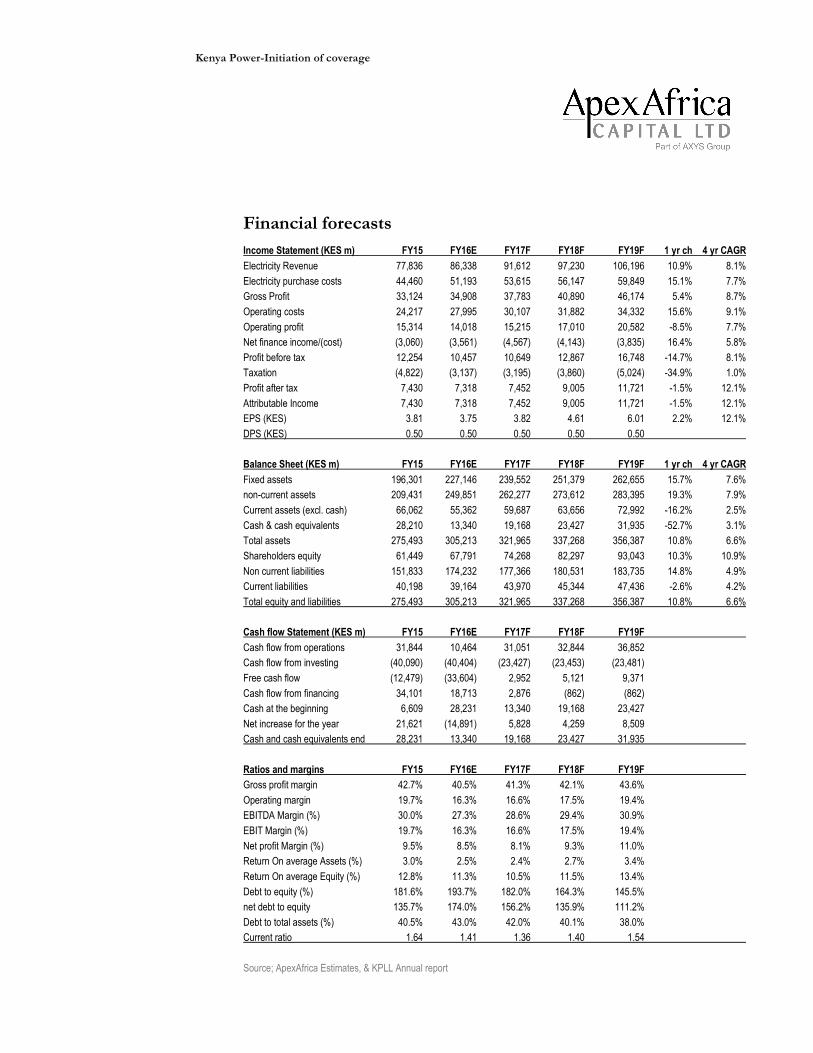
Financial forecasts
Income Statement (KES m) FY15 FY16E FY17F FY18F FY19F 1 yr ch 4 yr CAGR
Electricity Revenue 77,836 86,338 91,612 97,230 106,196 10.9% 8.1%
Electricity purchase costs 44,460 51,193 53,615 56,147 59,849 15.1% 7.7%
Gross Profit 33,124 34,908 37,783 40,890 46,174 5.4% 8.7%
Operating costs 24,217 27,995 30,107 31,882 34,332 15.6% 9.1%
Operating profit 15,314 14,018 15,215 17,010 20,582 -8.5% 7.7%
Net finance income/(cost) (3,060) (3,561) (4,567) (4,143) (3,835) 16.4% 5.8%
Profit before tax 12,254 10,457 10,649 12,867 16,748 -14.7% 8.1%
Taxation (4,822) (3,137) (3,195) (3,860) (5,024) -34.9% 1.0%
Profit after tax 7,430 7,318 7,452 9,005 11,721 -1.5% 12.1%
Attributable Income 7,430 7,318 7,452 9,005 11,721 -1.5% 12.1%
EPS (KES) 3.81 3.75 3.82 4.61 6.01 2.2% 12.1%
DPS (KES) 0.50 0.50 0.50 0.50 0.50
Balance Sheet (KES m) FY15 FY16E FY17F FY18F FY19F 1 yr ch 4 yr CAGR
Fixed assets 196,301 227,146 239,552 251,379 262,655 15.7% 7.6%
non-current assets 209,431 249,851 262,277 273,612 283,395 19.3% 7.9%
Current assets (excl. cash) 66,062 55,362 59,687 63,656 72,992 -16.2% 2.5%
Cash & cash equivalents 28,210 13,340 19,168 23,427 31,935 -52.7% 3.1%
Total assets 275,493 305,213 321,965 337,268 356,387 10.8% 6.6%
Shareholders equity 61,449 67,791 74,268 82,297 93,043 10.3% 10.9%
Non current liabilities 151,833 174,232 177,366 180,531 183,735 14.8% 4.9%
Current liabilities 40,198 39,164 43,970 45,344 47,436 -2.6% 4.2%
Total equity and liabilities 275,493 305,213 321,965 337,268 356,387 10.8% 6.6%
Cash flow Statement (KES m) FY15 FY16E FY17F FY18F FY19F
Cash flow from operations 31,844 10,464 31,051 32,844 36,852
Cash flow from investing (40,090) (40,404) (23,427) (23,453) (23,481)
Free cash flow (12,479) (33,604) 2,952 5,121 9,371
Cash flow from financing 34,101 18,713 2,876 (862) (862)
Cash at the beginning 6,609 28,231 13,340 19,168 23,427
Net increase for the year 21,621 (14,891) 5,828 4,259 8,509
Cash and cash equivalents end 28,231 13,340 19,168 23,427 31,935
Ratios and margins FY15 FY16E FY17F FY18F FY19F
Gross profit margin 42.7% 40.5% 41.3% 42.1% 43.6%
Operating margin 19.7% 16.3% 16.6% 17.5% 19.4%
EBITDA Margin (%) 30.0% 27.3% 28.6% 29.4% 30.9%
EBIT Margin (%) 19.7% 16.3% 16.6% 17.5% 19.4%
Net profit Margin (%) 9.5% 8.5% 8.1% 9.3% 11.0%
Return On average Assets (%) 3.0% 2.5% 2.4% 2.7% 3.4%
Return On average Equity (%) 12.8% 11.3% 10.5% 11.5% 13.4%
Debt to equity (%) 181.6% 193.7% 182.0% 164.3% 145.5%
net debt to equity 135.7% 174.0% 156.2% 135.9% 111.2%
Debt to total assets (%) 40.5% 43.0% 42.0% 40.1% 38.0%
Current ratio 1.64 1.41 1.36 1.40 1.54
Source; ApexAfrica Estimates, & KPLL Annual report
Kenya Power-Initiation of coverage
Appendix
Investment ratings Buy: A total return is anticipated in excess of the market's long-term historic annual rate
(approximately 10%). Total return expectations should be higher for stocks that possess greater risk.
Hold: Hold the shares with neither a materially positive total return nor a materially negative total
return anticipated.
Sell: Stock should be sold as materially negative total return is anticipated.
Disclaimer ApexAfrica and its parent company Axys Group seek to do business with companies covered in their research reports.
Consequently, a conflict of interest may arise that could affect the objectivity of this report. This document should only be
considered a single factor used by investors in making their investment decisions. The reader should independently evalu-
ate the investment risks and is solely responsible for their investment decisions. The opinions and information portrayed in
this report may change without prior notice to investors.
This publication may not be distributed to the public media or quoted or used by the public media without prior and express
written consent of ApexAfrica or Axys Group.
This document does not constitute an offer, or the solicitation of an offer, for the sale or purchase of any security. Whilst
every care has been taken in preparing this document, no representation, warranty or undertaking (express or implied) is
given and no responsibility or liability is accepted by Apex Africa or any of its employees as to the accuracy of the infor-
mation contained and opinions expressed in this report.
ApexAfrica Capital Ltd
A The Riverfront, 1st Floor, Prof. David Wasawo Drive, Off Riverside Drive | P.O. Box 43676-
00100 | Nairobi | Kenya |
T: +254-20-2226440 | Fax: +254-20-2319092 | Cell: +254-723-420204| W :
www.apexafrica.com