Embed Size (px)
Citation preview
October
2014
2
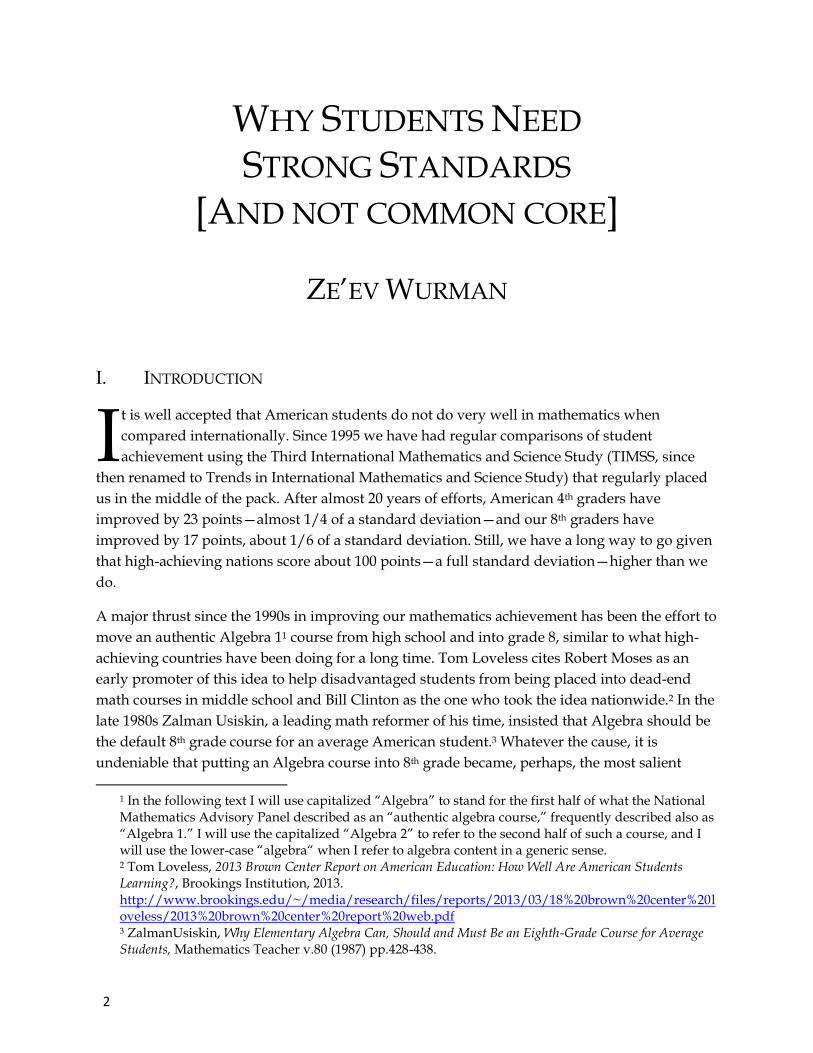
WHY STUDENTS NEED STRONG STANDARDS
[AND NOT COMMON CORE]
ZE’EV WURMAN
I. INTRODUCTION
t is well accepted that American students do not do very well in mathematics when
compared internationally. Since 1995 we have had regular comparisons of student
achievement using the Third International Mathematics and Science Study (TIMSS, since
then renamed to Trends in International Mathematics and Science Study) that regularly placed
us in the middle of the pack. After almost 20 years of efforts, American 4th graders have
improved by 23 points—almost 1/4 of a standard deviation—and our 8th graders have
improved by 17 points, about 1/6 of a standard deviation. Still, we have a long way to go given
that high-achieving nations score about 100 points—a full standard deviation—higher than we
do.
A major thrust since the 1990s in improving our mathematics achievement has been the effort to
move an authentic Algebra 11 course from high school and into grade 8, similar to what high-
achieving countries have been doing for a long time. Tom Loveless cites Robert Moses as an
early promoter of this idea to help disadvantaged students from being placed into dead-end
math courses in middle school and Bill Clinton as the one who took the idea nationwide.2 In the
late 1980s Zalman Usiskin, a leading math reformer of his time, insisted that Algebra should be
the default 8th grade course for an average American student.3 Whatever the cause, it is
undeniable that putting an Algebra course into 8th grade became, perhaps, the most salient
1 In the following text I will use capitalized “Algebra” to stand for the first half of what the National Mathematics Advisory Panel described as an “authentic algebra course,” frequently described also as “Algebra 1.” I will use the capitalized “Algebra 2” to refer to the second half of such a course, and I will use the lower-case “algebra“ when I refer to algebra content in a generic sense. 2 Tom Loveless, 2013 Brown Center Report on American Education: How Well Are American Students Learning?, Brookings Institution, 2013. http://www.brookings.edu/~/media/research/files/reports/2013/03/18%20brown%20center%20loveless/2013%20brown%20center%20report%20web.pdf 3 ZalmanUsiskin, Why Elementary Algebra Can, Should and Must Be an Eighth-Grade Course for Average Students, Mathematics Teacher v.80 (1987) pp.428-438.
I
3
feature of the efforts to reform and strengthen American mathematics education throughout the
1990s and 2000s.
This effort is clearly visible in the data Loveless cites: an increase from 16% of 8th grade students
taking advanced math in 1990, to 27% in 2000 and 47% in 2011.4 California is another example of
such an effort. In 1997, it adopted mathematics standards intended to prepare all its students to
take an Algebra 1 class in 8th grade, similar to the expectations in high-achieving countries. As a
consequence, California moved from 16% of 8th graders taking Algebra 1 in 1999, to 32% in 2003
and 67% in 2013.5 But the California story differs from the national story described in Loveless’s
report. While the national story places a serious question mark on the efficacy of pushing
Algebra 1 into grade 8, the California implementation was more careful, and its results more
unequivocally positive. More on this later.
The effort to put more middle school children in Algebra classes had its detractors in its early
days. Some labeled the effort as “educationally inappropriate” and claimed that it unnecessarily
“stresses children.” Others opposed it on the grounds that it would widen the gap between
advantaged and disadvantaged students, expressing the often-held but frequently unvoiced
belief that students from disadvantaged backgrounds are incapable of academically holding
their own.
Yet despite such opposition, the reality of an ever-increasing number of foreign students
enrolling in our colleges and the economic competition from developing countries –especially
the educationally high-achieving Asian Tigers– convinced many of the importance of enhancing
the mathematical capabilities of American students. The presidential National Mathematics
Advisory Panel studied this particular issue in, perhaps, the greatest depth ever and found:
Although clear and current international data across a wide range of countries on the timing of algebra course work cannot be located, it is clear from TIMSS data and the work of Schmidt et al. (2002) that students in the A+ countries study Algebra as well as Geometry in Grades 7 and 8.
…
A search of the literature produced six studies that met the Panel’s design criteria and included Algebra or mathematics achievement as an outcome …
It is important to note that these six studies drew on four national data sets. … The consistency of their findings is striking. The studies by Ma and others provide some evidence that there are long-term benefits for Grade 7 or 8 students with the requisite mathematical background for algebra if they can take an authentic Algebra course in Grade 7 or 8: higher mathematics achievement in high school and the opportunity to take advanced mathematics course work in Grade 11 or 12.
4 Loveless (2013). Table 3-1. 5 California STAR (School Testing And Reporting) data. The 2013 data refers to students taking Algebra 1 by grade 8 rather than only in grade 8. http://star.cde.ca.gov
4
… research evidence, as well as the experience of other countries, supports the value of preparing a higher percentage of students than the U.S. does at present to complete an Algebra I course or its equivalent by Grade 7 or 8, and of providing such course work in Grade 7 or 8.6
These findings were reflected in one of the Panel’s key recommendations:
All school districts should ensure that all prepared students have access to an authentic algebra course—and should prepare more students than at present to enroll in such a course by Grade 8.7
Indeed, this understanding of the importance of early Algebra was not limited to the National
Mathematics Advisory Panel. Less than a year later, in December of 2008, the National
Governors Association, the Council of Chief State School Officers, and Achieve, Inc., published
a seminal report, Benchmarking for Success, which included this first recommendation:
Action I: Upgrade state standards by adopting a common core of internationally benchmarked standards in math and language arts for grades K-12 to ensure that students are equipped with the necessary knowledge and skills to be globally competitive.8
This report called, then, for what has since become known as the Common Core State
Standards. It went on to declare:
Research has revealed striking similarities among the math and science standards in top-performing nations, along with stark differences between those world class expectations and the standards adopted by most U.S. states.… By the eighth grade, students in top performing nations are studying algebra and geometry, while in the U.S., most eighth-grade math courses focus on arithmetic.9
In other words, the rallying cry for the establishment of a common core of content standards in
2008 explicitly acknowledged that for the U.S. to be benchmarked against top-performing
countries, we should teach algebra in the 8th grade.
Yet when the Common Core standards were published a little more than a year later, in the
early summer of 2010, they firmly placed the first algebra course in … high school!
6 Foundations for Success: Report of the Task Group on Conceptual Knowledge and Skills, p 3-45 to 3-47. U.S. Department of Education, 2008. 7 Foundations for Success, The Final Report of the National Mathematics Advisory Panel, p. xviii.U.S. Department of Education, 2008. 8 Benchmarking for Success: Ensuring U.S. Students Receive a World-Class Education, NGA, CCSSO, Achieve, (2008). 9 Ibid.
5
II. THE CALIFORNIA EXPERIENCE WITH EARLY ALGEBRA TAKING
Many would naturally ask whether teaching an Algebra course to all students is a reasonable
expectation for grade 8. After all, many of us remember the difficulty we ourselves had with
algebra. Can we reasonably expect that all students can handle it?
Here is some of the clearest evidence that we can.
The Japanese school system consists of a six-year primary school, a three-year lower secondary school, and a three-year upper secondary school. The first nine grades are compulsory, and enrollment now is 99.99%. According to 1990 statistics, 95.1% of age-group children are enrolled in upper secondary school.
Japanese Grade 7 Mathematics explores integers, positive and negative numbers, letters and expressions, equations, functions and proportions, plane figures, and figures in space. Chapter headings in Japanese Grade 8 Mathematics include calculating expressions, inequalities, systems of equations, linear functions, parallel lines and congruent figures, parallelograms, similar figures, and organizing data. Japanese Grade 9 Mathematics covers square roots, polynomials, quadratic equations, functions, circles, figures and measurement, and probability and statistics. The material in these three grades is compulsory for all students.10
As is clear from the above, twenty years ago 99.99% of Japanese students completed by grade 9
what would be called in this country both an Algebra 1 and a Geometry course. Further, at least
95.1% of them completed this content successfully, because they were allowed to continue to
secondary school. This shows that teaching Algebra 1 to the whole 8th grade cohort, or teaching
Algebra 1 and Geometry to the whole grades 8-9 cohort, is eminently possible.
As already mentioned, in 1997 California adopted standards that attempted to prepare all
students in K-7 to take an Algebra class by grade 8. Yet California realized that such a major
change cannot happen overnight, and it emphasized that only “students who have mastered
foundational skills, as indicated by good performance on the algebra readiness test, would take
algebra in the eighth grade.”11
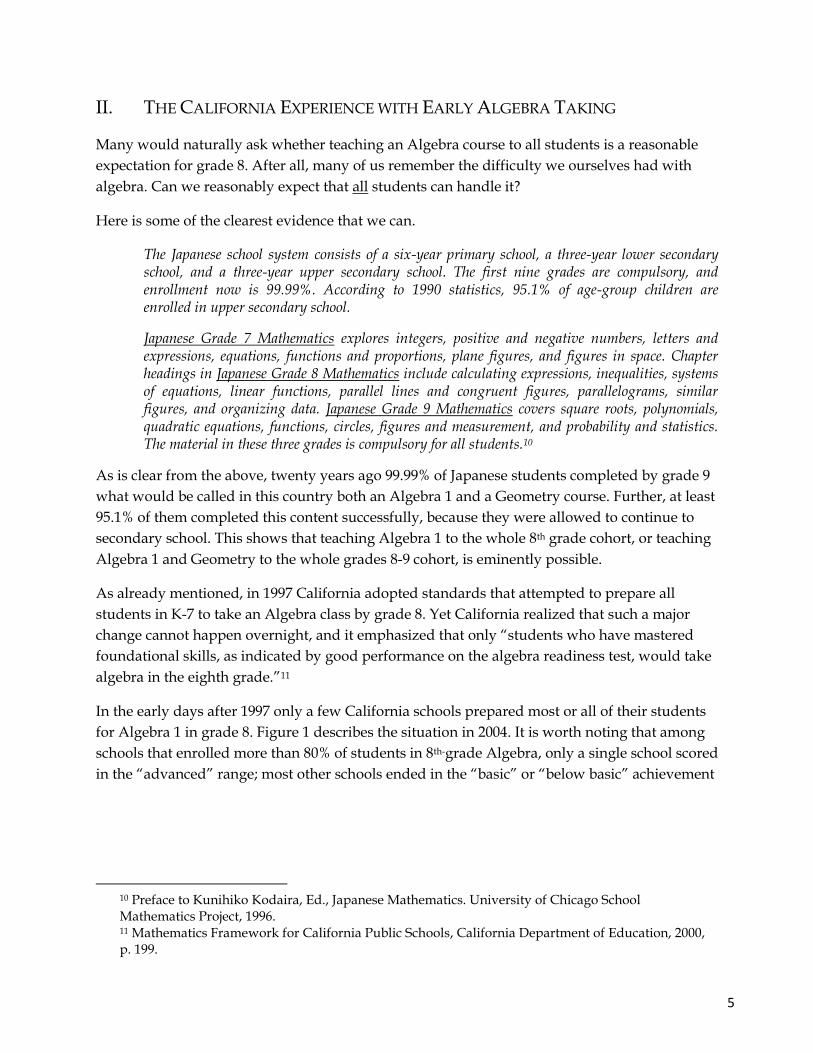
In the early days after 1997 only a few California schools prepared most or all of their students
for Algebra 1 in grade 8. Figure 1 describes the situation in 2004. It is worth noting that among
schools that enrolled more than 80% of students in 8th-grade Algebra, only a single school scored
in the “advanced” range; most other schools ended in the “basic” or “below basic” achievement
10 Preface to Kunihiko Kodaira, Ed., Japanese Mathematics. University of Chicago School Mathematics Project, 1996. 11 Mathematics Framework for California Public Schools, California Department of Education, 2000, p. 199.
6
range. The majority of schools enrolled less than half of their students in Algebra by grade 8,
and their achievement centered on the boundary between basic and proficient.12
Figure 1
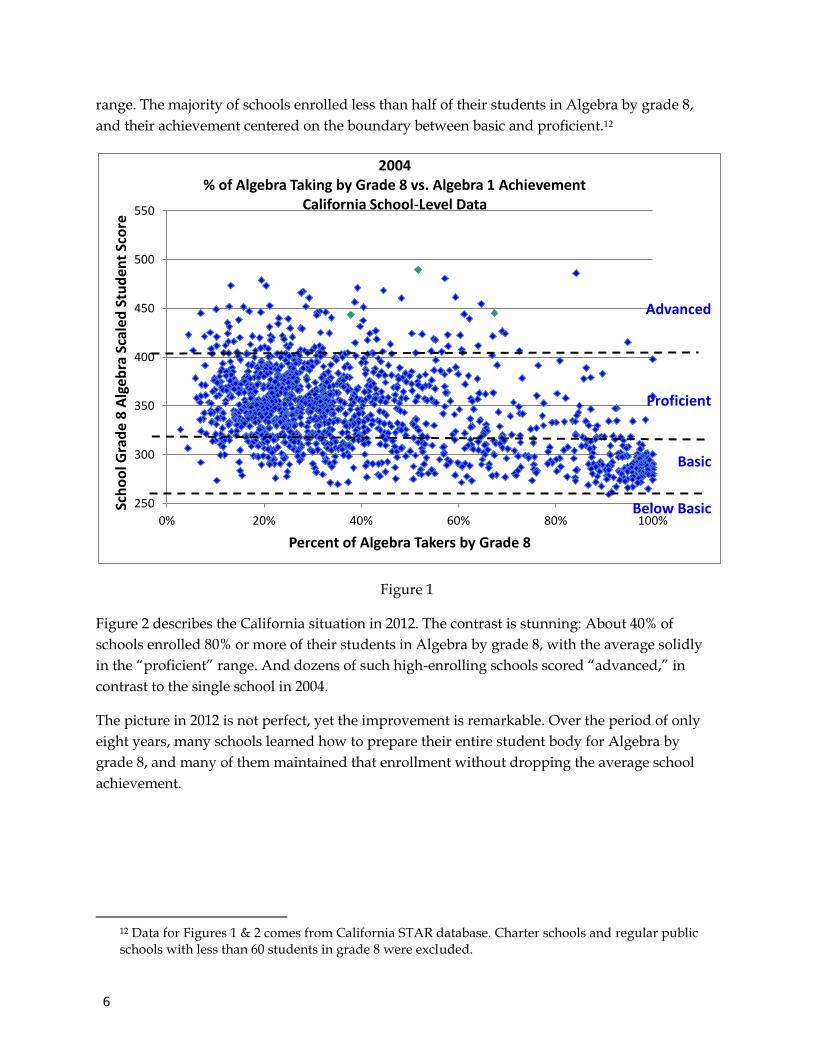
Figure 2 describes the California situation in 2012. The contrast is stunning: About 40% of
schools enrolled 80% or more of their students in Algebra by grade 8, with the average solidly
in the “proficient” range. And dozens of such high-enrolling schools scored “advanced,” in
contrast to the single school in 2004.
The picture in 2012 is not perfect, yet the improvement is remarkable. Over the period of only
eight years, many schools learned how to prepare their entire student body for Algebra by
grade 8, and many of them maintained that enrollment without dropping the average school
achievement.
12 Data for Figures 1 & 2 comes from California STAR database. Charter schools and regular public schools with less than 60 students in grade 8 were excluded.
250
300
350
400
450
500
550
0% 20% 40% 60% 80% 100%
Sch
oo
l Gra
de
8 A
lgeb
ra S
cale
d S
tud
ent
Sco
re
Percent of Algebra Takers by Grade 8
2004 % of Algebra Taking by Grade 8 vs. Algebra 1 Achievement
California School-Level Data
Basic
Proficient
Advanced
Below Basic
7
Figure 2
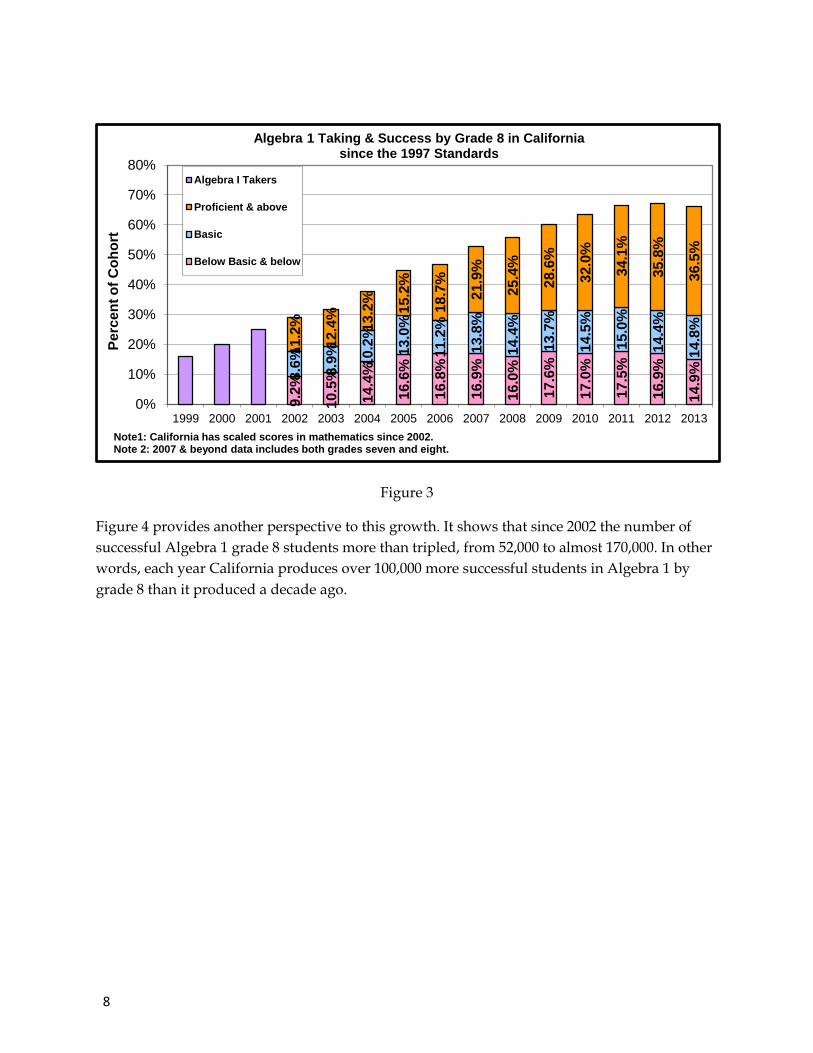
That was the picture regarding schools. Figure 3 shows the Algebra-1-by-grade-8 taking of the
overall student cohorts in California since 1999, when only 16% of the cohort took Algebra by
grade 8. Since then, the number of students taking Algebra 1 by grade 8 more than quadrupled
to 67%. Yet despite this enormous increase, the fraction of successful students scoring
“proficient” and “advanced” kept increasing from 11% in 2002, the first year that scaled scores
were available, to over 36% in 2013. Also notable is the fact that there was only minimal growth
in students scoring “basic” and “below basic” over that period.
250
300
350
400
450
500
550
0% 20% 40% 60% 80% 100%
Sch
oo
l Gra
de
8 A
lgeb
ra S
cale
d S
tud
ent
Sco
re
Percent of Algebra Takers by Grade 8
2012 % of Algebra Taking by Grade 8 vs. Algebra 1 Achievement
California School-Level Data
Advanced
Proficient
Basic
Below Basic
8
Figure 3
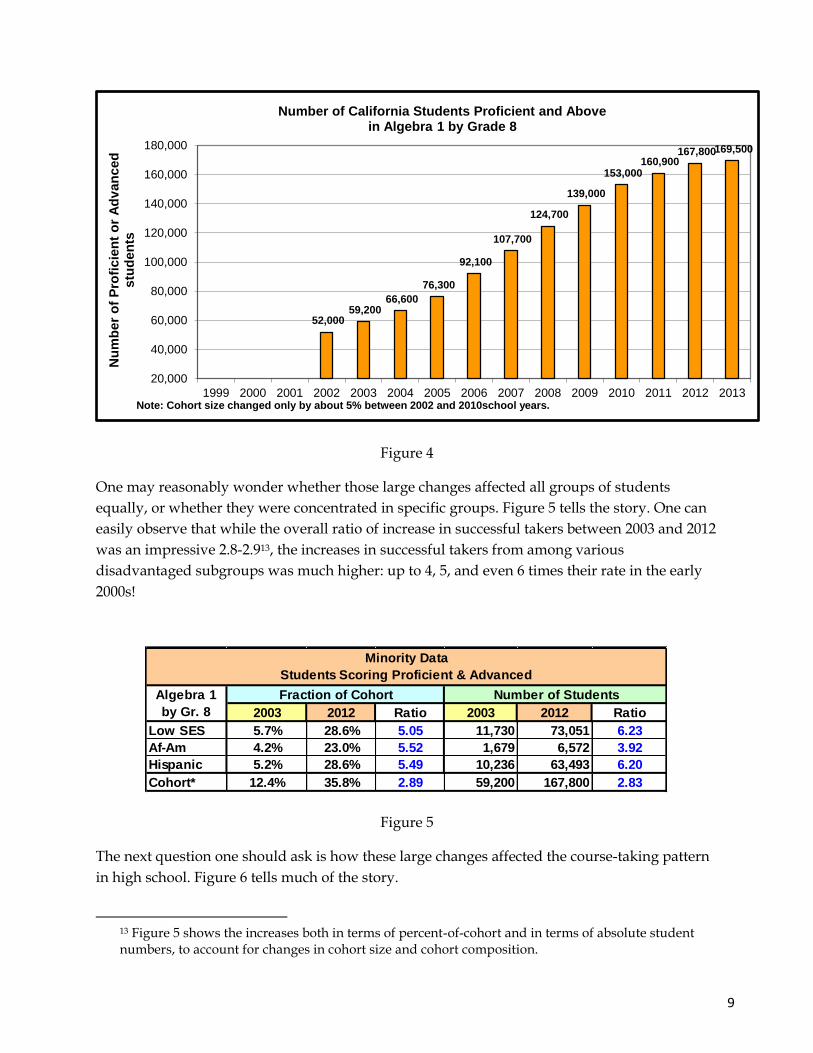
Figure 4 provides another perspective to this growth. It shows that since 2002 the number of
successful Algebra 1 grade 8 students more than tripled, from 52,000 to almost 170,000. In other
words, each year California produces over 100,000 more successful students in Algebra 1 by
grade 8 than it produced a decade ago.
9.2
%
10.5
%
14.4
%
16.6
%
16.8
%
16.9
%
16.0
%
17.6
%
17.0
%
17.5
%
16.9
%
14.9
%
8.6
%
8.9
%
10.2
%
13.0
%
11.2
%
13.8
%
14.4
%
13.7
%
14.5
%
15.0
%
14.4
%
14.8
%
11.2
%
12.4
%
13.2
%
15.2
%
18.7
%
21.9
%
25.4
%
28.6
%
32.0
%
34.1
%
35.8
%
36.5
%
0%
10%
20%
30%
40%
50%
60%
70%
80%
1999 2000 2001 2002 2003 2004 2005 2006 2007 2008 2009 2010 2011 2012 2013
Pe
rce
nt
of
Co
ho
rt
Algebra 1 Taking & Success by Grade 8 in California since the 1997 Standards
Algebra I Takers
Proficient & above
Basic
Below Basic & below
Note1: California has scaled scores in mathematics since 2002. Note 2: 2007 & beyond data includes both grades seven and eight.
9
Figure 4
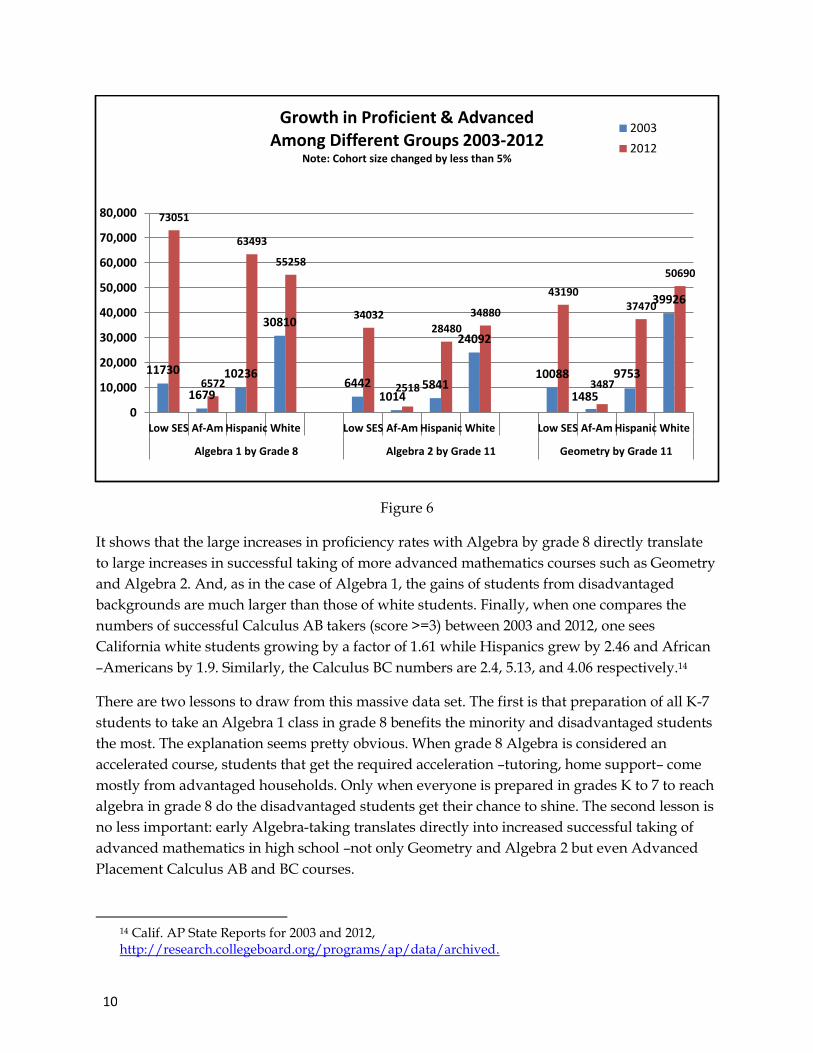
One may reasonably wonder whether those large changes affected all groups of students
equally, or whether they were concentrated in specific groups. Figure 5 tells the story. One can
easily observe that while the overall ratio of increase in successful takers between 2003 and 2012
was an impressive 2.8-2.913, the increases in successful takers from among various
disadvantaged subgroups was much higher: up to 4, 5, and even 6 times their rate in the early
2000s!
Figure 5
The next question one should ask is how these large changes affected the course-taking pattern
in high school. Figure 6 tells much of the story.
13 Figure 5 shows the increases both in terms of percent-of-cohort and in terms of absolute student numbers, to account for changes in cohort size and cohort composition.
52,000 59,200
66,600
76,300
92,100
107,700
124,700
139,000
153,000 160,900
167,800 169,500
20,000
40,000
60,000
80,000
100,000
120,000
140,000
160,000
180,000
1999 2000 2001 2002 2003 2004 2005 2006 2007 2008 2009 2010 2011 2012 2013
Nu
mb
er
of
Pro
ficie
nt
or
Ad
van
ced
stu
den
ts
Number of California Students Proficient and Above in Algebra 1 by Grade 8
Note: Cohort size changed only by about 5% between 2002 and 2010school years.
2003 2012 Ratio 2003 2012 Ratio
Low SES 5.7% 28.6% 5.05 11,730 73,051 6.23
Af-Am 4.2% 23.0% 5.52 1,679 6,572 3.92
Hispanic 5.2% 28.6% 5.49 10,236 63,493 6.20
Cohort* 12.4% 35.8% 2.89 59,200 167,800 2.83
Algebra 1
by Gr. 8
Minority Data
Students Scoring Proficient & Advanced
Number of StudentsFraction of Cohort
10
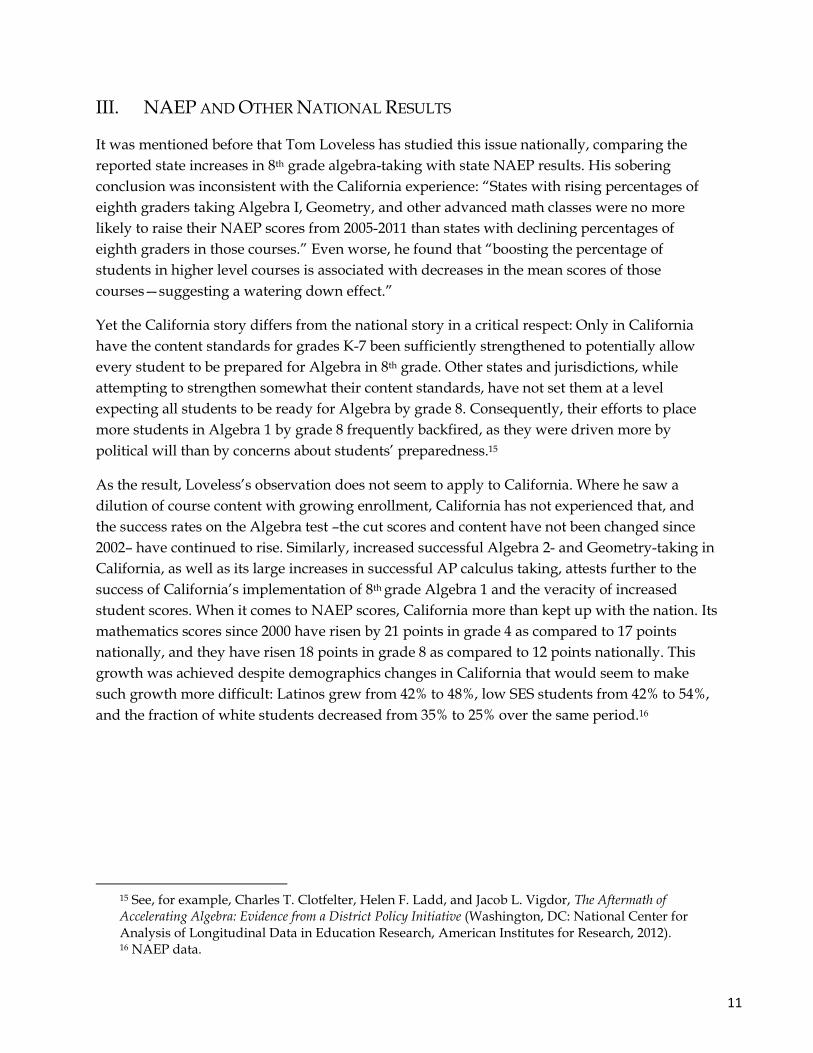
Figure 6
It shows that the large increases in proficiency rates with Algebra by grade 8 directly translate
to large increases in successful taking of more advanced mathematics courses such as Geometry
and Algebra 2. And, as in the case of Algebra 1, the gains of students from disadvantaged
backgrounds are much larger than those of white students. Finally, when one compares the
numbers of successful Calculus AB takers (score >=3) between 2003 and 2012, one sees
California white students growing by a factor of 1.61 while Hispanics grew by 2.46 and African
–Americans by 1.9. Similarly, the Calculus BC numbers are 2.4, 5.13, and 4.06 respectively.14
There are two lessons to draw from this massive data set. The first is that preparation of all K-7
students to take an Algebra 1 class in grade 8 benefits the minority and disadvantaged students
the most. The explanation seems pretty obvious. When grade 8 Algebra is considered an
accelerated course, students that get the required acceleration –tutoring, home support– come
mostly from advantaged households. Only when everyone is prepared in grades K to 7 to reach
algebra in grade 8 do the disadvantaged students get their chance to shine. The second lesson is
no less important: early Algebra-taking translates directly into increased successful taking of
advanced mathematics in high school –not only Geometry and Algebra 2 but even Advanced
Placement Calculus AB and BC courses.
14 Calif. AP State Reports for 2003 and 2012, http://research.collegeboard.org/programs/ap/data/archived.
11730
1679
10236
30810
6442 1014
5841
24092
10088
1485
9753
39926
73051
6572
63493
55258
34032
2518
28480
34880
43190
3487
37470
50690
0
10,000
20,000
30,000
40,000
50,000
60,000
70,000
80,000
Low SES Af-Am Hispanic White Low SES Af-Am Hispanic White Low SES Af-Am Hispanic White
Algebra 1 by Grade 8 Algebra 2 by Grade 11 Geometry by Grade 11
Growth in Proficient & Advanced Among Different Groups 2003-2012
Note: Cohort size changed by less than 5%
2003
2012
11
III. NAEP AND OTHER NATIONAL RESULTS
It was mentioned before that Tom Loveless has studied this issue nationally, comparing the
reported state increases in 8th grade algebra-taking with state NAEP results. His sobering
conclusion was inconsistent with the California experience: “States with rising percentages of
eighth graders taking Algebra I, Geometry, and other advanced math classes were no more
likely to raise their NAEP scores from 2005-2011 than states with declining percentages of
eighth graders in those courses.” Even worse, he found that “boosting the percentage of
students in higher level courses is associated with decreases in the mean scores of those
courses—suggesting a watering down effect.”
Yet the California story differs from the national story in a critical respect: Only in California
have the content standards for grades K-7 been sufficiently strengthened to potentially allow
every student to be prepared for Algebra in 8th grade. Other states and jurisdictions, while
attempting to strengthen somewhat their content standards, have not set them at a level
expecting all students to be ready for Algebra by grade 8. Consequently, their efforts to place
more students in Algebra 1 by grade 8 frequently backfired, as they were driven more by
political will than by concerns about students’ preparedness.15
As the result, Loveless’s observation does not seem to apply to California. Where he saw a
dilution of course content with growing enrollment, California has not experienced that, and
the success rates on the Algebra test –the cut scores and content have not been changed since
2002– have continued to rise. Similarly, increased successful Algebra 2- and Geometry-taking in
California, as well as its large increases in successful AP calculus taking, attests further to the
success of California’s implementation of 8th grade Algebra 1 and the veracity of increased
student scores. When it comes to NAEP scores, California more than kept up with the nation. Its
mathematics scores since 2000 have risen by 21 points in grade 4 as compared to 17 points
nationally, and they have risen 18 points in grade 8 as compared to 12 points nationally. This
growth was achieved despite demographics changes in California that would seem to make
such growth more difficult: Latinos grew from 42% to 48%, low SES students from 42% to 54%,
and the fraction of white students decreased from 35% to 25% over the same period.16
15 See, for example, Charles T. Clotfelter, Helen F. Ladd, and Jacob L. Vigdor, The Aftermath of Accelerating Algebra: Evidence from a District Policy Initiative (Washington, DC: National Center for Analysis of Longitudinal Data in Education Research, American Institutes for Research, 2012). 16 NAEP data.
12
IV. COMMON CORE MATHEMATICS STANDARDS’ IMPLICATIONS FOR THE
DISADVANTAGED
Despite all the acknowledgments of the importance of teaching Algebra in grade 8 from Robert
Moses and Zalman Usiskin, despite the similar recommendation of the National Mathematics
Advisory Panel, and despite Common Core’s promise in its Benchmarking for Success report, the
Common Core standards emerged in the summer of 2010 with their Algebra 1 course firmly
planted in the high school.17 Moreover, if one examines the totality of the Common Core high
school standards, one sees diluted content for Geometry and Algebra 2 courses and insufficient
content even for a solid trigonometry course, let alone pre-calculus. Jason Zimba, one of the lead
authors of the Common Core standards, freely acknowledges this fact.18 Furthermore, a student
who starts an authentic Algebra 1 course in grade 9 (or completes it by the end of grade 9) is
unlikely to complete pre-calculus following the path Common Core prescribes, even if pre-
calculus content were included in the Common Core.
In some sense this is more than strange. Preparedness for STEM and maintaining American
competitiveness was the major rallying cry for the supposedly rigorous Common Core
standards. As we have seen, our competitors do teach their students authentic Algebra 1 prior
to or in grade 8, and so many of them come here to study in college that they already make up a
majority in many graduate STEM programs. Further, we know that fewer than one out of six
students who do not reach a pre-calculus course in high school will complete a STEM degree.19
It boggles the mind that after all the rhetoric of “rigor” and “international competitiveness,” the
best the Common Core offers in terms of preparing American students for college is less than
what has been already offered by many states over the last decade or more.
But the true travesty of the Common Core is its failure to deliver on its promise of a genuine
Algebra course in grade 8, and the devastating impact that failure is bound to have on the
achievement of minorities and disadvantaged students. Although politicians and
administrators in many states promise to allow “acceleration” and to retain the 8th grade
Algebra courses they currently have, these are empty promises. Few, if any, schools will offer
acceleration beyond the Common Core in the early grades, because the national Common Core
tests will assess only the grade-level Common Core content at each grade in grades 3-8. As in
California in the 1990s, such acceleration will be overwhelmingly provided through paid
17 One should not confuse an authentic Algebra 1 course with some algebraic content present in most/all elementary grades. Most state standards, as well as the Common Core, have algebra-related content strands often starting from Kindergarten, and Common Core supporters frequently confuse the two. Yet Appendix A of Common Core mathematics contains an explicit Algebra I course description destined for the first year of high school. 18 S. Carr, Teachers Feel Urgency of Common Core Standards, The Advocate, 9/4/2013. http://theadvocate.com/home/6914390-125/common-core 19 STEM in Postsecondary Education, National Center for Education Statistics (NCES-2013-152), October 2012.
13
tutoring by affluent families of students attending public schools. The biggest victims of this
reversal will be the poor and the disadvantaged. Their families tend not to be able to afford the
extra-curricular tutoring.
The result? Most grade 8 Algebra 1 classes in poor schools will soon close, when the pipeline of
prepared students coming out of K-7 dries up, and STEM-bound students will come almost
exclusively from advantaged backgrounds, whether in private or public schools. This will be
the legacy of Common Core.
V. CONCLUDING REMARKS
The national standards movement justified its emergence arguing that many state standards
embody low academic expectations, are non-competitive in the international marketplace, and
place American students and the American economy at a disadvantage. It promised rigorous
and internationally-benchmarked standards that would increase STEM preparedness of
American students and improve our competitive posture.
Unfortunately, these promises were unfulfilled when the mathematics standards emerged in
June 2010. Not only have they not improved the rigor of the high school curriculum, but in
many cases they have severely retarded the progress states have made over the last decade or
more. The biggest and most obvious sign of this lowering of expectations is Common Core’s
placement of an authentic Algebra 1 course in grade 9 rather than grade 8. This runs contrary to
what our international competitors do, what many mathematics education reformers have been
promoting in this country for three decades, and what the national standards movement itself
explicitly promised in its 2008 manifesto Benchmarking for Success. Not only will a delayed
Algebra placement—and its generally low high school expectations—not increase American
high school STEM preparedness, it will also likely sharply reduce it.
But the cruelest irony of the Common Core mathematics is in the huge negative impact it is
bound to have on the achievement of minority and disadvantaged students. Those are precisely
the students who need rigorous expectations from early elementary grades within their regular
curriculum, as they are less likely to get family or paid extra-curricular support. Massive and
robust data from the California experiment over the last 15 years clearly demonstrates this fact.
Yet despite its soaring rhetoric of college-readiness for all, the Common Core has abandoned
precisely these students.
14
ABOUT THE AUTHOR
Ze’ev Wurman is visiting scholar at the Hoover Institution. Between 2007 and 2009 he served as
a senior policy adviser with the Office of Planning, Evaluation, and Policy Development at the
U.S. Department of Education. Wurman served as a commissioner on the California Academic
Content Standards Commission that in 2010 evaluated the Common Core’s suitability for
California adoption.
ABOUT AMERICAN PRINCIPLES PROJECT
The American Principles Project is a 501(c)(3) organization dedicated to preserving and
propagating the fundamental principles on which our country was founded - universal
principles, embracing the notion that we are all created equal, endowed by our Creator with
certain unalienable rights, and among these are life, liberty, and the pursuit of happiness.