Embed Size (px)
Citation preview

October 2000
Emigration of Natural & Hatchery Chinook Salmon& Steelhead Smolts from the Imnaha River, OregonTHIS IS INVISIBLE TEXT TO KEEP VERTICAL
ALIGNMENT
October 14, 1997 to June 16, 1998THIS IS INVISIBLE TEXT TO KEEP VERTICAL ALIGNMENT THIS IS INVISIBLE TEXT TO KEEP VERTICAL ALIGNMENT THIS IS INVISIBLE TEXT TO KEEP VERTICAL ALIGNMENT THIS IS INVISIBLE TEXT TO KEEP VERTICAL ALIGNMENT
Annual Report 1998
DOE/BP-30423-5

This report was funded by the Bonneville Power Administration (BPA), U.S. Department of Energy, aspart of BPA's program to protect, mitigate, and enhance fish and wildlife affected by the developmentand operation of hydroelectric facilities on the Columbia River and its tributaries. The views of thisreport are the author's and do not necessarily represent the views of BPA.
This document should be cited as follows: Cleary, Peter J., Michael L. Blenden, Paul A. Kucera - Nez Perce Tribe, Department of Fisheries ResourcesManagement, Emigration of Natural & Hatchery Chinook Salmon & Steelhead Smolts from the Imnaha River, Oregon,October 14, 1997 to June 16, 1998, 1998 Annual Report, Report to Bonneville Power Administration, Contract No.1997AM30423, Project No. 1997-015-01, 150 electronic pages (BPA Report DOE/BP-30423-5)
This report and other BPA Fish and Wildlife Publications are available on the Internet at:
http://www.efw.bpa.gov/cgi-bin/efw/FW/publications.cgi
For other information on electronic documents or other printed media, contact or write to:
Bonneville Power AdministrationEnvironment, Fish and Wildlife Division
P.O. Box 3621905 N.E. 11th Avenue
Portland, OR 97208-3621
Please include title, author, and DOE/BP number in the request.

Emigration of Natural & Hatchery Chinook Salmon & SteelheadSmolts from the Imnaha River, Oregon
October 14, 1997 to June 16, 1998
1998 Annual Report
Prepared by:Peter J. Cleary
Michael L. BlendenPaul A. Kucera
Nez Perce TribeDepartment of Fisheries Resources Management
Lapwai, Idaho 83540
Prepared for:U.S. Department of Energy
Bonneville Power AdministrationEnvironment, Fish and Wildlife
P.O. Box 3621Portland, Oregon 97208-3621
andU.S. Fish and Wildlife Service
Lower Snake River Compensation PlanProgram Office
1387 Vinnell WayBoise, Idaho 83709
Cooperative Agreement 1448-1410-98-J004
Project Number: 97-015-01Contract Number: 97AM30423
Task Order Number: 98AT00792
October 2000

i
ABSTRACT
The Nez Perce Tribe has conducted emigration studies in the Imnaha River for sevenyears and has participated in the smolt monitoring program for the fifth consecutive year. Emigration studies were conducted for the purpose of the Lower Snake River CompensationPlan’s hatchery evaluation and to collect information for the Fish Passage Center’s (FPC) SmoltMonitoring Program; a basin-wide effort in the Columbia and Snake rivers. Rotary screw trapswere used to capture emigrating juvenile chinook salmon and steelhead smolts at two sites, atriver kilometer (rkm) 74 and 7, during the fall from October 14 to December 19. Rotary screwtraps were fished during the spring from February 26 to June 16 at the lower site. Fish weretagged with PIT (passive integrated transponders) tags. PIT tagged fish were detected migratingpast interrogation sites in the Snake and Columbia rivers and survival was estimated with theSurvival Using Proportional Hazards model (program SURPH).
Imnaha River mean discharge during the fall ranged from 4.1 cms on December 3 to 9.5cms on October 31 and the average daily water temperature ranged from 0.2 /C on December 5to 10.7 /C on October 18. Imnaha River mean daily discharge during spring emigration rangedfrom 5.6 cms on March 11 to 168.9 cms on May 26 and water temperatures ranged from 2.7 /Con February 28 to 11.4/C on May 20. The Snake River mean daily discharge ranged from 916cms (32,300 cfs) on March 9 to 4,672 cms (165,000 cfs) on May 27 and water temperaturesranged from 5.2/C on February 28 to 15.9 /C on June 14. Begining spill dates in the LowerSnake River ranged from March 5 at Ice Harbor Dam to March 24 at Lower Granite Dam. Continuous spill at LGR occurred from April 6 to June 21.
The fall catch totaled 2,232 natural chinook salmon and 24 natural steelhead at the uppertrap site and 1,156 natural chinook salmon and 123 natural steelhead at the lower trap site. Thespring trap catch totaled 4,195 natural chinook salmon, 17,837 hatchery chinook salmon, 3,569natural steelhead, and 5,141 hatchery steelhead. A total of 93,127 hatchery chinook salmon werereleased from the chinook acclimation facility on April 6. There were two separate releases ofhatchery steelhead of 86,422 and 30,674 fish occurring on April 26 and May 19 from the LittleSheep Creek Acclimation Facility. The fall catch of natural chinook salmon peaked at the upperand lower sites on October 22 and October 24, respectively. The spring catch of natural chinooksalmon, hatchery chinook salmon, natural steelhead, and hatchery steelhead peaked on March 18,April 9, April 23, and April 27, respectively. Natural chinook salmon were captured throughoutthe entire study period. Ninety-seven percent of the sampled hatchery chinook salmon werecaptured within 11 days after release and capture dates ranged from April 7 to May 22. Naturalsteelhead were captured from March 10 to June 11. Hatchery steelhead were captured fromMarch 22 to June 16.
PIT tagged fish interrogated (recaptured) at rkm 7 (lower trap) during the springemigration totaled 150 natural chinook salmon, 3,371 hatchery chinook salmon, and 20 hatcherysteelhead. Estimated, in-river, post-release survival of hatchery chinook salmon smolts fromrelease at the acclimation facility to the lower trap was 88.4% based on PIT tag recaptures. Thisin-river survival estimate of hatchery chinook salmon from the acclimation site to the lower trap

ii
was the lowest recorded since 1994.
Estimated season-wide survival of natural chinook salmon from release at the upper andlower sites during the fall was 45.9% and 60.4%, respectively. Season-wide survival of naturalchinook salmon, hatchery chinook salmon, natural steelhead, and hatchery steelhead, fromrelease at the lower trap site during the spring to Lower Granite Dam was estimated as follows:85.2%, 75.7%, 86.0%, and 82.9%, respectively. The survival estimates for natural and hatcherychinook salmon were within the range of past estimates, and the cumulative interrogationpercentages of unique PIT tags at Lower Granite Dam, Little Goose Dam, Lower MonumentalDam, and McNary Dam were also within the range of past observations. The estimated survivalfor hatchery steelhead was the highest observed since 1995.
Weekly survival estimates from release during the spring to Lower Monumental Dam fornatural chinook salmon ranged from 71.9 to 78.1%. Weekly survival estimates from release toLower Monumental Dam for hatchery chinook salmon were 58.4% and 72.4%. Weekly survivalestimates from release to Lower Monumental Dam for natural steelhead ranged from 60.6% to74.9%. Weekly survival estimates from release to Lower Monumental Dam for hatcherysteelhead were 63.9% and 57.5%.
Arrival times of natural chinook salmon tagged in the fall at the upper and lower ImnahaRiver trap sites at Lower Granite Dam, ranged from March 27 to June 6. The 90% arrival timefor each group was May 9 and April 24, respectively. Natural chinook salmon tagged in thespring (lower site) had arrival times ranging from April 1 to June 27 at Lower Granite Dam and90% arrived by May 6. The range of arrival dates at Lower Granite Dam for hatchery chinooksalmon, natural steelhead, and hatchery steelhead were April 15-May 22, April 2-June 12, andApril 25-July 29, and 90% percent arrived at Lower Granite Dam on May 9, May 22, and May26, respectively.
Mean weekly travel times of natural chinook to Lower Granite Dam ranged from 8 to 29days. Hatchery chinook traveled to Lower Granite Dam in 25 days during the week of April 5and 26 days during the week of April 12. Natural chinook had significantly faster travel times toLower Granite Dam than hatchery chinook during the week of April 12. The range of meanweekly travel times of natural steelhead to Lower Granite Dam was 3.6 to 37.7 days. The rangeof mean weekly travel times of hatchery steelhead to Lower Granite Dam was 2.4 to 7.7 days.Natural steelhead released during the weeks of April 26 and May 17 had significantly fastertravel times to Lower Granite Dam than hatchery steelhead.

iii
TABLE OF CONTENTS
ABSTRACT . . . . . . . . . . . . . . . . . . . . . . . . . . . . . . . . . . . . . . . . . . . . . . . . . . . . . . . . . . . . . . . . . . i
TABLE OF CONTENTS . . . . . . . . . . . . . . . . . . . . . . . . . . . . . . . . . . . . . . . . . . . . . . . . . . . . . . . iii
LIST OF TABLES . . . . . . . . . . . . . . . . . . . . . . . . . . . . . . . . . . . . . . . . . . . . . . . . . . . . . . . . . . . . . v
LIST OF FIGURES . . . . . . . . . . . . . . . . . . . . . . . . . . . . . . . . . . . . . . . . . . . . . . . . . . . . . . . . . . vii
APPENDIX TABLES AND FIGURES . . . . . . . . . . . . . . . . . . . . . . . . . . . . . . . . . . . . . . . . . . . . x
INTRODUCTION . . . . . . . . . . . . . . . . . . . . . . . . . . . . . . . . . . . . . . . . . . . . . . . . . . . . . . . . . . . . . 1
METHODS . . . . . . . . . . . . . . . . . . . . . . . . . . . . . . . . . . . . . . . . . . . . . . . . . . . . . . . . . . . . . . . . . . 2Study Area Description . . . . . . . . . . . . . . . . . . . . . . . . . . . . . . . . . . . . . . . . . . . . . . . . . . . 2Equipment Description . . . . . . . . . . . . . . . . . . . . . . . . . . . . . . . . . . . . . . . . . . . . . . . . . . . 2Trap Operations . . . . . . . . . . . . . . . . . . . . . . . . . . . . . . . . . . . . . . . . . . . . . . . . . . . . . . . . . 5Trap Efficiencies . . . . . . . . . . . . . . . . . . . . . . . . . . . . . . . . . . . . . . . . . . . . . . . . . . . . . . . . 6Biological Characteristics . . . . . . . . . . . . . . . . . . . . . . . . . . . . . . . . . . . . . . . . . . . . . . . . . 7PIT Tagging . . . . . . . . . . . . . . . . . . . . . . . . . . . . . . . . . . . . . . . . . . . . . . . . . . . . . . . . . . . . 7Smolt Yield . . . . . . . . . . . . . . . . . . . . . . . . . . . . . . . . . . . . . . . . . . . . . . . . . . . . . . . . . . . . 8Survival Estimation . . . . . . . . . . . . . . . . . . . . . . . . . . . . . . . . . . . . . . . . . . . . . . . . . . . . . . 8Travel Timing to Trap Site and Lower Snake River Dams . . . . . . . . . . . . . . . . . . . . . . . . 9
RESULTS AND DISCUSSION . . . . . . . . . . . . . . . . . . . . . . . . . . . . . . . . . . . . . . . . . . . . . . . . . 10Imnaha and Snake River Discharge, Temperature and Spill . . . . . . . . . . . . . . . . . . . . . . 10Trap Operation . . . . . . . . . . . . . . . . . . . . . . . . . . . . . . . . . . . . . . . . . . . . . . . . . . . . . . . . . 10Emigration Timing and Trends at Trap Site . . . . . . . . . . . . . . . . . . . . . . . . . . . . . . . . . . 12Biological Characteristics . . . . . . . . . . . . . . . . . . . . . . . . . . . . . . . . . . . . . . . . . . . . . . . . 22PIT Tag Release Groups . . . . . . . . . . . . . . . . . . . . . . . . . . . . . . . . . . . . . . . . . . . . . . . . . 27Emigration Timing and Trends of Previously PIT Tagged Fish . . . . . . . . . . . . . . . . . . . 31Smolt Yield . . . . . . . . . . . . . . . . . . . . . . . . . . . . . . . . . . . . . . . . . . . . . . . . . . . . . . . . . . . 31Estimated Smolt Survival . . . . . . . . . . . . . . . . . . . . . . . . . . . . . . . . . . . . . . . . . . . . . . . . 34Arrival Timing . . . . . . . . . . . . . . . . . . . . . . . . . . . . . . . . . . . . . . . . . . . . . . . . . . . . . . . . . 43Travel Times . . . . . . . . . . . . . . . . . . . . . . . . . . . . . . . . . . . . . . . . . . . . . . . . . . . . . . . . . . 50Mortality . . . . . . . . . . . . . . . . . . . . . . . . . . . . . . . . . . . . . . . . . . . . . . . . . . . . . . . . . . . . . . 52Incidental Catch . . . . . . . . . . . . . . . . . . . . . . . . . . . . . . . . . . . . . . . . . . . . . . . . . . . . . . . . 54
SUMMARY . . . . . . . . . . . . . . . . . . . . . . . . . . . . . . . . . . . . . . . . . . . . . . . . . . . . . . . . . . . . . . . . . 54
ACKNOWLEDGMENTS . . . . . . . . . . . . . . . . . . . . . . . . . . . . . . . . . . . . . . . . . . . . . . . . . . . . . . 59

iv
LITERATURE CITED . . . . . . . . . . . . . . . . . . . . . . . . . . . . . . . . . . . . . . . . . . . . . . . . . . . . . . . . 60
Appendix A . . . . . . . . . . . . . . . . . . . . . . . . . . . . . . . . . . . . . . . . . . . . . . . . . . . . . . . . . . . . . . . . . 62
Appendix B . . . . . . . . . . . . . . . . . . . . . . . . . . . . . . . . . . . . . . . . . . . . . . . . . . . . . . . . . . . . . . . . . 70
Appendix C . . . . . . . . . . . . . . . . . . . . . . . . . . . . . . . . . . . . . . . . . . . . . . . . . . . . . . . . . . . . . . . . . 77
Appendix D . . . . . . . . . . . . . . . . . . . . . . . . . . . . . . . . . . . . . . . . . . . . . . . . . . . . . . . . . . . . . . . . . 83
Appendix E . . . . . . . . . . . . . . . . . . . . . . . . . . . . . . . . . . . . . . . . . . . . . . . . . . . . . . . . . . . . . . . . . 87
Appendix F . . . . . . . . . . . . . . . . . . . . . . . . . . . . . . . . . . . . . . . . . . . . . . . . . . . . . . . . . . . . . . . . . . 91
Appendix G . . . . . . . . . . . . . . . . . . . . . . . . . . . . . . . . . . . . . . . . . . . . . . . . . . . . . . . . . . . . . . . . . 94
Appendix H . . . . . . . . . . . . . . . . . . . . . . . . . . . . . . . . . . . . . . . . . . . . . . . . . . . . . . . . . . . . . . . . 101
Appendix I . . . . . . . . . . . . . . . . . . . . . . . . . . . . . . . . . . . . . . . . . . . . . . . . . . . . . . . . . . . . . . . . . 108
Appendix J . . . . . . . . . . . . . . . . . . . . . . . . . . . . . . . . . . . . . . . . . . . . . . . . . . . . . . . . . . . . . . . . . 111
Appendix K . . . . . . . . . . . . . . . . . . . . . . . . . . . . . . . . . . . . . . . . . . . . . . . . . . . . . . . . . . . . . . . . 113
Appendix L . . . . . . . . . . . . . . . . . . . . . . . . . . . . . . . . . . . . . . . . . . . . . . . . . . . . . . . . . . . . . . . . 119
Appendix M . . . . . . . . . . . . . . . . . . . . . . . . . . . . . . . . . . . . . . . . . . . . . . . . . . . . . . . . . . . . . . . . 121

v
LIST OF TABLES
Table 1. The targeted positions of the Imnaha traps for staff gauge heights from February 26 toJune 16, 1998...................................................................................................................................6
Table 2. Dates the screw traps were not operated during the spring study period, February 27-28and March 4 -June 16, 1998...........................................................................................................12
Table 3. Summary of the weekly catch of species caught in the Imnaha screw trap during thespring of 1998. Chinook salmon and steelhead of unknown origin (n = 47) were omitted........13
Table 4. The number and date of hatchery chinook salmon and steelhead released into the ImnahaRiver, with the number PIT tagged, and type of additional external and internal marks, in1998................................................................................................................................................14
Table 5. Mean and range of fork length (mm), weight (g), and condition factor for natural andhatchery chinook salmon and steelhead smolts collected at the Imnaha River screw trap fromOctober 14 to December 19, 1997 and February 26-27 and March 4 to June 16, 1998................24
Table 6. Weekly numbers of PIT tagged natural chinook salmon released into the Imnaha Riverfrom the upper and lower Imnaha screw traps from October 15 to December 19, 1997 ..............29
Table 7. Weekly numbers of PIT tagged fish released into the Imnaha River from the lowerImnaha screw trap from February 26 to June 16, 1998 ................................................................29
Table 8. Mean and range of fork length (mm), weight (g), and condition factor for natural andhatchery chinook salmon and steelhead smolts collected and PIT tagged at the Imnaha Riverscrew trap from February 26 to June 16, 1998...............................................................................30
Table 9. The mean trap efficiency, PIT tag interrogation percentage and estimated survival fromrelease to trap (bootstrap and SURPH) and release to Lower Granite Dam (LGR) for hatcherychinook salmon smolts from 1994 to 1998....................................................................................34
Table 10. Season-wide survival estimates from the upper and lower traps to Lower Granite Dam(LGR), Lower Granite Dam to Little Goose Dam, (LGO), Little Goose Dam to LowerMonumental Dam (LMO), and Lower Monumental Dam to McNary Dam (MCN) for fishreleased from October 14 to December 16, 1997 at the upper and lower Imnaha traps andFebruary 26 to June 16 at the lower trap........................................................................................35

vi
Table 11. Estimated survival probabilities for salmonid smolts released from the lower ImnahaRiver trap from February 26 to June 16, 1998 with 95% confidence limits in parentheses. Estimates are from release to the tail race for the trap to Lower Granite Dam and tailrace to thetail race for all other sites. Abbreviations: LGR-Lower Granite Dam, LGO-Little Goose Dam,LMO-Lower Monumental Dam.....................................................................................................41
Table 12. Arrival timing of PIT tagged Imnaha River natural chinook salmon smolts at LowerGranite, Little Goose, Lower Monumental, and McNary dams from 1993 to1998.......................44
Table 13. Arrival timing of PIT tagged Imnaha River hatchery chinook salmon smolts at LowerGranite, Little Goose, Lower Monumental, and McNary Dams from 1992 to1998......................47
Table 14. Arrival timing of PIT tagged Imnaha River natural steelhead smolts at Lower Granite,Little Goose, Lower Monumental, and McNary Dams from 1993 to 1998...................................48
Table 15. Arrival timing of PIT tagged Imnaha River hatchery steelhead smolts at Lower Granite,Little Goose, Lower Monumental, and McNary dams from 1993 to 1998....................................49
Table 16. Mortality of chinook salmon and steelhead smolts due to trapping, handling, and PITtagging from February 26 to June 16, 1998...................................................................................52

vii
LIST OF FIGURES
Figure 1. Map of the Imnaha River study area. The mouth of the Imnaha River is 308 riverkilometers upstream from Lower Granite Dam (not shown on map)..............................................3
Figure 2. The Lower Imnaha trap site with two rotary screw traps operating. The traps are inposition 3. Trap A is on the left and trap B is on the right..............................................................4
Figure 3. Mean daily discharge (USGS Gauge 13292000 at Imnaha, OR) and mean daily watertemperature of the Imnaha River during the spring trapping period, February 26 to June 16,1998................................................................................................................................................11
Figure 4. Mean daily discharge (USGS Gauge 13334300 at Anatone, WA) and mean daily watertemperature of the Snake River during the spring trapping period, February 26 to June 16,1998................................................................................................................................................11
Figure 5. The daily catch of natural chinook salmon at the lower trap and daily average dischargeat the Imnaha stream gauge (1329000), from October 14 to December 19, 1997.........................16
Figure 6. The daily catch of natural chinook salmon at the lower trap and daily averagetemperature at rkm 7, from October 14 to December 19, 1997.....................................................16
Figure 7. The daily catch of natural steelhead at the lower trap and daily average discharge at theImnaha stream gauge (1329000), from October 14 to December 19, 1997. .................................17
Figure 8. The daily catch of natural steelhead at the lower trap and daily average temperature atrkm 7, from October 14 to December 19, 1997.............................................................................17
Figure 9. The daily catch of natural chinook salmon at the lower trap and daily average dischargeat the Imnaha stream gauge (1329000), from February 26 to June 16, 1998.................................18
Figure 10. The daily catch of natural chinook salmon at the lower trap and daily averagetemperature at rkm 7, from February 26 to June 16, 1998.............................................................18
Figure 11. The daily catch of hatchery chinook salmon at the lower trap and daily averagedischarge at the Imnaha stream gauge (1329000), from February 26 to June 16, 1998................19
Figure 12. The daily catch of hatchery chinook salmon at the lower trap and daily averagetemperature at rkm 7, from February 26 to June 16, 1998.............................................................19
Figure 13. The daily catch of natural steelhead at the lower trap and daily average discharge atthe Imnaha stream gauge (1329000), from February 26 to June 16, 1998....................................20

viii
Figure 14. The daily catch of natural steelhead at the lower trap and daily average temperature atrkm 7, from February 26 to June 16, 1998 ....................................................................................20
Figure 15. The daily catch of hatchery steelhead at the lower trap and daily average discharge atthe Imnaha stream gauge (1329000), from February 26 to June 16, 1998.....................................21
Figure 16. The daily catch of hatchery steelhead and daily average temperature at rkm 7, fromFebruary 26 to June 16, 1998.........................................................................................................21
Figure 17. Length frequency of natural chinook salmon trapped in the upper and lower ImnahaRiver traps, October 14 to December 19, 1997..............................................................................23
Figure 18. Length frequency of natural steelhead smolts (and rainbow trout) trapped in the upperand lower Imnaha River traps, October 14 to December 19, 1997................................................23
Figure 19. Length frequency of natural and hatchery chinook salmon smolts trapped in the lowerImnaha River, February 26 to June 16, 1998.................................................................................25
Figure 20. Length frequency of natural and hatchery steelhead smolts trapped in the lowerImnaha River, February 26 to June 16, 1998. ...............................................................................25
Figure 21. Mean fork lengths and condition factors for natural chinook salmon captured in theImnaha screw traps, February 26 to June 16, 1998........................................................................26
Figure 22. Mean fork lengths and condition factors for hatchery chinook salmon captured in theImnaha screw traps, February 26 to June 16, 1998........................................................................26
Figure 23. Mean fork lengths and condition factors for natural steelhead captured in the Imnahascrew traps, February 26 to June 16, 1998.....................................................................................27
Figure 24. Mean fork lengths and condition factors for hatchery steelhead captured in the Imnahascrew traps, February 26 to June 16, 1998. ...................................................................................28
Figure 25. The number of previously PIT tagged natural chinook salmon captured from February26 to June 16, 1998. Dashed lines represent a departure from the scale of the x axis..................32
Figure 26. The number of previously PIT tagged hatchery chinook salmon captured fromFebruary 26 to June 16, 1998. Dashed lines represent a departure from the scale of the x axis...32
Figure 27. The arrival frequency of previously PIT tagged natural chinook salmon, released fromOctober 15 to November 15 at the upper trap and hatchery chinook salmon, released at theacclimation facility April 6, at the lower Imnaha traps during the spring of 1998........................33

ix
Figure 28. Season-wide survival estimates for natural chinook salmon released from the ImnahaRiver trap to Lower Granite Dam, from 1993 to 1998. Error bars indicate 95% confidence limits.Asterisks indicate upper confidence levels greater than 100%......................................................37
Figure 29. Season-wide survival estimates for hatchery chinook salmon released from theImnaha River trap to Lower Granite Dam, from 1994 to 1998. Error bars indicate 95%confidence limits............................................................................................................................37
Figure 30. Season-wide survival estimates for natural steelhead released from the Imnaha Rivertrap to Lower Granite Dam, from 1995 to 1998. Error bars indicate the 95% confidencelimit................................................................................................................................................38
Figure 31. Season-wide survival estimates for hatchery steelhead released from the Imnaha Rivertrap to Lower Granite Dam, from 1995 to 1998. Error bars indicate the 95% confidencelimit................................................................................................................................................38
Figure 32. Estimated survival of natural and hatchery reared chinook salmon smolts released atthe Imnaha River trap to Lower Monumental Dam from 1993 to 1998 and 95% confidenceintervals. Confidence intervals were not available for the 1997 estimates (after Smith et al. 1998,cited in Kucera, 1998 )..................................................................................................................40
Figure 33. Estimated mortality of hatchery reared chinook salmon smolts, by stream reach, fromrelease at the Imnaha River acclimation facility to Lower Monumental Dam from 1994 to 1998(after Smith et al. 1998, cited in Kucera 1998)..............................................................................42
Figure 34. Season-wide mortality of natural and hatchery reared chinook salmon and steelheadsmolts, by stream reach, from release at the Imnaha River trap to McNary Dam in 1998............43
Figure 35. Mean travel times of natural chinook salmon (top) and hatchery chinook salmon(bottom) weekly PIT tag release groups from the lower Imnaha trap to LGR with 95% confidenceintervals, in 1998. Asterisks indicate confidence intervals greater than 42 days..........................51
Figure 36. Mean travel times of natural steelhead (top) and hatchery steelhead (bottom) weeklyPIT tag release groups from the lower Imnaha trap to LGR with 95% confidence intervals, in1998................................................................................................................................................53

x
APPENDIX TABLES AND FIGURES
Table A. The mean daily discharge and standard deviation estimated from provisional datacollected at the USGS gauging site 13292000 at Imnaha, Oregon and the mean daily average,maximum, and minimum water temperatures at the lower site during the fall, October 14 toDecember 19, 1997 and spring, February 26 to May 24, 1998. . . . . . . . . . . . . . . . . . . . . . . . . . . 63
Table B. The mean daily discharge and standard deviation and mean, maximum and minimumwater temperature estimated from provisional data collected at the USGS gauging site 13292000at Anatone, Washington, on the Snake River, January 1 to July 1, 1998. . . . . . . . . . . . . . . . . . . 71
Table C. The average total discharge, average turbine discharge, and average total spill (Kcfs)for Lower Granite, Little Goose, Lower Monumental, Ice Harbor, and McNary dams from March1 to June 30, 1998. Daily averages were calculated from midnight to midnight. . . . . . . . . . . . . 78
Table D. A summary of the daily catch of natural reared chinook salmon and steelhead capturedin the upper and lower Imnaha screw traps from October 14 to December 19, 1997 . . . . . . . . . 84
Table E. A summary of the daily catch of natural and hatchery reared chinook salmon andsteelhead captured in the Lower Imnaha River screw traps from February 26 to June 16, 1998. 88
Table F. T-test values and sample sizes (n) for seven statistical comparisons of mean forklengths of natural and hatchery chinook salmon and steelhead in the fall of 1997 and spring of1998 and one comparison of mean travel times of natural and hatchery chinook salmon andsteelhead from the lower Imnaha River trap to Lower Granite Reservoir in 1998. . . . . . . . . . . 92
Table G. Daily mean fork lengths (MFL), weights, and condition factors with standarddeviations (STD) for natural and hatchery chinook salmon and steelhead captured in the ImnahaRiver screw traps during the spring emigration of 1998. . . . . . . . . . . . . . . . . . . . . . . . . . . . . . . . 95
Table H. A summary of individual PIT tag release group release dates, number released, andmean fork lengths and weights with standard deviations for natural and hatchery chinook salmonand steelhead released February 26 to June 16, 1998 from the lower Imnaha Trap. . . . . . . . . . 102
Table I. Wilcoxon test values and sample sizes (n) for four statistical comparisons of medianfork lengths of natural and hatchery chinook salmon and steelhead in the spring of 1998 and fivecomparisons of median travel time of natural and hatchery chinook salmon and steelhead fromthe lower Imnaha River trap to Lower Granite Reservoir in 1998. . . . . . . . . . . . . . . . . . . . . . . 109
Table J. Daily trap efficiencies conducted from April 9 to April 17, 1998, for hatchery chinooksalmon released on April 6 into the Imnaha River above the lower Imnaha Trap. . . . . . . . . . . 112

xi
Table K. First observations of PIT tagged natural and hatchery chinook salmon and steelhead released at the Imnaha Trap at the Snake and Columbia River Dams in 1998. Sites areabbreviated as follows: Lower Granite Dam (LGR), Little Goose Dam (LGO), LowerMonumental Dam (LMO), and McNary Dam (MCN). . . . . . . . . . . . . . . . . . . . . . . . . . . . . . . 114
Table L. Cumulative interrogations of spring PIT tagged Imnaha River natural and hatcherychinook salmon and steelhead smolts at Lower Granite, Little Goose, Lower Monumental, andMcNary (MCN) dams from 1993 to 1998 and SURPH survival estimates from trapto MCN. . . . . . . . . . . . . . . . . . . . . . . . . . . . . . . . . . . . . . . . . . . . . . . . . . . . . . . . . . . . . . . . . . . . 120
Figure M-1. Daily arrival timing frequency of natural chinook salmon, PIT tagged in the fall atthe upper site, at Lower Granite Dam (top graph) and Little Goose Dam (bottom graph), March22 to June 6, 1998. The average total project discharge is represented by the top line and theaverage turbine discharge is represented by the lower line. . . . . . . . . . . . . . . . . . . . . . . . . . . . . 122
Figure M-2. Daily arrival timing frequency of natural chinook salmon, PIT tagged in the fall atthe upper site, at Lower Monumental Dam (top graph) and McNary Dam (bottom graph), March22 to June 6, 1998. The average total project discharge is represented by the top line and theaverage turbine discharge is represented by the lower line. . . . . . . . . . . . . . . . . . . . . . . . . . . . . 123
Figure M-3. Daily arrival timing frequency of natural chinook salmon, PIT tagged in the fall atthe lower site, at Lower Granite Dam (top graph) and Little Goose Dam (bottom graph), March22 to June 6, 1998. The average total project discharge is represented by the top line and theaverage turbine discharge is represented by the lower line. . . . . . . . . . . . . . . . . . . . . . . . . . . . . 124
Figure M-4. Daily arrival timing frequency of natural chinook salmon, PIT tagged in the fall atthe lower site, at Lower Monumental Dam (top graph) and McNary Dam (bottom graph), March22 to June 6, 1998. The average total project discharge is represented by the top line and theaverage turbine discharge is represented by the lower line. . . . . . . . . . . . . . . . . . . . . . . . . . . . . 125
Figure M-5. Daily arrival timing frequency of natural chinook salmon, PIT tagged in the springat the lower site, at Lower Granite Dam (top graph) and Little Goose Dam (bottom graph), March29 to July 4, 1998. The average total project discharge is represented by the top line and theaverage turbine discharge is represented by the lower line. . . . . . . . . . . . . . . . . . . . . . . . . . . . . 126
Figure M-6. Daily arrival timing frequency of natural chinook salmon, PIT tagged in the springat the lower site, at Lower Monumental Dam (top graph) and McNary Dam (bottom graph),March 29 to July 4, 1998. The average total project discharge is represented by the top line andthe average turbine discharge is represented by the lower line. . . . . . . . . . . . . . . . . . . . . . . . . . 127 Figure M-7. Daily arrival timing frequency of hatchery chinook salmon, PIT tagged in the springat the lower site, at Lower Granite Dam (top graph) and Little Goose Dam (bottom graph), March29 to July 4, 1998. The average total project discharge is represented by the top line and theaverage turbine discharge is represented by the lower line. . . . . . . . . . . . . . . . . . . . . . . . . . . . . 128

xii
Figure M-8. Daily arrival timing frequency of hatchery chinook salmon, PIT tagged in the springat the lower site, at Lower Monumental Dam (top graph) and McNary Dam (bottom graph),March 29 to July 4, 1998. The average total project discharge is represented by the top line andthe average turbine discharge is represented by the lower line. . . . . . . . . . . . . . . . . . . . . . . . . . 129
Figure M-9. Daily arrival timing frequency of natural steelhead, PIT tagged in the spring at thelower site, at Lower Granite Dam (top graph) and Little Goose Dam (bottom graph), March 29 toJuly 4, 1998. The average total project discharge is represented by the top line and the averageturbine discharge is represented by the lower line. . . . . . . . . . . . . . . . . . . . . . . . . . . . . . . . . . . 130
Figure M-10. Daily arrival timing frequency of natural steelhead, PIT tagged in the spring at thelower site, at Lower Monumental Dam (top graph) and McNary Dam (bottom graph), March 29to July 4, 1998. The average total project discharge is represented by the top line and the averageturbine discharge is represented by the lower line. . . . . . . . . . . . . . . . . . . . . . . . . . . . . . . . . . . 131
Figure M-11. Daily arrival timing frequency of hatchery-adipose-left-ventral clipped steelhead,PIT tagged in the spring at the lower site, at Lower Granite Dam (top graph) and Little GooseDam (bottom graph), March 29 to July 4, 1998. The average total project discharge isrepresented by the top line and the average turbine discharge is represented by the lower line. . . . . . . . . . . . . . . . . . . . . . . . . . . . . . . . . . . . . . . . . . . . . . . . . . . . . . . . . . . . . . . . . . . . . . . . 132
Figure M-12. Daily arrival timing frequency of hatchery-adipose-left-ventral clipped steelhead,PIT tagged in the spring at the lower site, at Lower Monumental Dam (top graph) and McNaryDam (bottom graph), March 29 to July 4, 1998. The average total project discharge isrepresented by the top line and the average turbine discharge is represented by the lower line. . . . . . . . . . . . . . . . . . . . . . . . . . . . . . . . . . . . . . . . . . . . . . . . . . . . . . . . . . . . . . . . . . . . . . . . 133
Figure M-13. Daily arrival timing frequency of hatchery-adipose-clipped steelhead, PIT taggedin the spring at the lower site, at Lower Granite Dam (top graph) and Little Goose Dam (bottomgraph), March 29 to July 4, 1998. The average total project discharge is represented by the topline and the average turbine discharge is represented by the lower line. . . . . . . . . . . . . . . . . . . 134
Figure M-14. Daily arrival timing frequency of hatchery-adipose-clipped steelhead, PIT taggedin the spring at the lower site, at Lower Monumental Dam (top graph) and McNary Dam (bottomgraph), March 29 to July 4, 1998. The average total project discharge is represented by the topline and the average turbine discharge is represented by the lower line. . . . . . . . . . . . . . . . . . . 135

1
INTRODUCTION
This report summarizes the results of the Lower Snake River Compensation PlanHatchery Evaluation Studies (LSRCP) and the Imnaha Smolt Monitoring Program (SMP) for the1998 smolt migration from the Imnaha River, Oregon. These studies were designed and closelycoordinated to provide information about juvenile natural and hatchery chinook salmon andsteelhead biological characteristics, behavior and emigrant timing, survival, arrival timing andtravel time to the Snake River dams and McNary Dam on the Columbia River. Data collectedfrom these studies are shared with the FPC. These data are essential to quantify smolt survivalrates under the current passage conditions and to evaluate the future recovery strategies that seekto optimize smolt survival through the hydroelectric system. Information shared with the FPCassists with in-season shaping of flow and spill management requests in the Snake Riverreservoirs. The Bonneville Power Administration and the United States Fish and WildlifeService contracted the Nez Perce Tribe (NPT) to monitor emigration timing and tag 21,200emigrating natural and hatchery chinook salmon (Oncorhynchus tshawytscha) and steelheadsmolts (Oncorhynchus mykiss) from the Imnaha River during the spring emigration period(March 15 - June 5) with PIT tags. Additional funds were provided by the United States Fish andWildlife Service to compare migration timing and survival of Imnaha natural chinook salmoncaptured during the fall (October 14 to December 19) in the upper and lower Imnaha River. Natural chinook salmon captured during the fall in the upper Imnaha River are assumed tooverwinter in the Imnaha River and natural chinook captured in the lower Imnaha River areassumed to be migrating to overwinter in the Snake River.
The completion of trapping in the spring of 1998 marked the seventh year of emigrationstudies on the Imnaha River and the fifth year of participation in the FPC smolt monitoringprogram. Monitoring and evaluation objectives were to:
1. Determine emigration timing of chinook salmon and steelhead smolts collected at theImnaha River traps.
2. Evaluate effects of flow, smolt condition and other environmental factors on emigrationtiming.
3. Monitor the abundance and biological characteristics of juvenile chinook salmon andsteelhead smolts collected at the Imnaha River screw trap.
4. Determine emigration timing, travel time, and in-river survival of PIT tagged hatcherychinook salmon smolts released at the Imnaha River acclimation facility to the lowerImnaha River traps.
5. Estimate the post-release survival of hatchery reared chinook salmon smolts in theImnaha River.

2
6. Determine arrival timing, travel time and recovery rate, or cumulative tag interrogations,(as an index of minimum smolt survival) and estimated survival of hatchery chinooksalmon and natural and hatchery steelhead smolts PIT tagged from the Imnaha River trapsto Snake and Columbia river dams.
METHODS
Study Area Description
The Imnaha River subbasin is located in northeastern Oregon (Figure 1) and encompassesan area of approximately 2,538 square kilometers. The mainstem Imnaha River flows in anortherly direction for 129 km from its headwaters in the Eagle Cap Wilderness Area to itsconfluence with the Snake River (James 1984; Kucera 1989). The river drains the easternescarpment of the Wallowa mountains and part of an adjacent plateau located between theWallowa River drainage to the west and Hells Canyon of the Snake River to the east (Kucera1989). Elevations in the watershed vary from 3,048 m at the headwaters to about 260 m in lowerelevations (Kucera 1989). There are diversions for irrigation upstream from the gauging site inthe headwaters of the tributary Big Sheep Creek (rkm 32). The water diverted from Big SheepCreek is diverted to the Wallowa River Basin (Anonymous a 2000). Trapping sites are located atrkm 7 (lower site) and rkm 74 (upper site).
The 70 year (1929 - 1998) mean annual discharge of the Imnaha River is 14.6 cms (515cfs) at Imnaha, Oregon, USGS gauge 13292000. The minimum discharge, 0.5 cms (16 cfs) wasobserved November 22, 1931. The maximum river discharge, 572.0 cms (20,200 cfs) wasobserved January 1, 1997 (Anonymous a 2000). Maximum river discharge generally occursfrom April to June with minimum flows from August to February (Kucera 1989).
Equipment Description
Floating rotary screw traps manufactured by E.G. Solutions Inc., Corvallis, Oregon, wereused to capture emigrating salmonid smolts (Figure 2). Similar traps have been used to capturemigrating salmonid species in New York and Alaska (Kennen et al. 1994; Thedinga et al. 1994). When conditions permitted, two of these traps were fished in tandem. During hatchery releases,trap efficiency trials, high flows or periods of damage to one trap, a single trap was fished.
The screw traps used in the spring and fall at the lower site consisted of a non-standard2.1 m diameter trapping cone supported by a metal A-frame and two six meter pontoons thatprovided flotation. Fish entering the trapping cones move through to a custom oversize livebox(1.68 m wide x 1.25 m long x 0.55 m deep). The live box was fitted with a removable baffle todissipate water velocity during high flows. A smaller trap, with a 1.5 m diameter cone, was usedat the upper site in the fall.
Water temperature information for this study was collected using a constant recording

3
Figure 1. Map of the Imnaha study area. The mouth of the Imnaha River is 135 river kilometersupstream from Lower Granite Dam (not shown on map).

4
Figure 2. The lower Imnaha trap site with two rotary screw traps operating. The traps are inposition 3. Trap A is on the left and trap B is on the right.
Ryan TempMentor which was located approximately 150 m upstream from the screw trap.Temperatures were collected until the end of May when the TempMentor was washeddownstream and recovered in Asotin, Washington. Data from the Ryan TempMentor is valid upto May 24. Discharge information used in this report was provided by the U.S. GeologicalSurvey, USGS gauge 13292000 at Imnaha, Oregon (rkm 32). The data is collected every halfhour and was considered provisional. Water discharge and temperature information wasprovided by the USGS for the Anatone stream gauge, 13334300.
Data summarizing the average total discharge, average turbine discharge, and averagetotal spill for the Snake and Columbia river dams, from January 1 to October 1 was obtainedfrom the Fish Passage Center (H. Franzoni, personal communication). Data was summarizeddaily from midnight to midnight. Daily peak discharge and spills were determined from March 1to June 30 for Lower Granite Dam (LGR), Little Goose Dam (LGO), Lower Monumental Dam(LMO), Ice Harbor (IHR) and McNary Dam (MCN). The daily averages for the total spill ateach dam were summed from March 1 to June 30 to determine the total spill, at each site, for the1998 migration. Average total spill data was summarized from March 1 to June 30 because we

5
expected that the majority of the Imnaha smolts would be passing though the migration corridorduring that period.
Trap Operations
The upper Imnaha River trap was located at rkm 74 (0.4 rkm) downstream of the ImnahaRiver chinook salmon acclimation facility. This trap was fished from October 15 to November15, 1997 (15 days). The lower Imnaha River screw trap was operated from October 14 toDecember 19, 1997 (43 days) and from February 26-27 and from March 4 to June 16, 1998. TheSMP portion began on March 15 and was completed June 5. A second trap was deployed onMarch 9 for the purpose of increasing the catch of natural chinook salmon. The second trapoperated until March 23. The second trap was deployed again during the following periods:April 1 to April 6, April 20 to April 23, May 11 to May 13, and May 18 to May 19. Normally,the screw traps were operated five days per week from Sunday evening through Friday morning. Exceptions occurred on several occasions when trap repair was necessary or high flows or debrisload in the river prevented safe trap operation. During the release of hatchery chinook salmonone trap was operated continuously for 12 days.
The screw traps were secured on the west bank of the Imnaha River, below the CowCreek bridge, 6.6 kilometers from the confluence with the Snake River. When two traps werefished they were positioned side by side with the trap nearest to the east bank staggered onemeter downstream. Trap positions in the river were adjusted by manipulating a cable suspensionsystem which allowed side to side and upstream/downstream movement of the traps. Thisallowed the trap to be backed slightly out of the main current and fished during high flows.
As in past years we attempted to position the trap according to the staff gauge height(Table 1). Heavy debris loads and high water velocities forced a change in protocol that createda fourth position a meter downstream of position 3. The trap was never fished in position 2. Stream gauge readings for positions 3 and 4 overlapped on 14 of 36 occasions. Distancesbetween the position 1 and 4 ranged from one to three meters. Ultimately, the daily position ofthe trap was determined by positioning the trap in the furthest upstream position where watervelocities and debris would not cause the trap to sink. The presumed advantage of positioningthe trap upstream was increased trap efficiencies. The disadvantage, as learned from empiricalknowledge, is that water velocities tend to pin small debris in the cone of the traps and sink them.The overlap in stream gauge height allowed trap personnel to safely fish the trap in a positionfarther downstream position during the early spring when freshets washed out debris and positiontraps farther upstream in late spring after the early spring freshets had cleared debris from thestream banks. The traps positions were recorded daily.
The live box of the screw trap was checked at 0800 every morning and several timesthroughout each night and day. Non-target piscivorus fish and large numbers of other non-targetfish were removed from the live box first. Non-target piscivorus fish were scanned for PIT tagsand then released 30-50 meters downstream. Fish were processed as they were removed from thetrap. Tagging records for chinook salmon and steelhead were recorded in the same PIT tagging

6
Table 1. The targeted positions of the Imnaha traps for staff gauge heights from February 26 toJune 16, 1998.
Staff Gauge (cm)
Position Reported to the
Fish Passage Center
Distance from Position
One (m)
MinimumGauge Height ofOperation (cm)
MaximumGauge Height ofOperation (cm)
> 90 1 0 36 80
2 1 NA NA
90 - 100 3 2 62 126
< 100 4 3 86 119
file to reduce the amount of handling and stress to the fish.
Daily processing procedures were similar to those used by Ashe et al. (1995) and were asfollows: 1) Fish were anaesthetized in a MS-222 bath (3 mL MS-222 stock solution (100 g/L)per 19 L of water) buffered with propolyaqua (PRO-NOVAQUA), 2) Each fish was examined forexisting marks (e.g. fin clips), and PIT tag insertion scars, 3) Chinook salmon, steelhead andlarge piscivorus fish were scanned with a PIT tag scanner, 4) 300 to 100 hatchery chinooksalmon smolts were targeted for use in daily trap efficiency trials, 5) A specified number of eachspecies was selected for PIT tag insertion, 6) All other fish were enumerated and released 30-50m downstream from the trap after recovering from the anaesthetic, and 7) All fish mortality wasrecorded.
Trap Efficiencies
No trap efficiency trials were conducted at the upper or lower trap site during the falltrapping period because the goal for fall trapping was to tag 2,000 natural chinook salmon to getarrival timing and survival estimates to mainstem dams. Efficiency trials for hatchery chinooksalmon were conducted nine times. The first 300 hatchery chinook salmon were targeted for trapefficiency trials. Marked fish were measured (fork length) to the nearest mm and weighed to thenearest 0.1 g. Fish selected for trap efficiency trials were marked by clipping the distal portion ofthe fins. The following fin clips were used on a daily basis, Sunday through Saturdayrespectively: upper and lower caudal, upper caudal, lower caudal, left pelvic, right pelvic, leftpectoral, and right pectoral.
Fish marked for trap efficiency trials were held in perforated plastic garbage cans in theriver during daytime hours (approximately 12 h) and then transported upstream approximatelyone km to the release site during evening hours. Fish were released after dark on the day theywere marked. Trap efficiency was determined by E = R/M; where E is estimated trapefficiency, R is number of marked fish recaptured, and M is number of fish marked and released.
7
Biological Characteristics
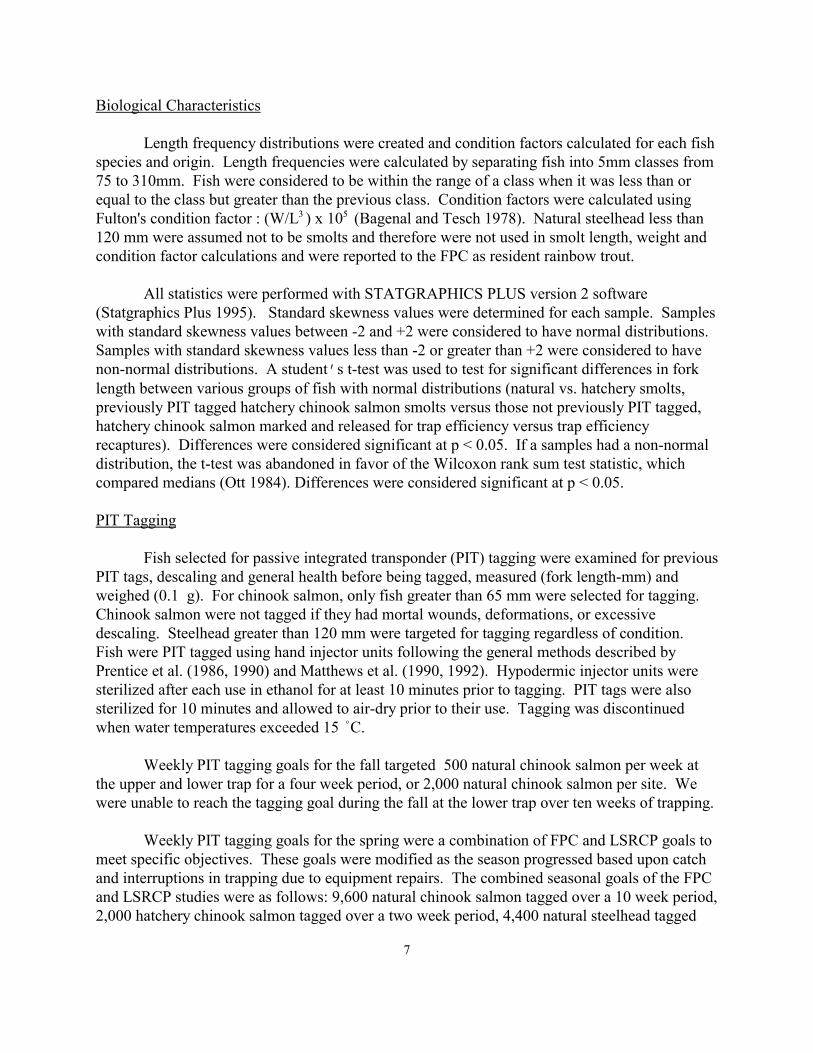
Length frequency distributions were created and condition factors calculated for each fishspecies and origin. Length frequencies were calculated by separating fish into 5mm classes from75 to 310mm. Fish were considered to be within the range of a class when it was less than orequal to the class but greater than the previous class. Condition factors were calculated usingFulton's condition factor : (W/L3 ) x 105 (Bagenal and Tesch 1978). Natural steelhead less than120 mm were assumed not to be smolts and therefore were not used in smolt length, weight and condition factor calculations and were reported to the FPC as resident rainbow trout.
All statistics were performed with STATGRAPHICS PLUS version 2 software(Statgraphics Plus 1995). Standard skewness values were determined for each sample. Sampleswith standard skewness values between -2 and +2 were considered to have normal distributions. Samples with standard skewness values less than -2 or greater than +2 were considered to havenon-normal distributions. A student’s t-test was used to test for significant differences in forklength between various groups of fish with normal distributions (natural vs. hatchery smolts,previously PIT tagged hatchery chinook salmon smolts versus those not previously PIT tagged,hatchery chinook salmon marked and released for trap efficiency versus trap efficiencyrecaptures). Differences were considered significant at p < 0.05. If a samples had a non-normaldistribution, the t-test was abandoned in favor of the Wilcoxon rank sum test statistic, whichcompared medians (Ott 1984). Differences were considered significant at p < 0.05.
PIT Tagging
Fish selected for passive integrated transponder (PIT) tagging were examined for previousPIT tags, descaling and general health before being tagged, measured (fork length-mm) andweighed (0.1 g). For chinook salmon, only fish greater than 65 mm were selected for tagging. Chinook salmon were not tagged if they had mortal wounds, deformations, or excessivedescaling. Steelhead greater than 120 mm were targeted for tagging regardless of condition. Fish were PIT tagged using hand injector units following the general methods described byPrentice et al. (1986, 1990) and Matthews et al. (1990, 1992). Hypodermic injector units weresterilized after each use in ethanol for at least 10 minutes prior to tagging. PIT tags were alsosterilized for 10 minutes and allowed to air-dry prior to their use. Tagging was discontinuedwhen water temperatures exceeded 15 °C.
Weekly PIT tagging goals for the fall targeted 500 natural chinook salmon per week atthe upper and lower trap for a four week period, or 2,000 natural chinook salmon per site. Wewere unable to reach the tagging goal during the fall at the lower trap over ten weeks of trapping.
Weekly PIT tagging goals for the spring were a combination of FPC and LSRCP goals tomeet specific objectives. These goals were modified as the season progressed based upon catchand interruptions in trapping due to equipment repairs. The combined seasonal goals of the FPCand LSRCP studies were as follows: 9,600 natural chinook salmon tagged over a 10 week period,2,000 hatchery chinook salmon tagged over a two week period, 4,400 natural steelhead tagged

8
over a 7 week period, and 5,200 hatchery steelhead tagged over a 6 week period.
Steelhead smolts were held until fully recovered and then released as a group. Chinooksalmon smolts were held in perforated aquatic containers for a minimum of 12 hours and releasedas a group after dark. The latter methodology is a standard practice employed to allow chinooksalmon smolts to recover from tagging stress and increase predator avoidance and survivalthrough night time release. Mortality due to tagging, trapping, or handling was recorded.
Tagging files were validated using the PITVAL2 software program. Tagging andinterrogation files were submitted to the Pacific States Marine Fisheries Commission (PSMFC)PIT Tag Information System (PTAGIS) database via modem within a 48 hour period followingtagging. PIT tag interrogation data were downloaded from the PTAGIS database.
Smolt Yield
Smolt yield was estimated by two separate methods. Interrogations of previously PITtagged fish at the trap and Snake and Columbia River dams provide unique capture histories. These capture histories enabled us to calculate survival by the Cormack, Jolly, Seber methodologyas stated in the methods for survival estimation. Smolt yield was also determined for the periodusing the bootstrap method (Efron and Tibshirani 1986). Daily emigration numbers wereestimated by: N = U/E; where N is estimate of total number of emigrants, and U is number ofunmarked fish and E is the trap efficiency. Bootstrap period estimates (Np) were calculated by:Np=Up/Ep; where Up is the total number of unmarked fish captured during the period and Ep is themean trap efficiency for the period.
Survival Estimation
Survival was estimated by the Cormack, Jolly, and Seber methodology, also known as the“Jolly-Seber model,” with the Survival Using Proportional Hazards (SURPH) program (Smith et.al., 1994). Fish were sorted into weekly release groups. Each weekly release group was treated asa single release. The SURPH model uses repeated detections of individually tagged fish throughfour lower Snake River dams and Columbia River dams and analysis of their capture historiesprovides estimates of their survival. Only weekly release groups of 200 or more fish wereanalyzed for survival on a weekly basis. Season-wide estimates, using a single release model,were calculated using all PIT tagged fish for each species and rearing type. Season wide estimatesserved as indices to compare survival between years and to cumulative interrogations.
The data files for release groups were created using the program CAPTHIST (Westhagen1997). Capture histories identified fish which were loaded onto a barge or for which an exit pointfrom a fish bypass facility could not be determined. Survival estimates do not include fish whichhad negative travel times or single coil detections. SURPH calculates standard errors for eachestimate. The SURPH model can produce survival estimates which are greater than one. Theseestimates generally reflect an underestimation of survival in previous reaches. Estimates formultiple reaches were calculated as the product of individual reach estimates.

9
Travel Timing to Trap Site and Lower Snake River Dams
Emigration timing of natural and hatchery chinook salmon and steelhead smolts, at thetrap sites, were determined by daily collection numbers. Arrival timing and travel time of PITtagged hatchery chinook salmon smolts released at the Imnaha River acclimation facility andhatchery steelhead smolts released at the Little Sheep Creek acclimation facility was determinedby daily collection numbers and PIT tag interrogation at the screw trap site.
Arrival timing, travel time and cumulative interrogation percentages to LGR, LGO, LMO,and MCN were determined for natural and hatchery chinook salmon and steelhead smolts.Detections and arrival timing at each dam for this report period are based on first-timeobservations of individual tag codes at each dam. Arrival timing estimates do not includesubsequent detections of fish that were captured in the Snake River trap, held in sample rooms orraceways, had negative travel times or single coil detections. Release groups of fish were pooledweekly to determine travel time to LGR. First time PIT tag observations, from all maininterrogation sites, were used to calculate and report the cumulative interrogation percentages toLGR by species and rearing. Cumulative interrogation percentages of each species wasdetermined by dividing the sum of first tag code observations by the total number of fish taggedand released.
Travel time estimates to LGR do not include fish captured in the Snake River trap. Differences in mean travel time, from weekly PIT tag release groups, were analyzed by means of at-test (Statgraphics Plus 1995) as in 1997 (Blenden et al. 1998) if the standard skewness valueswere within ±2. Differences in means were tested and considered significant at the 0.05 level. Ifa sample’s standard skewness values was outside the range of ±2 it was considered to have a non-normal distribution and the t-test was abandoned in favor of the Wilcoxon rank sum test statistic(Ott 1984). This test compared median travel times between hatchery reared and naturallyproduced smolts.

10
RESULTS AND DISCUSSION
Imnaha and Snake River Discharge, Temperature and Spill
During the fall 1997 trapping period, Imnaha River discharge ranged from 4.1 cms (145cfs) on December 3 to 9.5 cms (335 cfs) on October 31. Mean daily water temperature at thelower Imnaha River trap site during the fall trapping period ranged from 0.2 /C on December 5 to10.7 /C on October 18. Imnaha River mean daily discharge during spring emigration ranged from5.6 cms (199 cfs) on March 11 to 168.9 cms (5,964 cfs) on May 26 at USGS gauge 13292000,Imnaha, OR (Figure 3). Mean daily water temperatures during the spring period ranged from 2.7/C on February 28 to 11.4/C on May 20 (Figure 3). Appendix A contains the mean dailydischarge readings and daily minimum, maximum and mean water temperatures during the studyperiod. The Snake River mean daily discharge during the spring emigration ranged from 916 cms(32,300 cfs) on March 9 to 4,672 cms (165,000 cfs) on May 27 at USGS gauge13334300,Anatone, WA.(Figure 4). Mean daily water temperatures during the study period ranged from5.2/C on February 28 to 15.9 /C on June 14. Appendix B contains the mean daily dischargereadings and daily minimum, maximum and mean water temperatures during the study period forthe Snake River.
IHR spill occurred March 5 through March 7, March 9, March 24 through March 29, andApril 6 through June 30. The minimum amount of water spilled at IHR during spill periods was3.74 Kcfs on March 29 and the maximum spill was 132.31 Kcfs on May 28. Spill at LMOoccurred March 9, March 24 through March 27, March 31, and April 6 to June 23. The minimumamount of spill at LMO during these periods was 0.05 Kcfs on June 1 and the maximum spill was120.48 Kcfs on May 28. LGO spilled March 15 through March 16, March 24 through March 27,and April 6 through June 20. The minimum amount of spill at LGO during these periods was0.08 Kcfs on March 16 and the maximum spill was 98.36 Kcfs on May 27. Spill at MCN rangedfrom March 17 through March 19, March 21, March 24 through March 28, March 31, and April20 to June 30. The minimum amount of spill at MCN during these periods was 2.07 Kcfs onMarch 24 and the maximum spill was 251.0 Kcfs on May 29. LGR was the last dam to initiatespill on March 24. Spill occurred until March 27 and continuous spill occurred April 6 throughJune 21. The minimum amount of spill at LGR during these periods was 0.02 Kcfs on June 21and the maximum spill was 109.4 Kcfs on May 27. The daily average total discharge, averageturbine discharge, and average total spill for the previously mentioned sites from March 1 to June30 is presented in Appendix C.
Trap Operation
The Imnaha River screw trap was operated for 69 days during the 112 day springemigration period. The trap was scheduled to operate 5 days per week from February 26 to June16 except during the release of hatchery chinook salmon. Of the scheduled days, only nine weremissed. One of the days missed was the result of damage to the trap and eight were the result ofhigh flows (Table 2).

11
0
1000
2000
3000
4000
5000
6000
2/22 3/1 3/8 3/1
53/2
23/2
9 4/5 4/12
4/19
4/26 5/3 5/1
05/1
75/2
45/3
1 6/7 6/14
Date
Ave
rage
Dai
ly D
isch
arge
(cfs
)
0
3
6
9
12
15
18
Tem
pera
ture
(C)
Flow (cfs)Average Temperature (C)
0
30
60
90
120
150
180
2/22 3/1 3/8 3/1
53/2
23/2
9 4/5 4/12
4/19
4/26 5/3 5/1
05/1
75/2
45/3
1 6/7 6/14
Date
Ave
rage
Dai
ly D
isch
arge
(Kcf
s)
0
3
6
9
12
15
18
Tem
pera
ture
(C)
Flow (Kcfs)Average Temperature (C)
Figure 3. Mean daily discharge (USGS Gauge 13292000 at Imnaha, OR) and mean daily watertemperature of the Imnaha River during the spring trapping period, February 26 to June 16, 1998.
Figure 4. Mean daily discharge (USGS Gauge 13334300 at Anatone, WA) and mean daily watertemperature of the Snake River during the spring trapping period, February 26 to June 16, 1998.

12
Table 2. Dates the screw traps were not operated during the spring study period, February 27-28and March 4 -June 16, 1998.
Dates Not Fished Reason Trap Not Fished Scheduled Days Missed
02/28 - 03/03 Extended Weekend
03/07 Weekend
03/14 Weekend
03/24 Trap Damage 1
03/28 Weekend
04/04 - 04/05 Weekend
04/18 Weekend
04/24 - 04/25 High Flows 1
05/02 - 05/03 Weekend / High Flows 1
05/09 Weekend
05/16 Weekend
05/23 - 05/31 Weekend / High Flows 6
06/06 Weekend
06/13 Weekend
Emigration Timing and Trends at Trap Site
A total of 2,232 natural chinook salmon and 24 natural steelhead juveniles were capturedat the upper Imnaha River trap from October 15 to November 15, 1997. The highest single dayscatch for natural chinook salmon was 361 fish on October 22. Appendix D contains daily detailsof the catch at the upper and lower sites from October 14 to December 19, 1997. A total of 1,516natural chinook salmon and 123 natural steelhead juveniles were captured at the lower ImnahaRiver trap from October 14 to December 19, 1997. The catch of natural chinook salmon peakedtwice with 108 fish sampled on October 24 and 102 fish captured on October 31. The catch ofnatural steelhead peaked with 40 fish on October 31, which coincided with a spike in discharge of335 cfs and an increase in mean water temperature from 6.0°C on October 26 to 9.6°C onOctober 31(Appendixes A and D).
A total of 4,195 natural chinook salmon, 17,837 hatchery chinook salmon, 3,569 naturalsteelhead and 5,141 hatchery steelhead smolts were captured in the Imnaha River screw trapduring the study period (Table 3). An additional 431 non-target fish were captured. The total

13
catch of target and non-target fish was 31,173 fish. Appendix E contains daily catch summariesof natural and hatchery chinook salmon and steelhead from February 26 to June 16, 1998. Naturalchinook salmon were collected throughout the study period and comprised 13.5% of the totalcatch. The peak period of natural chinook salmon smolt collection occurred from March 15 toMarch 23.
Table 3. Summary of the weekly catch of species caught in the Imnaha screw trap during thespring of 1998. Chinook salmon and steelhead of unknown origin (n = 47) were omitted.
WeekNatural Chinooksalmon
HatcheryChinook salmon
NaturalSteelhead
HatcherySteelhead
02/22/98 - 02/28/98 15 0 0 0
03/01/98 - 03/07/98 14 0 0 0
03/08/98 - 03/14/98* 20 0 1 0
03/15/98 - 03/21/98* 1,789 0 61 0
03/22/98 - 03/28/98* 299 0 65 2
03/29/98 - 04/04/98* 640 0 252 0
04/05/98 - 04/11/98* 269 10,246 86 0
04/12/98 - 04/18/98 472 6,991 185 1
04/19/98 - 04/25/98* 484 521 1,093 8
04/26/98 - 05/02/98 74 57 570 2,273
05/03/98 - 05/09/98 5 7 166 178
05/10/98 - 05/16/98* 59 10 359 663
05/17/98 - 05/23/98* 49 5 717 1,835
05/24/98 - 05/30/98 - - - -
05/31/98 - 06/06/98 2 0 12 48
06/07/98 - 06/13/98 2 0 2 109
06/14/98 - 06/20/98 2 0 0 24
Catch 4,195 17,837 3,569 5,141* Two traps were fishing for one or more days.

14
The Oregon Department of Fish and Wildlife (ODFW) released 93,127 hatchery rearedchinook salmon smolts into the Imnaha River from the Imnaha River acclimation facility (rkm 73)on April 6 (Mike Flesher, personal communication, ODFW database information). Of these,19,827 smolts were PIT tagged prior to release (Table 4). Hatchery chinook salmon smoltscomprised 57.2% of the total catch. Hatchery chinook salmon smolts were first captured on April7, one day after the release. Approximately 97% (17,237) of the hatchery chinook salmon trappedwere captured within 11 days of release. Small numbers of hatchery chinook salmon smolts werecaught through mid-May (Appendix E).
Emigrating natural steelhead smolts were captured from March 10 to June 11. Naturalsteelhead comprised 11.4% of the total catch. Natural steelhead catch peaked on April 23 with acatch of 578 fish (Appendix E). Very few natural steelhead smolts were captured during June.
ODFW released 117,096 hatchery reared steelhead smolts into the Imnaha River subbasin,at the Little Sheep acclimation facility (rkm 45) in two groups (Table 4). Smolts released on April26 had adipose and left ventral fin clips with coded wire tags and 867 PIT tags. The release groupof May 19 were adipose fin clipped and none were PIT tagged. Thirty one percent of the hatcheryreared steelhead smolts captured in the Imnaha traps occurred between May 9 and May 23 (Table3). Hatchery steelhead comprised 16.5% of the total catch. Only 4.4% of the hatchery steelheadsmolts released were captured. The low percentage of hatchery fish captured may have resultedfrom mean discharge greater than 2,000 cfs from May 1 to May 11 affecting the ability toefficiently operate the traps. Additionally, peak discharge from May 23 to May 31 caused us tomiss six days of trapping and may have enticed the majority of the remaining hatchery rearedsteelhead to emigrate.
Table 4. The number and date of hatchery chinook salmon and steelhead released into the ImnahaRiver, with the number PIT tagged, and type of additional external and internal marks, in 1998.
Species Date of Release Number Released Number PIT tagged Mark Type
ChinookSalmon
04/06/98 93,127 19,827 AD1, CWT2
Steelhead 04/26/98 86,422 867 AD1, LV3, CWT
Steelhead 05/19/98 30,674 0 AD1
Chinook Salmon Totals 93,127 19,827
Steelhead Totals 117,096 8671 adipose fin clip2 coded wire tag 3 left ventral fin clip

15
The fall catch of natural chinook salmon at the lower site peaked on October 24, 7 daysprior to the October 31 peak fall flow of 335 cfs with a catch of 108 fish (Figure 5). The secondhighest catch day (n = 102) occurred on October 31. Fall water temperatures during both pulsesof fish were greater than 8°C (Figure 6). The fall catch of natural steelhead peaked with theOctober 31 increase in flow to 335 cfs and when water temperatures were greater than 8°C(Figure 7 and 8). A group of 13 natural chinook salmon were observed moving downstream onDecember 5 when the lowest mean daily water temperature, 0.2°C, was observed.
Observations of natural chinook salmon in the daily catch at the lower trap began tosubstantially increase after a slight increase in flow that occurred from March 13 from 254 to 517cfs on March 17. The daily catch of natural chinook salmon peaked the following day when 501fish were captured (Figure 9). Flow continued to increase and spiked to 2,033 cfs on March 24. This movement of fish occurred as mean daily water temperature increased from 2.7 °C onFebruary 28 to 9.6 °C on March 14 (Figure 10). Another substantial movement of naturalchinook salmon (n = 199) occurred on April 22 prior an increase in the average discharge from593 cfs on April 16 to 2,148 cfs on April 24. The average daily water temperature on April 22 was11.3 °C.
Hatchery chinook salmon were released after the mean daily discharge reached 518 cfs onMarch 17 and prior to the April 24 spike in the hydrograph (Figure 11). Flows were as low as 593cfs when the majority of hatchery fish were captured. Temperature from April 6 to April 17ranged from 6.4 to 9.0 °C (Figure 12). The catch of hatchery chinook salmon peaked on April 9with 3,927; three days after the release. The emigration timing of hatchery chinook salmon at thelower Imnaha trap should not be correlated to flow or temperature because of the release was notvolitional.
The first major catch of natural steelhead smolts was observed on April 23 with 578 fish. The stream discharge increased from 593 cfs on April 16 to 2,148 cfs on April 24 (Figure 13). The traps did not fish on April 24 and April 25 so it is unknown if the catch of natural steelheadwould have coincided with the increase in discharge. However the peak in the daily catch ofnatural steelhead did come a day after temperatures spiked up to 11.3°C (Figure 14). The secondmajor catch of natural steelhead was observed May 18 with 211 fish. The May 18 catch proceededa spike in the hydrograph of 3,704 cfs on May 23 and peak flow on May 26 of 5,964 cfs. Thesecond major movement of natural steelhead smolts coincided with an increase in watertemperature from 8.5°C on May 16 to 11.4°C on May 20.
Hatchery steelhead were captured in the greatest numbers on April 27, 1998, three daysafter the average daily discharge reached 2,148 cfs on April 24 and a day after their release fromthe acclimation facility (Figure 15). As with hatchery chinook salmon, the emigration timing ofhatchery steelhead at the lower Imnaha trap should not be correlated to flow or temperaturebecause the release was not volitional. A total of 1,428 hatchery steelhead were captured fromMay 20 to May 22, after the May 19 release from the acclimation facility. High flows and heavydebris on May 23 forced us to stop trapping. Mean daily water temperatures from May 19 to May22 ranged from 10.3 to 11.4°C (Figure 16).

16
0
30
60
90
120
150
10/5
10/12
10/19
10/26 11
/211
/911
/1611
/2311
/30 12/7
12/14
Date
Num
ber o
f Fis
h C
aptu
red
0
100
200
300
400
500
Dis
char
ge (c
fs)
-Natural Chinook (Lower Site)
Average Discharge (cfs)
0
30
60
90
120
150
10/5
10/12
10/19
10/26 11
/211
/911
/1611
/2311
/30 12/7
12/14
Date
Num
ber o
f Fis
h C
aptu
red
0
2
4
6
8
10
Tem
pera
ture
(C)
Natural Chinook (Lower Site)Average Temperature (C)
Figure 5. The daily catch of natural chinook salmon at the lower trap and daily average dischargeat the Imnaha stream gauge (1329000), from October 14 to December 19, 1997.
Figure 6. The daily catch of natural chinook salmon at the lower trap and daily averagetemperature at rkm 7, from October 14 to December 19, 1997.

17
0
18
36
54
72
90
10/5
10/12
10/19
10/26 11
/211
/911
/1611
/2311
/30 12/7
12/14
Date
Num
ber o
f Fis
h C
aptu
red
0
100
200
300
400
500
Dis
char
ge (c
fs)
Natural Steelhead (Lower Site)Average Discharge (cfs)
0
18
36
54
72
90
10/5
10/12
10/19
10/26 11
/211
/911
/1611
/2311
/30 12/7
12/14
Date
Num
ber o
f Fis
h C
aptu
red
0
2
4
6
8
10
Tem
pera
ture
(C)
Natural Steelhead (Lower Site)Average Temperature (C)
Figure 7. The daily catch of natural steelhead at the lower trap and daily average discharge at theImnaha stream gauge (1329000), from October 14 to December 19, 1997.
Figure 8. The daily catch of natural steelhead at the lower trap and daily average temperature atrkm 7, from October 14 to December 19, 1997.

18
0
100
200
300
400
500
600
2/22 3/1 3/8 3/1
53/2
23/2
9 4/5 4/12
4/19
4/26 5/3 5/1
05/1
75/2
45/3
1 6/7 6/14
Date
Num
ber o
f Fis
h C
aptu
red
0
1000
2000
3000
4000
5000
6000
Dis
char
ge (c
fs)
Natural ChinookAverage Discharge (cfs)
0
100
200
300
400
500
600
2/22 3/1 3/8 3/1
53/2
23/2
9 4/5 4/12
4/19
4/26 5/3 5/1
05/1
75/2
45/3
1 6/7 6/14
Date
Num
ber o
f Fis
h C
aptu
red
0
2
4
6
8
10
12
Tem
pera
ture
(C)
Natural ChinookAverage Temperature (C)
Figure 9. The daily catch of natural chinook salmon at the lower trap and daily average dischargeat the Imnaha stream gauge (1329000), from February 26 to June 16, 1998.
Figure 10. The daily catch of natural chinook salmon at the lower trap and daily averagetemperature at rkm 7, from February 26 to June 16, 1998.

19
0
800
1600
2400
3200
4000
4800
2/22 3/1 3/8 3/1
53/2
23/2
9 4/5 4/12
4/19
4/26 5/3 5/1
05/1
75/2
45/3
1 6/7 6/14
Date
Num
ber o
f Fis
h C
aptu
red
0
1000
2000
3000
4000
5000
6000
Dis
char
ge (c
fs)
Hatchery Chinook Average Discharge (cfs)
0
800
1600
2400
3200
4000
4800
2/22 3/1 3/8 3/1
53/2
23/2
9 4/5 4/12
4/19
4/26 5/3 5/1
05/1
75/2
45/3
1 6/7 6/14
Date
Num
ber o
f Fis
h C
aptu
red
0
2
4
6
8
10
12
Tem
pera
ture
(C)
Hatchery ChinookAverage Temperature (C)
Figure 11. The daily catch of hatchery chinook salmon at the lower trap and daily averagedischarge at the Imnaha stream gauge (1329000), from February 26 to June 16, 1998.
Figure 12. The daily catch of hatchery chinook salmon at the lower trap and daily averagetemperature at rkm 7, from February 26 to June 16, 1998.

20
0
100
200
300
400
500
600
2/22 3/1 3/8 3/1
53/2
23/2
9 4/5 4/12
4/19
4/26 5/3 5/1
05/1
75/2
45/3
1 6/7 6/14
Date
Num
ber o
f Fis
h C
aptu
red
0
1000
2000
3000
4000
5000
6000
Dis
char
ge (c
fs)
Natural SteelheadAverage Discharge (cfs)
0
100
200
300
400
500
600
2/22 3/1 3/8 3/1
53/2
23/2
9 4/5 4/12
4/19
4/26 5/3 5/1
05/1
75/2
45/3
1 6/7 6/14
Date
Num
ber o
f Fis
h C
aptu
red
0
2
4
6
8
10
12
Tem
pera
ture
(C)
Natural SteelheadAverage Temperature (C)
Figure 13. The daily catch of natural steelhead at the lower trap and daily average discharge at theImnaha stream gauge (1329000), from February 26 to June 16, 1998.
Figure 14. The daily catch of natural steelhead at the lower trap and daily average temperature atrkm 7, from February 26 to June 16, 1998.

21
0
150
300
450
600
750
900
2/22 3/1 3/8 3/1
53/2
23/2
9 4/5 4/12
4/19
4/26 5/3 5/1
05/1
75/2
45/3
1 6/7 6/14
Date
Num
ber o
f Fis
h C
aptu
red
0
1000
2000
3000
4000
5000
6000
Dis
char
ge (c
fs)
Hatchery Steelhead Average Discharge (cfs)
0
150
300
450
600
750
900
2/22 3/1 3/8 3/1
53/2
23/2
9 4/5 4/12
4/19
4/26 5/3 5/1
05/1
75/2
45/3
1 6/7 6/14
Date
Num
ber o
f Fis
h C
aptu
red
0
2
4
6
8
10
12
Tem
pera
ture
(C)
Hatchery SteelheadAverage Temperature (C)
Figure 15. The daily catch of hatchery steelhead at the lower trap and daily average discharge atthe Imnaha stream gauge (1329000), from February 26 to June 16, 1998.
Figure 16. The daily catch of hatchery steelhead and daily average temperature at rkm 7, fromFebruary 26 to June 16, 1998.

22
Biological Characteristics
Natural chinook salmon caught in the fall of 1997 at the upper Imnaha River trap averaged89 mm in fork length (n = 2,067) and ranged from 55-128 mm (Figure 17). Mean weight ofnatural chinook salmon was 7.9 g (n = 1,994) with a range of 1.7-24.7 g. The average conditionfactor was 1.1 with a range of 0.7-1.6 (Table 5). Natural steelhead caught in fall of 1997 at theupper Imnaha River trap averaged 120 mm in fork length (n = 24) and ranged from 56-225 mm(Figure 18). Mean weight of natural steelhead was 20.4 g (n = 23) with a range of 1.8-92.2 g. The average condition factor was 1.01 with a range of 0.78-1.45. Natural chinook salmon caughtin the fall of 1997 at the lower Imnaha River trap site averaged 95 mm in fork length (n = 1,491)and ranged from 73-147 mm. The mean weight and condition factor was 9 g (n = 1,488) and1.04, respectively with ranges of 3.9-32.1 g and 0.57-1.6 (Table 5). Natural chinook salmoncollected at the lower trap were significantly larger in fork length (p<0.05) than the naturalchinook salmon collected at the upper trap. T-test values for 1998 are presented in Appendix F. Natural steelhead averaged 146 mm in fork length (n = 118) and ranged from 69-221 mm. Themean weight and condition factor was 38.4 g (n = 115) and 1.04, respectively with ranges of 4.2-107.1 g and 0.80-1.34.
Based on length frequency data, the majority of chinook salmon and steelhead emigrantscollected in the screw trap during the spring were age I and II, respectively (Figures 19 and 20). Hatchery reared chinook salmon smolts were significantly larger (p<0.05) than their naturalcounterparts. The size of hatchery chinook salmon has been significantly larger than their naturalcounter parts since 1994 (Ashe et al. 1995, Blenden et al. 1996 to 1998). Mean length of naturalchinook salmon 1998 spring emigrants was 106 mm, mean weight was 12.7 g, and the meancondition factor was 1.05 (Table 5). Weekly mean lengths of natural chinook salmon throughoutthe spring emigration period, ranged from 102 to 110 mm and mean condition factors of naturalchinook salmon ranged from 1.03 to 1.13 (Figure 21). Mean length of hatchery reared chinooksalmon caught during the spring was 135 mm and mean weight was 27.2 g (Table 5). Meancondition factor for hatchery chinook salmon smolts was 1.08. Weekly mean lengths for hatcherychinook salmon smolts ranged from 139 mm to 129 mm and decreased during the four weekperiod (Figure 22). Fish captured during the week ending April 11 averaged 138 mm in forklength. They were significantly larger (p < 0.05) than those captured during the week endingApril 18, with an average fork length of 132 mm. Fish captured during the week ending April 25averaged 132 mm and were significantly larger than those captured during the week ending May 2(p< 0.05). Fish captured during the week ending May 2 averaged 128 mm. Weekly meancondition factors during the four week period ranged from 1.02 to 1.10.
Natural steelhead spring smolts mean length was 177 mm, mean weight was 56.8 g, andmean condition factor was 0.99 (Table 5). Weekly mean lengths and condition factor for naturalsteelhead smolts ranged from 143 to 186 mm and 0.90 to 1.01, respectively (Figure 23). Hatchery steelhead were significantly larger (p<0.05), with a mean length of 218 mm and a mean weight of102.0 g. The mean condition factor for hatchery steelhead was 0.96. The size of hatchery steelhead has been significantly larger than their natural counterparts since 1994 (Ashe et al.

23
0
4
8
12
16
20
55 70 85 100 115 130 145 160 175 190 205 220
Fork Length (mm)
Freq
uenc
y (%
) .
Natural Steelhead, Upper Site (n = 24)Natural Steelhead, Lower Site (n = 118)
0
5
10
15
20
25
30
55 65 75 85 95 105 115 125 135
Fork Length (mm)
Freq
uenc
y (%
)
Natural Chinook, Upper Site (n = 2,067)Natural Chinook, Lower Site (n = 1,491)
Figure 17. Length frequency of natural chinook salmon trapped in the upper and lower ImnahaRiver traps, October 14 to December 19, 1997.
Figure 18. Length frequency of natural steelhead (and rainbow trout) trapped in the upper andlower Imnaha River traps, October 14 to December 19, 1997.

24
Table 5. Mean and range of fork length (mm), weight (g), and condition factor for natural andhatchery chinook salmon and steelhead smolts collected at the Imnaha River screw trap fromOctober 14 to December 19, 1997 and February 26-27 and March 4 to June 16, 1998.
Chinook salmon SteelheadNatural Hatchery Natural Hatchery
Fall, (Upper Trap)Sample Size 2,067 NA 24 NAMean Fork Length 89 120Range 55 - 128 56 - 225Standard Deviation 7.6 37.6
Sample Size 1,994 NA 23 NAMean Weight 7.9 20.4Range 1.7 - 24.7 1.8 - 92.2Standard Deviation 2.1 25.7
Sample Size 1,994 NA 23 NAMean K 1.1 1.01Range 0.7 - 1.6 0.78 - 1.45Standard Deviation 0.10 1.0
Fall, (Lower Trap)Sample Size 1,491 NA 118 NAMean Fork Length 95 146Range 73 - 147 69 - 221Standard Deviation 8.3 43.1
Sample Size 1,488 NA 115 NAMean Weight 9.0 38.4Range 3.9 - 32.1 4.2 - 107.1Standard Deviation 2.5 20.9
Sample Size 1,488 NA 115 NAMean K 1.04 1.04Range 0.57 - 1.6 0.80 - 1.34Standard Deviation 0.09 0.13
Spring, (Lower Trap)Sample Size 3,969 3,098 2,843 3,890Mean Fork Length 106 135 177 218Range 75 - 133 103 - 220 120 - 260 137 - 294Standard Deviation 7.9 11.1 20.7 20.0
Sample Size 3,951 2,269 2,842 1,665Mean Weight 12.7 27.2 56.8 102.0Range 4.4 - 44.1 10.5 - 190.0 16.7 - 184.0 39.6 - 228.7Standard Deviation 3.2 8.4 20.7 30.4
Sample Size 3,951 2,269 2,842 1,665Mean K 1.05 1.08 0.99 0.96Range 0.73 - 1.78 0.61 - 1.78 0.67 - 1.59 0.65 - 1.33Standard Deviation 0.09 0.10 0.07 0.07

25
0
5
10
15
20
25
30
70 85 100
115
130
145
160
175
190
205
Fork Length (mm)
Freq
uenc
y (%
)
Natural Chinook (n = 3,969) Hatchery Chinook (n = 3,098)
0
5
10
15
20
25
115
130
145
160
175
190
205
220
235
250
265
280
295
310
Fork Length (mm)
Freq
uenc
y (%
)
Natural Steelhead (n = 2,843) Hatchery Steelhead (n = 3,890)
Figure 19. Length frequency of natural and hatchery chinook salmon smolts trapped in the lowerImnaha River, February 26 to June 16, 1998.
Figure 20. Length frequency of natural and hatchery steelhead smolts trapped in the lower ImnahaRiver, February 26 to June 16, 1998.

26
020406080
100120140160
2/28 3/7 3/1
43/2
13/2
8 4/4 4/11
4/18
4/25 5/2 5/9 5/1
65/2
35/3
0 6/6 6/13
6/20
Week (last day)
Fork
Len
gth
(mm
)
0.600.680.750.830.900.981.051.131.20
Con
ditio
n Fa
ctor
Average Length Condition Factor
020406080
100120140160
2/28 3/7 3/1
43/2
13/2
8 4/4 4/11
4/18
4/25 5/2 5/9 5/1
65/2
35/3
0 6/6 6/13
6/20
Week (last day)
Fork
Len
gth
(mm
)
0.600.680.750.830.900.981.051.131.20
Con
ditio
n Fa
ctor
Average Length Condition Factor
Figure 21. Mean fork lengths and condition factors for natural chinook salmon captured in theImnaha screw traps, February 26 to June 16, 1998.
Figure 22. Mean fork lengths and condition factors for hatchery chinook salmon captured in theImnaha screw traps, February 26 to June 16, 1998.

27
80100120140160180200220240
2/28 3/7 3/1
43/2
13/2
8 4/4 4/11
4/18
4/25 5/2 5/9 5/1
65/2
35/3
0 6/6 6/13
6/20
Week (last day)
Fork
Len
gth
(mm
)
0.600.680.750.830.900.981.051.131.20
Con
ditio
n Fa
ctor
Average Length Condition Factor
Figure 23. Mean fork lengths and condition factors for natural steelhead captured in the Imnahascrew traps, February 26 to June 16, 1998.
1995, Blenden et al. 1996 to 1998). Weekly mean lengths and condition factor for hatcherysteelhead smolts ranged from 213 to 223 mm and 0.93 to 1.00, respectively (Figure 24). Appendix G contains mean daily length, weight and condition factors for captured natural andhatchery chinook salmon and steelhead smolts.
PIT Tag Release Groups
A total of 1,996 natural chinook salmon were PIT tagged at the upper Imnaha River trapbetween October 15 and November 15, 1997 (Table 6). Average fork length and weight was 89 mm and 7.9 g. Mean condition factor was 1.09. Weekly release group sample sizes rangedfrom 90 to 742 with the majority of the fish being tagged the week ending October 25. Averageweekly fork lengths ranged from 88 to 92 mm. Average weekly weight and condition factorsranged from 7.6 to 8.2 g and 0.98 to 1.12, respectively. At the lower Imnaha River trap we PITtagged and released 1,454 natural chinook salmon between October 16 and December 19, 1997(Table 6). Average fork length was 95 mm with an average weight and condition factor of 9.0 gand 1.04, respectively. Natural chinook salmon tagged at the lower trap were significantly larger(p < 0.05) than those tagged at the upper trap. Sample sizes of weekly release groups ranged from32 to 264. Mean weekly fork lengths ranged from 93 to 97 mm with mean weekly weightsranging from 8.5 to 10.5 g. Mean weekly condition factors ranged from 0.96 to 1.22.

28
80100120140160180200220240
2/28 3/7 3/1
43/2
13/2
8 4/4 4/11
4/18
4/25 5/2 5/9 5/1
65/2
35/3
0 6/6 6/13
6/20
Week (last day)
Fork
Len
gth
(mm
)
0.600.680.750.830.900.981.051.131.20
Con
ditio
n Fa
ctor
Average Length Condition Factor
Figure 24. Mean fork lengths and condition factors for hatchery steelhead captured in the Imnahascrew traps, February 26 to June 16, 1998.
We PIT tagged and released 3,956 natural chinook salmon, 2,000 hatchery chinooksalmon, 3,106 natural steelhead, and 3,859 hatchery steelhead from February 26 to June 16, 1998(Table 7). Tagging goals were met for hatchery chinook salmon but were not accomplished fornatural chinook salmon and natural and hatchery steelhead. The majority of natural chinooksalmon (45%) were tagged during the week of March 15. The majority of hatchery chinooksalmon (50%) were tagged during the week of April 5. The majority of natural and hatcherysteelhead (23% and 38%) were tagged during the weeks of April 19 and April 26 respectively. Information on PIT tag release groups are listed in Appendix H.
Spring PIT tagged natural chinook salmon averaged 106 mm in fork length and had anaverage weight of 12.7 g. Natural chinook salmon had an average condition factor of 1.05. Spring PIT tagged hatchery chinook salmon averaged 136 mm in fork length and had an averageweight of 27.5 g. Hatchery chinook salmon averaged a condition factor of 1.07. Spring PITtagged natural steelhead averaged 177 mm in fork length and had an average weight of 57.2 g. Natural steelhead had an average condition factor of 0.99. Spring PIT tagged hatchery steelheadaveraged 218 mm in fork length and had an average weight of 101.8 g. Hatchery steelhead had anaverage condition factor of 0.96 (Table 8).
The standard skewness value for the fork lengths of PIT tagged natural chinook salmonwas 4.13, indicating a significant departure from normality. The fork lengths of PIT tagged

29
Table 6. Weekly numbers of PIT tagged natural chinook salmon released into the Imnaha Riverfrom the upper and lower Imnaha screw traps from October 15 to December 19, 1997 .
Week Upper Trap Lower Trap10/12/97-10/16/97 249 3210/19/97-10/25/97 742 25910/26/97-11/1/97 497 26411/2/97-11/8/97 418 10211/9/97-11/15/97 90 18811/16/97-11/22/97 25011/23/97-11/29/97 15011/30/97-12/6/97 8512/7/97-12/13/97 8312/14/97-12/20/97 41
Totals 1,996 1,454
Table 7. Weekly numbers of PIT tagged fish released into the Imnaha River from the lowerImnaha screw trap from February 26 to June 16, 1998.
WeekNatural Chinook
salmonHatchery Chinook
salmon Natural Steelhead Hatchery Steelhead2/22/98 - 2/28/98 143/1/98 - 3/7/983/8/98 - 3/14/98 19 13/15/98 - 3/21/98 1,698 413/22/98 - 3/28/98 280 283/29/98 - 4/4/98 611 2474/5/98 - 4/11/98 218 1,007 834/12/98 - 4/18/98 457 987 1804/19/98 - 4/25/98 491 6 714 84/26/98 - 5/2/98 70 567 1,4495/3/98 - 5/9/98 2 164 174
5/10/98 - 5/16/98 51 357 6615/17/98 - 5/23/98 41 712 1,4025/24/98 - 5/30/985/31/98 - 6/6/98 2 10 426/7/98 - 6/13/98 2 1006/14/98 - 6/20/98 2 23
Totals 3,956 2,000 3,106 3,859

30
Table 8. Mean and range of fork length (mm), weight (g), and condition factor for natural andhatchery chinook salmon and steelhead smolts collected and PIT tagged at the Imnaha Riverscrew trap from February 26 to June 16, 1998.
Chinook salmon SteelheadStatistic Natural Hatchery Natural Hatchery
Sample Size 3,933 1,987 2,768 3,847Mean Fork Length 106 136 177 218Range 75 - 133 103 - 201 120 - 260 137 - 304Standard Deviation 7.9 11.4 20.3 20.0
Sample Size 3,912 1,161 2,768 1,621Mean Weight 12.7 27.5 57.2 101.8Range 4.4 - 44.1 10.6 - 87.5 16.7 - 184.0 30.2Standard Deviation 3.2 7.9 20.5 39.6 - 228.7
Sample Size 3,912 1,159 2,767 1,621Mean K 1.05 .61 - 1.69 0.99 0.96Range 0.73 - 1.78 1.07 0.67 - 1.59 0.65 - 1.33Standard Deviation 0.1 0.1 0.1 0.1
hatchery chinook, natural steelhead, and hatchery steelhead also had standard skewness valuesoutside of the range of ±2, or non-normal distributions. Therefore, medians were compared usingthe Wilcoxon test instead of a students t-test to compare the means. Wilcoxon test values for1998 are presented in Appendix I. There were no significant differences between the median forklengths of tagged and non-tagged natural chinook salmon, and tagged and non-tagged hatcherysteelhead (p > 0.05). Tagged natural chinook salmon represented 94.3% of all natural chinooksalmon captured. Tagged hatchery steelhead represented 75.1% of all hatchery steelheadcaptured. There were statistically significant differences between fork lengths of tagged and non-tagged hatchery chinook salmon, and tagged and non-tagged natural steelhead. Thesedifferences were not considered biologically significant for hatchery chinook salmon. Theaverage fork length of PIT tagged hatchery chinook salmon was 136 mm and the median was 135mm (n = 1,987). The average length of non-PIT tagged hatchery chinook salmon was 134 mmand the median was 133 (n = 1,111).
The average fork length of PIT tagged natural steelhead was 177 mm (n = 2,768). Theaverage fork length of non-PIT tagged natural steelhead was 160 mm (n = 74). These averages donot include the lengths of 31 non-PIT tagged natural steelhead between 75 and 119 mm and 14PIT tagged natural steelhead less than 120 mm. The reason for the exclusion of these small fishwas that steelhead greater than 120 mm were selected for PIT tagging and fish less than 120 mmwere reported as rainbow trout. PIT tagged natural steelhead represented 87% of all fish capturedin the trap. Therefore, we feel that the PIT tagged portion was representative of Imnaha natural

31
steelhead captured in the trap.
There were nine weekly release groups of natural steelhead of 30 or more individuals,ranging from 41 to 714 fish during the spring (Table 7). These nine groups represent 98.7% of allPIT tagged natural steelhead and 85.9% of all natural steelhead captured. Mean weekly forklengths ranged from 149 to 186 mm. Weekly condition factors ranged from 0.93 to 1.00. Six ofthe nine weekly release groups of natural steelhead contained 200 or more individuals. Therewere six weekly release groups of hatchery steelhead of 30 or more individuals ranging from 42 to1,402 fish during the spring (Table 7). These six groups represent 99.2% of all PIT taggedhatchery steelhead or 74.5% of all hatchery steelhead captured. Mean weekly fork lengths rangedfrom 214 to 223 mm. Weekly condition factors ranged from 0.93 to 0.98. Three of the nineweekly release groups of hatchery steelhead contained 200 or more individuals.
Emigration Timing and Trends of Previously PIT Tagged Fish
NPT released 1,996 PIT tagged natural chinook salmon between October 15 andNovember 15, 1997 and ODFW released 1,010 PIT tagged natural chinook salmon on September8 and 9, 1997 in the upper Imnaha River. We recaptured 124 (6.2%) and 26 (2.6%) of these fish,respectively, at the lower trap from February 27 to May 19. The peak catch of previously PITtagged natural chinook salmon (n = 22) occurred on March 17 (Figure 25). The following daythe peak catch of non-PIT tagged natural chinook salmon occurred. There were a total of 3,371hatchery chinook salmon recaptured (17%) from the release of 19,827 PIT tagged fish. The peakcatch of previously PIT tagged hatchery chinook salmon (n = 933) occurred on April 9 (Figure26). This was the same day as the peak catch of non-PIT tagged fish. Recapture dates rangedfrom April 6 to May 12. Mean travel time for hatchery chinook salmon smolts from theacclimation facility to the Imnaha River screw trap was four days. The median arrival date ofnatural chinook salmon, tagged in the fall by NPT, occurred on March 20 and 90 % arrivaloccurred on April 22 (Figure 27). Hatchery chinook salmon’s median arrival date occurred onApril 10 and 90% arrival occurred on April 14 (Figure 27).
The traps may not have captured the majority of the PIT tagged hatchery steelhead. Therewere a total of 20 hatchery steelhead recaptured from the release of 867 PIT tagged fish from theacclimation facility. Recapture dates ranged from April 26 to May 22. Half of the hatcherysteelhead arrived by May 2 and 90% arrived on May 19. Flows greater than 2,000 cfs during theweek of May 3 and May 24 may have decreased our ability to trap hatchery steelhead effectively.
Smolt Yield
The SURPH model was used to estimate post-release survival and smolt yield of hatcherychinook salmon smolts from the acclimation facility release to the lower Imnaha River trap site asin 1997. Trap efficiency trials were conducted as in past years but we placed no confidence in theresulting bootstrap estimate (Table 9). Future Bootstrap population estimates for hatcherychinook salmon should be carefully examined and trap efficiency trial methods tested for biases.

32
0
5
10
15
20
25
30
2/22
3/15
3/22
3/29 4/5 4/1
24/1
94/2
6
Date
Num
ber o
f Fis
h C
aptu
red
0
700
1400
2100
2800
3500
4200
Flow
(cfs
)
-
PIT Tagged Natural Chinook Average Flow
n =
1
0
200
400
600
800
1000
1200
2/22 4/5 4/1
24/1
94/2
6 5/3 5/10
5/17
Date
Num
ber o
f Fis
h C
aptu
red
0
700
1400
2100
2800
3500
4200
Flow
(cfs
)
-
PIT Tagged Hatchery Chinook Average Flow
Figure 25. The number of previously PIT tagged natural chinook salmon captured from February26 to June 16, 1998. Dashed lines represent a departure from the scale of the x axis.
Figure 26. The number of previously PIT tagged hatchery chinook salmon captured fromFebruary 26 to June 16, 1998. Dashed lines represent a departure from the scale of the x axis.

33
0
20
40
60
80
100
2/22 3/1 3/8 3/1
53/2
23/2
9 4/5 4/12
4/19
4/26 5/3 5/1
05/1
75/2
4
Date
Arr
ival
Fre
quen
cy (%
) Natural ChinookHatchery Chinook
Figure 27. The arrival frequency of previously PIT tagged natural chinook salmon, released fromOctober 15 to November 15 at the upper trap and hatchery chinook salmon, released at theacclimation facility April 6, at the lower Imnaha traps during the spring of 1998.
Survival for PIT tagged hatchery chinook salmon smolts, from release at the Imnaha Riveracclimation facility to the screw trap, was estimated at 88.4% using the SURPH based Jolly-SeberCormack method (Table 9). The 95% confidence interval around the point estimate was 1.0%.This estimate was based on 3,371 interrogations of PIT tagged fish at the Imnaha River trap siteand subsequent interrogations at downstream interrogation sites. The interrogations at theImnaha River trap represents 17% of all PIT tagged hatchery chinook salmon released and theSURPH estimate represented a smolt yield of 82,324 fish at the screw trap.
Trap efficiency trials were conducted from April 8 to April 16 (Appendix J). The averagedaily flows during this period ranged from 598.4 to 698.5 cfs. The mean trap efficiency wasestimated at 29.4% in 1998, based on 2,683 marked fish and nine trials. This was higher thanobservations from 1994 to 1996. The resulting bootstrap estimate, based on the mean trapefficiency, was 60,252 fish. The 95% confidence interval around this point estimate was ±3,599. The estimate accounted for 65% of the hatchery chinook salmon released. After April 17 anadditional 600 fish were captured. Using the season trap efficiency average of 29% for thefollowing five weeks of operation results in an additional yield of 2,070 fish ±183. The additionof these fish results in a survival estimate, from release at the acclimation facility to the Imnahatrap site, of 67% . The 95% confidence intervals around this point estimate is 6.0%. We feel thatthis estimate is low because the SURPH program estimated survival, from release at theacclimation facilty to the lower trap, at 0.884 (95% confidence interval of 0.010) and survivalfrom the trap to LGR at 0.773 (95% confidence interval of 0.011). The product of the estimatesfor these two reaches would be 68.3%. The 95% confidence of the bootstrap point estimate to the

34
Table 9. The mean trap efficiency, PIT tag interrogation percentage and estimated survival fromrelease to trap (bootstrap and SURPH) and release to Lower Granite Dam (LGR) for hatcherychinook salmon smolts from 1994 to 1998.
Year Mean TrapEfficiency
(%)
PIT TagInterrogations
at Screw Trap (%)
Estimated Survival
Release to TrapSURPH (%) Bootstrap (%)
Release toLGR5 (%)
1998 29.41 17.0 88.4 66.92 68.3
1997 45.91 19.6 89.2 442 61.6
1996 11.6 10.6 95 101.7 56.8
19953 --- 10.8 92.6 --- 61.8
1994 13.84 6.2 100.9 88.1 68.51 Over-estimate of trap efficiency.2 Under-estimate of smolt yield based on the bootstrap method.3 Based on one trap efficiency trial.4 Data for HxW crossed chinook salmon smolts released on March 28.5 SURPH based estimate after Blenden et al. 1998.
lower trap overlaps the SURPH point estimate from the acclimation facility to LGR. There maybe no significant differences between the estimates, but survival from the acclimation facility tothe trap should not be higher than survival from acclimation facility to LGR.
There appears to have been a statistical size related bias in trapping of hatchery rearedchinook salmon smolts used in trap efficiency trails. Mean fork length of hatchery chinooksalmon smolts marked and released for trap efficiency trials was 132.9 mm (n=1,071). This wassignificantly different (p<0.05) than the mean fork length of 135.2 mm for recaptured hatcherychinook salmon used in trap efficiency trials (n=667). However, the 2.3 mm may not bebiologically significant. Similar differences were observed during a previous study with naturalchinook salmon marked and recaptured in the upper Imnaha River (Gaumer 1968). Gaumerreported significant differences in two of seven trials. Mean fork lengths were 3.9 and 2.7 mmgreater for recaptured fish in a ditch diversion trap. The difference in the recaptured fork lengthwas attributed to differential mortality by size of fish at marking or predators, smaller fish passingover the rotary screen, or poor detection of marks (Gaumer 1968).
Estimated Smolt Survival
Estimated survival of 1997 fall tagged natural chinook salmon from the upper trap site toLGR, using the program SURPH, was 45.9%, with 95% confidence interval of 3.1%(Table 10). This survival rate was approximately twice as much as the estimated survival in 1993 (22.4%) and

35
1995 (0.257) from the upper trap. Some estimates in Table 10 are greater than one. This ispossible when survival to the previous site was underestimated. Minimum survival to LGR, usingcumulative detections of unique PIT tags at LGR, LGO, LMO, and MCN, was 39.8%. Fall taggedchinook salmon from release at the upper trap to LMO had an estimated survival of 0.393. Appendix K contains details of first observations of PIT tag detections at LGR, LGO, LMO, andMCN for daily release groups of natural and hatchery chinook salmon and steelhead.
Natural chinook salmon trapped at the lower trap site in 1997 had a seasonal survivalestimate of 0.604, with a confidence interval of 0.043, from the trap to LGR. This survivalestimate nearly doubled earlier estimates from 1993 to 1995. This estimate is 0.145 higher thanfall tagged natural chinook salmon released at the upper site. However, this is considered aminimum survival estimate because it is unknown if fall PIT tagged chinook salmon continue tomigrate downstream through the dams during fall and winter before PIT tag interrogation systemsare operational in the spring. Cumulative detections of fall PIT tagged natural chinook salmonfrom the lower site at LGR, LGO, LMO, and MCN totaled 707 fish, or 48.6%. Fall taggedchinook salmon, from release at the lower trap to LMO, had an estimated survival of 0.497.
Table 10. Season-wide survival estimates from the upper and lower traps to Lower Granite Dam(LGR), Lower Granite Dam to Little Goose Dam, (LGO), Little Goose Dam to Lower MonumentalDam (LMO), and Lower Monumental Dam to McNary Dam (MCN) for fish released from October14 to December 16, 1997 at the upper and lower Imnaha traps and February 26 to June 16 at thelower trap. Ninety-five percent confidence intervals (C.I.) are shown to the right in parentheses.
Season, SiteRearing Species
NumberReleased
Trap to LGR( 95% C.I.)
LGR to LGO(95% C.I.)
LGO to LMO(95% C.I.)
LMO to MCN(95% C.I.)
Fall, Upper SiteNatural Chinooksalmon
1,996 0.459 (0.031) 1.010 (0.038) 0.848 (0.110) 1.077 (0.402)
Fall, Lower SiteNatural Chinooksalmon
1,453 0.604 (0.043) 1.052 (0.071) 0.782 (0.147) 0.873 (0.269)
Spring, Lower SiteNatural Chinooksalmon
3,956 0.852 (0.020) 1.034 (0.041) 0.849 (0.059) 1.050 (0.186)
Spring, Lower SiteHatchery Chinooksalmon
2,000 0.757 (0.031) 1.002 (0.063) 0.848 (0.098) 0.845 (0.257)
Spring, Lower SiteNatural Steelhead 3,106 0.860 (0.022) 0.996 (0.051) 0.795 (0.071) 0.939 (0.298)
Spring, Lower SiteHatchery Steelhead 3,859 0.829 (0.024) 0.930 (0.047) 0.824 (0.071) 1.004 (0.331)

36
The season-wide estimate for natural chinook salmon released from the Imnaha River trap to LGR, March 15 to April 25, was 0.852 with a 95% confidence interval of 0.020 (Table 10). This estimate is 0.248 higher than natural chinook salmon released from the same point in the fall. However, as previously mentioned, it is unknown if fall PIT tagged chinook salmon continue tomigrate downstream through the dams during fall and winter before PIT tag interrogation systemsare operational in the spring. The cumulative percentage of unique PIT tags interrogated at LGR,LGO, LMO, and MCN was 74.4% (n = 3,956). Appendix L contains the cumulative interrogationpercentages from 1993 to 1998. Survival estimates from 1993 to 1998 have ranged from 0.762 in1994 to 0.909 in 1995. The 95% confidence intervals were 0.053 and 0.067, respectively (Figure28). Seasonal survival estimates prior to 1998 in this report for natural and hatchery chinooksalmon and steelhead represent the latest calculations by NPT and preceded estimations presentedin previous annual reports. The smaller confidence interval for 1998 reflects the largest releasegroup of natural chinook salmon from the Imnaha river. Sample sizes for estimates prior to 1998ranged from 238 to 1,310. There are no apparent trends in survival of Imnaha River naturalchinook salmon, from 1993 to 1998.
Hatchery chinook salmon, released from the Imnaha River trap to LGR, had a season-widesurvival estimate of 0.757 with a 95% confidence interval of 0.031. This was within the range ofestimates from 1994 to 1997 (Figure 29). The lowest survival estimate to LGR was 67.1%,occurring in 1994, and the highest estimate was 0.804, occurring in 1997. PIT tag release groups,used in estimates from 1994 to 1997, ranged from 662 to 999 fish. The cumulative percentage ofunique PIT tags interrogated in 1998 at LGR, LGO, LMO, and MCN was 64.2% (n = 2,000). Thisis the highest cumulative interrogation rate since 1992. No PIT tagged hatchery chinook salmonsmolts were released from the Imnaha River screw trap in 1993. In 1992, cumulative interrogationpercentages did not include LMO as it was not yet an interrogation site.
Season wide survival for natural steelhead released from the Imnaha River trap to LGR was0.860 (Table 10). The 95% confidence interval was 0.022. This is the lowest seasonal estimatereported since 1995 (Figure 30). Natural steelhead have had fairly consistent survival estimatesthat ranged from 0.837 in 1995 to 0.901 in 1997. The 95% confidence intervals were 0.071 and0.039. The cumulative percentage of unique PIT tags interrogated at LGR, LGO, LMO, and MCNin 1998 was 71.5% (n = 3,106). This currently represents the largest group of natural steelheadreleased into the Imnaha River. PIT tag release groups, used for cumulative interrogations prior to1998, have ranged from 227 to 1,502 fish.
The estimated season-wide survival for hatchery steelhead released from the Imnaha Rivertrap to LGR was 0.829 with a 95% confidence interval of 0.024. This was the highest estimatedsurvival since 1995 (Figure 31). Estimated season-wide survival from the lower trap to LGR for1995 was 0.775, with a 95% confidence interval of 0.031. However, the 1998 estimate is onlyslightly higher than the estimate for 1997 of 0.814 with a 95% confidence interval of 0.020 and the1998 95% confidence interval overlaps 95% confidence intervals for 1997 and 1995. The lowestseasonal survival estimate to LGR was 0.646, occurring in 1996 with a 95% confidence interval of0.047. The cumulative percentage of unique PIT tags interrogated at LGR, LGO, LMO, and MCNin 1998 was 65.4% (n = 3,859). Survival estimates and cumulative interrogation rates for 1993 and

37
0102030405060708090
100
1993 1994 1995 1996 1997 1998
Year
Surv
ival
Est
imat
e (%
) * *
0102030405060708090
100
1994 1995 1996 1997 1998
Year
Surv
ival
Est
imat
e (%
)
Figure 28. Season-wide survival estimates for natural chinook salmon released from the ImnahaRiver trap to Lower Granite Dam, from 1993 to 1998. Error bars indicate 95% confidence limits.Asterisks indicate upper confidence levels greater than 100%.
Figure 29. Season-wide survival estimates for hatchery chinook salmon released from the ImnahaRiver trap to Lower Granite Dam, from 1994 to 1998. Error bars indicate 95% confidence limits.

38
0102030405060708090
100
1995 1996 1997 1998
Year
Surv
ival
Est
imat
e (%
)
0102030405060708090
100
1995 1996 1997 1998
Year
Surv
ival
Est
imat
e (%
)
Figure 30. Season-wide survival estimates for natural steelhead released from the Imnaha Rivertrap to Lower Granite Dam, from 1995 to 1998. Error bars indicate the 95% confidence limit.
Figure 31. Season-wide survival estimates for hatchery steelhead released from the Imnaha Rivertrap to Lower Granite Dam, from 1995 to 1998. Error bars indicate the 95% confidence limit.
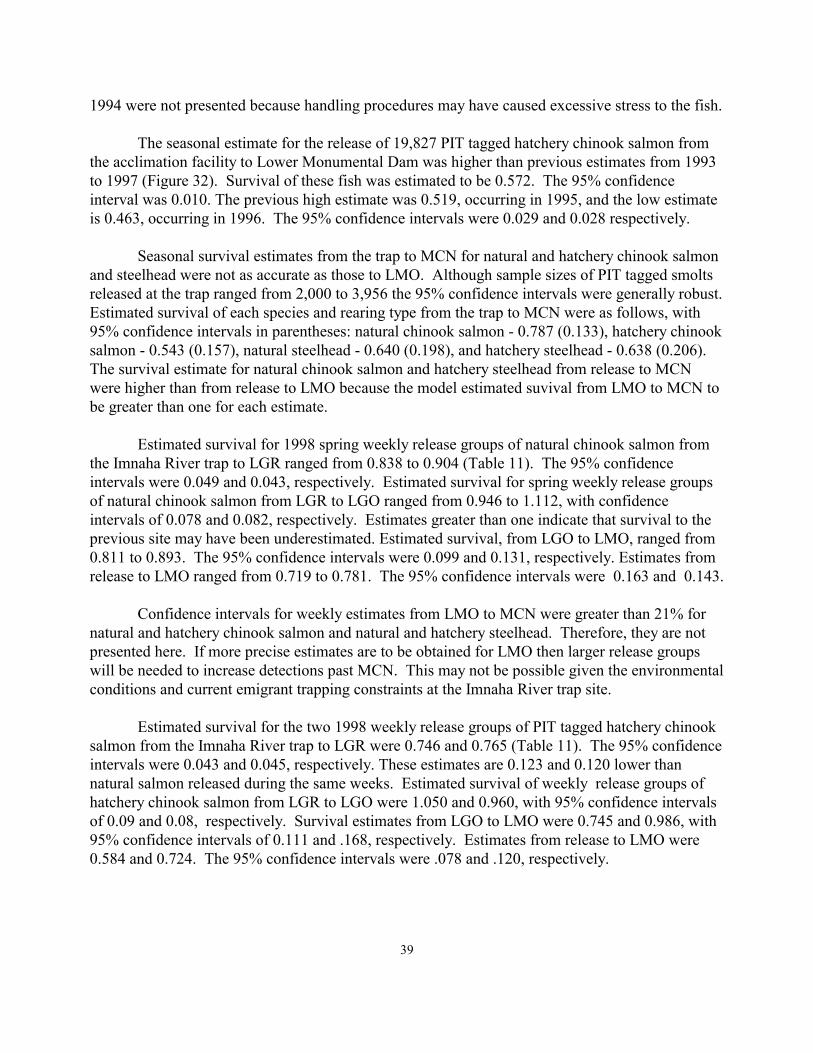
39
1994 were not presented because handling procedures may have caused excessive stress to the fish.
The seasonal estimate for the release of 19,827 PIT tagged hatchery chinook salmon fromthe acclimation facility to Lower Monumental Dam was higher than previous estimates from 1993to 1997 (Figure 32). Survival of these fish was estimated to be 0.572. The 95% confidenceinterval was 0.010. The previous high estimate was 0.519, occurring in 1995, and the low estimateis 0.463, occurring in 1996. The 95% confidence intervals were 0.029 and 0.028 respectively.
Seasonal survival estimates from the trap to MCN for natural and hatchery chinook salmonand steelhead were not as accurate as those to LMO. Although sample sizes of PIT tagged smoltsreleased at the trap ranged from 2,000 to 3,956 the 95% confidence intervals were generally robust. Estimated survival of each species and rearing type from the trap to MCN were as follows, with95% confidence intervals in parentheses: natural chinook salmon - 0.787 (0.133), hatchery chinooksalmon - 0.543 (0.157), natural steelhead - 0.640 (0.198), and hatchery steelhead - 0.638 (0.206). The survival estimate for natural chinook salmon and hatchery steelhead from release to MCNwere higher than from release to LMO because the model estimated suvival from LMO to MCN tobe greater than one for each estimate.
Estimated survival for 1998 spring weekly release groups of natural chinook salmon fromthe Imnaha River trap to LGR ranged from 0.838 to 0.904 (Table 11). The 95% confidenceintervals were 0.049 and 0.043, respectively. Estimated survival for spring weekly release groupsof natural chinook salmon from LGR to LGO ranged from 0.946 to 1.112, with confidenceintervals of 0.078 and 0.082, respectively. Estimates greater than one indicate that survival to theprevious site may have been underestimated. Estimated survival, from LGO to LMO, ranged from0.811 to 0.893. The 95% confidence intervals were 0.099 and 0.131, respectively. Estimates fromrelease to LMO ranged from 0.719 to 0.781. The 95% confidence intervals were 0.163 and 0.143.
Confidence intervals for weekly estimates from LMO to MCN were greater than 21% fornatural and hatchery chinook salmon and natural and hatchery steelhead. Therefore, they are notpresented here. If more precise estimates are to be obtained for LMO then larger release groupswill be needed to increase detections past MCN. This may not be possible given the environmentalconditions and current emigrant trapping constraints at the Imnaha River trap site.
Estimated survival for the two 1998 weekly release groups of PIT tagged hatchery chinooksalmon from the Imnaha River trap to LGR were 0.746 and 0.765 (Table 11). The 95% confidenceintervals were 0.043 and 0.045, respectively. These estimates are 0.123 and 0.120 lower thannatural salmon released during the same weeks. Estimated survival of weekly release groups ofhatchery chinook salmon from LGR to LGO were 1.050 and 0.960, with 95% confidence intervalsof 0.09 and 0.08, respectively. Survival estimates from LGO to LMO were 0.745 and 0.986, with95% confidence intervals of 0.111 and .168, respectively. Estimates from release to LMO were0.584 and 0.724. The 95% confidence intervals were .078 and .120, respectively.

40
0
10
20
30
40
50
60
70
1993 1994 1995 1996 1997 1998
Year
Surv
ival
Est
imat
e (%
)
Figure 32. Estimated survival of hatchery reared chinook salmon smolts released at the ImnahaRiver acclimation facility to Lower Monumental Dam from 1993 to 1998 and 95% confidenceintervals. Confidence intervals were not available for the 1997 estimates (after Smith et al. 1998,cited in Kucera, 1998).
Natural steelhead survival, from the Imnaha River trap to LGR, ranged from 0.798 to 0.889for weekly release groups (Table 11). The 95% confidence intervals were 0.056 and 0.050,respectively. Survival from LGR to LGO ranged from 0.863 to 1.072. The 95% confidenceintervals were 0.154 and 0.143. Estimated survival from LGO to LMO ranged from 0.636 to0.843, with 95% confidence intervals of 0.135 and 0.107, respectively. Estimates from release toLMO ranged from 0.606 to 0.749. The 95% confidence intervals were 0.102 and 0.084,respectively.
Weekly release groups of hatchery steelhead, from the Imnaha River trap to LGR, hadsurvival estimates ranging from 0.774 to 0.869. The 95% confidence intervals were 0.068 and 0.027 (Table 11). Estimated survival for spring weekly release groups of hatchery steelhead fromLGR to LGO ranged from 0.824 to 0.920. The 95% confidence intervals were 0.127 and 0.060,respectively. The survival of hatchery steelhead from LGO to LMO released during the week ofApril 26 and May 24 were estimated to have survival rates of 0.796 and 0.775, with 95%confidence intervals of 0.082 and 0.119, respectively. No survival estimate was presented forhatchery steelhead released during the week of May 10 because confidence intervals were greaterthan 0.200 (Table 11). Survival estimates for weekly release groups of hatchery steelhead during

41
Table 11. Estimated survival probabilities for salmonid smolts released from the lower ImnahaRiver trap from February 26 to June 16, 1998 with 95% confidence limits in parentheses. Estimates are from release to the tail race for the trap to Lower Granite Dam and tailrace to the tailrace for all other sites. Abbreviations: LGR-Lower Granite Dam, LGO-Little Goose Dam, LMO-Lower Monumental Dam.
Week ofRelease
NumberReleased
Trap to LGR(95% C.I.)
LGR to LGO(95% C.I.)
LGO to LMO(95% C.I.)
Trap to LMO(95% C.I.)
Natural Chinook salmon
3/15 1,698 0.849 (0.033) 1.112 (0.082) 0.811 (0.099) 0.766 (0.078)
3/22 280 0.849 (0.094) 1.019 (0.178)
3/29 611 0.838 (0.049) 1.059 (0.099) 0.880 (0.172) 0.781 (0.143)
4/5 218 0.867 (0.070) 0.986 (0.105) 0.842 (0.196) 0.719 (0.163)
4/12 457 0.886 (0.051) 0.941 (0.080) 0.900 (0.141) 0.750 (0.110)
4/19 491 0.904 (0.043) 0.989 (0.072) 0.807 (0.107) 0.721 (0.090)
Hatchery Chinook salmon
4/5 1,007 0.746 (0.043) 1.050 (0.090) 0.745 (0.111) 0.584 (0.078)
4/12 987 0.765 (0.045) 0.960 (0.080) 0.986 (0.168) 0.724 (0.120)
Natural Steelhead
3/29 247 0.838 (0.082) 0.863 (0.154)
4/19 714 0.889 (0.050) 1.072 (0.143) 0.636 (0.135) 0.606 (0.102)
4/26 567 0.880 (0.039) 1.010 (0.084) 0.843 (0.107) 0.749 (0.084)
5/10 357 0.798 (0.056) 0.982 (0.121) 0.802 (0.192) 0.629 (0.141)
5/24 712 0.849 (0.074) 0.966 (0.145)
Hatchery Steelhead
4/26 1,449 0.869 (0.027) 0.920 (0.060) 0.796 (0.082) 0.636 (0.061)
5/10 661 0.774 (0.068) 0.824 (0.127)
5/24 1,402 0.838 (0.054) 0.886 (0.096) 0.775 (0.119) 0.575 (0.074)

42
0
20
40
60
80
1994 1995 1996 1997 1998
Release Year
Estim
ated
Mor
talit
y (%
) -
Release to IMNTRP IMNTRP to LGR LGR to LGO LGO to LMO
1 11 1 1
2 22
2 2
1 2
the week of April 26 and May 24, from the Imnaha River trap to LMO, were 0.636 and 0.575, withconfidence intervals of 0.061 and 0.074, respectively.
Kucera and Blenden (1998) reported that Imnaha River hatchery chinook salmon smoltsreleased at the acclimation facility experienced the highest reach specific mortality from theImnaha River trap to LGR. Our results for 1998 are consistent (Figure 33). Mortality between theImnaha trap and LGR was estimated to be 22.7 (±2.1%), for hatchery chinook salmon releasedfrom the acclimation facility. This is the lowest estimated mortality for this reach since 1994. Thehighest estimated was 38.6% in 1996. Mortality for hatchery chinook salmon released from theacclimation facility to the Imnaha trap was 11.6%. This is the highest in river post-releasemortality estimated since 1994 (Kucera and Blenden 1998). Prior to 1998, estimated survival forhatchery chinook released from the acclimation facility to the lower Imnaha trap had ranged from0% in 1994 to 10.8% in 1997.
The values in Table 10 indicate that hatchery chinook and steelhead experienced the highestreach specific mortality from the Imnaha River trap to LGR (Figure 34). Mortality in this sectionwas 24.3% for hatchery chinook salmon and 17.1% for hatchery steelhead. Natural chinook andsteelhead released during the spring had 14.8 and 14.0% mortality between the Imnaha river trapand LGR, but had higher mortality estimates between LGO and LMO of 15.1 and 20.5%,respectively. Values in Table 10 indicate that least amount of mortality occurred
Figure 33. Estimated mortality of hatchery reared chinook salmon smolts, by stream reach, fromrelease at the Imnaha River acclimation facility to Lower Monumental Dam from 1994 to 1998(after Smith et al. 1998, cited in Kucera 1998).

43
0
20
40
60
80
Natural Chinook Hatchery Chinook Natural Steelhead Hatchery Steelhead
Rearing Type and Species
Estim
ated
Mor
talit
y (%
) .
IMNTRP to LGR LGR to LGO LGO to LM0 LMO to MCJ1
1
1
Figure 34. Season-wide mortality of natural and hatchery reared chinook salmon and steelheadsmolts, by stream reach, from release at the Imnaha River trap to McNary Dam in 1998.
between LGR and LGO and limited mortality occurred between LMO and MCN. However, fourof the 6 estimates presented in Table 10 for the area between LGR and LGO are greater than oneand three of the 6 estimates presented in Table 10 for the area between LMO and MCN are greaterthan one. Estimates greater than one are not possible because the number of PIT tagged fishdetected at LGR and released back into the river can not exceed the number of PIT tagged fishdetected downstream at LGO unless the number of fish detected at LGR and released back into theriver were underestimated. This may have occurred if a significant portion of the PIT tagged fishwere not detected at LGR or if handling protocols at LGR were breached (e.g. fish were detected inroute to a barge and removed from the study and subsequent release group at LGR, but wereactually released into the river). Overestimation in a single reach should not invalidate the overallsurvival estimate because there are multiple recapture events where a fish can be detected but itdoes make assessing the mortality in these reaches problematic. Therefore, we recommend thatreaders view the data as an overall estimate of the season-wide mortality and bear in mind theproblems with using this data to assess reach specific mortality.
Arrival Timing
Natural chinook salmon PIT tagged in the fall of 1997, at the upper trap, arrived at LGRfrom April 3 to June 5 (n=454) with median and 90% arrival on April 27 and May 9 (Table 12). April 3 arrivals were represented by three fish. Arrival at LGO occurred from April 14 to May 28

44
Table 12. Arrival timing of PIT tagged Imnaha River natural chinook salmon smolts at LowerGranite, Little Goose, Lower Monumental, and McNary dams from 1993 to 1998.____________________________________________________________________________
Dam Year Sample Arrival Timing Size(n) Date Range Median 90%
______________________________________________________________________________
Lower Granite 1998a 454 April 3 - June 5 April 27 May 91998b 428 March 27 - May 12 April 14 April 241998 1,630 April 1 - June 27 April 25 May 61997 74 April 6-May 18 April 22 May 111996 421 April 6-June 12 April 30 May 181995 184 April 11-July 11 May 1 May 111994 348 April 14-June 23 April 24 May 111993 109 April 21-June 12 May 4 May 14
Little Goose 1998a 410 April 14 - May 28 May 4 May 151998b 228 April 11 - May 12 April 25 May 21998 837 April 14 - June 25 May 3 May 121997 70 April 15-May 22 April 26 May 111996 358 April 12-June 16 April 27 May 201995 144 April 15-July 15 May 7 May 201994 194 April 23-June 17 April 28 May 71993 46 April 27-June 2 May 3 May 16
Lower Monumental 1998a 304 April 15 - May 29 May 7 May 191998b 202 April 19 - May 19 April 25 May 41998 289 April 19 - June 8 April 30 May 111997 74 April 20-June 1 April 30 May 141996 359 April 13-June 15 May 10 May 221995 142 April 19-August 4 May 8 June 41994 215 April 25-July 26 May 1 May 241993 37 May 3-June 2 May 8 May 13
McNary 1998a 195 April 18 - June 4 May 4 May 181998b 236 April 20 - May 23 April 30 May 41998 187 April 19 - June 2 May 1 May 151997 24 April 22-May 19 May 1 May 121996 148 April 19-June 8 May 14 May 241995 89 April 28-July 9 May 12 May 211994 229 April 29-July 16 May 12 May 281993 20 May 3-June 15 May 9 May 21
______________________________________________________________________________a Tagged and released during the fall of 1997 from the upper trap site.b Tagged and released during the fall of 1997 from the lower trap site.

45
(n=410). Median and 90% arrival to LGO occurred on May 4 and May 15, respectively. Naturalchinook salmon emigrated past LMO between April 15 and May 29 (n=304), with median and90% passage dates of May 7 and May 19. Natural chinook salmon arrival at MCN ranged fromApril 18 to June 4 (n=195). Median and 90% arrival at MCN occurred on May 4 and May 18. These fish, assumed to overwinter in the Imnaha River, had similar arrival timing at all dams tonatural chinook salmon tagged at the lower trap during the spring, with 90% arrival timings beingthree to eight days later.
Fall PIT tag release groups of natural chinook salmon from the lower trap arrived at LGRfrom March 27 to May 12 (n=428), with median and 90% arrival on April 14 and April 24 (Table12). March 27 arrivals were represented by 2 fish. Arrival at LGO occurred from April 11 to May12 (n=228). Median and 90% arrival to LGO occurred on April 25 and May 2, respectively. Natural chinook salmon emigrated past LMO between April 19 and May 19 (n=202) with medianand 90% passage dates of April 25 and May 4. Natural chinook salmon arrival at MCN rangedfrom April 20 to May 23 (n=236). Median and 90% arrival at MCN occurred on April 30 and May4. Peak arrival occurred at LGR from early to mid-April and occurred in late April at Little Goose,Lower Monumental and MCN (Appendix M).
Imnaha River natural chinook salmon smolts PIT tagged and released during the springarrived at LGR from April 1 to June 27 with median and 90% passage dates of April 25 and May 6,respectively (Table 12). April 1 arrivals were represented by 5 fish. Arrival timing at LGR, LGO,LMO, and MCN for natural chinook salmon is represented by 1,630, 837, 289, and 187 fish,respectively. Median arrival dates at LGR have ranged between April 22 and May 4 from 1993 to1998. The 90% arrival dates for natural chinook salmon released in the spring for the years 1993-1997 have all fallen within a one week period from May 11-18 at LGR. In 1998 the 90% arrivaloccurred earlier, May 6. Natural chinook salmon smolts emigrated past LGO between April 14and June 25, 1998. The median passage date at LGO was May 3 and 90% of natural chinooksalmon smolt passage occurred by May 12. The 90% passage date at LGO (1993-1998) hasoccurred over a two week period from May 7 to May 20. Natural chinook salmon released in thespring of 1998, from the lower trap, moved past LMO and MCN occurred between April 19 toJune 8 and April 19 to June 2, respectively. Passage of 90% of natural chinook salmon smolts atLMO in 1998 occurred on May 11, two days earlier than previously observed from 1993 to 1997.The latest passage date for 90% of natural chinook at LMO, since 1993, has been June 4. Timingof 90% passage at MCN was observed from May 12 to May 28 (1993-1998).
PIT tag interrogation systems at LGR may not have covered the whole emigration period. The fish tagged at the lower trap during the fall, and assumed to overwinter in the Snake River, hadearlier arrival timings than the natural chinook salmon smolts tagged at the lower trap during thespring or the upper trap during the fall. March 27 was the first day of sampling at LGR. Two ofthe Imnaha fish, from the fall release group at the lower trap, arrived on March 27. The daily indexof passage at LGR on March 27 was 44 wild yearling chinook salmon (Anonymous b 1998). Thefall tagged natural chinook salmon released from the lower trap had a 90% arrival timing 12 daysearlier than spring tagged fish at LGR. The 90% arrival timing of fall tagged natural chinooksalmon, from the lower trap, was 10 days earlier at LGO, 7 days earlier at LMO, and 9 days earlier

46
at MCN, than natural chinook salmon smolts tagged at the lower trap during the spring. Theearlier arrival timing of Imnaha natural chinook salmon released during the fall at LGR suggeststhat the cumulative interrogation rate of 48.6% for natural chinook salmon released in the fall fromthe lower trap may not be accurate due to the lack of interrogation data. Earlier operation of thePIT tag interrogation system would be beneficial for evaluating different life history strategies ofchinook salmon.
Arrival timing of spring PIT tagged Imnaha River hatchery chinook salmon smolts occurredbetween April 15 and May 22 at LGR, April 25 and May 26 at LGO, April 23 and May 26 atLMO, and between May 2 and May 30 at MCN. Arrival timing at LGR, LGO, LMO, and MCNfor hatchery chinook salmon is represented by 696, 391, 143, and 53 fish, respectively. Medianarrival dates of hatchery chinook salmon at LGR, LGO, LMO, and MCN occurred on May 2, May7, May 8, and May 11, respectively (Table 13). Ninety percent of the fish had passed by LGR,LGO, LMO, and MCN by May 9, May 14, May 15, and May 19 respectively. For the migratoryyears 1994-1998 the median and 90% arrival dates at LGR ranged from May 2-12 and May 9-16.respectively. The 90% passage date at LGO (1994-1998) has occurred over a 9 day period fromMay 14-23. The 90% arrival dates (1994-1998) at LMO occurred over a nine day period (May 15-26).
Natural steelhead smolts PIT tagged and released in the spring from the Imnaha Riverarrived at LGR from April 2 to June 12, at LGO from April 14 to June 19, at LMO from April 16to June 11, and at MCN from April 20 to June 4 (Table 14). Arrival timing at LGR, LGO, LMO,and MCN for natural steelhead is represented by 1,474, 481, 213, and 53 fish, respectively. Median and 90% arrival dates of natural steelhead occurred on May 3 and May 22 at LGR, May 8and May 26 at LGO, May 10 and May 27 at LMO, and May 7 and May 28 at MCN. May 2 to May26 is the median arrival date range at LGR for natural steelhead from 1993 to 1998. The 90%arrival date range for 1993 to 1998 is May 9 to June 8. Natural steelhead 90% arrival timing atLGO has occurred between May 12 and June 7 (1993-1998). LMO 90% arrival timing of naturalsteelhead smolts has occurred from May 14 to July 10, from 1993 to 1998. Ninety percent arrivaltiming at MCN (1994 and 1996-1998) occurred between the dates of May 18 and June 9. Handlingprocedures in 1994 may have caused a lower than average cumulative interrogation rate and mayhave affected arrival timing as well (Ashe et. al. 1995).
Imnaha River hatchery steelhead smolt dam arrival timing was more prolonged than their natural counterparts because of the two release dates. Arrival timing occurred between April25 and July 29 at LGR, May 3 to July 10 at LGO, May 5 to July 15 at LMO, and May 13 to July 2at MCN (Table 15). PIT tagging and differential fin clips made it possible to distinguish between the April 26 and May 19 release groups. However, the point of release for all PIT tagged steelheadused in this analysis was from the lower trap. Therefore, hatchery steelhead were treated as oneentire group for summarizing arrival timing data.
Arrival timing of spring PIT tagged Imnaha River hatchery steelhead smolts occurredbetween April 25 and July 29 at LGR, May 3 and July 10 at LGO, May 5 and July 15 at LMO, and

47
Table 13. Arrival timing of PIT tagged Imnaha River hatchery chinook salmon smolts at LowerGranite, Little Goose, Lower Monumental, and McNary Dams from 1992 to 1998.______________________________________________________________________________
Dam Year Sample Arrival Timing Size (n) Date Range Median 90%
______________________________________________________________________________
Lower Granite 1998 696 April 15-May 22 May 2 May 91997 227 April 16-May 22 May 5 May 141996 169 April 13-May 26 May 7 May 1619951 128 April 13-June 7 May 2 May 1319952 83 April 16-May 22 May 8 May 151994 129 April 24-May 18 May 12 May 1219923 273 April 12-June 6 April 21 May 6
Little Goose 1998 391 April 25-May 26 May 7 May 141997 267 April 20-May 27 May 9 May 181996 131 April 23-June 6 May 13 May 2019951 114 April 26-June 11 May 10 May 2019952 67 April 27-June 7 May 12 May 231994 65 April 28-June 2 May 14 May 2119923 116 April 17-May 22 April 27 May 5
Lower Monumental 1998 143 April 23-May 26 May 8 May 151997 199 April 25-June 3 May 10 May 191996 136 April 23-May 29 May 15 May 2319951 106 April 27-June 10 May 12 May 2119952 71 April 29-June 9 May 17 May 261994 73 April 30-June 7 May 14 May 20
McNary 1998 53 May 2-May 30 May 11 May 19 1997 61 May 1-June 1 May 10 May 19
1996 55 May 1-May 27 May 16 May 2319951 67 April 29-June 9 May 16 May 2319952 36 May 3-May 30 May 16 May 221994 119 May 6-June 17 May 21 May 2619923 61 April 27-June 1 May 8 May 17
____________________________________________________________________________________________1 HXW crossed chinook salmon smolts PIT tagged for the Nez Perce Tribe and released at dark.2 HXH crossed chinook salmon smolts PIT tagged for the Fish Passage Center and released one hour after tagging and recovery.3 Hatchery chinook salmon smolts PIT tagged and released in 1992 were over a two day period only for survival estimation.
Overall, for the years 1993-1998, the median and 90% arrival date ranges for hatcherysteelhead at LGR were May 5 to May 31, and May 26 to July 15, respectively. Handlingprocedures in 1994 may have caused a lower than average cumulative interrogation rates and may have affected arrival timing as well (Blenden et al. 1997). At LGO the median and 90% arrivaltiming for 1993 to 1998 was May 25 to June 3, and May 30 to July 17, respectively. Median and
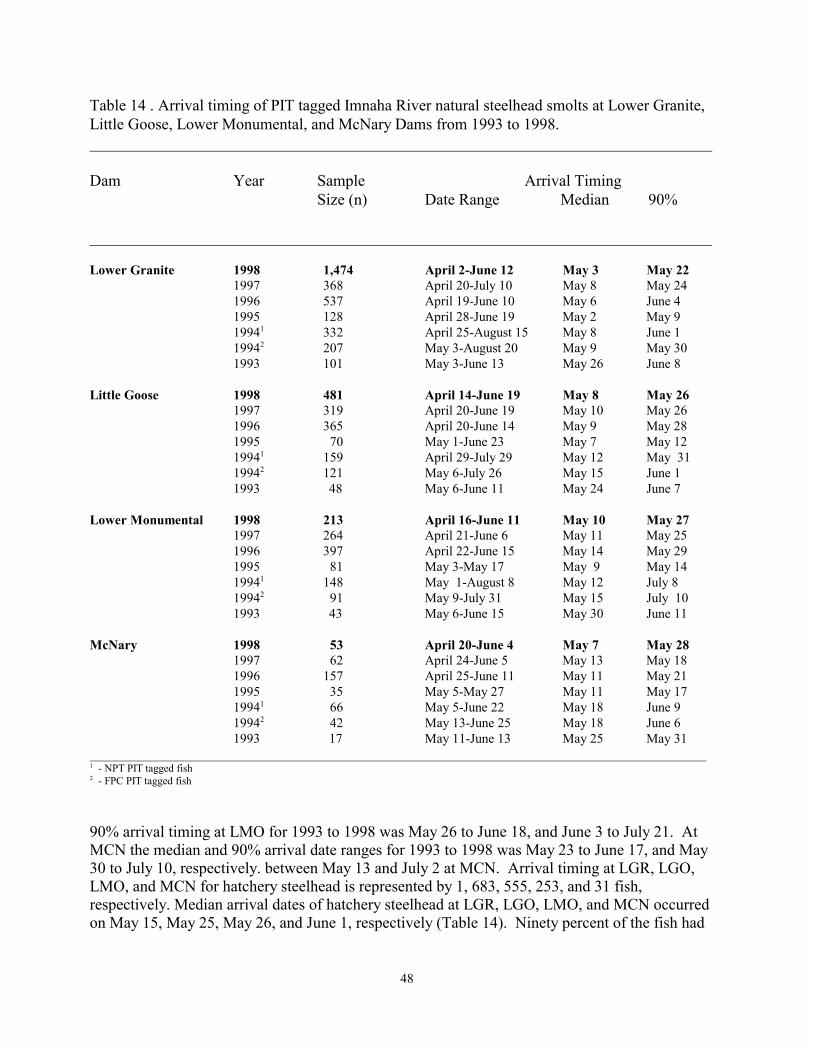
48
Table 14 . Arrival timing of PIT tagged Imnaha River natural steelhead smolts at Lower Granite,Little Goose, Lower Monumental, and McNary Dams from 1993 to 1998.______________________________________________________________________________
Dam Year Sample Arrival Timing Size (n) Date Range Median 90%
______________________________________________________________________________
Lower Granite 1998 1,474 April 2-June 12 May 3 May 221997 368 April 20-July 10 May 8 May 241996 537 April 19-June 10 May 6 June 41995 128 April 28-June 19 May 2 May 919941 332 April 25-August 15 May 8 June 119942 207 May 3-August 20 May 9 May 301993 101 May 3-June 13 May 26 June 8
Little Goose 1998 481 April 14-June 19 May 8 May 261997 319 April 20-June 19 May 10 May 261996 365 April 20-June 14 May 9 May 281995 70 May 1-June 23 May 7 May 1219941 159 April 29-July 29 May 12 May 3119942 121 May 6-July 26 May 15 June 11993 48 May 6-June 11 May 24 June 7
Lower Monumental 1998 213 April 16-June 11 May 10 May 271997 264 April 21-June 6 May 11 May 251996 397 April 22-June 15 May 14 May 291995 81 May 3-May 17 May 9 May 1419941 148 May 1-August 8 May 12 July 819942 91 May 9-July 31 May 15 July 10 1993 43 May 6-June 15 May 30 June 11
McNary 1998 53 April 20-June 4 May 7 May 281997 62 April 24-June 5 May 13 May 181996 157 April 25-June 11 May 11 May 211995 35 May 5-May 27 May 11 May 1719941 66 May 5-June 22 May 18 June 919942 42 May 13-June 25 May 18 June 61993 17 May 11-June 13 May 25 May 31
____________________________________________________________________________________________1 - NPT PIT tagged fish2 - FPC PIT tagged fish
90% arrival timing at LMO for 1993 to 1998 was May 26 to June 18, and June 3 to July 21. AtMCN the median and 90% arrival date ranges for 1993 to 1998 was May 23 to June 17, and May30 to July 10, respectively. between May 13 and July 2 at MCN. Arrival timing at LGR, LGO,LMO, and MCN for hatchery steelhead is represented by 1, 683, 555, 253, and 31 fish,respectively. Median arrival dates of hatchery steelhead at LGR, LGO, LMO, and MCN occurredon May 15, May 25, May 26, and June 1, respectively (Table 14). Ninety percent of the fish had

49
Table 15. Arrival timing of PIT tagged Imnaha River hatchery steelhead smolts at Lower Granite,Little Goose, Lower Monumental, and McNary dams from 1993 to 1998.______________________________________________________________________________
Dam Year Sample Arrival Timing Size (n) Date Range Median 90%
______________________________________________________________________________
Lower Granite 1998 1,683 April 25-July 29 May 15 May 261997 2,346 April 19-July 24 May 23 June 13 1996 440 April 23-July 14 May 28 June 141995 661 May 6-July 12 May 31 June 1619941 164 April 29-August 20 May 29 July 1519942 306 May 6-August 21 May 25 June 231993 224 May 3-June 28 May 17 May 31
Little Goose 1998 555 May 3-July 10 May 25 May 301997 1,844 April 21-August 23 May 26 June 131996 261 April 24-July 11 May 25 June 161995 409 May 8-July 13 June 3 June 2019941 86 May 2-July 30 May 31 July 1719942 165 May 10-August 12 May 27 July 91993 106 May 5-July 8 May 25 June 2
Lower Monumental 1998 253 May 5-July 15 May 26 June 31997 1,432 April 22-August 6 May 27 June 15 1996 232 May 6-July 7 May 27 June 151995 410 May 9-July 13 June 6 June 1619941 30 May 5-August 5 June 3 July 1719942 75 May 11-August 24 June 18 July 211993 92 May 7-June 14 May 26 June 5
McNary 1998 31 May 13-July 2 June 1 June 191997 245 April 23-August 12 May 27 June 181996 30 April 27-July 3 May 23 June 71995 69 May 15-July 17 June 5 June 2719941 22 May 17-July 14 June 5 July 1019942 56 May 20-July 11 June 17 July 81993 7 May 11-June 5 May 19 May 30
____________________________________________________________________________________________1 - NPT PIT tagged fish released at dark2 - FPC PIT tagged fish released after recovery
passed by LGR, LGO, LMO, and MCN by May 26, May 30, June 3, and June 19, respectively.
Spill occurred at all dams during the Imnaha River smolt emigration, the majority of the smolts arrived at the dams before the peak in the average spill occurred. The 90% arrival timing ofImnaha River natural chinook salmon, released in the fall at the upper trap preceded the peak in theaverage total spill at LGR by 18 days. At LGO, LMO, and MCN 90% arrival of natural chinooksalmon released in the fall at the upper trap preceded the peak in the average total spill by 12, 9,

50
and 11 days. Natural chinook salmon released at the lower trap during the fall had ninety percentarrival times that preceded the peak average total spills at LGR, LGO, LMO and MCN by 33, 22,24, and 25 days, respectively. However, differences between 90% arrival of natural chinooksalmon released in the fall at the lower trap and the peak average total spills may be greater if earlyarrivals at dams went undetected. Spring releases of natural chinook had 90% arrival times atLGR, LGO, LMO, and MCN that preceded the peak average total spills at LGR, LGO, LMO, andMCN by 21, 15, 17 and 14 days, respectively. A group of PIT tagged wild spring/summer chinooksalmon from multiple streams in Idaho in 1995 were also observed to have arrived before peakflows occurred in 1995 (Achord et al. 1996). Peak passage of fish from multiple streams in Idahoat LGR coincided with an increasing flow period, but prior to peak flows. Additionally, peakpassage occurred prior to peak flows at LGO, LMO, and MCN, but coincided with moderate tohigh river flows (Achord et al. 1996).
Hatchery Chinook arrived at LGR, LGO, LMO, and MCN 18, 13, 13, and 10 days,respectively, prior to the peaks in the average total spill. Differences between 90% arrival timingand the peak in the average total spill were less for Imnaha River steelhead. Natural steelheadarrived at LGR five days earlyer than the peak in the average total spill at LGR and only one daydifference at LGO, LMO, and MCN. At LGR, 90% arrival of hatchery steelhead occurred a dayprior to the peak in the average total spill and 90% arrival at LGO, LMO, and MCN occurred 3, 6,and 21 days, respectively, after the peaks in the total average spill occurred at each dam. Appendix M contains figures of the arrival timing frequency, the average total discharge, and theaverage total turbine discharge for LGR, LGO, LMO, and MCN for all fish released in the fall andspring from the Imnaha River.
Travel Times
Mean travel time of natural chinook salmon, for release groups of 30 or more fish, to LGRranged from 8 to 29 days between March 15 and May 23 and mean travel times during the weeksof April 5 and 12 were 21 and 16 days, respectively (Figure 35). The fastest mean travel time resulted from the releases during the week of May 10 and the slowest mean travel time resultedfrom the releases during the week of March 15. Mean travel times of natural chinook salmondecreased with an increase in the calendar date. Natural chinook salmon tagged in March and earlyApril did not have the benefit of the increased discharge from the Imnaha River and Snake Riverand may not have been as smoltified as natural chinook salmon tagged in late April. The meantravel time of hatchery chinook salmon to LGR was 26 and 25 days for the releases during theweeks of April 5 and April 12 (Figure 35).
Individual travel times of natural and hatchery chinook salmon were compared for releasesoccurring during the weeks of April 5 and April 12. There was not a significant difference in thetravel times of natural and hatchery chinook salmon from the Imnaha River trap to LGR during theweek of April 5 (p> 0.05). T-test values for 1998 are presented in Appendix F. Natural chinooksalmon released during the following week had significantly faster travel times to LGR thanhatchery chinook salmon (p< 0.05).

51
0
7
14
21
28
35
42
3/15-
3/21
3/22 -
3/28
3/29 -
4/4
4/5 - 4
/11
4/12 -
4/18
4/19 -
4/25
4/26 -
5/2
5/10 -
5/16
5/17 -
5/23
Release Dates
Mea
n Tr
avel
Tim
e (d
ays)
Natural Chinook Salmon
0
7
14
21
28
35
42
4/5 - 4
/11
4/12 -
4/18
Release Dates
Mea
n Tr
avel
Tim
e (d
ays)
Hatchery Chinook Salmon
Figure 35. Mean travel times of natural chinook salmon (top) and hatchery chinook salmon(bottom) weekly PIT tag release groups, from the lower Imnaha trap to LGR, with 95% confidenceintervals, in 1998. Asterisks indicate confidence intervals greater than 42 days.
*

52
Travel time of natural steelhead to LGR ranged from 4 to 38 days (Figure 36). Naturalsteehead smolt travel time decreased over time as the spring emigration proceeded until the weekofApril 19. Mean travel time from the May 17 weekly PIT tag releases was the fastest and theslowest mean travel time was the result of the March 15 weekly releases. Hatchery Steelheadmean travel time to LGR ranged from 5 to 8 days (Figure 36). The slowest travel times were theresult of the releases during the week of April 26 and the fastest travel times were the result of thereleases during the week of June 7. Median travel times of natural and hatchery steelhead smoltswere compared for releases occurring from April 26 to May 17. Median travel times of naturalsteelhead (4 days) were significantly faster than hatchery steelhead (6 days) to LGR during theweek of April 26 and May 17 (p< 0.05). Wilcoxon test values for 1998 are presented in AppendixI.
Mortality
Mortality was tallied for each anadromous salmonid species of natural and hatchery originto determine the effects of trapping, handling and tagging on the fish during the fall and spring. The only mortality experienced during the fall was a trapping related mortality (0.07%) at thelower trap.
Handling was the principal cause of mortality during the spring in natural and hatcherychinook salmon (0.12 and 0.03%), while trapping caused the most mortalities in natural andhatchery steelhead (0.03 and 0.10%). PIT tagging was not a cause of mortality for natural chinooksalmon and steelhead. PIT tagging caused minimal mortalities for hatchery chinook salmon andhatchery steelhead ( 0.01 and 0.06%) (Table 16). Total mortality due to trapping, handling, andPIT tagging did not exceed 0.17% for natural chinook salmon, 0.04 for hatchery chinook salmon,0.03 for natural steelhead, and 0.18 for hatchery steelhead during the spring emigration trapping.
Table 16. Mortality of chinook salmon and steelhead smolts due to trapping, handling, and PITtagging from February 26 to June 16, 1998.
Chinook salmon SteelheadNatural Hatchery Natural Hatchery
NumberCaptured 4163 17,926 3,560 5,141
MortalitySource n % n % n % n %
Trapping 2 0.05 1 0.01 1 0.03 5 0.10Handling 5 0.12 5 0.03 0 0.00 1 0.02PIT Tagging 0 0.00 2 0.01 0 0.00 3 0.06
Total 7 0.17 8 0.04 1 0.03 9 0.18

53
0
10
20
30
40
50
60
3/15 -
3/21
3/29 -
4/4
4/5 - 4
/11
4/12 -
4/18
4/19
- 4/25
4/26
- 5/2
5/3 -
5/9
5/10
- 5/16
5/17
- 5/23
Release Dates
Mea
n Tr
avel
Tim
e (d
ays)
.
Natural Steelhead
0
5
10
15
20
25
30
4/26 -
5/2
5/3 - 5
/9
5/10 -
5/16
5/17 -
5/23
5/31 -
6/6
6/7 - 6
/13
Release Dates
Mea
n Tr
avel
Tim
e (d
ays)
. Hatchery Steelhead
Figure 36. Mean travel times of natural steelhead (top) and hatchery steelhead (bottom) weekly PITtag release groups, from the lower Imnaha trap to LGR, with 95% confidence intervals, in 1998.

54
Incidental Catch
Four non-target game fish species were incidentally captured during our investigation. They were mountain whitefish (Prosopium williamsoni), rainbow trout and adult steelhead(Onchorhyncus mykiss), bull trout (Salvelinus confluentus) and smallmouth bass (Micropterusdolomieui). The upper Imnaha River trap collected 198 mountain whitefish and seven bull troutduring the fall trapping period. Seven mountain whitefish, five bull trout and one smallmouth basswere collected in the lower Imnaha River trap during the fall trapping period. A total of 36mountain whitefish, 32 rainbow trout, 12 adult steelhead, and one bull trout were captured duringthe spring trapping period.
Other non-target fish collected during the spring include longnose dace (Rhinichthyscataractae), bridgelip suckers (Catostomus columbianus), sculpin (Cottus sp.), northern pikeminnow (Ptychocheilus oregonensis) and redside shiner (Richardsonius balteatus). A total of 184,147, 12, two and one were captured, respectively, during the spring trapping period. Additionally,four unidentified suckers were captured (Catostomus sp.). Three longnose dace and one sculpinwere caught during the fall at the upper Imnaha River trap. The lower Imnaha River trap collectedtwo longnose dace, seven bridgelip suckers, one sculpin, and eight northern pike minnow duringfall trapping.
SUMMARY
Rotary screw traps were used to capture emigrating juvenile chinook salmon and steelheadin the Imnaha River at two sites, rkm 7 and 74, during the fall of 1997 and the spring of 1998. Thefall sampling period ranged from October 14 to December 19. The spring sampling period rangedfrom Feburary 26 to June 16. Trapping only occurred at the lower site during the spring. Highflows and debris kept the traps from fishing for 9 days during the spring trapping period in 1998.
Fall emigrants captured at the upper site totaled 2,232 natural chinook salmon and 24natural steelhead. Fall emigrants captured at the lower site totaled 1,516 natural chinook salmonand 123 natural steelhead. A total of 4,195 natural chinook salmon, 17,837 hatchery chinooksalmon, 3,569 natural steelhead, and 5,141 hatchery steelhead were sampled during the springemigrant trapping at the lower site. The spring catch composition was 57.2% hatchery chinooksalmon, 16.5% hatchery steelhead, 13.5% natural chinook salmon, 11.4% natural steelhead and1.4% incidental species.
The mean length and weight of fall emigrating natural chinook salmon captured at theupper site was 89 mm and 7.9 g with a condition factor of 1.1. Mean fork length and weight of fallemigrating natural chinook salmon captured at the lower site was 95 mm and 9.0 g with acondition factor of 1.04. Fall emigrating chinook salmon captured at the lower site weresignificantly larger in fork length than chinook salmon at the upper site (p < 0.05). The meanlength and weight of spring emigrating natural chinook salmon captured was 106 mm and 12.7 gwith a condition factor of 1.05. There were no discerning size trends in mean weekly fork lengthor condition factor of emigrating natural chinook salmon. The mean length and weight of hatchery

55
chinook salmon captured was 135 mm and 27.2 g with a condition factor of 1.08. Hatcherychinook salmon were significantly larger in fork length than there natural counterparts in the spring(p < 0.05). The fork lengths of hatchery chinook salmon captured in the trap significantlydecreased from April 5 to May 2.
The mean length and weight of fall emigrating natural steelhead captured at the upper sitewas 120 mm and 20.4 g with a condition factor of 1.01. Average length and weight of fallemigrating natural steelhead captured at the lower site was 146 mm and 38.4 g with a conditionfactor of 1.04. The mean length and weight of spring emigrating natural steelhead captured was177 mm and 56.8 g with a condition factor of 0.99. Mean length and weight of spring emigratinghatchery steelhead captured was 218 mm and 102.2 g with a condition factor of 0.96. Hatcherysteelhead were significantly larger than there natural counterparts in the spring.
Spring releases of hatchery chinook salmon by ODFW from the chinook salmonacclimation facility occurred on April 6 and totaled 93,123 smolts. All fish were marked withadipose fin clips and coded wire tags. A total of 19,827, of the 93,123 hatchery chinook salmonsmolts released, were marked with PIT tags as well. Hatchery steelhead were released from theLittle Sheep Creek Acclimation Facility on April 26 and May 19 and totaled 117,096 fish. Hatchery steelhead released April 26 had adipose, left ventral clips, and coded wire tags andtotaled 86,422 fish. Hatchery steelhead released May 19 had only adipose clips and totaled 30,674fish. Only the April 26 release group included a group of hatchery steelhead with 867 PIT tags.
The peak catch of natural chinook salmon totaled 501 smolts and occurred on March 18. Emigration timing of hatchery chinook salmon in the Imnaha River peaked April 9, with the catchof 3,927 fish, three days after their release. Approximately 97% of the hatchery chinook salmonwere captured within 11 days of their release. Previously PIT tagged natural chinook salmon werecaptured in the greatest numbers on March 17 and the peak catch of previously PIT tagged hatcherychinook were captured on April 9. Mean travel time of PIT tagged hatchery chinook salmon to thetrap was four days. Future volitional releases should be considered to produce earlier emigrationtiming that is synchronized with the movement of natural chinook salmon. Evaluation ofemigration timing for hatchery chinook salmon can be accomplished by continuing to releasegroups of PIT tagged smolts.
The catch of natural steelhead did increase with increasing flows on April 25, but there wasno noticeable trend throughout the season with migration responses, as measured by the dailycatch, to fluctuations in flow or temperature. However, the daily catch does not account for factorssuch as changes in the trap efficiency, the number of traps operating, or the amount of time thetraps were fished during the day. Hatchery steelhead also lacked noticeable responses to increasesor fluctuations in flow or temperature. Emigration timing, as with hatchery chinook salmon, wasthe result of release timing.
We tagged a total of 7,406 natural chinook salmon in three distinct PIT tag release groups.The PIT tag release groups of natural chinook salmon tagged at the upper and lower site in the fall,and the lower site in the spring produced survival estimates, arrival timing, and mean travel time toLGR. A total of 2,000 hatchery chinook, 3,106 natural steelhead, and 3,859 hatchery steelhead

56
were PIT tagged as well. There was no significant differences between the fork lengths of taggedversus non-tagged natural chinook salmon, or tagged and non-tagged hatchery steelhead. Therewas a statistical difference between the fork lengths of tagged and non-tagged hatchery chinooksalmon, but the 2 mm difference was not considered biologically significant. The majority of thenatural steelhead captured (87%) were PIT tagged, released, and determined to be representative ofthe natural steelhead captured in the Imnaha trap in 1998.
The release of 19,827 PIT tagged hatchery chinook salmon from the acclimation siteallowed us to estimate survival using the SURPH model. We interrogated 3,371 PIT taggedhatchery chinook salmon at the trap site in the spring and estimated survival to the trap at 88.4%. As in past years, daily trap efficiencies were conducted for the purpose of estimating survival usingthe Bootstrap method. However, overestimated trap efficiencies produced a bootstrap survivalestimate from the acclimation facility to the lower Imnaha River trap that was slightly lower than aSURPH survival estimate from the acclimation facility to LGR.
Season-wide survival estimates from release to LGR of natural chinook salmon, releasedduring the fall at the upper and lower trap, were 45.9 and 60.4%. Estimated season-wide survivalof natural chinook salmon from release to LMO for fall releases at the upper and lower trap, were39.3 and 49.7%. Survival estimates from release at the Imnaha trap to LGR, for weekly releasegroups of natural chinook salmon released from March 15 to April 19, ranged from 83.8 to 90.4%. Survival estimates from release at the Imnaha trap to LMO, ranged from 71.9 to 78.1%. Survivalestimates from release at the Imnaha trap to LGR, for two weekly release groups of hatcherychinook salmon were 74.6 and 76.5%. Survival estimates from release at the Imnaha trap to LMO,were 58.4 and 72.4%. Natural chinook salmon smolts had higher survival rates to LGR and LMOfor the weeks of April 5 and April 12, despite being significantly smaller than their hatcherycounterparts.
Survival estimates from release at the Imnaha trap to LGR, for weekly release groups ofnatural steelhead released from March 29 to May 24, ranged from 79.8% to 88.9%. Survivalestimates from release at the Imnaha trap to LMO for weekly release groups of natural steelheadranged from 60.6% to 74.9%. Survival estimates from release at the Imnaha trap to LGR, forweekly release groups of hatchery steelhead released from April 26 to May 24, ranged from 77.4%to 86.9%. Survival estimates from release at the Imnaha trap to LMO, for weekly release groups ofhatchery steelhead released from April 26 and May 24, were from 63.9 and 57.5%, respectively.
The season survival estimates for natural and hatchery chinook salmon, from release at thelower trap to LGR, were within the ranges observed from 1993 to 1997. Ranges for these twogroups are 76.2 to 90.9%, and 67.1 to 80.4%, respectively. There appears to be no definite yearlytrends in survival for natural or hatchery chinook salmon. Estimated season-wide survival fromrelease at the lower trap to LGR, for natural steelhead (86.0%) was the lowest observed since 1995. Hatchery steelhead season-wide survival from release at the lower trap to LGR (82.9%) was thehighest observed since 1995. Season-wide survival estimates from the lower trap to LGR fornatural and hatchery steelhead have ranged from 83.7 to 90.1%, and 64.6 to 82.1%, respectively,since 1995.

57
Hatchery chinook salmon, released from the acclimation facility to LMO, appear to havesustained the highest mortality between the lower Imnaha trap and LGR. Mortality within thisreach, has been higher than other reaches since 1994. Reach specific mortality for hatcherysteelhead in 1998, from release at the lower trap to LMO, was also the highest between the Imnahatrap and LGR (17.9%). Natural chinook salmon and steelhead in 1998, released during the springfrom the lower Imnaha trap to LMO, had the highest reach specific mortality between LGO andLMO. Mortality estimates should be used cautiously and only as indicators of reaches that arepotential problems for passage because they are the result of survival estimates and survivalbetween LGR and LGO may have been overestimated.
PIT tag interrogation systems at LGR may not have covered the whole emigration period.The passage index at LGR indicated that 44 wild (natural) chinook salmon yearlings passed duringtheir first day of operations on March 27. Two Imnaha River fish, tagged during the fall at thelower trap, were interrogated on March 27 at LGR. An additional 8 PIT tagged natural chinookfrom the Imnaha River were interrogated between April 1 and April 3. Natural chinook salmontagged in the fall at the lower site had median and 90% arrival dates 9 and 12 days earlier thannatural chinook salmon tagged in the fall at the upper site or natural chinook salmon tagged in thespring at the lower site. Earlier operation of interrogation facilities at LGR would improve PIT tagbased estimates of natural chinook released from the Imnaha River to LGR. Knowledge of earlyarrival timing of natural chinook at LGR could be beneficial for planning spills for smoltmonitoring programs in the spring.
Median arrival timing for natural chinook salmon released during the spring of 1998occurred on April 25 at LGR and has ranged from April 22 to May 4, from 1993 to 1998. The 90%arrival time range at LGR for spring released natural chinook salmon in 1998 occurred on May 6and has ranged from May 6 to May 18, from 1993 to 1998. Hatchery chinook arrival timing atLGR occurred later than natural chinook salmon. Median and 90% arrival occurred on May 2 andMay 9, respectively. Median and 90% arrival dates of hatchery chinook salmon from the Imnahariver to LGR have ranged from April 21 to May 12, and May 6 to May 16, respectively, from 1993to 1998.
Natural steelhead arrived at LGR from April 2 to June 12. Median arrival occurred on May3 and 90% arrival occurred on May 22. Median arrival dates of natural steelhead smolts haveranged from May 2 to May 26, from 1993 to 1998. Ninety percent arrival dates of naturalsteelhead smolts have ranged from May 9 to June 8, from 1993 to 1998. Arrival timing of hatcherysteelhead at LGR occurred from April 25 to July 29. This was later than their natural counterpartsand interrogations of hatchery steelhead smolts lasted 24 days longer at LGR than interrogations ofnatural steelhead. We attribute the differences in arrival timing of natural and hatchery steelheadto the release timing of hatchery steelhead on April 26 and May 19.
Natural chinook salmon had significantly faster travel times from the Imnaha River to LGRthan hatchery chinook salmon during the week of April 12. Travel times of natural chinooksalmon from the trap to LGR decreased as the season progressed. Mean travel times of naturalchinook from the trap to LGR ranged from 8 to 29 days and mean travel times of hatchery chinookfrom the trap to LGR ranged from 25 to 26 days. Slow travel times of natural chinook may have

58
been influence by the release of PIT tagged fish during March and early April. These fish wouldnot have had the benefit of discharge from the Imnaha and Snake rivers. Natural steelhead hadsignificantly faster travel times to LGR than hatchery steelhead during the weeks of April 26 andMay 17. Mean travel times of natural steelhead to LGR ranged from 4 to 38 days. Mean traveltimes of hatchery steelhead to LGR ranged from 5 to 8 days. Mean travel times of naturalsteelhead decreased as the season progressed but travel times of hatchery steelhead remain fairlyconsistent.
Trapping caused one mortality during the fall at the lower site. There were a total of 25deaths of target species in the spring of the 30,742 target fish captured. Trapping caused the deathof two chinook salmon and handling accounted for another five deaths. Eight hatchery chinookdeaths were due to a combination of trapping, handling, and PIT tagging, with the majority ofdeaths due to handling (n = 5). The only death of natural steelhead was due to trapping. Ninehatchery steelhead deaths were attributed to a combination of trapping, handling, and PIT tagging. Most of the deaths of hatchery steelhead were due to trapping.
In conclusion, hatchery production has produced hatchery chinook salmon and steelheadsmolts that are larger than natural fish. Arrival timing of natural fish has differed from hatcheryfish in past years. Natural chinook salmon arrived at LGR on March 27, the same day samplingbegan at LGR. Earlier operation of the LGR interrogation facility would be beneficial foreliminating the uncertainty in arrival timing and survival estimates of early migrating Imnaha Riverchinook salmon. Survival of hatchery chinook salmon, from release at the lower Imnaha River trapto LGR, was not better than the survival of natural chinook, during the weeks of April 5 and April12. Additionally, natural chinook had significantly faster travel times than hatchery steelhead,from the trap to LGR, during the week of April 12. However, differences in smoltification orbehavior could have had an effect on the survival of natural and hatchery chinook salmon from theImnaha River and future emigration studies should investigate how these variables affect survival.

59
ACKNOWLEDGMENTS
The Nez Perce Tribe extends the administrative support necessary to complete theseprojects and this report. Project funding from the U.S. Fish and Wildlife Service’s Lower SnakeRiver Compensation Plan program initiated the Imnaha River emigration project investigations in1992 and continues today. Project cost share funding is also provided by the Bonneville PowerAdministration though the Imnaha Smolt Monitoring Program. We wish to thank JoeMcCormack, for his expertise in operating, maintaining, and repairing the trapping equipment andPIT tagging fish and Glenda Claire, for her expertise in PIT tagging fish and contributions withdata entry, validation, and summary of the PIT tag data. We also thank Glenn Szerlong forassisting with PIT tagging, data entry, and summary of PIT tag groups. Department Aides OlicuttWatters and Neil Miller also deserves our gratitude for their efforts and dedication in operating thetraps and recording data. We extend our gratitude to the United States Forest Service for allowingus the use of the Thorn Creek guard station facilities, and Jack McClaren for allowing us access tohis land for trapping purposes. The Fish Passage Center’s Data System Administrative Manager,Henry Franzoni, deserves our gratitude for providing the software and technical support forcommunicating data to the Fish Passage Center and biometrician, Tom Berggren for assisting withthe necessary PIT tagging schedule. Thank you’s are also due to Carter Stein and Dave Marvin ofthe Pacific States Marine Fisheries Commission for providing the technical support and identifyingduplicate tag codes in the PIT tag data. Finally, we would like to extend our thanks Jay Hesse, fortechnical advice pertaining to this report and data collection.

60
LITERATURE CITED
Achord, S., M.B. Eppard, B.P. Sandford, and G.M. Mathews. 1996. Monitoring The Migration Of Wild Snake River Spring/Summer Chinook Salmon Smolts, 1995. Bonneville Power Administration Techinical Report. Contract DE-AI79-91BP18800. Project 91-028.
Anonymous a. 2000. 13292000-IMNAHA RIVER AT IMNAHA, OR. [online] Available at http://oregon.usgs.gov/rt-cgi/gen_stn_pg?station=13292000. February 24.
Anonymous b. 1998. Fish Passage Center Weekly Report 98-3. Portland, Oregon.
Ashe, B. L., A. C. Miller, P. A. Kucera, and M. L. Blenden. 1995. Spring Outmigration Of Wild And hatchery Chinook Salmon and Steelhead Smolts From The Imnaha River, March 1 - June15, 1994. FPC Technical Report. NPT DFRM Lapwai, Idaho
Bagenal, T. B., and F. W. Tesch. 1978. Age and growth. Pages 101-136 in T.B.Bagenal, editor. Methods for assessment of fish production in fresh waters, 3rd edition. Blackwell Scientific Publications, Oxford, England.
Blenden, M.L., S.J. Rocklage, and P.A. Kucura. 1997. Spring Outmigration of Wild and Hatchery Chinook Salmon and Steelhead Trout Smolts from the Imnaha River, Oregon, February 23 - June 24, 1996. Bonneville Power Adiminstation Technical Report. Contract DE-FC79-88FC38906. Project 87-127. NPT DFRM. Lapwai, ID.
Blenden, M.L., P.A. Kucera, and E.R. Veach. 1998. Spring Emigration of Natural and HatcheryChinook salmon and Steelhead Smolts from the Imnaha River, Oregon, February 25 - June27, 1997. Bonneville Power Adiminstation Technical Report. Contract DE-FC79-88BP38906. Project 87-127. NPT DFRM. Lapwai, ID.
Efron, B., and R. Tibshirani. 1986. Bootstrap methods for standard errors, confidence intervals, and other measures of statistical accuracy. Statistical Science 1:54-77.
Gaumer, T.F. 1968. Behavior of Juvenile Anadromous Salmonids in the Imnaha River, September 1964 to June 1967. Fish Commission of Oregon Research Division Closing Report.
James, G. 1984. Imnaha River basin recommended salmon and steelhead habitat improvement measures. Working paper. Confederated Tribes of the Umatilla Indian Reservation.
Kennen, J. G., S. J. Wisniewski, N. H. Ringler, and H. M. Hawkins. 1994. Application and modification of an auger trap to quantify emigrating fishes in Lake Ontario tributaries. North American Journal of Fisheries Management 14:828-836.
Kucera, P. A. 1989. Nez Perce Tribal review of the Imnaha River Lower Snake River Compensation Plan. Working paper. LSRCP Technical Report AFF1/LSR-89-08. Nez Perce tribe Fisheries Management, Lapwai, Idaho

61
Kucera, P.A., and M.L. Blenden. 1998. Emigration of Hatchery and Natural Chinook Salmonfrom the Imnaha River. pp. 141 - 153. Lower Snake River Compensation Plan StatusReview Symposium. U.S. Fish and Wildlife Service. February 4 to February 5, 1998. Boise,Idaho.
Matthews, G. M., J. R. Harmon, S. Achord, O. W. Johnson, and L. A. Kubin. 1990.Evaluation of transportation…on the Columbia and Snake Rivers, 1989. Report to the U.S. Army Corps of Engineers, Contract DACW68-84-H0034. NMFS. Seattle, Washington.
Matthews, G. M., S. Accord, J. R. Harmon, O. W. Johnson, D. M. Marsh, B. P. Sandford, N. N. Paasch, K. W. McIntyre, and K. L. Thomas. 1992. Evaluation of transportation of juvenile salmonids…Columbia and Snake Rivers, 1990.Report to USACE, Seattle
Ott, L. 1984. An introduction to statistical methods and data analysis. PWS Publishers. Boston, Massachusetts
Prentice, E. F., D. L. Park, T. A. Flagg, and S. McCutcheon. 1986. A study to determine the biological feasibility of a new fish tagging system, 1985-1986. Report to the Bonneville Power Administration. Contract DE-A179-83BP11982, Project 83-119. NMFS
Prentice, E. F., T. A. Flagg, C. S. McCutcheon, D. F. Brastow, and D. C. Cross. 1990. Equipment, methods, and an automated data-entry station for PIT tagging. American Fisheries Society Symposium 7:335-340.
Smith S.G., J.R. Skalski, J. W. Schlechte, A. Hoffmann, and V. Cassen, J.R.1994. Statistical Survival Analysis of Fish and Wildlife Tagging Studies. Contract DE-BI79-90BP02341. Project 89-107. Bonneville Power Administration. Portland, Oregon.
Smith, S.G., W.D. Muir, E.E. Hockersmith, S. Achord, M.B. Eppard, T.E. Ruehle, and J.G.Williams. 1998. Survival estimates for the passage of juvenile salmonids through SnakeRiver dams and reservoirs, 1996. Annual Report submitted to the Bonneville PowerAdministration. National Marine Fisheries Service, Seattle, WA. 197pp.
Statgraphics Plus. 1995. Statgraphics Plus Version 2. Manugistics, Inc. Rockville, Maryland.
Thedinga, J. F., M. L. Murphy, S. W. Johnson, J. M. Lorenz, and K. V. Koski. 1994. Determination of salmonid smolt yield with rotary screw traps in the Situk River, Alaska, to predict effects of glacial flooding. North American J.F.M. 14:837-851
Westhagen, P. and J. Skalski, 1997. The Design and Analysis of Salmonid Tagging Studies in theColumbia Basin. Bonneville Power Administration. Contract DE-BI79-90BP02341. Project 89-107-00. Portland, Oregon.

62
Appendix A
The mean daily discharge and standard deviation estimated from provisional data collected at theUSGS gauging site 13292000 at Imnaha, Oregon and the mean daily average, maximum, andminimum water temperatures at the lower site during the fall, October 14 to December 19, 1997and spring, February 26 to May 24, 1998.

63
Table A. The mean daily discharge and standard deviation estimated from provisional datacollected at the USGS gauging site 13292000 at Imnaha, Oregon and the mean daily average,maximum, and minimum water temperatures at the lower site during the fall, October 14 toDecember 19, 1997 and spring, February 26 to May 24, 1998. NA = data not available.
Season &SiteDay
Mean Discharge
(cfs)
StandardDeviation ofthe Discharge
Mean WaterTemperature
(BC)
Maximum WaterTemperature
(BC)
Minimum WaterTemperature
(BC)
Fall (Lower Site)
10/14/97 208 10.5 15.8 7.9
10/15/97 206 9.9 16.4 6.9
10/16/97 202 9.6 17.4 6.2
10/17/97 200 9.8 16.8 6.2
10/18/97 197 10.7 15.3 8.0
10/19/97 194 10.4 15.9 7.9
10/20/97 192 8.5 14.2 5.2
10/21/97 189 7.5 14.7 4.3
10/22/97 187 8.1 10.0 5.9
10/23/97 189 9.2 9.8 8.5
10/24/97 196 8.2 9.8 7.4
10/25/97 186 6.6 8.0 5.2
10/26/97 186 6.0 7.1 4.7
10/27/97 186 7.8 9.5 6.7
10/28/97 184 7.1 7.8 6.4
10/29/97 192 8.3 9.5 7.1
10/30/97 247 9.5 10.3 8.8
10/31/97 335 9.6 10.3 9.0
11/1/97 277 8.3 9.4 7.4
11/2/97 240 6.4 7.4 5.2
11/3/97 227 6.7 7.8 5.7

Table A. Continued.
Season &SiteDay
Mean Discharge
(cfs)
StandardDeviation ofthe Discharge
Mean WaterTemperature
(BC)
Maximum WaterTemperature
(BC)
Minimum WaterTemperature
(BC)
64
11/4/97 220 8.1 9.2 7.3
11/5/97 214 7.6 8.9 6.4
11/6/97 209 7.6 8.9 6.4
11/7/97 218 9.0 9.2 8.7
11/8/97 245 9.5 10.2 8.8
11/9/97 230 9.2 10.1 8.2
11/10/97 220 6.9 8.1 6.2
11/11/97 215 5.0 6.0 4.2
11/12/97 208 3.9 4.8 2.9
11/13/97 201 3.1 4.2 2.1
11/14/97 196 2.6 3.7 1.6
11/15/97 194 2.1 3.2 1.2
11/16/97 190 2.2 3.7 0.9
11/17/97 203 4.9 6.0 4.0
11/18/97 199 5.5 6.4 4.7
11/19/97 205 5.6 6.4 4.9
11/20/97 211 6.6 7.4 6.1
11/21/97 207 6.3 7.1 5.3
11/22/97 196 4.1 5.2 3.2
11/23/97 197 5.5 7.1 3.8
11/24/97 210 6.9 7.3 6.4
11/25/97 220 6.2 7.1 5.3
11/26/97 207 4.3 5.1 3.7
11/27/97 207 4.4 5.1 3.5

Table A. Continued.
Season &SiteDay
Mean Discharge
(cfs)
StandardDeviation ofthe Discharge
Mean WaterTemperature
(BC)
Maximum WaterTemperature
(BC)
Minimum WaterTemperature
(BC)
65
11/28/97 200 4.2 4.9 3.4
11/29/97 197 3.9 4.4 3.2
11/30/97 199 5.4 6.0 4.6
12/1/97 194 4.6 5.3 4.2
12/2/97 174 3.9 4.8 2.7
12/3/97 145 1.4 2.5 0.6
12/4/97 168 0.5 1.1 0.0
12/5/97 167 0.2 0.6 0.0
12/6/97 169 0.2 0.4 0.0
12/7/97 207 0.9 1.7 0.2
12/8/97 224 2.5 3.2 1.9
12/9/97 196 2.3 3.3 1.7
12/10/97 151 1.4 1.9 1.1
12/11/97 178 NA NA NA
12/12/97 158 1.1 1.9 0.4
12/13/97 168 0.2 0.4 0.0
12/14/97 193 0.5 2.0 0.0
12/15/97 198 3.2 3.7 2.4
12/16/97 187 4.4 5.1 3.3
12/17/97 198 5.4 5.7 5.1
12/18/97 189 4.2 5.1 3.5
12/19/97 149 1.6 3.2 0.7Spring (Lower Site)
2/26/98 246 11.5 4.2 4.9 3.52/27/98 212 21.9 3.3 4.4 1.7

Table A. Continued.
Season &SiteDay
Mean Discharge
(cfs)
StandardDeviation ofthe Discharge
Mean WaterTemperature
(BC)
Maximum WaterTemperature
(BC)
Minimum WaterTemperature
(BC)
66
2/28/98 227 20.7 2.7 3.8 1.63/1/98 237 15.0 4.7 6.4 3.53/2/98 225 7.6 5.8 6.7 5.13/3/98 234 10.1 5.5 6.4 4.73/4/98 215 5.3 4.5 6.1 3.23/5/98 208 11.8 4.9 6.1 3.63/6/98 202 15.8 3.7 5.3 2.23/7/98 202 18.2 3.4 5.6 1.63/8/98 217 13.6 3.8 4.8 2.93/9/98 206 5.6 5.2 7.3 3.73/10/98 201 2.6 7.3 9.0 6.03/11/98 199 2.5 8.5 10.8 6.73/12/98 206 4.0 8.6 11.1 6.43/13/98 254 24.5 9.6 12.1 7.73/14/98 370 37.3 9.6 10.9 7.93/15/98 445 18.7 8.8 9.8 7.83/16/98 504 16.8 8.5 9.2 7.83/17/98 518 9.9 6.1 7.6 5.63/18/98 469 17.2 5.9 8.1 4.03/19/98 430 8.8 6.4 8.5 3.03/20/98 424 1.9 7.6 9.5 5.73/21/98 458 12.0 8.3 9.8 6.83/22/98 572 92.5 9.5 10.8 8.43/23/98 1,330 418.8 8.8 10.1 8.13/24/98 2,033 168.8 6.9 7.8 5.63/25/98 1,745 48.6 7.2 7.8 6.43/26/98 1,361 33.0 7.3 7.4 6.93/27/98 1,184 73.8 6.2 7.0 5.43/28/98 985 45.7 5.4 6.6 3.83/29/98 847 37.9 5.6 7.7 3.83/30/98 747 23.2 5.9 7.7 3.93/31/98 686 18.7 6.7 8.1 5.34/1/98 645 13.3 7.7 9.6 6.0

Table A. Continued.
Season &SiteDay
Mean Discharge
(cfs)
StandardDeviation ofthe Discharge
Mean WaterTemperature
(BC)
Maximum WaterTemperature
(BC)
Minimum WaterTemperature
(BC)
67
4/2/98 625 9.6 8.4 9.3 7.74/3/98 626 5.9 7.6 8.5 6.44/4/98 639 5.4 7.8 8.3 7.44/5/98 675 6.4 7.5 7.9 7.14/6/98 661 13.8 8.1 9.8 6.84/7/98 650 5.5 7.5 8.6 7.04/8/98 622 10.3 7.7 9.5 6.04/9/98 608 3.9 7.8 9.0 6.64/10/98 628 12.3 9.0 11.2 7.54/11/98 678 6.7 8.5 9.5 7.74/12/98 693 9.5 8.0 8.9 7.04/13/98 666 11.5 6.4 7.7 5.34/14/98 636 10.8 7.0 8.2 6.04/15/98 636 7.6 7.1 8.3 6.04/16/98 593 11.5 8.2 10.6 6.44/17/98 597 4.9 8.4 10.5 6.64/18/98 603 5.5 7.9 9.5 6.04/19/98 614 3.2 9.4 10.9 8.14/20/98 629 6.9 9.8 12.3 7.54/21/98 728 29.2 11.0 13.4 8.94/22/98 1,019 98.2 11.3 12.9 9.94/23/98 1,743 177.9 10.6 12.3 9.84/24/98 2,148 139.0 8.3 9.7 7.34/25/98 1,683 122.0 7.1 8.0 6.04/26/98 1,405 68.7 7.8 9.8 6.04/27/98 1,334 53.2 9.2 11.1 7.44/28/98 1,439 53.3 10.1 11.6 8.54/29/98 1,611 74.3 10.4 11.8 8.84/30/98 1,853 89.9 10.5 11.7 8.95/1/98 2,079 89.0 10.5 11.7 8.95/2/98 2,212 109.9 10.3 11.3 8.55/3/98 2,302 112.2 10.8 11.8 9.55/4/98 2,259 85.7 10.5 12.0 8.9

Table A. Continued.
Season &SiteDay
Mean Discharge
(cfs)
StandardDeviation ofthe Discharge
Mean WaterTemperature
(BC)
Maximum WaterTemperature
(BC)
Minimum WaterTemperature
(BC)
68
5/5/98 2,425 156.7 10.7 11.7 9.25/6/98 2,287 99.5 10.6 12.1 9.25/7/98 2,314 120.5 10.9 11.8 9.55/8/98 2,279 108.2 10.6 11.7 9.45/9/98 2,377 134.6 9.5 10.7 8.85/10/98 2,041 73.4 9.6 11.2 8.85/11/98 2,086 99.1 10.5 11.1 10.05/12/98 1,944 69.3 10.2 11.2 9.55/13/98 1,858 45.8 9.3 10.1 8.95/14/98 1,717 54.0 9.1 9.6 8.55/15/98 1,569 50.3 8.6 9.7 7.55/16/98 1,455 22.5 8.5 8.9 7.85/17/98 1,470 20.7 8.5 9.2 8.05/18/98 1,443 19.9 9.2 11.2 7.65/19/98 1,401 27.7 10.3 11.9 8.95/20/98 1,353 32.2 11.4 13.5 9.95/21/98 1,616 223.5 10.7 12.3 8.55/22/98 2,662 410.6 8.3 8.9 7.75/23/98 3,704 176.1 8.9 9.8 8.35/24/98 3,042 236.7 10.3 12.0 8.95/25/98 3,706 1,233 NA NA NA5/26/98 5,964 190 NA NA NA5/27/98 4,730 191 NA NA NA5/28/98 4,118 366 NA NA NA5/29/98 3,346 146 NA NA NA5/30/98 2,922 164 NA NA NA5/31/98 2,613 121 NA NA NA6/1/98 2,468 73 NA NA NA6/2/98 2,274 112 NA NA NA6/3/98 2,161 80 NA NA NA6/4/98 2,002 119 NA NA NA6/5/98 1,902 60 NA NA NA6/6/98 1,815 70 NA NA NA

Table A. Continued.
Season &SiteDay
Mean Discharge
(cfs)
StandardDeviation ofthe Discharge
Mean WaterTemperature
(BC)
Maximum WaterTemperature
(BC)
Minimum WaterTemperature
(BC)
69
6/7/98 1,721 46 NA NA NA6/8/98 1,693 47 NA NA NA6/9/98 1,637 68 NA NA NA6/10/98 1,622 52 NA NA NA6/11/98 1,927 109 NA NA NA6/12/98 1,975 81 NA NA NA6/13/98 2,060 95 NA NA NA6/14/98 1,930 117 NA NA NA6/15/98 1,757 61 NA NA NA6/16/98 1,668 88 NA NA NA

70
Appendix B
The mean daily discharge and standard deviation and mean, maximum and minimum watertemperature estimated from provisional data collected at the USGS gauging site 13292000 atAnatone, Washington, on the Snake River, January 1 to July 1, 1998.

71
Table B. The mean daily discharge and standard deviation and mean, maximum and minimumwater temperature estimated from provisional data collected at the USGS gauging site 13292000 atAnatone, Washington, on the Snake River, January 1 to July 1, 1998.
Day
Mean Discharge
(cfs)
Mean WaterTemperature
(BC)
Maximum WaterTemperature
(BC)
Minimum WaterTemperature
(BC)1/1/98 22,800 3.9 4.1 3.81/2/98 19,500 4 4.2 3.71/3/98 21,700 4.1 4.2 3.91/4/98 21,100 3.9 4.1 3.71/5/98 22,400 3.7 4.1 3.51/6/98 25,400 4 4.1 3.81/7/98 25,700 4.1 4.2 3.91/8/98 27,200 4.2 4.3 3.91/9/98 30,700 3.9 4.1 3.71/10/98 31,500 3.5 3.9 3.41/11/98 27,900 3.1 3.6 2.31/12/98 24,300 2.3 2.7 1.91/13/98 26,400 2.5 2.7 2.41/14/98 25,500 2.7 2.9 2.41/15/98 28,100 2.8 2.9 2.61/16/98 27,400 2.6 2.7 2.41/17/98 26,800 2.9 3.2 2.71/18/98 24,400 3.1 3.4 2.91/19/98 24,900 3.3 3.5 3.11/20/98 29,000 3.3 3.5 3.11/21/98 30,100 3.4 3.6 3.21/22/98 32,000 3.3 3.5 3.21/23/98 29,900 3.4 3.5 3.21/24/98 30,200 3.6 3.8 3.41/25/98 33,600 3.6 3.8 3.51/26/98 32,500 3.7 4 3.51/27/98 33,000 3.9 4 3.71/28/98 33,900 4 4.4 3.91/29/98 36,500 3.7 4 3.61/30/98 34,200 3.7 4.1 3.61/31/98 34,600 3.5 3.7 3.3

Table B. Continued.
Day
Mean Discharge
(cfs)
Mean WaterTemperature
(BC)
Maximum WaterTemperature
(BC)
Minimum WaterTemperature
(BC)
72
2/1/98 34,100 3.3 3.5 3.22/2/98 32,500 3.5 3.9 3.22/3/98 33,500 3.7 3.8 3.52/4/98 33,900 3.9 4.1 3.62/5/98 35,000 4 4.2 3.82/6/98 34,700 3.8 4 3.62/7/98 35,000 3.9 4.3 3.62/8/98 35,200 4.2 4.3 42/9/98 36,800 4.2 4.5 42/10/98 35,900 3.8 4.1 3.62/11/98 36,400 4 4.4 3.62/12/98 36,400 4.1 4.2 4.12/13/98 36,600 4.4 4.6 4.22/14/98 35,800 4.4 4.5 4.32/15/98 37,000 4.6 4.7 4.42/16/98 36,800 4.8 5.1 4.52/17/98 35,100 4.7 4.9 4.62/18/98 36,100 4.9 5.3 4.72/19/98 35,400 5.1 5.4 4.92/20/98 35,500 5.4 5.7 52/21/98 34,200 5.6 5.7 5.52/22/98 35,600 5.5 5.8 5.32/23/98 35,200 5.6 5.9 5.42/24/98 34,500 5.5 5.8 5.32/25/98 35,200 5.3 5.5 5.12/26/98 35,600 5.4 5.6 5.22/27/98 34,700 5.3 5.7 52/28/98 34,100 5.2 5.3 53/1/98 33,900 5.5 5.7 5.33/2/98 33,600 5.8 6 5.63/3/98 34,200 5.8 6.1 5.63/4/98 34,600 5.6 5.9 5.33/5/98 32,900 5.8 6.1 5.5
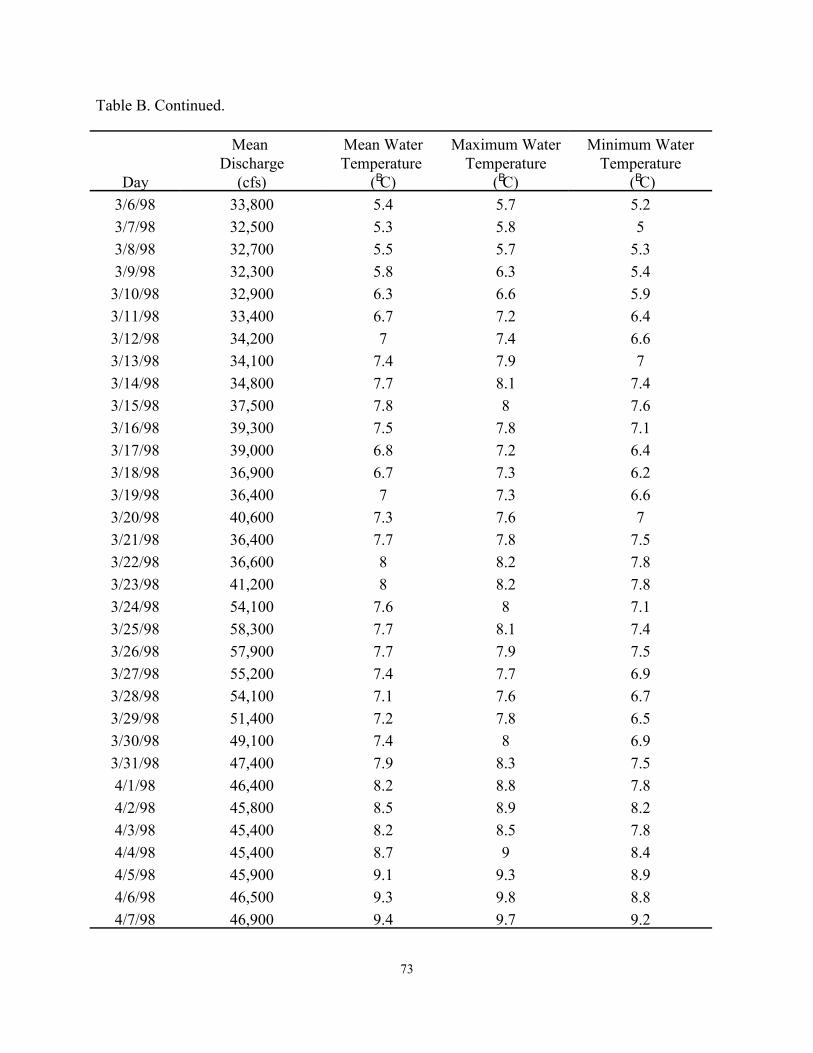
Table B. Continued.
Day
Mean Discharge
(cfs)
Mean WaterTemperature
(BC)
Maximum WaterTemperature
(BC)
Minimum WaterTemperature
(BC)
73
3/6/98 33,800 5.4 5.7 5.23/7/98 32,500 5.3 5.8 53/8/98 32,700 5.5 5.7 5.33/9/98 32,300 5.8 6.3 5.43/10/98 32,900 6.3 6.6 5.93/11/98 33,400 6.7 7.2 6.43/12/98 34,200 7 7.4 6.63/13/98 34,100 7.4 7.9 73/14/98 34,800 7.7 8.1 7.43/15/98 37,500 7.8 8 7.63/16/98 39,300 7.5 7.8 7.13/17/98 39,000 6.8 7.2 6.43/18/98 36,900 6.7 7.3 6.23/19/98 36,400 7 7.3 6.63/20/98 40,600 7.3 7.6 73/21/98 36,400 7.7 7.8 7.53/22/98 36,600 8 8.2 7.83/23/98 41,200 8 8.2 7.83/24/98 54,100 7.6 8 7.13/25/98 58,300 7.7 8.1 7.43/26/98 57,900 7.7 7.9 7.53/27/98 55,200 7.4 7.7 6.93/28/98 54,100 7.1 7.6 6.73/29/98 51,400 7.2 7.8 6.53/30/98 49,100 7.4 8 6.93/31/98 47,400 7.9 8.3 7.54/1/98 46,400 8.2 8.8 7.84/2/98 45,800 8.5 8.9 8.24/3/98 45,400 8.2 8.5 7.84/4/98 45,400 8.7 9 8.44/5/98 45,900 9.1 9.3 8.94/6/98 46,500 9.3 9.8 8.84/7/98 46,900 9.4 9.7 9.2

Table B. Continued.
Day
Mean Discharge
(cfs)
Mean WaterTemperature
(BC)
Maximum WaterTemperature
(BC)
Minimum WaterTemperature
(BC)
74
4/8/98 46,700 9.3 9.7 8.94/9/98 46,100 9.3 9.6 94/10/98 46,000 9.5 9.9 9.24/11/98 46,000 9.6 9.8 9.34/12/98 46,200 9.6 9.8 9.24/13/98 45,900 9.1 9.6 8.94/14/98 45,700 8.9 9.1 8.64/15/98 46,000 9 9.2 8.74/16/98 46,000 9.2 9.6 8.74/17/98 45,800 9.6 10 9.24/18/98 45,500 9.5 9.8 9.24/19/98 45,100 10 10.6 9.64/20/98 44,900 10.6 11.2 104/21/98 45,300 11.3 11.9 10.74/22/98 46,700 11.8 12.2 11.54/23/98 50,500 12.1 12.4 11.64/24/98 56,800 11.3 12.1 10.54/25/98 61,900 10.2 10.7 9.74/26/98 60,800 10.3 10.9 9.74/27/98 57,700 10.8 11.5 10.24/28/98 55,900 11.4 12.3 10.74/29/98 56,800 12 12.8 11.44/30/98 60,700 12.5 13.2 11.85/1/98 67,700 12.6 13.3 125/2/98 72,700 12.5 12.9 12.15/3/98 77,800 12.7 13.3 12.25/4/98 81,800 12.6 13.1 12.15/5/98 84,800 12.8 13.3 12.45/6/98 86,800 12.7 13.2 12.45/7/98 88,200 12.9 13.3 12.55/8/98 89,400 12.7 13.1 12.45/9/98 92,600 12.1 12.5 11.75/10/98 91,900 11.9 12.6 11.4
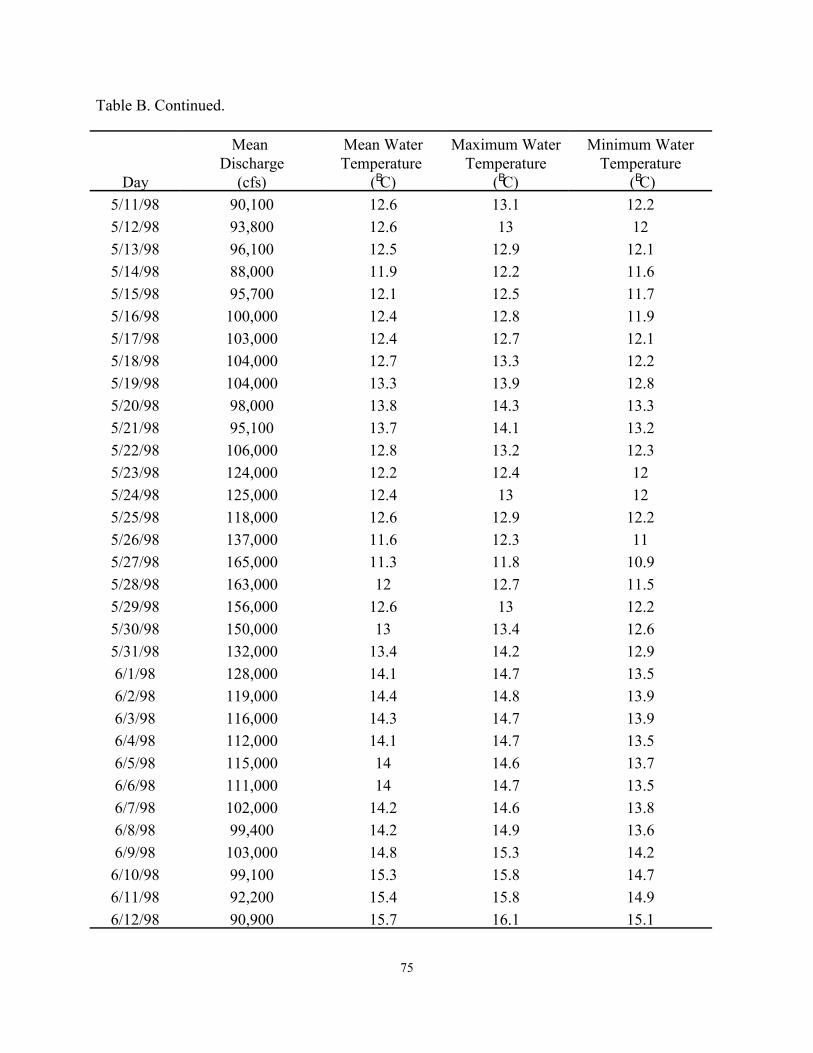
Table B. Continued.
Day
Mean Discharge
(cfs)
Mean WaterTemperature
(BC)
Maximum WaterTemperature
(BC)
Minimum WaterTemperature
(BC)
75
5/11/98 90,100 12.6 13.1 12.25/12/98 93,800 12.6 13 125/13/98 96,100 12.5 12.9 12.15/14/98 88,000 11.9 12.2 11.65/15/98 95,700 12.1 12.5 11.75/16/98 100,000 12.4 12.8 11.95/17/98 103,000 12.4 12.7 12.15/18/98 104,000 12.7 13.3 12.25/19/98 104,000 13.3 13.9 12.85/20/98 98,000 13.8 14.3 13.35/21/98 95,100 13.7 14.1 13.25/22/98 106,000 12.8 13.2 12.35/23/98 124,000 12.2 12.4 125/24/98 125,000 12.4 13 125/25/98 118,000 12.6 12.9 12.25/26/98 137,000 11.6 12.3 115/27/98 165,000 11.3 11.8 10.95/28/98 163,000 12 12.7 11.55/29/98 156,000 12.6 13 12.25/30/98 150,000 13 13.4 12.65/31/98 132,000 13.4 14.2 12.96/1/98 128,000 14.1 14.7 13.56/2/98 119,000 14.4 14.8 13.96/3/98 116,000 14.3 14.7 13.96/4/98 112,000 14.1 14.7 13.56/5/98 115,000 14 14.6 13.76/6/98 111,000 14 14.7 13.56/7/98 102,000 14.2 14.6 13.86/8/98 99,400 14.2 14.9 13.66/9/98 103,000 14.8 15.3 14.26/10/98 99,100 15.3 15.8 14.76/11/98 92,200 15.4 15.8 14.96/12/98 90,900 15.7 16.1 15.1

Table B. Continued.
Day
Mean Discharge
(cfs)
Mean WaterTemperature
(BC)
Maximum WaterTemperature
(BC)
Minimum WaterTemperature
(BC)
76
6/13/98 95,500 15.7 16.1 15.26/14/98 97,800 15.9 16.4 15.56/15/98 96,400 15.7 16.1 15.36/16/98 93,900 15.2 15.8 14.86/17/98 88,100 14.7 15.4 14.16/18/98 79,500 15.4 16.1 14.96/19/98 73,900 15.5 16 15.16/20/98 73,000 15.3 16 14.76/21/98 73,400 16.1 16.7 15.66/22/98 70,700 16.3 16.6 15.86/23/98 67,600 16.7 17.3 16.36/24/98 66,800 16.8 17 16.66/25/98 64,100 16.3 16.7 166/26/98 71,300 15.8 16.2 15.56/27/98 79,100 15.7 16.3 15.16/28/98 75,200 16.2 16.9 15.76/29/98 68,400 17 17.7 16.56/30/98 68,000 18 18.6 17.67/1/98 63,400 18.7 19.2 18.2

77
Appendix C
The average total discharge, average turbine discharge, and average total (Kcfs) spill for LowerGranite, Little Goose, Lower Monumental, Ice Harbor, and McNary dams from March 1 to June30, 1998. Daily averages were calculated from midnight to midnight. This data is a subset of dataobtained from the Fish Passage Center.

78
Table C. The average total discharge, average turbine discharge, and average total spill (Kcfs) for Lower Granite, Little Goose, LowerMonumental, Ice Harbor, and McNary dams from March 1 to June 30, 1998. Daily averages were calculated from midnight to midnight. This data is a subset of data obtained from the Fish Passage Center. Abbreviations: Discharge = Dschrg., Average = Avg.
Lower Granite Dam Little Goose Dam Lower Monumental Dam Ice Harbor Dam McNary Dam
Date
AverageTotal
Dschrg.
Average TurbineDschrg.
Avg.TotalSpill
AverageTotal
Dschrg.
Average TurbineDschrg.
Avg.TotalSpill
AverageTotal
Dschrg.
Average TurbineDschrg.
Avg.TotalSpill
AverageTotal
Dschrg.
Average TurbineDschrg.
Avg.TotalSpill
AverageTotal
Dschrg.
Average TurbineDschrg.
Avg.TotalSpill
03/01 47.95 47.85 0.00 42.18 41.98 0.00 46.75 46.55 0.00 48.02 47.82 0.00 154.92 150.92 0.0003/02 35.85 35.68 0.00 35.84 35.58 0.00 38.11 37.88 0.00 35.88 35.68 0.00 156.42 152.42 0.0003/03 35.13 35.03 0.00 33.33 33.13 0.00 35.59 35.29 0.00 33.33 33.13 0.00 182.84 178.88 0.0003/04 34.65 34.55 0.00 31.23 30.97 0.00 31.22 30.92 0.00 30.52 30.32 0.00 183.11 179.11 0.0003/05 48.10 48.00 0.00 53.28 53.08 0.00 60.77 60.41 0.00 65.35 41.10 24.07 196.13 192.13 0.0003/06 36.38 36.28 0.00 36.47 36.27 0.00 37.79 37.49 0.00 35.21 10.80 23.49 161.85 157.43 0.0003/07 35.57 35.47 0.00 34.98 34.78 0.00 35.38 35.08 0.00 39.36 15.53 23.60 156.45 152.46 0.0003/08 33.32 33.22 0.00 30.01 29.81 0.00 31.44 31.14 0.00 28.57 28.31 0.00 140.01 136.01 0.0003/09 46.23 46.13 0.00 66.90 66.70 0.00 76.10 70.56 5.17 80.76 52.46 27.90 154.90 150.90 0.0003/10 35.36 35.26 0.00 29.40 29.20 0.00 28.23 27.87 0.00 27.52 27.25 0.00 155.59 151.59 0.0003/11 36.57 36.47 0.00 32.76 32.56 0.00 38.06 37.76 0.00 37.65 37.45 0.00 164.17 160.17 0.0003/12 37.93 37.83 0.00 41.43 41.16 0.00 41.94 41.39 0.00 43.63 43.43 0.00 157.46 153.46 0.0003/13 38.01 37.78 0.00 32.38 32.18 0.00 33.85 33.55 0.00 32.43 32.23 0.00 166.68 162.68 0.0003/14 39.43 39.26 0.00 38.06 37.73 0.00 40.22 39.67 0.00 39.28 39.08 0.00 150.20 146.20 0.0003/15 41.29 41.19 0.00 40.23 38.59 1.44 41.97 41.67 0.00 42.33 42.01 0.00 127.54 123.54 0.0003/16 47.74 47.43 0.00 48.30 47.71 0.08 49.31 48.70 0.00 47.43 46.73 0.00 159.43 155.43 0.0003/17 44.02 43.36 0.00 44.22 43.83 0.00 49.65 49.17 0.00 50.15 49.58 0.00 179.23 160.55 14.6903/18 42.88 42.36 0.00 42.80 42.41 0.00 44.48 43.99 0.00 41.54 41.09 0.00 195.41 170.94 20.0003/19 46.34 45.55 0.00 44.67 44.34 0.00 45.60 45.05 0.00 48.47 48.02 0.00 180.86 168.13 7.6303/20 47.06 46.62 0.00 49.09 48.70 0.00 51.77 51.28 0.00 48.26 47.87 0.00 176.25 171.64 0.0003/21 41.69 41.25 0.00 43.20 42.87 0.00 45.96 45.48 0.00 43.57 43.12 0.00 164.61 153.39 6.5203/22 44.38 43.93 0.00 47.77 47.38 0.00 51.05 50.62 0.00 53.27 52.88 0.00 130.37 125.67 0.0003/23 50.10 49.52 0.00 52.00 51.61 0.00 54.40 53.83 0.00 55.55 55.16 0.00 156.10 151.40 0.0003/24 65.47 64.23 0.59 62.81 60.75 1.39 65.29 62.83 1.74 58.75 52.75 5.61 172.14 165.37 2.07

Table C. Continued
Lower Granite Dam Little Goose Dam Lower Monumental Dam Ice Harbor Dam McNary Dam
Date
AverageTotal
Dschrg.
Average TurbineDschrg.
Avg.TotalSpill
AverageTotal
Dschrg.
Average TurbineDschrg.
Avg.TotalSpill
AverageTotal
Dschrg.
Average TurbineDschrg.
Avg.TotalSpill
AverageTotal
Dschrg.
Average TurbineDschrg.
Avg.TotalSpill
AverageTotal
Dschrg.
Average TurbineDschrg.
Avg.TotalSpill
79
03/25 74.12 66.17 7.57 72.89 61.18 11.30 78.09 56.23 21.47 81.82 56.43 24.88 197.51 145.29 47.5603/26 75.38 68.47 6.18 75.24 66.55 8.04 78.00 68.70 8.52 79.85 56.65 22.68 253.31 165.34 83.4503/27 83.23 69.50 13.37 84.50 77.63 6.21 89.88 75.57 13.47 92.99 58.76 33.82 241.15 173.70 62.7403/28 63.45 63.00 0.00 63.64 63.18 0.00 68.36 67.63 0.00 72.55 62.05 9.82 215.28 169.61 40.9803/29 60.50 59.91 0.00 60.66 60.13 0.00 68.12 67.33 0.00 66.23 61.87 3.74 159.58 154.88 0.0003/30 57.74 57.09 0.00 57.07 56.35 0.00 57.85 56.93 0.00 58.73 57.91 0.00 164.64 159.94 0.0003/31 61.09 60.36 0.00 62.11 61.34 0.00 65.71 64.38 0.49 60.37 59.62 0.00 192.88 162.11 26.0704/01 43.99 43.62 0.00 44.87 44.28 0.00 49.75 48.90 0.00 52.46 51.65 0.00 153.69 148.99 0.0004/02 53.39 52.95 0.00 54.66 54.14 0.00 58.01 57.35 0.00 57.43 56.80 0.00 147.63 142.93 0.0004/03 53.78 53.41 0.00 56.38 55.80 0.00 59.12 58.39 0.00 60.08 59.39 0.00 137.00 132.32 0.0004/04 55.63 55.33 0.00 57.05 56.59 0.00 60.15 59.43 0.00 58.84 58.15 0.00 138.76 134.06 0.0004/05 55.87 55.43 0.00 59.65 59.13 0.00 62.43 61.51 0.00 57.18 56.43 0.00 131.28 126.58 0.0004/06 64.40 56.46 7.30 70.95 55.39 14.98 76.97 66.46 9.78 76.45 64.15 11.49 148.14 143.44 0.0004/07 68.70 39.21 29.05 74.45 43.98 29.76 78.73 58.15 19.73 83.29 37.37 45.05 149.89 145.19 0.0004/08 63.02 33.74 28.86 57.79 28.84 28.35 63.13 42.17 20.13 66.06 17.95 47.43 137.45 132.75 0.0004/09 61.28 31.92 28.88 57.40 32.33 24.55 61.43 41.00 19.71 67.25 11.20 55.25 129.85 125.15 0.0004/10 60.23 31.70 28.17 55.98 32.35 23.04 58.49 37.99 19.63 63.43 7.73 55.00 130.78 126.08 0.0004/11 60.66 35.20 25.15 59.49 35.95 22.94 61.93 42.82 18.45 66.58 13.10 52.79 135.97 131.27 0.0004/12 58.38 32.82 25.12 54.75 33.28 20.83 55.61 36.98 17.78 59.87 12.82 46.31 128.94 124.24 0.0004/13 58.43 42.46 15.52 54.49 30.79 23.10 57.53 37.64 19.23 63.03 9.33 53.02 133.57 129.06 0.0004/14 55.48 49.17 5.73 57.57 33.78 23.07 58.18 38.27 19.06 61.72 9.39 51.45 125.56 121.01 0.0004/15 57.31 50.95 5.91 55.62 35.20 19.73 58.97 39.51 18.61 62.63 8.83 52.99 132.95 128.25 0.0004/16 55.85 49.46 6.01 55.63 33.05 22.04 56.92 36.41 19.67 62.12 10.81 50.62 144.66 140.04 0.0004/17 55.37 48.77 6.02 56.72 33.48 22.59 58.62 39.85 18.05 58.61 10.93 46.91 137.88 133.18 0.0004/18 53.52 46.93 6.01 54.16 35.43 18.15 55.70 35.89 19.10 58.20 6.65 50.52 129.29 124.59 0.0004/19 52.83 46.23 6.02 51.55 33.97 16.99 53.35 36.99 15.51 57.96 11.36 45.72 141.75 137.05 0.00

Table C. Continued
Lower Granite Dam Little Goose Dam Lower Monumental Dam Ice Harbor Dam McNary Dam
Date
AverageTotal
Dschrg.
Average TurbineDschrg.
Avg.TotalSpill
AverageTotal
Dschrg.
Average TurbineDschrg.
Avg.TotalSpill
AverageTotal
Dschrg.
Average TurbineDschrg.
Avg.TotalSpill
AverageTotal
Dschrg.
Average TurbineDschrg.
Avg.TotalSpill
AverageTotal
Dschrg.
Average TurbineDschrg.
Avg.TotalSpill
80
04/20 58.23 51.77 6.01 58.14 37.98 19.57 60.27 40.55 19.00 63.90 12.17 51.01 145.63 91.44 49.4904/21 64.66 54.58 9.50 65.93 42.53 22.57 69.79 50.70 18.20 75.78 17.13 57.83 155.63 100.35 50.6304/22 62.46 55.28 6.73 61.68 38.04 23.05 62.25 41.66 19.69 64.83 10.46 53.42 154.95 91.86 58.3804/23 71.39 64.32 6.51 69.10 45.55 22.89 70.34 51.55 18.00 76.37 15.95 59.48 202.82 123.40 74.7204/24 85.95 66.61 18.98 84.70 61.08 23.05 88.74 68.38 19.58 90.38 29.26 60.51 194.05 114.10 75.2804/25 98.56 66.18 32.06 94.41 70.98 22.86 101.23 82.50 18.06 103.48 36.81 65.80 180.33 105.72 69.9004/26 93.64 66.48 26.75 87.65 64.70 22.35 91.40 72.18 18.38 95.63 29.20 65.62 184.57 109.79 70.0804/27 84.11 66.19 17.34 80.39 55.31 22.98 81.70 63.41 17.50 86.81 26.16 59.79 200.13 125.50 69.9304/28 82.13 66.01 15.37 81.79 58.10 22.98 87.63 68.37 18.35 89.85 28.08 60.95 198.49 123.77 70.0304/29 83.64 66.20 16.84 81.13 57.65 22.83 84.23 65.32 17.93 87.67 24.23 62.38 196.89 122.19 70.0004/30 90.82 66.10 24.00 86.00 62.28 22.99 89.10 71.35 16.90 93.80 28.24 64.82 217.23 148.50 64.0305/01 100.85 66.38 34.03 94.70 71.20 22.85 98.60 80.50 17.26 103.19 36.86 65.40 230.62 156.07 69.8505/02 102.19 70.49 31.34 97.00 73.65 22.77 101.05 83.08 17.19 105.70 39.30 65.40 225.36 145.81 74.8505/03 111.75 84.52 26.70 106.89 78.23 27.89 113.16 89.43 22.91 114.10 42.55 70.61 278.82 154.01 120.1005/04 119.34 87.50 31.32 114.24 86.14 27.37 118.56 92.74 24.98 125.31 55.38 69.06 279.08 155.20 119.1805/05 124.45 92.92 30.95 119.65 86.85 31.80 121.88 92.46 28.53 126.63 53.00 72.51 295.98 160.41 130.8905/06 126.67 93.20 32.95 120.82 88.71 31.33 125.21 97.71 26.59 127.92 55.58 71.35 328.08 159.14 164.2505/07 126.55 94.71 31.33 122.25 91.43 30.22 125.75 99.84 25.05 129.72 60.76 68.14 337.82 169.58 163.5405/08 128.91 96.05 32.51 125.28 93.02 31.67 128.04 100.13 27.11 132.86 56.12 75.85 339.72 169.42 165.6005/09 131.33 96.20 34.75 126.81 91.33 34.83 134.62 100.35 33.35 139.65 59.48 79.05 360.50 169.90 185.9105/10 129.85 96.21 33.11 124.83 91.52 32.53 128.86 99.22 28.73 131.48 56.93 73.61 329.26 167.13 157.4305/11 123.73 93.88 29.20 118.11 74.76 42.64 124.08 98.75 24.55 128.83 61.41 66.61 300.39 160.58 135.1105/12 122.50 92.57 29.20 116.61 88.43 26.84 118.67 95.66 22.04 124.23 56.59 66.70 309.62 165.63 139.3005/13 125.43 95.75 29.29 124.10 89.75 33.46 129.00 100.55 27.53 132.59 63.04 68.75 326.50 169.65 152.1505/14 117.32 87.65 29.21 112.29 86.41 25.10 115.14 93.88 20.47 118.48 51.92 65.75 327.35 175.42 147.2405/15 126.96 94.13 32.39 120.80 86.84 33.38 125.67 95.54 29.28 129.23 61.10 67.38 333.35 174.72 153.94

Table C. Continued
Lower Granite Dam Little Goose Dam Lower Monumental Dam Ice Harbor Dam McNary Dam
Date
AverageTotal
Dschrg.
Average TurbineDschrg.
Avg.TotalSpill
AverageTotal
Dschrg.
Average TurbineDschrg.
Avg.TotalSpill
AverageTotal
Dschrg.
Average TurbineDschrg.
Avg.TotalSpill
AverageTotal
Dschrg.
Average TurbineDschrg.
Avg.TotalSpill
AverageTotal
Dschrg.
Average TurbineDschrg.
Avg.TotalSpill
81
05/16 123.69 94.07 29.25 120.29 89.72 29.98 125.11 96.87 27.40 130.48 63.63 65.85 317.63 173.71 139.2205/17 126.02 96.36 29.21 120.20 84.25 35.25 125.23 100.64 23.61 128.35 61.91 65.45 296.94 171.67 120.5705/18 127.91 90.78 36.52 125.07 91.45 32.83 128.84 101.32 26.59 133.53 66.28 66.51 293.58 163.98 124.9005/19 127.45 96.33 30.45 122.25 88.26 33.03 125.05 97.40 26.75 127.69 61.64 65.19 315.17 160.57 149.9005/20 125.55 92.86 32.34 121.30 83.30 37.19 128.43 95.52 32.07 134.93 68.08 65.65 308.15 157.30 146.0805/21 122.60 90.12 31.92 115.94 82.80 32.38 118.40 89.95 27.35 121.98 55.57 65.35 312.50 165.25 142.5505/22 143.55 100.93 42.03 138.47 94.22 43.56 143.10 100.07 42.06 145.73 71.13 73.59 293.09 154.74 133.6505/23 172.62 103.79 68.42 162.54 99.90 61.86 172.06 100.57 70.53 173.15 83.54 88.56 284.41 146.92 132.7905/24 173.52 104.01 68.85 166.23 99.98 65.56 179.32 100.08 78.20 183.34 75.64 106.77 317.34 156.38 156.2505/25 161.45 103.78 57.07 155.40 99.98 54.73 166.21 101.82 63.49 167.39 82.01 84.40 287.05 140.09 142.2605/26 177.99 103.72 73.40 167.68 98.71 68.32 179.42 99.70 79.02 180.59 85.51 94.33 306.10 154.14 147.2505/27 213.28 103.30 109.40 200.40 101.35 98.36 211.45 100.62 109.99 212.39 86.93 124.60 379.64 168.13 206.8205/28 208.98 102.85 105.75 197.82 98.84 98.26 221.30 100.03 120.48 218.59 85.40 132.31 400.13 157.19 238.2505/29 191.89 103.14 88.15 183.07 97.35 85.20 191.80 98.61 92.35 189.61 84.29 104.33 408.97 153.27 251.0005/30 189.52 100.22 88.78 179.83 92.26 86.91 198.00 96.38 100.89 200.01 91.34 107.81 414.28 165.51 244.0805/31 167.49 101.98 64.85 163.09 91.57 70.89 174.79 86.30 87.59 176.49 87.15 88.46 394.40 163.48 226.2206/01 162.64 102.16 59.71 152.76 86.32 65.73 160.20 94.67 64.63 164.29 84.40 79.13 366.78 166.68 195.4006/02 149.04 98.68 49.80 144.06 74.68 68.56 153.03 85.83 66.17 156.20 72.90 82.21 384.97 150.27 230.0006/03 150.65 92.36 57.99 146.01 79.28 66.13 155.69 90.83 64.00 157.22 72.59 83.76 405.38 163.38 237.3006/04 142.04 98.35 43.37 138.98 86.40 51.98 144.10 93.64 49.62 149.31 72.88 75.67 390.75 162.86 223.1906/05 144.14 87.48 56.37 138.66 83.18 55.02 147.32 95.22 51.43 151.39 75.04 75.53 353.51 168.00 180.8106/06 139.22 85.79 53.13 131.38 86.13 44.78 138.78 98.16 39.88 140.50 71.73 67.95 373.29 166.12 202.4806/07 131.15 72.82 58.03 124.37 77.78 46.12 130.28 92.69 36.79 133.51 57.78 74.90 316.82 152.12 160.0006/08 125.65 82.20 42.89 119.45 81.68 37.19 123.10 91.90 30.40 127.83 61.20 65.90 322.76 163.44 154.9306/09 126.60 86.64 39.31 123.53 83.78 39.17 128.20 94.18 33.10 134.39 64.84 68.80 337.04 168.22 164.12

Appendix C. Continued.
Lower Granite Dam Little Goose Dam Lower Monumental Dam Ice Harbor Dam McNary Dam
Date
AverageTotal
Dschrg.
Average TurbineDschrg.
Avg.TotalSpill
AverageTotal
Dschrg.
Average TurbineDschrg.
Avg.TotalSpill
AverageTotal
Dschrg.
Average TurbineDschrg.
Avg.TotalSpill
AverageTotal
Dschrg.
Average TurbineDschrg.
Avg.TotalSpill
AverageTotal
Dschrg.
Average TurbineDschrg.
Avg.TotalSpill
82
06/10 121.06 71.28 49.27 115.28 77.16 37.34 119.28 90.05 28.45 122.54 56.28 65.31 315.17 159.58 150.8806/11 117.24 82.85 33.74 112.94 75.78 36.44 118.58 94.43 23.36 123.48 55.30 67.07 310.78 164.49 141.5906/12 114.62 79.81 34.43 109.16 73.71 34.74 112.61 93.62 18.09 115.02 49.03 65.05 296.52 164.93 126.8906/13 120.40 79.75 40.15 116.41 70.23 45.59 122.83 101.70 20.31 122.95 56.56 65.55 304.28 162.48 137.1006/14 122.68 84.05 38.12 116.45 73.74 42.05 120.32 102.59 17.00 126.27 59.70 65.70 290.83 174.81 111.3206/15 119.41 90.67 28.16 117.64 63.46 53.58 122.16 104.28 17.15 123.94 57.69 65.50 273.74 158.31 110.7306/16 116.64 90.58 25.26 112.90 77.68 34.58 116.95 98.27 17.83 117.90 52.65 64.50 213.86 135.47 73.7806/17 115.23 87.54 27.25 108.94 79.13 29.23 114.41 95.18 18.39 118.23 55.12 62.24 252.14 152.18 95.2806/18 97.61 69.92 27.18 100.38 71.26 28.55 104.23 86.28 17.15 108.38 45.12 62.57 253.33 153.78 94.8506/19 94.27 66.45 27.38 89.68 64.58 24.53 94.58 72.33 21.40 98.66 36.41 61.45 254.25 142.65 106.8906/20 99.64 71.91 27.08 96.78 71.25 24.81 100.37 73.38 26.21 105.20 43.18 61.02 276.35 150.09 121.5506/21 91.51 91.05 0.02 90.28 89.63 0.00 96.59 95.76 0.05 99.36 37.57 60.86 230.93 154.05 72.1806/22 88.95 88.37 0.00 88.95 88.43 0.00 94.34 93.49 0.06 96.49 33.43 62.20 208.34 131.19 72.4506/23 84.24 83.65 0.00 85.05 84.15 0.00 91.43 90.38 0.25 93.75 35.23 57.77 214.58 137.30 72.5806/24 86.04 85.67 0.00 85.65 84.94 0.00 90.35 89.50 0.00 91.41 33.35 57.05 284.06 162.93 116.4506/25 83.13 77.35 5.35 81.83 81.37 0.00 86.12 85.45 0.00 86.43 25.88 59.93 267.72 167.33 95.6906/26 90.68 90.30 0.00 89.98 89.52 0.00 94.69 94.03 0.00 100.40 38.55 61.19 258.79 160.92 93.1806/27 101.31 100.80 0.00 99.99 99.47 0.00 109.25 108.53 0.00 109.67 47.94 61.05 275.76 165.55 105.5206/28 97.96 97.38 0.00 99.33 98.81 0.00 106.52 105.73 0.00 110.30 48.46 61.14 250.81 168.39 77.7306/29 88.07 87.63 0.00 89.73 89.15 0.00 96.70 95.79 0.00 97.61 35.98 61.00 242.27 161.55 76.0206/30 85.09 84.58 0.00 83.75 82.98 0.00 87.84 87.05 0.00 91.33 34.53 56.07 235.25 146.32 84.23
Sum of the Daily Avg. Spill 2,680.2 2,841.8 2,552.5 5,949.1 9,700.3

83
Appendix D
A summary of the daily catch of natural reared chinook salmon and steelhead captured in the upperand lower Imnaha screw traps from October 14 to December 19, 1997.

84
Table D. A summary of the daily catch of natural chinook salmon and steelhead captured in theupper and lower Imnaha screw traps from October 14 to December 19, 1997.
Date Lower Trap Site Natural Natural Chinook Salmon Steelhead
Upper Trap Site Natural NaturalChinook Salmon Steelhead
10/14/98 24 0 -- --
10/15/98 15 1 143 1
10/16/98 3 1 229 2
10/17/98 14 1 -- --
10/18/98 -- -- -- --
10/19/98 -- -- -- --
10/20/98 -- -- -- --
10/21/98 67 2 192 0
10/22/98 43 4 362 0
10/23/98 46 5 243 0
10/24/98 108 0 -- --
10/25/98 -- -- -- --
10/26/98 -- -- -- --
10/27/98 -- -- -- --
10/28/98 76 4 141 1
10/29/98 59 3 137 0
10/30/98 33 10 227 5
10/31/98 102 40 -- --
11/1/98 -- -- -- --
11/2/98 -- -- -- --
11/3/98 -- -- -- --
11/4/98 -- -- 75 3
11/5/98 45 0 97 2

85
Table D. Continued.
Date Lower Trap Site Natural Natural Chinook Salmon Steelhead
Upper Trap Site Natural NaturalChinook Salmon Steelhead
11/6/98 37 2 96 6
11/7/98 14 2 73 0
11/8/98 10 0 85 1
11/9/98 -- -- 37 3
11/10/98 -- -- -- --
11/11/98 -- -- -- --
11/12/98 -- -- -- --
11/13/98 58 4 -- --
11/14/98 54 4 -- --
11/15/98 83 8 95 0
11/16/98 -- -- -- --
11/17/98 74 11 -- --
11/18/98 74 4 -- --
11/19/98 17 3 -- --
11/20/98 47 2 -- --
11/21/98 33 0 -- --
11/22/98 15 2 -- --
11/23/98 68 0 -- --
11/24/98 32 1 -- --
11/25/98 17 0 -- --
11/26/98 36 1 -- --
11/27/98 -- -- -- --
11/28/98 -- -- -- --

Table D. Continued.
86
Date Lower Trap Site Natural Natural Chinook Salmon Steelhead
Upper Trap Site Natural NaturalChinook Salmon Steelhead
11/29/98 -- -- -- --
11/30/98 29 0 -- --
12/1/98 15 0 -- --
12/2/98 12 0 -- --
12/3/98 9 0 -- --
12/4/98 9 0 -- --
12/5/98 13 0 -- --
12/6/98 -- -- -- --
12/7/98 -- -- -- --
12/8/98 -- -- -- --
12/9/98 40 1 -- --
12/10/98 26 1 -- --
12/11/98 8 0 -- --
12/12/98 9 0 -- --
12/13/98 -- -- -- --
12/14/98 -- -- -- --
12/15/98 -- -- -- --
12/16/98 9 0 -- --
12/17/98 7 4 -- --
12/18/98 7 0 -- --
12/19/98 19 2 -- --

87
Appendix E
A summary of the daily catch of natural and hatchery reared chinook salmon and steelheadcaptured in the lower Imnaha River screw traps from February 26 to June 16, 1998.

88
Table E. A summary of the daily catch of natural and hatchery reared chinook salmon andsteelhead captured in the Lower Imnaha River screw traps from February 26 to June 16, 1998.
Date Natural ChinookSalmon
Hatchery ChinookSalmon
Natural Steelhead Hatchery Steelhead
2/27/98 15 0 0 03/5/98 9 0 0 03/6/98 5 0 0 03/9/98* 4 0 0 03/10/98* 2 0 1 03/11/98* 0 0 0 03/12/98* 4 0 0 03/13/98* 10 0 0 03/16/98* 239 0 3 03/17/98* 464 0 15 03/18/98* 501 0 24 03/19/98* 317 0 9 03/20/98* 184 0 5 03/21/98* 84 0 5 03/22/98* 79 0 9 13/23/98* 155 0 28 13/24/98 - - - -3/25/98 - - - -3/26/98 21 0 25 03/27/98 44 0 3 03/30/98 167 0 68 03/31/98 152 0 52 04/1/98* 131 0 54 04/2/98* 125 0 60 04/3/98* 65 0 18 04/6/98* 101 0 20 04/7/98 65 8 11 04/8/98 59 870 20 04/9/98 23 3,927 14 04/10/98 3 2,805 6 04/11/98 18 2,636 15 04/12/98 34 2,956 16 0

Table E. Continued.
Date Natural ChinookSalmon
Hatchery ChinookSalmon
Natural Steelhead Hatchery Steelhead
89
4/13/98 72 1,426 17 14/14/98 104 1,390 55 04/15/98 111 733 31 04/16/98 94 327 45 04/17/98 57 159 21 04/20/98* 67 110 78 04/21/98* 112 100 99 14/22/98* 199 186 338 54/23/98* 106 125 578 24/24/98 0 0 0 04/27/98 4 9 55 7824/28/98 21 11 80 4054/29/98 19 13 125 3994/30/98 14 12 160 3915/1/98 16 12 150 2965/4/98 0 0 0 05/5/98 1 3 54 835/6/98 1 2 36 355/7/98 3 2 42 355/8/98 0 0 34 25
5/11/98* 2 0 29 655/12/98* 6 5 75 1465/13/98* 18 4 84 1555/14/98 20 0 93 1615/15/98 13 1 78 1365/18/98* 18 1 211 2075/19/98* 19 0 200 2005/20/98 6 2 100 5315/21/98 1 0 81 3325/22/98 5 2 125 5655/25/98 0 0 0 05/26/98 0 0 0 0

Table E. Continued.
Date Natural ChinookSalmon
Hatchery ChinookSalmon
Natural Steelhead Hatchery Steelhead
90
5/27/98 0 0 0 05/28/98 0 0 0 05/29/98 0 0 0 06/1/98 0 0 0 06/2/98 1 0 6 146/3/98 1 0 4 166/4/98 0 0 2 66/5/98 0 0 0 126/8/98 0 0 0 56/9/98 0 0 1 156/10/98 0 0 0 356/11/98 2 0 1 506/12/98 0 0 0 46/15/98 2 0 0 76/16/98 0 0 0 17Total 4,195 17,837 3,569 5,141
* The asterisk notes days when two traps were fishing.

91
Appendix F
T-test values and sample sizes (n) for seven statistical comparisons of mean fork lengths of naturaland hatchery chinook salmon and steelhead in the fall of 1997 and spring of 1998 and onecomparison of mean travel times of natural and hatchery chinook salmon and steelhead from thelower Imnaha River trap to Lower Granite Reservoir in 1998.
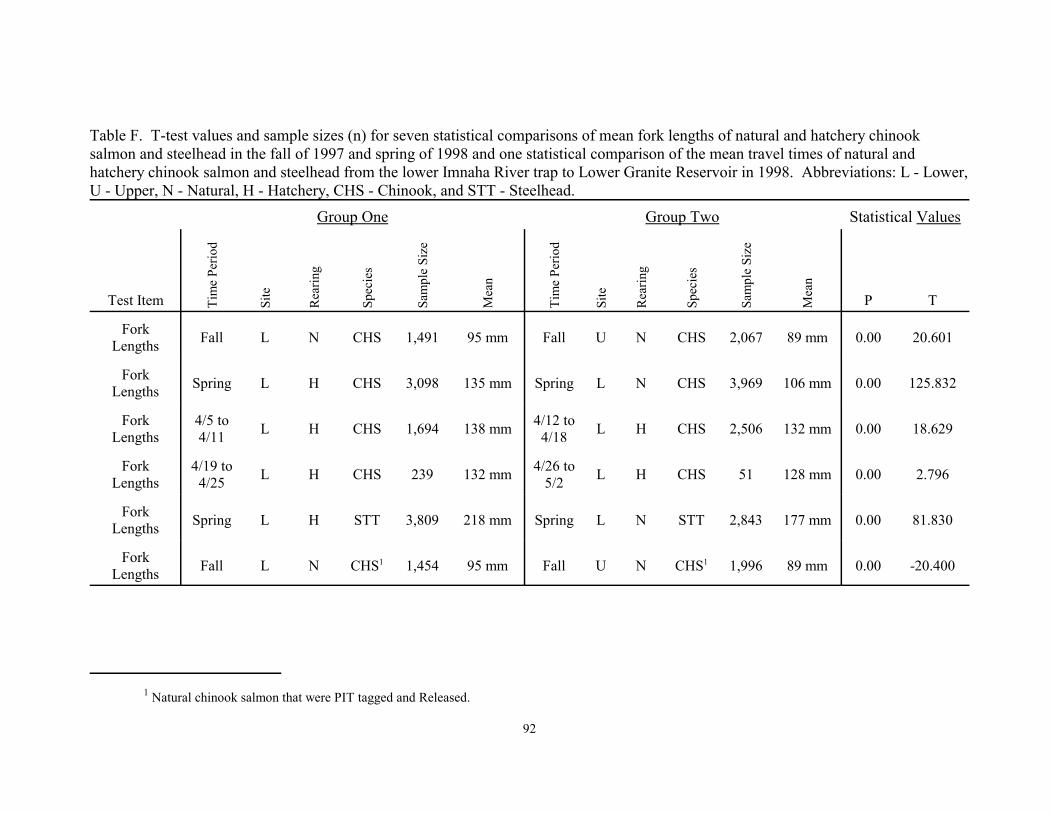
1 Natural chinook salmon that were PIT tagged and Released.
92
Table F. T-test values and sample sizes (n) for seven statistical comparisons of mean fork lengths of natural and hatchery chinooksalmon and steelhead in the fall of 1997 and spring of 1998 and one statistical comparison of the mean travel times of natural andhatchery chinook salmon and steelhead from the lower Imnaha River trap to Lower Granite Reservoir in 1998. Abbreviations: L - Lower,U - Upper, N - Natural, H - Hatchery, CHS - Chinook, and STT - Steelhead.
Group One Group Two Statistical Values
Test Item Tim
e Pe
riod
Site
Rea
ring
Spec
ies
Sam
ple
Size
Mea
n
Tim
e Pe
riod
Site
Rea
ring
Spec
ies
Sam
ple
Size
Mea
n
P T
ForkLengths Fall L N CHS 1,491 95 mm Fall U N CHS 2,067 89 mm 0.00 20.601
ForkLengths Spring L H CHS 3,098 135 mm Spring L N CHS 3,969 106 mm 0.00 125.832
ForkLengths
4/5 to4/11 L H CHS 1,694 138 mm 4/12 to
4/18 L H CHS 2,506 132 mm 0.00 18.629
ForkLengths
4/19 to4/25 L H CHS 239 132 mm 4/26 to
5/2 L H CHS 51 128 mm 0.00 2.796
ForkLengths Spring L H STT 3,809 218 mm Spring L N STT 2,843 177 mm 0.00 81.830
ForkLengths Fall L N CHS1 1,454 95 mm Fall U N CHS1 1,996 89 mm 0.00 -20.400

Table F. Continued.
Group One Group Two Statistical Values
2 Hatchery chinook salmon that were marked and released for trap efficiency trials.
3 Hatchery chinook salmon that were marked, released for trap efficiency trials and then recaptured.
93
Test Item Tim
e Pe
riod
Site
Rea
ring
Spec
ies
Sam
ple
Size
Mea
n
Tim
e Pe
riod
Site
Rea
ring
Spec
ies
Sam
ple
Size
Mea
n
P T
ForkLengths Spring L H CHS2 1,071 133 mm Spring L H CHS3 667 135 mm 0.00 -4.286
TravelTimes
4/5 to4/11 L N CHS 100 20.8 days 4/5 to
4/11 L H CHS 357 21.3days 0.61 -0.557

94
Appendix G
Daily mean fork lengths (MFL), weights, and condition factors with standard deviations (STD) fornatural and hatchery chinook salmon and steelhead captured in the Imnaha River screw traps duringthe spring emigration of 1998.

95
Table G. Daily mean fork lengths (MFL), weights, and condition factors with standard deviations(STD) for natural and hatchery chinook salmon and steelhead captured in the Imnaha River screwtraps during the spring emigration of 1998.Species/ Date MFL
MFL(STD)
Mean Weight
Mean Weight(STD)
Mean ConditionFactor
Mean ConditionFactor (STD)
Natural Chinook salmon02/27/98 106 7.7 12.6 3.03 1.04 0.04803/10/98 110 5.2 13.2 2.21 0.94 0.02903/12/98 106 9.1 13.5 3.01 1.15 0.28203/13/98 108 6.7 13.3 2.89 1.03 0.05003/16/98 108 7.7 13.3 2.73 1.05 0.08403/17/98 107 7.6 13.0 2.79 1.05 0.07703/18/98 105 7.4 12.3 2.81 1.04 0.08303/19/98 105 7.4 11.8 2.60 1.00 0.07003/20/98 103 7.8 12.2 3.32 1.09 0.16003/21/98 103 6.4 11.5 2.33 1.03 0.05903/22/98 104 8.4 12.0 3.09 1.05 0.07803/23/98 106 8.1 12.5 3.08 1.03 0.06603/26/98 102 5.3 11.7 2.09 1.11 0.06903/27/98 107 7.1 13.3 2.85 1.07 0.07003/30/98 103 8.6 11.6 3.63 1.03 0.06803/31/98 104 11.8 12.1 6.25 1.03 0.07804/01/98 102 7.3 11.3 2.47 1.05 0.06504/02/98 103 7.6 11.5 2.74 1.04 0.06304/03/98 104 7.5 11.6 2.69 1.02 0.05904/06/98 105 6.7 12.0 2.42 1.02 0.06204/07/98 106 7.2 13.0 2.85 1.07 0.07104/08/98 106 8.6 12.5 3.42 1.02 0.10304/09/98 103 8.0 12.6 2.19 1.17 0.16304/10/98 115 26.7 17.7 18.26 0.99 0.08404/11/98 106 7.1 12.2 2.73 0.99 0.07504/12/98 109 5.2 13.9 2.57 1.05 0.07804/13/98 105 8.1 12.4 2.97 1.04 0.12804/14/98 105 7.4 13.2 2.92 1.12 0.12504/15/98 107 11.4 13.5 4.84 1.07 0.083

Table G. Continued.
Species/ Date MFL
MFL(STD)
Mean Weight
Mean Weight(STD)
Mean ConditionFactor
Mean ConditionFactor (STD)
96
Natural Chinook Salmon04/16/98 108 7.4 13.6 3.01 1.07 0.09404/17/98 112 0.0 15.5 0.00 1.10 0.00004/20/98 107 8.3 13.8 3.30 1.11 0.08904/21/98 108 7.7 14.2 3.24 1.10 0.09204/22/98 113 10.5 16.1 5.32 1.10 0.08904/23/98 111 8.0 14.6 3.12 1.05 0.07104/26/98 100 5.7 11.1 3.03 1.12 0.10804/27/98 101 6.1 12.0 2.37 1.14 0.09104/28/98 105 8.5 12.5 3.41 1.06 0.11104/29/98 112 23.6 17.1 15.23 1.08 0.06604/30/98 106 8.2 13.0 3.57 1.06 0.07505/05/98 116 0.0 14.0 0.00 0.90 0.00005/06/98 113 0.005/07/98 104 10.7 13.4 3.78 1.17 0.02205/12/98 105 6.2 13.2 2.03 1.14 0.12805/13/98 103 6.9 12.4 2.32 1.11 0.06605/14/98 107 6.6 13.9 2.72 1.13 0.07005/15/98 107 6.7 13.9 2.33 1.13 0.08205/18/98 102 8.405/19/98 102 9.3 11.8 2.90 1.06 0.14805/20/98 102 12.6 11.9 5.44 1.05 0.06505/22/98 107 10.1 13.7 3.54 1.10 0.05406/02/98 98 0.0 11.3 0.00 1.20 0.00006/03/98 95 0.0 10.7 0.00 1.25 0.00006/11/98 98 3.0 11.2 0.85 1.18 0.02006/15/98 89 3.5 7.9 0.30 1.16 0.180Hatchery Chinook Salmon04/07/98 138 0.0 30.0 0.0 1.14 0.00004/08/98 141 11.4 31.7 8.7 1.11 0.07004/09/98 136 10.5 29.0 6.2 1.11 0.09604/10/98 139 11.7 30.8 15.0 1.13 0.744

Table G. Continued.
Species/ Date MFL
MFL(STD)
Mean Weight
Mean Weight(STD)
Mean ConditionFactor
Mean ConditionFactor (STD)
97
Hatchery Chinook Salmon04/11/98 137 12.4 27.6 10.0 1.04 0.08504/12/98 135 9.1 25.8 5.9 1.04 0.10204/13/98 133 10.6 25.2 6.2 1.07 0.10704/14/98 151 52.6 25.3 7.3 0.51 0.47104/15/98 129 12.6 26.7 10.6 1.43 1.39904/16/98 131 9.2 24.0 5.6 1.03 0.07004/20/98 123 0.0 22.8 0.0 1.23 0.00004/21/98 131 8.8 24.5 5.5 1.09 0.10704/22/98 133 10.7 26.0 6.8 1.08 0.11904/23/98 157 0.0 38.9 0.0 1.01 0.00004/27/98 128 5.804/28/98 123 8.004/29/98 131 7.604/30/98 133 6.705/01/98 128 5.905/05/98 132 5.605/06/98 135 4.005/12/98 130 6.805/13/98 138 8.3 26.3 6.0 0.99 0.06805/14/98 131 0.5 23.3 1.0 1.05 0.05505/15/98 130 0.0 27.8 0.0 1.27 0.00005/18/98 138 0.005/20/98 119 0.005/22/98 127 0.0 22.5 0.0 1.10 0.000Natural Steelhead03/16/98 135 36.2 30.6 24.48 1.05 0.11203/17/98 158 12.0 38.2 8.83 0.96 0.05203/18/98 143 18.3 29.4 12.63 0.97 0.07603/19/98 137 21.4 27.3 10.52 0.98 0.05103/20/98 145 14.9 32.2 9.88 1.04 0.08203/21/98 125 20.9 23.1 11.87 1.07 0.053

Table G. Continued.
Species/ Date MFL
MFL(STD)
Mean Weight
Mean Weight(STD)
Mean ConditionFactor
Mean ConditionFactor (STD)
98
Natural Steelhead03/22/98 140 14.1 29.2 7.42 1.04 0.06003/23/98 151 34.6 38.1 26.96 0.96 0.11803/26/98 176 18.7 57.2 20.85 1.01 0.21303/27/98 154 29.9 42.7 23.41 1.04 0.14803/30/98 176 22.2 55.7 18.97 0.97 0.05703/31/98 170 28.5 50.7 21.00 0.97 0.10604/01/98 163 19.6 43.8 15.73 0.97 0.05704/02/98 160 17.3 42.6 13.98 1.00 0.07904/03/98 151 29.6 40.0 21.91 1.36 1.79104/06/98 167 24.4 46.8 21.08 0.95 0.07904/07/98 170 10.5 47.3 8.15 0.96 0.04004/08/98 168 25.7 47.1 21.88 0.90 0.20504/09/98 171 29.3 51.9 23.08 0.97 0.10404/10/98 186 17.6 54.9 27.80 0.81 0.29604/11/98 173 15.5 42.7 17.46 0.83 0.25204/12/98 174 11.9 53.5 13.47 0.99 0.08104/13/98 187 18.5 65.0 19.00 0.97 0.06904/14/98 174 18.8 53.8 18.38 0.98 0.05804/15/98 178 18.9 56.7 17.69 0.97 0.05304/16/98 184 19.1 58.6 24.09 0.90 0.22604/17/98 96 0.0 9.3 0.00 1.05 0.00004/20/98 176 21.2 54.2 20.50 0.96 0.06804/21/98 179 22.4 58.1 19.44 1.02 0.49004/22/98 188 22.5 66.7 24.02 0.97 0.06304/23/98 191 22.6 71.9 27.13 0.98 0.09004/26/98 180 17.7 45.3 28.68 0.77 0.43404/27/98 179 16.2 59.9 17.41 1.02 0.06504/28/98 179 17.5 56.7 19.95 0.97 0.18804/29/98 179 20.4 59.2 21.30 1.00 0.12804/30/98 179 19.9 60.0 20.01 1.01 0.05705/01/98 178 0.0 52.8 0.00 0.94 0.000

Table G. Continued.
Species/ Date MFL
MFL(STD)
Mean Weight
Mean Weight(STD)
Mean ConditionFactor
Mean ConditionFactor (STD)
99
Natural Steelhead05/05/98 177 15.1 52.3 13.71 0.92 0.05305/06/98 187 21.1 0.0 0.00 0.00 0.00005/07/98 178 16.2 59.0 17.36 1.01 0.05805/08/98 177 15.1 56.4 15.39 1.00 0.06205/11/98 181 23.6 0.0 0.00 0.00 0.00005/12/98 173 15.2 52.4 14.50 0.99 0.05405/13/98 171 13.8 51.0 12.79 1.00 0.06005/14/98 174 15.7 54.8 17.11 1.02 0.19905/15/98 170 16.2 51.0 15.16 1.02 0.05805/18/98 175 16.6 0.0 0.00 0.00 0.00005/19/98 171 15.4 50.7 16.47 0.99 0.15705/20/98 170 16.8 49.4 17.45 0.97 0.15805/21/98 169 17.0 46.7 18.26 0.96 0.15905/22/98 171 16.4 52.2 15.75 1.01 0.06706/02/98 158 23.7 46.3 15.21 1.11 0.06606/03/98 172 19.9 56.7 14.22 1.10 0.10206/09/98 161 0.0 38.3 0.00 0.92 0.00006/10/98 90 0.0 7.9 0.00 1.08 0.00006/11/98 219 0.0 99.6 0.00 0.95 0.00006/12/98 157 0.0 44.4 0.00 1.15 0.00006/15/98 106 0.0 10.6 0.00 0.89 0.000Hatchery Steelhead03/22/98 234 0.0 113.8 0.00 0.89 0.00003/23/98 263 0.0 155.2 0.00 0.85 0.00004/14/98 288 0.0 117.8 0.00 0.49 0.00004/21/98 281 0.0 203.9 0.00 0.92 0.00004/22/98 262 24.1 172.2 63.25 0.92 0.06204/23/98 260 7.5 178.3 7.65 1.02 0.04504/26/98 221 17.4 108.2 29.57 0.98 0.06004/27/98 225 19.0 119.4 36.27 1.01 0.06004/28/98 219 18.8 102.7 26.53 0.99 0.064

Table G. ContinuedTable G. Continued.
Species/ Date MFL
MFL(STD)
Mean Weight
Mean Weight(STD)
Mean ConditionFactor
Mean ConditionFactor (STD)
100
Hatchery Steelhead04/29/98 219 19.2 101.9 27.31 0.99 0.06005/05/98 222 18.4 101.5 29.13 0.90 0.05705/06/98 223 19.805/07/98 212 18.9 93.9 29.45 0.95 0.06405/08/98 219 18.5 105.2 28.03 0.98 0.04305/11/98 219 16.405/12/98 221 18.5 95.7 22.61 0.93 0.05105/13/98 218 20.0 101.5 27.48 0.95 0.05405/14/98 221 19.4 103.2 28.59 0.94 0.04905/15/98 218 18.2 101.2 26.59 0.95 0.05505/18/98 221 21.305/19/98 221 18.3 103.2 26.30 0.93 0.05105/20/98 211 19.9 93.2 29.37 0.97 0.06505/21/98 212 20.8 97.6 31.98 0.97 0.12405/22/98 208 19.0 87.8 0.00 1.05 0.00006/02/98 224 19.3 115.9 33.66 1.00 0.07206/03/98 221 22.8 109.4 33.53 0.99 0.08606/05/98 224 16.1 108.8 25.27 0.96 0.05806/09/98 220 24.3 104.9 41.08 0.94 0.09106/10/98 224 23.8 109.4 38.95 0.93 0.07106/11/98 215 20.9 99.0 33.34 0.96 0.06006/12/98 245 8.6 151.0 21.93 1.02 0.04506/15/98 219 30.7 104.7 42.90 0.94 0.05806/16/98 225 19.7 105.5 31.80 0.91 0.044

101
Appendix H
A summary of individual PIT tag release group release dates and times, number released, and meanfork lengths and weights with standard deviations for natural and hatchery chinook salmon andsteelhead released February 26 to June 16, 1998 from the lower Imnaha Trap.

102
Table H. A summary of individual PIT tag release group release dates, number released, and meanfork lengths and weights with standard deviations for natural and hatchery chinook salmon andsteelhead released February 26 to June 16, 1998 from the lower Imnaha Trap.
Rearing andSpecies PIT Tag Group Release Date
NumberReleased
Mean ForkLength(mm)
StandardDeviationof Length
MeanWeight
(g)
StandardDeviationof Weight
Natural Chinook salmonPAK98058.NT1 2/27/98 14 106 8.0 12.6 3.1PAK98069.NT1 3/10/98 4 112 6.2 13.2 2.6PAK98069.NT2 3/10/98 2 107 4.2 0.0 0.0PAK98071.NT1 3/12/98 2 99 5.0 12.4 2.1PAK98071.NT3 3/12/98 2 114 9.2 14.5 5.2PAK98072.NT1 3/13/98 9 108 7.1 13.3 3.1PAK98075.NT1 3/16/98 230 108 7.7 13.3 2.7PAK98076.NT1 3/17/98 432 107 7.7 13.0 2.9PAK98077.NT1 3/18/98 413 105 7.4 12.2 2.9PAK98078.NT1 3/19/98 305 105 9.7 11.6 2.9PAK98078.NT2 3/19/98 69 106 6.6 11.8 2.2PAK98079.NT1 3/20/98 168 103 7.9 12.2 3.3PAK98080.NT2 3/21/98 81 103 6.4 11.5 2.3PAK98081.NT1 3/22/98 77 104 8.4 12.0 3.1PAK98082.NT2 3/23/98 146 106 8.2 12.5 3.1PAK98085.NT1 3/26/98 16 102 5.4 11.7 2.2PAK98086.NT1 3/27/98 41 107 7.2 13.3 2.9PAK98089.NT4 3/30/98 48 104 11.0 11.9 5.2PAK98089.NT5 3/30/98 109 103 7.4 11.5 2.7PAK98090.NT1 3/31/98 40 103 6.1 11.9 2.3PAK98090.NT3 3/31/98 105 105 13.4 12.2 7.2PAK98091.NT1 4/1/98 128 103 6.7 11.4 2.4PAK98092.NT1 4/2/98 121 103 7.3 11.6 2.7PAK98093.NT2 4/3/98 60 104 7.6 11.6 2.7PAK98096.NT1 4/6/98 95 105 6.8 12.0 2.4PAK98097.NT1 4/7/98 39 105 7.7 12.8 3.1PAK98097.NT5 4/8/98 21 108 6.1 13.4 2.5PAK98098.NT2 4/8/98 27 106 8.7 12.5 3.5PAK98099.NTA 4/9/98 20 103 8.4 12.7 2.2PAK98099.NTC 4/9/98 1 85 60.9PAK98099.NTP 4/9/98 1 102 10.4

Table H. Continued.
Rearing andSpecies PIT Tag Group Release Date
NumberReleased
Mean ForkLength(mm)
StandardDeviationof Length
MeanWeight
(g)
StandardDeviationof Weight
103
Natural Chinook salmonPAK98100.NTC 4/10/98 2 107 14.8 13.3 4.7PAK98100.NTE 4/11/98 12 117 29.5 18.4 20.5PAK98101.NTA 4/12/98 33 106 7.2 11.8 3.5PAK98102.NTB 4/13/98 19 110 5.4 14.1 2.6PAK98103.NT1 4/13/98 33 105 8.2 12.7 3.9PAK98103.NTA 4/13/98 19 108 8.9 12.9 4.0PAK98103.NTB 4/14/98 2 115 13.4 15.1 6.2PAK98103.NTD 4/14/98 99 105 7.8 12.1 3.1PAK98104.NT1 4/15/98 109 105 7.3 13.2 3.0PAK98105.NT1 4/16/98 90 113 34.5 13.4 4.7PAK98106.NT1 4/17/98 3 106 1.0 12.6 0.3PAK98106.NT4 4/17/98 50 108 7.7 13.7 3.1PAK98110.NT1 4/20/98 94 107 8.2 13.8 3.3PAK98111.NT1 4/21/98 107 108 7.3 14.2 3.1PAK98112.NT1 4/22/98 4 107 3.2 16.9 4.2PAK98112.NT2 4/22/98 91 113 12.1 16.5 6.6PAK98112.NT3 4/22/98 94 112 8.8 15.8 3.8PAK98113.NT1 4/23/98 101 111 8.0 14.6 3.1PAK98116.NT2 4/27/98 4 100 6.6 8.4 6.3PAK98117.NT1 4/28/98 21 101 6.3 12.0 2.4PAK98118.NT1 4/29/98 18 105 8.7 12.5 3.5PAK98119.NT1 4/30/98 12 112 24.6 17.1 15.9PAK98120.NT1 5/1/98 15 106 8.5 13.0 3.7PAK98125.NT1 5/5/98 1 116 14.0PAK98126.NT1 5/6/98 1 113 0.0PAK98133.NT1 5/13/98 18 103 7.1 12.4 2.4PAK98134.NT1 5/14/98 20 107 6.9 13.9 2.8PAK98135.NT1 5/15/98 13 107 7.0 13.9 2.4PAK98138.NT1 5/18/98 17 102 8.7 0.0 0.0PAK98139.NT1 5/19/98 18 102 9.6 11.2 4.0PAK98140.NT1 5/20/98 6 102 13.8 11.9 6.0PAK98153.NT1 6/2/98 1 98 11.3
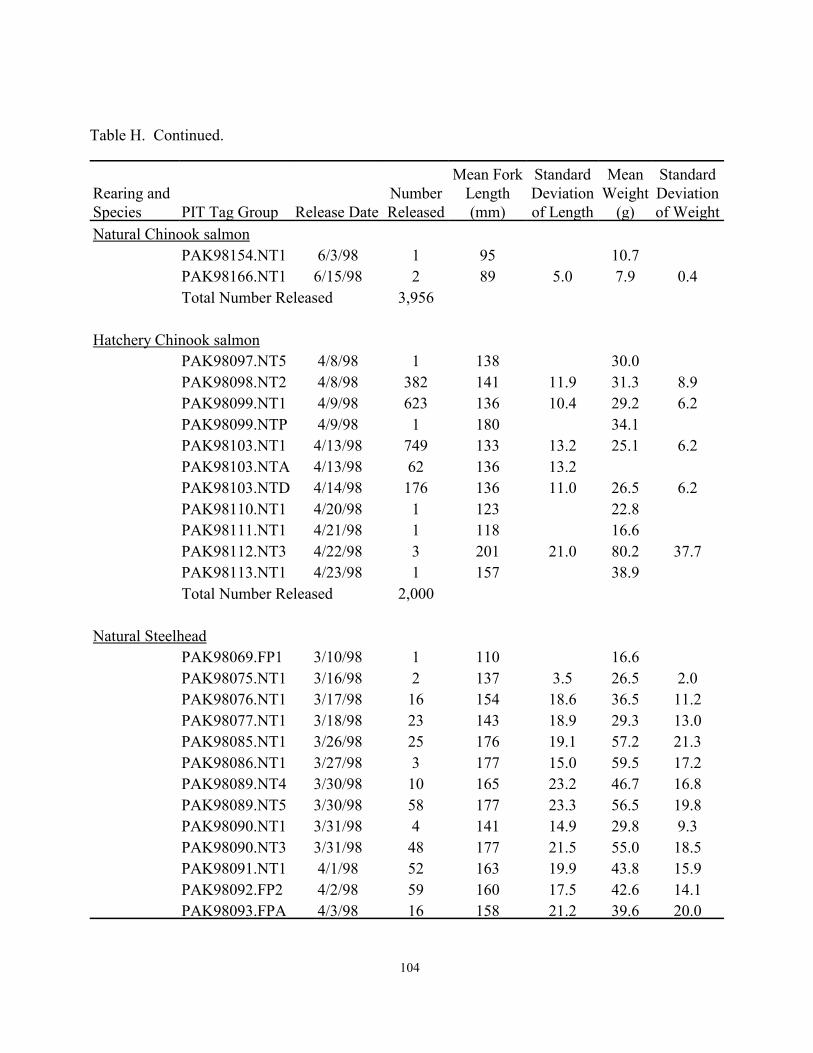
Table H. Continued.
Rearing andSpecies PIT Tag Group Release Date
NumberReleased
Mean ForkLength(mm)
StandardDeviationof Length
MeanWeight
(g)
StandardDeviationof Weight
104
Natural Chinook salmonPAK98154.NT1 6/3/98 1 95 10.7PAK98166.NT1 6/15/98 2 89 5.0 7.9 0.4Total Number Released 3,956
Hatchery Chinook salmonPAK98097.NT5 4/8/98 1 138 30.0PAK98098.NT2 4/8/98 382 141 11.9 31.3 8.9PAK98099.NT1 4/9/98 623 136 10.4 29.2 6.2PAK98099.NTP 4/9/98 1 180 34.1PAK98103.NT1 4/13/98 749 133 13.2 25.1 6.2PAK98103.NTA 4/13/98 62 136 13.2PAK98103.NTD 4/14/98 176 136 11.0 26.5 6.2PAK98110.NT1 4/20/98 1 123 22.8PAK98111.NT1 4/21/98 1 118 16.6PAK98112.NT3 4/22/98 3 201 21.0 80.2 37.7PAK98113.NT1 4/23/98 1 157 38.9Total Number Released 2,000
Natural SteelheadPAK98069.FP1 3/10/98 1 110 16.6PAK98075.NT1 3/16/98 2 137 3.5 26.5 2.0PAK98076.NT1 3/17/98 16 154 18.6 36.5 11.2PAK98077.NT1 3/18/98 23 143 18.9 29.3 13.0PAK98085.NT1 3/26/98 25 176 19.1 57.2 21.3PAK98086.NT1 3/27/98 3 177 15.0 59.5 17.2PAK98089.NT4 3/30/98 10 165 23.2 46.7 16.8PAK98089.NT5 3/30/98 58 177 23.3 56.5 19.8PAK98090.NT1 3/31/98 4 141 14.9 29.8 9.3PAK98090.NT3 3/31/98 48 177 21.5 55.0 18.5PAK98091.NT1 4/1/98 52 163 19.9 43.8 15.9PAK98092.FP2 4/2/98 59 160 17.5 42.6 14.1PAK98093.FPA 4/3/98 16 158 21.2 39.6 20.0

Table H. Continued.
Rearing andSpecies PIT Tag Group Release Date
NumberReleased
Mean ForkLength(mm)
StandardDeviationof Length
MeanWeight
(g)
StandardDeviationof Weight
105
Natural SteelheadPAK98096.FP1 4/6/98 19 168 21.5 45.4 18.0PAK98097.FP1 4/7/98 11 165 18.5 44.6 12.0PAK98098.FP1 4/9/98 6 183 21.1 59.8 20.0PAK98098.NT2 4/8/98 14 166 23.9 43.1 21.5PAK98099.NTA 4/9/98 14 173 27.0 53.6 23.1PAK98099.NTP 4/9/98 1 202 64.7PAK98100.NTC 4/10/98 4 192 25.6 60.8 46.8PAK98100.NTE 4/11/98 14 185 16.2 53.2 23.5PAK98101.NTA 4/12/98 14 173 15.5 40.3 19.8PAK98102.NTB 4/13/98 3 174 14.6 53.5 16.5PAK98103.NT1 4/13/98 9 174 15.3 54.6 15.0PAK98103.NTA 4/13/98 6 169 24.3 48.1 21.1PAK98103.NTB 4/14/98 3 174 7.9 51.9 9.8PAK98103.NTD 4/14/98 51 192 16.5 69.6 18.1PAK98104.NT1 4/15/98 30 174 19.1 53.8 18.7PAK98105.NT1 4/16/98 43 178 19.4 56.6 18.1PAK98106.NT4 4/17/98 21 185 19.2 55.9 27.1PAK98110.NT1 4/20/98 76 176 20.0 54.7 20.4PAK98111.NT1 4/21/98 95 181 19.7 59.0 19.1PAK98112.NT1 4/22/98 19 182 22.2 55.6 29.2PAK98112.NT2 4/22/98 194 190 21.2 68.6 24.4PAK98112.NT3 4/22/98 102 186 21.9 64.6 22.2PAK98113.NT1 4/23/98 228 192 22.6 69.9 29.0PAK98116.NT2 4/27/98 55 180 17.8 45.3 28.9PAK98117.NT1 4/28/98 80 177 25.8 59.6 17.7PAK98118.NT1 4/29/98 125 178 23.7 56.1 20.5PAK98119.NT1 4/30/98 158 178 24.3 59.1 21.2PAK98120.NT1 5/1/98 149 178 24.8 60.0 20.0PAK98125.NT1 5/5/98 53 177 15.3 52.2 14.0PAK98126.NT1 5/6/98 36 187 21.4 0.0 0.0PAK98127.NT1 5/7/98 41 178 16.5 59.0 17.6PAK98128.NT1 5/8/98 34 177 15.3 56.4 15.6

Table H. Continued.
Rearing andSpecies PIT Tag Group Release Date
NumberReleased
Mean ForkLength(mm)
StandardDeviationof Length
MeanWeight
(g)
StandardDeviationof Weight
106
Natural SteelheadPAK98131.NT1 5/11/98 29 181 24.0 0.0 0.0PAK98132.NT1 5/12/98 75 173 15.3 52.4 14.6PAK98133.NT1 5/13/98 82 171 13.9 50.8 12.9PAK98134.NT1 5/14/98 93 174 15.8 54.8 17.2PAK98135.NT1 5/15/98 78 170 16.3 51.0 15.3PAK98138.NT1 5/18/98 209 175 16.7 0.0 0.0PAK98139.NT1 5/19/98 199 171 15.5 50.7 16.5PAK98140.NT1 5/20/98 99 168 23.4 49.0 17.8PAK98140.NT2 5/21/98 81 170 18.7 50.2 18.3PAK98141.NT1 5/22/98 44 169 17.2 46.7 18.5PAK98142.NT2 5/22/98 80 171 16.5 52.2 15.9PAK98153.NT1 6/2/98 6 167 11.1 51.6 9.2PAK98154.NT1 6/3/98 4 172 23.0 56.7 16.4PAK98160.NT1 6/9/98 1 161 38.3PAK98162.NT2 6/11/98 1 219 99.6Total Number Released 3,106
Hatchery SteelheadPAK98111.NT1 4/21/98 1 281 203.9PAK98112.NT1 4/22/98 1 304 290.4PAK98112.NT2 4/22/98 3 246 14.0 132.0 24.4PAK98112.NT3 4/22/98 1 265 174.4PAK98113.NT1 4/23/98 2 260 10.6 178.3 10.8PAK98116.NT2 4/27/98 289 220 21.7 14.2 38.2PAK98117.NT1 4/28/98 387 221 33.6 30.6 55.2PAK98118.NT1 4/29/98 394 219 18.9 21.4 43.5PAK98119.NT1 4/30/98 379 219 19.2 22.6 44.3PAK98125.NT1 5/5/98 82 219 30.6 100.6 31.2PAK98126.NT1 5/6/98 32 223 20.1 0.0 0.0PAK98127.NT1 5/7/98 35 206 40.6 93.5 29.5PAK98128.NT1 5/8/98 25 219 18.9 105.2 28.6PAK98131.NT1 5/11/98 65 219 16.6 0.0 0.0

Table H. Continued.
Rearing andSpecies PIT Tag Group Release Date
NumberReleased
Mean ForkLength(mm)
StandardDeviationof Length
MeanWeight
(g)
StandardDeviationof Weight
107
Hatchery SteelheadPAK98132.NT1 5/12/98 145 221 18.5 14.5 35.6PAK98133.NT1 5/13/98 155 218 20.0 98.2 32.5PAK98134.NT1 5/14/98 161 221 19.4 98.7 35.1PAK98135.NT1 5/15/98 135 218 18.3 100.5 28.0PAK98138.NT1 5/18/98 201 221 21.4 0.0 0.0PAK98139.NT1 5/19/98 196 222 18.1 101.3 31.0PAK98140.NT1 5/20/98 531 211 19.7 33.1 47.1PAK98140.NT2 5/21/98 211 209 20.6 38.7 51.9PAK98141.NT1 5/22/98 132 209 18.8 55.2 47.6PAK98142.NT2 5/22/98 131 206 26.3 0.7 7.7PAK98153.NT1 6/2/98 14 224 20.0 115.9 34.9PAK98154.NT1 6/3/98 16 221 23.5 109.4 34.6PAK98156.NT1 6/5/98 12 224 16.8 108.8 26.4PAK98160.NT1 6/9/98 19 220 25.0 104.9 42.2PAK98161.NT1 6/10/98 34 224 24.1 109.4 39.5PAK98162.NT2 6/11/98 43 215 21.4 99.2 34.1PAK98163.NT1 6/12/98 4 245 9.9 151.0 25.3PAK98166.NT1 6/15/98 7 219 33.2 104.7 46.3PAK98167.NT1 6/16/98 16 225 20.3 105.5 32.8Total Number Released 3,859

108
Appendix I
Wilcoxon test values and sample sizes (n) for four statistical comparisons of median fork lengths ofnatural and hatchery chinook salmon and steelhead in the spring of 1998 and five statisticalcomparison of the median travel time of natural and hatchery chinook salmon and steelhead fromthe lower Imnaha River trap to Lower Granite Reservoir in 1998.

109
Table I. Wilcoxon test values and sample sizes (n) for four statistical comparisons of median fork lengths of natural and hatcherychinook salmon and steelhead in the spring of 1998 and five statistical comparison of the median travel time of natural and hatcherychinook salmon and steelhead from the lower Imnaha River trap to Lower Granite Reservoir in 1998. Abbreviations: L - Lower, U -Upper, N - Natural, H - Hatchery, CHS - Chinook, and STT - Steelhead.
Group One Group Two Statistical Values
Test Item Tim
e Pe
riod
Site
Rea
ring
Spec
ies
Sam
ple
Size
Med
ian
Tim
e Pe
riod
Site
Rea
ring
Spec
ies
Sam
ple
Size
Med
ian
P W
ForkLengths Spring L N CHS1 3,933 106 mm Spring L N CHS2 36 105 mm 0.30 63,675
ForkLengths Spring L H STT1 3,846 218 mm Spring L H STT2 44 226 mm 0.08 97,562
ForkLengths Spring L H CHS1 1,987 135 mm Spring L H CHS2 1,111 133 mm 0.00 1.18*106
ForkLengths Spring L N STT1 2,768 176 mm Spring L N STT2 74 157 mm 0.00 60,102
TravelTimes
4/12 to4/18 L N CHS 204 15.5 days 4/26 to
4/18 L H CHS 339 19.1days 0.00 6,009
TravelTimes
4/26 to5/2 L N STT 325 3.8 days 4/26 to
5/2 L H STT 839 5.6 days 0.0 188,827
1 PIT Tagged2 Non-PIT Tagged

Table I. Continued.
Group One Group Two Statistical Values
110
Test Item Tim
e Pe
riod
Site
Rea
ring
Spec
ies
Sam
ple
Size
Mea
n
Tim
e Pe
riod
Site
Rea
ring
Spec
ies
Sam
ple
Size
Mea
n
P W
TravelTimes
5/3 to5/9 L N STT 93 3.3 days
5/3 to5/9 L H STT 86 3.8 days 0.07 4,616
TravelTimes
5/10 to5/16 L N STT 188 4.4 days 5/10 to
5/16 L H STT 253 4.0 days 0.74 24,229
TravelTimes
5/17 to5/23 L N STT 236 3.3 5/17 to
5/23 L H STT 448 3.7 0.00 64,609

111
Appendix J
Daily trap efficiencies conducted from April 9 to April 17, 1998, for hatchery chinook salmonreleased on April 6 into the Imnaha River above the lower Imnaha Trap.

112
Table J. Daily trap efficiencies conducted from April 9 to April 17, 1998, for hatchery chinooksalmon released on April 6 into the Imnaha River above the lower Imnaha Trap.
TrialTrial
End DateDaily AverageDischarge (cfs)
NumberReleased
NumberRecaptured
Daily EfficiencyEstimate
1 4/08/98 609 300 84 .28
2 4/09/98 612 300 78 .26
3 4/10/98 665 303 73 .24
4 4/11/98 698 301 108 .36
5 4/12/98 679 302 85 .28
6 4/13/98 654 304 60 .20
7 4/14/98 636 305 102 .33
8 4/15/98 613 304 87 .29
9 4/16/98 598 264 109 .41
Totals and Average 2,683 786 29.4%

113
Appendix K
First observations of PIT tagged natural and hatchery chinook salmon and steelhead released at theImnaha Trap at the Snake and Columbia river dams in 1998.

114
Table K. First observations of PIT tagged natural and hatchery chinook salmon and steelhead released at the Imnaha Trap at the Snake and Columbia River Dams in 1998. Sites are abbreviatedas follows: Lower Granite Dam (LGR), Little Goose Dam (LGO), Lower Monumental Dam (LMO),and McNary Dam (MCN).
DateReleased
NumberReleased
Number of First Observations at Main Sites
LGR LGO LMO MCN Total
Natural Chinook Salmon2/27/98 14 5 3 0 0 83/10/98 6 3 0 0 1 43/12/98 4 0 1 1 0 23/13/98 9 5 1 0 0 63/16/98 230 88 34 25 20 1673/17/98 432 171 79 34 30 3143/18/98 413 155 85 39 26 3053/19/98 374 140 58 29 30 2573/20/98 168 68 28 12 12 1203/21/98 81 35 17 4 5 613/22/98 77 25 14 4 7 503/23/98 146 47 30 17 11 1053/26/98 16 3 7 1 0 113/27/98 41 17 10 0 4 313/30/98 157 65 32 14 7 1183/31/98 145 53 37 11 4 1054/1/98 128 68 23 2 5 984/2/98 121 50 26 9 3 884/3/98 60 23 16 4 1 444/6/98 95 39 29 3 2 734/7/98 39 18 14 0 0 324/8/98 48 26 9 3 0 384/9/98 22 11 7 0 1 19
4/10/98 2 1 0 0 0 14/11/98 12 5 4 1 0 104/12/98 33 11 12 0 0 234/13/98 71 34 17 5 3 594/14/98 101 35 24 13 1 73

Table K. Continued.
DateReleased
NumberReleased
Number of First Observations at Main Sites
LGR LGO LMO MCN Total
115
Natural Chinook Salmon4/15/98 109 51 30 8 1 904/16/98 90 48 22 4 1 754/17/98 53 25 17 4 0 464/20/98 94 45 29 8 1 834/21/98 107 50 23 7 2 824/22/98 189 100 39 9 5 1534/23/98 101 49 29 7 2 874/27/98 4 1 2 0 0 34/28/98 21 11 6 1 0 184/29/98 18 8 2 0 0 104/30/98 12 4 2 1 0 75/1/98 15 8 4 1 0 135/5/98 1 0 1 0 0 15/6/98 1 1 0 0 0 1
5/13/98 18 8 5 1 0 145/14/98 20 8 3 1 0 125/15/98 13 3 2 0 0 55/18/98 17 4 1 3 0 85/19/98 18 4 2 2 2 105/20/98 6 0 1 1 0 26/2/98 1 1 0 0 0 16/4/98 1 0 0 0 0 0
6/15/98 2 0 0 0 0 0Total 3,956 1,630 837 289 187 2,943
Hatchery Chinook Salmon4/8/98 383 144 73 28 10 2554/9/98 624 215 117 51 13 396
4/13/98 811 289 161 47 21 5184/14/98 176 51 39 17 8 115

Table K. Continued.
DateReleased
NumberReleased
Number of First Observations at Main Sites
LGR LGO LMO MCN Total
116
Hatchery Chinook salmon4/20/98 1 0 1 0 0 14/21/98 1 0 0 0 0 04/22/98 3 1 0 0 0 14/23/98 1 0 0 0 1 1
Total 2,000 700 391 143 53 1,287
Natural Steelhead3/16/98 1 1 0 0 0 13/17/98 2 8 0 1 1 103/18/98 16 12 4 1 0 173/26/98 23 11 3 3 1 183/27/98 25 2 0 0 0 23/30/98 13 35 10 7 1 533/31/98 62 26 2 2 3 334/1/98 48 25 2 5 3 354/2/98 52 31 6 2 2 414/3/98 59 6 4 1 1 124/6/98 16 8 4 0 0 124/7/98 19 6 0 2 0 84/8/98 6 9 3 0 1 134/9/98 39 12 1 1 0 14
4/10/98 1 3 0 0 1 44/11/98 4 7 1 1 1 104/12/98 14 6 2 0 0 84/13/98 26 12 1 2 0 154/14/98 9 27 8 2 2 394/15/98 51 13 4 2 0 194/16/98 30 24 8 2 1 354/17/98 43 9 6 1 1 174/20/98 21 33 14 4 0 51

Table K. Continued.
DateReleased
NumberReleased
Number of First Observations at Main Sites
LGR LGO LMO MCN Total
117
Natural Steelhead4/21/98 76 41 11 10 2 644/22/98 308 152 58 17 4 2314/23/98 102 116 32 20 5 1734/27/98 228 29 6 5 1 414/28/98 55 43 11 5 1 604/29/98 80 68 18 11 1 984/30/98 125 92 23 14 3 1325/1/98 158 93 19 8 2 1225/5/98 149 27 11 8 1 475/6/98 53 20 7 5 0 325/7/98 36 25 7 3 0 355/8/98 41 21 6 3 0 30
5/11/98 34 18 8 1 0 275/12/98 29 42 15 4 0 615/13/98 75 43 10 2 1 565/14/98 82 39 11 4 2 565/15/98 93 46 5 6 0 575/18/98 78 82 34 7 4 1275/19/98 209 71 28 12 4 1155/20/98 199 32 15 5 1 535/21/98 99 18 16 14 0 485/22/98 125 33 47 8 2 906/2/98 80 2 0 1 0 36/3/98 6 0 1 1 0 26/9/98 4 0 0 0 0 0
6/11/98 1 0 0 0 0 0Total 3,105 1,479 482 213 53 2,227
Hatchery Steelhead4/21/98 1 0 0 0 0 0

Table K. Continued.
DateReleased
NumberReleased
Number of First Observations at Main Sites
LGR LGO LMO MCN Total
118
Hatchery Steelhead4/22/98 5 2 0 1 0 34/23/98 2 1 0 0 0 14/27/98 289 166 40 9 1 2164/28/98 387 216 48 33 0 2974/29/98 394 241 48 23 1 3134/30/98 379 216 46 22 2 2865/5/98 82 41 9 3 0 535/6/98 32 15 3 2 0 205/7/98 35 16 7 5 0 285/8/98 25 14 3 4 0 21
5/11/98 65 29 11 6 0 465/12/98 145 76 18 9 2 1055/13/98 155 56 23 8 0 875/14/98 161 52 11 5 2 705/15/98 135 40 20 8 0 685/18/98 201 71 20 10 1 1025/19/98 196 67 17 18 1 1035/20/98 531 163 103 43 11 3205/21/98 211 67 39 14 1 1215/22/98 263 80 64 23 3 1706/2/98 14 6 0 0 0 66/3/98 16 3 2 1 2 86/5/98 12 5 4 1 1 116/9/98 19 4 4 2 1 11
6/10/98 34 17 3 1 0 216/11/98 43 12 4 2 1 196/12/98 4 0 1 0 1 26/15/98 7 4 2 1 0 76/16/98 16 2 5 0 0 7
Total 3,859 1,682 555 254 31 2,522

119
Appendix L
Cumulative interrogations of spring PIT tagged Imnaha River natural and hatchery chinook salmonand steelhead smolts at Lower Granite, Little Goose, Lower Monumental and McNary (MCN) damsfrom 1993 to 1998 and SURPH survival estimates to MCN.

120
Table L. Cumulative interrogations of spring PIT tagged Imnaha River natural and hatcherychinook salmon and steelhead smolts at Lower Granite, Little Goose, Lower Monumental andMcNary Dams from 1993 to 1998 and survival estimates to MCN.
Species Migration YearNumberReleased
CumulativeInterrogations
CumulativeInterrogations (%)
Survival EstimateTo MCN (%)
Natural Chinook salmon1998 3,956 2,943 74.4 78.3 (±13.7 )1997 238 160 67.21996 1,311 819 62.51995 421 330 78.41994 956 595 62.21993 249 160 64.3
Hatchery Chinook salmon1998 2,000 1,283 64.2 57.9 (±18.6 )1997 1,000 538 53.81996 698 335 48.01995a 445 262 58.91995b 302 171 56.61994 662 299 45.21992c 928 450 48.5
Natural Steelhead1998 3,106 2,222 71.5 56.5 (±17.1 )1997 782 588 75.21996 1,503 1,065 70.91995 227 173 76.21994d 846 443 52.41994 604 292 48.31993 183 131 71.6
Hatchery Steelhead1998 3,859 2,522 65.4 60.5 (±20.4 )1997 6,117 3,794 62.01996 1,346 671 49.91995 1,289 897 69.61994d 1,076 216 20.11994 1,237 479 38.71993 526 279 53.0
a HXW crossed chinook salmon smolts PIT tagged for the Nez Perce Tribe and released at dark.bHXH crossed chinook salmon smolts PIT tagged for the FPC and released one hour after tagging and recovery.cLower Monumental Dam was not an interrogation site.d NPT PIT tagged fish.e FPC PIT tagged fish.

121
Appendix M
Daily arrival timing frequencies of PIT tagged Imnaha River fish to Lower Granite, Little Goose,Lower Monumental, and McNary dams during the 1998 spring migration.
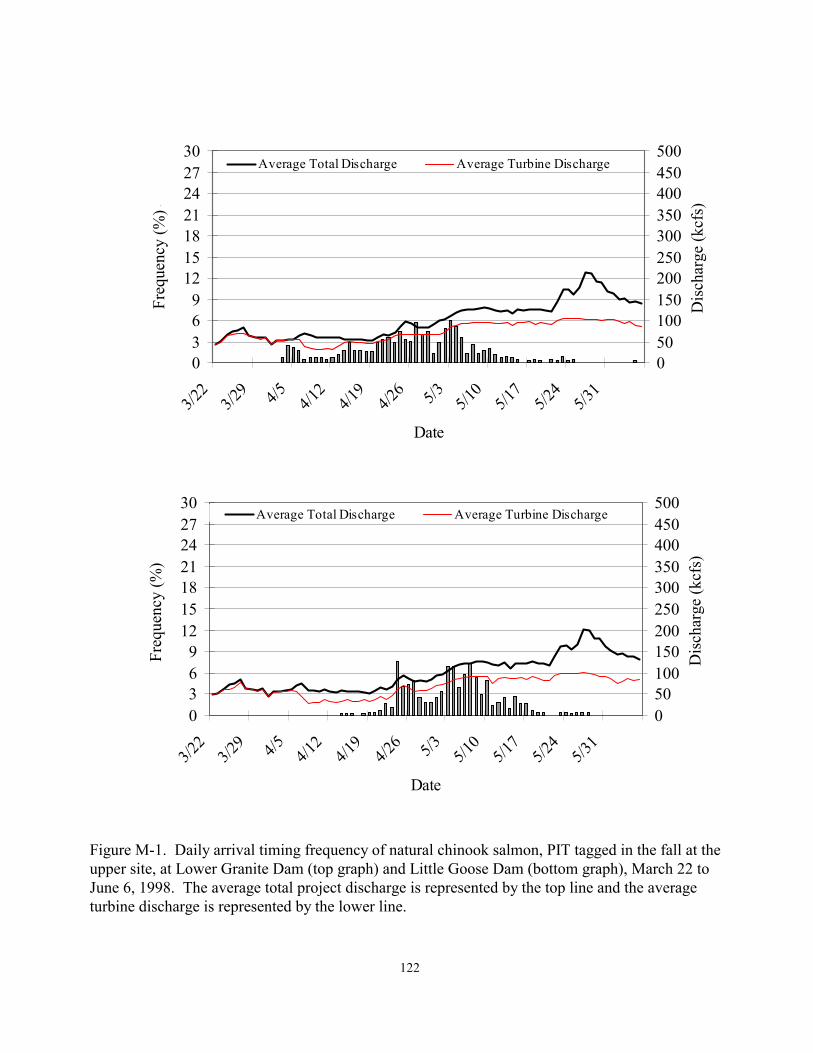
122
0369
12151821242730
3/22
3/29 4/5 4/1
24/1
94/2
6 5/3 5/10
5/17
5/24
5/31
Date
Freq
uenc
y (%
) -
050100150200250300350400450500
Dis
char
ge (k
cfs)
Average Total Discharge Average Turbine Discharge
0369
12151821242730
3/22
3/29 4/5 4/1
24/1
94/2
6 5/3 5/10
5/17
5/24
5/31
Date
Freq
uenc
y (%
) -
050100150200250300350400450500
Dis
char
ge (k
cfs)
Average Total Discharge Average Turbine Discharge
Figure M-1. Daily arrival timing frequency of natural chinook salmon, PIT tagged in the fall at theupper site, at Lower Granite Dam (top graph) and Little Goose Dam (bottom graph), March 22 toJune 6, 1998. The average total project discharge is represented by the top line and the averageturbine discharge is represented by the lower line.

123
0369
12151821242730
3/22
3/29 4/5 4/1
24/1
94/2
6 5/3 5/10
5/17
5/24
5/31
Date
Freq
uenc
y (%
) -
050100150200250300350400450500
Dis
char
ge (k
cfs)
Average Total Discharge Average Turbine Discharge
0369
12151821242730
3/22
3/29 4/5 4/1
24/1
94/2
6 5/3 5/10
5/17
5/24
5/31
Date
Freq
uenc
y (%
) -
050100150200250300350400450500
Dis
char
ge (k
cfs)
Average Total Discharge Average Turbine Discharge
Appendix M. Continued.
Figure M-2. Daily arrival timing frequency of natural chinook salmon, PIT tagged in the fall at theupper site, at Lower Monumental Dam (top graph) and McNary Dam (bottom graph), March 22 toJune 6, 1998. The average total project discharge is represented by the top line and the averageturbine discharge is represented by the lower line.

124
0369
12151821242730
3/22
3/29 4/5 4/1
24/1
94/2
6 5/3 5/10
5/17
5/24
5/31
Date
Freq
uenc
y (%
) -
050100150200250300350400450500
Dis
char
ge (k
cfs)
Average Total Discharge Average Turbine Discharge
0369
12151821242730
3/22
3/29 4/5 4/1
24/1
94/2
6 5/3 5/10
5/17
5/24
5/31
Date
Freq
uenc
y (%
) -
050100150200250300350400450500
Dis
char
ge (k
cfs)
Average Total Discharge Average Turbine Discharge
Appendix M. Continued.
Figure M-3. Daily arrival timing frequency of natural chinook salmon, PIT tagged in the fall at thelower site, at Lower Granite Dam (top graph) and Little Goose Dam (bottom graph), March 22 toJune 6, 1998. The average total project discharge is represented by the top line and the averageturbine discharge is represented by the lower line.

125
0369
12151821242730
3/22
3/29 4/5 4/1
24/1
94/2
6 5/3 5/10
5/17
5/24
5/31
Date
Freq
uenc
y (%
) -
050100150200250300350400450500
Dis
char
ge (k
cfs)
Average Total Discharge Average Turbine Discharge
0369
12151821242730
3/22
3/29 4/5 4/1
24/1
94/2
6 5/3 5/10
5/17
5/24
5/31
Date
Freq
uenc
y (%
) -
050100150200250300350400450500
Dis
char
ge (k
cfs)
Average Total Discharge Average Turbine Discharge
Appendix M. Continued.
Figure M-4. Daily arrival timing frequency of natural chinook salmon, PIT tagged in the fall at thelower site, at Lower Monumental Dam (top graph) and McNary Dam (bottom graph), March 22 toJune 6, 1998. The average total project discharge is represented by the top line and the averageturbine discharge is represented by the lower line.

126
0.03.06.09.0
12.015.018.021.024.027.030.0
3/29 4/5 4/1
24/1
94/2
6 5/3 5/10
5/17
5/24
5/31 6/7 6/1
46/2
16/2
8
Date
Freq
uenc
y (%
) -
050100150200250300350400450500
Dis
char
ge (k
cfs)
Average Total Discharge Average Turbine Discharge
0.03.06.09.0
12.015.018.021.024.027.030.0
3/29 4/5 4/1
24/1
94/2
6 5/3 5/10
5/17
5/24
5/31 6/7 6/1
46/2
16/2
8
Date
Freq
uenc
y (%
) -
050100150200250300350400450500
Dis
char
ge (k
cfs)
Average Total Discharge Average Turbine Discharge
Appendix M. Continued.
Figure M-5. Daily arrival timing frequency of natural chinook salmon, PIT tagged in the spring atthe lower site, at Lower Granite Dam (top graph) and Little Goose Dam (bottom graph), March 29to July 4, 1998. The average total project discharge is represented by the top line and the averageturbine discharge is represented by the lower line.

127
0.03.06.09.0
12.015.018.021.024.027.030.0
3/29 4/5 4/1
24/1
94/2
6 5/3 5/10
5/17
5/24
5/31 6/7 6/1
46/2
16/2
8
Date
Freq
uenc
y (%
) -
050100150200250300350400450500
Dis
char
ge (k
cfs)
Average Total Discharge Average Turbine Discharge
0.03.06.09.0
12.015.018.021.024.027.030.0
3/29 4/5 4/1
24/1
94/2
6 5/3 5/10
5/17
5/24
5/31 6/7 6/1
46/2
16/2
8
Date
Freq
uenc
y (%
) -
050100150200250300350400450500
Dis
char
ge (k
cfs)
Average Total Discharge Average Turbine Discharge
Appendix M. Continued.
Figure M-6. Daily arrival timing frequency of natural chinook salmon, PIT tagged in the spring atthe lower site, at Lower Monumental Dam (top graph) and McNary Dam (bottom graph), March 29to July 4, 1998. The average total project discharge is represented by the top line and the averageturbine discharge is represented by the lower line.

128
0369
12151821242730
4/12
4/19
4/26 5/3 5/1
05/1
75/2
45/3
1 6/7 6/14
6/21
6/28
Date
Freq
uenc
y (%
) -
050100150200250300350400450500
Dis
char
ge (k
cfs)
Average Total Discharge Average Turbine Discharge
0369
12151821242730
4/12
4/19
4/26 5/3 5/1
05/1
75/2
45/3
1 6/7 6/14
6/21
6/28
Date
Freq
uenc
y (%
) -
050100150200250300350400450500
Dis
char
ge (k
cfs)
Average Total Discharge Average Turbine Discharge
Appendix M. Continued.
Figure M-7. Daily arrival timing frequency of hatchery chinook salmon, PIT tagged in the spring atthe lower site, at Lower Granite Dam (top graph) and Little Goose Dam (bottom graph), April 12 toJuly 4, 1998. The average total project discharge is represented by the top line and the averageturbine discharge is represented by the lower line.
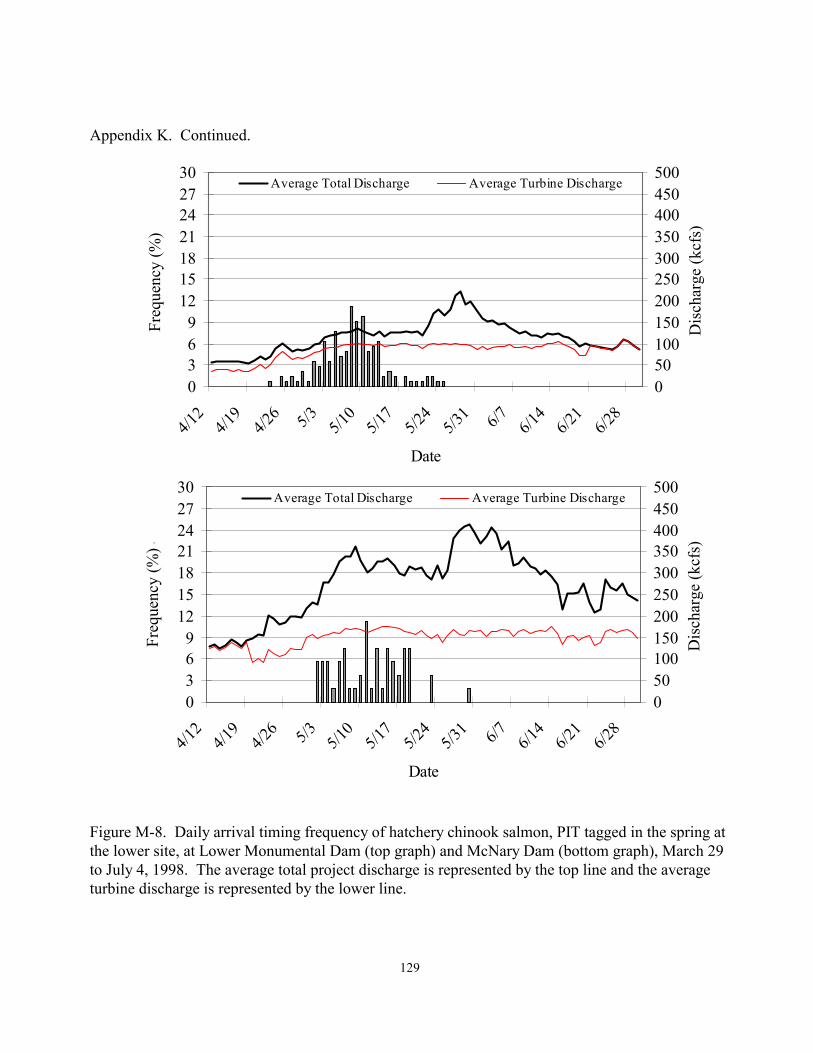
129
0369
12151821242730
4/12
4/19
4/26 5/3 5/1
05/1
75/2
45/3
1 6/7 6/14
6/21
6/28
Date
Freq
uenc
y (%
) -
050100150200250300350400450500
Dis
char
ge (k
cfs)
Average Total Discharge Average Turbine Discharge
0369
12151821242730
4/12
4/19
4/26 5/3 5/1
05/1
75/2
45/3
1 6/7 6/14
6/21
6/28
Date
Freq
uenc
y (%
) -
050100150200250300350400450500
Dis
char
ge (k
cfs)
Average Total Discharge Average Turbine Discharge
Appendix K. Continued.
Figure M-8. Daily arrival timing frequency of hatchery chinook salmon, PIT tagged in the spring atthe lower site, at Lower Monumental Dam (top graph) and McNary Dam (bottom graph), March 29to July 4, 1998. The average total project discharge is represented by the top line and the averageturbine discharge is represented by the lower line.

130
0369
12151821242730
3/29 4/5 4/1
24/1
94/2
6 5/3 5/10
5/17
5/24
5/31 6/7 6/1
46/2
16/2
8
Date
Freq
uenc
y (%
) -
050100150200250300350400450500
Dis
char
ge (k
cfs)
Average Total Discharge Average Turbine Discharge
0369
12151821242730
3/29 4/5 4/1
24/1
94/2
6 5/3 5/10
5/17
5/24
5/31 6/7 6/1
46/2
16/2
8
Date
Freq
uenc
y (%
) -
050100150200250300350400450500
Dis
char
ge (k
cfs)
Average Total Discharge Average Turbine Discharge
Appendix M. Continued.
Figure M-9. Daily arrival timing frequency of natural steelhead, PIT tagged in the spring at thelower site, at Lower Granite Dam (top graph) and Little Goose Dam (bottom graph), March 29 toJuly 4, 1998. The average total project discharge is represented by the top line and the averageturbine discharge is represented by the lower line.

131
0369
12151821242730
3/29 4/5 4/1
24/1
94/2
6 5/3 5/10
5/17
5/24
5/31 6/7 6/1
46/2
16/2
8
Date
Freq
uenc
y (%
) -
050100150200250300350400450500
Dis
char
ge (k
cfs)
-
Average Total Discharge Average Turbine Discharge
0369
12151821242730
3/29 4/5 4/1
24/1
94/2
6 5/3 5/10
5/17
5/24
5/31 6/7 6/1
46/2
16/2
8
Date
Freq
uenc
y (%
) -
050100150200250300350400450500
Dis
char
ge (k
cfs)
Average Total Discharge Average Turbine Discharge
Appendix M. Continued.
Figure M-10. Daily arrival timing frequency of natural steelhead, PIT tagged in the spring at thelower site, at Lower Monumental Dam (top graph) and McNary Dam (bottom graph), March 29 toJuly 4, 1998. The average total project discharge is represented by the top line and the averageturbine discharge is represented by the lower line.
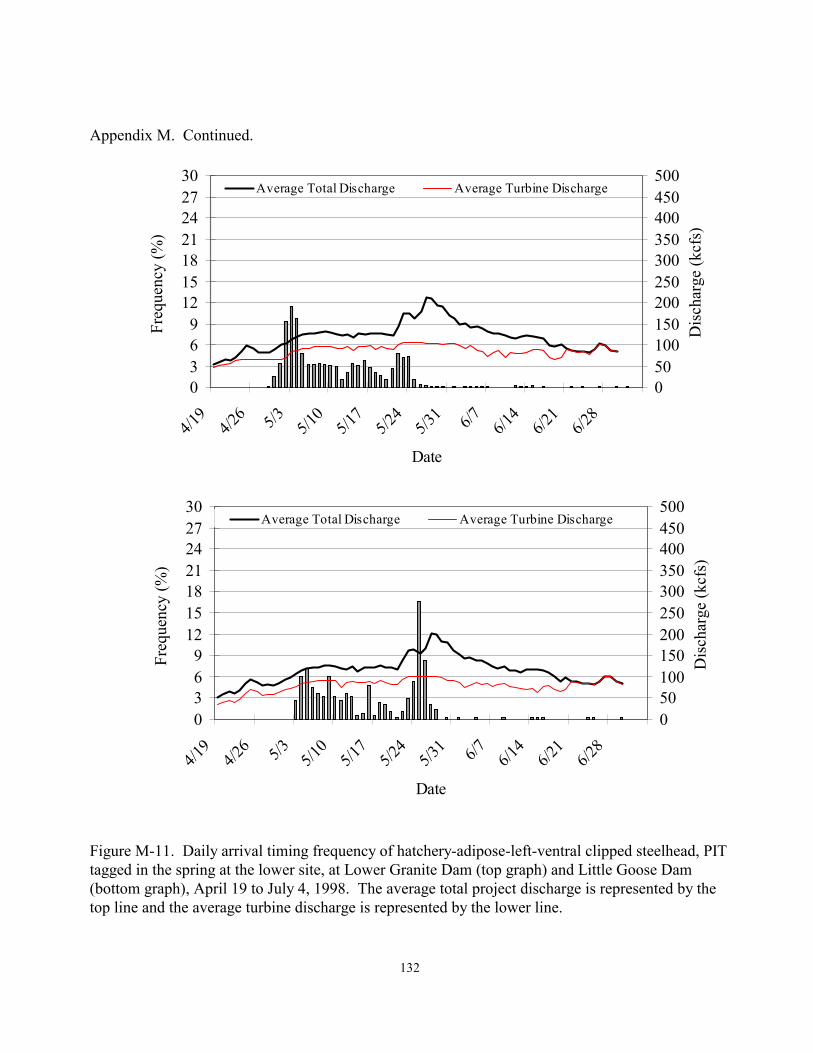
132
0369
12151821242730
4/19
4/26 5/3 5/1
05/1
75/2
45/3
1 6/7 6/14
6/21
6/28
Date
Freq
uenc
y (%
) -
050100150200250300350400450500
Dis
char
ge (k
cfs)
Average Total Discharge Average Turbine Discharge
0369
12151821242730
4/19
4/26 5/3 5/1
05/1
75/2
45/3
1 6/7 6/14
6/21
6/28
Date
Freq
uenc
y (%
) -
050100150200250300350400450500
Dis
char
ge (k
cfs)
Average Total Discharge Average Turbine Discharge
Appendix M. Continued.
Figure M-11. Daily arrival timing frequency of hatchery-adipose-left-ventral clipped steelhead, PITtagged in the spring at the lower site, at Lower Granite Dam (top graph) and Little Goose Dam(bottom graph), April 19 to July 4, 1998. The average total project discharge is represented by thetop line and the average turbine discharge is represented by the lower line.

133
0369
12151821242730
4/19
4/26 5/3 5/1
05/1
75/2
45/3
1 6/7 6/14
6/21
6/28
Date
Freq
uenc
y (%
) -
050100150200250300350400450500
Dis
char
ge (k
cfs)
Average Total Discharge Average Turbine Discharge
0369
12151821242730
4/19
4/26 5/3 5/1
05/1
75/2
45/3
1 6/7 6/14
6/21
6/28
Date
Freq
uenc
y (%
) -
050100150200250300350400450500
Dis
char
ge (k
cfs)
Average Total Discharge Average Turbine Discharge
Appendix M Continued.
Figure M-12. Daily arrival timing frequency of hatchery-adipose-left-ventral clipped steelhead, PITtagged in the spring at the lower site, at Lower Monumental (top graph) and McNary Dam (bottomgraph), April 19 to July 4, 1998. The average total project discharge is represented by the top lineand the average turbine discharge is represented by the lower line.

134
0369
12151821242730
4/19
4/26 5/3 5/1
05/1
75/2
45/3
1 6/7 6/14
6/21
6/28
Date
Freq
uenc
y (%
) -
050100150200250300350400450500
Dis
char
ge (k
cfs)
Average Total Discharge Average Turbine Discharge
0369
12151821242730
4/19
4/26 5/3 5/1
05/1
75/2
45/3
1 6/7 6/14
6/21
6/28
Date
Freq
uenc
y (%
) -
050100150200250300350400450500
Dis
char
ge (k
cfs)
Average Total Discharge Average Turbine Discharge
Appendix M. Continued.
Figure M-13. Daily arrival timing frequency of hatchery-adipose clipped steelhead, PIT tagged inthe spring at the lower site, at Lower Granite Dam (top graph) and Little Goose Dam (bottomgraph), April 19 to July 4, 1998. The average total project discharge is represented by the top lineand the average turbine discharge is represented by the lower line.

135
0369
12151821242730
4/19
4/26 5/3 5/1
05/1
75/2
45/3
1 6/7 6/14
6/21
6/28
Date
Freq
uenc
y (%
) -
050100150200250300350400450500
Dis
char
ge (k
cfs)
Average Total Discharge Average Turbine Discharge
0369
12151821242730
4/19
4/26 5/3 5/1
05/1
75/2
45/3
1 6/7 6/14
6/21
6/28
Date
Freq
uenc
y (%
) -
050100150200250300350400450500
Dis
char
ge (k
cfs)
Average Total Discharge Average Turbine Discharge
Appendix M. Continued.
Figure M-14. Daily arrival timing frequency of hatchery-adipose clipped steelhead, PIT tagged inthe spring at the lower site, at Lower Monumental (top graph) and McNary Dam (bottom graph),April 19 to July 4, 1998. The average total project discharge is represented by the top line and theaverage turbine discharge is represented by the lower line.