Embed Size (px)
Citation preview

ARM 16-Doc 04/14
Federal democratic republic of Ethiopia ministry of health
Special bulletin 16th Annual Review Meeting 2014
Oct 2014

Editor in Chief
Noah Elias
Director of Policy and Planning (PPD) Federal Ministry of Health (FMOH)
Co-coordinator of the Editorial
Mentesnot Kebede
HIS/M&E Regional coordinator (TA)
Editorial Board office
Noah Elias
Director of Policy and Planning Directorate
Mesoud Mohammed
Assistant Director for PPD
Habtamu Tesfaye
Monitoring and Evaluation Senior Officer
Hailu Dawo
Monitoring and Evaluation Senior Officer
Mohammed Ormango
Monitoring and Evaluation Officer
Mentesnot Kebede
HIS/M&E Regional coordinator (TA)
Ewnetu Getachew
Private HMIS coordinator (TA)
Dr. Alemayehu Belayneh
Technical Advisor for Director of Policy and
Planning Directorate(TA)
Table of Contents Acronym .................................................................................................................................................. i
Forward ................................................................................................................................................... ii
SECTION ONE PROGRESS UPDATE ............................................................................................................................ 1
1. EFY 2003-2006 Growth and Transformation Plan Progress update (GTP) .................................... 2
2. Blood Transfusion Service in Ethiopia – from establishment up to date ........................................ 5 SECTION TWO
BEST PRACTICE ................................................................................................................................... 8
Best Practices and achievements of Health Extension Program of selected woredas ............................. 9 1. Increase the skilled birth attendance coverage .............................................................................. 9
2. Home Delivery Free ................................................................................................................... 12
3. Open defecation free .................................................................................................................. 13
4. Improve Community Based Nutrition ......................................................................................... 14 SECTION THREE
INITIATIVES (FLAGSHIP, SUMMARY OF STRATEGIES AND GUIDELINES) ............................. 16
2014/15 Flagship Initiatives of FMOH Directorates ........................................................................... 17 New initiatives .................................................................................................................................. 20
1. National Strategic Action Plan (NSAP) for Prevention and Control of Non-communicable
Diseases in Ethiopia 2014-2015/16 ................................................................................................ 20
2. HMIS scale up at Private health institution ............................................................................. 23 3. National Malaria Strategic Plan, 2014 – 2020 (2007 – 2013 E.C.) ........................................... 26
4. National Licensing Exam ....................................................................................................... 30
5. Tobacco Free and Physically Active FMOH Premises ............................................................ 32 6. Gender training manual .......................................................................................................... 34
SECTION FOUR
ARTICLES (SUMMARY OF EVALUTIONS, OPERATIONAL RESEARCHES AND RESARCHES) ........................................................................ 37
1. Accelerated Plan for Scaling Up Prevention of Mother-to-Child Transmission Services in
Ethiopia, RAPID ASSESSMENT ..................................................................................................... 38
2. Second Round National First Line Anti Tuberculosis Drug Resistance Surveillance in Ethiopia. 41 3. The Social Perceptions Inhibiting the Utilization of Skilled Birth Care among Mothers in Amhara,
Ethiopia: the Social Mountains claiming Maternal Lives .................................................................... 43
4. The Intra-uterine Contraceptive Device (IUCD) revitalization initiative Midterm Evaluation ...... 44 5. Routine Data Quality Assessment (RDQA) 2014 ....................................................................... 48
6. Quality of Medicines in the Ethiopian Pharmaceutical Market .................................................... 56
ANNEX 1 ............................................................................................................................................. 59 1. Summary of 2006 EFY Basic Health Indicators: Selected HSDP IV Indicators and Health Related
MDG indicators ................................................................................................................................. 59
1.1. Summary of 2006 EFY Basic Health Indicators .................................................................. 59
1.2. Selected HSDP IV Indicators: Baseline, Targets and Achievements (EFY,2006)............... 61 1.3. Selected HSDP IV Indicators: Baseline, Targets and Achievements (EFY 2006)................ 62
1.4. Health Related MDG Indicators: MDG Targets and Achievements (EFY 2006) .................. 63
i
Acronym AIDS Acquired Immunodeficiency Syndrome
ANC Antenatal Care
ARM Annual review meeting
ART Antiretroval Therapy
BEmoNC Basic Emergency Obstetric and Neonatal Care
CEmONC Comprehensive Emergency Obstetric and Neonatal Care
CHD child health day
EDHS Ethiopian Demographic and Health Survey
EFMHACA Ethiopian Food Medicine and Healthcare Administration and Control Authority
GTP Growth and Transformation Plan
HAD Health Development Army
HDF home delivery free
HEP Health Extension Program
HEW Health Extension Worker
HC Health center
HIV Human Immunodeficiency Virus
HP Health Post
HRH Human Resource for Health
HSDP Health Sector Development Plan
IUCD Intra-uterine Contraceptive Device
MDG Millennium Development Goals
MDR multi drug resistance
MMR Maternal Mortality Ratio
MCH Maternal and Child Health
ODF Open Defecation Free
PMTCT Prevention of Maternal to Child Transmission
PHCU Primary Health Care Units
RHB Regional Health Bureau
SBA Skilled Birth Attendance
TB Tuberculosis
TBAs traditional birth attendants
WHO World Health Organization
WrHO Woreda Health Office
ii
Forward
The health system has multiple sources of health information/data that include
routine facility reporting systems, health facility assessments (both facility
censuses and surveys), and other special studies with their own specific strengths
and limitations. No single method provides all the information required assessing
service delivery, and multiple methods are needed to understand it
comprehensively. The Policy Planning Directorate of Federal Ministry of Health
is bringing out a regular publication entitled ‗Special Annual Review Meeting
Bulletin‘ for the third time and disseminate to inform participants of 16th
ARM on
major progress update, best practices, new initiatives and articles on key program
areas.
The data included in this bulletin is based on the information provided by routine
HMIS, population based surveys and different model estimates. The current
bulletin is an attempt to compile the latest available information up to end of the
fourth quarter of 2006 EC. An effort has been made to incorporate all the available
information and present it in a systematic and reader friendly manner in this
bulletin. I hope the bulletin will benefit all those who are involved in the field of
policy, administration; planning, management & research of health services.
I take this opportunity to put on record my appreciations for the officers and staff
of PPD for their extra ordinary effort in editing this bulletin and bringing it to this
shape.
Suggestions for improvement of this bulletin shall be highly appreciated.
Enjoy reading
Noah Elias (Bsc,MPH) Director of Policy and Planning Directorate

1
SECTION ONE
PROGRESS UPDATE

2
1. EFY 2003-2006 Growth and Transformation Plan Progress
update (GTP)
Mr. Noah Elias1, Dr. Alemayehu Belayneh
2, Mr. Hailu Dawo
3, Mr. Habtamu Tesfaye
4 and Mr
Mentesnot kebede5
1. Policy Plan Director, FMOH, [email protected].
2. Health Information System Advisor, FMOH, [email protected].
3. Monitoring and Evaluation Senior Officer, FMOH, [email protected], 4. Monitoring and Evaluation Senior Officer, Policy Plan Directorate, FMOH, [email protected].
5. HIS/M&E coordinator ,FMOH [email protected]
Introduction: Ethiopia, through its health extension program led by women centered health
development army has taken commendable efforts and achieved remarkable progress in recent
years with regards to improving maternal health, reducing child mortality, prevention and control
of HIV/AIDS, tuberculosis and malaria, and in expansion and construction of health facilities,
and training and deployment of health workforce. Major progress made towards GTP-MDG is
summarized below.
Universal Primary health care coverage: Expansion of HCs plays a pivotal role for the
achievement of universal PHC coverage. Cumulative number of functional health centers
reached 3,335 by the end of 2006 EFY from 2,142 in 2002 EFY. BY the end of 2006 EFY
Potential health service coverage reached 100%. Accordingly Health center population ratio has
shown significant decrease from 1: 37,299 in 2002 EFY to 1:26,390 by the end of 2006 EFY.
Improve Maternal Health:
Good maternal health depends on access to quality and effective, family planning service,
antenatal care, skilled delivery by health personnel and Post natal care. Accordingly, the Federal
Ministry of Health (FMOH) has applied a multi-pronged approach to reduce maternal and
newborn morbidity and mortality by improving access to and strengthening facility-based
maternal and newborn services.
Contraceptive Prevalence Rate has shown Remarkable Progress
Contraceptive prevalence among currently married women increased to 42% in 2014 from that
of 15% in EFY 2002 EFY.( GTP target,66%) . The observed sharp improvements of CPR led to
a reduction in unmet needs for family planning from 25.3% (DHS, 2011).
Similarly, Contraceptive Acceptance Rate (CAR) has increased to 63 in EFY 2006 from 56% in
2002.( GTP target,82%).
Antenatal Care –first visit coverage reached 98% in EFY 2006 from 68 % in EFY 2002. (90%
GTP target achieved). The proportion of deliveries assisted by skilled health professionals and
Postnatal care coverage reached 41% and 66% respectively in EFY 2006 from 15.7% and 34%
respectively in EFY 2002. (GTP target 62% for skilled delivery and).

3
Proportion of HIV positive mothers who provided with PMTCT prophylaxis reached 61% in
2014 from 14% in 2010.( GTP target is to reach 77%).
Maternal Mortality Ratio: As per EDHS-2011, maternal mortality ratio (MMR) was estimated at
676 deaths per 100,000 LBs. Though the progress of reducing MMR is too slow, there has been
improvement over the years between 1990 and 2014. According to the latest estimate of
WHO,UNICEF,UNFPA and the world bank maternal mortality ratio has declined to 420/100,000
live births in 2013 from that of 1400 in 1990, showing a 70 percent reduction.
Reduce child mortality
MDG goal 4 aims to reduce mortality among children under age 5 by two-thirds between 1990
and 2015. Results from EDHS 2011 showed a decline in Under-5 Mortality Rate (U5MR) from
166 to 88 per 1,000 live births. However, according to 2013 UN estimate Ethiopia has achieved
its under-five mortality rate which is 68/1000 live births three years ahead of 2015. Similarly
marked decline was recorded in Infant Mortality Rate (IMR) that decreased from 97 deaths per
1,000 live births in the 2000 EDHS to 59 in the 2011 EDHS. Even though Neonatal Mortality
Rate (NMR) decreased from 49 deaths per 1,000 live births in 2000 EDHS to 39 deaths per
1,000 live births in 2005 EDHS, it has remained stable at 37 deaths per 1,000 in 2011 EDHS.
Encouraging results have been recorded with regards to child immunization, in 2006,
Pentavalent -3 and Measles Immunization coverage reached 91% and 87% respectively from
82% and 76.5% baseline in 2002 EFY. The GTP target for DPT-3/Penta -3 is 96% and
90% for measles)
There has been notable improvement with regards to nutritional status of under five children.
According to Mini DHS2014, Stunting, wasting and underweight decreased to 40%,9% and 29%
respectively. decreased to 40%, wasting decreased to 9% similarly underweight reached 29%.
Ethiopia has halted the spread of HIV/AIDS, tuberculosis and malaria
Ethiopian has demonstrated encouraging results in HIV prevention, treatment, care, and Support
services. According to EHNRI 2012 projection estimate the adult prevalence further declined to
1.2 (GTP target: maintain at 2.4). Similarly HIV incidence has also declined to 0.03 ( GTP
target: 0.5%). DHS 2011 showed that 47.0% of women and 15.5% of men between 15-49 years
who had more than one sexual partner during the 12 months preceding the survey reported using
a condom during their last intercourse.
An encouraging increase was observed in the number of People Living With HIV/AIDS
(PLHIV) ever enrolled, ever started and currently on ART over the past years; The total number
of clients ever enrolled, ever stated and currently on ART has increased to 805,948 492,649 and
344,344 in 2006 EFY from 473,772,268,934 and 207,733 in 2002 EFY respectively.

4
Coverage of eligible client who are currently taking ART has reached 79% in EFY2006 from
53% in 2002 EFY, (GTP target: 95%).
Ethiopia has surpassed the MDG target of 70% as per the 2011 TB prevalence survey. To further
improve case detection rate, monitoring of the implementation of TB program with all forms was
undertaken using routine information system. Accordingly the Tuberculosis Case Detection rate
showed increasing pattern from the base line of 36% and reached 58% in 2005 and decreased to
54% in EFY 2006. The fluctuation in Tuberculosis case detection rate (CDR) performance
shows the need to strength community screening and avail diagnostic equipments to identify
sputum negative cases. Treatment success rate reached 92% in EFY 2006 from the baseline of
84% in 2002.(GTP target of 90% achieved).
The distribution of LLINs has shown encouraging increment and reached 58.4 million in 2006
from that of 22.2 million baseline of GTP. Routine information system shows the reduction in
epidemic occurrence of malaria cases, morbidity and mortality due to malaria..
Conclusion
Despite encouraging gains made in reduction of less than five mortality, primary health care
coverage, nutritional status of children and prevention and control of major communicable
diseases, however, the challenge of communicable diseases is not yet finished. Therefore, to
Sustain and further strengthen the achievements gained in past four years and to accomplish the
remaining target of the GTP-MDG we need to accelerate our concerted efforts in the year 2007
to accomplish our tasks and lay ground for the next GTP.

5
2. Blood Transfusion Service in Ethiopia–from establishment up to
date
Abraham Zeleke1
1. Deputy Director National Blood Transfusion Service Federal Ministry of Health Addis Ababa,
Ethiopia. [email protected]
The Ethiopian Red Cross Society has been the pioneer organization in developing blood banking
services in the country. The first blood transfusion center was established in 1969. The service
has been organized as a department under the leadership of the National Red Cross Society with
one central and 9 regional blood banks and can only meet part of the country's blood demand.
The service operated under ERCS until 2012.
Due to the growing of health service coverage and the increase in the number of health care
facilities the service become more accessible to the community at large and thereby the
awareness of the community towards the health service is improved. As result of which the
demand for quality health service by the community is dramatically mounting. Different
researches showed that, to provide quality health service in all the health facilities especially for
mothers and children, traumatic cases, and patients with different internal chronic illness as well
as for those who undergo major surgery procedures, the provision of safe blood and blood
products are immensely important.
Taking into consideration that to minimize maternal and child mortality rates, thereby to achieve
the Millennium Development Goals especially Goals 4 and 5, the supply of safe blood one of the
major components. To secure safe blood service the FMoH take over the service from Ethiopian
Red Cross Society since 2012 and integrated with the health service under the FMoH and RHBs
besides developed a strategic document as to how enhance the service.
In the blood service strategic document expansion of the number of blood banks, increasing
awareness level of the community towards the need of voluntary blood donation to increase the
collection of blood units, strengthening quality control system, enhancing blood transfusion
service facilities in place, strengthening the area with research and trainings, equipping blood
bank facilities with the latest equipments and materials, are some the initiative in the blood bank
strategic document that helps to bring about radical changes in Blood transfusion service.
In 2013/14 the blood bank service achieved a number of results, some of which are:
the increase in the number of blood banks from 12 to 25
furnishing all the newly opened blood bank services with the necessary manpower,
furniture, fixtures and other supplies
the year round awareness creation effort and massive mobilization of the public to make
voluntary blood donation a nation‘s culture made through media promotion, public figure
head involvement, strengthening donor partnership, strengthening institution based
6
voluntary Blood donation promotion, scale up of mobile & fixed site promotion & blood
collection approach etc.
Effort made by each blood bank to supply safe and adequate blood for every transfusion
facilities within 200kms radius
Additional 1 national & 12 Blood Bank facility constrictions initiated
As compared to the years before the FMoH take over the service, in the last 3 consecutive years
the total number of blood units collected and the share of voluntary donations were incrementally
increased where national collection increased from 40,000 units in 2011 to 88,000 units in
2013/14.
Moreover the number of voluntary donations increased from 10% in 2011 to 70% in 2014
nationwide.
The reason for those incremental results is the proactive move of the Ministry and the high
participation and involvement of the community including the media. The exemplary role played
by VIPs such as Deputy Prime Minster His Excellency Demeke Mekonnen, Ministers, world
class celebrity Athlete Dr Haile G/silassie, Artists etc in donating blood voluntarily and
provoking other to stand up for the same cause immensely contributed to the huge turnout of
blood donors on voluntary basis. Moreover, 30 mobile blood collection teams were built
nationwide who goes out from their respective centers to mobilize, recruit potential donors and
collect blood from those who are voluntary to do so. As a result of these remarkable paradigm
shifts in the blood service changed it picture from 10% voluntary donation in 2012 to 70%
voluntary donation in 2014 and addressed the safe blood need thereby decreased maternal and
child mortality as well as traumatic cases due to lack of safe and adequate blood and blood
products throughout the country.
Although the blood transfusion service in Ethiopia operated for more than four decades, it does
not achieved the intended purpose expected of it. To curb the situation all blood bank staffs at the
national and regional blood banks organized in a Health Development Army structure and
committed themselves made an active participation in mobilizing the community and recruit
more voluntary blood donors as a result of which we observed some inspiring changes especially
in the past budget year.
However, taking into consideration the fast expansion of the health facilities and the service
coverage, the demand for safe blood and blood products is growing rapidly; to make sure that a
single individual would not die for the lack of a unit of blood or blood products, still much more
effort remain to do.
Challenge
Even though the success stories mentioned above are achieved within a short period of time, the
blood transfusion service remains with challenges such as:
7
Lack of look - back system (haemovigilance) of blood usage in blood transfusing hospitals,
Inappropriate clinical use of blood, Poor quality control system, Poor data and information
management system of both blood donors and recipients.
Way forward
National Blood Transfusion Service should strive for institutional independence that would
enable it to strengthen the overall blood service across the nation.
It should equip itself with all the necessary state of the art equipments and materials in the field
of blood transfusion to the level of centre of excellence in terms of voluntary blood donor
programme, testing and processing of blood and blood products.
Establishing computerized data and information management system, assuring the quality of the
service, conducting researches, and so much more related tasks until it attains its vision, i.e.
optimal quality in the provision of safe blood for all through the provision of a safe, adequate and
accessible supply of blood and blood products.

8
SECTION TWO
BEST PRACTICE
9
Best Practices and achievements of Health Extension Program of
selected woredas
Christian Tadele Tsegaye 1 and Abebaw Asnake Ayicheh
2
1&2. Chief Officers, Federal Ministry of Health, Health Extension and Primary Health Services Directorate, Addis Ababa Ethiopia
Introduction: The Health Extension Program (HEP) is one of the priority programs in the
HSDP IV. The program focuses on delivering essential primary health care to the population at
grass root level (HSDP IV, 2011-2015).
The main objective of the program is to assure the availability of equitable health service
delivery, focusing on community health promotion and disease prevention at household and
community levels. The basic philosophy of the program is, provided that the community/
household is able to have gained basic health messages through the trained HEWs, it could easily
produce its own health the same way as it harvests agricultural yields. HEP is a program that
enables a family to implement all 16 packages through a continuous and rigorous follow up and
support of one-to-five leaders and HEWs. At community level, the program materializes
development teams, community based organizations (Iqub, Idir etc.), religious institutions,
market places, government institutions (e.g. schools and agricultural development centers,
farmers‘ training centers) and other associations, like women, youth and farmers‘ associations,
etc to help the development of community ownership and awareness on disease prevention and
primary health services.
Scaling up strategy has been brought in to the HEP so as to foster the best practices recorded in
the implementations of the various packages to blancket coverage and be able to identify and
address the major bottlenecks hampering the effective execution of each package at household
level. In due process the scaling up strategy helps to build implementation capacity of health
managers and professionals at all levels by building Health Development Army (HDA) (Revised
Rural HEP Implementation Guideline, 2014).
For the last two years, best lessons and achievements in some health service coverage‘s,
attributed to the firm-efforts of scaling-up the strategy, were recognized, documented and
published for Annual Review Meeting (ARM). Our 2013 publication reads you the efforts made
to boost skilled birth care utilization and the resultant best-lessons learnt. This year‘s publication
brings best practices on Skilled Birth Attendance (SBA), Open Defecation Free (ODF) and
nutrition for under 5 children resulted from implementing all customized strategies through the
flagship of HDA.
1. Increase the skilled birth attendance coverage
To increase the skilled birth attendance coverage, promising activities made in Oromia region
Jimma zone, Boneya Woreda, SNNP region Kaffa zone, Sa‘elem woreda and Amhara region
Dangla town administration are presented as follows:
1.1.Boneya District
10
Is found in Jimma zone, Oromia region. In the previous years, an attitude;
―Delivery out of home brings evil spirit, calls for bad spirit; delivery at home with the
assistance of traditional birth attendant, however; prevents from these all”
was inherently deep-rooted in the community, which used to discourage pregnant mothers from
having delivery in the health facilities. This tradition hampered the coverage of skilled birth
attendance in the Woreda. Recently, however, with increased commitment of the woreda health
office and the establishment of one-to-five networking, the health status of the community has
improved. Engagement of religious leaders, elders, traditional birth attendants (TBAs) and
making health centers (HCs) mother-friendly are among the important community based
innovative approaches that helped to increase SBA in the district.
To this effect, it is certain that the attitudinal change of the community comes through the
catalyst play done by religious leaders and elders. For example, since majority of the community
are Muslims, religious leaders mobilized their followers noting the Quranic verse that:
“„a choking person in a meal can use alcohol in the absence of water‟ so, how come
then a life giving mother die because she delivers at home?”
This, in turn, helped to improve SBA coverage in the woreda. Besides, TBAs have also shown
their support by refraining to assist mother delivering at home by themselves.
In addition the functionality of the new initiative of Primary Health Care Unit (HP-HC linkage)
contributed for increased SBA coverage.
Performance review meeting was held in the woreda, during first quarter of the year questioning
why envision of better delivery services to noticeable number of mothers was difficult.
Following the review meeting, possible bottlenecks hampering skilled birth care utilization were
identified with possible solutions to handle and clear directions were set. Consequently, better
outcomes were achieved.
Health professionals, along with Kebele administrators, have also launched a one month
community sensitization and awareness creation campaign/public conference on skilled birth
care utilization at every kebele of the woreda for community members. Afterwards, enormous
transformations became evident on the following wider issues:
Very deep roted harmful traditional practices and beliefs connected pregnancy and
delivery were practically eradicated
Positive attitudinal breakthrough has been witnessed among health professionals
fulfilling the professional ethics in an acceptable standard.
Community HDA became functionally stronger more than ever.
The effectiveness of Health center health post linkage has improved significantly.

11
Additionally, health facilities have been made conducive and welcoming to the labouring
mothers by availing waiting rooms and arranging ceremonies, such as coffee, provision of
pouridge, soup and other rituals accompanied by dances and songs. This helped delivering
mother and their family feel at home. A campaign was launched to generate money from the
community under a theme ―One Birr to One Mother‖ to cover the costs held at the health
facilities following deliveries. These altogether created awareness on the benefits of skilled birth
care utilization to the community members by clearly underlining the risks of home deliveries.
After the series social ignitions conducted at various levels, the following dramatic changes have
been achieved, in six month period:
250 mothers received skilled birth care per month; a figure not exceeding 10 prior.
Model household graduation reached 100%
Boneya Woreda was declared as HDF and ODF
1.2 Sa’elem District
“Be there present alive so to save mothers lives!”
Sa‘elem Woreda Health Office‘s profound slogan
Sa‘elem Woreda is a district found in Kaffa zone, the SNNPR. It is geographically hard to reach.
The woreda is also identified as a model for its best successes in health service delivery with
inadequate infrastructure, such as road, power and protected drinking water.
Woreda cabinets, and health office heads and management staff gave special emphasis to health
development of the district for it was believed that health is the epicenter of other social
developments. Accordingly, the woreda staff, including political leaders, regularly supported all
kebeles (a visit extended to households) using standardized checklists. The spot actions were also
taken to address bottlenecks. Health center health post linkage was strong enough as it was
evident in the annual plan of the PHCU. Monthly review meetings between the health center and
HEWs, planned and scheduled supports of health professionals to HEWs and timely feedbacks
provided to the HEWs are among sign of strong linkage. The community HAD were also strong
enough to openly discuss on the social barriers hindering skilled birth attendance and design
community led interventions to address the bottlenecks. As a result of these, Sa‘elem woreda was
declared as HDF and no maternal death was reported in 2006 EFY. Maternal and child health
improved noticeably. And a new social norm has been brought in to the woreda community to
foster primary health services utilization, like the following:
“One can only get socially acceptable status to be head of a household of husband, if
and only if he is able to, dig latrine, collaborate with his wife on her health issue and
responsible to implement all health extension packages”.
Keeping a girl or a female happy, especially before marriage, is a dominate existing social norm
in the community and the newly induced norm is found as a helpful strategy to convince the
whole community of the woreda supportive to the improvements health service utilizations.

12
2. Home Delivery Free
2.1. Town Administration of Dangla
Dangila town administration is found in Awi Zone of the Amhara Regional state. Similar to other
towns in Ethiopia, home delivery had long been used as preferred way of delivering a child.
Until recently, despite the existence of functional health centers staffed with skilled
professionals, the utilization of delivery service used to be very low in dangla town. And there
was no single kebele to mention as HDF in the administration till 2005 EFY.
To change such facts, the town administration cabinets and management staff, health office
management, health center director and professionals, HEWs, Kebele administrators, religious
leaders and traditional birth attendants, one to five and development group leaders had lunched
ambitious plans with an objective of making all kebeles home delivery free (HDF).
Pregnant mothers‘ conference moderated by midwives and other health professionals from the
health center, which is abeted by a manual, has played a pivotal role for the magnificent
achievement recorded. Identifying and addressing the long rooted bottlenecks related to
pregnancy, such as cultural, religious, traditional beliefs (overlooking the importance of ANC,
questioning the importance of facility delivery by the mere logic that home delivery was a
dominant value and lack of trust on the capabilities of facilities on proper delivery care services)
was a tough task.
In addition to the rigorous social mobilization activities, making the health facility attractive and
welcoming to the pregnant mothers and their families in seek of delivery service has also played
vital role for the astronomical increment of skilled birth care utilization. Making health facility
services attractive and timely was not only limited to the skilled birth care services but also to
other health services and it was noted that such positive changes counted in the hearts and minds
of the community in replacing the bad mental image of health facilities. This also facilitated for
the increase of skilled birth care utilization amongst community members.
Availability of ceremonies and rituals for labouring mothers and their families at the health
center
The provision of assorted clothing for the baby are additional incentives to promote
institutional delivery
The availability of maternal waiting rooms
The humble and ethical approach of midwives to labouring mothers and their families have
all helped to build huge trust and dependency on the services provided at the HC.
During the past, the HC was isolated from the community health care services as an island. The
following progress were made that changed this picture
Basic attitudinal changes on health professionals have been brought in.
13
Health professionals at HC were assigned to HPs and supported HEWs in a planned and
scheduled fashion with checklists which in turn helped in identifying and addressing skill,
logistics and attitudinal challenges HEWs are facing in everyday lives
The existence of strong one to five.
Provision of timely and proper feedback to HPs
The availability of traditional ambulance during the rainy season to transport labouring
mothers to where vechlies/ambulance are accessed
The exchange of mobile numbers between the delivering mother‘s family and the health
workers at HC and HP levels (midwife, HEW and ambulance driver) for a call to ambulance
all these made the linkage between Hc and HP to a level of mother and child relationship which
in turn boosted the confidence of HEWs and increased their acceptances and trustworthiness by
the community. Moreover, such circumstances have contributed greatly for producing HDF
kebeles.
In such a process, it was possible to make 2 of the 5 rural kebeles under the town administration
home delivery free. And documentation and scaling up of the best practices was well conducted
to the remaining kebeles. With a strong, effective and all rounded follow up, the successes
recorded in the rural kebeles paved the way to replicate similar achievements in the urban
kebeles. With a reasonable duration of time, 4 urban kebeles out of 5 were declared as HDF
increasing the proportion of HDF kebeles to 6 out of 10. Above all, skilled birth care utilization
has emerged as a social norm in the community.
3. Open defecation free
3.1. Debre Elias District
Debre Elias is a district in East Gojjam zone Amhara region. Open defecation had long been a
practice inherited and the construction and use of latrines been looked as desirable for the
urbanite elites as a luxury practice. Hence, the district community being exposed to
communicable diseases easily preventable resulting in the loss of productivity was a well noticed
story. Such story has began to change slowly with the implementation of HEP and effective and
closer follow up of the HEWs and the District leadership and governance. The change has been
boldly visible following the HDA in the District.
A very special approach was employed to this end; recruiting youth who completed high school
but jobless for the construction of public latrines at each development Group. The community
was responsible in recruiting the youth while the district health office trained them on latrine
construction. And then, the youth were paid from the community members‘ contributions. This
served a dual purpose of creating job opportunities to the youth in one hand and availing public
latrines on the other, a step to declare open defecation free kebeles.

14
Besides recruiting and employing youth, Debre Elias district has aligned the construction of
public latrines with natural resources conservation works. The local community was given a
direction from the district command post to involve in tasks of communal latrine constructions
and renovations in their own respective development group, one to five and individual household
in a team approach after natural resource conservation duties. Because of latrine construction and
proper utilization by every household is set as one of the criteria to be a graduate as a model,
community members were prompted to construct a latrine per capita. This laid a foundation for
the keen efforts of community members to construct communal latrines in market places,
churches and other public gathering areas. Furthermore, the clear understandings created on the
huge mass with the fact that individual healthy behavior may not avert diseases to one‘s family
unless the mass made it a norm triggered the community members to actively involve in the
process of making kebeles and schools open defecation free
Generally, by effective utilization of the HDA for social mobilization and awareness creation to
the political leaders, health professionals and the community, it was possible to declare 10 of the
16 kebeles in the District ODF. And replacing the latrines with durable materials has reached
63% while latrine construction and utilization coverage reached 100%.
4. Improve Community Based Nutrition
4.1. Hawuzein District
Hawuzein is a district located in Tigray, a region known for the effective implementations of
health programs and well noted best practices, particularly on HEP. The feeding habit of under 5
children had been non different to the generation old practices before and after the
implementation of HEP. Exclusive breast feeding till the child ages 6 months and supplementary
feeding after 6 months were rarely practiced. Proper feeding of lactating mothers was no issue at
all. Nonetheless, these all have been dramatically changed after the launch of the HDA.
The single most innovation which changed the story is CANDLE LIGHTING visit by members
of development group and one to five for recently delivering mothers and mothers with < 5
children under their networking. The visit holds a latent message for the mother lactating and her
family that development group and one to five members are watchful of the proper feeding of
both the mother and child. The manifested message lies in the continuation of the already
existing normative practice of paying a visit to the delivering mothers as congratulatory.
Accordingly, leaders of development group and one to five registered lactating mothers and < 5
children under their networks for effective and timely follow up of the feeding habits. House to
house visit and follow ups are paid and discussions on the challenges and good practices are
held. Challenges are discussed at development group level and addressed while good practices
are shared amongst members. And at a HP level, child health day (CHD) is held to
commemorate the 5th
birth day of the children in the community. The CHD serves as a stage for
the children to thank their respective mothers and other community members for the great efforts
they made for them to grow well nourished. The community members also use the ceremony to
send birth day wishes to their future generation. Demonstrations of proper feeding with local
available food staff are conducted during the ceremony too and it helped in addressing attitudinal

15
and skill bottlenecks amongst community members. CANDLIE LIGHTING visit to a
delivering mother is held by the community members if only if the mother gave birth at health
facilities. This also helped for the improvement of skilled birth development group and one to
five members paid a visit to recently delivered mothers saying
“Congratulations; we thank you for you have delivered at a health facility and initiated
breast feeding as well as early vaccination.”
The CANDLE LIGHTING way of social recognitions held for the mothers who properly fed
their children has improved for the better status of Hawuzein district community based nutrition
and hence, zero case resulted in malnourishment in the district.

16
SECTION THREE
INITIATIVES (FLAGSHIP, SUMMARY
OF STRATEGIES AND GUIDELINES)

17
2014/15 Flagship Initiatives of FMOH Directorates
Mentesnot kebede 1 1. HIS/M&E coordinator, FMOH
The deadline for the Millennium Development Goals (MDGs) approaches, Ethiopia is making
good progress towards meeting the targets. With a Motto crossing the last line the directorates of
FMOH for the year 2014/15 set different flagship initiatives.
National TB Control Program Improvement plan:-With the objective of reducing the
incidence, prevalence, and mortality resulting from TB, Ethiopia has developed and implemented
strategies which are fully aligned with the globally recommended Stop TB Strategy and
demonstrated encouraging gains in reducing the incidence, prevalence and deaths related to TB.
Currently, the National TB Control program has been reviewed and revised strategic plan with
bold and ambitious targets that must be met to substantially reduce the burden further with
ultimate goal of the TB epidemic. This gap are calling for an interim improvement plan to
rapidly reverse the declining program performance and accelerate implementation of key
initiatives included in the revised national TB control program strategic plan.
Clean and safe health facilities:-Cleanliness in hospitals is about more than just keeping the
place clean. It is a testimony to the commitment of the health facility to their clients and visitors,
about the attitudes of staff, managers and the board in terms of attention to detail the level of care
and the way the hospital is organized and run. It is not possible to have a good hospital without
being clean and tidy hospital. Excellence in patient care is dependent on getting the basics right,
making sure that the food is good, making sure that the patients are cared for and that the
surroundings are clean, tidy comfortable and safe.
The National accountability framework score card:-To fulfill the principles of BSC mainly,
conducting periodic performance reviews to learn about and improve strategy and thereby
enhancing commitment and accountability, Ethiopia has adopted ALMA accountability frame.
The accountability frame scorecard is assumed to strengthen further the planning, action and
performance monitoring and evaluation process in the country. The tool will play key role in
improving the quality of data capturing, information use and decision making processes, and
ultimately enhancing harmonized effort towards achieving the targets and goals set at each level.
Combating illegal trade and clearing backlog of product dossiers for evaluation:-Ethiopian
Food Medicine and Healthcare Administration and Control Authority (EFMHACA) as one of the
three pillars of the health sector is mandated to regulate the 4Ps, product (food and medicine),
professionals, premises and Practice adapting the known functions exercised in other countries;
these functions includes but not limited to registration, inspection, compliance and enforcement.
The regulatory system is such complex in that it is difficult to address all issues by single
government institute and the authority recognizes community ownership as well contribution
from clients to regulate them. This is experienced by conducting successive mass mobilization
forums, continuous discussion, and facilitation of ways in which citizens convey their voice so
as public will exercise its power in protecting itself from illegal/poor quality products and
services. In this connection, EFMHACA designed two flagship initiatives; combating illegal
trade and clearing backlog of product dossiers for evaluation.
18
Increasing Domestic Health Financing/ with special Emphasis on Domestic Philanthropy:- Every country faces resource constraint to finance their health system sustainably from domestic
sources. Even the richest countries find it difficult to keep up with rising health care costs
(WHO). The fifth National Health Account (NHAIV) has reviled in 2010/11 only half of the
total health expenditure is covered from domestic sources and the remaining 50% from external
sources. Compared to other countries, Ethiopia‘s 50% health expenditure from external resource
is very high end. This fact will have an impact on the sustainability of the health system in the
long run. Hence increasing domestic resource from different financing alternatives is one of the
priorities of the financial resource mobilization directorate.
Community Ownership and Empowerment:-An organization is nothing more than the
capacity of its people to create value. Every one of us acts or behaves in ways to create meaning.
Absolutely an organization leadership will help them discover meaning in delivering services to
their customers. Once this happens, they will be motivated to keep adding value, to their own
lives as well as to the lives of their customers. Thus the value chain of service delivery will
constantly be strengthened.
Achieve 80% of Model Households coverage in woredas Embraced For villagization:-
Health System Special Support Directorate is working strongly to enhance strong and accessible
health service provision at villagization centers among four regional states (namely Somali,
Gambella, Afar and Benishangul-Gumuz) which require equitable overall development. For
current year, the director is planning with special emphasis on model household trainings and
their ultimate graduation for those living in 538 villagazation centers through chosen flagship
initiative to encourage communities‘ engagement on their health related activities. The
directorates‘ flagship is to cover woredas‘ embraced for villagazation to reach 80% model
households coverage achievement.
Legislation and detailed procedural directives on newly emerging medical services:-The
ministry of health as an executive organ has a vision to see healthy, productive, and prosperous
Ethiopians. This vision will be effectively achieved when there is comprehensive health
legislation capable of solving legal issues in emerging medical practices and correcting medical
mal practice that might be encountered during the provision of medical service. In the current
health service provision of the country there are some emerging medical services which needs
legislation and detailed procedural directive that can regulate illegal service. The aim of this
project is to analyze that medical provision which needs procedural legislation in respect of legal
issues. Taking into account the nature and the degree of sensitivity the following three medical
services are identified for further legislative frame work under this project. Artificial
insemination, Stem cells and Blood transfusion service
Creation of a Forum with the internal auditors of Agencies & Federal Hospitals of Ministry
of Health:-Creation of a Forum with the internal auditors of Agencies & Federal Hospitals of
Ministry of Health in return to see their objective and independent assurance as well as
consulting services adds value to the risk management, control and governance of the respective
agencies and Federal Hospitals and hence, that of the Ministry of Health. The goal of this
flagship initiative of the directorate is to create Model internal audit and strong internal control
system of the agencies & Federal hospitals so that the vision, mission, goal and objective of the

19
Ministry of health will be achieved through effective, efficient and economical risk management,
control and governance.
General Hospital and Specialized Comprehensive standard design: - Appropriately equipped
hospitals at tertiary level will provide efficiently the expected services with quality of care and
equity of access. In the recently developed draft 20 years health strategic document, the Ministry
of Health seeks to achieve the health outcomes that commensurate with lower-middle income
country by 2025 and middle-middle-income country by 2035. With this regard the Secondary
and tertiary level hospital is a timely response for the current challenges of the tertiary level care
and will contribute significant role in to achieve the desired level of health status of the nation.
The objective of the project is to produce General and Specialized Comprehensive design that
will be leader in providing affordable, world –class secondary and tertiary care service that will
play a role model role for the existing and new hospital in Ethiopia.
Medical equipment specification and availability database:-Currently at the FMOH, there is
no database on medical equipments specifications which can be used for the procurement
purpose to address this problem, it has been decided that, the FMOH/PLMU, with the
involvement of all relevant stakeholders, will develop a medical equipment specification
database so that procurements can be drawn from it. This will give the assurance that
procurements will be conducted as per the requirements of the beneficiaries; regulatory
authorities will have easy reference to check against if procurements were made according to the
requirements; and the body that conducts the procurements shouldn‘t be worried about setting
specifications because they are already established.
National Licensing Examination:-Licensing and regulating health professionals helps to
protect the public from incompetent, professional, unsafe practitioners and promote quality
health care by ensuring that only qualified individuals receive a license to practice and deliver
health care. It is with this intention that the Ministry of Health established a National Board of
Examinations to deliver a standard qualifying exam at a national level for graduates of Medicine
and other health sciences (Midwifery, Anesthesia, Health officers) before they are deployed.
The Objective of the flagship is to: Protect the public from incompetent health practitioners,
Improve the quality of health care service rendered Improve quality of education in training
Institutions and, boost confidence and build public trust on health care service provision.
20
New initiatives
1. National Strategic Action Plan (NSAP) for Prevention and Control of
Non-communicable Diseases in Ethiopia 2014-2015/16
Dr Abdissa Kurkie1, Dr Mahlet Kifle
2 and Dr Asmamaw Bezabeh
3
1. Director, Disease Prevention and Control Directorate, [email protected].
2. NCD Team Leader, Disease Prevention and Control Directorate, [email protected]. 3. TA, NCD Team, Disease Prevention and Control Directorate, [email protected].
Introduction
The Brazzaville declaration on Non-Communicable Diseases was adopted by the African Health
Ministers in the WHO Africa region in 2011. The declaration recognized NCDs as a significant
development challenge and highlighted the major actions that should be undertaken by member
countries which included ―Developing and implementing NCDs prevention and control
strategies, guidelines, policies, legislations, regulatory Frameworks including the WHO FCTC
,in order to protect Individuals, families and communities from unhealthy diets; harmful use of
alcohol; Tobacco use and exposure to tobacco smoke; unsafe food; violence and injuries;
Advertising of unhealthy products; and infections responsible for certain types of cancers‖.
In line with this, a functional NCD unit was established under the Disease Prevention and
Control Directorate (Federal Ministry of Health) in July 2013. Following the formation of this
Unit, developing National NCDs Strategic Action Plan (NSAP) was given a top priority which is
a fundamental step for a systematic and coordinated response in the prevention and control of
NCDs and their risk factors. To realize this, the FMOH together with relevant stakeholders has
jointly engaged in the production of the NSAP for Prevention and Control of Non-communicable
Diseases in Ethiopia 2014-2015/16. This strategic action plan is intended to serve as a guiding
document for the designing, planning, implementation, and monitoring and evaluation of NCD
prevention and control activities.
THE DEVELOPMENT PROCESS
The development of the NSAP was directed by a taskforce which charge was to develop the
NSAP after a thorough review of the available, current scientific evidence. Experts from
different disciplines in the area of major non-communicable diseases were selected for this task.
The process included formal literature review by the taskforce, a consultative workshop by
engaging additional representatives from partner organizations and universities, and a validation
workshop involving representatives from regional health bureaus.
Strategic themes
Generally, the NSAP is organized into four priority areas taking into account a systematic and
comprehensive response to the prevention and control of NCDs and their risk factors and has
been costed for the period of 2014 to 2016.

21
The four thematic areas are:
a) Governance, leadership and favorable policy on NCDs and their risk factors.
The objective of this priority initiative is to strengthen the national capacity, leadership,
governance, multi-sectoral action and partnerships aimed to accelerate the national
response in the prevention and control of NCDs and their risk factors. Thus, effective
implementation of this priority area would result in increased political commitment,
availability of sustainable resources, and setting functional mechanisms for multi-sectoral
actions among sectoral ministries and effective coordination by the ministry of health.
b) Health promotion and disease prevention at the population level mainly addressing risk
factors.
By properly implementing this priority area and subsequent creation of health promoting
environments; it is projected to reduce exposure of individuals, families and communities
from modifiable NCD risk factors and possibly to reduce morbidity, mortality and
disability attributable to NCDs and their risk factors. Best buy interventions which are cost
effective are available for the prevention and control of the four major NCD risk factors
namely tobacco, physical inactivity, unhealthy diet and alcohol abuse. These interventions
are simple, feasible and applicable in low resource settings such as ours.
c) Comprehensive care and treatment of NCDs and their risk factors (revitalization of the
health system).
Early detection, diagnosis, treatment and palliative care for NCDs and their risk factors is
an integral component of the national response for NCDs. This priority area aimed to
provide health services for NCDs and their risk factors within the context of universal
health coverage through quality and patient-centered primary healthcare while facilitating
the referral system and delivery of state of the art health services both in secondary and
tertiary facilities. Reorientation of health system and decentralizing the traditional tertiary
level health services for NCDs into the primary health facilities are the main goals of this
strategic priority area.
d) Evidence for action: Monitoring and evaluation including producing local evidence through
surveillance and research.
This specific priority area is designed to monitor trends and determinants of non-
communicable diseases and evaluate progress of programs and interventions in the
prevention and control of NCDs. In addition, research and surveillance are vital for NCD
prevention and control interventions.
CONCLUSION
It is now clearer than ever that non-communicable disease kill more people than other causes
combined. The health, economic and social impact of NCDs is a concern beyond the health
sector that poses a significant challenge in the 21st century for human development.

22
Fortunately, there are best buy interventions that are scientifically proven and evidence based for
prevention and control of NCDs. Over a third of cancer cases and 80% of CVDs and diabetes
can be prevented through addressing the common shared risk factors; tobacco, unhealthy diet,
physical inactivity and the harmful use of alcohol. However, the prevention and control of NCDs
require actions beyond the health sector.
Therefore, a collective and coordinated action from all sectoral ministries would have a
paramount and sustained result.
23
2. HMIS scale up at Private health institution
Mr. Noah Elias1, MR Mengesha Edago
2 and Mr. Mentesnot Kebede
3
1. Policy Plan Director, FMOH, [email protected].
2. Monitoring and Evaluation Officer, FMOH. 3. HIS/M&E coordinator FMOH, [email protected].
Health Management Information System (HMIS) can be defined as a system that provides
updated, relevant, adequate, timely, reliable & complete evidence based health and health related
information to health managers at all level in order to make informed decisions about health
program performance. To address this routinely collected data from the public sectors alone
doesn‘t represent the status of the health sector‘s performance.
The Role of private Health Facilities in health system
In many developing countries, when people first seek diagnosis and treatment for an illness they
visit a private pharmacist, nurse, midwife, doctor, a drug seller or traditional practitioner. People
use these private sector providers (PSPs) because they are often nearer, open for longer hours,
and are seen as more considerate and sometimes less expensive than their public sector counter
parts.
Private sectors provide service for large segment of the population and they have significant
contribution in reducing morbidity and mortality. So that they are an important focus for
governments which aim to establishing, implementing, mainstreaming, coordinating, Monitoring
and evaluating partnerships between the Government and the private health sector. Private health
facilities employ a large number of staff, many of whom work exclusively in the private sector.
The situation of Private facility HMIS in Ethiopia
In total, FMOH documented 4096 private facilities practicing in a country, 63 Hospitals, 280
higher clinic, 850 medium clinics, and 2899 lower clinics. a survey conducted in 2011 at Addis
Ababa City administration to look at their contribution Findings 2962 health professionals
working as fulltime workers and 1368 of them also work as par time employee ,Nearly 48 % of
them have ANC services ,and 30 % give Delivery services and 27 % of them provide PMTCT
services
With regards to HMIS tool the assessment showed that 81% use registers 69% have services
cards ,and on the other hand 54% of the health facilities have computer for registration (use
simple office application or networked system or software developed using EPI Info…). Nearly
one fourth of the facilities implemented EMR. Some of the soft ware‘s used for registration
include: excel based, access Majority 89% of assessed sites send their report to governmental
and non-governmental organizations.
For more complex reporting requirements the standard FMOH registers and recording tools
should be used (HIV/AIDS and TB).

24
Why HMIS scale up in privet sector health facilities ?
Private health facilities are a key component of the health sector in Ethiopia and should be
recognized for their contribution. In our context despite their great service rendered to the
society, these sectors lack systematic reporting of the health information to the government. The
private sectors share considerable information to monitor overall service and disease pattern.
Even though, the recent statistics prevailed that a total of 4,033 private clinics and 63 private
hospitals existed, the implementation of the new HMIS not initiated till after finalization of
revision process of reformed HMIS. Therefore integration of private for profit, is important to
augment public sector data.
There is limited integration of data and data flow between health information systems in the
private and public sectors. Experience of both public and private sectors is that there is little
exchange of health data between the sectors.
An increase in the demand for an accessible, accurate and integrated national health information
system calls for strong consensus on the need for common standards for data across the public
and private sectors and integrated national HMIS that improves data coverage of the health
sector by linking public health information system with information from the private sector.
The main objective of scaling up of redesigned HMIS reform into the private sector is to
strengthen integrated national health information with full participation and partnership of the
private sector
Strategies and interventions for scale up of Health Information System in private
institution
Strengthen public private partnership
Advocate and raise awareness for Health Information System for private health facilities
Customization of HMIS materials and Tools
Build capacity for collection, analysis, dissemination and utilization of health related
data.
Scale up implementation of data management systems
Progress to date
The great role the private sector, NGO and other government institutions play in increasing
health sector data coverage TWG established that leads the implementation of reformed HMIS in
the private sector. Following the assessment customization of HMIS materials and tools,
advocacy, sensitization, TOT, and cascaded training of health professionals in the private sector
were done accordingly 70% Private facilities have received facility level trainings and ready to
implement the revised HMIS and stare reporting from first quarter of 2007 Ethiopian fiscal year.

25
Next step
Complete training in the remaining of 30% health facilities
Strengthen supervision and mentorship
Establish partner forum
26
3. National Malaria Strategic Plan, 2014 – 2020 (2007 – 2013 E.C.)
Dr Abdissa kurkie Kabeto1
1. Director, Disease Prevention and Control Directorate, FMOH [email protected].
Ethiopia was one of the first countries to embrace the Scaling Up for Impact concept for malaria
control. The 2006-2010 National Strategic Plan aimed to rapidly scale-up malaria control
interventions to achieve a 50% reduction of the malaria burden, in line with Roll Back Malaria
objectives.
The status of coverage of the major interventions was measured in the 2007 and 2011 Malaria
Indicator Surveys. The results showed tremendous achievements of Ethiopia‘s malaria control
program: between 2005 and 2011, coverage increased more than 10-fold. Households in
malarious areas were protected by at least one insecticide treated net. Insecticide treated net use
by children under five and pregnant women increased to nearly 50% in malarious areas and to
over 60% in households that owned at least one net.
The percentage of households sprayed in the 12 months preceding the surveys were 20% in 2007
and 46.6% in 2011 showing more than double increase in 2011.
Administrative report indicates that IRS coverage of targeted households is further increased to
67% in 2012 and 83.9% in 2013. Health facilities are reporting sustained reductions in both
malaria cases and malaria-related deaths, even during the peak of the transmission season.
The 2014-2020 National Strategic Plan is the updated version of the 2011-2015 National Malaria
Strategic Plan. It is the product of a strong collaboration between all stakeholders that are
engaged in the fight against malaria in Ethiopia.
With resources secured to support universal coverage of key malaria interventions by the end of
2010, Ethiopia has already moved from Scale Up For Impact to sustained control, as key steps in
the process towards malaria elimination. The 2014-2020 National Strategic Plan will build on the
achievements of 2011-2013 and, through sustained control, will move towards malaria pre-
elimination/elimination through an integrated community health approach. This will be achieved
through continued provision of malaria prevention tools (long lasting insecticidal nets and indoor
residual spray). Increased diagnosis and case detection, increased access to treatment, and
increased utilization of interventions will only be possible by a community mobilization effort.
The diverse ecology of the country supports a wide range of transmission intensities, ranging
from low-hypo-endemic transmission in the highlands and semi-arid regions to high-endemic
perennial transmission in the lowland regions and valley floors. The current stratification of
malaria was developed using Woreda, or district-level transmission intensity (annual parasite
incidence per 1000 population - API). Woredas were categorized into different strata using API
data and elevation as criteria. Therefore, based on API and altitude, four broad strata are
27
identified. These strata are: malaria free; low; moderate, and high transmission strata. The
classification will be used to target intervention strategies.
Based on the current stratification the proportion of the population at risk of malaria is 60%. This
shows a reduction in the proportion of the at risk population, which was previously 68%. The
reduction is generally expected and can be explained in relation to the scale-up and sustenance of
interventions that have been taking place in the country. This implies that the ongoing
interventions attributed in reduction of malarious areas and population at risk. Conversely the
interventions have increased the proportion of malaria free areas.
The vision is ‗To see a malaria free Ethiopia‘ and the mission is ‗To provide quality, equitable
and effective malaria control services to population at risk of malaria through community
empowerment, mobilization, and ownership, an integrated health system approach, and strong
partnership and by ensuring transparency, accountability‘.
The goals of the national strategic plan are:
By 2020, to achieve near zero malaria deaths* (no more than 1 confirmed malaria
death per 100,000 population at risk) in Ethiopia.
By 2020, to reduce malaria cases by 75% from baseline of 2013.
By 2020, to eliminate malaria in selected low transmission areas.
The strategy provides a detailed account on the status and direction of the major malaria
prevention and control strategies, objectives and interventions that include community
empowerment and mobilization, early diagnosis and treatment, selective vector control,
surveillance and epidemic control, as well as cross cutting strategies that include monitoring and
evaluation, and programme management. The plan also considers approaches towards
eliminating malaria from low transmission areas. The priority interventions that will be targeted
in the national strategic plan are summarized as follows:
Community empowerment and mobilization
Carry out targeted advocacy, communication and social mobilization activities.
Empower and mobilize communities in order to own anti-malaria interventions and
actively participate in planning and implementation of interventions in their respective
areas.
Build capacity on advocacy, communication and social mobilization.
Conduct assessment to identify gaps in knowledge, attitude and practices in relation to
anti-malaria interventions. This will be incorporated with malaria indicator survey.
28
Diagnosis and treatment
Diagnose all suspected malaria cases;
Sustain universal coverage of effective and efficacious treatment as per the national
guidelines;
Establish quality assessment system for malaria diagnosis.
Monitor efficacy of anti-malaria drugs.
Support malaria related integrated community case management activities
Prevention or vector control
Achieve universal coverage, sustain; and improve utilization of long lasting insecticidal
nets.
Build capacity on planning, implementation and monitoring of indoor residual spraying.
Monitor susceptibility of insecticides and distribution and behaviour of vectors.
Monitor durability and longevity of long lasting insecticidal nets in the field setting.
Elimination of malaria
Improve immediate notification, case and foci investigation and classification.
Reduce number of active foci and locally acquired cases to zero, and halt and sustain zero
local transmission in selected areas;
Surveillance, monitoring and evaluation
Strengthen capacity of surveillance, and monitoring and evaluation activities; and
undertake routine and periodic data collection and analysis.
Ensure timeliness, completeness and quality of data.
Generate strategic information to update malaria epidemiological profile and facilitate
appropriate decision making.
In addition to the above mentioned strategic areas much emphasis will be given to improvement
of the overall malaria programme management and pharmaceuticals supply chain management.
The total estimated cost of the national strategic plan of 2014 – 2020 is US$973,884,080. Of
total, US$336,214,359 (34.5%) will be for long lasting insecticidal nets; US$280,681,801
(28.8%) for indoor residual spraying; US$163,877,879 (16.8%) for diagnosis and case
management; US$92,321,189 (9.5%) for advocacy, communication and social mobilization;
29
US$61,698,360 (6.3%) for program management, US$14,995,686 (1.5%) for elimination and
US$24,094,806 (2.5%) is for other programmatic areas. Majority of cost, US$725,934,693
(74.5%) will be for procurement of commodities.

30
4. National Licensing Exam
Dr. Wondimagegn1 Embiale and Kedir Seid
2
1. HR Director FMOH [email protected]
2. Human Resource Directorate, Development Team leader [email protected].
Introduction
Health workers are the cornerstone of health systems to ensure the achievement of health and
development goals. They form the essential building block with which effective and
comprehensive national health plans are built. New and innovative technologies can radically
transform the way health services are delivered. Without the availability of skilled and
adequately trained health workers to carry out the tasks however, these novel approaches will
inevitably fall short of their goals. Urgent attention to quality of human resources for health
training is thus crucial.
Ethiopia recognized early on the need to strengthen its health systems by investing in the training
of its health workers. The Government made a strategic decision that the ratio of higher
education intake between natural sciences/engineering/technology and social
sciences/humanities fields should be 70:30, with 20% of the total capacity of higher education
committed for health sciences education. This policy led to the overall health worker stock
increase in the health sector. Overall the expansion of public and private universities and
colleges in the country contribute a lot for supply of health care workers.
Despite the expansion of training institution, the quality of training was not getting enough
attention. Since establishment of TVET, the training of lower level health care workers who
completed the pre-service training have been checked against occupational standard and
curriculum using national qualifying exam (COC) that was prepared by Federal Ministry of
Health in collaboration with Federal Ministry of Education. This experience might be used as a
good lesson for higher education exit check program development. Many countries in the world
have used National Licensing Examination in order to improve healthcare around the world
through standardized assessment methods.
Rationale
Increasing public demands for quality and ethical health care
Mushrooming of public and private higher education institutions that do not necessarily
follow the same curricula and training rigor
The indefensible double standard of requiring graduates from technical and vocational
colleges to pass certification of competence (COC) exam as a precondition for
employment
Global standards for better regulation combined with aspirations to produce health
professionals that can compete at global stage

31
Strategic objective
Is to establish and install system that checks quality of training in order to protect public
through establishing National board examination (NBE) for health professionals
graduating from HEIs. It is expected that the Licensing exam result will be one of the
pre-requisites for initial license to practice as a health care worker.
Implementation of the program will be managed by Federal Ministry of Health (NBE) for
the coming years on Medicine, Anesthesia, Midwifery and Health officer training
programs. The National Licensing Exam will come to effect on graduates of 2007
EFY/2015 and beyond on the above four categories.

32
5. Tobacco Free and Physically Active FMOH Premises
Dr Abdissa Kurkie1 and Dr Mahlet Kifle
2
1. Director, Disease Prevention and Control Directorate, [email protected].
2. NCD Team Leader, Disease Prevention and Control Directorate, [email protected].
Introduction:-Non-communicable diseases (NCDs) are the leading cause of death worldwide,
accounting for 63% of all deaths in 2008. World Health Organization‘s projection indicated a
rapid increase in NCDs globally in the coming years with the highest increase estimated to occur
in the African region. By large, four behavioral risk factors: tobacco use, unhealthy diet,
insufficient physical activity and the harmful use of alcohol are cited as the leading risk factors
of NCDs. In addition, there are conclusive scientific evidences that ―Khat‖ consumption being a
fifth shared behavioral risk factor for NCDs as well as a predisposing factor for the above
mentioned behavioral risk factors. This is particularly true in Eastern Africa and the Middle East
where it was traditionally consumed for centuries. The rise of Non-communicable diseases
(NCDs) and their risk factors and the subsequent health, economic and social impact is a concern
beyond the health sector.
In particular to tobacco and physical activity, nearly 10 million people die each year worldwide
due to tobacco use and insufficient physical activity combined; (6.6 million due to tobacco and
3.2 million due to physical inactivity). It is also worth mentioning, more than 600,000 deaths
occur among non-smokers due to second-hand smoke.
Despite lack of nationwide studies reports showed NCDs and their risk factors are in the raise in
Ethiopia. WHO estimates 4% tobacco use prevalence in Ethiopia, but the prevalence varied
significantly among regions that ranges from less than 2-3% in Amhara and Tigray to as high as
25% in Easter part of the country (Somali, Afar, Harari), as well a non-cigarette tobacco use is
reported with a range of less than 1% in Amhara and Tigray regions to greater than 15% in Afar
and Benshanguel Gumuz regions. As well, the rapid urbanization and adoption of Western
lifestyle has impacted the level of physical activity and the ability to maintain a healthy body
weight. For example, a STEPS survey in Addis Ababa showed nearly 30% of adults were either
overweight or obese, while low physical activity was reported in 9% of males and 25% of
females.
There are a number of cost-effective interventions that can be implemented at a population level
to tackle the challenges of tobacco use and physical inactivity; however, most of these
interventions require multi-sectoral and policy level interventions. On the other hand, there are
also a number of simple and cost effective interventions that can be implemented at workplaces
that particularly could address the risks of tobacco and physical inactivity. Ensuring a tobacco
free workplace and promoting physical activity at workplaces are some of the best buy
interventions that are scientifically proven and evidence based.
To this end, Ethiopia ratified the Framework Convention on Tobacco Control (FCTC) that aimed
to protect individuals and communities from tobacco exposure. The FCTC calls for the
protection of individuals and communities from tobacco. It further calls for a tobacco free
workplace and public places that are 100% smoke free. In addition, it is possible to reduce the
33
risks of hypertension and overweight/obesity by encouraging physical activity at workplaces that
include promotion of walking to and from work as well as availing GYM at workplaces.
Therefore, given that the FMOH is the leading and specialized organization in health, it has the
privilege to lead by example ensuring its premises and the workplaces are tobacco free and
physically active; employees are healthy and productive. In addition, the concrete efforts and
shared positions in the implementation of tobacco free and physically active environment within
the Ministry of Health will demonstrate prototype measures among all sectoral ministries, civic
society and partners and believed to impact positively its adoption of tobacco free and physically
active environment in their workplaces. To this end, the Ministry launched the tobacco free and
physically active initiative on April 17, 2014 at a high level advocacy session to its employees
and representatives‘ of staffs from the specialized agencies and partner organizations.
Consequently, it is envisioned that the tobacco free and physically active workplace in the
Ministry to be rolled out within all levels of the health system (RHBs, Zonal and Woreda Health
Offices and health facilities) as well as nationally within all the sectoral Ministries and partners
operating in the country.
The FMOH will use the framework of the National Strategic Action plan for the Prevention and
Control of NCDs for advocacy, rollout and mainstreaming of this initiative within all sectoral
ministries and specialized agencies in Ethiopia.

34
6. Gender training manual
W/ro Yamrot Andualem1 and Mr. Almayehu Bogale
2
1. Gender Director, FMOH, [email protected],
2. Assistant Gender Director, FMOH, [email protected].
Introduction
The government of Ethiopia through the leadership of Federal Ministry of Health (FMOH) has
pursued its commitments to ensure all Ethiopians have access to basic health services. New and
up-to-date Strategies aimed at improving access to health services were developed and
implemented to guarantee universal access at all levels of the health care system. Beyond
adopting and implementing new, innovative and result driven strategies, it regularly reviews and
modifies its implementation manuals and guidelines to accommodate changing situations. With
this regard, the women and youth directorate has recently revised Gender mainstreaming manual.
The manual is revised in line with the Growth and Transformation plan of the country to ensure
Gender equity and equality at all levels of the health sector. Furthermore, the mainstreaming
manual plays vital role in addressing health issues caused and aggravated by Gender related
determinants.
The mainstreaming manual has been launched in the presence of senior leadership of the
ministry, members of the standing committee of women and youth of the parliament, leaders of
the different sector offices, and representatives of partner organizations. In addition, series of
meetings were organized with RHBs and Federal level sector offices to introduce and sensitize
on the revised manual. RHBs are conducting similar meetings with key department heads and
officials from the regional offices to cascade the process of sensitization and familiarization.
The manual contributes a lot in promoting accountability and mainstreaming Gender issues in to
the six building blocks of the health system. Furthermore recommendations and directions from
the revised Gender mainstreaming manual were considered as input in preparing 2007 E.C
annual work plan of the directorate.
Purpose of Gender training manual
The purpose of the Gender training manual is to standardize Gender related trainings for health
workers. In order to facilitate mainstreaming of Gender at all levels of the health system, it is
important that service providers and leadership at all levels of the health system have sufficient
knowledge on Gender. Hence, the Gender training manual helps to standardize and ensure
quality of trainings to these groups of people in the health system. The manual, on the other
hand, gives the privilege to coordinate trainings in a manner that allow effective and efficient use
of resources to achieve higher impacts.
In general, the Gender training manual plays crucial role in ensuring quality of trainings and
addressing knowledge gaps among service providers and leaders at all levels.

35
Objective of Gender training manual
The main objective of the Gender training manual is to increase awareness and knowledge of
health workers‘ on Gender and enhance their skills in mainstreaming Gender so that they can
contribute to speed up the process of implementing the Gender mainstreaming manual. In other
words, it is to equip trainees with the skills to use Gender related information in planning,
execution and monitoring of day to day activities.
In addition:
Help trainees change their Gender serotype attitude
Helps to understand current situation in Ethiopia with regard to Gender
Helps the trainees understand the relationship between Health and Gender and the impact
of Gender on health services utilization
Content of Gender training manual
The Gender training manual has 3 main sections: facilitator manual, participant manual and
participants‘ note. The manual is prepared in accordance with the ministry‘s training manual and
it covers seven modules:
Module 1- This module deals with the conceptual definition of concepts related to Gender.
Module 2- focuses on national and international policies, guidelines, agreements and charters
will be discussed in detail. In addition, constitution of the FDRE, the family law, women related
policies and relevant concepts will be dealt with.
Module 3 – this module explains the relationship between Gender and Health. The impact of
Early marriage, Female Genital cutting, Sexual violence, etc on women health is presented in
detail. Moreover, it gives detail information on Gender mainstreaming.
Module 4 – this module contains Gender analysis and related concepts. Gender analysis
framework, Monitoring and evaluation, Gender analysis matrix etc are discussed in detail
Module 5 – it equips the trainee with knowledge and information on Gender audit
Module 6 – This module discuss concepts related with budget allocation for Gender. Trainees
will get acquainted with budget allocation, budget allocation strategies (approaches) levels and
related topics.
Module 7 – it analyses Gender and the health workers in Ethiopia
In coordination with the Human Resource Development Directorate, the Women and youth
Directorate has made efforts to maintain on job training manual standards of the ministry. The
training case team under the HRD was involved in testing content of the material. The Women
and youth directorate has organized a training session to receive feedback from the different

36
sector offices at federal and regional levels. Heads of Gender offices at regional and federal
sector offices were among the participants of the training where the manual is tested, input
gathered and incorporated. At the end, in September 2014, the manual was endorsed by the
FMOH, based on the evaluation result that confirmed standards of ministry.
End users of the Gender training manual
This manual can be used by all health workers in Ethiopia.
37
SECTION FOUR
ARTICLES (SUMMARY OF
EVALUTIONS,
OPERATIONAL RESEARCHES AND
RESARCHES)
38
1. Accelerated Plan for Scaling Up Prevention of Mother-to-Child
Transmission Services in Ethiopia, RAPID ASSESSMENT
Dr. Tadesse Ketema1 and Dr.Helina Kebede
2
1. Maternal and Child Health Advisor, [email protected]
2. Child Health Team Leader [email protected]
Introduction
In "2011, the number of HIV-positive adults (ages 15-49) in Ethiopia was estimated to be
approximately 800,000 including more than 38000 pregnant women.
Additionally, 182,249 children ages 0 to 14 were estimated to be HIV-positive, most having been
infected through mother-to-child transmission. New HIV infections were estimated at 24236
among adults and 13008 among children. Given the importance of vertical transmission of
HIV/AIDS in the country, the Government of Ethiopia (GOE) has given high priority to
prevention of mother to-child transmission (PMTCT). Strides have been made in the coverage
and quality of PMTCT services. For instance, PMTCT services expanded from 32 to 1,445
health facilities in just six years, between 2003/4 and 2010/11. Despite these achievements, 52%
of facilities offering maternal, newborn, and child health (MNCH) services do not include
PMTCT services as part of their service packages. Moreover, opportunities are often missed to
retain women in PMTCT services in settings where the services are available. In 2010/11,34% of
an estimated 2.9 million pregnant women were tested for HIV. Only 40% of those identified as
HIV-positive received antiretroviral (ARV) prophylaxis, and just 24% of HIV-exposed newborns
received prophylaxis.
This report presents the findings of a rapid assessment of the Federal Ministry of Health‘s
Accelerated Plan for Scaling up PMTCT Services in Ethiopia (AP), implemented during 2012.
The AP was undertaken to spur momentum toward achieving the 2015 targets set in the Fourth
Health Sector Development Program. The AP focused on rapid expansion of prevention of
mother-to-child transmission (PMTCT) service sites, improvements in service quality, demand
creation, and strengthening of monitoring and evaluation (M&E) systems.
Objectives of the assessment
The objectives of this assessment were to review the achievements of the PMTCT program under
the AP, and to identify the challenges encountered and opportunities for closing performance
gaps.
The objectives, which responded to the need to analyze progress during the first year of the plan,
were to:
Take inventory of achievements under the AP at the regional level in terms of human and
supply investments and implementation status.
Assess readiness to provide PMTCT services in facilities through the cascade of care.

39
Assess trends in indicators of PMTCT service utilization before and during
implementation of the plan.
Describe the experiences of community members engaged to increase access to and
demand for maternal, newborn, and child health (MNCH)/PMTCT services.
Study design
Data were collected in December 2012 and January 2013 in two cities and four regions
representing urban, agrarian, and pastoral contexts.
Eight members of the National PMTCT Technical Working Group were interviewed, as were 18
regional representatives, 121 directors of health facilities, and 121 service managers. Twenty
focus group discussions were held with members of the Health Development Army, members of
mother to- mother clubs, and male and female community members. Site assessments were also
conducted at 122 facilities.
The implementation of the AP focused on four major strategies: rapid expansion of PMTCT
service sites, improvements in the quality of MNCH/PMTCT services, demand creation, and
rollout of revised national guidelines. These four implementation strategies were to be supported
by enhanced M&E. This report focuses on experiences with the first three strategies and with
M&E.
Key findings
RAPID EXPANSION OF PMTCT SERVICE SITES
Regions approached the expansion of access to a full range of antenatal care (ANC) and PMTCT
services with a strategy of universal access. Respondents valued the participatory process used
during AP implementation. Implementation of the AP resulted in increased referrals by
community health workers, targeted information delivered through facility-based and
community-based means, staff trained, and stock in place to deliver new services.
HEALTH SYSTEM STRENGTHENING AND CAPACITY BUILDING
Supply chain management and coordination was challenging at the outset of the AP, with
delivery of appropriate supplies often lagging behind provider preparation and training. Ordering
supplies was seen as complicated and bureaucratic; facilities were sometimes forced to directly
procure drugs and supplies after approval by the regional board. Capacity building through
provider training was regarded as a highly successful collaboration with partners; mentoring was
noted to require further strengthening.
DEMAND CREATION
The efforts of the Health Development Army were widely acknowledged to be significant in
generating community awareness of key AP elements. Challenges in informing communities
about the improved services included poor coverage of local TV stations in large regions, lack of

40
access to TV among poor households, insufficient posters and leaflets for distribution, limited
activities from woredas and kebeles, and limited budgets.
QUALITY IMPROVEMENT, RESOURCE ALLOCATION, AND MONITORING AND
EVALUATION
A quality improvement process was initiated under the AP, and it will be a priority under the
follow-on plan to eliminate mother-to-child transmission. During resource allocation,
instructions differed as to the responsibility for budgeting at different levels of the health system.
Responses were mixed as to whether available resources were sufficient for the tasks undertaken
during implementation of the AP. M&E was a challenging process, as the former Health
Management Information System did not collect all the data needed to monitor the plan. Also,
the introduction of the new monitoring system for PMTCT parallel to the Health Management
Information System was delayed, resulting in the submission of incomplete and inconsistent
data.
CONCLUSION
Overall, the findings of the assessment are consistent with the successes and challenges
anticipated with the introduction of any new health program on a large scale. It is to be expected
that there will be variations in implementation across geographic areas and challenges in aligning
the functions of all inputs necessary for smooth system function, such as demand creation,
supply provision, enhanced staff skills, and collection and use of high-quality data for decision-
making. The findings further point to several key interventions that can be considered to improve
efforts to eliminate mother-to-child transmission in Ethiopia:
Audit the quality of data trending in the Health Management Information System.
Develop a standardized system for follow-up of referrals.
Strengthen the involvement of health extension workers in monitoring adherence to
antiretroviral therapy, retaining people with HIV/AIDS in care, and scheduling infant
testing.
Reinforce commodity management.

41
2. Second Round National First Line Anti Tuberculosis Drug Resistance
Surveillance in Ethiopia.
Eshetu Lemma, Beniam Feleke, Abebaw Kebede, Muluwork Getahun, Zelalem Yaregal,
Ribka Fantu, Yetnebersh Fiseha, Abyot Meaza, Zekarias Dagne
1. Ethiopian Public Health Institute Centers for Disease Control and Prevention-Ethiopia
Introduction
The first round national anti-tuberculosis drug resistance surveillance was carried out in 2003-
2005. The finding has showed that MDR level of 1.6% and 11.5% in new and previously treated
cases, respectively. As a follow up, the second round surveillance was started in December 2011
to determine the current level of drug resistant TB in Ethiopia.
Objective
The main objective of this project was to assess the magnitude of first line anti-tuberculosis drug
resistance of tubercle bacilli in Ethiopia.
Methodology
Cross-sectional survey conducted in newly diagnosed smear positive TB patients from 32
diagnostic health facilities during the period December 2011 to June 2013.The sample size for
new smear positive TB cases for the study was 1,614 proportionally distributed to the 32 survey
sites based on the smear positive case load from the previous year‘s report . All previously
treated TB patient identified during the study period were also included. All eligible participants
were interviewed in relation to their current and past TB status and treatment outcome history
using clinical form. HIV status data of the TB patients were obtained from the TB unit register.
Pre-ART register was also reviewed to collect IPT information for PLHIV. Sputum samples
were collected at the study sites and transported to National Referral Laboratory(NRL),
Ethiopian Public Health Institution(EPHI) for TB culture on Lowenstein–Jensen (LJ) medium
and DST by indirect proportion method and Line Probe Assay (LPA).Training was given to all
health professionals involved in the survey before the initiation of actual data and sputum sample
collection. All study health facilities participated in the regional AFB microscopy EQA program
(on-site supervision and blind rechecking). The NRL has participated in DST proficiency testing
(PT) from Uganda Supranational TB Reference Laboratory (SRL) during the survey. All MDR
and 10% of non-MDR Mycobacterium isolates were sent for rechecking to the current SRL,
Milan, Italy.
Result
A total of 1,796 smear positive pulmonary TB patients were enrolled from 32 diagnostic centers
in the study. Eleven(11) were rejected due to specimen leakage, inadequate volume, usage of
inappropriate specimen container and missing clinical forms. 119 (4 NTM, 47 negative, 65
contaminated, and 3 sample lost) were excluded from drug resistance analysis. Fifteen(15) more

42
were excluded because of invalid LPA result. A total of 1651 (1463 by proportion method, 188
by LPA) were available for final analysis of drug resistance. Of 1382 new smear positive TB
cases, 32(2.3%) were MDR TB cases and of 269 previously treated cases, 48 (17.8%) were
found to have multi drug resistance tuberculosis. A total of 80 strains among 1651 (4.8%) were
identified as multi drug resistant TB and out of 76 MDR TB cases that had known HIV status 22
(29%) were HIV positive.
Conclusion
The result shows that the increment of MDR TB in both new and previously treated cases from
the first round anti TB drug resistance survey back in 2005. HIV is significantly associated with
MDR TB among new TB cases and female are at high risk of getting MDR TB than male.
Acknowledgment
The project was financially and technically supported by CDC, WHO and FIND.

43
3. The Social Perceptions Inhibiting the Utilization of Skilled Birth Care
among Mothers in Amhara, Ethiopia: the Social Mountains claiming
Maternal Lives Christian Tadele Tsegaye Chief Officer at Health Extension Program and Primary Health services Directorate
E-mail: [email protected]/[email protected]
Introduction
Maternal mortality has become challenging to the global health. There is no exception in Africa
including Ethiopia. Skilled birth attendance is the most effective strategy to assure safe and
successful delivery which helps for the health of both a mother and a child. However, the
utilization of skilled birth care in Ethiopia is reasonably very low.
Methods
The study is a qualitative study. Purposive sampling procedure was used. Data were collected by
open ended topic guide using in-depth interviews and FGDs. Open Code software was used for
data coding and categorization.
Results
The findings showed that influence of grandmothers and mother-in-laws, maintaining generation
old practice of home delivery and perceived inhospitality of HFs and HPs are the major factors
highly affecting skilled birth care utilization. Unfavorable social perceptions towards pregnancy
and delivery, dominant value of home delivery and desire to maintain it along with its
idiosyncratic rituals being the corner stone fueled by poor quality and ―inconvenient‖ services
provided at health facilities were found major factors inhibiting the utilization of skilled birth
care.
Conclusion
Factors affecting skilled birth care utilization are related to maintaining the dominant practice
and values of home delivery, influence of grandmothers and mother-in-laws and perceived
inhospitality of HPs and HFs. Therefore, community led dialogue, discussion and awareness
raising initiatives targeting grandmothers, mothers-in-laws, mothers and husbands to re-engineer
the social perceptions is recommended. Refreshing trainings to HPs on ANC counseling,
customer handling and health communications are also advised. Rituals surrounding pregnancy
shall also be allowed to be executed inside HFs compounds. Sex of midwives at health facilities
shall be considered too. Community preferred female midwives.
Key words
Institutional Delivery, Skilled Birth Care, Maternal Health, Ethiopia, MDG 5
44
4. The Intra-uterine Contraceptive Device (IUCD) revitalization initiative
Midterm Evaluation
Dr.Martha Minwuyelet1 and Berhane Assefa
2
1. Maternal Health Team Lead, email [email protected] phone
2. FP Officer, email [email protected]
Introduction
This report describes the findings from a midterm evaluation of the Intra-uterine Contraceptive
Device (IUCD) revitalization initiative conducted by the Federal Ministry of Health (FMOH)
and developing partners. Developing partners provided financial and technical support to the
FMOH to conduct a process evaluation of the initial phase of the IUCD initiative with two main
purposes: 1) to determine if women are being targeted effectively by IUCD information
campaigns and materials, and 2) to consolidate lessons learned from the initial implementation in
116 woredas to guide the national expansion.
The mid-term evaluation was conducted in Amhara, Tigray, Southern Nations Nationalities
People (SNNP), Oromia, Addis Ababa and Dire Dawa. The lessons learned from this initial
phase provide guidance to the FMOH and implementing partners in developing strategies to
improve family planning (FP) services and increase IUCD uptake in health facilities. The results
also contained in this report also support making of informed programmatic decisions during
scale-up.
Data were collected using quantitative and qualitative methods. Quantitative data collectors
conducted facility inventories, collected service statistics, and administered provider and female
client interviews at selected hospitals and health centers. Additionally, in-depth interviews were
conducted with HEWs and family planning sub process owners/case team members at regional,
zonal and woreda health offices.
Results from the facility inventory, service statistics, provider interviews and client interviews
are presented in tables stratified by health facility. The evaluation was conducted in a total of 120
health facilities, which included 18 hospitals, 34 urban health centers and 68 rural health centers.
Key results
Provider-Related Findings
Provider Training and Facility Readiness to Provide IUCD
Prior to January 2010 when the IUCD initiative was launched, 18 providers from hospitals in the
evaluation locations had received training in IUCD services. These providers included clinical
nurses, midwives, health officers and general practitioner/specialists. Following the launch of the
initiative, 28 providers at hospitals had received IUCD training. At health centers, a total of 29
providers in urban and 56 providers in rural health centers had received IUCD training before
45
January 2010, but 100 providers in urban health centers and 74 in rural health centers received
training in IUCD services after January 2010. This results show a substantial increases in the
number of providers trained after January 2010: 55% increase in hospitals, over 200% increase
in urban health centers and 32% increase in rural health centers.
A total of 221 trained and certified providers in IUCDs services were reported at the surveyed
facilities: 18% in hospitals, 46% in urban health centers and 37% in rural health centers. Health
professionals who were trained but not certified to provide IUCDs were fewer in number at 75:
13% in hospitals, 17% in urban health centers and 69% in rural health centers. On the day of the
survey, a total of 168 full-time trained and certified providers were physically present across the
three facility types: 26 in hospitals, 67 in urban health centers and 75 in rural health centers.
In terms of family planning methods usually provided, facilities had a combination of short-
acting and long-term methods. In urban health centers, more than 90% provided all methods
except emergency contraceptive pills (ECPs; 79%) and Trust implants (76%). In rural health
centers, injectables were reportedly provided in all 68 rural health centers. Oral Contraceptive
Pills (OCPs), Implanon and condoms were available in over 90% of these health centers, while
IUCDs were available in 79%. Related to stock-outs in the last six months, very few facilities
were without IUCDs. Only one hospital, one rural health center and one urban health center
reported that they had experienced stock outs of that method at some point in the last six months.
Pills and implants were more likely to have been out of stock in the last six months, but with the
exception of Jadelle and Implanon, most methods did not experience notable stock-outs.
Service Statistics
Service statistics on insertion and removal of long-acting family planning (LAFP) methods were
collected for the calendar year 2012 only. A total of 4,202 insertions of the IUCD or implants in
the 18 hospitals were determined. The majority of the insertions at hospitals (56%) were for
Implanon, and 20% were for the IUCD. In health centers, 31,888 insertions of any LAFP
methods were conducted, of which 48% were for Implanon 25% for IUCD insertions. Removals
for LAFP methods were also evident. Records at the hospitals indicate 923 removals of Implants
and IUCD at hospitals, the majority being for Implanon (66%) followed by IUCD (12%), and
5,604 removals at health centers, again the majority being for Implanon.
Provider Capacity
Providers were selected to participate in interviews from the three types of facilities (hospitals,
health centers and health posts). Thirty providers in hospitals, 67 in urban health centers and 87
in rural health centers were interviewed for a total of 184 providers from the 120 facilities. The
majority of providers were female and married. In rural health centers, however, the proportion
of male and female providers was almost equal (47% and 53%, respectively), as were married
and single providers in both types of health centers. None of the providers interviewed was a
medical doctor. In urban health centers, 18% of providers were health officers. The average
length of time working as a health service provider was 10 years for hospital-based providers, 9
years for those in urban health centers and 5 years for those working in rural health centers. With
regard to average length of time working in their current facility, hospital providers reported 7
years, their urban health center counterparts 5 years, and rural health center providers 3 years.
46
Providers reported providing IUCD insertions regularly. Health center providers reported higher
average insertions in the past year than hospital providers: 48 by urban and 37 by rural health
center providers, which averages to approximately three to four IUCD insertions per month.
Overall, there are many more insertions of LAFP methods than removals, and more implant
removals than IUCD removals. This is indicative of the timeframe between the revitalization of
LAFP methods and the evaluation timeframe. The Implanon initiative started end of 2009, while
the IUCD initiative started in 2010. This likely explains why the majority of providers
interviewed (58%) reported that they had not performed any IUCD removal. Providers were also
asked about their level of comfort and interest in providing IUCD services. Over two-thirds of
providers who were asked about their comfort level reported being very comfortable providing
IUCD insertions. Another 12% said they were somewhat comfortable. A similarly large number
of providers across the facility types said they were very interested in providing IUCD services.
Providers appeared knowledgeable about the conditions that should be checked or ruled out
before inserting the IUCD. The majority in both hospitals and health centers mentioned
pregnancy, infection and cervical or endometrial growth--with health center and hospital
providers reporting these conditions in similar proportions.
When asked about supportive supervision, hospital providers were less likely to report having
received supportive supervision than their health center counterparts in the past year. Further,
while the majority of health center providers reported receiving supportive supervision specific
to FP and IUCD services, less than half of hospital-based providers did so.
Provider experience of the IUCD revitalization initiative
Providers were asked to describe what they considered the challenges and successes of efforts to
expand IUCD services. Quite a few challenges were mentioned by providers, however, the most
common challenge frequently cites was the lack of awareness or knowledge of the IUCD. A
notable proportion of these providers (21%) also said that there were no challenges to expanding
IUCD services.
Successes reported by providers were just numerous. Demand creation was more likely to be
cited as a success by hospital providers than health center providers, while creating community
awareness of IUCD services was mentioned more often by health center providers than their
hospital counterparts as a success.
Facility Client’s Findings
A total of 1,186 women were interviewed, with 85% intercepted at health centers and the rest in
hospitals. These results are based on female clients aged 15-49 who were seeking healthcare
services on the day the evaluation team visited the health facility. For this reason, interpretation
of the findings is restricted to facility clients, and may not be a reflection of the findings that
could be obtained from population-level survey. Most hospital clients and urban health center
clients were interviewed in Oromia and Addis Ababa, while in rural health centers Amhara,
Oromia and SNNPR predominated.

47
Women’s knowledge, use and experience FP methods and services
Only 4% of the women interviewed reported not knowing any FP method. The remaining 96% of
women across facilities reported awareness of injectables (94%), OCPs (86%), implants (80%),
the IUCD (60%), condoms (32%), emergency contraception (7%), and unspecified others (2%).
This pattern held for the health centers, but women interviewed at hospitals were just as aware of
IUCDs as they were of implants (79% and 78%, respectively). With regard to use, 25% of
women reported that they had never used a modern FP method. Of these, 27% were clients
sampled from urban health centers, 24% were sampled from hospitals and 22% were sampled
from rural health centers. Fewer than 10% of women were currently using OCPs. Implants
superseded OCPs in current use, but injectables maintained predominance. Although 60% of the
women reported knowledge of the IUCD, only 4% had ever or were currently using it.
Out of a total of 716 women who had ever heard of or knew about the IUCD, only 3% had ever
used it (but discontinued use) and 4% were current users. Thus, a total of 7% of women were
asked to share their direct experiences with IUCD. These women were also asked about their
source(s) of information about the IUCD. The health facility was the dominant source of
information (61%), followed by TV (42%). Additionally, 31% mentioned a friend/relative, and
the same percentage also mentioned radio as a source of information about IUCD. Health
Extension Workers (HEWs) were mentioned by 22% of the women as a source of information
about IUCD overall, but women from rural health centers were more likely to mention HEWs,
while TV and radio were more common non-health facility sources for hospital and urban health
center clients.
Women‘s attitudes towards IUCD, regardless of their experience with the method, were obtained
to determine if information campaigns and Information, Education and Communication (IEC)
materials were effective. The most positive thing about IUCD for nearly 60% of the women was
the fact that it prevented pregnancy for a long time. With the exception of the view that IUCD
increases the risk of infection, stated by 10% of the women, all other negative opinions were
stated by less than 10% of the respondents.
With regard to spousal consent, 92% of the women interviewed were affirmative that their
partner should approve before she uses the IUCD. This suggests the direction that the IEC
materials, community mobilization and counseling should address men as much as they address
the women.
Conclusion
In conclusion, the points to a number of successes in the initial phase of the IUCD initiative and
provide lessons that should be taken into consideration during the expansion phase. The strong
interest by the providers, the low level of negative opinions, low stock-outs of IUCD and other
FP methods—all these factors point to a positive environment for IUCD scale-up.

48
5. Routine Data Quality Assessment (RDQA) 2014
Mr. Noah Elias1, Mesoud Mohammed,
2Dr. Alemayehu Belayneh
3, Mr. Hailu Dawo
4, Mr. Habtamu
Tesfaye5
1. Policy Plan Director, FMOH, [email protected].
2. Assistant Director for PPD, FMOH [email protected].
3. Health Information System Advisor, FMOH, [email protected].
4. Monitoring and Evaluation Senior Officer, FMOH, [email protected],
5. Monitoring and Evaluation Senior Officer, Policy Plan Directorate, FMOH,
Introduction
In an effort to strengthen the country health information system, Ethiopia has undertaken an
extensive reform and re-design of the health management and information systems. The reform
has taken major steps in response to the lack of accurate, timely and complete data that
consequently affected the quality of care, planning and management systems as well as the
decision making by the managers at all levels in the health care systems.
The quality of reported data and use of information for action is dependent on the underlying
data management and reporting systems; stronger systems should produce better quality data. In
other words, for good quality data to be produced by and flow through a data management
system, key functional components need to be in place at all levels of the system.
The assessment covered a total of 91 district and town health offices and, 214 health facilities
(182 health centres and 32 hospitals) all RHBs and FMOH. The fourth quarter of EFY 2005 was
agreed for review of data. The findings of the study are summarized below.
Objective: To verify the quality of reported data, assess the data management and reporting
systems and level of information use for decision making.
Study design: Cross sectional study design was employed using both quantitative and qualitative
approaches. Cluster sampling technique was employed i.e primarily woreda (Clusters) were
selected using simple random sampling and health facilities sampled accordingly.
Indicators, data sources and reporting period: The study assessed the quality of data and
underlying systems related to indicators that are considered to be key national indicators during
the specific reporting periods. Due to practical constraints, only eight indicators that are critically
needed at sub-national and national as well as international reporting and decision making
purpose were considered..
Study tools and procedures: The assessment was done using the revised WHO guideline on
routine data quality assessment tool (WHO DQS 2009). The assessment therefore included
following two protocols:
Data Management and Reporting Systems Assessment Protocol: which help identify
potential challenges to data quality created by the data management and reporting systems at the
three levels (Service delivery unit, intermediate aggregation level where reports from service
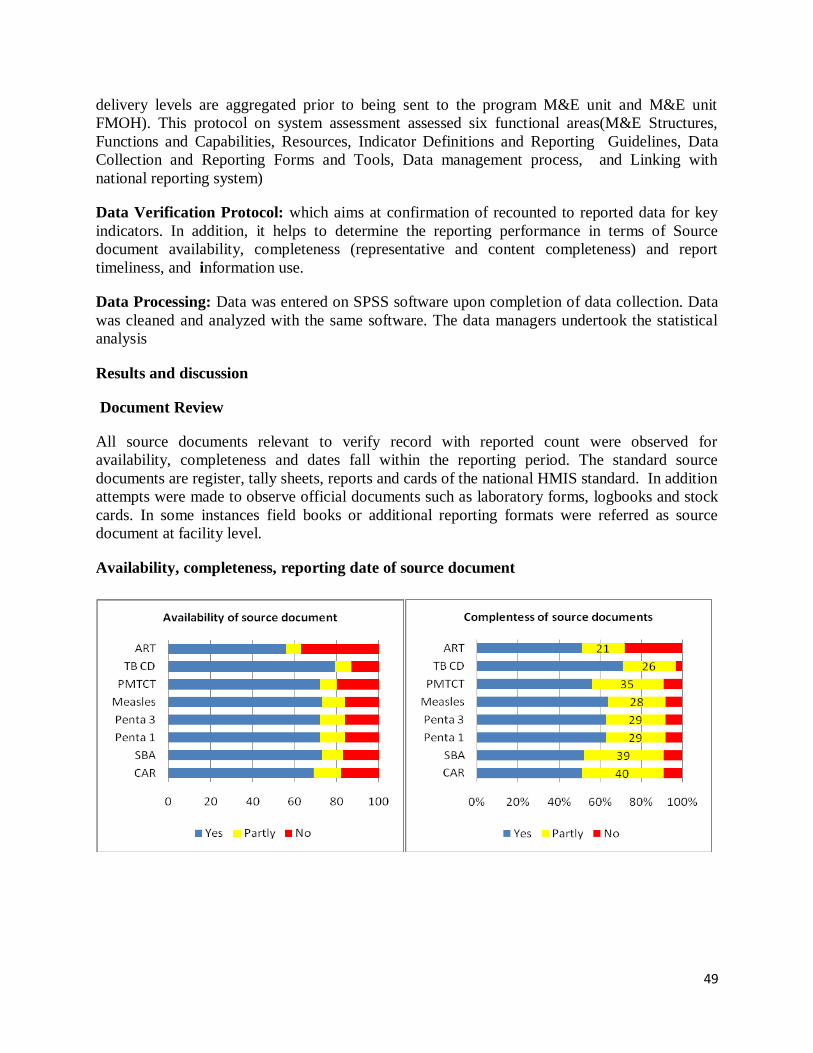
49
delivery levels are aggregated prior to being sent to the program M&E unit and M&E unit
FMOH). This protocol on system assessment assessed six functional areas(M&E Structures,
Functions and Capabilities, Resources, Indicator Definitions and Reporting Guidelines, Data
Collection and Reporting Forms and Tools, Data management process, and Linking with
national reporting system)
Data Verification Protocol: which aims at confirmation of recounted to reported data for key
indicators. In addition, it helps to determine the reporting performance in terms of Source
document availability, completeness (representative and content completeness) and report
timeliness, and information use.
Data Processing: Data was entered on SPSS software upon completion of data collection. Data
was cleaned and analyzed with the same software. The data managers undertook the statistical
analysis
Results and discussion
Document Review
All source documents relevant to verify record with reported count were observed for
availability, completeness and dates fall within the reporting period. The standard source
documents are register, tally sheets, reports and cards of the national HMIS standard. In addition
attempts were made to observe official documents such as laboratory forms, logbooks and stock
cards. In some instances field books or additional reporting formats were referred as source
document at facility level.
Availability, completeness, reporting date of source document
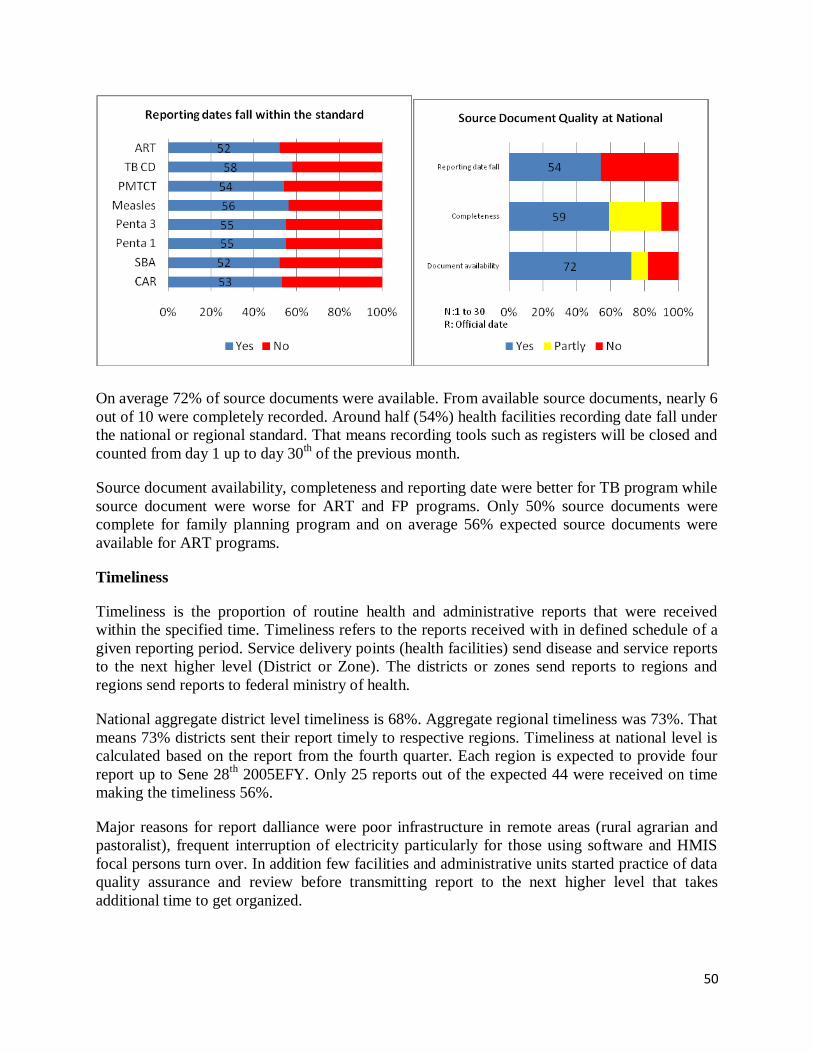
50
On average 72% of source documents were available. From available source documents, nearly 6
out of 10 were completely recorded. Around half (54%) health facilities recording date fall under
the national or regional standard. That means recording tools such as registers will be closed and
counted from day 1 up to day 30th of the previous month.
Source document availability, completeness and reporting date were better for TB program while
source document were worse for ART and FP programs. Only 50% source documents were
complete for family planning program and on average 56% expected source documents were
available for ART programs.
Timeliness
Timeliness is the proportion of routine health and administrative reports that were received
within the specified time. Timeliness refers to the reports received with in defined schedule of a
given reporting period. Service delivery points (health facilities) send disease and service reports
to the next higher level (District or Zone). The districts or zones send reports to regions and
regions send reports to federal ministry of health.
National aggregate district level timeliness is 68%. Aggregate regional timeliness was 73%. That
means 73% districts sent their report timely to respective regions. Timeliness at national level is
calculated based on the report from the fourth quarter. Each region is expected to provide four
report up to Sene 28th
2005EFY. Only 25 reports out of the expected 44 were received on time
making the timeliness 56%.
Major reasons for report dalliance were poor infrastructure in remote areas (rural agrarian and
pastoralist), frequent interruption of electricity particularly for those using software and HMIS
focal persons turn over. In addition few facilities and administrative units started practice of data
quality assurance and review before transmitting report to the next higher level that takes
additional time to get organized.

51
Data verification (accuracy):
Data accuracy ratio (verification factor) is computed as the proportion of recounted values (from
source documents) over the reported value (to the next higher level).
Facility aggregate verification factor is computed for each region by sum up the recounted values
for the verified sites and divide by the sum of the reported values for the verified sites. Same
procedure is followed to compute the national level facility aggregate verification factor.
Facility aggregate/ combined verification factor, EFY2005
0.60
0.930.86 0.82
0.74
1.22
0.87
0.00
0.20
0.40
0.60
0.80
1.00
1.20
1.40
CAR SBA Penta 1 Penta 3 Measles TB CD ART
Health facility aggregate VF , 2005
VF
As show In the above figure, CAR, Penta 1, 3 and Measles combined reports had a tendency to
be exaggerate. CAR takes the lead to over report, being 0.60 combined facility verification
factor. In contrary, detected TB cases were under reported with a combined verification factor of
1.22. To clearly demonstrate the inconsistency of reporting let us take Penta 3 and Measles.
M&E Structure, Functions and Capabilities
On average fulltime HMIS focal person was assigned in 61.7% of facilities. Of them 25.7 were
HIT graduates. Regarding training of facility staff, only 18.3% (one in five) facilities had at least
75% trained staff at the time of data collection. While nearly four in ten facilities had less than a
quarter trained staffs. All facilities provide 24houre service, however 41.6% did not open their
medical card room at night.
Input/Resource
HMIS unit, budget, card room size, availability of card room worker and runner, standard
shelves, computer and receipt of supervision with feedback are inputs to establish and sustain
HMIS system. We found an index of 0.43 for input component. Hospitals performed well than
health center in availability of card room workers, runners, computers and HMIS unit. On
average functional computer was available in three fourth of facilities. As table 1.2 shows, 57.9%
facilities received HMIS focused supportive supervision from outside organ while only 28.0%

52
had written feedback. Around one third facilities allocate budget for HMIS activity. Around
three fourth health centers did not have runner.
Data Collection and Reporting Forms, Tools and Guidelines
Data collection tools and guideline availability, consistent use and knowledge of HMIS focal
person on procedure and analysis of priority indicators were assessed. Data collection index for 9
key variables was 0.63. One month stock of cards, registers and tally sheets was available nearly
for half of health facilities.
The standard forms/tools were consistently used by three fourth of health facility and nearly half
of health facilities were using additional "unofficial" forms, registers, tally or reports.
On average 57% facilities (53.3% HC and 78.1% hospital) had HMIS recording, reporting,
indicator and information use guidelines.
HMIS focal person were tested whether they knew the recording and reporting procedures and
indicator calculation taking FP and ANC indicators. Nearly half of the focal persons knew
recording and reporting procedures and said the can calculate indicator (53.7%). However,
40.7% of focal persons were able to calculate indicators. That means, 13.7% focal persons
showed confidence in indicator calculation but were not able to do so.
Data Management Processes
Data Management Processes at health facility level was assessed using six key variables. Data
management process index was 0.57 or 1.7 with WHO standard. It is in yellow zone. Ten
Individual folders were taken randomly from medical record unit to check all visits medical
record. We found a quarter of (25.2%) facilities have at least 8 complete client records out of the
expected ten records. None of client records were complete in 18.8% facilities.
Eight out of ten facilities were recording on registers promptly upon service delivery. Hospitals
were performing well than health centers in immediate recording on registers up on service
delivery. It was 93.8% in hospitals and 79.1% in health centers. Expert interview revealed, health
centers prefer to tally before writing on register in time of high client flow particularly for
immunization program. To assess whether ―data and medical charts are kept confidential‖,
observation and interview were made to know if client has a chance to hold their integrated
folder, individual folder was returned to MRU immediately and whether the facility has runner.
We found six out of ten facilities kept medical record confidentially. Hospitals (81.2%) were
more concerned on keeping confidentiality than health centers (57.1%).
Observation was made whether facilities regularly check consistency of report with record in
source documents using standard lot quality assurance sampling (LQAS). We found more than
half of hospital and one third health centers were performing LQAS as per standard on monthly
basis and document the finding. On average 36.4% facilities were performing LQAS.
Availability of copy of at least one year report submitted to next higher level was observed. On
average 79.9% facilities kept copy of report sent to WoHO, ZHD or RHB. Hospitals performed
better than health centers.

53
Links with National Reporting System
Linkage with national reporting system was assessed using three key attributes that relate to use
of official recording, reporting tools and identification of service delivery points. We found all
hospitals and 95.6% health centers were using relevant national forms/tools are for data
collection and reporting. Around 7 out of 10 facilities were report through a single channel of the
national information systems. In other word only 28.5% facilities were reporting to stakeholders
including developing partners in addition to the report sent to district, zone, and region health
office. All hospitals and 92.9% health center report has identification that helps to trace facilities
from the report. Linkage with national system index was 0.86 (2.59 with WHO standard) for
health facilities.
Information Use
Level of information use culture was assessed using six key variables that start from realistic
planning, identification of problem and monitoring of execution of decisions regularly. An index
(aggregate value) is computed for all variables, giving zero for ―No‖ response, 0.5 for ―Partly‖
and 1 for ―Yes‖. The result of an index is transformed in to three to standardize with WHO
values to assess all system together in a spider diagram. Information use index is 0.54. The index
is transformed in to 1.62 into WHO standard.
84.6% of health facilities were use demographic data from sources such as survey, census, etc for
planning. Health centers perform well than hospitals in use of demographic information for
planning. Only one third (33.6%) of Performance Review team analyze report were using plan
vs. achievement and discuss HMIS finding on monthly basis. Half of facilities were never used
compared plan with achievement for performance review meetings.
Around two third (69.6%) facility were not developing action plan for recommended activities
and disseminate to responsible bodies while around a quarter (28.5%) of facilities document and
follow execution of decisions. Display of information is assessed by observing case teams and
head offices. The types of data displayed and whether the data were updated for the last reporting
period was rated in to ―yes for 14 data elements‖, ―Partly for 7-13 data elements‖ and ―No for <7
data elements‖ categories (Annex 1.1). Around half (47.2%) facilities were displaying updated
information on monthly basis. Around one fifth health centers and one third hospitals were never
displayed updated information on monthly basis.

54
Summary of System Component
Summary of system components at health facility level, 2005
1.63
1.28
1.88
1.70
2.59
1.62
0.00
1.00
2.00
3.00
M&E Structure and Capabilities
Resource
Collection and Reporting
Data Management Processes
Links with National System
Information Use
HMIS systems performance, 2005Green, 2.5 - 3.0
Yellow, 1.5 - 2.5
Red, < 1.5
The above two Figures show the summary of system component as an index from 1 and rated
from 3 in accordance with WHO standard. The information use component is included in the
system component as it is believed to increase data demand there by data quality. FMOH need to
focus more effort on resource component (1.28), M&E structure, function and capability (1.62)
and information use (1.63).
Limitation
Limitations pertinent to getting data from registers, reports and log books were both challenges
and findings for this kind of information system assessment. Therefore major challenges in data
collection process are discussed below.
Few facilities were closed at the time of data collection, hence replaced by other facilities
Satellite health posts were not assessed to understand data accuracy at primary health
care unit
Conclusion
Facility combined verification factor was VF= 0.77 that show a tendency to over report except
TB program. In TB program on average one out of five cases detected were not reported from
health facility.
On average seven out of ten facilities avail documents. The standard source documents such as
register, tally sheets, reports and national HMIS standard guidelines were available in most of the
sites visited. Documentation and source document availability for easy retrieval found to be
encouraging at all service delivery sites.
Similarly seven out of ten districts receive timely report from health facilities. Performance
varies across regions. However there were challenges in reporting date fall within agreed time of

55
month across regions. FMOH need to focus more effort on resource, M&E structure, function
and capability and information use components.
The result revealed ―District‖ as the weakest entities in HMIS scale up (supervision, budget,
structure, capacity) and Hospitals relatively performing well than HC. Lesson learned particular
from the third RDQA is ―Data use, demand data quality that in turn demand robust HMIS‖.
Recommendation
Improve HMIS data quality (Strengthening Data management & processing, LQAS at
facility level, and RDQA at district and RHB level).
Strengthen performance review team (Revisit mandate and procedure, Support district
and region level HMIS review meeting and Provide training on new information use
guideline).
Strengthen HMIS and Program collaboration (HMIS data generation & processing, Data
quality assurance and use and Sensitization).
Build capacity of HMIS focal person and other Professionals (Audio- visual material
procedure, ISS (HMIS component enrich, DQA as entry point to facility), Strengthen
Mentorship (Minimum standard, facility presence all partner), Pre _ service training, Job
Aids and Best practice.
Strengthen Partnership, private facilities, agencies and associations. Through TWG,
NAC, Partners forum, public wing.
Strengthen e-HMIS
Strengthening standardized, well documented recording and reporting formats and
information flow to avoid inconsistent results and poor data quality.
Include HMIS in Command posts agenda and follow the execution.

56
6. Quality of Medicines in the Ethiopian Pharmaceutical Market
(Extracted from the Assessment report of Substandard/Counterfeit drugs in
the Ethiopian Pharmaceutical Market by EFMHACA and WHO)
Wondie Alemu1
1. Plan and Project Coordination Directorate Director, EFMHACA, [email protected],
Background: There is global concern about regulating the quality, safety and efficacy of
medicines. The Ethiopia health sector is organized in three pillars; provider, purchaser and
regulator, In accordance with Proclamation No. 661/2009, the Ethiopian Food, Medicine and
Healthcare Administration and Control Authority (EFMHACA) is provided with a mandate to
regulate the 4Ps (Practice, Premises, Professionals and Products) so as to protect the public from
poor quality products and services. To execute its mandate of ensuring the quality of products
and services it carries out different activities including but not limited to assessment of safety,
efficacy and quality (evaluation and registration system) of products.
The threat of counterfeiting appears to be invisible due to its nature as well as the neglect it has
suffered over the years from the stakeholders involved in the pharmaceutical supply chain. This
problem is particularly important in many developing countries due to inadequate regulatory
system as well as an increased burden of both communicable and chronic disease among other
numerous public health issues. Unfortunately, the exact extent of this problem and therefore how
best to combat it, is unknown and this study was conducted to see the magnitude of the problem
in Ethiopia as well as to forward some recommendations.
Objectives: the present study was undertaken to provide evidence on the existence of
substandard/counterfeit medicines in the Ethiopian market and to propose strategies to combat
medicines counterfeiting in Ethiopia.
Methods: This was a cross-sectional descriptive study carried out in selected sites of Addis
Ababa, Afar, Amhara, Diredawa, Harai, Oromia, SNNPR, Somali and Tigray. Survey
questionnaires were used to gather pertinent information on regulatory capacity and
representative medicines selected based on defined criteria during sample collection.
Sampling criteria to include a drug in the survey was: inclusion in the country‘s list of essential
drugs; high consumption rate compared to other medicines; therapeutic importance in relation to
morbidity pattern; availability of oral dosage form of the study medicine; medicines of erratic
supply and medicines of relatively expensive price. Accordingly, 19 types of medicines were
selected.
From these 19 types of medicines 319 samples /data were collected between 10 July and 10
August 2013., then subjected to appropriate qualitative and quantitative tests to determine the
identity and amount of active ingredient present in the product. Drug quality was measured by
level of active ingredient as percentage of stated content and by compliance (pass/fail) with
pharmacopeial standards. Association of failure with type of products and source of samples was
established using Chi square test.
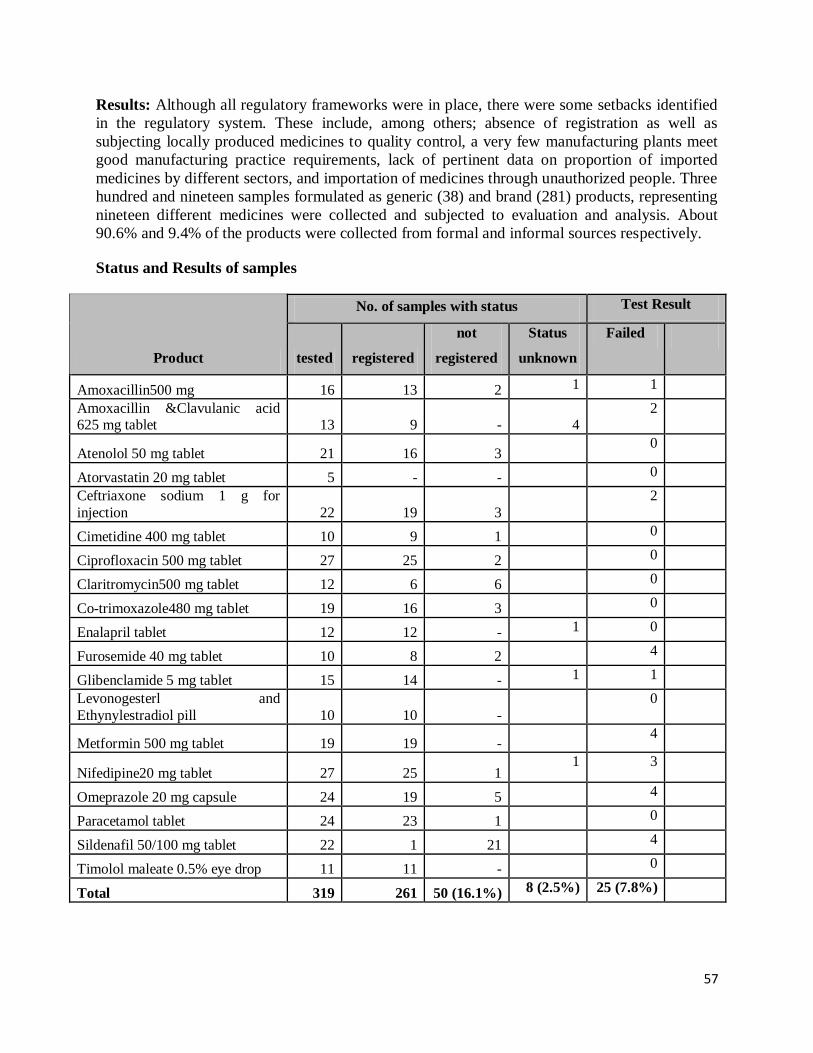
57
Results: Although all regulatory frameworks were in place, there were some setbacks identified
in the regulatory system. These include, among others; absence of registration as well as
subjecting locally produced medicines to quality control, a very few manufacturing plants meet
good manufacturing practice requirements, lack of pertinent data on proportion of imported
medicines by different sectors, and importation of medicines through unauthorized people. Three
hundred and nineteen samples formulated as generic (38) and brand (281) products, representing
nineteen different medicines were collected and subjected to evaluation and analysis. About
90.6% and 9.4% of the products were collected from formal and informal sources respectively.
Status and Results of samples
Product
No. of samples with status Test Result
tested registered
not
registered
Status
unknown
Failed
Amoxacillin500 mg 16 13 2 1 1
Amoxacillin &Clavulanic acid 625 mg tablet 13 9 -
4
2
Atenolol 50 mg tablet 21 16 3 0
Atorvastatin 20 mg tablet 5 - - 0
Ceftriaxone sodium 1 g for
injection 22 19 3
2
Cimetidine 400 mg tablet 10 9 1 0
Ciprofloxacin 500 mg tablet 27 25 2 0
Claritromycin500 mg tablet 12 6 6 0
Co-trimoxazole480 mg tablet 19 16 3 0
Enalapril tablet 12 12 - 1 0
Furosemide 40 mg tablet 10 8 2 4
Glibenclamide 5 mg tablet 15 14 - 1 1
Levonogesterl and
Ethynylestradiol pill 10 10 -
0
Metformin 500 mg tablet 19 19 - 4
Nifedipine20 mg tablet 27 25 1 1 3
Omeprazole 20 mg capsule 24 19 5 4
Paracetamol tablet 24 23 1 0
Sildenafil 50/100 mg tablet 22 1 21 4
Timolol maleate 0.5% eye drop 11 11 - 0
Total 319 261 50 (16.1%) 8 (2.5%) 25 (7.8%)

58
Out of the 25 samples that fell short of complying pharmacopeial specifications, 18 (72%) were
collected from formal and 7 (28%) from informal sources. Failure to meet pharmacopeial
specifications did not seem to be affected by the type of product (Generic vs. brand), source
(formal vs. informal) and by the site of collection.
Conclusion and Recommendations: The data generated from this study indicate the presence of
substandard products among the investigated products in the Ethiopian market. Nevertheless, the
prevalence of substandard medicines appeared to be of lower magnitude compared to other
developing countries. The problem of low quality medicines can have important implications not
only on the everyday practice of healthcare providers but also erodes public confidence in the
healthcare industry. Capacity of the regulatory system appeared to be not that strong and due
attention should be paid so that it could restore public confidence.
Based on the findings the following recommendations have been made:
Including elements of basic knowledge on rational use of drugs and drug quality in public
education campaigns, to increase awareness and demands for drug quality.
Strengthening the enforcement of pharmacy regulations in order to be able to trace the
sources of drugs in both formal and informal markets, enabling sanctions when appropriate.
Registration of drugs should be mandatory regardless of the source of the product.

59
ANNEX 1
1. Summary of 2006 EFY Basic Health Indicators: Selected HSDP IV
Indicators and Health Related MDG indicators
1.1. Summary of 2006 EFY Basic Health
Indicators
Indicator 1999 2000 2001 2002 2003 2004 2005 2006
Improve maternal health
Contraceptive acceptance rate 34.8 53.9 56.2 61.9 61.7 60.4 59.5 63.0%
Antenatal care coverage (first visit ) 52.1 61.2 97.7 71.4 82.2 89.1 97.4 98.1%
Percentage of Deliveries assisted by Skilled Health personnel 16.1 20.7 18.4 16.8 16.6 20.4 23.1 41.0%
Postnatal care Coverage 19.2 25.9 34.3 36.2 42.1 44.5 50.5 66.2%
Child Health
live birth weighing < 2500gm 11086 337490 44079 134993 36218
Moderate Malnutrition in < 3 yrs 350017 925971 930527 1038986 1051322
Sever malnutrition in < 3 yrs 52970 98515 145183 189546 189800
HC providing IMNCI service 548 930 1237 1713 2031 2373 2967
Penta 3 immunization Coverage 76.8 85.4 81.6 86 84.7 84.9 87.6 91.1%
PCV 3 Immunization Coverage 44.4 80.4 86.0%
Measles immunization coverage 68.4 75.9 76.6 82.4 81.5 79.5 83.2 86.5%
Fully immunization coverage 56.8 66.4 65.5 72.3 74.5 71.4 77.7 82.9%
Disease Prevention and Control
TB and Leprosy
TB case Detection rate 32 33.9 34 36 36.8 71.8* 58.9* 53.7%*
TB treatment success rate 85 84 85.6 84 83.6 90.6 91.4 92.1%
TB cure rate 69 67.4 67 65.2 66.5 68.2 70.3 69.1%
New cases of Leprosy 4179 4414 4302 4430 4153 2929 3224 3080.00
HIV/AIDS
Person Ever Enrolled in HIV Care 164560 266507 376772 473772 580919 666147 744339 805948
Persons Ever Started on ART 97299 150136 208784 268934 33434 379190 439301 492649
Persons Currently on ART 73124 109930 152472 207733 247805 274708 308860 344344
Hygien and Environmental Health
Latrine coverage 37 60 74.9 86 84.1 85.6 82.9%
* TB CDR (all forms)
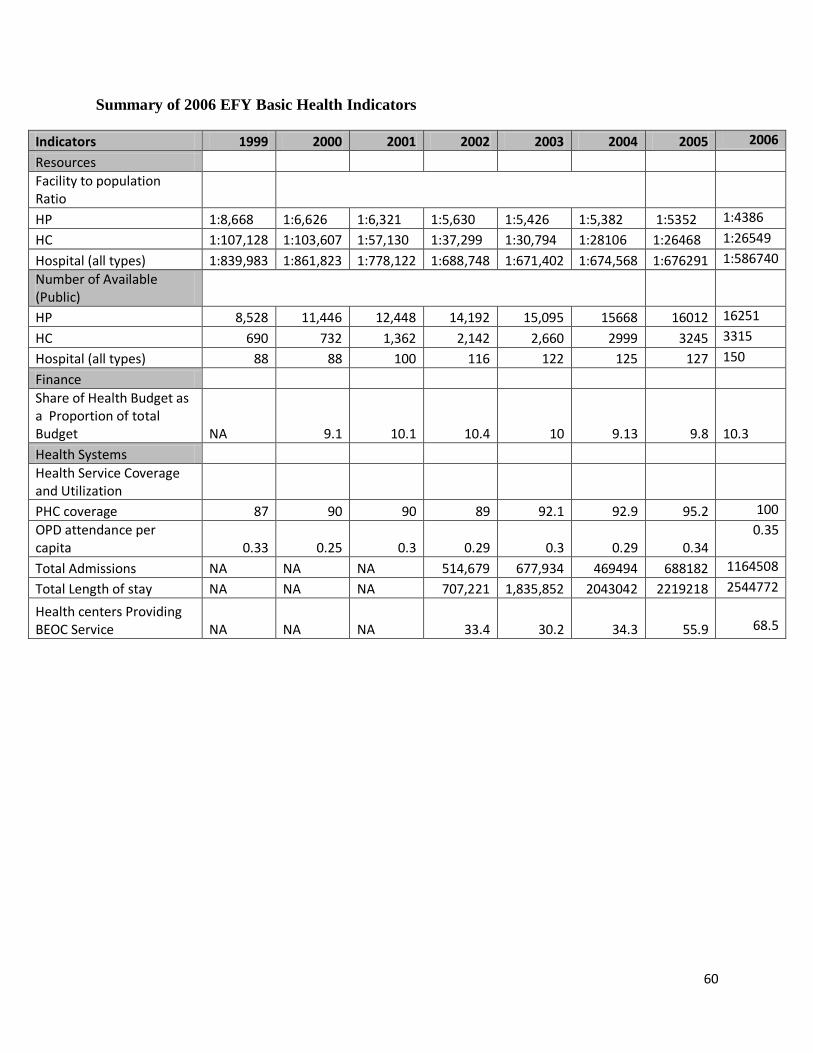
60
Summary of 2006 EFY Basic Health Indicators
Indicators 1999 2000 2001 2002 2003 2004 2005 2006
Resources
Facility to population Ratio
HP 1:8,668 1:6,626 1:6,321 1:5,630 1:5,426 1:5,382 1:5352 1:4386
HC 1:107,128 1:103,607 1:57,130 1:37,299 1:30,794 1:28106 1:26468 1:26549
Hospital (all types) 1:839,983 1:861,823 1:778,122 1:688,748 1:671,402 1:674,568 1:676291 1:586740
Number of Available (Public)
HP 8,528 11,446 12,448 14,192 15,095 15668 16012 16251
HC 690 732 1,362 2,142 2,660 2999 3245 3315
Hospital (all types) 88 88 100 116 122 125 127 150
Finance
Share of Health Budget as a Proportion of total Budget NA 9.1 10.1 10.4 10 9.13 9.8
10.3
Health Systems
Health Service Coverage and Utilization
PHC coverage 87 90 90 89 92.1 92.9 95.2 100
OPD attendance per capita 0.33 0.25 0.3 0.29 0.3 0.29 0.34
0.35
Total Admissions NA NA NA 514,679 677,934 469494 688182 1164508
Total Length of stay NA NA NA 707,221 1,835,852 2043042 2219218 2544772
Health centers Providing BEOC Service NA NA NA 33.4 30.2 34.3 55.9
68.5
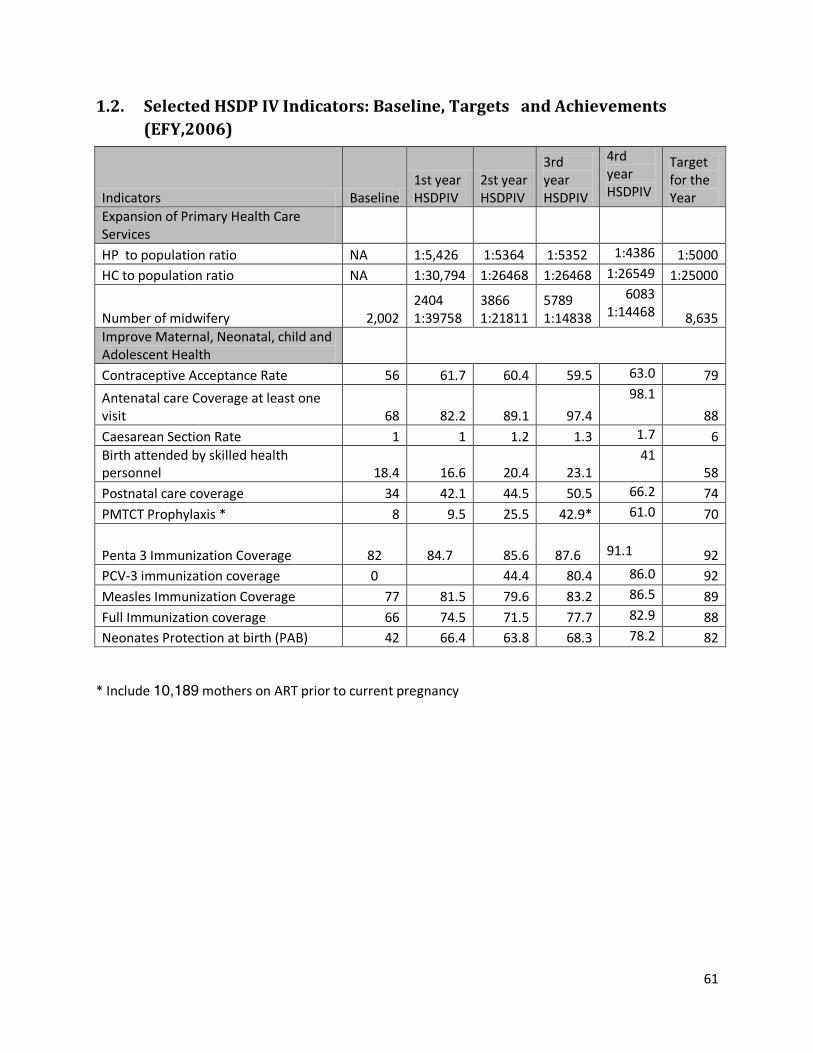
61
1.2. Selected HSDP IV Indicators: Baseline, Targets and Achievements
(EFY,2006)
Indicators Baseline 1st year HSDPIV
2st year HSDPIV
3rd year HSDPIV
4rd year HSDPIV
Target for the Year
Expansion of Primary Health Care Services
HP to population ratio NA 1:5,426 1:5364 1:5352 1:4386 1:5000
HC to population ratio NA 1:30,794 1:26468 1:26468 1:26549 1:25000
Number of midwifery 2,002 2404 1:39758
3866 1:21811
5789 1:14838
6083 1:14468 8,635
Improve Maternal, Neonatal, child and Adolescent Health
Contraceptive Acceptance Rate 56 61.7 60.4 59.5 63.0 79
Antenatal care Coverage at least one visit 68 82.2 89.1 97.4
98.1
88
Caesarean Section Rate 1 1 1.2 1.3 1.7 6
Birth attended by skilled health personnel 18.4 16.6 20.4 23.1
41 58
Postnatal care coverage 34 42.1 44.5 50.5 66.2 74
PMTCT Prophylaxis * 8 9.5 25.5 42.9* 61.0 70
Penta 3 Immunization Coverage 82 84.7 85.6 87.6
91.1 92
PCV-3 immunization coverage 0 44.4 80.4 86.0 92
Measles Immunization Coverage 77 81.5 79.6 83.2 86.5 89
Full Immunization coverage 66 74.5 71.5 77.7 82.9 88
Neonates Protection at birth (PAB) 42 66.4 63.8 68.3 78.2 82
* Include 10,189 mothers on ART prior to current pregnancy
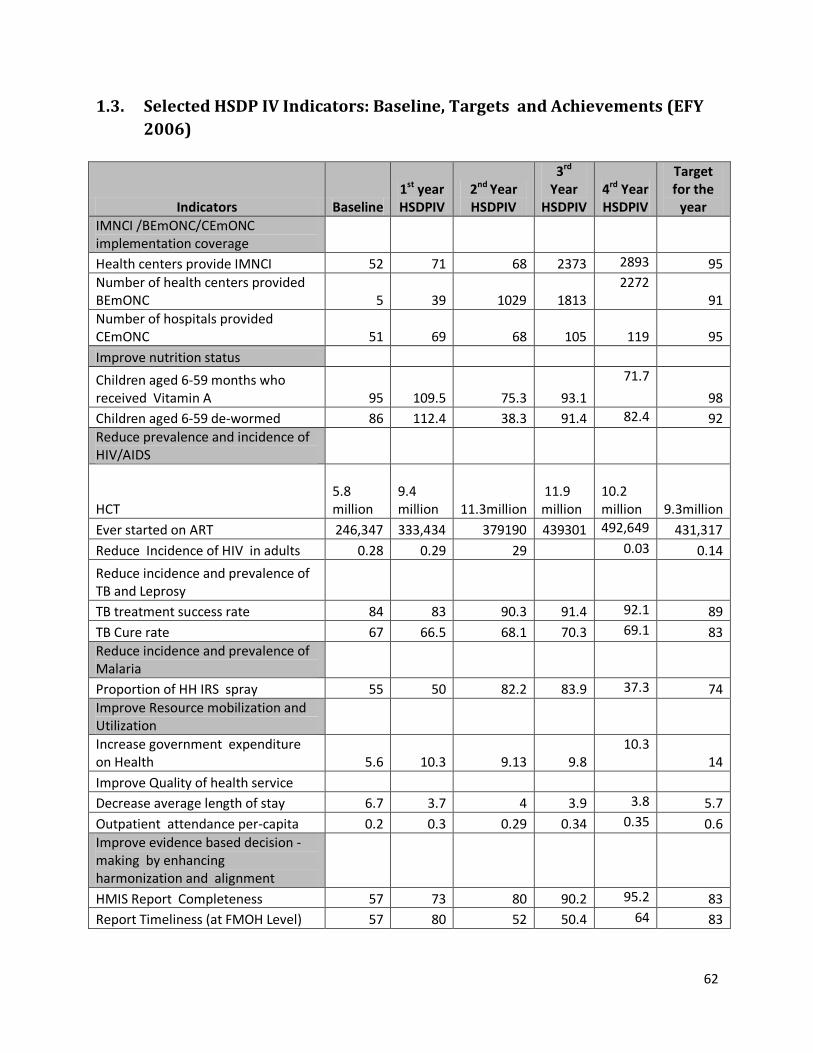
62
1.3. Selected HSDP IV Indicators: Baseline, Targets and Achievements (EFY
2006)
Indicators Baseline 1st year HSDPIV
2nd Year HSDPIV
3rd Year
HSDPIV 4rd Year HSDPIV
Target for the
year
IMNCI /BEmONC/CEmONC implementation coverage
Health centers provide IMNCI 52 71 68 2373 2893 95
Number of health centers provided BEmONC 5 39 1029 1813
2272 91
Number of hospitals provided CEmONC 51 69 68 105
119 95
Improve nutrition status
Children aged 6-59 months who received Vitamin A 95 109.5 75.3 93.1
71.7
98
Children aged 6-59 de-wormed 86 112.4 38.3 91.4 82.4 92
Reduce prevalence and incidence of HIV/AIDS
HCT 5.8 million
9.4 million
11.3million
11.9 million
10.2 million 9.3million
Ever started on ART 246,347 333,434 379190 439301 492,649 431,317
Reduce Incidence of HIV in adults 0.28 0.29 29 0.03 0.14
Reduce incidence and prevalence of TB and Leprosy
TB treatment success rate 84 83 90.3 91.4 92.1 89
TB Cure rate 67 66.5 68.1 70.3 69.1 83
Reduce incidence and prevalence of Malaria
Proportion of HH IRS spray 55 50 82.2 83.9 37.3 74
Improve Resource mobilization and Utilization
Increase government expenditure on Health 5.6 10.3 9.13 9.8
10.3 14
Improve Quality of health service
Decrease average length of stay 6.7 3.7 4 3.9 3.8 5.7
Outpatient attendance per-capita 0.2 0.3 0.29 0.34 0.35 0.6
Improve evidence based decision -making by enhancing harmonization and alignment
HMIS Report Completeness 57 73 80 90.2 95.2 83
Report Timeliness (at FMOH Level) 57 80 52 50.4 64 83
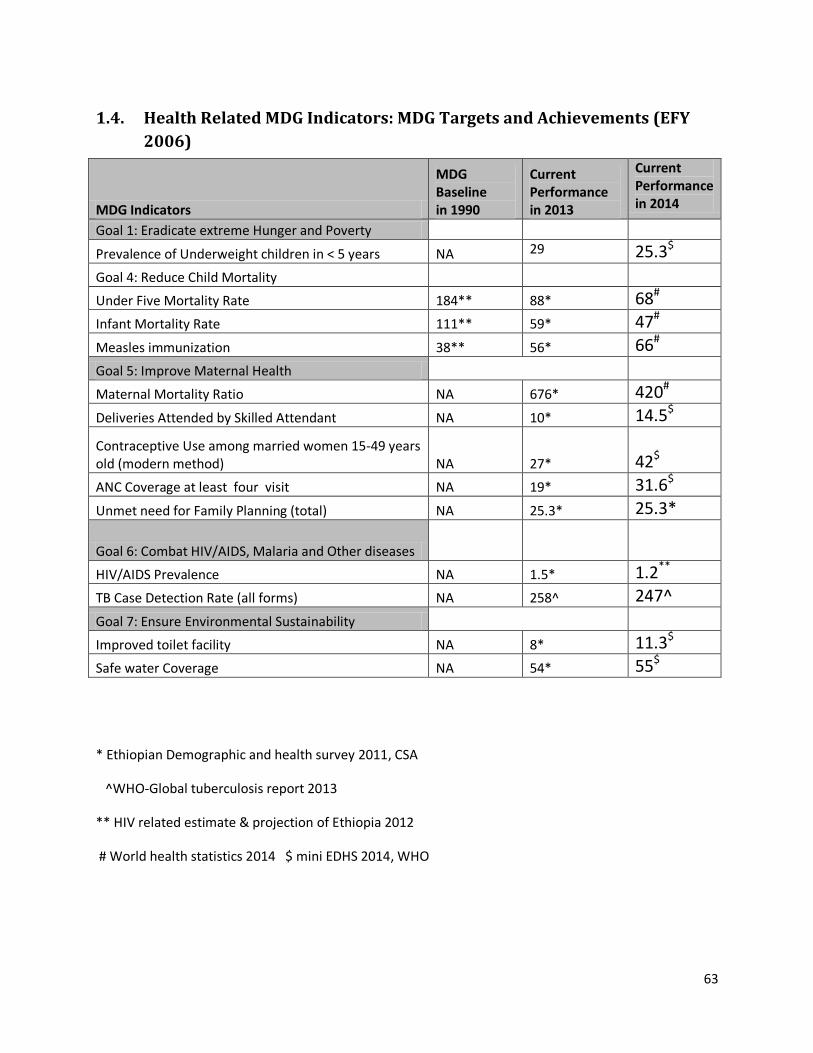
63
1.4. Health Related MDG Indicators: MDG Targets and Achievements (EFY
2006)
MDG Indicators
MDG Baseline in 1990
Current Performance in 2013
Current Performance in 2014
Goal 1: Eradicate extreme Hunger and Poverty
Prevalence of Underweight children in < 5 years NA 29 25.3$
Goal 4: Reduce Child Mortality
Under Five Mortality Rate 184** 88* 68#
Infant Mortality Rate 111** 59* 47#
Measles immunization 38** 56* 66#
Goal 5: Improve Maternal Health
Maternal Mortality Ratio NA 676* 420#
Deliveries Attended by Skilled Attendant NA 10* 14.5$
Contraceptive Use among married women 15-49 years old (modern method) NA 27*
42$
ANC Coverage at least four visit NA 19* 31.6$
Unmet need for Family Planning (total) NA 25.3* 25.3*
Goal 6: Combat HIV/AIDS, Malaria and Other diseases
HIV/AIDS Prevalence NA 1.5* 1.2**
TB Case Detection Rate (all forms) NA 258^ 247^
Goal 7: Ensure Environmental Sustainability
Improved toilet facility NA 8* 11.3$
Safe water Coverage NA 54* 55$
* Ethiopian Demographic and health survey 2011, CSA
^WHO-Global tuberculosis report 2013
** HIV related estimate & projection of Ethiopia 2012
# World health statistics 2014 $ mini EDHS 2014, WHO