Embed Size (px)
Citation preview

OCN 201: Shelf Sediments
Rockall Plateau

Classification by Mode of Formation
• Detrital sediments– Transported and deposited as particles– Derived from weathering of pre-existing rocks
(igneous, metamorphic or sedimentary)• Chemical sediments
– Precipitated from solution
Terrigenous Sediment Cycle
• Land (terra) born (-genous)• Land source identifiable• Participates in sediment
cycle…– Erosion– Transport– Deposition– Recycling in deep earth

Chemical Sedimentary Rocks• Limestone: calcite = CaCO3
• Dolomite: CaMg(CO3 )2
• Evaporites: evaporation of seawater:CaCO3 , CaSO4 .2H2 O, NaCl, KCl, borates
Bristol Lake, Mojave Desert

Passive Margins (East USA)• Faulted blocks of rifted
continental crust• Triassic rift valley
sediments in faulted blocks• Overlain by Jurassic marine
sediments/salt• Overlain by thick (shelf,
slope, rise) sediments (Cretaceous and Cenozoic) that buried ancient reef
• Whole coastal plain still subsiding and accumulating.

Origin of salt beds by evaporation when the ocean basin was young

Pockmarks on the floor of the Gulf of Mexico
• Sediment from Rockies carried by Mississippi.
• Overlies salt (~180 Ma).• Weight of sediment causes
domes of salt to rise, spread out and dissolve.
• Collapsed salt domes create “pockmarks”.

Thick deposits of salt form in the oceana) because rivers carry sediment to the sea.b) from evaporation of seawater.c) in young ocean basins, which are long and narrow.d) both b) and c).e) all of the above.
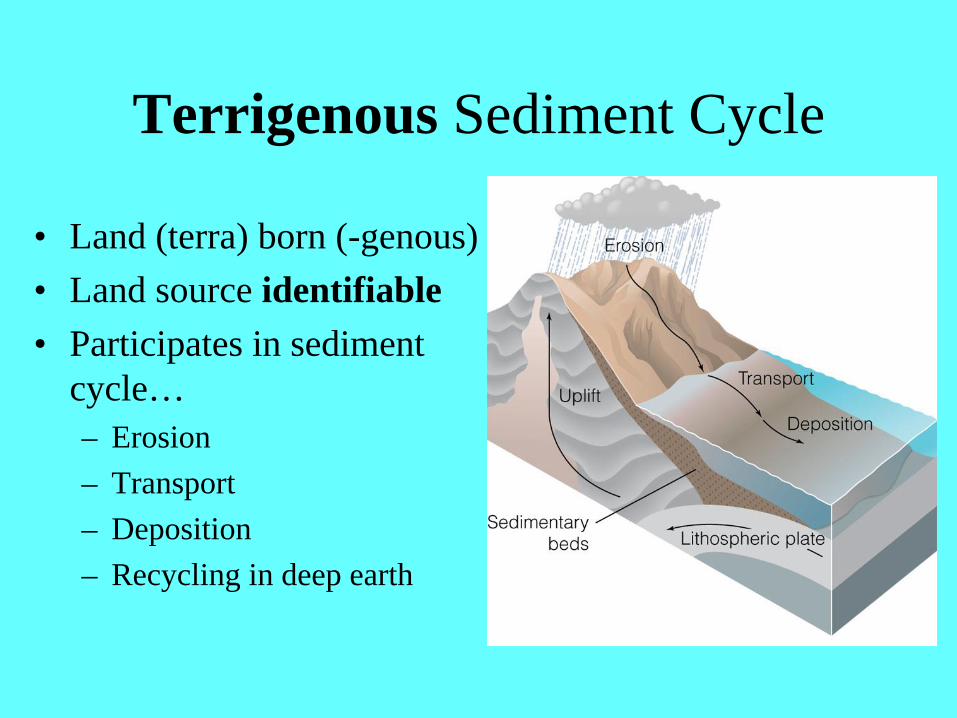
Sea Level Changes: I• Deduced from sediment packets on continental margin
using seismic methods.• Use of one or two ships• Earlier used dynamite, now use airguns.• reflection (layering) vs refraction (speed of sound in
layers)

Sea Level Changes: II• Transgression:
Progressive flooding of land, high sea level stand
• Regression: Progressive draining of land, low sea level stand

Sea Level Change • Local causes
– Water in motion– Storm surges, wind driven,
currents along shoreline– Tectonic uplift or
subsidence• Global causes
– Change in ice volume– Change in mean seafloor
spreading rate (fast = younger seafloor, sea level rises, slow = older seafloor, sea level falls
– Change in mean ocean T(water expands on warming)
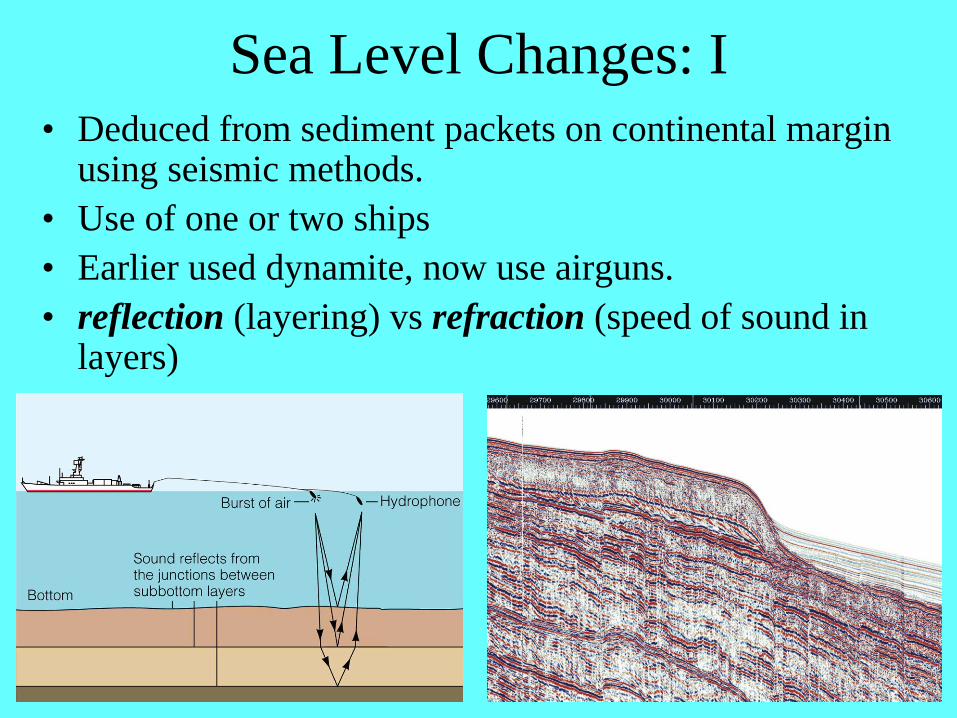
Sea Level Summary• Sea level is rising!
– Sea level fell from 125Ka to ~20 Ka due to ice buildup.
– Sea level has been (generally) rising for the past 20 Ka. (evidence from drowned reefs).
– Global sea level has risen about 20 cm over past century, largely due to melting of glacial ice.
– There is a local effect of Hawaiian geology on sea level rise.
Eemianinterglacial
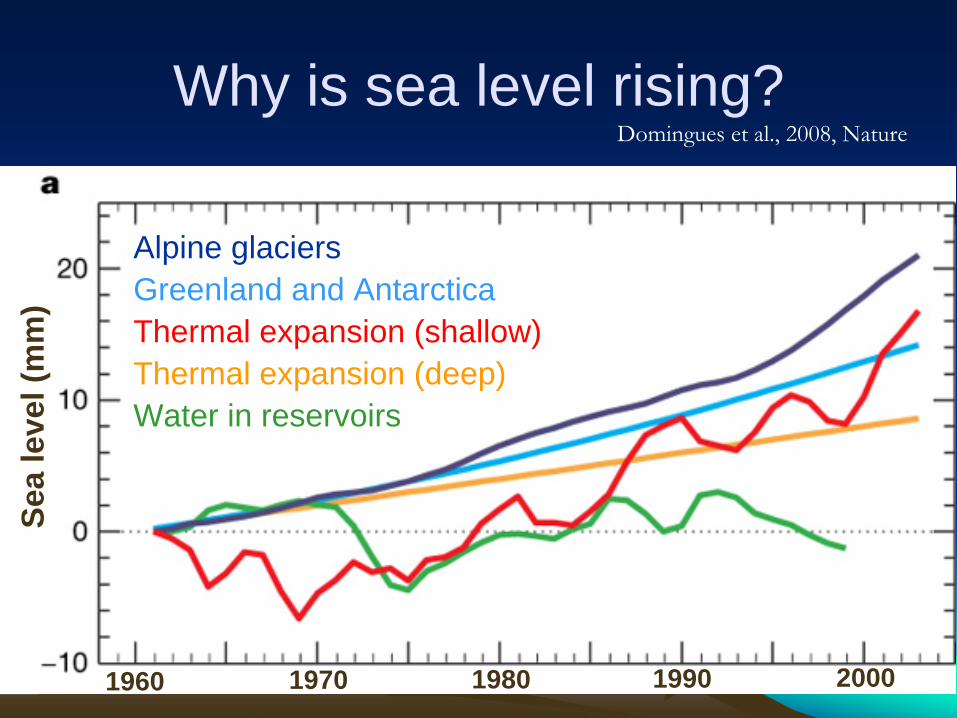
Why is sea level rising?Se
a le
vel (
mm
)
1960
Alpine glaciersGreenland and Antarctica Thermal expansion (shallow)Thermal expansion (deep)Water in reservoirs
Domingues
et al., 2008, Nature
1970 1980 1990 2000

Sea Level in Hawaii• Two causes:
– Local: Hawaiian Arch– Global: overall sea level rise
Every island has its own rate of sea-level rise
Downward push at hotspot causes upward bulge under Oahu
The young Big Island is soheavy it bends the lithosphere
As the Pacific Plate moves, every islandrides over the bulge causing uplift

Effect of Sea Level on Coasts: I

Effects of Sea Level on Low Areas
• Rise of only a few 10’s of cm can be critical.• Pacific Atolls (Marshall, Micronesia,
Tuamotu, etc.)• Indian Ocean (Maldives… shown here!)• Also important for low continental areas
(Florida, New Orleans, London,Venice)

Effect of Sea Level on Coasts: IILow sea level at ~20 ka increased dry land (from reef banks and continental shelf) as much as 200 km seaward.
Future sea level will rise up to 70 m if polar ice caps melt, flooding the reef platform and continental shelf of the SE USA . . .
Loss of Greenland ice cap = 7 m rise

Sea level is rising today becausea) Earth’s climate is warming.b) glacial ice is melting.c) the oceans are warming, and water expands as it warms.d) all of the above.

Value of Physical Resources from the Sea (2001)
Oil and gas: $200BCable laying: $10B
Placers: diamonds $800Mgold $200M
Sand and gravel: $500M
Salts (including Mg): $500M

Political regime: UN Law of the Sea• Nearshore:
– 12 mile territorial zone and 200 mile Exclusive Economic Zone.– These two zones account for 40% of the ocean area!
• Offshore:– International Seabed Authority (leases, royalties)

Origin of Oil and Natural Gas
1. Deposition of organic carbon in sediments(bodies of small organisms)
2. Burial and heating to convert to oil and gas ( = hydrocarbons)
3. Migration through permeable sediment(e.g., sandstone)
4. Trapping to form an underground pool
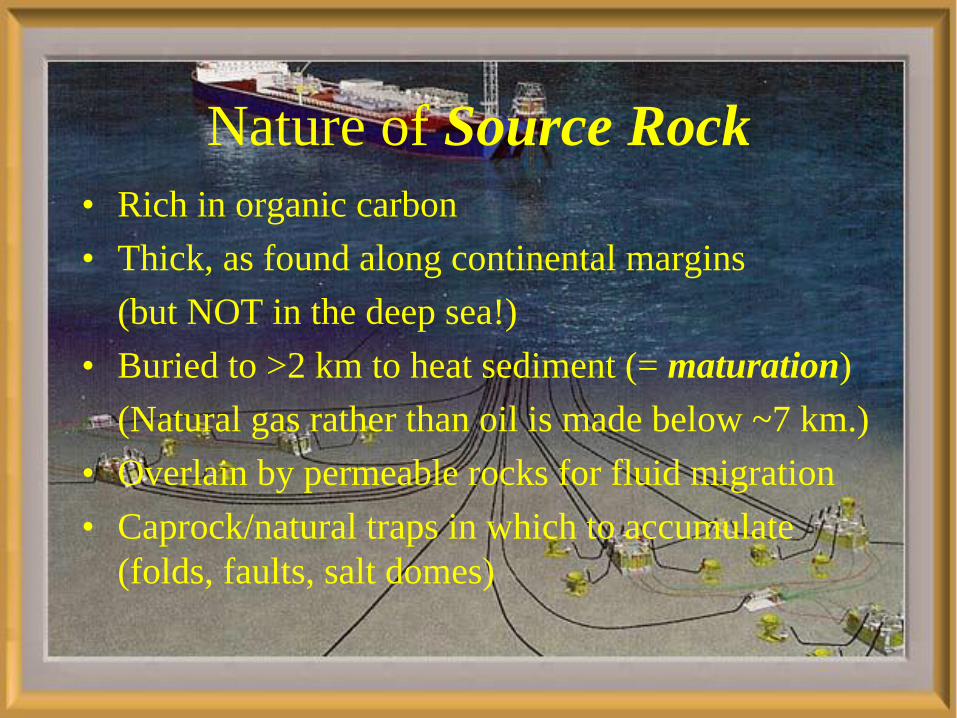
Nature of Source Rock• Rich in organic carbon• Thick, as found along continental margins
(but NOT in the deep sea!)• Buried to >2 km to heat sediment (= maturation)
(Natural gas rather than oil is made below ~7 km.)• Overlain by permeable rocks for fluid migration• Caprock/natural traps in which to accumulate
(folds, faults, salt domes)

Formation of an Oil or Gas Deposit

Structure of Fossil Fuel Deposits• Hydrocarbons are not
present as large liquid pools; rather:
• Oil and gas adhere to particles of enclosing rock.
• Oil and gas ascend until trapped by an impermeable caprock.

Geologic Traps for Oil and Gas

Economic Considerations• Drilling for oil is costlier in ocean than on land.
(also true of any marine mining operation)• Most marine oil deposits are tapped from
platforms in less than 100 m water depth.

Oil• Most of the oil on Earth was produced during episodes of
extreme warmth between 90 and 150 million years ago.
• Algae proliferated in warm sunlit tropical waters, and the hot surface water prevented normal circulation such that stagnant anoxic conditions occurred at depth.
• We will burn most of this oil within a single human lifetime (Ours!)
• A grown man working at hard physical labor for a month burns the amount of energy in a gallon of gasoline.
• Each American has available to them the energy equivalent of ~200 slaves. Energy is the source of our wealth!

US OIL PRODUCTION FORECAST: 1930 to 2030
0
1000
2000
3000
4000
5000
6000
7000
8000
9000
10000
11000
12000
13000
1930 1940 1950 1960 1970 1980 1990 2000 2010 2020 2030
Year
000'
s of
bar
rels
of o
il pe
r day
© Energyfiles Ltd
ONSHORE
OFFSHORE
ESTIMATE | FORECAST
The Peak in Oil Production: the USA
US peaked in 1970, as predicted by M. King Hubbert in 1956.
Peak was 11 MBrl/day.Today we use 20.Drill, Baby, Drill?
2011

Peaked in 2002
Peaked in 1970
Peaked in ~1985
World crude oil production peaked in 2005-2008 (so far).

Implications of “Peak Oil”• The production curve is called a “logistic curve”.
• The peak in production follows the peak in discovery by 30-40 years (USA: 1930’s, 1970; global discovery peak was 1964.)
• At the peak, ~half of the resource is gone—and it is the good half! (easy to find and cheap to recover)
• Production falls rapidly and inevitably from the peak, regardless of demand. A long plateau produces a steeper drop.
• As of 2009, 64 countries are past-peak and 35 are not.

UK OIL PRODUCTION FORECAST: 1950 to 2050
0
500
1000
1500
2000
2500
3000
3500
4000
1950 1960 1970 1980 1990 2000 2010 2020 2030 2040 2050
Year
mill
ion
barr
els
per y
ear
© Energyfiles Ltd
PRODUCTION
DISCOVERIES
Piper Alpha disasterPeaked in 1999

SAUDI ARABIA OIL PRODUCTION FORECAST: 1950 to 2050
0
2000
4000
6000
8000
10000
12000
14000
16000
18000
20000
1950 1960 1970 1980 1990 2000 2010 2020 2030 2040 2050
Year
Mill
ions
of b
arre
ls o
f oil
per y
ear
© Energyfiles Ltd
DISCOVERIES
PRODUCTION

The Peak in Oil Production: the World
You are here.
The peak year of global oil discovery
was 1964.
1964


The Peak in Oil Production: the World
Duncan (2001)
74 + 10 = 84 million barrels per day(135 needed in 2030!)
•In the next 25 years, crude oil production from existing wells will decline from the current 74
Mbarrels/day to only 16 Mbarrels/day (IEA, 2010). = Severe shortfall!

Aloha, see you next time…
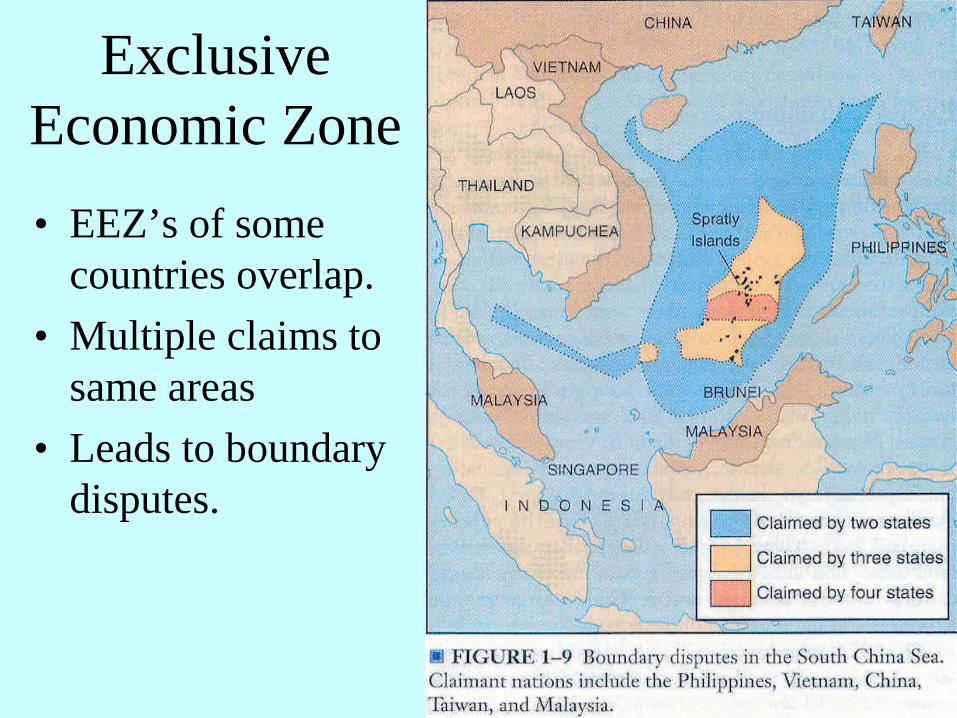
Exclusive Economic Zone• EEZ’s of some
countries overlap.• Multiple claims to
same areas• Leads to boundary
disputes.


![Tris(trimethyl-stannyl,- germy], -siJyl)borates](https://img.dokumen.tips/doc/110x75/6257210866398056bc478d5e/tristrimethyl-stannyl-germy-sijylborates.jpg)