Embed Size (px)
Citation preview

3\ \8\oclt,111EV, CoA Memo. No. 107
THE COLLEGE OF AERONAUTICS
An assessment of the critical strains which can
be sustained by a mar-ageing steel under bi-axial tension
- by -
R. Pearce
- 1 -
Mar-ageing steels are being specified more and more in advanced engineering applications, and, frequently, the components are manufactured from sheet material. Consequently, the evaluation of the sheet forming properties of this material is of paramount importance; this investigation forms part of this general program.
The aim here is two-fold, firstly, to determine the maximum strain which can be sustained under bi-axial stress, and secondly, to suggest any way in which this value can be increased.
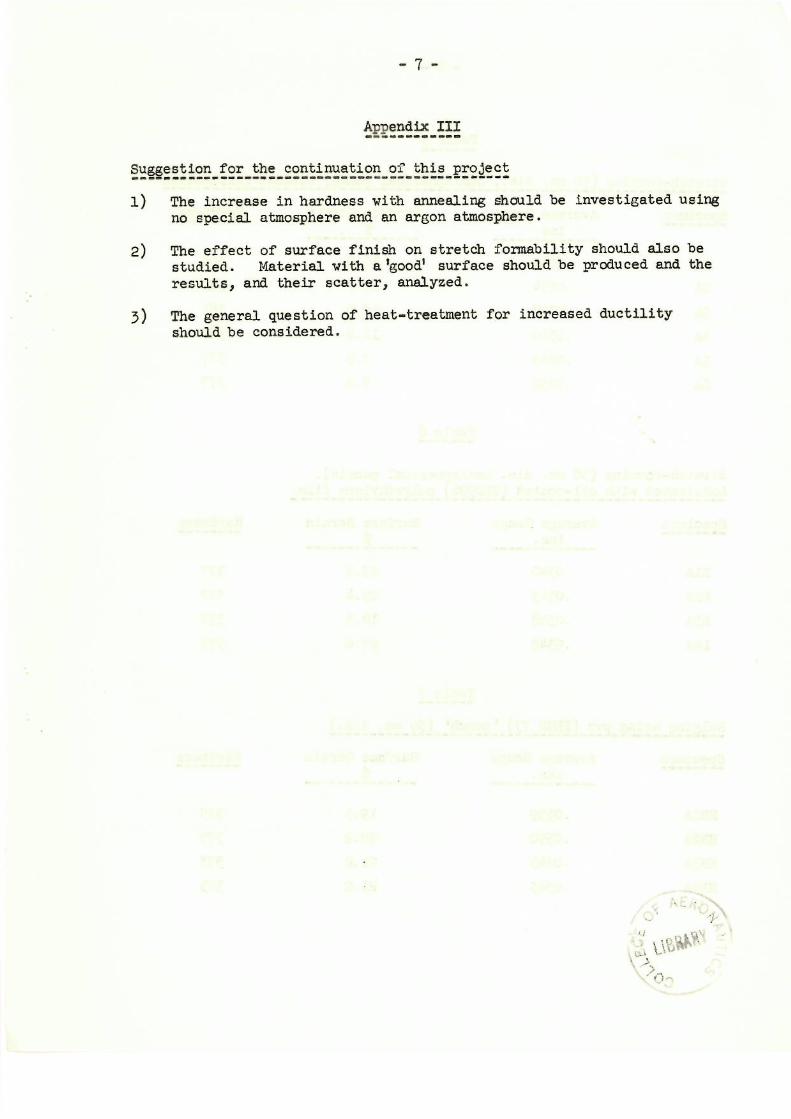
The material has been stressed bi-axially in a variety of ways, and the critical strain measured on a grid of 0.1" diameter circles imprinted on the sheet prior to forming by the Electromark process. TiVq has been developed by several firms in the USA and described by Keeler`1). Deformation was carried out using the 35 ton Hille Engineering Press equipped with an Advance =00 X-Y Recorder to give accurate load-extension curves. Serrated blankholders were installed to prevent the blank from drawing-in (figure 1). Bulging - to 50 mm.91i4meter - was effected using firstly the pvc-technique described by Pearcek2)and secondly using conventional oil pressure - to 100 mm. diameter. Punch stretching was carried out with a 50 mm. hemispherical punch, with and without oiled (TSD996) polyethylene film interposed between the punch and the workpiece. Typical cups are shown in figure 2.
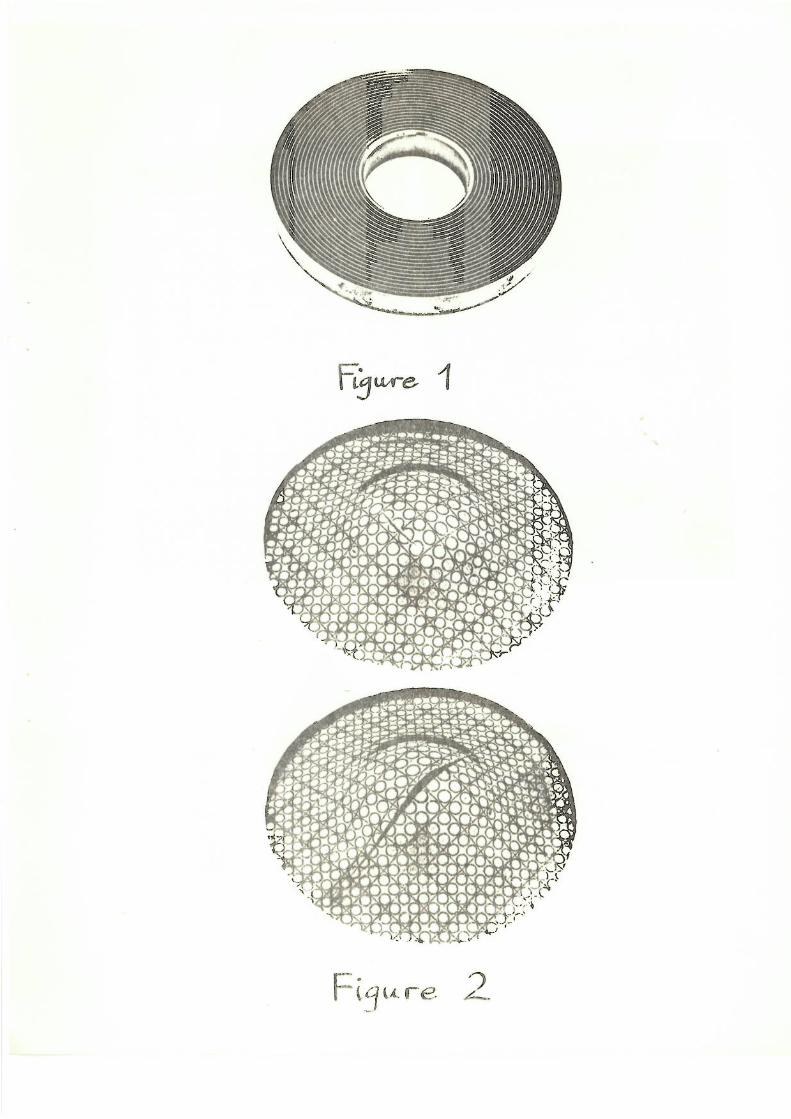
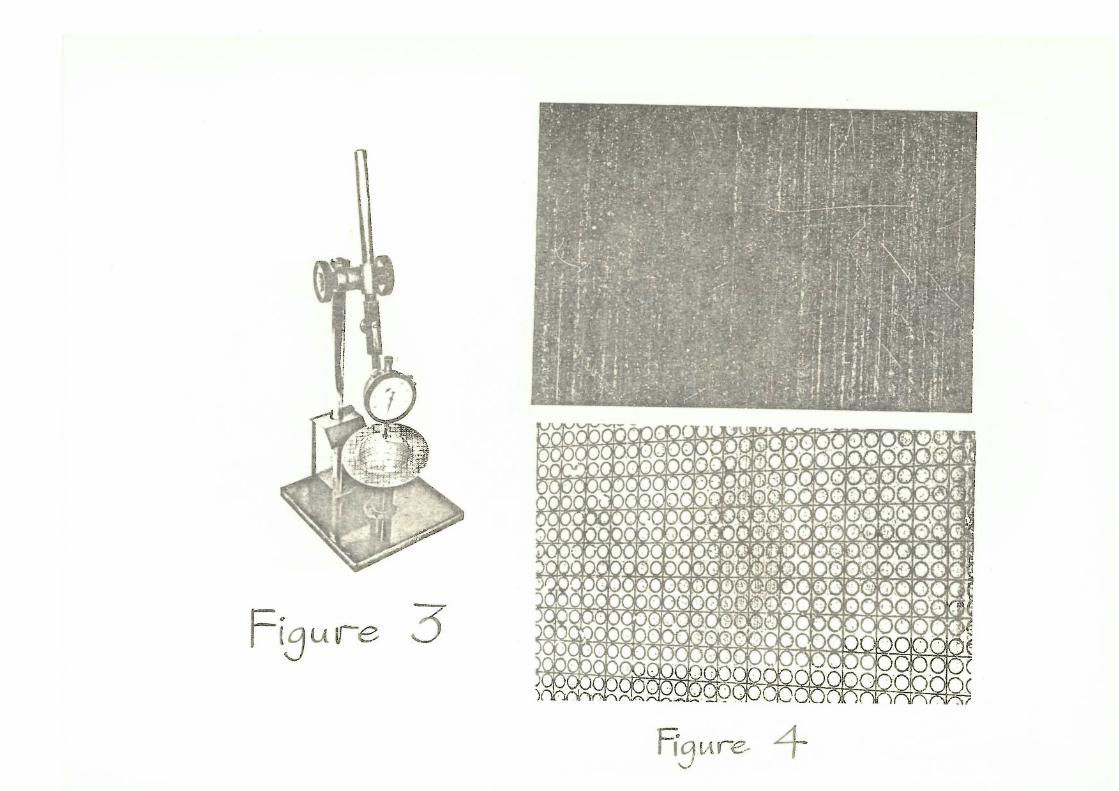
The first work was done to see what accuracy could be expected from grid measurements. The results were somewhat disappointing, for, the thickness of the grid line was such that increasing magnification only increased the uncertainty of the positions to which measurements should be made. Thus the accuracy by this method is only about ± 4%. It was then decided to use the grid circles merely as position-determiners to measure the thickness at the esfimated centre of each circle with a clock gauge reading to .0001 in. and the cup placed on a spherical seat (Fig. 3). From this measurement the thickness strain could be plotted against initial radial position, if it was desired to show the material distribution over the cup profile, and, assuming constant volume, the surface strain can be computed (see Appendix 1) at or near the pole, where a balanced bi-axial stress state obtains, to an accuracy of ±1.5%. The material used for this investigation was provided free-of-charge by Bristol Aerojet Ltd. The surface finish was poor, being heavily ridged (Figure 4). A talysurf trace of the surface profile is shown in Fig. 5. The variation in gauge is given in the tables showing the results of the various tests carried out in this investigation. Fortunately, the short-range variation was slight and six flange readings, three I on' and three 'off' (see Figure 6) were taken on each cup and the average of these taken to be the 'gauge' of the blank. The pattern of the results obtained indicate that the errors in this assumption are small. The results of the experimental work, carried out in the manner described above, are given in the following sections.

-2 -
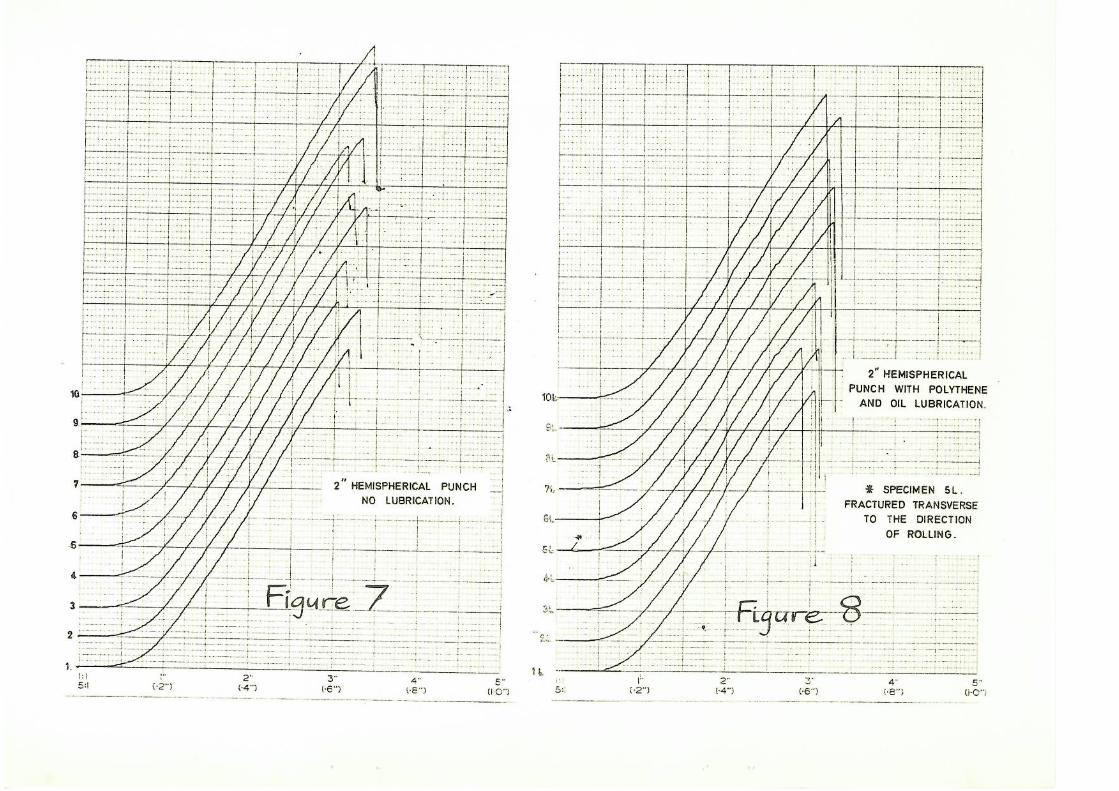
Stretch-forming (50 mm. dia., hemispherical punch) without lubrication.
Table 1
Specimen Average gauge (ins.)
Surface Strain%
Cup height (ins.)
Av. of 3 readings Ht. 30 Kilos
1 0.0333 18.3 0.550 353
3 0.0336 18.6 0.525 362 4 0.0330 17.9 0.540 364
5 0.0326 19.8 0.590 566
6 0.0336 19.8 0.560 360
7 0.0345 18.2 0.578 349
8 0.0334 17.8 0.542 362
9 0.0338 21.2 0.610 333
1.) 0.0343 21.3 0.6no 364
The average maximum strain developed is 19.6%. The spread of results and properties can be seen from Table 1 and Figure 7. There is a general trend indicating greater surface strains and cup heights with lower hardness, but the correlation is not significant
Table _2
Stretch-forming (50 mm. dia. hemispherical panels). Lubricated with oil-coated (TSD996) polyethylene film.
Specimen Average gauge (ins.) Surface Strain (%) Cup height (ins.)
1L 0.0334 20.2 0.530 2L 0.0349 25.8 0.535 3L 0.0340 17.0 0.495 4L 0.0330 21.2 0.540 5L 0.0326 22.9 0.525 6L 0.0328 28.1 0.570 7L 0.0336 29.2 0.570 8L 0.0333 25.0 0.555 9L 0.0333 28.1 0.585
The average maximum strain developed is 24.1%. Which is significantly higher than in the unlubricated case. The effect of lubrication on the ioad-penetration curves can be seen in Figure 8. The trend of surface strain vs. cup height seems better than in the unlubricated case.
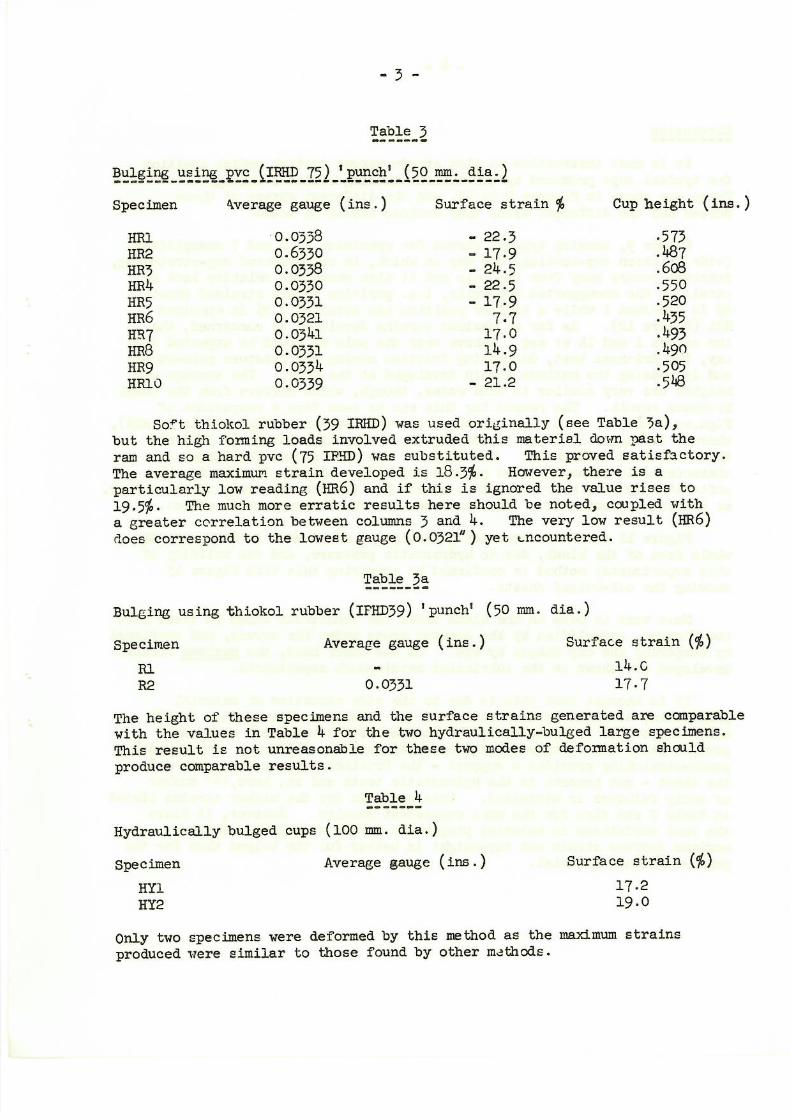
Table 3
Bulging using v2 (IRRD 75) 'punch' (50 mm. dia.)
Specimen Average gauge (ins.) Surface strain % Cup height (ins.)
HR1 0.0338 - 22.3 .573 HR2 0.6330 - 17.9 .487 HR3 0.0338 - 24.5 .608 HR4 0.0330 - 22.5 .550 HR5 0.0331 - 17.9 .520 HR6 0.0321 7.7 .435 HR7 0.0341 17.0 .493 HR8 0.0331 14.9 .490 HR9 0.0334 17.0 .505 HR1O 0.0339 - 21.2 .548
Soft thiokol rubber (39 IRHD) was used originally (see Table 3a), but the high forming loads involved extruded this material down past the ram and so a hard pvc (75 IRHD) was substituted. This proved satisfactory. The average maximum strain developed is 18.3%. However, there is a particularly low reading (HR6) and if this is ignored the value rises to 19.5%. The much more erratic results here should be noted, coupled with a greater correlation between columns 3 and 4. The very low result (HR6) does correspond to the lowest gauge (0.0321") yet encountered.
Table 3a
Bulging using thiokol rubber (IFHD39) 'punch' (50 mm. dia.)
Specimen Average gauge (ins.)
Surface strain (%)
R1
14.c R2 0.0331
17.7
The height of these specimens and the surface strains generated are comparable with the values in Table 4 for the two hydraulically-bulged large specimens. This result is not unreasonable for these two modes of deformation should produce comparable results.
Table 4
Hydraulically bulged cups (100 mm. dia.)
Specimen Average gauge (ins.) Surface strain (%) HY1 17.2 HY2 19.0
Only two specimens were deformed by this method as the maximum strains produced were similar to those found by other mdthods.
II
Discussion
It is most instructive to plot strain versus initial radial position for typical cups produced by the methods heading Tables 1 through 4. These are shown in Figures 9 to 13, and the different shapes of these curves and the different areas they enclose should be noted.
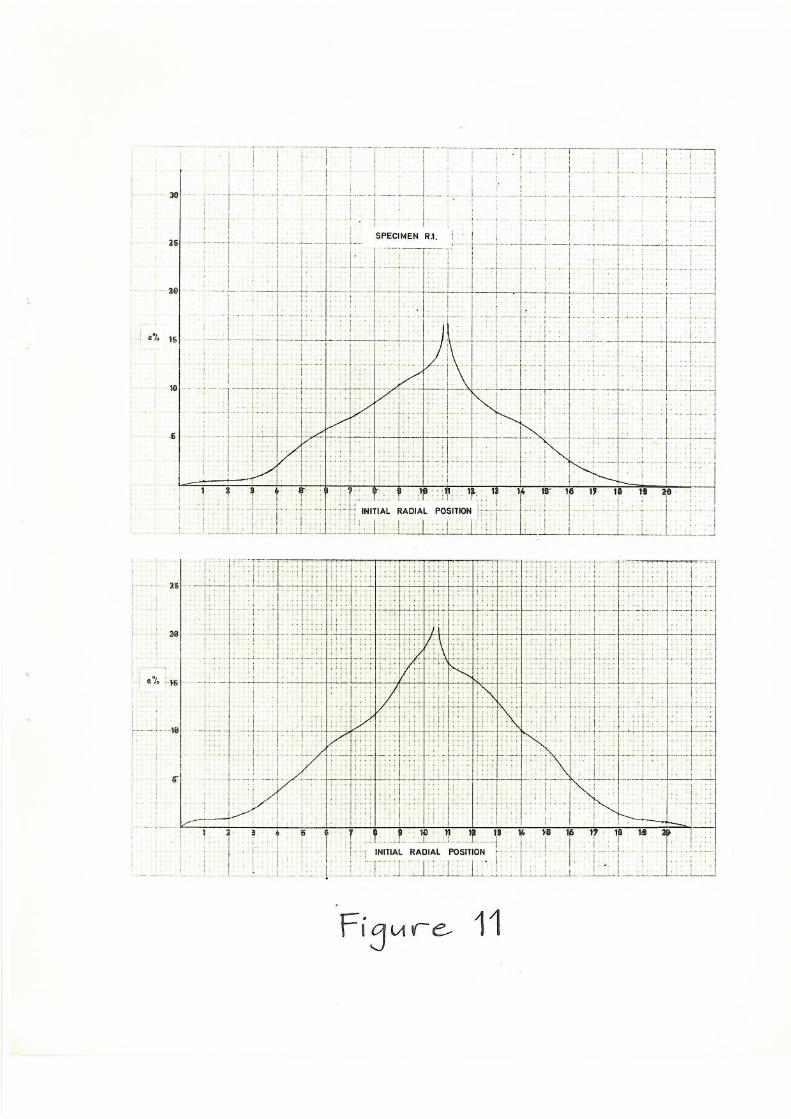
Figure 9, showing typical curves for specimens 1, 2 and 7 exemplifies (vide Ericksen cup-testing) the way in which, in unlubricated cup-stretching, fracture occurs away from the pole and it also shows the relative lack of strain in the unsupported cup walls, i.e. position 16 has strained about 4% in specimen 1 while a similar position has strained 8.5% in specimen HR1 (Figure 12). As far as maximum strains developed is concerned, the two series 1 and 11, et seq., behave over the pole as would be expected in, say, the Ericksen test, decreasing friction moving the fracture pole-wards and increasing the maximum strain developed at the pole. The average cup heights are very similar in both cases, though, which differs from the usual Ericksen result. The reason for this can be seen from a comparison of Figures 9 and :0. In Figure 9 there are two regions of high strain (" 22%), whereas in Figure 10 there is one region of very high strain (' 30%) and these two tend to balance. The shape of the curves near the flange is characteristic of unsupported punch-stretching. Figure 11, showing the soft-rubber bulging also shows this effect due to back-extrusion of the rubber, as previously mentioned. This produces the same 'unsupported= effect.
Figure 12 shows ± curves for pyc-bulging, where work is done over the whole area of the blank, due to hydrostatic pressure, and the validity of this experimental method is confirmed by comparing this with Figure 13 showing the oil-bulged sheets.
More work is done on the blank under the conditions shown in these last two figures, exemplifies by the greater areas under the curves, and confirmed by comparing the cup shapes by eye. On the other hand, the maximum strains developed are shown in the lubricated metal-punch experiments.
It is thought that this is due to the wide variation of material properties, as shown by the scatter of the results. The surface finish also leaves much to be desired, the sharper of the 'grooves' could well provide sites for fracture initiation andpremature failure. Consequently, punch-stretching provides a support - the friction between the punch and the sheet - not present in the hydrostatic tests and so, here, the number of early failures is minimized. This accounts for the higher strains listed in Table 2 and also for the more consistent results. However, it blurs the real variations in material properties and so correlation between maximum surface strain and cup-height is better for the bulged than for the punch-stretched material.
5
Conclusions
This investigation aimed primarily to determine the maximum strain which could be sustained by this material when subjected to bi-axial tension.
This can be derived theoretically for an ideal material - homogeneous and isotropic.
Assuming the relationship:
a = Ken
for the true stress (a) true strain (s) curve, where n is termed the work-hardening exponent and K is a constant. It can further be shown that, at instability in uniaxial tension the true strain, E, equals the work-hardening exponent;
n
and for balanced biaxial tension:
E = 2n
So, the available strain in the latter case is much greater than in the former. This relationship is only quantitative in the case of an ideal material, but it is likely that the general statement will apply for real materials.
In the case of the mar-ageing steels tested in this investigation, the total tensile elongation measured approximately 10%. The maximum strain at instability in the bi-axial tests varied between 7.7% and 29.2%, while 90% of the specimens gave strains in the range 16%-25%. Thus, 20% would be a reasonable practical maximum to impose for sheet metal forming operations. However, the actual range quoted shows the variations which occur and every effort should be made to improve this situation by closer metallurgical control. In addition, the surface finish leaves much to be desired.

-6
Appendix I
Calculation of surface strain from thickness measurements
If do = original diameter
d = final diameter
to
original thickness
t = final thickness
Then
Ad 2t o Ad2t 4 — 4
. d2t = d2t
'd 2t 0 0 t
0.01 to t
d - do
Percentage strain is of course, d x 100. 0
Appendix II
After the above work had been completed, it was thought politic to check that the material was in the fully-annealed condition. Consequently, samples were annealed for 2 hour at 820°C, and the Vickers hardness number checked. The results are shown in Tables 5, 6 and 7. It will be noted that in all cases the hardness has increased, the unlubricated stretch-formed cups show a marked decrease in maximum surface strain developed (see Table 1) while the others are not very different from the unannealed material.
The reason for this could well be that the annealing process affects the frictional characteristics of the metal and thus the unlubricated results would demonstrate an effect which could not operate in the lubricated or pvc-case.
Arpendix III
Suggestion for the continuation of this project
1) The increase in hardness with annealing should be investigated using no special atmosphere and an argon atmosphere.
2) The effect of surface finish on stretch formability should also be studied. Material with a'goodl surface should be produced and the results, and their scatter, analyzed.
3) The general question of heat-treatment for increased ductility should be considered.
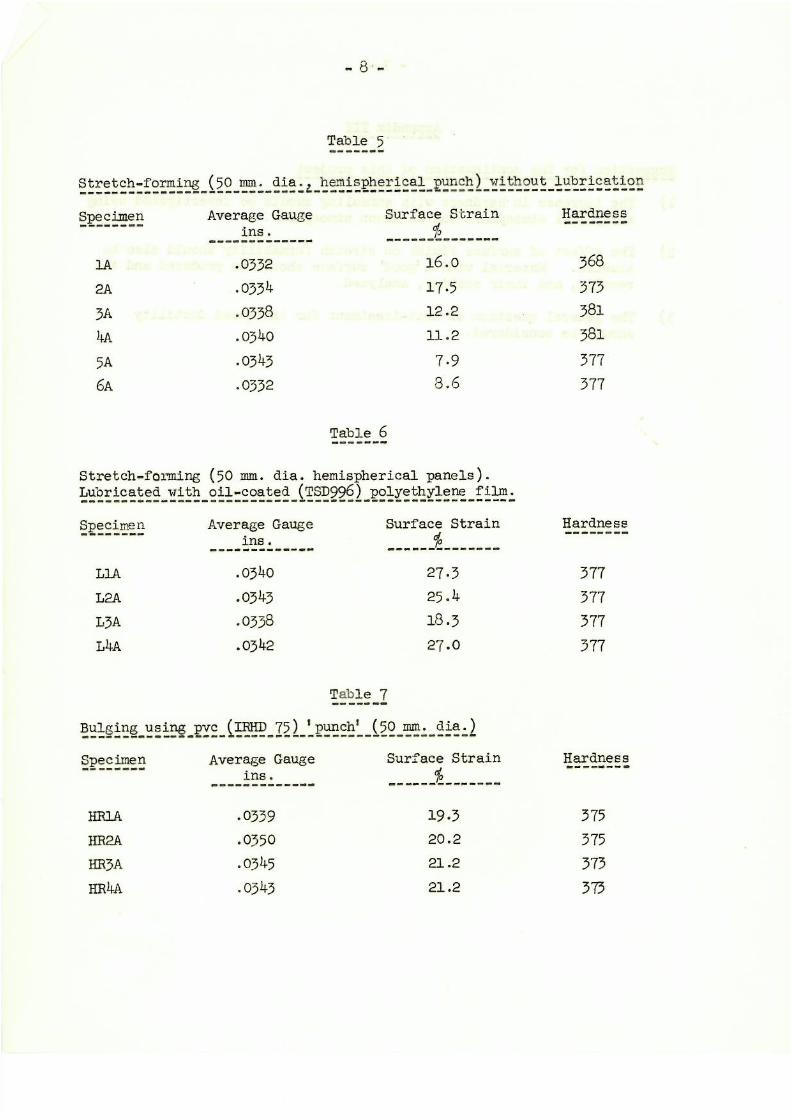
Table 5
Stretch-forming (50 mm. dia.L hemispherical punch) without lubrication
Specimen Average Gauge ins.
Surface Strain Hardness
1A .0332 16.0 368
2A .0334 17.5 373
3A .0338 12.2 381
4A .0340 11.2 381
5A .0343 7.9 377
6A .0332 3.6 377
Table 6
Stretch-forming Lubricated with
(50 mm. dia. hemispherical panels). oil-coated (TSD996) polyethylene film.
Specimen Average Gauge ins.
Surface Strain Hardness
L1A .0340 27.3 377
L2A .0343 25.4 377
L3A .0338 18.3 377
L4A .0342 27.0 377
Table 7 -- -----
Bulging using pvc (TRHD 75) 'punch' (50 mm. dia.2
Specimen Average Gauge ins.
Surface Strain Hardness ------- -
HR1A .0339 19.3 375
HR2A .0350 20.2 375
HR3A .0345 21.2 373
HR4A .0343 21.2 373
hltvre,,
re. 2.
et •
•
. •
t
: • r - • '
, •
. . .
• - 7, ,:-
• • .,.
• 1
• L
•
•y.-I-% • ,
- r.' ••
-17- -Rill Qy
10,9 Ike CFAs foo ism) *144
ere • to • Rs go 4,,,, I a t_s_t erei 01) fro •glik4
:_...- AL
O„ 40 Ce 6'0
PALIV •Pr• t• •
4,0 4r•
IA *JP 4.1010,„ 041
114040,s•
d-111,1 *AA" CAN...,A0 rietriii airor•Tic•
rate 444941 ritig .4 —1•.
Irlirertr. 0"-ini 0 O.
•;4010 owe ere ic9Fre
0,* CO 0./.4.0 1,+" rt," 4044. 40 4.0 troolloos•••
•
• ski, -pper•
4,0 Astc0.0 0,J0 40 4,0
II* 14
ft PA 0 04AR 11,010 Er Co IFITerVirgitro itAl OA i 0 to Al s: %0 EMI' OW ' T 0, AA )..A, :V
Cs • • Ot • ,1 ALO OAAPIA AL
(Airs or Co eV* 04Palr
•
. • ': • • •
' 9 •; •
. -9 4' .1 •*" .
s .. A
- ; '1" 1-7
. • -
• ilk
[ • 2.
• 9 • . •
•-.. ;
•I ' - .14 •
4
• ,
1̂
fti• _

V-17'11-"ri
kbi9c+.4-1101.4.wi
V-13. "r-1i 06
corxlizmozHafi °arc x iv).q.saA
, OL
.140510. •31AVI _

30 — SPECIMEN 1 D5 max 0. 550
25 —
20-
aR
10 7
3-
4 4 8 ; ; 8 10 11 12 19 15 15 16 19 10 111 20
INITIAL RADIAL POSITION
SPECIMEN 2.
20
e%
16
- -10
0 • 10 11 12 11 It T6 19 16 10 20
INITIAL RADIAL POSITION
3-6
10
19
S
*mar. • 0. Mr
1
SPECIMEN 7. D s • 0. 5B3 , max.
Figure
16 16 16 17 16 19 26 13 1 2 3 $ $ 10 11 T2
INITIAL RADIAL POSITION

16 SPECIMEN 1.1. O1 x 20- 518"
25
16
6
1 2- r 6 7' I 19 11 12 11 le 1.15 14 17 15 20
30
e
16
INITIAL RADIAL POSITION
SPECIMEN 6. I D, = 0. 550 tt
7 3- 3 * 14 11 4 IS W 12 17 15 19 251
INITIAL RADIAL POSITION
SPECIMEN 10.1.. =0.54 0 MO X
161
F yi4
z
pie 11
1 1 ) 1. 5 7 II 5 50 11 11 12 Ili 55 TB 17 II 19 24
INITIAL RADIAL POSITION
25 1
5 • 1' ?
r — f INITIAL RADIAL POSITION I- • I
r Li. 1 • _LILL' : ' • • • • •
2 3 A
eh.
-
25
20
SPECIMEN R.I.
6
- . INITIAL RADIAL POSITION
1) 4 lir I I 20 -
. • 1 - __LJ:•_] •
FigiAr-e- 11


2.13 . z2 4 • as
INITIAL RADIAL POSITION • ' I 1
I 1 I
.- St sa vt 16 10 • 14
- •
1 SPECIMEN HY.1. and HY.2.
•
L L 1_ '
3Q
e
IQ
• 15-
ZS
Figure 13