Embed Size (px)
Citation preview

CASE PROGRAM 2010-112.2
Ocean Survey 20/20: setting and implementing agreed cross-government priorities (B)
The group that met at Land Information New Zealand (LINZ) in mid-October 2005 faced a formidable challenge. For the past six months most of them had been involved in describing projects designed to meet the aims of Ocean Survey 20/20 (OS20/20). After almost as many meetings there were now 122 different projects proposed for the 15-year work programme to gather data about New Zealand’s marine estate. Each project had been scoped and defined by a working party of technical experts. Now everyone had to set aside personal preferences and decide which of those projects should take priority.
LINZ, the lead agency for the OS20/20 across-government collaboration, had called the meeting and invited Associate Professor Vicky Mabin from Victoria University’s Victoria Management School to facilitate the use of multi-criteria decision analysis (MCDA) to prioritise the projects.
Multi-criteria decision analysis
Multi-criteria decision analysis (MCDA), also known simply as multi-criteria analysis (MCA), is a process designed to simplify complex decision-making tasks that may involve multiple stakeholders, a diversity of possible outcomes, and many criteria by which to assess the outcomes.1 It offers a means to compare like with unlike, and to assess the value of different projects in achieving a defined aim.
Kevin Kelly, LINZ’s General Manager, Policy felt that Ocean Survey 20/20, with more than 20 stakeholders, and sometimes directly conflicting aims for the projects described, was ideally suited to the process. He and Jerome Sheppard, LINZ’s designated manager for OS20/20, had seen Vicky Mabin demonstrate the decision framework to ANZSOG
This case study has been prepared for a presentation by Dr George Argyrous, University of New South Wales, by Janet Tyson of the Australia and New Zealand School of Government. It has been designed as a basis for class discussion. The support and assistance of Land Information New Zealand is gratefully acknowledged. The contributions of Dawn Brook, Kevin Kelly, Mary Livingston, Vicky Mabin, and Jerome Sheppard, are appreciated but responsibility for the final content lies with the author.
Cases are not necessarily intended as a complete account of the events described. While every reasonable effort has been made to ensure accuracy at the time of publication, subsequent developments may mean that certain details have since changed. This work is licensed under Creative Commons Attribution-NonCommercial-NoDerivatives 4.0 International License, except for logos, trademarks, photographs and other content marked as supplied by third parties. No license is given in relation to third party material. Version 8-06-10. Distributed by the Case Program, the Australia and New Zealand School of Government, www.anzsog.edu.au
1 Proctor, W in ‘Evidence for policy and decision-making’ a practical guide, ed. G Argyrous, 2009, UNSW Press and ANZSOG, p72.

Executive Fellows Program participants. Kevin Kelly had immediately seen how the process might be applied to get “disparate groups and interests who are at different levels of understanding in the policy process onto the same page.” He had seen the months of effort already put into defining each OS20/20 project and knew that “each of the agencies came to the table very good at prioritising within their own silos but had no idea of how to prioritise across their silos.”2
He felt this type of multi-criteria decision process was ideally suited to an all-of-government exercise. Eighteen different government agencies, as well as university and local government representatives, had already been involved in the specification of the list of project options.
Comparing scampi with tsunami
The lengthy list of projects had been compiled according to the need for survey data, either offshore or from the coast, according to eight different themes. In the prioritisation process a project to collect data about squid and scampi fishing off Campbell Island (the Fisheries and Biodiversity theme) would have to be measured against another designed to get better data about tsunami hazards near the North Canterbury Coast of the South Island (the Hazards theme), and yet another one to estimate the extent of gas hydrate deposits off the East Coast of the North Island as a potential future source of energy as well as submarine landslides and possible climate change (the Minerals theme).
As Vicky Mabin explained to the OS20/20 group, a multi-criteria decision process can start by listing either criteria or projects (options). As a list of projects had already been developed, the next task would be to agree on the criteria against which each project could be scored, then what weight should be given to each criterion according to its relative importance to the overall goal. The final priority would emerge as the sum of the weighted scores for each project for all criteria (For a worked example, see Exhibit 1).
Setting up: scoring, weighting and the value tree
The most extensive part of the process is the setting-up phase, during which the criteria, scoring and the weighting are decided. Once these are agreed the “doing” phase, making decisions on prioritisation, can be done in just a few hours, as long as there is some way of managing all the data that is generated. Vicky Mabin used the decision support software VISA 3 for this and other related prioritisation tasks.
From her previous experience with MCDA,4 Vicky Mabin knew it was essential that decisions about weights should be made only once it had been decided how the criteria would be scored. “It’s just like people talking about the weather. One person’s
2 Kevin Kelly interview 3 Visual Impact Senstivity Analysis. See Belton, V, ‘Multiple Criteria Decision Analysis: Practically the only way to choose” in LC Hendry and RW Eglese (Eds) Operational Research Tutorial Papers, Operational Research Society, Birmingham, 1990.
4 Mabin V et al, ‘Allocating public sector research funds: the use of multi-criteria decision making and electronic brainstorming to guide resource allocation’ Reprinted from the proceedings of the 4th international meeting of the Decision Sciences Institute, Sydney, July 1997..

3
‘hot’ will be another person’s ‘pleasantly warm’. Everyone needs to have the same understanding – for example, that 40 degrees Celsius is ‘hot’.”5
From mid-October to the end of November 2005 key people from participating agencies would “disappear for days at a time” and many meeting hours were consumed in setting up the criteria, scores and preliminary weights. Each project was scored by a panel of experts. Dawn Brook, who had managed the earlier process to set up the OS20/20 work programme, now took on the role of moderator, attending every meeting to ensure that each group was working to the same interpretations of the scoring scales – that one panel’s “8” was equivalent to another panel’s’ “8” - as they decided on the scores (see also Exhibit 1).
The setting up phase was necessarily an iterative process, during which all participants worked towards a greater understanding of each project and its relationship with other projects.
As Vicky Mabin described it,
“Criteria were put forward, and we tried to score a set of projects against them, then that got bogged down as the scientists involved thought more deeply about their projects, and we in turn refined the criteria and the projects, before finally coming to agreement on the criteria, their descriptions and the scoring scales.”6
After a month of meetings the criteria, scoring and weighting had been tested on six projects, demonstrated to and approved by the chief executive group. At their request the two criteria “Magnitude of potential returns” and “Possibility of potential returns” were added to indicate the risk/benefit of each project. Detailed discussions about costs were deliberately avoided so that this stage of prioritisation would focus on other aspects; not all projects were yet costed, and available costings were only estimates.
The confirmed criteria were grouped as a hierarchical “value tree” (Exhibit 2), where the two most important were strategic importance and potential returns. Over the next six weeks scores were allocated or confirmed for the remaining projects.
Mary Livingston took over as the Ministry of Fisheries’ representative at the start of the prioritisation process. She felt it was laborious but ultimately rewarding, and an excellent way to understand what others’ projects were about.
“It was unrelenting, the meetings went on and on and on…We just had to fit other work in around it, and keep going. I remember thinking, this is going nowhere, there are lots of people against it because they think this is going to suck money out of other research areas.” 7
However, it was worth persisting with because of the opportunities only this cross-agency collaboration could offer, she thought.
5 See Goodwin,P, and G. Wright (1998), Decision Analysis for Management Judgement, Wiley, Chichester ,p29. 6 Vicky Mabin interview 7 Mary Livingston, Principal Fisheries Scientist with MFish and previously with NIWA.
4
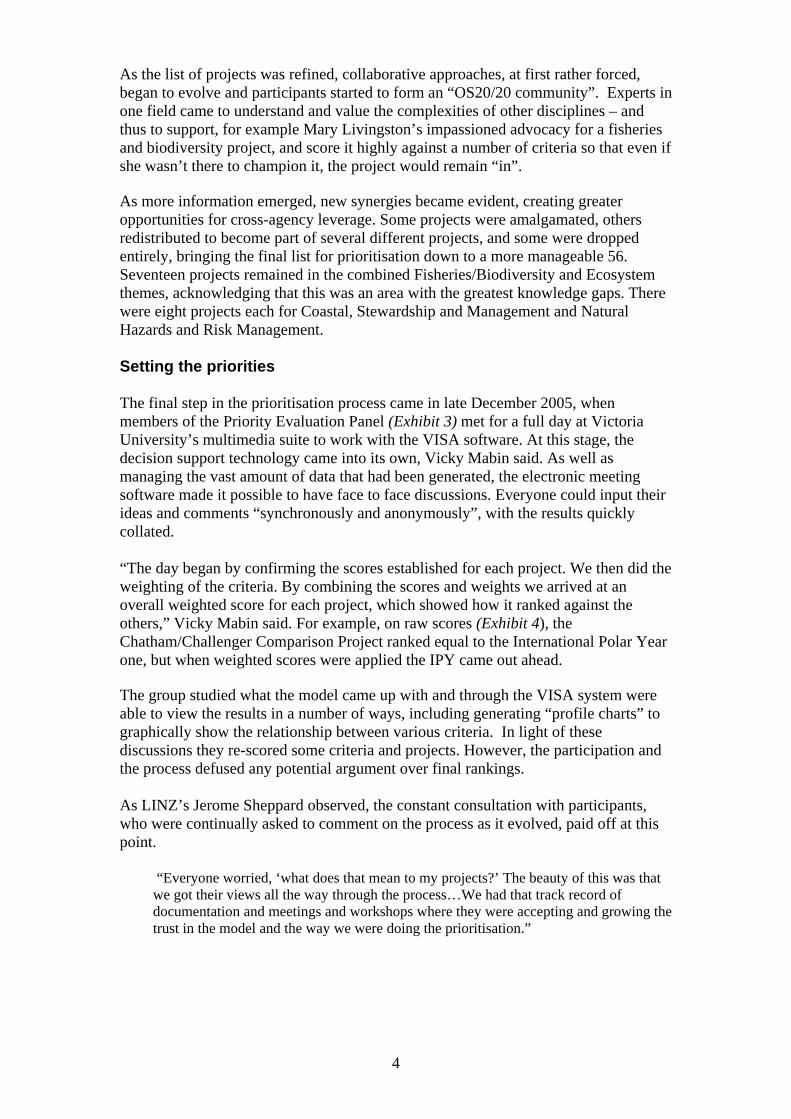
As the list of projects was refined, collaborative approaches, at first rather forced, began to evolve and participants started to form an “OS20/20 community”. Experts in one field came to understand and value the complexities of other disciplines – and thus to support, for example Mary Livingston’s impassioned advocacy for a fisheries and biodiversity project, and score it highly against a number of criteria so that even if she wasn’t there to champion it, the project would remain “in”.
As more information emerged, new synergies became evident, creating greater opportunities for cross-agency leverage. Some projects were amalgamated, others redistributed to become part of several different projects, and some were dropped entirely, bringing the final list for prioritisation down to a more manageable 56. Seventeen projects remained in the combined Fisheries/Biodiversity and Ecosystem themes, acknowledging that this was an area with the greatest knowledge gaps. There were eight projects each for Coastal, Stewardship and Management and Natural Hazards and Risk Management.
Setting the priorities
The final step in the prioritisation process came in late December 2005, when members of the Priority Evaluation Panel (Exhibit 3) met for a full day at Victoria University’s multimedia suite to work with the VISA software. At this stage, the decision support technology came into its own, Vicky Mabin said. As well as managing the vast amount of data that had been generated, the electronic meeting software made it possible to have face to face discussions. Everyone could input their ideas and comments “synchronously and anonymously”, with the results quickly collated.
“The day began by confirming the scores established for each project. We then did the weighting of the criteria. By combining the scores and weights we arrived at an overall weighted score for each project, which showed how it ranked against the others,” Vicky Mabin said. For example, on raw scores (Exhibit 4), the Chatham/Challenger Comparison Project ranked equal to the International Polar Year one, but when weighted scores were applied the IPY came out ahead.
The group studied what the model came up with and through the VISA system were able to view the results in a number of ways, including generating “profile charts” to graphically show the relationship between various criteria. In light of these discussions they re-scored some criteria and projects. However, the participation and the process defused any potential argument over final rankings.
As LINZ’s Jerome Sheppard observed, the constant consultation with participants, who were continually asked to comment on the process as it evolved, paid off at this point.
“Everyone worried, ‘what does that mean to my projects?’ The beauty of this was that we got their views all the way through the process…We had that track record of documentation and meetings and workshops where they were accepting and growing the trust in the model and the way we were doing the prioritisation.”

5
As well, “When you’re discussing a list of data, and discussing each project using the same set of criteria, it tends to defuse any potential acrimony,” Vicky Mabin commented. The sensitivity analysis carried out as the final stage of the prioritisation process was also an important means of assuring people of the integrity of the priorities. It could quickly be shown what difference it would make if dramatic changes were made to the weightings (ie relative importance) for each criterion. Available cost information was used to get a rough assessment of project value vs costs, before the “top 20” projects were established. These faced further scrutiny. Top priority The final rankings were established after the group reconvened for half a day in the multi-media suite. As part of the last overview of the process, they debated whether the same priorities would emerge if, for instance, the results were tested against other criteria such as the political mileage or profile to be gained. It was at this point that the International Polar Year project was confirmed as the number one priority, as “New Zealand’s major contribution to the International Polar Year Census of Antarctic Marine Life,” and the only project in the Sovereignty theme. As well as meeting a number of international obligations it was also an area of particular interest to Prime Minister Helen Clark. Completing the top four (for locations see Exhibit 5) were:
2= the Coastal Far North-North and East project (Coastal Stewardship and Management) covering 1200 km of coastline “of particular interest due to high biodiversity values, impact of fishing on habitat and increasing population and related coastal development….[and] vulnerable to tsunami generated from northern marine hazards.” Almost all shipping coming in to New Zealand travels along this coast.
2= The Coastal Foveaux-Stewart Island (also Coastal) to “provide information about
topography, substrate type and significant ecological communities of the coasts and seabed” of another area of high biodiversity and fishing value, prone to tsunamis.
4. The Chatham/Challenger Comparison. “The comparison is important because according to the Marine Environment Classification these are areas with similar seabeds and very different productivity…The Chatham Rise is one of New Zealand’s most fished areas and the data gathering will provide considerable information about the effects of fishing on the seabed and biodiversity in the area.” 8
A useful process Despite the hours they were immersed in it, many of the participants emerged as passionate advocates for the multi-criteria decision-making process and the disciplines it imposed. It was not long before LINZ was applying it to another across-government project, this time in the geospatial area.
8 CBC (06) 45 Appendix 2: OS20/20 needs-based project list, p22

6
LINZ’s Kevin Kelly said the multi-criteria framework delivered all that he had hoped for. “It’s an absolutely brilliant tool for breaking up silos and getting a prioritised programme.” The same decision might eventually have been reached without the technology, if not the process. However the software helped to generate an agreed framework that people could trust to deliver in a reasonable timeframe, he said. LINZ’s Jerome Sheppard cautioned that the final prioritisation process only worked as quickly and well as it did because those taking part were sufficiently expert in their own areas, and well-informed of the big picture to be able to make quick-judgements on trade-off possibilities. Mary Livingston from MFish felt that the approach could be used more widely across government as the networks and relationships established continued to generate successful interactions between departments that previously might have felt they had little in common. Others felt that the value of the process should be kept in proportion. “MCDA is old technology but it was successful in hammering out a list of projects and getting consensus to prioritise them,” in the view of the Ministry of Research, Science and Technology. The Ministry also pointed out that its effectiveness would be limited unless it was used in the context of other initiatives, such as new funding options. Facilitator Vicki Mabin looked back at the MCDA process as applied to OS20/20 as a very good piece of work, and an advance on what had been done previously although it involved such a large number of agencies. “The work programme projects were so different. If you had relied on an intuitive method people would simply be pushing their own barrows, so you needed to have some sort of level playing field.” The effort put in to ensure everyone was interpreting the criteria and scoring in the same way paid off, she thought. However, she too cautioned that MCDA shouldn’t be treated as a “one-pass set of steps”. It is only one of a set of techniques that should be used. “Other approaches are needed to explore what other actions, such as infrastructure, coordination or support systems need putting in place to enable the projects to deliver their full potential.” For Ray Wood from the Institute of Geological and Nuclear Sciences, a major flaw was not having any provision to review the priorities on a regular basis. “Things will change, so we should be looking at things again. Do we still think that project x should stay as number 4, or should project 56 come up?” Like others, including Project Manager Dawn Brook, he felt that the involvement of so many subject experts, and the commitment of the participants, delivered a final project ranking that was appropriate, even if the prioritisation process would not meet the strict requirements of scientific peer review. A greater concern for Dawn Brook was the pressure of time at the final stage and its impact on the integrity of the decision-making. She would have liked to see more time for participants to challenge some of the ratings, although “I suspect actually that the output we would have got would have been not much different had we had time to

7
do it better,” and some participants would undoubtedly have rioted if “tied up for days and days” to make decisions. However, her lasting impression of what was an exhilarating project to be involved with, is how the OS20/20 process established “a great deal more understanding between some of those agencies of each other’s work, and each other’s passions, and how those passions conflict, and hopefully also how they could achieve things together that didn’t damage each others’ interests.” The priorities go to Cabinet The final task was to put detailed figures on the estimated costs of the full 56-project work programme. In the short time available, these were largely based on NIWA calculations of vessel and service costs. There was some debate about the wisdom of presenting the full list, fully costed, to Cabinet all at once. However, in February 2006, the prioritised projects were forwarded to Cabinet, with the calculation that it would cost $733 million, or $49 million a year, to complete the list by 2020.

8
Exhibit 1: The New Family Car The following example illustrates the key steps of MCA:
1. Determination of the criteria for assessing options 2. Determination of the scoring scales for measuring each option against each
criterion 3. Determining the ‘meaning’ of the points on the scale 4. Determining the relative weighting of each criterion to the total
(a) Determining the criteria, the scoring scales, and the “meaning” of points on the scale
The Drivealot family has decided to buy a new car that can be used mainly for travel around the city and to take part in a car pooling scheme. After much debate they have decided on the main criteria for the vehicle and have set a 10-point scoring scale. On this scale, lower numbers mean a poorer performance against the criterion, so therefore: Criterion 1: Acceleration: A score of 2 means a slow takeoff while 10 could compete in a drag race. 8 would “avoid embarrassment at the traffic lights”. Criterion 2: Comfort for 5: 2 would mean it’s a tight fit for five adults, while 8 would give them ample space and 10 would include arm-rests for each seat. Criterion 3: Luggage: 2 would mean it would be difficult to carry large items while 8 would mean wheelchairs or household appliances fit in comfortably and 10 would mean each of the 5 passengers could take a big suitcase. Criterion 4: Cost The family wants to get value for money, so in this case a low score equates with a high price and a high score equates with a lower price. A 0 would represent the maximum they would be able to pay, while an 8 would have a lot of extras included in the price. Table A shows the scores they arrived at: Type of car Criteria Acceleration
to 60 kmph Comfort for 5
Luggage space
Cost
Oyotat 5 8 7 8 Eldenho 7 8 4 7 Donha 4 3 8 5 Drof 8 4 3 9

9
(b) Determining the relative weighting of each criterion to the total.
The next step is to decide the weightings to apply to each criterion. These must add up to 1, so each will be a proportion of one. This is where the family decides which of the four criteria are most important to them. Despite the pleas of the teenage son, the majority vote is for comfort, followed by cost. As this is an around town car, luggage capacity comes last. The weightings they decide are Acceleration: .15 Comfort .45 Luggage .05 Cost .35 Table B shows the calculation of weighted scores Type of car Criteria Acceleratio
n to 60 kmph
Comfort for five adults
Luggage space
Cost Total of weighted scores/priority rank
Weighted scores
Weighting: .15
Weighting: .45
Weighting.05
.35
Oyotat 5x.15=.75 8x.45=3.6 7x.05=.35 8x.39=2.8. 7.5(1) Ehldono 7x.15=1.05 8x.45= 3.6 4x.05=.2 7x.39=2.45 7.3 (2) Donha 4x.15=0.6 3x.45=1.35 8x.05=.4 5x.351.75 4.1 (4) Drof 8x.15=1.2 4x.45=1.8 3x.05=.15 9x.353.15 6.3 (3) There are two close contenders, but in the end one winning brand. Now they just have to decide the preferred colour….
(c) Sensitivity analysis This is how the family could see what would happen if the teenage son had got his preferences. His priorities would assign the following weights: Acceleration: .55 Comfort .05 Luggage .05 Cost .35 Table C shows how the final priorities are sensitive to changed weightings Type of car Criteria
Acceleratio
n to 60 kmph
Comfort for five adults
Luggage space
Cost Total of weighted scores/priority rank
Weighted scores
Weighting: .55
Weighting: .05
Weighting.05
Weighting: .35
Oyotat 5x.55=2.75 8x.05=0.4 7x..05=.35 8x.35=2.8 6.3 (3rd) Ehldono 7x.55=3.85 8x.05+ 0.4 4x.05=.2 7x.35=2.45 6.9 (2nd) Donha 4x.55=2.2 3x.05=0.15 8x.05=.4 5x.35=1 75 4.5 (4th) Drof 8x.55=4.4 4x.05=.2 3x.05=.15 9x.35=3.15 7.9 (1st)

10
Exhibit 2: The value tree for Ocean Survey 20/20 projects
How criteria were defined: for example Strategic Importance includes: degree of significance of the issue as evidenced by a) government attention and b) the attention of a department of government; the risk to New Zealand f the issue is not addressed; the degree of centrality of the project to the OS20/20 goals. Source : Kemsley, Vicky Mabin notes
Exhibit 3: The priority evaluation panel
Name Role/area of interest Antarctica New Zealand Ltd Crown entity: management of government activities in Antarctica Department of Conservation Marine conservation and biodiversity Institute of Geological and Nuclear Science (GNS Science)
Crown Research Institute; geological mapping of the undersea, seismic surveys
Land Information New Zealand (LINZ) (Chair; Ministerial group)
Co-ordinating agency; hydrographic charting; lessor of Tangaroa
Ministry for the Environment Biodiversity strategy; Oceans Policy Ministry of Economic Development Hydrocarbon and mineral exploration Ministry of Fisheries Fisheries and biodiversity Ministry of Foreign Affairs and Trade
Sovereignty, law of the sea
National Institute for Water and Atmospheric Science (NIWA)
Crown Research Institute Climate and ocean research; owner of Tangaroa
New Zealand Defence Force New Zealand navy; sovereignty; deep sea survey Regional councils Represented by Environment Bay of Plenty

Exhibit 4: How the OS20/20 projects were scored The table below shows the scores allocated to ten different projects, according to the criteria listed in the value tree (from left to right). The eventual ”top 4” are highlighted. Theme codes: BF: Fisheries, biodiversity and ecosystems; CL: Climate HZ: Hazards; HC: Hydrocarbons; MS:Maritime safety; MN; minerals; SO: sovereignty; CO: Coastal stewardship and management
Value tree listing STRATEGIC IMPORTANCE POTENTIAL RETURNS Raw
score Magnitude of potential returns Probability of potential returns Total Project scores on all criteria Criteria Project Names
Govt policy interest
Users of the data (operational level)
Timing + urgency
Information gap
Exploitable new resource
Managing/ protecting resource
Scientific knowledge and understanding (SK+U)
Exploitable new resource returns
Managing /protecting resource returns
SK+U returns
BF001Chathams 7 6 5 7 2 5 5 8 5 8 58
BF002Chatham /Challenger
8 9 9 8 2 9 7 8 9 8 77
Cl001Moorings 7 7 9 8 0 5 8 0 5 8 57
Hz001Puysegur 5 6 5 4 4 5 5 2 8 8 52
Hc001Reinga 9 6 10 7 9 5 7 2 6 8 69
MS001Snares 5 7 5 4 0 5 4 0 9 9 48
Mn001Bellona 2 5 2 7 2 3 4 4 6 8 43
So001International Polar Year
9 9 8 8 5 9 8 1 10 10 77
Co001FarNorth 9 9 9 7 2 8 7 8 8 6 73
Co008Foveaux 9 9 9 5 2 9 7 8 8 8 74

12
WEIGHTINGS USED IN CALCULATION Note: The weightings under “strategic importance” add up to 1, as do the weights under “potential returns” and “probability of potential returns.” ` STRATEGIC IMPORTANCE POTENTIAL RETURNS Magnitude of potential returns Probability of potential returns Project So 001: International Polar Year
Govt policy interest
Users of data (operational level)
Timing and urgency
Information gap
Exploitable new resource
Managing/ protecting resource
Scientific knowledge + understanding )SK+U)
Exploitable new resource
Managing/ protecting resource
SK+U returns
Score 9 9 8 8 5 9 8 1 10 10 Weight 0.37 0.185 0.260 0.185 0.350 0.360 0.290 0.333 0.333 0.333 Weighted score 3.33 1.665 2.08 1.48 1.75 3.24 2.32 0.33 3.3 3.3 Total this “branch” 8.555 7.31 6.993 7.1515 Weight top “branch” .44 .56 Total value top branch
3.762 4.004
Total value project 7.7684 STRATEGIC IMPORTANCE POTENTIAL RETURNS Magnitude of potential returns Probability of potential returns Project BF 002 Chatham/challenger
Govt policy interest
Users of data (operational level)
Timing and urgency
Information gap
Exploitable new resource
Managing/ protecting resource
Scientific knowledge + understanding )SK+U)
Exploitable new resource
Managing/ protecting resource
SK+U returns
Score 8 9 9 8 2 9 7 8 9 8 Weight 0.37 0.185 0.260 0.185 0.350 0.360 0.290 0.333 0.333 0.333 Weighted score 2.96 1.665 2.34 1.48 0.7 3.24 2.03 2.664 2.997 2.664 Total this “branch” 8.445 5.97 8.325 7.1475 Weight top “branch” .44 .56 Total value top branch 3.7158 4.0026 Total value project 7.7184

13
Exhibit 5: Location of Ocean Survey 20/20 projects
Source: Kemsley, page 51