Embed Size (px)
Citation preview

Prepared in cooperation with the City of Wichita
Occurrence of Cyanobacteria, Microcystin, and Taste-and-Odor Compounds in Cheney Reservoir, Kansas, 2001–16
Scientific Investigations Report 2017–5016
U.S. Department of the InteriorU.S. Geological Survey

Cover. Cheney Reservoir, Kansas. Photographs from U.S. Geological Survey.
Discrete samples collected from a near-shore accumu-lation of cyanobacteria (left) and an open-water area (right) in Cheney Reservoir, Kansas.
Cyanobacterial accumulation near the glory hole spillway at Cheney Dam.
Continuous water-quality instrumentation deployed in Cheney Reservoir, Kansas.
Equipment for near real-time transition of continuous water-quality data.

Occurrence of Cyanobacteria, Microcystin, and Taste-and-Odor Compounds in Cheney Reservoir, Kansas, 2001–16
By Jennifer L. Graham, Guy M. Foster, Thomas J. Williams, Ariele R. Kramer, and Theodore D. Harris
Prepared in cooperation with the City of Wichita
Scientific Investigations Report 2017–5016
U.S. Department of the InteriorU.S. Geological Survey

U.S. Department of the InteriorRYAN K. ZINKE, Secretary
U.S. Geological SurveyWilliam H. Werkheiser, Acting Director
U.S. Geological Survey, Reston, Virginia: 2017
For more information on the USGS—the Federal source for science about the Earth, its natural and living resources, natural hazards, and the environment—visit https://www.usgs.gov or call 1–888–ASK–USGS.
For an overview of USGS information products, including maps, imagery, and publications, visit https://store.usgs.gov.
Any use of trade, firm, or product names is for descriptive purposes only and does not imply endorsement by the U.S. Government.
Although this information product, for the most part, is in the public domain, it also may contain copyrighted materials as noted in the text. Permission to reproduce copyrighted items must be secured from the copyright owner.
Suggested citation:Graham, J.L., Foster, G.M., Williams, T.J., Kramer, A.R., and Harris, T.D., 2017, Occurrence of cyanobacteria, microcys-tin, and taste-and-odor compounds in Cheney Reservoir, Kansas, 2001–16: U.S. Geological Survey Scientific Investiga-tions Report 2017–5016, 57 p., https://doi.org/10.3133/sir20175016.
ISSN 2328-0328 (online)

iii
Contents
Abstract ...........................................................................................................................................................1Introduction.....................................................................................................................................................2
Purpose and Scope ..............................................................................................................................2Description of the Study Area ............................................................................................................2
Methods...........................................................................................................................................................3Continuous Water-Quality Monitoring...............................................................................................3Discrete Water-Quality Sampling.......................................................................................................4Correlation Analysis .............................................................................................................................5Development of Logistic Regression Models for Microcystin and Geosmin .............................5
Occurrence of Cyanobacteria and Associated Compounds in Cheney Reservoir .............................6Cyanobacterial Abundance ................................................................................................................6Microcystin ............................................................................................................................................9Geosmin and 2-Methylisoborneol ....................................................................................................10Co-occurrence of Microcystin and Taste-and-Odor Compounds ..............................................10
Logistic Regression Models for Microcystin and Geosmin ..................................................................11Microcystin ..........................................................................................................................................11Geosmin ................................................................................................................................................14
Summary........................................................................................................................................................14References Cited..........................................................................................................................................15Appendix 1. 14-Year Logistic Regression Model Archival Summary for Microcystin
Occurrence at Station 07144790, 2003–16 ..................................................................................20Appendix 2. 4-Year Logistic Regression Model Archival Summary for Microcystin
Occurrence at Station 07144790, 2013–16 ..................................................................................31Appendix 3. 16-Year Logistic Regression Model Archival Summary for Geosmin
Occurrence at Station 07144790, 2001–16 ..................................................................................38Appendix 4. 4-Year Logistic Regression Model Archival Summary for Geosmin
Occurrence at Station 07144790, 2013–16 ..................................................................................51

iv
Figures
1. Map showing location of the U.S. Geological Survey water-quality monitoring station in Cheney Reservoir and land use in the Cheney Reservoir watershed ................3
2. Graphs showing seasonal patterns in Cheney Reservoir, Kansas, May 2001 through June 2016 ........................................................................................................................8
3. Graphs showing comparison of previously and newly developed logistic model accuracy in Cheney Reservoir .................................................................................................13
Tables
1. Statistical summaries of cyanobacterial abundance, microcystin, geosmin, and 2-methylisoborneol data collected at Cheney Reservoir, Kansas, May 2001 through June 2016 .......................................................................................................................................7
2. Best fit multiple logistic regression models for microcystin and geosmin at Cheney Reservoir, Kansas, May 2001 through June 2016 ..................................................................12
Conversion FactorsU.S. customary units to International System of Units
Multiply By To obtain
Length
foot (ft) 0.3048 meter (m)micrometer (µm) 0.001 millimeter (mm)
Area
square mile (mi2) 2.590 square kilometer (km2) Volume
acre-foot (acre-ft) 1,233 cubic meter (m3)acre-foot (acre-ft) 0.001233 cubic hectometer (hm3)

v
Datum
Horizontal coordinate information is referenced to the North American Datum of 1927 (NAD 27).
Supplemental Information
Concentrations of chemical constituents in water are given in either micrograms per liter (µg/L) or nanograms per liter (ng/L).
Abundances are given in cells per milliliter (cells/mL).
Abbreviations
AVLD absolute value logarithmic difference
CyanoHAB cyanobacterial harmful algal bloom
KDHE Kansas Department of Health and Environment
MIB 2-methylisoborneol
QA/QC quality assurance and quality control
p-value probability value
RPD relative percentage difference
TPPC threshold probability for positive classification
USGS U.S. Geological Survey


Occurrence of Cyanobacteria, Microcystin, and Taste-and-Odor Compounds in Cheney Reservoir, Kansas, 2001–16
By Jennifer L. Graham, Guy M. Foster, Thomas J. Williams, Ariele R. Kramer, and Theodore D. Harris
AbstractCheney Reservoir, located in south-central Kansas, is one
of the primary drinking-water supplies for the city of Wichita and an important recreational resource. Since 1990, cyano-bacterial blooms have been present occasionally in Cheney Reservoir, resulting in increased treatment costs and decreased recreational use. Cyanobacteria, the cyanotoxin microcystin, and the taste-and-odor compounds geosmin and 2-methyl-isoborneol have been measured in Cheney Reservoir by the U.S. Geological Survey, in cooperation with the city of Wichita, for about 16 years. The purpose of this report is to describe the occurrence of cyanobacteria, microcystin, and taste-and-odor compounds in Cheney Reservoir during May 2001 through June 2016 and to update previously published logistic regres-sion models that used continuous water-quality data to estimate the probability of microcystin and geosmin occurrence above relevant thresholds.
Cyanobacteria, microcystin, and geosmin were detected in about 84, 52, and 31 percent of samples collected in Cheney Reservoir during May 2001 through June 2016, respectively. 2-methylisoborneol was less common, detected in only 3 percent of samples. Microcystin and geosmin concentrations exceeded advisory values of concern more frequently than cya-nobacterial abundance; therefore, cyanobacteria are not a good indicator of the presence of these taste-and-odor compounds in Cheney Reservoir. Broad seasonal patterns in cyanobacteria and microcystin were evident, though abundance and concentra-tion varied by orders of magnitude across years. Cyanobacte-rial abundances generally peaked in late summer or early fall (August through October), and smaller peaks were observed in winter (January through February). In a typical year, microcys-tin was first detected in June or July, increased to its seasonal maxima in the summer (July through September), and then decreased. Seasonal patterns in geosmin were less consistent than cyanobacteria and microcystin, but geosmin typically had a small peak during winter (January through March) during most years and a large peak during summer (July through September) during some years. Though the relation between cyanobacterial abundance and microcystin and geosmin concentrations was positive, overall correlations were weak, likely because produc-tion is strain-specific and cyanobacterial strain composition
may vary substantially over time. Microcystin often was present without taste-and-odor compounds. By comparison, where taste-and-odor compounds were present, microcystin frequently was detected. Taste-and-odor compounds, therefore, may be used as indicators that microcystin may be present; however, microcystin was present without taste-and-odor compounds, so taste or odor alone does not provide sufficient warning to ensure human-health protection.
Logistic regression models that estimate the probability of microcystin occurrence at concentrations greater than or equal to 0.1 micrograms per liter and geosmin occurrence at concentrations greater than or equal to 5 nanograms per liter were developed. Models were developed using the complete dataset (January 2003 through June 2016 for microcystin [14-year dataset]; May 2001 through June 2016 for geosmin [16-year dataset]) and an abbreviated 4-year dataset (January 2013 through June 2016 for microcystin and geosmin). Per-formance of the newly developed models was compared with previously published models that were developed using data collected during May 2001 through December 2009. A seasonal component and chlorophyll fluorescence (a surrogate for algal biomass) were the explanatory variables for microcystin occur-rence at concentrations greater than or equal to 0.1 micrograms per liter in all models. All models were relatively robust, though the previously published and 14-year models performed better over time; however, as a tool to estimate microcystin occur-rence at concentrations greater than or equal to 0.1 micrograms per liter in a real-time notification system near the Cheney Dam, the 4-year model is most representative of recent (2013 through 2016) conditions. All models for geosmin occurrence at concentrations greater than or equal to 5 nanograms per liter had different explanatory variables and model forms. The previously published and 16-year models were not robust over time, likely because of changing environmental conditions and seasonal patterns in geosmin occurrence. By comparison, the abbreviated 4-year model may be a useful tool to estimate geosmin occurrence at concentrations greater than or equal to 5 nanograms per liter in a real-time notification system near the Cheney Dam. The better performance of the abbreviated 4-year geosmin model during 2013 through 2016 relative to the previ-ously published and 16-year models demonstrates the need for continuous reevaluation of models estimating the probability of occurrence.

2 Occurrence of Cyanobacteria, Microcystin, and Taste-and-Odor Compounds in Cheney Reservoir, Kansas, 2001–16
IntroductionCyanobacteria (also called blue-green algae) cause a
multitude of water-quality concerns, including the potential to produce toxins and taste-and-odor compounds. Toxins and taste-and-odor compounds may cause substantial economic and public health concerns and are of particular interest in lakes, reservoirs, and rivers that are used for drinking-water supply and recreation (Graham and others, 2008). Cyanobac-terial toxins (cyanotoxins) have been implicated in human and animal illness and death in at least 43 States in the United States, including Kansas (Graham and others, 2009; Trevino-Garrison and others, 2015). Several countries have set national standards or guidelines for cyanotoxins in drink-ing water (Hudnell, 2008). The U.S. Environmental Protec-tion Agency recently (2015) released health advisory values for the cyanotoxins microcystin and cylindrospermopsin in finished drinking water. The 10-day health advisory values for microcystin in finished drinking water are 0.3 microgram per liter (μg/L) for young children (less than six years old) and 1.6 μg/L for all other ages. The 10-day health advisory values for cylindrospermopsin are 0.7 μg/L for young children and 3.0 μg/L for all other ages (U.S. Environmental Protection Agency, 2015). Many U.S. States have established monitor-ing programs to minimize potential exposure to cyanotoxins through recreational activities (Graham and others, 2009). The Kansas Department of Health and Environment (KDHE) uses two advisory levels to issue recreational public health advi-sories or warnings for cyanobacterial harmful algal blooms (CyanoHABs) in Kansas reservoirs. Cyanobacterial abun-dances between 80,000 and 250,000 cells per milliliter (cells/mL) or microcystin concentrations between 4 and 20 µg/L are the current (2016) advisory levels for public health watches; cyanobacterial abundances or microcystin concentrations greater than or equal to 250,000 cells/mL and 20 µg/L are the current advisory levels for public health warnings (KDHE, 2015). Unlike cyanotoxins, taste-and-odor compounds have no known effects on human health, and there are no regula-tions or advisory values for these compounds. Aesthetic issues are associated with taste-and-odor compounds at low con-centrations (5 to 10 nanograms per liter [ng/L]), and remedial actions commonly are implemented as soon as taste or odor is detected in a drinking-water supply (Taylor and others, 2005).
Cheney Reservoir, located in south-central Kansas (fig. 1), is one of the primary drinking-water supplies for the city of Wichita and an important recreational resource. Dur-ing 1995 through 2013, about 70 percent of Wichita’s annual municipal water supply came from Cheney Reservoir (Han-sen and others, 2014). Because of population growth, urban development, and water-supply needs, the city of Wichita will continue to rely on Cheney Reservoir as a drinking-water supply for the foreseeable future. Since 1990, cyanobacterial blooms have been present occasionally in Cheney Reservoir, resulting in increased treatment costs and decreased recre-ational use (Christensen and others, 2006; Kansas Depart-ment of Health and Environment, 2016a). Since April 2001,
the U.S. Geological Survey (USGS), in cooperation with the city of Wichita, has routinely collected discrete samples for cyanobacteria, the cyanotoxin microcystin, and taste-and-odor compounds; and has continuously measured water-quality conditions to develop a real-time notification system of chang-ing water-quality conditions that may affect drinking-water treatment.
Purpose and Scope
Cyanobacteria, the cyanotoxin microcystin, and the taste-and-odor compounds geosmin and 2-methylisoborneol (MIB) have been measured in Cheney Reservoir (fig. 1) for about 16 years. The purpose of this report is to describe the occur-rence of cyanobacteria, microcystin, and taste-and-odor com-pounds in Cheney Reservoir during May 2001 through June 2016 and to update previously published logistic regression models that used continuous water-quality data to estimate the probability of microcystin and geosmin occurrence above relevant thresholds (Stone and others, 2013). A detailed analy-sis of the environmental factors related to the occurrence of cyanobacteria, microcystin, and taste-and-odor compounds in Cheney Reservoir and changes over time are beyond the scope of this report. Quantification of cyanobacteria, microcystin, and taste-and-odor compounds in Cheney Reservoir over a relatively long period will provide the city of Wichita and the State of Kansas a better understanding of associated water-quality concerns in the reservoir with respect to drinking water and recreational activities. The logistic regression models presented in this report provide useful indicators of microcys-tin and geosmin occurrence in Cheney Reservoir. In addition, the methods used in this study could be applied to other sites regionally, nationally, and globally.
Description of the Study Area
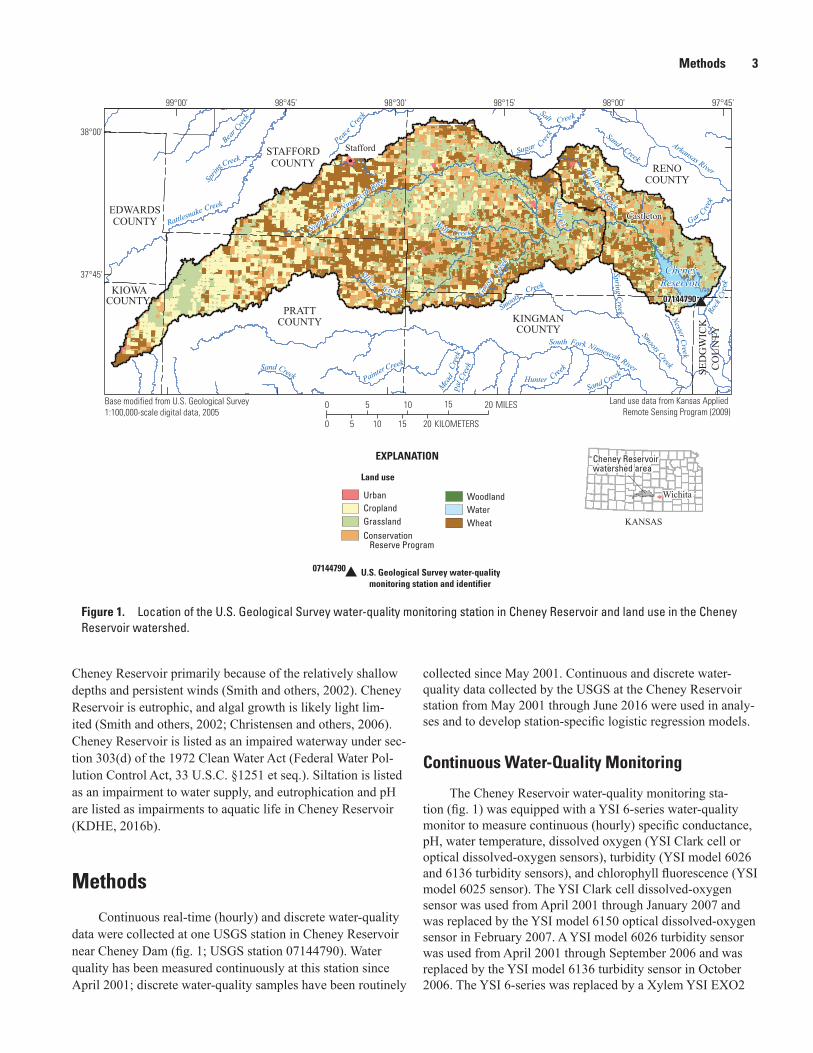
Cheney Reservoir, located in south-central Kansas (fig. 1), was constructed by the Bureau of Reclamation, U.S. Department of the Interior, between 1962 and 1965. The primary purpose of Cheney Reservoir was to provide the city of Wichita, Kansas, with a reliable municipal water supply, downstream flood control, wildlife habitat, and recreational areas (Bureau of Reclamation, 2016). Cheney Reservoir has a contributing watershed of 933 square miles (mi2). Land use in the Cheney Reservoir watershed predominately is rural; less than 1 percent of the land use in the watershed is classi-fied as urban (fig. 1). All agricultural crops, including wheat, compose about 51 percent of the land use. About 26 percent of the watershed for Cheney Reservoir is grassland and about 18 percent is Conservation Reserve Program land (Peterson and others, 2010).
At a pool elevation of 1,420.7 feet (ft), Cheney Reservoir has a maximum depth of 41 ft, a mean depth of 16.8 ft, and a surface area of about 15.5 mi2 (Kansas Biological Survey, 2012). Thermal and chemical stratification rarely happen in
Methods 3
SED
GW
ICK
CO
UN
TY
KINGMANCOUNTY
KIOWACOUNTY
PRATTCOUNTY
PAWNEECOUNTY
STAFFORDCOUNTY
EDWARDSCOUNTY
RENOCOUNTY
CheneyReservoirCheney
Reservoir0714478007144790
Creek Creek
Creek
Creek
Creek
Creek
Creek Cree
k
CreekCreek
Bear
Sprin
gRattlesnake
SandPainter
South Fork Ninnescah River
Pat C
reek
Sand Creek
Mead
SugarSand
Rock
Cre
ek
Gar Creek
Peace
Creek
Creek
Smoots Creek
Spring
Nester Creek
Smoots Creek
WolfWolf
Salt
North Fork Ninnesc
ah River
North Fork Ninnesc
ah River
SilverSilver
CreekCreek
CreekCreek
CreekCreek
Creek
Creek
CrCr
Goose
Goose
Red Rock
Red Rock
IrishIrish
Hunter
Arkansas River
Stafford
CastletonCastleton
97°45'98°00'98°15'98°30'98°45'99°00'
38°00'
37°45'
Base modified from U.S. Geological Survey1:100,000-scale digital data, 2005
Land use data from Kansas Applied Remote Sensing Program (2009)
WichitaWichita
Cheney Reservoirwatershed area
EXPLANATION
U.S. Geological Survey water-quality monitoring station and identifier
Land use
UrbanCroplandGrassland
WoodlandWaterWheat
Cheney Reservoirwatershed area
0 10 15 205 MILES
0 10 205 15 KILOMETERS
Conservation Reserve Program
07144790
KANSAS
Figure 1. Location of the U.S. Geological Survey water-quality monitoring station in Cheney Reservoir and land use in the Cheney Reservoir watershed.
Cheney Reservoir primarily because of the relatively shallow depths and persistent winds (Smith and others, 2002). Cheney Reservoir is eutrophic, and algal growth is likely light lim-ited (Smith and others, 2002; Christensen and others, 2006). Cheney Reservoir is listed as an impaired waterway under sec-tion 303(d) of the 1972 Clean Water Act (Federal Water Pol-lution Control Act, 33 U.S.C. §1251 et seq.). Siltation is listed as an impairment to water supply, and eutrophication and pH are listed as impairments to aquatic life in Cheney Reservoir (KDHE, 2016b).
Methods
Continuous real-time (hourly) and discrete water-quality data were collected at one USGS station in Cheney Reservoir near Cheney Dam (fig. 1; USGS station 07144790). Water quality has been measured continuously at this station since April 2001; discrete water-quality samples have been routinely
collected since May 2001. Continuous and discrete water-quality data collected by the USGS at the Cheney Reservoir station from May 2001 through June 2016 were used in analy-ses and to develop station-specific logistic regression models.
Continuous Water-Quality Monitoring
The Cheney Reservoir water-quality monitoring sta-tion (fig. 1) was equipped with a YSI 6-series water-quality monitor to measure continuous (hourly) specific conductance, pH, water temperature, dissolved oxygen (YSI Clark cell or optical dissolved-oxygen sensors), turbidity (YSI model 6026 and 6136 turbidity sensors), and chlorophyll fluorescence (YSI model 6025 sensor). The YSI Clark cell dissolved-oxygen sensor was used from April 2001 through January 2007 and was replaced by the YSI model 6150 optical dissolved-oxygen sensor in February 2007. A YSI model 6026 turbidity sensor was used from April 2001 through September 2006 and was replaced by the YSI model 6136 turbidity sensor in October 2006. The YSI 6-series was replaced by a Xylem YSI EXO2

4 Occurrence of Cyanobacteria, Microcystin, and Taste-and-Odor Compounds in Cheney Reservoir, Kansas, 2001–16
water-quality monitor in October 2014 and measured the same water-quality parameters. All data are considered comparable during the period of record despite the changes in the water-quality monitor during the course of the study. There are some documented differences in 6026 and 6136 turbidity sensor. Stone and others (2013) developed a relation to convert 6026 turbidity data to 6136 turbidity data; however, there was a lot of scatter around the relation. In the dataset used for analyses in this report, the difference in corrected and uncorrected 6026 turbidity values was 12 formazin nephelometric units or less (median=0.2), so no adjustments were made to turbidity val-ues. Reservoir elevation was measured using a Design Analy-sis H–350 nonsubmersible pressure transducer and H–355 gas system. The water-quality monitor and pressure transducer were maintained in accordance with standard USGS proce-dures (Wilde, variously dated; Wagner and others, 2006; Sauer and Turnipseed, 2010). Continuous water-quality data were recorded hourly and are available through the USGS National Water Information System database at https://doi.org/10.5066/F7P55KJN.
Sensor maxima were not exceeded for any of the physi-cochemical properties measured, with the exception of one flu-orescence measurement (409 µg/L; sensor maxima=400 µg/L) on August 11, 2003. According to the guidelines established in Wagner and others (2006), during 2001 through 2016, 92 percent of the continuous data were rated as excellent (requir-ing corrections of less than plus or minus 5 percent), 4 percent were rated as good (requiring corrections of less than plus or minus 10 percent), 2 percent were rated as fair (requiring cor-rections of less than plus or minus 15 percent), and 2 percent were rated as poor (requiring corrections of greater than plus or minus 15 percent). Time-series measurements occasionally were missing or deleted from the dataset because of equip-ment malfunction, excessive fouling caused by environmental conditions, or temporary removal of the sensors because of ice on the reservoir. During April 2001 through June 2016, about 5 percent of the water temperature record; 11 percent of the turbidity record; 9 percent of the dissolved oxygen record; and 7 percent of the specific conductance, pH, and fluorescence records were missing or deleted, largely because of sensor removal during ice cover.
Discrete Water-Quality Sampling
Discrete water-quality samples were collected about biweekly to monthly from May 2001 through June 2016 at USGS water-quality monitoring station 07144790. Most samples (226 of 230) were collected between 8:45 a.m. and 12:15 p.m. During May 2001 through July 2004, samples were collected near the surface using a Teflon Kemmerer bottle or a weighted bottle sampler with a 1-liter Teflon bottle follow-ing USGS methods (U.S. Geological Survey, variously dated); these samples were not depth integrated. Starting in August 2004, discrete water-quality samples were collected as inte-grated photic-zone (depth at which light is about 1 percent of
that at the surface) samples using a double check-valve bailer (Lane and others, 2003); these samples were depth integrated. Vertical profiles collected in Cheney Reservoir indicated that thermal stratification rarely happens and water-quality conditions typically are uniform throughout the water column. Water-quality results collected before and after the sampling procedure change in summer 2004 were similar. All water samples were analyzed for phytoplankton community compo-sition and the taste-and-odor compounds geosmin and MIB. Starting in June 2003, all samples also were analyzed for the cyanotoxin microcystin. All samples were processed and ana-lyzed as described in Stone and others (2013). Geosmin, MIB, and microcystin data are available through the USGS National Water Information System database at https://doi.org/10.5066/F7P55KJN. Phytoplankton community composition data are available in Graham (2017).
Phytoplankton samples (preserved with a 9:1 Lugol’s iodine:acetic acid solution) were analyzed for taxonomic iden-tification and enumeration by BSA Environmental Services, Inc., Beachwood, Ohio. Phytoplankton were enumerated to the lowest possible taxonomic level using membrane-filtered slides (McNabb, 1960) and a Leica DMLB compound micro-scope (× 100, × 200, × 400, × 630, and × 1000 magnification). This technique preserves cell structure and provides good resolution, allowing samples to be examined at high magni-fications. The magnification used depended upon the size of dominant taxa and presence of particulates. The goal was to count at multiple magnifications so identification and enu-meration of taxa that span several orders of magnitude in size was achieved. If a sample was dominated by cells or natu-ral units below 10 to 20 micrometers (µm) in size, or when cells were fragile and difficult to identify, most counting was completed at × 630 magnification. Samples were thoroughly mixed as part of the filtering process to ensure that organisms were evenly distributed. The abundance of common taxa was estimated by random field counts. At least 400 natural units (colonies, filaments, and unicells) were enumerated to the low-est possible taxonomic level from each sample. In addition, an entire strip of the filter was counted at high magnification (usually × 630 magnification) exclusively for cyanobacteria missed during the random field counts to further ensure com-plete potential harmful algal species detection. For abundant filamentous taxa, the total number of cells per filament was estimated by quantifying the number of cells within a known length (for example, 100 µm) of 25 filaments. The mean num-ber of cells per known length was then calculated and applied to measurements of the length and width of each filament encountered to estimate the total cell number of that taxon in the sample. In colonies with extremely small cells (for example, Microcystis), cells were enumerated from a small representative area of the colony containing at least 100 cells. In accordance with Lund and others (1958), counting using this approach provides accuracy within 90-percent confidence limits.
During May 2001 through September 2012, only dis-solved geosmin and MIB were analyzed; starting in October

Methods 5
2012, total geosmin and MIB were analyzed, and dissolved samples were analyzed if concentrations exceeded 5 ng/L. A comparison of samples in which total and dissolved concen-trations were measured indicated that reporting of occurrence was not affected by this change, but maximum concentrations likely were underreported before analysis of total concentra-tions. Geosmin and MIB were analyzed using solid phase microextraction gas chromatography/mass spectrometry (Zimmerman and others, 2002). Throughout the course of the study, Montgomery Watson Laboratories, Pasadena, California (2001–3), the USGS Organic Geochemistry Research Labora-tory, Lawrence, Kans. (2003–7), and Engineering Performance Solutions, LLC, Gainesville, Florida (2007–14) provided analyses for geosmin and MIB. Each time laboratories were changed, an among-laboratory comparison was completed before the change was made to verify comparability of results; an analysis of the among-laboratory comparisons is provided in Stone and others (2013).
Microcystin was analyzed by the USGS Organic Geo-chemistry Research Laboratory, Lawrence, Kans. Before 2005, unfiltered whole-water samples were analyzed for microcystin (environmental microcystin concentrations) (Christensen and others, 2006). Starting in 2005, all samples were lysed by three sequential freeze-thaw cycles and filtered using 0.7-µm glass-fiber filters before analysis for microcystin (total micro-cystin concentrations; Loftin and others, 2008). Reporting of microcystin occurrence likely was not affected by the change from environmental to total concentrations, but maxima were likely underreported before the analysis of total concentrations (Graham and others, 2010). Abraxis® enzyme-linked immu-nosorbent assays were used to measure microcystin (congener independent).
Quality-assurance and quality-control (QA/QC) samples were collected to evaluate variability in sample collection and processing techniques. Stone and others (2013) describe the QA/QC information for the discrete microcystin, geosmin, and MIB samples; and continuous water-quality data collected during April 2001 through December 2009. Relative percent-age difference (RPD) was used to evaluate differences in ana-lyte concentrations detected in replicate water samples. The RPD was calculated by dividing the difference between the replicate pair by the mean of the replicate pair and multiply-ing that value by 100, thereby creating a value that represents the percent difference between replicate samples (Zar, 1999). The medians of individual replicate RPDs for microcystin, geosmin, and MIB were 2 percent (range from 0 to 26 percent, n=10), 5 percent (range from 0 to 14 percent, n=6), and 2 per-cent (range from 0 to 11 percent, n=7), respectively. Larger RPDs generally were the result of values near the laboratory reporting level.
About 10 percent of the phytoplankton samples collected during 2001 through 2016 were QA/QC samples. Absolute value logarithmic difference (AVLD) was used to evaluate dif-ferences in cyanobacterial abundance between replicate pairs (Francy and others, 2015). AVLD was calculated as follows:
AVLD = |log10R1 – log10R2| (1)
where R1 is cyanobacterial abundance in replicate 1,
and R2 is cyanobacterial abundance in replicate 2.AVLD was used to evaluate differences for phytoplankton data because RPD calculations are sensitive to rare taxa present in one of the replicate samples but not the other. Replicate pairs with an AVLD less than logarithm 1.0 were considered accept-able for cyanobacterial abundance. The AVLDs for cyanobac-terial abundance ranged from 0 to 3.5 (n=22). Median AVLD was 0.3; 73 percent of comparisons had AVLDs less than 0.75. Replicates with AVLDs greater than logarithm 1.0 (27 percent of all comparisons) happened when cyanobacteria were rare and represented less than 5 percent of the total phytoplankton abundance.
Correlation Analysis
Cyanobacterial production of toxins and taste-and-odor compounds is strain specific, and cyanobacterial abundance (or abundance of potential producers) may not be linearly related to the concentration of these compounds in the envi-ronment (Graham and others, 2008). Nonparametric Spear-man rank-correlation analysis was used to test for monotonic relations between cyanobacterial abundance, microcystin, and geosmin (Helsel and Hirsch, 2002). MIB was not detected frequently enough in Cheney Reservoir to be included in cor-relation analysis. Spearman rank-correlation coefficients (rho values) were considered significant when probability values (p-values) were less than 0.05.
Development of Logistic Regression Models for Microcystin and Geosmin
Multiple logistic regression was used to develop models to identify factors that best explained the probability of micro-cystin and geosmin concentrations exceeding selected thresh-olds, following the methods described in Foster and Graham (2016). MIB was only occasionally detected in Cheney Reservoir, precluding the development of a logistic regres-sion model. Microcystin and geosmin models were developed for the full dataset (microcystin—January 2003 through June 2016, about 14 years; geosmin—May 2001 through June 2016, about 16 years) and an abbreviated dataset (January 2013 through June 2016, about 4 years). January 2013 through June 2016 was selected for the abbreviated dataset because an August 2013 inflow event caused the reservoir to gain about 89,000 acre-feet over 10 days, stimulating a geosmin event in the reservoir (Otten and others, 2016); high geosmin concen-trations have been observed in late summer and fall since the 2013 inflow.
6 Occurrence of Cyanobacteria, Microcystin, and Taste-and-Odor Compounds in Cheney Reservoir, Kansas, 2001–16
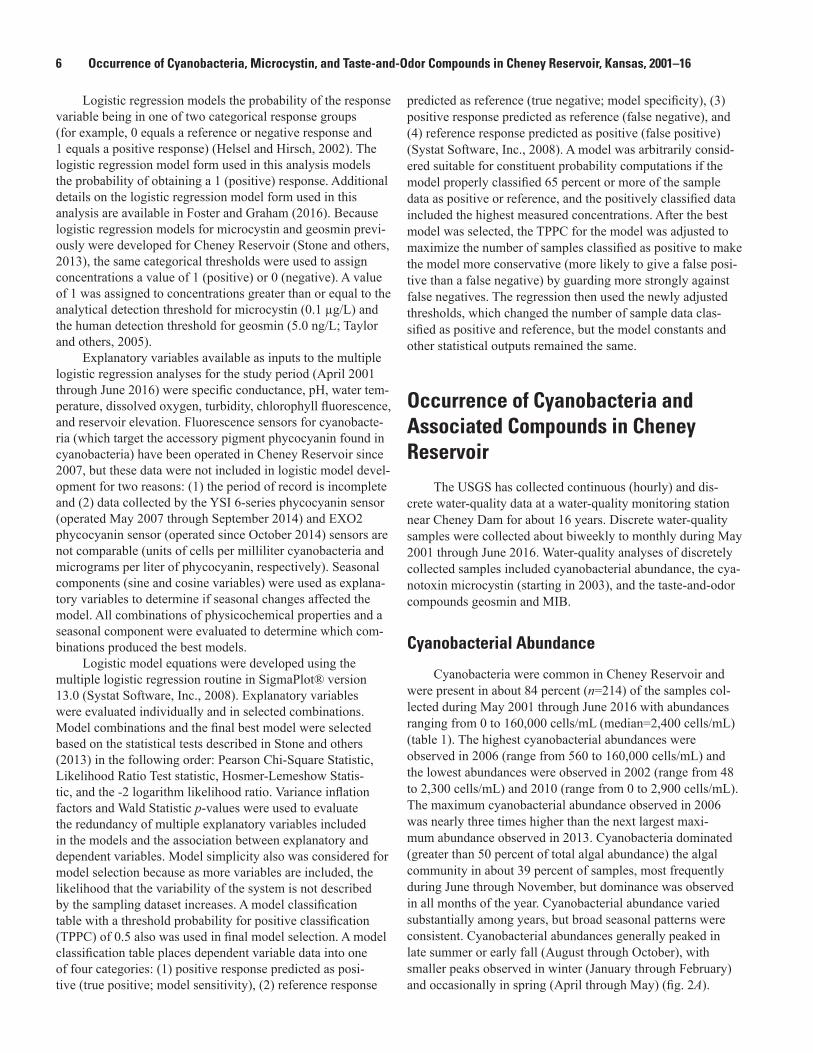
Logistic regression models the probability of the response variable being in one of two categorical response groups (for example, 0 equals a reference or negative response and 1 equals a positive response) (Helsel and Hirsch, 2002). The logistic regression model form used in this analysis models the probability of obtaining a 1 (positive) response. Additional details on the logistic regression model form used in this analysis are available in Foster and Graham (2016). Because logistic regression models for microcystin and geosmin previ-ously were developed for Cheney Reservoir (Stone and others, 2013), the same categorical thresholds were used to assign concentrations a value of 1 (positive) or 0 (negative). A value of 1 was assigned to concentrations greater than or equal to the analytical detection threshold for microcystin (0.1 µg/L) and the human detection threshold for geosmin (5.0 ng/L; Taylor and others, 2005).
Explanatory variables available as inputs to the multiple logistic regression analyses for the study period (April 2001 through June 2016) were specific conductance, pH, water tem-perature, dissolved oxygen, turbidity, chlorophyll fluorescence, and reservoir elevation. Fluorescence sensors for cyanobacte-ria (which target the accessory pigment phycocyanin found in cyanobacteria) have been operated in Cheney Reservoir since 2007, but these data were not included in logistic model devel-opment for two reasons: (1) the period of record is incomplete and (2) data collected by the YSI 6-series phycocyanin sensor (operated May 2007 through September 2014) and EXO2 phycocyanin sensor (operated since October 2014) sensors are not comparable (units of cells per milliliter cyanobacteria and micrograms per liter of phycocyanin, respectively). Seasonal components (sine and cosine variables) were used as explana-tory variables to determine if seasonal changes affected the model. All combinations of physicochemical properties and a seasonal component were evaluated to determine which com-binations produced the best models.
Logistic model equations were developed using the multiple logistic regression routine in SigmaPlot® version 13.0 (Systat Software, Inc., 2008). Explanatory variables were evaluated individually and in selected combinations. Model combinations and the final best model were selected based on the statistical tests described in Stone and others (2013) in the following order: Pearson Chi-Square Statistic, Likelihood Ratio Test statistic, Hosmer-Lemeshow Statis-tic, and the -2 logarithm likelihood ratio. Variance inflation factors and Wald Statistic p-values were used to evaluate the redundancy of multiple explanatory variables included in the models and the association between explanatory and dependent variables. Model simplicity also was considered for model selection because as more variables are included, the likelihood that the variability of the system is not described by the sampling dataset increases. A model classification table with a threshold probability for positive classification (TPPC) of 0.5 also was used in final model selection. A model classification table places dependent variable data into one of four categories: (1) positive response predicted as posi-tive (true positive; model sensitivity), (2) reference response
predicted as reference (true negative; model specificity), (3) positive response predicted as reference (false negative), and (4) reference response predicted as positive (false positive) (Systat Software, Inc., 2008). A model was arbitrarily consid-ered suitable for constituent probability computations if the model properly classified 65 percent or more of the sample data as positive or reference, and the positively classified data included the highest measured concentrations. After the best model was selected, the TPPC for the model was adjusted to maximize the number of samples classified as positive to make the model more conservative (more likely to give a false posi-tive than a false negative) by guarding more strongly against false negatives. The regression then used the newly adjusted thresholds, which changed the number of sample data clas-sified as positive and reference, but the model constants and other statistical outputs remained the same.
Occurrence of Cyanobacteria and Associated Compounds in Cheney Reservoir
The USGS has collected continuous (hourly) and dis-crete water-quality data at a water-quality monitoring station near Cheney Dam for about 16 years. Discrete water-quality samples were collected about biweekly to monthly during May 2001 through June 2016. Water-quality analyses of discretely collected samples included cyanobacterial abundance, the cya-notoxin microcystin (starting in 2003), and the taste-and-odor compounds geosmin and MIB.
Cyanobacterial Abundance
Cyanobacteria were common in Cheney Reservoir and were present in about 84 percent (n=214) of the samples col-lected during May 2001 through June 2016 with abundances ranging from 0 to 160,000 cells/mL (median=2,400 cells/mL) (table 1). The highest cyanobacterial abundances were observed in 2006 (range from 560 to 160,000 cells/mL) and the lowest abundances were observed in 2002 (range from 48 to 2,300 cells/mL) and 2010 (range from 0 to 2,900 cells/mL). The maximum cyanobacterial abundance observed in 2006 was nearly three times higher than the next largest maxi-mum abundance observed in 2013. Cyanobacteria dominated (greater than 50 percent of total algal abundance) the algal community in about 39 percent of samples, most frequently during June through November, but dominance was observed in all months of the year. Cyanobacterial abundance varied substantially among years, but broad seasonal patterns were consistent. Cyanobacterial abundances generally peaked in late summer or early fall (August through October), with smaller peaks observed in winter (January through February) and occasionally in spring (April through May) (fig. 2A).

Occurrence of Cyanobacteria and Associated Compounds in Cheney Reservoir 7
Table 1. Statistical summaries of cyanobacterial abundance, microcystin, geosmin, and 2-methylisoborneol data collected at Cheney Reservoir, Kansas, May 2001 through June 2016.
[n, number of samples; --, not measured; <, less than; MIB, 2-methylisoborneol]
Year
Cyanobacterial abundance, in cells per milliliter Microcystin, in micrograms per liter
n Median Minimum MaximumNumber of detections
Percent detections
n Median Minimum MaximumNumber
of detections
Percent detections
2001 2 3,640 1,400 5,900 2 100 0 -- -- -- -- --2002 4 490 48 2,300 4 100 0 -- -- -- -- --2003 11 5,300 380 33,000 11 100 11 0.28 0.13 2.0 11 1002004 7 930 84 17,000 7 100 7 0.14 <0.1 0.26 5 712005 15 3,900 140 27,000 15 100 15 0.15 <0.1 2.3 12 802006 18 10,000 560 160,000 18 100 20 0.20 <0.1 2.8 12 602007 18 3,100 18 15,000 18 100 18 0.19 <0.1 1.4 11 612008 20 8,600 370 29,000 20 100 21 0.10 <0.1 1.1 11 522009 24 1,600 0 8,700 21 88 25 <0.1 <0.1 2.9 2 82010 21 0 0 2,900 8 38 21 <0.1 <0.1 <0.1 0 02011 17 280 0 40,000 10 59 17 0.14 <0.1 9.0 11 652012 14 120 0 7,400 7 50 13 <0.1 <0.1 0.79 6 462013 17 4,100 0 57,000 14 82 19 0.12 <0.1 7.3 12 632014 13 4,300 0 15,000 12 92 13 0.19 <0.1 0.45 12 922015 10 1,800 91 50,000 10 100 10 <0.1 <0.1 0.40 4 402016 3 77 0 9,000 2 67 3 <0.1 <0.1 0.63 1 33
YearGeosmin, in nanograms per liter MIB, in nanograms per liter
n Median Minimum MaximumNumber of detections
Percent detections
n Median Minimum MaximumNumber of detections
Percent detections
2001 5 4.0 <3.0 11 1 20 5 <5 <5 <5 0 02002 6 <5 <3.0 7.3 2 33 6 <5 <5 5.7 1 172003 11 15 5.0 110 11 100 11 <5 <5 10 3 272004 8 <5 <5.0 5.0 1 13 8 <5 <5 <5 0 02005 15 <5 <5.0 64 4 27 15 <5 <5 6.0 1 72006 20 <5 <5.0 5.0 3 15 20 <5 <5 <5 0 02007 18 <5 <2.0 32 2 11 18 <5 <2 <5 0 02008 22 <2 <2.0 14 7 32 22 <2 <2 <2 0 02009 25 2.7 <2.0 17 9 36 25 <2 <2 2.3 0 02010 21 <2 <2.0 5.9 3 14 21 <2 <2 2.6 0 02011 17 3.2 <2.0 9.6 4 24 17 <2 <2 <2 0 02012 14 <2 <1.0 3.5 0 0 14 <2 <1 <2 0 02013 22 9.4 <1.0 54 13 59 22 <1 <1 9.7 2 92014 13 4.3 <1.0 22 6 46 13 <1 <1 5.2 1 82015 10 3.8 <1.0 8.4 4 40 10 1.6 <1 3.4 0 02016 3 1.3 <1.0 14 1 33 3 <1 <1 <1 0 0

8 Occurrence of Cyanobacteria, Microcystin, and Taste-and-Odor Compounds in Cheney Reservoir, Kansas, 2001–16Cy
anob
acte
rial a
bund
ance
, in
cells
per
mill
ilite
r M
icro
cyst
in c
once
ntra
tion,
in m
icro
gram
s pe
r lite
r
Jan.0
20
10
30
50
60
40
70
110
120
20,000
0
0
1.0
2.0
3.0
4.07.08.09.0
10.0
40,000
60,00080,000
100,000120,000140,000160,000180,000
Feb. Mar. Apr. May June July Aug. Sept. Oct. Nov. Dec.
Geos
min
con
cent
ratio
n, in
nan
ogra
ms
per l
iter
A
B
C
Abundance of concern for drinking-water treatment (Taylor and others, 2005)
U.S. Environmental Protection Agency (2015) finished drinking-water guidance for adults
Human detection threshold (Taylor and others, 2005)
U.S. Environmental Protection Agency (2015) finished drinking-water guidance for young children
Kansas Department of Health and Environment (2015) public health watch guidance
Kansas Department of Health and Environment (2015) public health watch guidance
Outlier
Interquartilerange
Outlier
10th percentile
25th percentile50th percentile
75th percentile
90th percentile
EXPLANATION
Figure 2. Seasonal patterns in Cheney Reservoir, Kansas, May 2001 through June 2016. A, cyanobacterial abundance. B, microscysin concentration. C, geosmin concentration.

Occurrence of Cyanobacteria and Associated Compounds in Cheney Reservoir 9
Though cyanobacteria were common in Cheney Reser-voir, abundances at the USGS station near Cheney Dam only occasionally exceeded advisory values of concern. Cyano-bacteria are a concern for drinking-water treatment at abun-dances as low as 20,000 cells/mL (Taylor and others, 2005). Cyanobacterial abundance in Cheney Reservoir exceeded 20,000 cells/mL in about 9 percent of samples. Abundances exceeded 20,000 cells/mL throughout the year, but such abun-dances happened most frequently in winter (January through February) and summer or early fall (July through October) (fig. 2A). The KDHE (2015) advisory level for a public health watch (greater than 80,000 cells/mL) was exceeded in 3 per-cent of samples, all collected during 2006. Cyanobacterial abundance in Cheney Reservoir never exceeded the KDHE (2015) advisory level for a public health warning (greater than 250,000 cells/mL). Although cyanobacterial abundance near Cheney Dam only exceeded the KDHE (2015) value for a public health watch 1 year during May 2001 through June 2016, the KDHE has occasionally issued public health watches and warnings for the reservoir based on exceedances observed at other locations (KDHE, 2016a).
Genetic analyses have identified Microcystis and Ana-baena as the most likely microcystin and geosmin producers, respectively, in Cheney Reservoir (Otten and others, 2016). These cyanobacterial genera are commonly associated with CyanoHABs throughout the world (Hudnell, 2008). Microcys-tis was present in about 30 percent of samples collected during May 2001 through June 2016, and Anabaena was present in about 44 percent of samples. These cyanobacteria were pres-ent during most years and were most abundant during summer and early fall (June through October). Abundance of these cyanobacteria never exceeded the KDHE watch values for recreational activities, and Anabaena (maximum 11,000 cells/mL) never exceeded 20,000 cells/mL. Microcystis (maximum 40,000 cells/mL) exceeded 20,000 cells/mL once in August 2011.
Microcystin
Microcystin is the most commonly detected cyanotoxin worldwide, and has been present in lakes and reservoirs throughout the United States (Loftin and others, 2016). Overall, microcystin was detected in about 52 percent (n=213) of the samples collected from Cheney Reservoir during January 2003 through June 2016. Microcystin concentrations ranged from less than 0.1 to 9.0 µg/L (median=0.1 µg/L) (table 1). Microcystin was detected during all months of the year, but was present most frequently (77 to 88 percent of samples) and had the highest concentrations during July through September (fig. 2B). With the exception of 2010, microcystin was detected during all years. As observed with cyanobacterial abundance, maximum microcystin concentrations varied by orders of magnitude among years, but broad seasonal patterns were con-sistent. In a typical year, microcystin was first detected (greater than 0.1 µg/L) in June or July, increased to seasonal maxima
in the summer (July through September), and then decreased (fig. 2B).
The highest microcystin concentrations were observed in August of 2011 (maximum=9.0 µg/L) and 2013 (maxi-mum=7.3 µg/L), and the lowest concentrations were observed in 2004 (maximum of 0.26 µg/L in August) (table 1). Micro-cystin was not detected in 2010, the year that also had the lowest cyanobacterial abundances; however, maximum micro-cystin concentrations did not happen during the same years as maximum cyanobacterial abundances (table 1). The overall correlation between microcystin concentration and cyanobacte-rial abundance was positive but weak (rho=0.44, p-value<0.01, n=206). Similarly, although Microcystis is likely the main microcystin producer in Cheney Reservoir and abundance was positively associated with microcystin concentration, the overall correlation was similar to the more general measure of cyanobacterial abundance (rho=0.45, p-value<0.01, n=206). The relations between microcystin and cyanobacterial and Microcystis abundance are known to be complex, and often are nonlinear because microcystin production is strain-specific. Cyanobacterial strain composition may vary substantially over time (Davis and others, 2009; Bozarth and others, 2010).
Microcystin concentrations at the USGS station near Cheney Dam (fig. 1) exceeded advisory values of concern more frequently than cyanobacterial abundance; therefore, cyanobacteria likely are not a good indicator for microcystin occurrence in Cheney Reservoir. The 10-day health advisory value for young children (0.3 µg/L) in finished drinking water (U.S. Environmental Protection Agency, 2015) was exceeded in about 26 percent of samples (56 of 213 samples) collected during January 2003 through June 2016. Most exceedances happened during June through September (50 samples), though the 0.3-µg/L advisory value was also occasionally exceeded in March (1 sample) and October (5 samples) (fig. 2B). Exceed-ances happened during all years except 2010, when microcys-tin was not detected in Cheney Reservoir. The 10-day health advisory value for all other ages (1.6 µg/L) in finished drink-ing water (U.S. Environmental Protection Agency, 2015) was exceeded in about 7 percent of samples (14 of 213 samples); exceedances happened most frequently in August (5 samples) and September (6 samples), though the 1.6-µg/L advisory value occasionally was exceeded in June (1 sample) and July (2 samples) (fig. 2B). The 1.6-µg/L advisory value was exceeded during 6 of the 16 years (2003, 2005, 2006, 2009, 2011, and 2013) data were collected (table 1). Microcystin concentra-tions exceeded the KDHE (2015) recreational advisory value for a public health watch (4 µg/L) in two samples (less than 1 percent of samples collected) during 2003 through 2016; exceedances happened in August of 2011 and 2013. Microcys-tin concentrations never exceeded the value for a public health warning (20 µg/L). Although microcystin concentrations near Cheney Dam only exceeded the KDHE (2015) advisory value for a public health watch twice, KDHE has occasionally issued public health watches and warnings for the reservoir based on exceedances observed at other locations (KDHE, 2016a).

10 Occurrence of Cyanobacteria, Microcystin, and Taste-and-Odor Compounds in Cheney Reservoir, Kansas, 2001–16
Geosmin and 2-Methylisoborneol
Many groups of algae and other organisms can produce compounds that cause taste or odor events in drinking water; however, most taste-and-odor problems in drinking water are associated with cyanobacterial production of geosmin and MIB. Humans are sensitive to geosmin and MIB in finished drinking water at concentrations between 5 and 10 ng/L (Tay-lor and others, 2005). Because analytical detection thresholds ranged from 1 to 5 ng/L during the 16-year study period (Stone and others, 2013), description of geosmin and MIB occurrence is based on concentrations greater than or equal to 5 ng/L. Geosmin was detected in Cheney Reservoir at concen-trations greater than or equal to 5 ng/L more frequently (about 31 percent of samples, n=230) than MIB (about 3 percent of samples, n=230) during May 2001 through June 2016. As observed for microcystin, cyanobacteria likely are not a good indicator for taste-and-odor occurrence in Cheney Reservoir because concentrations exceeded the human detection thresh-old of 5 ng/L more frequently than cyanobacteria exceeded advisory values of concern.
Geosmin and MIB concentrations ranged from less than 1.0 to 110 ng/L and less than 1 to 10 ng/L, respectively (both medians were less than 5 ng/L) (table 1). Geosmin was detected at concentrations greater than 5 ng/L during all months of the year but most frequently during February and March (50 and 54 percent of samples, respectively). Though geosmin was detected most frequently during winter months, the highest concentrations were detected during late spring through early fall (June through October) when seasonal maxima in cyanobacteria and microcystin also were exceeded (fig. 2). Geosmin was detected at concentrations greater than or equal to 5 ng/L during all years except 2012; geosmin was detected in 2012, but the maximum concentration was 3.5 ng/L (table 1). Seasonal patterns in geosmin were less consistent than cyanobacteria and microcystin, but in general, geosmin had a small peak during winter (January through March) during most years and a large peak during summer (July through September) during some years (fig. 2C). Sum-mer peaks happened throughout the study period and consis-tently happened during 2011 and all subsequent years. MIB was detected at concentrations greater than 5 ng/L during late winter and early spring (March through April), early summer (June), and early fall (September), with the highest concentra-tions observed in early spring and early fall. MIB was detected at concentrations greater than 5 ng/L in 5 of the 16 years data were collected (2002, 2003, 2005, 2013, and 2014); MIB also was detected in 2009, 2010, and 2015, but maximum concen-trations ranged from 2.3 to 3.4 ng/L (table 1). Because MIB was detected relatively infrequently, broad seasonal patterns among years were not discernable.
The highest geosmin concentrations were observed in June and July 2003 (maxima of 63 and 110 ng/L, respectively) and July 2005 (maximum of 64 ng/L). The highest MIB concentrations were observed in March 2003 (maximum of 10 ng/L) and September 2013 (maximum of 9.7 ng/L). The
highest observed geosmin concentrations did not happen dur-ing the same years as the highest cyanobacterial abundances (2006) and microcystin concentrations (2011 and 2013), although high concentrations of microcystin and MIB were detected in 2013 (table 1). The overall correlation between geosmin concentration and cyanobacterial abundance was positive but weak (rho=0.23, p-value<0.01, n=214). Although Anabaena is likely the main geosmin producer in Cheney Res-ervoir (Otten and others, 2016) and abundance was positively associated with geosmin concentration, the overall correlation was similar to the more general measure of cyanobacterial abundance (rho=0.22, p-value<0.01, n=214). Like microcys-tin, the relations between geosmin and cyanobacterial and Anabaena abundance are known to be complex and are often nonlinear because geosmin production is strain-specific and cyanobacterial strain composition may vary substantially over time. MIB was not detected at concentrations greater than or equal to 5 ng/L in enough samples (8 of 230) for a meaningful comparison with cyanobacterial abundance. Unlike micro-cystin and geosmin, the likely producer of MIB has not been identified in Cheney Reservoir though benthic, rather than planktonic, cyanobacteria have been hypothesized as a poten-tial source (Otten and others, 2016); analysis of benthic algal communities was not part of this study.
Co-occurrence of Microcystin and Taste-and-Odor Compounds
Complex mixtures of cyanotoxins and taste-and-odor compounds may be present frequently during cyanobacterial blooms (Graham and others, 2010), presenting challenges for drinking-water treatment. Optimal treatment processes may vary depending on the compound or mixture of compounds present in the drinking-water supply (Westrick and others, 2010). During January 2001 through June 2016, microcystin was detected more frequently in Cheney Reservoir (52 percent of samples, n=213) than was geosmin (31 percent of samples, n=230) or MIB (3 percent of samples, n=230). Overall, about 63 percent of samples collected had either detectable micro-cystin, taste-and-odor compounds at concentrations greater than 5 ng/L, or both. Microcystin and taste-and-odor com-pounds co-occurred in about 22 percent of samples analyzed for both compounds (n=213). When microcystin and the taste-and-odor compound geosmin co-occurred (20 percent of samples), concentrations were not significantly correlated (rho=0.09, p-value=0.56, n=42). The lack of correlation between microcystin and geosmin concentration is similar to the findings of Graham and others (2010), and likely the result of being produced by two different organisms in Cheney Res-ervoir (Otten and others, 2016).
Of the samples with detectable microcystin (n=110), 43 percent had detectable taste-and-odor compounds at con-centrations greater than 5 ng/L. Of the samples with detect-able taste-and-odor compounds (n=70), about 75 percent had detectable microcystin. Microcystin often was present without

Logistic Regression Models for Microcystin and Geosmin 11
taste-and-odor compounds. By comparison, when taste-and-odor compounds were present, microcystin frequently was detected. Therefore, taste-and-odor may be used as an indica-tor that microcystin may be present; however, microcystin did occur without taste-and-odor, so odor alone does not provide sufficient warning to ensure human-health protection.
Logistic Regression Models for Microcystin and Geosmin
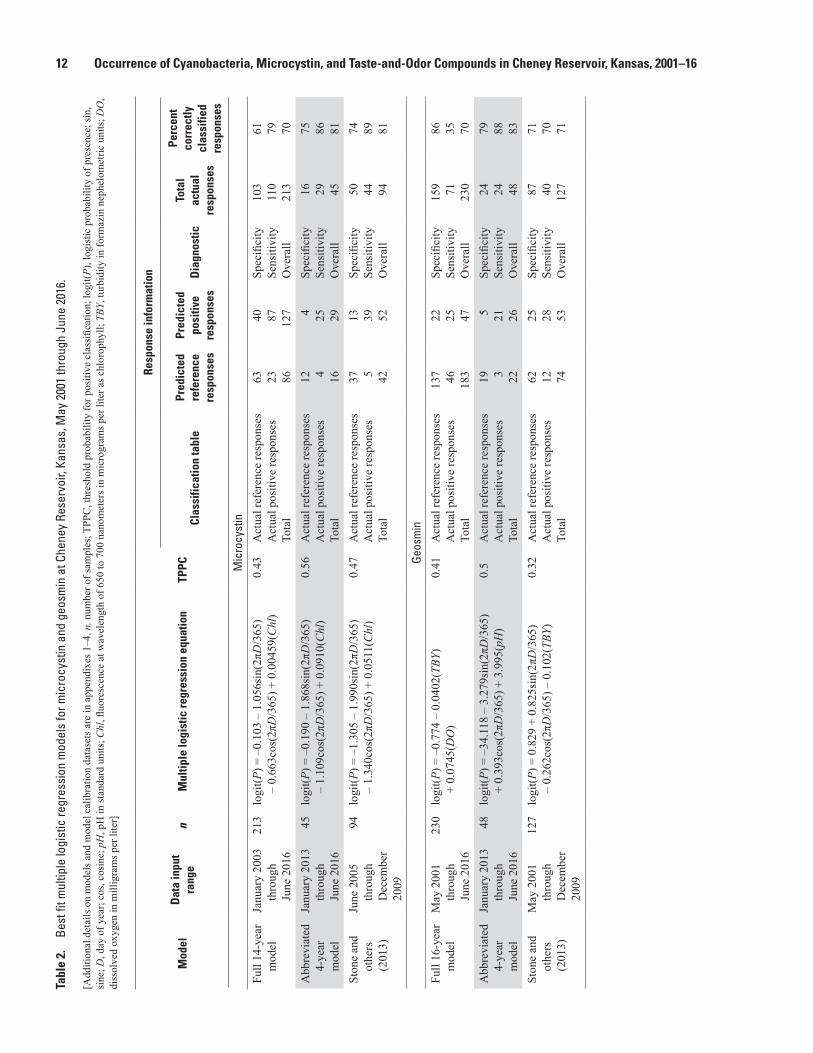
Logistic regression models that estimate the probability of microcystin occurrence at concentrations greater than or equal to 0.1 µg/L and geosmin occurrence at concentrations greater than or equal to 5 ng/L were developed. Models were developed using the entire 14- (microcystin) to 16-year (geos-min) datasets and abbreviated 4-year datasets that included data collected from January 2013 through June 2016. Final models are presented in table 2. Statistical model output and model datasets are presented in appendixes 1–4. The newly developed models are compared with previously published models that were developed using data collected during May 2001 through December 2009 (Stone and others, 2013).
The Cheney Reservoir station near the Cheney Dam (fig. 1) was selected to develop a real-time notification system of changing water-quality conditions that may affect drinking-water treatment. Although this station is also representative of recreational conditions near Cheney Dam, it may not be indicative of conditions elsewhere in the reservoir. Additional stations would be required to develop comprehensive notifica-tion system indicative of conditions throughout the reservoir.
Microcystin
A seasonal component and chlorophyll fluorescence (a surrogate for algal biomass) were the explanatory variables for microcystin occurrence at concentrations greater than or equal to 0.1 µg/L in the previously published model (June 2005 through December 2009; Stone and others, 2013), the 14-year (January 2003 through June 2016) model, and the abbreviated 4-year (January 2013 through June 2016) model. Overall model form was the same in all models, though the coefficients and the TPPCs used to maximize the number of samples classified as positive changed (table 2). The inclu-sion of the seasonal component and chlorophyll fluorescence as explanatory variables in all models reflects the consistent seasonal pattern in microcystin occurrence, as well as the positive correlation with cyanobacterial abundance during January 2003 through June 2016. The threshold of the 14-year model was reset from 0.5 to 0.43. The final logistic model correctly estimated the likelihood of microcystin concentra-tions exceeding the 0.1 µg/L threshold 79 percent of the time and not exceeding the detection threshold 61 percent of the time, resulting in an overall accuracy (number of data points
correctly categorized with respect to presence or absence) of 70 percent (table 2; appendix 1). The threshold of the 4-year model was reset from 0.5 to 0.56. The final logistic model correctly estimated the likelihood of microcystin concentra-tions exceeding the 0.1 µg/L threshold 86 percent of the time and not exceeding the detection threshold 75 percent of the time, resulting in an overall accuracy of 81 percent (table 2; appendix 2).
To compare performance of the three models over time, the TPPC was set to 0.5 for all models, probabilities were cal-culated for all discrete data points, and evaluated overall and by year (fig. 3A). Overall accuracy of the previously published (Stone and others, 2013) and 14-year models was similar (70 and 72 percent, respectively), despite the addition of about 10 years of data to the 14-year model (fig. 3A). Overall accuracy of the 4-year model was lower (65 percent; fig. 3A) but was calibrated using a smaller dataset collected during a shorter period than the previously published and 14-year mod-els (fig. 3A; table 2). During 2001 through 2016, the difference in the accuracy of the three models ranged from 0 to 36 per-cent (median=8 percent), and was within 15 percent during 9 of the 14 years. There was no consistent pattern in which model performed the best among years, though the differences in model accuracy tended to be highest between the previously published and 4-year model. The differences in the years used to calibrate the previously published (2005 through 2009) and 4-year (2013 through 2016) models likely caused the higher differences in accuracy between these two models. The most substantial differences between the three models occurred dur-ing 2003 and 2010. The 4-year model had the highest accuracy in 2003, possibly because specific conditions that occurred during the 4-year model calibration period were more similar to 2003 than conditions during the calibration periods for the other models. All models performed relatively poorly (accu-racy less than 50 percent) in 2010, when microcystin was not detected in the reservoir. During 2013 through 2016, the accu-racy of all models was within 5 percent or less except 2014. In 2014, the accuracy of the 4-year model was 23 percent higher than the previously published model and 15 percent higher than the 14-year model. Reasons for the higher accuracy of the 4-year model during 2014 are unclear, but likely related to specific conditions captured by the short-term dataset that are masked in the full dataset.
The previously published (Stone and others, 2013), 14-year, and 4-year models contained the same explanatory variables, though model coefficients changed based on the calibration dataset (table 2). All models were relatively robust when compared using a TPCC of 0.5, though the previously published and 14-year models performed better over time (fig. 3A); however, as a tool to estimate microcystin occur-rence at concentrations greater than or equal to 0.1 µg/L in a real-time notification system near Cheney Dam, the 4-year model has the highest TPPC and accuracy (table 2), and is most representative of recent (2013 through 2016) conditions.
12 Occurrence of Cyanobacteria, Microcystin, and Taste-and-Odor Compounds in Cheney Reservoir, Kansas, 2001–16Ta
ble
2.
Best
fit m
ultip
le lo
gist
ic re
gres
sion
mod
els
for m
icro
cyst
in a
nd g
eosm
in a
t Che
ney
Rese
rvoi
r, Ka
nsas
, May
200
1 th
roug
h Ju
ne 2
016.
[Add
ition
al d
etai
ls o
n m
odel
s and
mod
el c
alib
ratio
n da
tase
ts a
re in
app
endi
xes 1
–4. n
, num
ber o
f sam
ples
; TPP
C, t
hres
hold
pro
babi
lity
for p
ositi
ve c
lass
ifica
tion;
logi
t(P),
logi
stic
pro
babi
lity
of p
rese
nce;
sin,
si
ne; D
, day
of y
ear;
cos,
cosi
ne; p
H, p
H in
stan
dard
uni
ts; C
hl, fl
uore
scen
ce a
t wav
elen
gth
of 6
50 to
700
nan
omet
ers i
n m
icro
gram
s per
lite
r as c
hlor
ophy
ll; T
BY, t
urbi
dity
in fo
rmaz
in n
ephe
lom
etric
uni
ts; D
O,
diss
olve
d ox
ygen
in m
illig
ram
s per
lite
r]
Mod
elD
ata
inpu
t ra
nge
nM
ultip
le lo
gist
ic re
gres
sion
equ
atio
nTP
PC
Resp
onse
info
rmat
ion
Clas
sific
atio
n ta
ble
Pred
icte
d re
fere
nce
resp
onse
s
Pred
icte
d po
sitiv
e re
spon
ses
Dia
gnos
ticTo
tal
actu
al
resp
onse
s
Perc
ent
corr
ectly
cl
assi
fied
resp
onse
s
Mic
rocy
stin
Full
14-y
ear
mod
elJa
nuar
y 20
03
thro
ugh
June
201
6
213
logi
t(P) =
–0.
103
– 1.
056s
in(2
πD/3
65)
– 0.
663c
os(2
πD/3
65) +
0.0
0459
(Chl
)0.
43A
ctua
l ref
eren
ce re
spon
ses
Act
ual p
ositi
ve re
spon
ses
Tota
l
63 23 86
40 87 127
Spec
ifici
tySe
nsiti
vity
Ove
rall
103
110
213
61 79 70A
bbre
viat
ed
4-ye
ar
mod
el
Janu
ary
2013
th
roug
h Ju
ne 2
016
45lo
git(P
) = –
0.19
0 –
1.86
8sin
(2πD
/365
) –
1.10
9cos
(2πD
/365
) + 0
.091
0(C
hl)
0.56
Act
ual r
efer
ence
resp
onse
sA
ctua
l pos
itive
resp
onse
sTo
tal
12 4 16
4 25 29
Spec
ifici
tySe
nsiti
vity
Ove
rall
16 29 45
75 86 81St
one
and
othe
rs
(201
3)
June
200
5 th
roug
h D
ecem
ber
2009
94lo
git(P
) = –
1.30
5 –
1.99
0sin
(2πD
/365
) –
1.34
0cos
(2πD
/365
) + 0
.051
1(C
hl)
0.47
Act
ual r
efer
ence
resp
onse
sA
ctua
l pos
itive
resp
onse
sTo
tal
37 5 42
13 39 52
Spec
ifici
tySe
nsiti
vity
Ove
rall
50 44 94
74 89 81
Geos
min
Full
16-y
ear
mod
elM
ay 2
001
thro
ugh
June
201
6
230
logi
t(P) =
–0.
774
– 0.
0402
(TBY
) +
0.07
45(D
O)
0.41
Act
ual r
efer
ence
resp
onse
sA
ctua
l pos
itive
resp
onse
sTo
tal
137 46 183
22 25 47
Spec
ifici
tySe
nsiti
vity
Ove
rall
159 71 230
86 35 70A
bbre
viat
ed
4-ye
ar
mod
el
Janu
ary
2013
th
roug
h Ju
ne 2
016
48lo
git(P
) = –
34.1
18 –
3.2
79si
n(2π
D/3
65)
+ 0.
393c
os(2
πD/3
65) +
3.9
95(p
H)
0.5
Act
ual r
efer
ence
resp
onse
sA
ctua
l pos
itive
resp
onse
sTo
tal
19 3 22
5 21 26
Spec
ifici
tySe
nsiti
vity
Ove
rall
24 24 48
79 88 83St
one
and
othe
rs
(201
3)
May
200
1 th
roug
h D
ecem
ber
2009
127
logi
t(P) =
0.8
29 +
0.8
25si
n(2π
D/3
65)
– 0.
262c
os(2
πD/3
65) –
0.1
02(T
BY)
0.32
Act
ual r
efer
ence
resp
onse
sA
ctua
l pos
itive
resp
onse
sTo
tal
62 12 74
25 28 53
Spec
ifici
tySe
nsiti
vity
Ove
rall
87 40 127
71 70 71

Logistic Regression Models for Microcystin and Geosmin 13
Mic
rocy
stin
logi
stic
mod
el a
ccur
acy,
in p
erce
nt
Previously published (Stone and others, 2013) model14-year model
4-year model
Geos
min
logi
stic
mod
el a
ccur
acy,
in p
erce
nt
0
10
20
30
40
50
60
70
80
90
100
0
10
20
30
40
50
60
70
80
90
100A
B
2003 2004 2005 2006 2007 2008 2009 2010 2011 2012 2013 2014 2015 2016 Overall
200320022001 2004 2005 2006 2007 2008 2009
Year
2010 2011 2012 2013 2014 2015 2016 Overall
EXPLANATION
Previously published (Stone and others, 2013) model16-year model
4-year model
EXPLANATION
Figure 3. Comparison of previously and newly developed logistic model accuracy in Cheney Reservoir. A, microcystin during January 2003 through June 2016. B, geosmin during May 2001 through June 2016.

14 Occurrence of Cyanobacteria, Microcystin, and Taste-and-Odor Compounds in Cheney Reservoir, Kansas, 2001–16
Geosmin
The previously published (May 2001 through December 2009; Stone and others, 2013), the 16-year (May 2001 through June 2016), and the abbreviated 4-year (January 2013 through June 2016) models for geosmin occurrence at concentrations greater than or equal to 5 ng/L all had different explanatory variables and model forms (table 2). The previously pub-lished model included a seasonal component and turbidity as explanatory variables, likely because geosmin occurrences in Cheney Reservoir have seasonal patterns mediated by light. By comparison, the 16-year model included turbidity and dissolved oxygen as explanatory variables. Turbidity likely is indicative of the influence of light on the cyanobacterial pro-ducers of geosmin, and dissolved oxygen is most likely associ-ated with the influence algal biomass can exert on dissolved oxygen concentrations through algal productivity (Graham and others, 2008). The abbreviated 4-year model included a seasonal component and pH as explanatory variables. The seasonal pattern in geosmin occurrence was more pronounced during 2013 through 2016 than the overall study period and pH, like dissolved oxygen, also may serve as an indicator of algal productivity (Graham and others, 2008). The threshold of the 16-year model was reset from 0.50 to 0.41. The final logistic model correctly estimated the likelihood of geosmin concentrations exceeding the 5 ng/L threshold 35 percent of the time and not exceeding the detection threshold 86 percent of the time, resulting in an overall accuracy of 70 percent (table 2; appendix 3). Although the overall accuracy of the 16-year model was relatively high (70 percent), the model did not perform well when estimating occurrence (positive response; only 35 percent of concentrations greater than or equal to 5 ng/L were correctly categorized). The threshold of the 4-year model was not reset from 0.5. The resulting final logistic model correctly estimated the likelihood of geosmin concentrations exceeding the 5 ng/L threshold 88 percent of the time and not exceeding the detection threshold 79 per-cent of the time, producing an overall accuracy of 83 percent (table 2; appendix 4).
To compare performance of the three models over time, the TPPC was set to 0.5 for all models, probabilities were cal-culated for all discrete data points, and evaluated overall and by year (fig. 3B). Overall accuracy of the previously published (Stone and others, 2013) and 16-year models was the same (70 percent; fig. 3B), despite the addition of about 10 years of data to the 16-year model. Overall accuracy of the 4-year model was lower (54 percent; fig. 3B) but was calibrated using a smaller dataset collected during a shorter period than the pre-viously published and 16-year models (fig. 3B; table 2). Dur-ing 2001 through 2016, the difference in the accuracy of the three models ranged from 0 to 68 percent (median=19 percent) and was within 15 percent during only 4 of the 16 years. The difference in the accuracy of the previously published model and the 16-year model across years was smaller and ranged from 0 to 33 percent (median=10 percent) (fig. 3B). During 2001 through 2012, the previously published and 16-year
models performed consistently better than the 4-year model. By comparison, during 2013 through 2016, accuracy of the 4-year model was about 30 to 68 percent higher than the previ-ously published and 16-year models in all years except 2015, when the accuracy of all three models was within 10 percent (between 60 and 70 percent) (fig. 3B). Performance of the pre-viously published and 16-year models likely was affected by an August 2013 inflow event to the reservoir that caused the reservoir to gain about 89,000 acre-feet in 10 days. The inflow also stimulated a geosmin event in the reservoir that had the highest late summer and fall (September through Novem-ber) concentrations observed during the study period (Otten and others, 2016). High geosmin concentrations have been observed in late summer and fall since the 2013 inflow event. The higher accuracy of the 4-year model during 2013 through 2016 likely is a result of the specific conditions captured by the short-term dataset during and after the 2013 inflow event.
The previously published (Stone and others, 2013) model and the 16-year model were not robust over time, likely because of changing environmental conditions and seasonal patterns in geosmin occurrence. By comparison, the abbrevi-ated 4-year model may be a useful tool to estimate geosmin occurrence at concentrations greater than or equal to 5 ng/L in a real-time notification system near Cheney Dam. The 4-year model has the highest TPPC and accuracy (table 2), and is most representative of recent (2013 through 2016) conditions in the reservoir. The better performance of the abbreviated 4-year geosmin model during 2013 through 2016 relative to the previously published and 16-year models demonstrates the need for continuous reevaluation of models estimating the probability of occurrence.
SummaryCyanobacterial toxins and taste-and-odor compounds
may cause substantial economic and public health concerns and are of particular interest in lakes, reservoirs, and riv-ers that are used for drinking-water supply and recreation. Cheney Reservoir, located in south-central Kansas, is one of the primary drinking-water supplies for the city of Wichita and an important recreational resource. Since 1990, cyanobacterial blooms have occasionally been present in Cheney Reservoir, resulting in increased treatment costs and decreased recre-ational use. Cyanobacteria, the cyanotoxin microcystin, and the taste-and-odor compounds geosmin and 2-methylisobor-neol (MIB) have been measured in Cheney Reservoir by the U.S. Geological Survey (USGS), in cooperation with the city of Wichita, for about 16 years. The purpose of this report is to describe the occurrence of cyanobacteria, microcystin, and taste-and-odor compounds in Cheney Reservoir during May 2001 through June 2016 and to update previously published logistic regression models that used continuous water-quality data to estimate the probability of microcystin and geosmin occurrence above relevant thresholds.

References Cited 15
The USGS collected continuous real-time (hourly) and discrete water-quality data at a water-quality monitoring station near Cheney Dam during April 2001 through June 2016. Water-quality analyses of discretely collected samples included cyanobacterial abundance, the cyanotoxin micro-cystin (starting in 2003), and the taste-and-odor compounds geosmin and MIB. Continuous water-quality measurements included specific conductance, pH, water temperature, dis-solved oxygen, turbidity, and chlorophyll fluorescence.
Cyanobacteria were common in Cheney Reservoir, and were present in about 84 percent of the samples collected dur-ing May 2001 through June 2016. Cyanobacterial abundance varied substantially among years, but broad seasonal patterns were consistent. Cyanobacterial abundances generally peaked in late summer or early fall (August through October), with smaller peaks observed in winter (January through Febru-ary) and occasionally in spring (April through May). Though cyanobacteria were common in Cheney Reservoir, abundances near Cheney Dam exceeded advisory values of concern in less than 10 percent of samples.
Microcystin was detected in about 52 percent of the samples collected during January 2003 through June 2016. As observed with cyanobacterial abundance, maximum micro-cystin concentrations varied by orders of magnitude among years, but broad seasonal patterns were consistent. In a typical year, microcystin was first detected in June or July, increased to seasonal maxima in the summer (July through September), and then decreased. The overall correlation between microcys-tin concentration and cyanobacterial abundance was positive but weak. Microcystin concentrations in Cheney Reservoir exceeded advisory values of concern more frequently than cyanobacterial abundance, indicating cyanobacteria likely are not a good indicator for microcystin occurrence in Cheney Reservoir. Microcystin concentrations exceeded advisory values of concern for drinking water in about 26 percent of samples and for recreation in less than 1 percent of samples.
Geosmin was detected in Cheney Reservoir at concen-trations greater than or equal to 5 nanograms per liter (ng/L) more frequently (about 31 percent of samples) than MIB (about 3 percent of samples) during May 2001 through June 2016. As observed for microcystin, cyanobacteria likely are not a good indicator for taste-and-odor compound occurrence in Cheney Reservoir because concentrations exceeded the human detection threshold of 5 ng/L more frequently than cya-nobacteria exceeded advisory values of concern. Seasonal pat-terns in geosmin were less consistent than cyanobacteria and microcystin, but in general geosmin had a small peak during winter (January through March) during most years and a large peak during summer (July through September) during some years. Because MIB was detected infrequently, broad seasonal patterns among years were not discernable. The overall cor-relation between geosmin concentration and cyanobacterial abundance was positive but weak.
Complex mixtures of cyanotoxins and taste-and-odor compounds may be present frequently during cyanobacterial blooms, presenting challenges for drinking-water treatment.
During January 2001 through June 2016 microcystin was detected more frequently in Cheney Reservoir than was geosmin or MIB. Microcystin often was present without taste-and-odor compounds. By comparison, where taste-and-odor compounds were present, microcystin frequently was detected. Taste-and-odor compounds, therefore, may be used as an indicator that microcystin may be present; however, micro-cystin was present without taste-and-odor compounds, so taste or odor alone does not provide sufficient warning to ensure human-health protection.
Logistic regression models that estimate the probability of microcystin occurrence at concentrations greater than or equal to 0.1 microgram per liter (µg/L) and geosmin occur-rence at concentrations greater than or equal to 5 ng/L were developed using the complete dataset (January 2003 through June 2016 for microcystin [14-year dataset]; May 2001 through June 2016 for geosmin [16-year dataset]) and an abbreviated 4-year dataset (January 2013 through June 2016 for microcystin and geosmin). Performance of the newly developed models was compared with previously published models that were developed using data collected during May 2001 through December 2009. A seasonal component and chlorophyll fluorescence (a surrogate for algal biomass) were the explanatory variables for microcystin occurrence at con-centrations greater than or equal to 0.1 µg/L in all models. All microcystin models were relatively robust, though the previ-ously published and 14-year models performed better over time; however, as a tool to estimate microcystin occurrence at concentrations greater than or equal to 0.1 µg/L in a real-time notification system near Cheney Dam, the 4-year model is most representative of recent (2013 through 2016) conditions. All models for geosmin occurrence at concentrations greater than or equal to 5 ng/L had different explanatory variables and model forms. The previously published and 16-year models were not robust over time, likely because of changing environ-mental conditions and seasonal patterns in geosmin occur-rence. By comparison, the abbreviated 4-year model may be a useful tool to estimate geosmin occurrence at concentrations greater than or equal to 5 ng/L in a real-time notification sys-tem near Cheney Dam. The better performance of the abbrevi-ated 4-year geosmin model during 2013 through 2016 relative to the previously published and 16-year models demonstrates the need for continuous reevaluation of models estimating the probability of occurrence.
References Cited
Bozarth, C.S., Schwartz, A.D., Shepardson, J.W., Colwell, F.S., and Dreher, T.W., 2010, Population turnover in a Microcystis bloom results in predominantly nontoxic vari-ants late in the season: Applied and Environmental Microbi-ology, v. 76, no. 15, p. 5207–5213. [Also available at http://dx.doi.org/10.1128/AEM.00001-10.]

16 Occurrence of Cyanobacteria, Microcystin, and Taste-and-Odor Compounds in Cheney Reservoir, Kansas, 2001–16
Bureau of Reclamation, 2016, Wichita project: Bureau of Rec-lamation Projects & Facilities Web page, accessed October 2016 at https://www.usbr.gov/projects/index.php?id=403.
Christensen, V.G., Graham, J.L., Milligan, C.R., Pope, L.M., and Ziegler, A.C., 2006, Water quality and relation to taste-and-odor compounds in the North Fork Ninnescah River and Cheney Reservoir, south-central Kansas, 1997–2003: U.S. Geological Survey Scientific Investigations Report 2006–5095, 43 p. [Also available at https://pubs.usgs.gov/sir/2006/5095/.]
Davis, T.W., Berry, D.L., Boyer, G.L., Gobler, C.J., 2009, The effects of temperature and nutrients on the growth and dynamics of toxic and non-toxic strains of Microcystis during cyanobacteria blooms: Harmful Algae, v. 8, no. 5, p. 715–725. [Also available at http://dx.doi.org/10.1016/j.hal.2009.02.004.]
Foster, G.M., and Graham, J.L., 2016, Logistic and linear regression model documentation for statistical relations between continuous real-time and discrete water-quality constituents in the Kansas River, Kansas, July 2012 through June 2015: U.S. Geological Survey Open-File Report 2016–1040, 27 p. [Also available at http://dx.doi.org/10.3133/ofr20161040.]
Francy, D.S., Graham, J.L., Stelzer, E.A., Ecker, C.D., Brady, A.M.G., Struffolino, Pamela, and Loftin, K.A., 2015, Water quality, cyanobacteria, and environmental factors and their relations to microcystin concentrations for use in predictive models at Ohio Lake Erie and inland lake recreational sites, 2013–14: U.S. Geological Survey Scientific Investigations Report 2015–5120, 58 p. [Also available at http://dx.doi.org/10.3133/sir20155120.]
Graham, J.L., 2017, Phytoplankton data for Cheney Res-ervoir near Cheney, Kansas, June 2001 through October 2016: U.S. Geological Survey data release, https://doi.org/10.5066/F7ZG6QFX.
Graham, J.L., Loftin, K.A., and Kamman, Neil, 2009, Moni-toring recreational freshwaters: LakeLine, v. 29, Summer 2009, p. 18–24. [Also available at https://ks.water.usgs.gov/static_pages/studies/water_quality/cyanobacteria/LLsummer-graham2.pdf.]
Graham, J.L., Loftin, K.A., Meyer, M.T., and Ziegler, A.C., 2010, Cyanotoxin mixtures and taste-and-odor compounds in cyanobacterial blooms from the midwestern United States: Environmental Science and Technology, v. 44, no. 19, p. 7361–7368. [Also available at http://dx.doi.org/10.1021/es1008938.]
Graham, J.L., Loftin, K.A., Ziegler, A.C., and Meyer, M.T., 2008, Cyanobacteria in lakes and reservoirs—Toxin and taste-and-odor sampling guidelines (ver. 1.0): U.S. Geologi-cal Survey Techniques of Water-Resources Investigations, book 9, chap. A7, sec. 7.5, accessed September 2016 at https://pubs.water.usgs.gov/twri9A/.
Hansen, C.V., Whisnant, J.A., and Lanning-Rush, J.L., 2014, Status of groundwater levels and storage volume in the Equus Beds aquifer near Wichita, Kansas, 2012 to 2014: U.S. Geological Survey Scientific Investigations Report 2014–5185, 39 p. [Also available at http://dx.doi.org/10.3133/sir20145185.]
Helsel, D.R., and Hirsch, R.M., 2002, Statistical methods in water resources—Hydrologic analysis and interpretation: U.S. Geological Survey Techniques of Water-Resources Investigations, book 4, chap. A3, 522 p. [Also available at https://pubs.usgs.gov/twri/twri4a3/.]
Hudnell, H.K., ed., 2008, Cyanobacterial harmful algal blooms—State of the science and research needs: Advances in Experimental Medicine and Biology, v. 619, 950 p. [Also available at http://dx.doi.org/10.1007/978-0-387-75865-7.]
Kansas Applied Remote Sensing Program, 2009, 2005 Kansas land cover patterns—Level IV: Kansas Biological Survey, University of Kansas, Kansas Applied Remote Sensing Pro-gram Web page, accessed January 2017 at http://www.kars.ku.edu/research/2005-kansas-land-cover-patterns-level-iv/.
Kansas Biological Survey, 2012, Bathymetric and sediment survey of Cheney Reservoir, Reno-Kingman-Sedgwick Counties, Kansas: Kansas Biological Survey Report 2011–01, 54 p. [Also available at http://www.kwo.org/Reservoirs/ReservoirBathymetry/Rpt_Cheney_FINAL_report_082813_kbs.pdf.]
Kansas Department of Health and Environment [KDHE], 2015, Policy—Guidelines for addressing harmful algal blooms in Kansas recreational waters: Kansas Depart-ment of Health and Environment Internal Directive 1101.1, accessed September 2016 at http://www.kdheks.gov/algae-illness/download/HAB_policy.pdf.
Kansas Department of Health and Environment [KDHE], 2016a, Historical HABs: Kansas Department of Health and Environment, accessed September 2016 at http://www.kdheks.gov/algae-illness/historical_habs.htm.
Kansas Department of Health and Environment [KDHE], 2016b, 2016 303(d) list of all impaired/potentially impaired waters: Kansas Department of Health and Environment, accessed September 2016 at http://www.kdheks.gov/tmdl/2016/Proposed_Public_List_2016_All_Impaired_Waters.pdf.
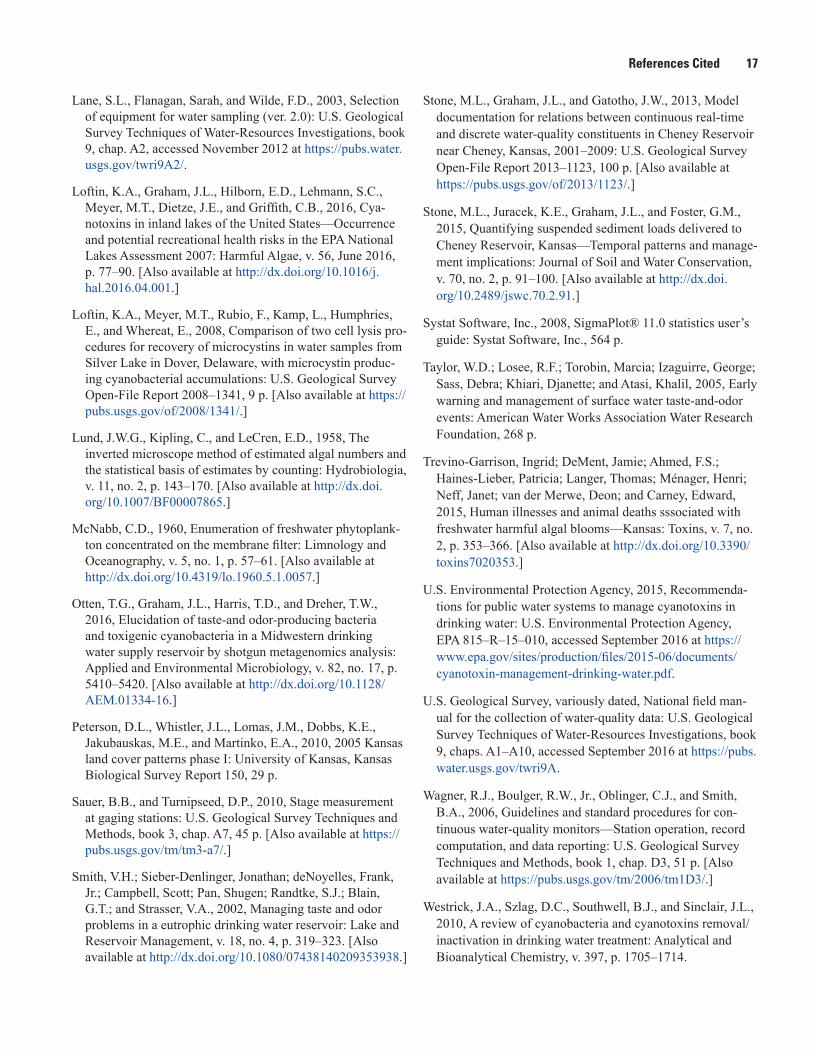
References Cited 17
Lane, S.L., Flanagan, Sarah, and Wilde, F.D., 2003, Selection of equipment for water sampling (ver. 2.0): U.S. Geological Survey Techniques of Water-Resources Investigations, book 9, chap. A2, accessed November 2012 at https://pubs.water.usgs.gov/twri9A2/.
Loftin, K.A., Graham, J.L., Hilborn, E.D., Lehmann, S.C., Meyer, M.T., Dietze, J.E., and Griffith, C.B., 2016, Cya-notoxins in inland lakes of the United States—Occurrence and potential recreational health risks in the EPA National Lakes Assessment 2007: Harmful Algae, v. 56, June 2016, p. 77–90. [Also available at http://dx.doi.org/10.1016/j.hal.2016.04.001.]
Loftin, K.A., Meyer, M.T., Rubio, F., Kamp, L., Humphries, E., and Whereat, E., 2008, Comparison of two cell lysis pro-cedures for recovery of microcystins in water samples from Silver Lake in Dover, Delaware, with microcystin produc-ing cyanobacterial accumulations: U.S. Geological Survey Open-File Report 2008–1341, 9 p. [Also available at https://pubs.usgs.gov/of/2008/1341/.]
Lund, J.W.G., Kipling, C., and LeCren, E.D., 1958, The inverted microscope method of estimated algal numbers and the statistical basis of estimates by counting: Hydrobiologia, v. 11, no. 2, p. 143–170. [Also available at http://dx.doi.org/10.1007/BF00007865.]
McNabb, C.D., 1960, Enumeration of freshwater phytoplank-ton concentrated on the membrane filter: Limnology and Oceanography, v. 5, no. 1, p. 57–61. [Also available at http://dx.doi.org/10.4319/lo.1960.5.1.0057.]
Otten, T.G., Graham, J.L., Harris, T.D., and Dreher, T.W., 2016, Elucidation of taste-and odor-producing bacteria and toxigenic cyanobacteria in a Midwestern drinking water supply reservoir by shotgun metagenomics analysis: Applied and Environmental Microbiology, v. 82, no. 17, p. 5410–5420. [Also available at http://dx.doi.org/10.1128/AEM.01334-16.]
Peterson, D.L., Whistler, J.L., Lomas, J.M., Dobbs, K.E., Jakubauskas, M.E., and Martinko, E.A., 2010, 2005 Kansas land cover patterns phase I: University of Kansas, Kansas Biological Survey Report 150, 29 p.
Sauer, B.B., and Turnipseed, D.P., 2010, Stage measurement at gaging stations: U.S. Geological Survey Techniques and Methods, book 3, chap. A7, 45 p. [Also available at https://pubs.usgs.gov/tm/tm3-a7/.]
Smith, V.H.; Sieber-Denlinger, Jonathan; deNoyelles, Frank, Jr.; Campbell, Scott; Pan, Shugen; Randtke, S.J.; Blain, G.T.; and Strasser, V.A., 2002, Managing taste and odor problems in a eutrophic drinking water reservoir: Lake and Reservoir Management, v. 18, no. 4, p. 319–323. [Also available at http://dx.doi.org/10.1080/07438140209353938.]
Stone, M.L., Graham, J.L., and Gatotho, J.W., 2013, Model documentation for relations between continuous real-time and discrete water-quality constituents in Cheney Reservoir near Cheney, Kansas, 2001–2009: U.S. Geological Survey Open-File Report 2013–1123, 100 p. [Also available at https://pubs.usgs.gov/of/2013/1123/.]
Stone, M.L., Juracek, K.E., Graham, J.L., and Foster, G.M., 2015, Quantifying suspended sediment loads delivered to Cheney Reservoir, Kansas—Temporal patterns and manage-ment implications: Journal of Soil and Water Conservation, v. 70, no. 2, p. 91–100. [Also available at http://dx.doi.org/10.2489/jswc.70.2.91.]
Systat Software, Inc., 2008, SigmaPlot® 11.0 statistics user’s guide: Systat Software, Inc., 564 p.
Taylor, W.D.; Losee, R.F.; Torobin, Marcia; Izaguirre, George; Sass, Debra; Khiari, Djanette; and Atasi, Khalil, 2005, Early warning and management of surface water taste-and-odor events: American Water Works Association Water Research Foundation, 268 p.
Trevino-Garrison, Ingrid; DeMent, Jamie; Ahmed, F.S.; Haines-Lieber, Patricia; Langer, Thomas; Ménager, Henri; Neff, Janet; van der Merwe, Deon; and Carney, Edward, 2015, Human illnesses and animal deaths sssociated with freshwater harmful algal blooms—Kansas: Toxins, v. 7, no. 2, p. 353–366. [Also available at http://dx.doi.org/10.3390/toxins7020353.]
U.S. Environmental Protection Agency, 2015, Recommenda-tions for public water systems to manage cyanotoxins in drinking water: U.S. Environmental Protection Agency, EPA 815–R–15–010, accessed September 2016 at https://www.epa.gov/sites/production/files/2015-06/documents/cyanotoxin-management-drinking-water.pdf.
U.S. Geological Survey, variously dated, National field man-ual for the collection of water-quality data: U.S. Geological Survey Techniques of Water-Resources Investigations, book 9, chaps. A1–A10, accessed September 2016 at https://pubs.water.usgs.gov/twri9A.
Wagner, R.J., Boulger, R.W., Jr., Oblinger, C.J., and Smith, B.A., 2006, Guidelines and standard procedures for con-tinuous water-quality monitors—Station operation, record computation, and data reporting: U.S. Geological Survey Techniques and Methods, book 1, chap. D3, 51 p. [Also available at https://pubs.usgs.gov/tm/2006/tm1D3/.]
Westrick, J.A., Szlag, D.C., Southwell, B.J., and Sinclair, J.L., 2010, A review of cyanobacteria and cyanotoxins removal/inactivation in drinking water treatment: Analytical and Bioanalytical Chemistry, v. 397, p. 1705–1714.

18 Occurrence of Cyanobacteria, Microcystin, and Taste-and-Odor Compounds in Cheney Reservoir, Kansas, 2001–16
Wilde, F.D., ed., variously dated, Field measurements: U.S. Geological Survey Techniques of Water-Resources Inves-tigations, book 9, chap. A6, accessed September 2016 at https://pubs.water.usgs.gov/twri9A6/.
Zar, J.H., 1999, Biostatistical analysis (4th ed): New Jersey, Prentice-Hall Inc., 663 p.
Zimmerman, L.R., Ziegler, A.C., and Thurman, E.M., 2002, Method of analysis and quality-assurance practices by U.S. Geological Survey Organic Geochemistry Research Group—Determination of geosmin and methylisoborneol in water using solid-phase microextraction and gas chromatog-raphy/mass spectrometry: U.S. Geological Survey Open-File Report 02–337, 12 p. [Also available at https://ks.water.usgs.gov/pubs/abstracts/ofr.02-337.html.]

Appendixes 1–4

20 Occurrence of Cyanobacteria, Microcystin, and Taste-and-Odor Compounds in Cheney Reservoir, Kansas, 2001–16
Appendix 1. 14-Year Logistic Regression Model Archival Summary for Microcystin Occurrence at Station 07144790, 2003–16 This model archival summary summarizes the logistic model for the probability of microcystin occurrence developed to compute hourly microcystin from January 1, 2003, onward.
Station and Model Information
Station number: 07144790 Station name: Cheney Re Nr Cheney, KS Station location: Latitude 37°43'34", Longitude 97°47'38" referenced to the North American Datum of 1927, in SE¼NE¼NW¼ sec. 6, T. 27 S., R. 04 W., Sedgwick County, Kansas, Hydrologic Unit 11030014.
Equipment: From April 2001 through September 2014, a YSI 6600 water-quality monitor was installed and equipped with sensors for water temperature, specific conductance, dissolved oxygen (YSI Clark cell [from April 2001 through January 2007] or YSI model 6150 optical [from February 2007 through September 2014]), pH, turbidity (YSI model 6026 [from April 2001 through September 2006] or YSI 6136 [from October 2006 through September 2014]), and chlorophyll fluorescence (YSI model 6025 sensor). From October 2014 to the present (December 2016), a Xylem YSI EXO2 water-quality monitor has been used and is equipped with sensors for water temperature, specific conductance, dissolved oxygen, pH, turbidity, and chlorophyll. The Xylem monitor is housed in a 4-inch diameter galvanized steel pipe. Readings from the water-quality monitor are recorded hourly, and data are transmitted hourly by satellite.
Date model was created: August 16, 2016
Model calibration data period: January 21, 2003, through June 15, 2016
Model application date: August 2016 onward
Model-Calibration Dataset
All data were collected using U.S. Geological Survey (USGS) protocols (U.S. Geological Survey, variously dated; https://water.usgs.gov/owq/FieldManual/) and are stored in the National Water Information System database (https://doi.org/10.5066/F7P55KJN). Logistic model equations were developed using the multiple logistic regression routine in SigmaPlot® version 13.0 (Systat Software, Inc., 2008). Explanatory variables were evaluated individually and in selected combinations. Explanatory variables selected as inputs to logistic regression were physicochemical properties: specific conductance, pH, water temperature, dissolved oxygen, chlorophyll fluorescence, and elevation of the reservoir surface. Seasonal components (sine and cosine variables) also were evaluated as explanatory variables in the models to determine if seasonal changes affected the model. All combinations of physicochemical properties and a seasonal component were evaluated to determine which combinations produced the best models.
The final selected logistic regression model was based on 213 concurrent measurements of microcystin occurrence collected from January 21, 2003, through June 15, 2016, and models the probability of the presence or absence of microcystin. Samples were collected throughout the range of continuously observed hydrologic conditions. In total, 103 samples were below the threshold for positive classification (0.1 microgram per liter [μg/L]). Summary statistics and the complete model-calibration dataset are provided below. Studentized residuals were inspected for values outside the 95-percent confidence interval, and leverage values for independent variables were inspected for values greater than 2. Values outside of the specified ranges were considered potential outliers and were investigated. No outliers were identified in the model-calibration dataset.

Appendix 1 21
Microcystin Sampling Details
Monthly to biweekly discrete water-quality samples collected during May 2001 through July 2004 were collected near the surface using a Teflon Kemmerer bottle or a weighted bottle sampler with a 1-liter Teflon bottle following USGS methods; these samples were not depth integrated. Starting in August 2004 discrete water-quality samples were collected as integrated photic-zone (depth at which light is about 1 percent of that at the surface) samples using a double check-valve bailer; these samples were depth integrated. Water-quality results collected before and after the sampling procedure change in summer 2004 were similar. Total microcystin was analyzed by the USGS Organic Geochemistry Research Laboratory, Lawrence, Kans. All samples were lysed by three sequential freeze-thaw cycles and filtered using 0.7-micrometer glass-fiber filters before analysis for microcystin. Abraxis® enzyme-linked immunosorbent assays were used to measure microcystin (congener independent).
Model Development
Logistic regression analysis was done using SigmaPlot by examining seasonality and other continuously measured data as explanatory variables for estimating microcystin occurrence. Seasonality was selected as the best predictor of microcystin based on a low Pearson Chi-square Statistic, high Likelihood Ratio Test Statistic, low -2 Log Likelihood Statistic, high Hosmer-Lemeshow Statistic, significant Wald Statistic, and low Variance Inflation Factor. A model classification table with a threshold probability for positive classification (TPPC) of 0.5 was also used in final model selection. After the best model was selected, the TPPC for the model was adjusted based on the fraction of data classified as positive to make the model more conservative (more likely to overestimate a positive response) by guarding more strongly against false negatives. Values for all the aforementioned statistics and metrics were computed for various models and are included below along with all relevant sample data and more in-depth statistical information.
Model Summary
Summary of final logistic regression analysis for microcystin occurrence at USGS station 07144790.
Probability of microcystin occurrence model:
( )logit 2 2( ( 0.103 1.056sin 0.663cls 0.00459
365 365D D
P Chip pæ ö æ ö÷ ÷ç ç÷ ÷= . . . +ç ç÷ ÷ç ç÷ ÷ç çè ø è ø
(1–1)
where
logit(P) is the logistic probability of microcystin occurrence (concentrations greater than or equal to 0.1 microgram per liter);
D is the Julian day of the year;
Chl is fluorescence at wavelength of 650 to 700 nanometers, in micrograms per liter as chlorophyll.
Seasonality (the information contained in the sine [sin] and cosine [cos] component of the equation; Helsel and Hirsch, 2002) and Chl make physical and statistical sense as explanatory variables for microcystin.
Previously Published Model
( )logit 2 2( ( 1.305 1.990 sin 1.340 cls 0.0511
365 365D D
P Chip pæ ö æ ö÷ ÷ç ç÷ ÷= . . . +ç ç÷ ÷ç ç÷ ÷ç çè ø è ø
(1–2)
Model author: Stone and others (2013)
Model data period: June 2005 through December 2009

22 Occurrence of Cyanobacteria, Microcystin, and Taste-and-Odor Compounds in Cheney Reservoir, Kansas, 2001–16
Probability of Microcystin Occurrence Record
The microcystin occurrence record is computed using this regression model, and the complete water-quality record is stored at the National Real-Time Water Quality website: https://nrtwq.usgs.gov/ks. Data are computed at 60-minute intervals.
SigmaPlot® Output for Microcystin at Station 07144790
14-Year Model Form
( )logit 2 2( ( 0.103 1.056sin 0.663cls 0.00459
365 365D D
P Chip pæ ö æ ö÷ ÷ç ç÷ ÷= . . . +ç ç÷ ÷ç ç÷ ÷ç çè ø è ø
(1–3)
Variable Summary Statistics
[μg/L, microgram per liter; Chl, is fluorescence at wavelength of 650 to 700 nanometers, in μg/L as chlorophyll; <, less than; --, not computed]
Summary statistic
Microcystin (μg/L)
Microcystin binary
Chl (μg/L)
Minimum <0.1 0 0 1st quartile <0.1 0 6 Median 0.1 1 8 Mean -- 1 13 3d quartile 0.3 1 14 Maximum 9.0 1 96

Appendix 1 23
Model Calibration Using Multiple Logistic Regression See the 14-year model form in equation 1–3 above. Number of samples=213 Missing observations=17 Estimation criterion: Maximum likelihood Dependent variable: Microcystin binary plus or minus (±) Positive response=1 Reference response=0 Number of unique independent variable combinations=213 Pearson Chi-square Statistic=215.079 (probability value [p-value]=0.354) Likelihood Ratio Test Statistic=38.057 (p-value=less than 0.001) -2*Log(Likelihood)=256.994 Hosmer-Lemeshow Statistic=13.734 (p-value=0.089) TPPC=0.43
Classification table Predicted reference responses
Predicted positive responses
Total actual responses
Percent correctly classified responses
Actual reference responses 63 40 103 61 Actual positive responses 23 87 110 79 Total 86 127 213 70 Details of the logistic regression equation: [p-value, probability value; VIF, Variance Inflation Factor; --, not measured; sin, sine of the seasonality component; cos, cosine of the seasonality component; <, less than; Chl, fluorescence at wavelength of 650 to 700 nanometers, in micrograms per liter as chlorophyll]
Independent variable Coefficient Standard error Wald statistic p-value VIF Constant –0.103 0.233 0.196 0.658 -- sin –1.056 0.230 21.114 <0.001 1.170 cos –0.663 0.226 8.591 0.003 1.085 Chl 0.00459 0.0134 0.117 0.732 1.249
Independent variable Odds ratio Lower 5-percent confidence interval
Upper 95-percent confidence interval
Constant 0.902 0.571 1.424 sin 0.348 0.222 0.546 cos 0.516 0.331 0.803 Chl 1.005 0.979 1.031
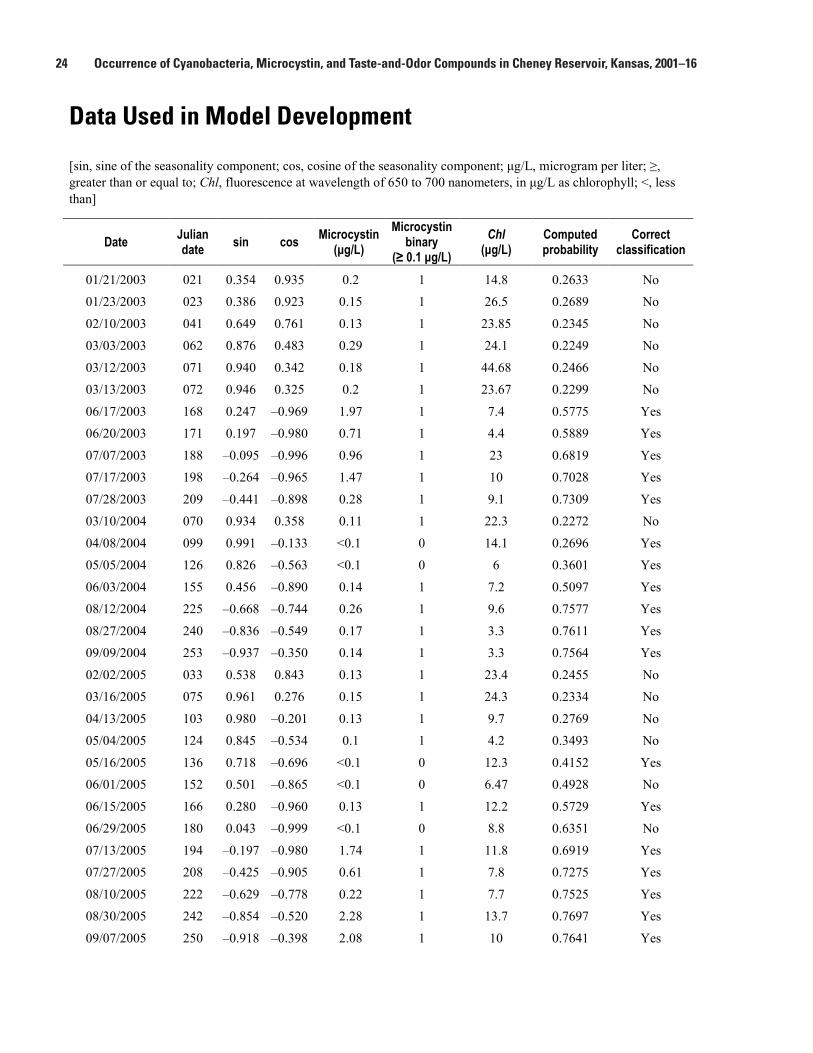
24 Occurrence of Cyanobacteria, Microcystin, and Taste-and-Odor Compounds in Cheney Reservoir, Kansas, 2001–16
Data Used in Model Development
[sin, sine of the seasonality component; cos, cosine of the seasonality component; μg/L, microgram per liter; ≥, greater than or equal to; Chl, fluorescence at wavelength of 650 to 700 nanometers, in μg/L as chlorophyll; <, less than]
Date Julian date sin cos Microcystin
(μg/L) Microcystin
binary (≥ 0.1 μg/L)
Chl (μg/L)
Computed probability
Correct classification
01/21/2003 021 0.354 0.935 0.2 1 14.8 0.2633 No
01/23/2003 023 0.386 0.923 0.15 1 26.5 0.2689 No
02/10/2003 041 0.649 0.761 0.13 1 23.85 0.2345 No
03/03/2003 062 0.876 0.483 0.29 1 24.1 0.2249 No
03/12/2003 071 0.940 0.342 0.18 1 44.68 0.2466 No
03/13/2003 072 0.946 0.325 0.2 1 23.67 0.2299 No
06/17/2003 168 0.247 –0.969 1.97 1 7.4 0.5775 Yes
06/20/2003 171 0.197 –0.980 0.71 1 4.4 0.5889 Yes
07/07/2003 188 –0.095 –0.996 0.96 1 23 0.6819 Yes
07/17/2003 198 –0.264 –0.965 1.47 1 10 0.7028 Yes
07/28/2003 209 –0.441 –0.898 0.28 1 9.1 0.7309 Yes
03/10/2004 070 0.934 0.358 0.11 1 22.3 0.2272 No
04/08/2004 099 0.991 –0.133 <0.1 0 14.1 0.2696 Yes
05/05/2004 126 0.826 –0.563 <0.1 0 6 0.3601 Yes
06/03/2004 155 0.456 –0.890 0.14 1 7.2 0.5097 Yes
08/12/2004 225 –0.668 –0.744 0.26 1 9.6 0.7577 Yes
08/27/2004 240 –0.836 –0.549 0.17 1 3.3 0.7611 Yes
09/09/2004 253 –0.937 –0.350 0.14 1 3.3 0.7564 Yes
02/02/2005 033 0.538 0.843 0.13 1 23.4 0.2455 No
03/16/2005 075 0.961 0.276 0.15 1 24.3 0.2334 No
04/13/2005 103 0.980 –0.201 0.13 1 9.7 0.2769 No
05/04/2005 124 0.845 –0.534 0.1 1 4.2 0.3493 No
05/16/2005 136 0.718 –0.696 <0.1 0 12.3 0.4152 Yes
06/01/2005 152 0.501 –0.865 <0.1 0 6.47 0.4928 No
06/15/2005 166 0.280 –0.960 0.13 1 12.2 0.5729 Yes
06/29/2005 180 0.043 –0.999 <0.1 0 8.8 0.6351 No
07/13/2005 194 –0.197 –0.980 1.74 1 11.8 0.6919 Yes
07/27/2005 208 –0.425 –0.905 0.61 1 7.8 0.7275 Yes
08/10/2005 222 –0.629 –0.778 0.22 1 7.7 0.7525 Yes
08/30/2005 242 –0.854 –0.520 2.28 1 13.7 0.7697 Yes
09/07/2005 250 –0.918 –0.398 2.08 1 10 0.7641 Yes

Appendix 1 25
Date Julian date sin cos Microcystin
(μg/L) Microcystin
binary (≥ 0.1 μg/L)
Chl (μg/L)
Computed probability
Correct classification
10/13/2005 286 –0.978 0.209 0.38 1 9.8 0.6976 Yes
10/27/2005 300 –0.900 0.437 0.2 1 8.8 0.6452 Yes
01/11/2006 011 0.188 0.982 <0.1 0 17.7 0.2949 Yes
03/01/2006 060 0.859 0.512 <0.1 0 17.1 0.2191 Yes
03/29/2006 088 0.998 0.056 <0.1 0 23.5 0.2523 Yes
04/25/2006 115 0.918 –0.398 <0.1 0 11.1 0.3192 Yes
05/17/2006 137 0.706 –0.709 <0.1 0 12.5 0.4205 Yes
05/31/2006 151 0.516 –0.857 <0.1 0 10.6 0.4921 No
06/14/2006 165 0.297 –0.955 <0.1 0 6.6 0.5615 No
06/28/2006 179 0.060 –0.998 0.21 1 7.2 0.6291 Yes
07/13/2006 194 –0.197 –0.980 0.17 1 6 0.6862 Yes
07/26/2006 207 –0.409 –0.912 0.18 1 10.7 0.7278 Yes
08/10/2006 222 –0.629 –0.778 1.61 1 10.2 0.7546 Yes
08/22/2006 234 –0.775 –0.632 0.62 1 7.5 0.7629 Yes
09/06/2006 249 –0.911 –0.413 2.65 1 21.9 0.7744 Yes
09/20/2006 263 –0.983 –0.184 1.25 1 9.9 0.7507 Yes
09/26/2006 269 –0.997 –0.082 3.6 1 13.38 0.7436 Yes
09/28/2006 271 –0.999 –0.047 3.75 1 10 0.7367 Yes
09/29/2006 272 –1.000 –0.030 3.39 1 11 0.7356 Yes
10/11/2006 284 –0.984 0.176 0.72 1 7.3 0.7013 Yes
10/25/2006 298 –0.914 0.405 0.32 1 7 0.6515 Yes
12/12/2006 346 –0.321 0.947 <0.1 0 9 0.4133 Yes
02/07/2007 038 0.608 0.794 <0.1 0 0 0.2190 Yes
03/07/2007 066 0.907 0.421 <0.1 0 32.3 0.2329 Yes
04/09/2007 099 0.991 –0.133 <0.1 0 17.9 0.2730 Yes
05/08/2007 128 0.806 –0.591 0.1 1 4.2 0.3674 No
05/31/2007 151 0.516 –0.857 0.23 1 5.1 0.4858 Yes
06/13/2007 164 0.313 –0.950 <0.1 0 5.2 0.5548 No
06/25/2007 176 0.112 –0.994 <0.1 0 4.99 0.6132 No
07/09/2007 190 –0.129 –0.992 0.22 1 7.59 0.6738 Yes
07/23/2007 204 –0.362 –0.932 0.61 1 7.6 0.7175 Yes
08/07/2007 219 –0.588 –0.809 0.66 1 6.6 0.7473 Yes
08/15/2007 227 –0.693 –0.721 1.39 1 9.4 0.7595 Yes
08/28/2007 240 –0.836 –0.549 1.12 1 6.6 0.7639 Yes
09/12/2007 255 –0.948 –0.317 0.63 1 7 0.7578 Yes
09/24/2007 267 –0.993 –0.116 0.68 1 8.4 0.7429 Yes
10/15/2007 288 –0.970 0.243 0.28 1 5 0.6864 Yes

26 Occurrence of Cyanobacteria, Microcystin, and Taste-and-Odor Compounds in Cheney Reservoir, Kansas, 2001–16
Date Julian date sin cos Microcystin
(μg/L) Microcystin
binary (≥ 0.1 μg/L)
Chl (μg/L)
Computed probability
Correct classification
10/29/2007 302 –0.884 0.467 0.15 1 5.7 0.6334 Yes
11/13/2007 317 –0.735 0.678 <0.1 0 10.5 0.5677 No
12/19/2007 353 –0.205 0.979 <0.1 0 4.3 0.3739 Yes
02/11/2008 042 0.662 0.750 0.15 1 11.33 0.2233 No
02/14/2008 045 0.699 0.715 <0.1 0 11.57 0.2206 Yes
02/15/2008 046 0.712 0.703 0.12 1 12.68 0.2206 No
03/10/2008 070 0.934 0.358 <0.1 0 26.2 0.2304 Yes
04/01/2008 092 1.000 –0.013 0.12 1 28.6 0.2652 No
04/16/2008 107 0.963 –0.268 <0.1 0 11.4 0.2910 Yes
04/29/2008 120 0.880 –0.475 <0.1 0 5 0.3330 Yes
05/13/2008 134 0.741 –0.671 <0.1 0 7 0.3993 Yes
06/03/2008 155 0.456 –0.890 <0.1 0 6.3 0.5086 No
06/18/2008 170 0.214 –0.977 0.1 1 5.4 0.5852 Yes
07/07/2008 189 –0.112 –0.994 0.83 1 6.8 0.6693 Yes
07/21/2008 203 –0.346 –0.938 1.06 1 11.9 0.7188 Yes
07/28/2008 210 –0.456 –0.890 0.43 1 24.4 0.7466 Yes
08/04/2008 217 –0.560 –0.829 0.19 1 4.4 0.7422 Yes
08/18/2008 231 –0.741 –0.671 0.19 1 2.1 0.7567 Yes
09/02/2008 246 –0.888 –0.460 <0.1 0 7.1 0.7635 No
09/17/2008 261 –0.976 –0.218 0.11 1 3 0.7476 Yes
10/01/2008 275 –1.000 0.022 <0.1 0 7.5 0.7257 No
10/15/2008 289 –0.966 0.260 <0.1 0 5.4 0.6834 No
11/04/2008 309 –0.821 0.570 0.11 1 8.1 0.6043 Yes
12/02/2008 337 –0.464 0.886 <0.1 0 6.4 0.4572 No
01/06/2009 006 0.103 0.995 <0.1 0 23.1 0.3175 Yes
01/20/2009 020 0.338 0.941 <0.1 0 31.2 0.2808 Yes
02/02/2009 033 0.538 0.843 <0.1 0 49.4 0.2683 Yes
02/18/2009 049 0.747 0.665 <0.1 0 20.71 0.2249 Yes
02/25/2009 056 0.821 0.570 <0.1 0 25.3 0.2258 Yes
03/03/2009 062 0.876 0.483 <0.1 0 24.7 0.2254 Yes
03/09/2009 068 0.921 0.390 <0.1 0 25.6 0.2286 Yes
03/12/2009 071 0.940 0.342 <0.1 0 25.3 0.2304 Yes
03/16/2009 075 0.961 0.276 <0.1 0 23.4 0.2326 Yes
03/25/2009 084 0.992 0.124 <0.1 0 22.4 0.2441 Yes
04/08/2009 098 0.993 –0.116 <0.1 0 15.1 0.2678 Yes
04/29/2009 119 0.888 –0.460 <0.1 0 5.5 0.3294 Yes
05/27/2009 147 0.574 –0.819 <0.1 0 7.7 0.4674 No

Appendix 1 27
Date Julian date sin cos Microcystin
(μg/L) Microcystin
binary (≥ 0.1 μg/L)
Chl (μg/L)
Computed probability
Correct classification
06/09/2009 160 0.378 –0.926 <0.1 0 10.4 0.5399 No
06/23/2009 174 0.146 –0.989 <0.1 0 25 0.6257 No
07/07/2009 188 –0.095 –0.996 0.13 1 9.2 0.6680 Yes
07/21/2009 202 –0.329 –0.944 <0.1 0 2.4 0.7072 No
08/05/2009 217 –0.560 –0.829 <0.1 0 8.6 0.7459 No
08/24/2009 236 –0.796 –0.605 <0.1 0 6.2 0.7627 No
09/02/2009 245 –0.880 –0.475 <0.1 0 4.4 0.7616 No
09/16/2009 259 –0.968 –0.251 2.91 1 3.1 0.7502 Yes
10/15/2009 288 –0.970 0.243 <0.1 0 4.19 0.6856 No
10/19/2009 292 –0.951 0.309 <0.1 0 4.74 0.6722 No
11/23/2009 327 –0.608 0.794 <0.1 0 5.1 0.5092 No
12/16/2009 350 –0.255 0.967 <0.1 0 5.79 0.3899 Yes
01/12/2010 012 0.205 0.979 <0.1 0 0 0.2752 Yes
02/10/2010 041 0.649 0.761 <0.1 0 53.0 0.2594 Yes
02/17/2010 048 0.735 0.678 <0.1 0 57.1 0.2560 Yes
02/24/2010 055 0.812 0.584 <0.1 0 96.2 0.2879 Yes
03/03/2010 062 0.876 0.483 <0.1 0 90.5 0.2824 Yes
03/10/2010 069 0.928 0.374 <0.1 0 54.6 0.2536 Yes
03/22/2010 081 0.984 0.176 <0.1 0 36.6 0.2514 Yes
04/12/2010 102 0.983 –0.184 <0.1 0 7.4 0.2719 Yes
05/18/2010 138 0.693 –0.721 <0.1 0 3.3 0.4153 Yes
06/17/2010 168 0.247 –0.969 <0.1 0 47.1 0.6212 No
06/30/2010 181 0.026 –1.000 <0.1 0 4.5 0.6349 No
07/14/2010 195 –0.214 –0.977 <0.1 0 9.4 0.6928 No
07/29/2010 210 –0.456 –0.890 <0.1 0 16.3 0.7395 No
08/12/2010 224 –0.655 –0.755 <0.1 0 5.3 0.7529 No
08/26/2010 238 –0.817 –0.577 <0.1 0 7.4 0.7642 No
09/08/2010 251 –0.924 –0.382 <0.1 0 6.1 0.7603 No
09/22/2010 265 –0.989 –0.150 <0.1 0 4.9 0.7433 No
10/04/2010 277 –0.998 0.056 <0.1 0 13.7 0.7265 No
10/18/2010 291 –0.956 0.293 <0.1 0 8.5 0.6796 No
11/15/2010 319 –0.712 0.703 <0.1 0 7.7 0.5543 No
12/06/2010 340 –0.417 0.909 <0.1 0 4 0.4387 No
01/18/2011 018 0.305 0.952 <0.1 0 5.1 0.2625 Yes
02/14/2011 045 0.699 0.715 <0.1 0 3.3 0.2141 Yes
03/14/2011 073 0.951 0.309 <0.1 0 8.2 0.2185 Yes
04/11/2011 101 0.986 –0.167 <0.1 0 8.8 0.2703 Yes

28 Occurrence of Cyanobacteria, Microcystin, and Taste-and-Odor Compounds in Cheney Reservoir, Kansas, 2001–16
Date Julian date sin cos Microcystin
(μg/L) Microcystin
binary (≥ 0.1 μg/L)
Chl (μg/L)
Computed probability
Correct classification
05/11/2011 131 0.775 –0.632 <0.1 0 4.7 0.3821 Yes
06/13/2011 164 0.313 –0.950 <0.1 0 6.3 0.5560 No
07/11/2011 192 –0.163 –0.987 0.55 1 4.9 0.6782 Yes
08/01/2011 213 –0.501 –0.865 2.32 1 5.1 0.7356 Yes
08/08/2011 220 –0.602 –0.799 8.97 1 4.7 0.7472 Yes
08/15/2011 227 –0.693 –0.721 1.31 1 1.0 0.7524 Yes
08/25/2011 237 –0.806 –0.591 0.92 1 5.6 0.7625 Yes
08/30/2011 242 –0.854 –0.520 0.25 1 4.9 0.7625 Yes
09/06/2011 249 –0.911 –0.413 0.39 1 9.7 0.7644 Yes
09/20/2011 263 –0.983 –0.184 0.65 1 19.4 0.7588 Yes
10/04/2011 277 –0.998 0.056 0.19 1 8.1 0.7214 Yes
11/01/2011 305 –0.859 0.512 0.14 1 4.7 0.6191 Yes
12/12/2011 346 –0.321 0.947 0.12 1 2.8 0.4064 No
01/18/2012 018 0.305 0.952 <0.1 0 4.7 0.2621 Yes
02/14/2012 045 0.699 0.715 0.11 1 3.9 0.2146 No
03/12/2012 072 0.946 0.325 <0.1 0 28.3 0.2337 Yes
04/16/2012 107 0.963 –0.268 <0.1 0 8.5 0.2883 Yes
05/16/2012 137 0.706 –0.709 <0.1 0 6.3 0.4135 Yes
06/11/2012 163 0.329 –0.944 0.4 1 6 0.5505 Yes
06/27/2012 179 0.060 –0.998 0.39 1 7.3 0.6292 Yes
07/09/2012 191 –0.146 –0.989 0.79 1 8.9 0.6787 Yes
07/31/2012 213 –0.501 –0.865 0.22 1 7 0.7373 Yes
08/21/2012 234 –0.775 –0.632 0.19 1 7.1 0.7626 Yes
09/19/2012 263 –0.983 –0.184 <0.1 0 14.5 0.7546 No
10/16/2012 290 –0.961 0.276 <0.1 0 7.8 0.6824 No
12/11/2012 346 –0.321 0.947 <0.1 0 11.1 0.4157 Yes
01/15/2013 015 0.262 0.965 <0.1 0 8.1 0.2724 Yes
01/23/2013 023 0.392 0.920 <0.1 0 9 0.2525 Yes
02/12/2013 043 0.679 0.734 <0.1 0 18.2 0.2274 Yes
03/19/2013 078 0.976 0.220 0.1 1 29.1 0.2413 No
04/09/2013 099 0.990 –0.139 <0.1 0 24.1 0.2798 Yes
05/07/2013 127 0.813 –0.583 <0.1 0 3.1 0.3634 Yes
06/06/2013 157 0.419 –0.908 <0.1 0 6.7 0.5218 No
07/08/2013 189 –0.119 –0.993 3 1 9 0.6731 Yes
07/23/2013 204 –0.368 –0.930 0.89 1 4.6 0.7156 Yes
08/06/2013 218 –0.579 –0.815 7.3 1 4.5 0.7445 Yes
08/19/2013 231 –0.746 –0.666 1.1 1 6 0.7602 Yes

Appendix 1 29
Date Julian date sin cos Microcystin
(μg/L) Microcystin
binary (≥ 0.1 μg/L)
Chl (μg/L)
Computed probability
Correct classification
09/09/2013 252 –0.933 –0.359 0.43 1 16.1 0.7676 Yes
09/25/2013 268 –0.996 –0.092 0.47 1 9.2 0.7412 Yes
10/21/2013 294 –0.937 0.348 0.3 1 8.2 0.6668 Yes
10/28/2013 301 –0.888 0.459 0.23 1 8.6 0.6388 Yes
11/06/2013 310 –0.808 0.590 0.14 1 9.9 0.5998 Yes
11/13/2013 318 –0.729 0.685 0.13 1 8.4 0.5624 Yes
11/18/2013 322 –0.669 0.743 0.12 1 8.4 0.5373 Yes
12/12/2013 346 –0.314 0.949 <0.1 0 7.2 0.4092 Yes
01/15/2014 015 0.262 0.965 0.11 1 7.2 0.2716 No
02/19/2014 050 0.763 0.646 0.11 1 9.5 0.2152 No
03/19/2014 078 0.976 0.220 0.18 1 45.2 0.2551 No
04/16/2014 106 0.966 –0.257 0.19 1 7.7 0.2855 No
05/20/2014 140 0.663 –0.748 0.13 1 10.03 0.4351 Yes
06/25/2014 176 0.105 –0.995 0.41 1 10.3 0.6209 Yes
07/10/2014 191 –0.153 –0.988 0.27 1 7.3 0.6786 Yes
07/22/2014 203 –0.352 –0.936 0.45 1 9.8 0.7180 Yes
08/05/2014 217 –0.565 –0.825 0.37 1 8.1 0.7461 Yes
09/16/2014 259 –0.970 –0.245 0.43 1 11 0.7565 Yes
10/28/2014 301 –0.889 0.458 0.19 1 6.9 0.6372 Yes
11/20/2014 324 –0.643 0.766 0.2 1 11.5 0.5303 Yes
12/16/2014 350 –0.255 0.967 <0.1 0 7.5 0.3918 Yes
01/13/2015 013 0.222 0.975 <0.1 0 12.4 0.2836 Yes
02/10/2015 041 0.649 0.761 0.12 1 17.2 0.2291 No
03/10/2015 069 0.928 0.374 <0.1 0 25.6 0.2292 Yes
04/15/2015 105 0.972 –0.234 <0.1 0 4.54 0.2782 Yes
05/06/2015 126 0.826 –0.563 <0.1 0 2.44 0.3564 Yes
06/09/2015 160 0.378 –0.926 0.19 1 1.57 0.5298 Yes
07/07/2015 188 –0.095 –0.996 0.4 1 7.16 0.6659 Yes
08/04/2015 216 –0.545 –0.838 <0.1 0 11.6 0.7468 No
09/08/2015 251 –0.924 –0.382 0.13 1 13.7 0.7666 Yes
11/09/2015 313 –0.780 0.625 <0.1 0 9.46 0.5866 No
02/17/2016 048 0.735 0.678 <0.1 0 6.83 0.2146 Yes
05/17/2016 138 0.693 –0.721 <0.1 0 3.57 0.4156 Yes
06/15/2016 167 0.264 –0.965 0.63 1 16 0.5821 Yes

30 Occurrence of Cyanobacteria, Microcystin, and Taste-and-Odor Compounds in Cheney Reservoir, Kansas, 2001–16
References Cited
Helsel, D.R., and Hirsch, R.M., 2002, Statistical methods in water resources—Hydrologic analysis and
interpretation: U.S. Geological Survey Techniques of Water-Resources Investigations, book 4, chap. A3, 522 p.
[Also available at https://pubs.usgs.gov/twri/twri4a3/.]
Systat Software, Inc., 2008, SigmaPlot® 11.0 statistics user’s guide: Systat Software, Inc., 564 p.
U.S. Geological Survey, variously dated, National field manual for the collection of water-quality data: U.S.
Geological Survey Techniques of Water-Resources Investigations, book 9, chaps. A1–A10, accessed September
2016 at https://pubs.water.usgs.gov/twri9A.

Appendix 2 31
Appendix 2. 4-Year Logistic Regression Model Archival Summary for Microcystin Occurrence at Station 07144790, 2013–16 This model archival summary summarizes the logistic model for the probability of microcystin occurrence developed to compute hourly microcystin from January 1, 2013, onward.
Station and Model Information
Station number: 07144790 Station name: Cheney Re Nr Cheney, KS Station location: Latitude 37°43'34", Longitude 97°47'38" referenced to the North American Datum of 1927, in SE¼NE¼NW¼ sec. 6, T. 27 S., R. 04 W., Sedgwick County, Kansas, Hydrologic Unit 11030014.
Equipment: From April 2001 through September 2014, a YSI 6600 water-quality monitor was installed and equipped with sensors for water temperature, specific conductance, dissolved oxygen (YSI Clark cell [from April 2001 through January 2007] or YSI model 6150 optical [from February 2007 through September 2014]), pH, turbidity (YSI model 6026 [from April 2001 through September 2006] or YSI 6136 [from October 2006 through September 2014]), and chlorophyll. From October 2014 to the present (December 2016), a Xylem YSI EXO2 water-quality monitor has been used and is equipped with sensors for water temperature, specific conductance, dissolved oxygen, pH, turbidity, and chlorophyll fluorescence (YSI model 6025 sensor). The Xylem monitor is housed in a 4-inch diameter galvanized steel pipe. Readings from the water-quality monitor are recorded hourly and data are transmitted hourly by satellite.
Date model was created: August 16, 2016
Model calibration data period: January 15, 2013, through June 15, 2016
Model application date: August 2016 onward
Model-Calibration Dataset
All data were collected using U.S. Geological Survey (USGS) protocols (U.S. Geological Survey, variously dated; https://water.usgs.gov/owq/FieldManual/) and are stored in the National Water Information System database (https://doi.org/10.5066/F7P55KJN). Logistic model equations were developed using the multiple logistic regression routine in SigmaPlot® version 11.0 (Systat Software, Inc., 2008). Explanatory variables were evaluated individually and in selected combinations. Explanatory variables selected as inputs to logistic regression were physicochemical properties: specific conductance, pH, water temperature, dissolved oxygen, chlorophyll fluorescence, and elevation of the reservoir surface. Seasonal components (sine and cosine variables) also were evaluated as explanatory variables in the models to determine if seasonal changes affected the model. All combinations of physicochemical properties and a seasonal component were evaluated to determine which combinations produced the best models.
The final selected logistic regression model was based on 45 concurrent measurements of microcystin occurrence collected from January 15, 2013, through June 15, 2016, and models the probability of the presence or absence of microcystin. Samples were collected throughout the range of continuously observed hydrologic conditions. In total, 16 samples were below the threshold for positive classification (0.1 microgram per liter [μg/L]). Summary statistics and the complete model-calibration dataset are provided below. Studentized residuals were inspected for values outside the 95-percent confidence interval and leverage values for independent variables were inspected for values greater than 2. Values outside of the specified ranges were considered potential outliers and were investigated. No outliers were identified in the model-calibration dataset.

32 Occurrence of Cyanobacteria, Microcystin, and Taste-and-Odor Compounds in Cheney Reservoir, Kansas, 2001–16
Microcystin Sampling Details
Discrete water-quality samples were collected monthly to biweekly during January 2013 through June 2016. Samples were collected as integrated photic-zone (depth at which light is about 1 percent of that at the surface) samples using a double check-valve bailer; these samples were depth integrated. Total microcystin was analyzed by the USGS Organic Geochemistry Research Laborabory, Lawrence, Kans. All samples were lysed by three sequential freeze-thaw cycles and filtered using 0.7-micrometer glass-fiber filters before analysis for microcystin. Abraxis® enzyme-linked immunosorbent assays were used to measure microcystin (congener independent).
Model Development
Logistic regression analysis was done using SigmaPlot by examining seasonality and other continuously measured data as explanatory variables for estimating microcystin occurrence. Seasonality was selected as the best predictor of microcystin based on a relatively low Pearson Chi-square Statistic, relatively high Likelihood Ratio Test Statistic, relatively low -2 Log Likelihood Statistic, relatively high Hosmer-Lemeshow Statistic, significant Wald Statistic, and relatively low Variance Inflation Factor. A model classification table with a threshold probability for positive classification (TPPC) of 0.5 also was used in final model selection. After the best model was selected, the TPPC for the model was adjusted based on the fraction of data classified as positive to make the model more conservative (more likely to overestimate a positive response) by guarding more strongly against false negatives. Values for all of the aforementioned statistics and metrics were computed for various models and are included below along with all relevant sample data and more indepth statistical information.
Model Summary
Summary of final logistic regression analysis for microcystin occurrence at USGS station 07144790.
Probability of microcystin occurrence model:
( )logit 2 2( ( 0.190 1.868sin 1.109cls 0.0910
365 365D D
P Chip pæ ö æ ö÷ ÷ç ç÷ ÷= . . . +ç ç÷ ÷ç ç÷ ÷ç çè ø è ø
(2–1)
where
logit(P) is the logistic probability of microcystin occurrence (concentrations greater than or equal to 0.1 microgram per liter);
D is the Julian day of the year;
Chl is fluorescence at wavelength of 650 to 700 nanometers, in micrograms per liter as chlorophyll.
Seasonality (the information contained in the sine [sin] and cosine [cos] component of the equation; Helsel and Hirsch, 2002) and Chl make physical and statistical sense as explanatory variables for microcystin.
Previously Published Model
( )logit 2 2( ( 1.305 1.990 sin 1.340 cls 0.0511
365 365D D
P Chip pæ ö æ ö÷ ÷ç ç÷ ÷= . . . +ç ç÷ ÷ç ç÷ ÷ç çè ø è ø
(2–2)
Model author: Stone and others (2013)
Model data period: June 2005 through December 2009

Appendix 2 33
Probability of Microcystin Occurrence Record
The microcystin occurrence record is computed using this regression model, and the complete water-quality record is stored at the National Real-Time Water Quality website: http://nrtwq.usgs.gov/ks. Data are computed at 60-minute intervals.
SigmaPlot® Output for Microcystin at Station 07144790
4-Year Model Form
( )logit 2 2( ( 0.190 1.868sin 1.109cls 0.0910
365 365D D
P Chip pæ ö æ ö÷ ÷ç ç÷ ÷= . . . +ç ç÷ ÷ç ç÷ ÷ç çè ø è ø
(2–3)
Variable Summary Statistics
[μg/L, microgram per liter; Chl, fluorescence at wavelength of 650 to 700 nanometers, in micrograms per liter as chlorophyll; <, less than; --, not measured]
Summary statistic
Microcystin (μg/L)
Microcystin binary
Chl (μg/L)
Minimum <0.1 0 2 1st quartile <0.1 0 7.16 Median 0.1 1 9 Mean -- 1 11 3d quartile 0.4 1 12 Maximum 7.0 1 45

34 Occurrence of Cyanobacteria, Microcystin, and Taste-and-Odor Compounds in Cheney Reservoir, Kansas, 2001–16
Model Calibration Using Multiple Logistic Regression
See the 4-year model form in equation 2–3 above. Number of samples=45 Missing observations=186 Estimation criterion: Maximum likelihood Dependent Variable: Microcystin binary (abbr) plus or minus (±) Positive response=1 Reference response=0 Number of unique independent variable combinations=45 Pearson Chi-square Statistic=48.443 (probability value [p-value]=0.169) Likelihood Ratio Test Statistic=14.971 (p-value=0.002) -2*Log(Likelihood)=43.603 Hosmer-Lemeshow Statistic=9.465 (p-value=0.305) TPPC=0.56
Classification table Predicted reference responses
Predicted positive responses
Total actual responses
Percent correctly classified responses
Actual reference responses 12 4 16 75 Actual positive responses 4 25 29 86 Total 16 29 45 81 Details of the logistic regression equation: [p-value, probability value; VIF, Variance Inflation Factor; --, not measured; sin, sine of the seasonality component; cos, cosine of the seasonality component; <, less than; Chl, fluorescence at wavelength of 650 to 700 nanometers, in micrograms per liter as chlorophyll]
Independent variable Coefficient Standard error Wald statistic p-value VIF Constant –0.190 0.647 0.0866 0.769 -- Sin –1.868 0.631 8.753 0.003 1.099 Cos –1.109 0.542 4.180 0.041 1.043 Chl 0.0910 0.0525 3.006 0.083 1.143
Independent variable Odds ratio Lower 5-percent confidence interval
Upper 95-percent confidence interval
Constant 0.827 0.232 2.939 sin 0.154 0.0448 0.532 cos 0.330 0.114 0.955 Chl 1.095 0.988 1.214

Appendix 2 35
Data Used in Model Development [sin, sine of the seasonality component; cos, cosine of the seasonality component; μg/L, microgram per liter; ≥, greater than or equal to; Chl, fluorescence at wavelength of 650 to 700 nanometers, in μg/L as chlorophyll; <, less than]
Date Julian date sin cos Microcystin
(μg/L) Microcystin
binary (≥ 0.1 μg/L)
Chl (μg/L) Computed probability
Correct classification
01/15/2013 015 0.262 0.965 <0.1 0 8.1 0.2724 Yes
01/23/2013 023 0.392 0.920 <0.1 0 9 0.2525 Yes
02/12/2013 043 0.679 0.734 <0.1 0 18.2 0.2274 Yes
03/19/2013 078 0.976 0.220 0.1 1 29.1 0.2413 No
04/09/2013 099 0.990 –0.139 <0.1 0 24.1 0.2798 Yes
05/07/2013 127 0.813 –0.583 <0.1 0 3.1 0.3634 Yes
06/06/2013 157 0.419 –0.908 <0.1 0 6.7 0.5218 Yes
07/08/2013 189 –0.119 –0.993 3 1 9 0.6731 Yes
07/23/2013 204 –0.368 –0.930 0.89 1 4.6 0.7156 Yes
08/06/2013 218 –0.579 –0.815 7.3 1 4.5 0.7445 Yes
08/19/2013 231 –0.746 –0.666 1.1 1 6 0.7602 Yes
09/09/2013 252 –0.933 –0.359 0.43 1 16.1 0.7676 Yes
09/25/2013 268 –0.996 –0.092 0.47 1 9.2 0.7412 Yes
10/21/2013 294 –0.937 0.348 0.3 1 8.2 0.6668 Yes
10/28/2013 301 –0.888 0.459 0.23 1 8.6 0.6388 Yes
11/06/2013 310 –0.808 0.590 0.14 1 9.9 0.5998 Yes
11/13/2013 318 –0.729 0.685 0.13 1 8.4 0.5624 Yes
11/18/2013 322 –0.669 0.743 0.12 1 8.4 0.5373 No
12/12/2013 346 –0.314 0.949 <0.1 0 7.2 0.4092 Yes
01/15/2014 015 0.262 0.965 0.11 1 7.2 0.2716 No
02/19/2014 050 0.763 0.646 0.11 1 9.5 0.2152 No
03/19/2014 078 0.976 0.220 0.18 1 45.2 0.2551 No
04/16/2014 106 0.966 –0.257 0.19 1 7.7 0.2855 No
05/20/2014 140 0.663 –0.748 0.13 1 10.03 0.4351 No
06/25/2014 176 0.105 –0.995 0.41 1 10.3 0.6209 Yes
07/10/2014 191 –0.153 –0.988 0.27 1 7.3 0.6786 Yes
07/22/2014 203 –0.352 –0.936 0.45 1 9.8 0.7180 Yes
08/05/2014 217 –0.565 –0.825 0.37 1 8.1 0.7461 Yes
09/16/2014 259 –0.970 –0.245 0.43 1 11 0.7565 Yes
10/28/2014 301 –0.889 0.458 0.19 1 6.9 0.6372 Yes
11/20/2014 324 –0.643 0.766 0.2 1 11.5 0.5303 No

36 Occurrence of Cyanobacteria, Microcystin, and Taste-and-Odor Compounds in Cheney Reservoir, Kansas, 2001–16
Date Julian date sin cos Microcystin
(μg/L) Microcystin
binary (≥ 0.1 μg/L)
Chl (μg/L) Computed probability
Correct classification
12/16/2014 350 –0.255 0.967 <0.1 0 7.5 0.3918 Yes
01/13/2015 013 0.222 0.975 <0.1 0 12.4 0.2836 Yes
02/10/2015 041 0.649 0.761 0.12 1 17.2 0.2291 No
03/10/2015 069 0.928 0.374 <0.1 0 25.6 0.2292 Yes
04/15/2015 105 0.972 –0.234 <0.1 0 4.54 0.2782 Yes
05/06/2015 126 0.826 –0.563 <0.1 0 2.44 0.3564 Yes
06/09/2015 160 0.378 –0.926 0.19 1 1.57 0.5298 No
07/07/2015 188 –0.095 –0.996 0.4 1 7.16 0.6659 Yes
08/04/2015 216 –0.545 –0.838 <0.1 0 11.6 0.7468 No
09/08/2015 251 –0.924 –0.382 0.13 1 13.7 0.7666 Yes
11/09/2015 313 –0.780 0.625 <0.1 0 9.46 0.5866 No
02/17/2016 048 0.735 0.678 <0.1 0 6.83 0.2146 Yes
05/17/2016 138 0.693 –0.721 <0.1 0 3.57 0.4156 Yes
06/15/2016 167 0.264 –0.965 0.63 1 16 0.5821 Yes

Appendix 2 37
References Cited
Helsel, D.R., and Hirsch, R.M., 2002, Statistical methods in water resources—Hydrologic analysis and
interpretation: U.S. Geological Survey Techniques of Water-Resources Investigations, book 4, chap. A3, 522 p.
[Also available at https://pubs.usgs.gov/twri/twri4a3/.]
Systat Software, Inc., 2008, SigmaPlot® 11.0 statistics user’s guide: Systat Software, Inc., 564 p.
U.S. Geological Survey, variously dated, National field manual for the collection of water-quality data: U.S.
Geological Survey Techniques of Water-Resources Investigations, book 9, chaps. A1–A10, accessed September
2016 at https://pubs.water.usgs.gov/twri9A.

38 Occurrence of Cyanobacteria, Microcystin, and Taste-and-Odor Compounds in Cheney Reservoir, Kansas, 2001–16
Appendix 3. 16-Year Logistic Regression Model Archival Summary for Geosmin Occurrence at Station 07144790, 2001–16 This model archival summary summarizes the logistic model for the probability of geosmin occurrence developed to compute hourly geosmin from April 1, 2001, onward.
Station and Model Information
Station number: 07144790 Station name: Cheney Re Nr Cheney, KS Station location: Latitude 37°43'34", Longitude 97°47'38" referenced to the North American Datum of 1927, in SE¼NE¼NW¼ sec. 6, T. 27 S., R. 04 W., Sedgwick County, Kansas, Hydrologic Unit 11030014.
Equipment: From April 2001 through September 2014, a YSI 6600 water-quality monitor was installed and equipped with sensors for water temperature, specific conductance, dissolved oxygen (YSI Clark cell [from April 2001 through January 2007] or YSI model 6150 optical [from February 2007 through September 2014]), pH, turbidity (YSI model 6026 [from April 2001 through September 2006] or YSI 6136 [from October 2006 through September 2014]), and chlorophyll fluorescence (YSI model 6025 sensor). From October 2014 to the present (December 2016), a Xylem YSI EXO2 water-quality monitor has been used and is equipped with sensors for water temperature, specific conductance, dissolved oxygen, pH, turbidity, and chlorophyll. The Xylem monitor is housed in a 4-inch diameter galvanized steel pipe. Readings from the water-quality monitor are recorded hourly and data are transmitted hourly by satellite.
Date model was created: August 16, 2016
Model calibration data period: May 3, 2001, through June 15, 2016
Model application date: August 2016 onward
Model-Calibration Dataset
All data were collected using U.S. Geological Survey (USGS) protocols (U.S. Geological Survey, variously dated; https://water.usgs.gov/owq/FieldManual/) and are stored in the National Water Information System database (https://doi.org/10.5066/F7P55KJN). Logistic model equations were developed using the multiple logistic regression routine in SigmaPlot® version 11.0 (Systat Software, Inc., 2008). Explanatory variables were evaluated individually and in selected combinations. Explanatory variables selected as inputs to logistic regression were physicochemical properties: specific conductance, pH, water temperature, dissolved oxygen, chlorophyll fluorescence, and elevation of the reservoir surface. Seasonal components (sine and cosine variables) also were evaluated as explanatory variables in the models to determine if seasonal changes affected the model. All combinations of physicochemical properties and a seasonal component were evaluated to determine which combinations produced the best models.
The final selected logistic regression model is based on 230 concurrent measurements of geosmin occurrence collected from May 3, 2001, through June 15, 2016, and models the probability of the presence or absence of geosmin. Samples were collected throughout the range of continuously observed hydrologic conditions. In total, 111 samples were below the threshold for positive classification (5 nanograms per liter [ng/L]). Summary statistics and the complete model-calibration dataset are provided below. Studentized residuals were inspected for values outside the 95-percent confidence interval, and leverage values for independent variables were inspected for values greater than 2. Values outside of the specified ranges were considered potential outliers and were investigated. No outliers were identified in the model-calibration dataset.

Appendix 3 39
Geosmin Sampling Details
Monthly to biweekly discrete water-quality samples were collected during May 2001 through July 2004 near the surface using a Teflon Kemmerer bottle or a weighted bottle sampler with a 1-liter Teflon bottle following USGS methods; these samples were not depth integrated. Starting in August 2004 discrete water-quality samples were collected as integrated photic-zone (depth at which light is about 1 percent of that at the surface) samples using a double check-valve bailer; these samples were depth integrated. Water-quality results collected before and after the sampling procedure change in summer 2004 were similar. Geosmin was analyzed using solid phase microextraction gas chromatography/mass spectrometry. Throughout the course of the study, Montgomery Watson Laboratories, Pasadena, California (2001–2003), the USGS Organic Geochemistry Research Laboratory, Lawrence, Kans. (2003–2007), and Engineering Performance Solutions, LLC, Gainesville, Florida (2007–14) provided analyses for geosmin and 2-methylisoborneol. Each time laboratories were changed, an among-laboratory comparison was completed before the change was made to verify comparability of results.
Model Development
Logistic regression analysis was done using SigmaPlot by examining seasonality and other continuously measured data as explanatory variables for estimating geosmin occurrence. Seasonality was selected as the best predictor of geosmin based on a relatively low Pearson Chi-square Statistic, relatively high Likelihood Ratio Test Statistic, relatively low -2 Log Likelihood Statistic, relatively high Hosmer-Lemeshow Statistic, significant Wald Statistic, and relatively low Variance Inflation Factor. A model classification table with a threshold probability for positive classification (TPPC) of 0.5 also was used in final model selection. After the best model was selected, the TPPC for the model was adjusted based on the fraction of data classified as positive to make the model more conservative (more likely to overestimate a positive response) by guarding more strongly against false negatives. Values for all of the aforementioned statistics and metrics were computed for various models and are included below along with all relevant sample data and more in-depth statistical information.
Model Summary
Summary of final logistic regression analysis for geosmin occurrence at USGS station 07144790.
Probability of geosmin occurrence model:
( ) ( )logit( ( 0.774 0.0402 0.0745P TBY DO= . . + (3–1)
where
logit(P) is the logistic probability of geosmin occurrence (concentrations greater than or equal to 5 nanograms per liter);
TBY is turbidity, in formazin nephelometric units; and
DO is dissolved oxygen, in milligrams per liter.
TBY and DO make physical and statistical sense as explanatory variables for geosmin.
Previously Published Model
( )logit 2 2( ( 0.829 0.825sin 0.262cls 0.102
365 365D D
P TBYp pæ ö æ ö÷ ÷ç ç÷ ÷= + . .ç ç÷ ÷ç ç÷ ÷ç çè ø è ø
(3–2)
Model author: Stone and others (2013)
Model data period: May 2001 through December 2009

40 Occurrence of Cyanobacteria, Microcystin, and Taste-and-Odor Compounds in Cheney Reservoir, Kansas, 2001–16
Probability of Geosmin Occurrence Record
The geosmin occurrence record is computed using this regression model, and the complete water-quality record is stored at the National Real-Time Water Quality website: https://nrtwq.usgs.gov/ks. Data are computed at 60-minute intervals.

Appendix 3 41
SigmaPlot® Output for Geosmin at Station 07144790
16-Year Model Form
( ) ( )logit( ( 0.774 0.0402 0.0745P TBY DO= . . ´ + ´ (3–3)
Variable Summary Statistics
[μg/L, microgram per liter; DO, dissolved oxygen; mg/L, milligram per liter; TBY, turbidity; FNU, formazin nephelometric units; <, less than; --, not measured]
Summary statistic
Geosmin (μg/L)
Geosmin binary
DO (mg/L)
TBY (FNU)
Minimum <1 0 4 1 1st quartile <2 0 6.9 11 Median 2.0 0 9 17 Mean -- 0 9 20 3d quartile 5.8 1 12 26 Maximum 54 1 17 73
Model Calibration Using Multiple Logistic Regression See the 16-year model form in equation 3–3 above. Number of samples=230 Estimation criterion: Maximum likelihood Dependent variable: Geosmin plus or minus (±) Positive response=1 Reference response=0 Number of unique independent variable combinations=226 Pearson Chi-square Statistic=230.504 (probability value [p-value]=0.404) Likelihood Ratio Test Statistic=15.609 (p-value=less than 0.001) -2*Log(Likelihood)=268.696 Hosmer-Lemeshow Statistic=6.577 (p-value=0.583) TPPC=0.41
Classification table Predicted reference responses
Predicted positive responses
Total actual responses
Percent correctly classified responses
Actual reference responses 137 22 159 86 Actual positive responses 46 25 71 35 Total 183 47 230 70

42 ROccurrence of Cyanobacteria, Microcystin, and Taste-and-Odor Compounds in Cheney Reservoir, Kansas, 2001–16
Details of the Logistic Regression Equation: [p-value, probability value; VIF, Variance Inflation Factor; --, not measured; TBY, turbidity; DO, dissolved oxygen]
Independent variable Coefficient Standard error Wald statistic p-value VIF Constant –0.774 0.700 1.222 0.269 -- TBY –0.0402 0.0160 6.268 0.012 1.182 DO 0.0745 0.0537 1.926 0.165 1.182
Independent variable Odds ratio Lower 5-percent confidence interval
Upper 95-percent confidence interval
Constant 0.461 0.117 1.820 TBY 0.961 0.931 0.991 DO 1.077 0.970 1.197
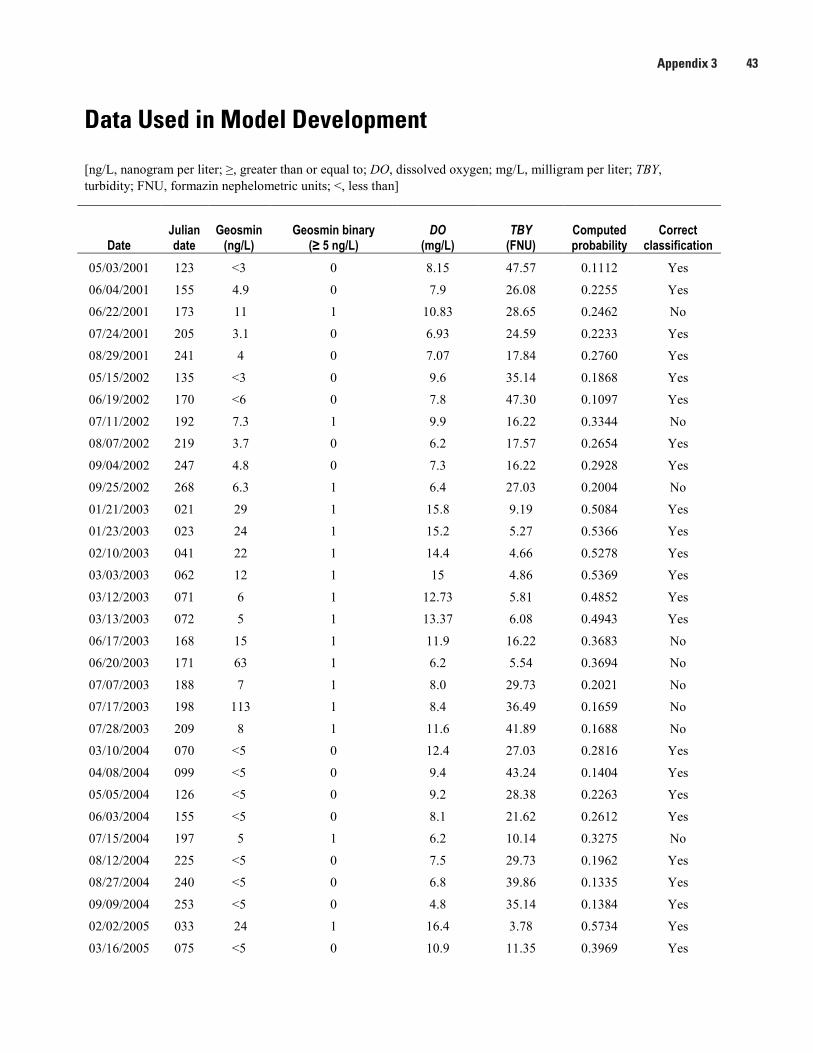
Appendix 3 43
Data Used in Model Development
[ng/L, nanogram per liter; ≥, greater than or equal to; DO, dissolved oxygen; mg/L, milligram per liter; TBY, turbidity; FNU, formazin nephelometric units; <, less than]
Date Julian date
Geosmin (ng/L)
Geosmin binary (≥ 5 ng/L)
DO (mg/L)
TBY (FNU)
Computed probability
Correct classification
05/03/2001 123 <3 0 8.15 47.57 0.1112 Yes
06/04/2001 155 4.9 0 7.9 26.08 0.2255 Yes
06/22/2001 173 11 1 10.83 28.65 0.2462 No
07/24/2001 205 3.1 0 6.93 24.59 0.2233 Yes
08/29/2001 241 4 0 7.07 17.84 0.2760 Yes
05/15/2002 135 <3 0 9.6 35.14 0.1868 Yes
06/19/2002 170 <6 0 7.8 47.30 0.1097 Yes
07/11/2002 192 7.3 1 9.9 16.22 0.3344 No
08/07/2002 219 3.7 0 6.2 17.57 0.2654 Yes
09/04/2002 247 4.8 0 7.3 16.22 0.2928 Yes
09/25/2002 268 6.3 1 6.4 27.03 0.2004 No
01/21/2003 021 29 1 15.8 9.19 0.5084 Yes
01/23/2003 023 24 1 15.2 5.27 0.5366 Yes
02/10/2003 041 22 1 14.4 4.66 0.5278 Yes
03/03/2003 062 12 1 15 4.86 0.5369 Yes
03/12/2003 071 6 1 12.73 5.81 0.4852 Yes
03/13/2003 072 5 1 13.37 6.08 0.4943 Yes
06/17/2003 168 15 1 11.9 16.22 0.3683 No
06/20/2003 171 63 1 6.2 5.54 0.3694 No
07/07/2003 188 7 1 8.0 29.73 0.2021 No
07/17/2003 198 113 1 8.4 36.49 0.1659 No
07/28/2003 209 8 1 11.6 41.89 0.1688 No
03/10/2004 070 <5 0 12.4 27.03 0.2816 Yes
04/08/2004 099 <5 0 9.4 43.24 0.1404 Yes
05/05/2004 126 <5 0 9.2 28.38 0.2263 Yes
06/03/2004 155 <5 0 8.1 21.62 0.2612 Yes
07/15/2004 197 5 1 6.2 10.14 0.3275 No
08/12/2004 225 <5 0 7.5 29.73 0.1962 Yes
08/27/2004 240 <5 0 6.8 39.86 0.1335 Yes
09/09/2004 253 <5 0 4.8 35.14 0.1384 Yes
02/02/2005 033 24 1 16.4 3.78 0.5734 Yes
03/16/2005 075 <5 0 10.9 11.35 0.3969 Yes

44 Occurrence of Cyanobacteria, Microcystin, and Taste-and-Odor Compounds in Cheney Reservoir, Kansas, 2001–16
Date Julian date
Geosmin (ng/L)
Geosmin binary (≥ 5 ng/L)
DO (mg/L)
TBY (FNU)
Computed probability
Correct classification
04/13/2005 103 <5 0 10.3 25.68 0.2614 Yes
05/04/2005 124 <5 0 9.7 27.03 0.2427 Yes
05/16/2005 136 <5 0 9.6 7.00 0.4158 No
06/01/2005 152 <5 0 7.21 10.95 0.3369 Yes
06/15/2005 166 43 1 8.2 21.62 0.2626 No
06/29/2005 180 <5 0 6.8 16.00 0.2869 Yes
07/13/2005 194 43 1 9.9 11.01 0.3825 No
07/27/2005 208 64 1 6.4 14.02 0.2972 No
08/10/2005 222 <5 0 6.9 10.00 0.3403 Yes
08/30/2005 242 <5 0 7.9 11 0.3480 Yes
09/07/2005 250 <5 0 6.7 12 0.3192 Yes
10/13/2005 286 <5 0 9.1 14.00 0.3410 Yes
10/27/2005 300 <5 0 8.5 31.08 0.1994 Yes
01/11/2006 011 <5 0 13.8 10.68 0.4563 No
03/01/2006 060 5 1 14.9 2.60 0.5576 Yes
03/29/2006 088 <5 0 12.7 6.40 0.4788 No
04/25/2006 115 <5 0 8.5 23.00 0.2563 Yes
05/17/2006 137 <5 0 10.5 14.01 0.3647 Yes
05/31/2006 151 <5 0 9.5 10 0.3850 Yes
06/14/2006 165 <5 0 6.4 32.43 0.1678 Yes
06/28/2006 179 <5 0 8.4 13.00 0.3383 Yes
07/13/2006 194 <5 0 6.6 22.97 0.2304 Yes
07/26/2006 207 <5 0 7.2 20.27 0.2588 Yes
08/10/2006 222 <5 0 8.4 12.00 0.3474 Yes
08/22/2006 234 <5 0 4.2 27.03 0.1754 Yes
09/06/2006 249 5 1 10.6 14.01 0.3665 No
09/20/2006 263 <5 0 7.6 21.00 0.2588 Yes
09/26/2006 269 <5 0 9.85 11.00 0.3817 Yes
09/28/2006 271 <5 0 8.9 16.00 0.3199 Yes
09/29/2006 272 <5 0 8.9 18.00 0.3027 Yes
10/11/2006 284 <5 0 8.1 21.00 0.2661 Yes
10/25/2006 298 5 1 9 24.00 0.2557 No
12/12/2006 346 <5 0 13.2 6.90 0.4830 No
02/07/2007 038 32 1 13.6 3.5 0.5246 Yes
03/07/2007 066 20 1 12.4 8.20 0.4552 Yes
04/09/2007 099 <5 0 10.3 14.00 0.3614 Yes
05/08/2007 128 <5 0 7.3 9.10 0.3553 Yes

Appendix 3 45
Date Julian date
Geosmin (ng/L)
Geosmin binary (≥ 5 ng/L)
DO (mg/L)
TBY (FNU)
Computed probability
Correct classification
05/31/2007 151 <5 0 6.8 33.78 0.1644 Yes
06/13/2007 164 <5 0 6.1 31.00 0.1728 Yes
06/25/2007 176 <2 0 6.21 20.00 0.2468 Yes
07/09/2007 190 <2 0 6.02 21 0.2369 Yes
07/23/2007 204 <2 0 6 16.00 0.2748 Yes
08/07/2007 219 2.4 0 5.6 19.00 0.2459 Yes
08/15/2007 227 <2 0 6.9 15.00 0.2967 Yes
08/28/2007 240 <2 0 6.5 21.00 0.2434 Yes
09/12/2007 255 <5 0 7.3 10.00 0.3470 Yes
09/24/2007 267 2.2 0 7.5 25.68 0.2231 Yes
10/15/2007 288 <2 0 7.9 21.00 0.2632 Yes
10/29/2007 302 <2 0 8.9 20.00 0.2860 Yes
11/13/2007 317 <2 0 9.7 18.00 0.3154 Yes
12/19/2007 353 <2 0 12.5 5.00 0.4891 No
02/11/2008 042 5.8 1 13.6 1.40 0.5457 Yes
02/14/2008 045 5.2 1 13.6 0.89 0.5507 Yes
02/15/2008 046 <2 0 13.30 4.57 0.5082 No
03/10/2008 070 8.3 1 13.40 6.39 0.4918 Yes
04/01/2008 092 10.6 1 11.3 12.00 0.3978 No
04/16/2008 107 13.9 1 10.5 16.00 0.3464 No
04/29/2008 120 <2 0 8.6 33.00 0.1885 Yes
05/13/2008 134 <2 0 8.8 25.00 0.2454 Yes
06/03/2008 155 <2 0 6.7 18.00 0.2692 Yes
06/18/2008 170 <2 0 6.1 22.00 0.2308 Yes
06/25/2008 177 6.1 1 7 12.00 0.3241 No
07/07/2008 189 4.3 0 6.9 19.00 0.2643 Yes
07/21/2008 203 <2 0 7.5 35.14 0.1641 Yes
07/28/2008 210 <2 0 6.4 15.00 0.2890 Yes
08/04/2008 217 <2 0 5.7 13.00 0.2948 Yes
08/18/2008 231 <2 0 5.5 9.70 0.3199 Yes
09/02/2008 246 5 1 7.7 9.20 0.3612 No
09/17/2008 261 <2 0 8.1 11.00 0.3514 Yes
10/01/2008 275 2.8 0 8.5 6.40 0.4018 Yes
10/15/2008 289 <2 0 8.5 17.00 0.3049 Yes
11/04/2008 309 <2 0 9.4 17.00 0.3193 Yes
12/02/2008 337 <2 0 11.6 10.00 0.4227 No
01/06/2009 006 2.7 0 13.2 7.3 0.4790 No

46 Occurrence of Cyanobacteria, Microcystin, and Taste-and-Odor Compounds in Cheney Reservoir, Kansas, 2001–16
Date Julian date
Geosmin (ng/L)
Geosmin binary (≥ 5 ng/L)
DO (mg/L)
TBY (FNU)
Computed probability
Correct classification
01/20/2009 020 <2 0 15.2 8.5 0.5042 No
02/02/2009 033 <2 0 15.2 6.9 0.5202 No
02/18/2009 049 9.7 1 12 9.57 0.4342 Yes
02/25/2009 056 8 1 12 8.40 0.4458 Yes
03/03/2009 062 17 1 12.3 6.80 0.4673 Yes
03/09/2009 068 11.6 1 12 6.70 0.4627 Yes
03/12/2009 071 11.4 1 11.7 11.00 0.4147 Yes
03/16/2009 075 8.6 1 11.7 8.30 0.4413 Yes
03/25/2009 084 8.5 1 10.1 18.00 0.3219 No
04/08/2009 098 4.3 0 11.1 16.00 0.3566 Yes
04/29/2009 119 <2 0 8.1 19.00 0.2820 Yes
05/27/2009 147 <2 0 8 30.00 0.2004 Yes
06/09/2009 160 6.2 1 6.4 33.78 0.1604 No
06/23/2009 174 4.7 0 8.7 18 0.2995 Yes
07/07/2009 188 14.3 1 5 9.8 0.3110 No
07/21/2009 202 4.6 0 5.3 19 0.2418 Yes
08/05/2009 217 <2 0 6.1 17 0.2684 Yes
08/24/2009 236 <2 0 6.2 14 0.2942 Yes
09/02/2009 245 <2 0 6.7 14 0.3020 Yes
09/16/2009 259 <2 0 6.5 15 0.2905 Yes
10/15/2009 288 <2 0 9.2 13 0.3518 Yes
10/19/2009 292 <2 0 9.5 18 0.3122 Yes
11/23/2009 327 <2 0 9.9 14 0.3545 Yes
12/16/2009 350 <2 0 12.6 12 0.4212 No
01/12/2010 012 <2 0 16.6 6.7 0.5482 No
02/10/2010 041 3.1 0 16.8 8.0 0.5389 No
02/17/2010 048 3.8 0 16.7 9.9 0.5180 No
02/24/2010 055 5.2 1 16.4 12.0 0.4914 Yes
03/03/2010 062 4.8 0 16.3 12 0.4895 No
03/10/2010 069 5.8 1 13.4 17 0.3872 No
03/22/2010 081 <2 0 11.1 16 0.3566 Yes
04/12/2010 102 5.9 1 8.8 12 0.3542 No
05/18/2010 138 <2 0 7.7 25 0.2305 Yes
06/17/2010 168 3.5 0 6.9 18 0.2722 Yes
06/30/2010 181 3.5 0 5.5 22 0.2229 Yes
07/14/2010 195 <2 0 4 28 0.1678 Yes
07/29/2010 210 <2 0 5.4 29 0.1769 Yes

Appendix 3 47
Date Julian date
Geosmin (ng/L)
Geosmin binary (≥ 5 ng/L)
DO (mg/L)
TBY (FNU)
Computed probability
Correct classification
08/12/2010 224 <2 0 5.7 29 0.1802 Yes
08/26/2010 238 <2 0 6.4 35 0.1539 Yes
09/08/2010 251 <2 0 6.8 42 0.1239 Yes
09/22/2010 265 <2 0 7.1 46 0.1097 Yes
10/04/2010 277 <2 0 7.1 65 0.0543 Yes
10/18/2010 291 <2 0 7.8 50 0.0995 Yes
11/15/2010 319 4.6 0 9.9 54 0.0991 Yes
12/06/2010 340 <2 0 11.8 49 0.1342 Yes
01/18/2011 018 <2 0 13.6 34 0.2446 Yes
02/14/2011 045 <2 0 13.5 25 0.3158 Yes
03/14/2011 073 4.7 0 12.3 21 0.3314 Yes
04/11/2011 101 3.9 0 9.5 66 0.0618 Yes
05/11/2011 131 <2 0 8.6 42 0.1392 Yes
06/13/2011 164 <2 0 7.2 52 0.0888 Yes
07/11/2011 192 <2 0 7 44 0.1170 Yes
08/01/2011 213 <2 0 8.2 21 0.2675 Yes
08/08/2011 220 3.2 0 6.6 38 0.1407 Yes
08/15/2011 227 5.6 1 5.3 30 0.1701 No
08/25/2011 237 9.6 1 5.7 34 0.1524 No
08/30/2011 242 5.1 1 5.4 34 0.1495 No
09/06/2011 249 9 1 6.9 40 0.1338 No
09/20/2011 263 3.7 0 8 34 0.1758 Yes
10/04/2011 277 3.2 0 7.4 31 0.1871 Yes
11/01/2011 305 2.2 0 9.4 33 0.1978 Yes
12/12/2011 346 <2 0 12.6 25 0.3015 Yes
01/18/2012 018 <2 0 13.1 26 0.3009 Yes
02/14/2012 045 <2 0 12.7 16 0.3844 Yes
03/12/2012 072 <2 0 12.2 16 0.3756 Yes
04/16/2012 107 <2 0 8.9 73 0.0454 Yes
05/16/2012 137 <2 0 7.9 25 0.2332 Yes
06/11/2012 163 3.5 0 7.4 28 0.2061 Yes
06/27/2012 179 <2 0 7 27 0.2079 Yes
07/09/2012 191 2.9 0 7.6 26 0.2222 Yes
07/31/2012 213 <2 0 5.5 17 0.2597 Yes
08/21/2012 234 2.1 0 6.5 26 0.2083 Yes
09/19/2012 263 3.4 0 8.3 23 0.2535 Yes
10/16/2012 290 4.2 0 9.1 22 0.2728 Yes

48 Occurrence of Cyanobacteria, Microcystin, and Taste-and-Odor Compounds in Cheney Reservoir, Kansas, 2001–16
Date Julian date
Geosmin (ng/L)
Geosmin binary (≥ 5 ng/L)
DO (mg/L)
TBY (FNU)
Computed probability
Correct classification
11/13/2012 318 1.3 0 10.2 24 0.2731 Yes
12/11/2012 346 <1 0 11.6 30 0.2468 Yes
01/15/2013 015 2.8 0 14.1 5.1 0.5179 No
01/23/2013 023 <1 0 13.9 5.1 0.5141 No
02/12/2013 043 2.3 0 12.7 7.6 0.4667 No
03/19/2013 078 2.1 0 12.1 16 0.3738 Yes
04/09/2013 099 <1 0 10.4 24 0.2761 Yes
05/07/2013 127 1.7 0 9.8 14 0.3528 Yes
06/06/2013 157 <1 0 7.2 31 0.1849 Yes
07/08/2013 189 12.5 1 7.2 35 0.1618 No
07/23/2013 204 4.5 0 6.1 28 0.1907 Yes
08/06/2013 218 17.5 1 7.1 20 0.2594 No
08/19/2013 231 3.9 0 5.5 17 0.2597 Yes
09/06/2013 250 11.1 1 5.5 13 0.2918 No
09/09/2013 252 12.6 1 5.7 12 0.3033 No
09/12/2013 255 7.6 1 5.4 20 0.2358 No
09/25/2013 268 50 1 7.4 26 0.2196 No
09/30/2013 273 33.7 1 7.1 24 0.2297 No
10/21/2013 294 54.1 1 9.2 23 0.2664 No
10/28/2013 301 33.8 1 9.3 25 0.2523 No
11/06/2013 310 27.9 1 10 27 0.2471 No
11/13/2013 318 18.1 1 10.3 26 0.2589 No
11/18/2013 322 16.5 1 10.7 24 0.2806 No
12/12/2013 346 5.8 1 13.2 17 0.3837 No
01/15/2014 015 2.8 0 13.2 11 0.4421 No
02/19/2014 050 2.5 0 13.7 8.5 0.4763 No
03/19/2014 078 1.9 0 13 15 0.3993 Yes
04/16/2014 106 2.1 0 9.7 9.5 0.3934 Yes
05/20/2014 140 <1 0 8.55 18.5 0.2930 Yes
06/25/2014 176 22.2 1 6.4 11 0.3231 No
07/10/2014 191 4.3 0 5 18 0.2451 Yes
07/22/2014 203 16.6 1 6.7 18 0.2692 No
08/05/2014 217 4.3 0 6.2 14 0.2942 Yes
09/16/2014 259 11.8 1 7.8 14 0.3196 No
10/28/2014 301 5 1 8.5 15 0.3222 No
11/20/2014 324 13.1 1 12.3 6.4 0.4713 Yes
12/16/2014 350 11.1 1 11.9 18 0.3518 No

Appendix 3 49
Date Julian date
Geosmin (ng/L)
Geosmin binary (≥ 5 ng/L)
DO (mg/L)
TBY (FNU)
Computed probability
Correct classification
01/13/2015 013 7.6 1 14.6 4.4 0.5342 Yes
02/10/2015 041 5 1 13.7 2.4 0.5375 Yes
03/10/2015 069 2.7 0 13.6 1.5 0.5446 No
04/15/2015 105 <1 0 8.3 22 0.2611 Yes
05/06/2015 126 <1 0 8.2 9.5 0.3670 Yes
06/09/2015 160 8.4 1 10.2 4.2 0.4544 Yes
07/07/2015 188 3.4 0 6.2 9.8 0.3305 Yes
08/04/2015 216 4.2 0 6.4 7.4 0.3556 Yes
09/08/2015 251 8.1 1 7.5 15 0.3061 No
11/09/2015 313 2.7 0 9 19 0.2958 Yes
02/17/2016 048 1.3 0 12.9 12 0.4267 No
05/17/2016 138 <1 0 8.5 11 0.3583 Yes
06/15/2016 167 13.7 1 11.8 6.2 0.4640 Yes

50 Occurrence of Cyanobacteria, Microcystin, and Taste-and-Odor Compounds in Cheney Reservoir, Kansas, 2001–16
References Cited
Systat Software, Inc., 2008, SigmaPlot® 11.0 statistics user’s guide: Systat Software, Inc., 564 p.
U.S. Geological Survey, variously dated, National field manual for the collection of water-quality data: U.S.
Geological Survey Techniques of Water-Resources Investigations, book 9, chaps. A1–A10, accessed September
2016 at https://pubs.water.usgs.gov/twri9A.

Appendix 4 51
Appendix 4. 4-Year Logistic Regression Model Archival Summary for Geosmin Occurrence at Station 07144790, 2013–16 This model archival summary summarizes the logistic model for the probability of geosmin occurrence developed to compute hourly geosmin from January 1, 2013, onward.
Station and Model Information
Station number: 07144790 Station name: Cheney Re Nr Cheney, KS Station location: Latitude 37°43'34", Longitude 97°47'38" referenced to the North American Datum of 1927, in SE¼NE¼NW¼ sec. 6, T. 27 S., R. 04 W., Sedgwick County, Kansas, Hydrologic Unit 11030014.
Equipment: From April 2001 through September 2014, a YSI 6600 water-quality monitor was installed equipped with sensors for water temperature, specific conductance, dissolved oxygen (YSI Clark cell [from April 2001 through January 2007] or YSI model 6150 optical [from February 2007 through September 2014]), pH, turbidity (YSI model 6026 [from April 2001 through September 2006] or YSI 6136 [from October 2006 through September 2014]), and chlorophyll. From October 2014 to the present (December 2016), a Xylem YSI EXO2 water-quality monitor has been used and is equipped with sensors for water temperature, specific conductance, dissolved oxygen, pH, turbidity, and chlorophyll fluorescence (YSI model 6025 sensor). The Xylem monitor is housed in a 4-inch diameter galvanized steel pipe. Readings from the water-quality monitor are recorded hourly and data are transmitted hourly by satellite.
Date model was created: August 16, 2016
Model calibration data period: January 15, 2013, through June 15, 2016
Model application date: August 2016 onward
Model-Calibration Dataset
All data were collected using U.S. Geological Survey (USGS) protocols (U.S. Geological Survey, variously dated; https://water.usgs.gov/owq/FieldManual/) and are stored in the National Water Information System database (https://doi.org/10.5066/F7P55KJN). Logistic model equations were developed using the multiple logistic regression routine in SigmaPlot® version 11.0 (Systat Software, Inc., 2008). Explanatory variables were evaluated individually and in selected combinations. Explanatory variables selected as inputs to logistic regression were physicochemical properties: specific conductance, pH, water temperature, dissolved oxygen, chlorophyll fluorescence, and elevation of the reservoir surface. Seasonal components (sine and cosine variables) also were evaluated as explanatory variables in the models to determine if seasonal changes affected the model. All combinations of physicochemical properties and a seasonal component were evaluated to determine which combinations produced the best models.
The final selected logistic regression model is based on 48 concurrent measurements of geosmin occurrence collected from January 15, 2013, through June 15, 2016, and models the probability of the presence or absence of geosmin. Samples were collected throughout the range of continuously observed hydrologic conditions. In total, seven samples were below the threshold for positive classification (5 nanograms per liter [ng/L]). Summary statistics and the complete model-calibration dataset are provided below. Studentized residuals were inspected for values outside the 95-percent confidence interval, and leverage values for independent variables were inspected for values greater than 2. Values outside of the specified ranges were considered potential outliers and were investigated. No outliers were identified in the model-calibration dataset.

52 Occurrence of Cyanobacteria, Microcystin, and Taste-and-Odor Compounds in Cheney Reservoir, Kansas, 2001–16
Geosmin Sampling Details
Discrete water-quality samples were collected monthly to biweekly during January 2013 through June 2016. Samples were collected as integrated photic-zone (depth at which light is about 1 percent of that at the surface) samples using a double check-valve bailer; these samples were depth integrated. Geosmin was analyzed using solid phase microextraction gas chromatography/mass spectrometry by Engineering Performance Solutions, LLC, Gainesville, Florida.
Model Development
Logistic regression analysis was done using SigmaPlot by examining seasonality and other continuously measured data as explanatory variables for estimating geosmin presence. Seasonality was selected as the best predictor of geosmin based on a relatively low Pearson Chi-square Statistic, relatively high Likelihood Ratio Test Statistic, relatively low -2 Log Likelihood Statistic, relatively high Hosmer-Lemeshow Statistic, significant Wald Statistic, and relatively low Variance Inflation Factor. A model classification table with a threshold probability for positive classification (TPPC) of 0.5 also was used in final model selection. After the best model was selected, the TPPC for the model was adjusted based on the fraction of data classified as positive to make the model more conservative (more likely to overestimate a positive response) by guarding more strongly against false negatives. Values for all of the aforementioned statistics and metrics were computed for various models and are included below along with all relevant sample data and more in-depth statistical information.
Model Summary
Summary of final logistic regression analysis for geosmin occurrence at USGS station 07144790.
Probability of geosmin occurrence model:
( )logit 2 2( ( 34.118 3.279sin 0.393cls 3.995
365 365D D
P pHp pæ ö æ ö÷ ÷ç ç÷ ÷= . . + +ç ç÷ ÷ç ç÷ ÷ç çè ø è ø
(4–1)
where
logit(P) is the logistic probability of geosmin occurrence (concentrations greater than or equal to 5 nanograms per liter);
D is the Julian day of the year;
pH is pH, in standard units.
Seasonality (the information contained in the sine [sin] and cosine [cos] component of the equation; Helsel and Hirsch, 2002) and pH make physical and statistical sense as explanatory variables for geosmin.
Previously Published Model
( )logit 2 2( ( 0.829 0.825sin 0.262cls 0.102
365 365D D
P TBYp pæ ö æ ö÷ ÷ç ç÷ ÷= + . .ç ç÷ ÷ç ç÷ ÷ç çè ø è ø
(4–2)
Model author: Stone and others (2013)
Model data period: May 2001 through December 2009
Probability of Geosmin Occurrence Record
The geosmin record is computed using this regression model, and the complete water-quality record is stored at the National Real-Time Water Quality website: https://nrtwq.usgs.gov/ks. Data are computed at 60-minute intervals.

Appendix 4 53
SigmaPlot® Output for Geosmin at Station 07144790
4-Year Model Form
( )logit 2 2( ( 34.118 3.279sin 0.393cls 3.995
365 365D D
P pHp pæ ö æ ö÷ ÷ç ç÷ ÷= . . + +ç ç÷ ÷ç ç÷ ÷ç çè ø è ø
(4–3)
Variable Summary Statistics
[μg/L, microgram per liter, pH, pH in standard units; <, less than; --, not measured]
Summary statistic
Geosmin (μg/L)
Geosmin binary pH
Minimum <1 0 8 1st quartile 2.2 0 8.3 Median 4.8 1 9 Mean -- 1 -- 3d quartile 13 1 9 Maximum 54 1 9
Model Calibration Using Multiple Logistic Regression See the model form in equation 4–3 above. Number of samples=48 Missing observations=182 Estimation criterion: Maximum likelihood Dependent variable: Geosmin (abbr) plus or minus (±) Positive response=1 Reference response=0 Number of unique independent variable combinations=48 Pearson Chi-square Statistic=48.980 (probability value [p-value]=0.246) Likelihood Ratio Test Statistic=26.395 (p-value=less than 0.001) -2*Log(Likelihood)=40.147 Hosmer-Lemeshow Statistic=9.352 (p-value=0.313) TPPC=0.5
Classification table Predicted reference responses
Predicted positive responses
Total actual responses
Percent correctly classified responses
Actual reference responses 19 5 24 79 Actual positive responses 3 21 24 88 Total 22 26 48 83

54 Occurrence of Cyanobacteria, Microcystin, and Taste-and-Odor Compounds in Cheney Reservoir, Kansas, 2001–16
Details of the logistic regression equation: [p-value, probability value; VIF, Variance Inflation Factor; --, not measured; sin, sine of the seasonality component; cos, cosine of the seasonality component; pH, pH in standard units; <, less than]
Independent variable Coefficient Standard error Wald statistic p-value VIF Constant –34.118 17.635 3.743 0.053 -- sin –3.279 0.943 12.079 <0.001 1.149 cos 0.393 0.513 0.587 0.444 1.029 pH 3.995 2.072 3.717 0.054 1.180
Independent variable Odds ratio Lower 5-percent confidence interval
Upper 95-percent confidence interval
Constant 1.523×10⁻¹⁵ 1.486×10⁻³⁰ 1.560 sin 0.0377 0.00593 0.239 cos 1.481 0.542 4.048 pH 54.303 0.936 3,151.114

Appendix 4 55
Data Used in Model Development
[sin, sine of the seasonality component; cos, cosine of the seasonality component; ng/L, nanogram per liter; ≥, greater than or equal to; pH, pH in standard units; <, less than]
Date Julian date sin sin
Geosmin (ng/L)
Geosmin binary
(≥ 5 ng/L) pH Computed probability
Correct classification
01/15/2013 015 0.262 0.965 2.8 0 8.6 0.5179 No
01/23/2013 023 0.392 0.920 <1 0 8.5 0.5141 No
02/12/2013 043 0.679 0.734 2.3 0 8.6 0.4667 Yes
03/19/2013 078 0.976 0.220 2.1 0 8.6 0.3738 Yes
04/09/2013 099 0.990 –0.139 <1 0 8.6 0.2761 Yes
05/07/2013 127 0.813 –0.583 1.7 0 8.5 0.3528 Yes
06/06/2013 157 0.419 –0.908 <1 0 8.4 0.1849 Yes
07/08/2013 189 –0.119 –0.993 12.5 1 8.6 0.1618 No
07/23/2013 204 –0.368 –0.930 4.5 0 8.5 0.1907 Yes
08/06/2013 218 –0.579 –0.815 17.5 1 8.5 0.2594 No
08/19/2013 231 –0.746 –0.666 3.9 0 8.2 0.2597 Yes
09/06/2013 250 –0.915 –0.404 11.1 1 8.2 0.2918 No
09/09/2013 252 –0.933 –0.359 12.6 1 8.3 0.3033 No
09/12/2013 255 –0.951 –0.310 7.6 1 7.8 0.2358 No
09/25/2013 268 –0.996 –0.092 50 1 7.9 0.2196 No
09/30/2013 273 –1.000 –0.006 33.7 1 8.3 0.2297 No
10/21/2013 294 –0.937 0.348 54.1 1 8.5 0.2664 No
10/28/2013 301 –0.888 0.459 33.8 1 8.45 0.2523 No
11/06/2013 310 –0.808 0.590 27.9 1 8.5 0.2471 No
11/13/2013 318 –0.729 0.685 18.1 1 8.5 0.2589 No
11/18/2013 322 –0.669 0.743 16.5 1 8.5 0.2806 No
12/12/2013 346 –0.314 0.949 5.8 1 8.4 0.3837 No
01/15/2014 015 0.262 0.965 2.8 0 8.4 0.4421 Yes
02/19/2014 050 0.763 0.646 2.5 0 8.3 0.4763 Yes
03/19/2014 078 0.976 0.220 1.9 0 9 0.3993 Yes
04/16/2014 106 0.966 –0.257 2.1 0 8.2 0.3934 Yes
05/20/2014 140 0.663 –0.748 <1 0 8.24 0.2930 Yes
06/25/2014 176 0.105 –0.995 22.2 1 8.6 0.3231 No
07/10/2014 191 –0.153 –0.988 4.3 0 8.3 0.2451 Yes
07/22/2014 203 –0.352 –0.936 16.6 1 8.4 0.2692 No
08/05/2014 217 –0.565 –0.825 4.3 0 8.2 0.2942 Yes
09/16/2014 259 –0.970 –0.245 11.8 1 8.6 0.3196 No

56 Occurrence of Cyanobacteria, Microcystin, and Taste-and-Odor Compounds in Cheney Reservoir, Kansas, 2001–16
10/28/2014 301 –0.889 0.458 5 1 8.2 0.3222 No
11/20/2014 324 –0.643 0.766 13.1 1 8.7 0.4713 No
12/16/2014 350 –0.255 0.967 11.1 1 8.5 0.3518 No
01/13/2015 013 0.222 0.975 7.6 1 8.7 0.5342 Yes
02/10/2015 041 0.649 0.761 5 1 8.6 0.5375 Yes
03/10/2015 069 0.928 0.374 2.7 0 8.6 0.5446 No
04/15/2015 105 0.972 –0.234 <1 0 8.3 0.2611 Yes
05/06/2015 126 0.826 –0.563 <1 0 8.4 0.3670 Yes
06/09/2015 160 0.378 –0.926 8.4 1 8.8 0.4544 No
07/07/2015 188 –0.095 –0.996 3.4 0 8.4 0.3305 Yes
08/04/2015 216 –0.545 –0.838 4.2 0 8.5 0.3556 Yes
09/08/2015 251 –0.924 –0.382 8.1 1 8.7 0.3061 No
11/09/2015 313 –0.780 0.625 2.7 0 8.6 0.2958 Yes
02/17/2016 048 0.735 0.678 1.3 0 8.9 0.4267 Yes
05/17/2016 138 0.693 –0.721 <1 0 8.6 0.3583 Yes
06/15/2016 167 0.264 –0.965 13.7 1 8.9 0.4640 No

Appendix 4 57
References Cited
Helsel, D.R., and Hirsch, R.M., 2002, Statistical methods in water resources—Hydrologic analysis and
interpretation: U.S. Geological Survey Techniques of Water-Resources Investigations, book 4, chap. A3, 522 p.
[Also available at https://pubs.usgs.gov/twri/twri4a3/.]
Systat Software, Inc., 2008, SigmaPlot® 11.0 statistics user’s guide: Systat Software, Inc., 564 p.
U.S. Geological Survey, variously dated, National field manual for the collection of water-quality data: U.S.
Geological Survey Techniques of Water-Resources Investigations, book 9, chaps. A1–A10, accessed September
2016 at https://pubs.water.usgs.gov/twri9A.

Publishing support provided by: Rolla Publishing Service Center
For additional information concerning this publication, contact: Director, USGS Kansas Water Science Center 4821 Quail Crest Place Lawrence, KS 66049 (785) 842–9909
Or visit the Kansas Water Science Center website at: https://ks.water.usgs.gov


Graham and others—
Occurrence of Cyanobacteria, M
icrocystin, and Taste-and-Odor Com
pounds in Cheney Reservoir, Kansas, 2001–16—SIR 2017–5016
ISSN 2328-0328 (online)https://doi.org/10.3133/sir20175016