Embed Size (px)
Citation preview

M A R Y L A N D
G O V E R N O R ’ S W O R K F O R C E I N V E S T M E N T B O A R D
OCCUPATIONAL SKILLS TRAINING IN M A R Y L A N D : A ST U D Y O F EARNINGS
TR E N D S
1 4 1 4 K E Y H I G H W A Y , 2 N D F L O O R •• B A L T I M O R E , M A R Y L A N D 2 1 2 3 0
t e l : 4 1 0 . 3 3 3 . 4 4 5 4 •• f a x : 4 1 0 . 3 3 3 . 4 4 6 7 •• t o l l f r e e : 1 8 6 6 . 4 0 8 . 5 4 8 7 w e b s i t e : w w w . m d w o r k f o r c e . c o m

3
OCCUPATIONAL SKILLS TRAINING IN MARYLAND: A STUDY OF EARNINGS TRENDS
Prepared for
Governor's Workforce Investment Board
1414 Key Highway, 2nd Floor Baltimore, MD 21230
410/333-4454
www.mdworkforce.com
Prepared by
Dr. David W. Stevens The Jacob France Institute Merrick School of Business
University of Baltimore, BC-368 1420 North Charles Street Baltimore, MD 21201-5779
410/837-4729
February 3, 2003
The author accepts sole responsibility for the content of this report. No attribution of agreement with this content should be made to any other person or organization, including the Board staff and other entity representatives who contributed to the design and conduct of this research.

ACKNOWLEDGMENTS
During the past year, many people participated in various aspects of the design, conduct and write-up of the findings described in these pages. Most remain anonymous, but are thanked for their individual roles in what amounted to a team activity akin to an Amish barn raising. An interagency workgroup joined with Board staff and the author to reach mutual agreement on the scope of the study. Management information system personnel and legal counsels joined in decisions about the permissible release of confidential administrative records. State and local research and evaluation colleagues helped to ensure accurate interpretation of the administrative records relied upon, and were instrumental in the preliminary analysis of these data. The Board’s Workforce Information Committee members reviewed a draft of this report, commented during a briefing, and had an opportunity to submit further comments. The Maryland Department of Labor, Licensing and Regulation authorized use of the longitudinal files of administrative records maintained by The Jacob France Institute at the University of Baltimore under a data sharing agreement between the Department and the University. The employment and earnings profiles that appear here could not have been developed without these data. The Maryland Department of Business and Economic Development and the Maryland Higher Education Commission also authorized release of data for this study. Gayle Fink, Project Coordinator for the Maryland Association of Community Colleges, and Director of Planning, Research and Evaluation for the Community College of Baltimore County, is acknowledged for leadership in the preparation of the community college profile information appearing in the Appendix. In addition, the scope and presentation of the findings reported here reflect her expert counsel. Patrick Cassidy, Deputy Director of the Governor’s Workforce Investment Board, provided Board leadership for this study throughout the past year. His policy analyst colleagues David Bosser and Jean Davis participated at various stages along the way. Finally, Institute colleagues John Janak, Stacey Lee and Sang Truong are thanked for exemplary data processing, table construction and design of charts help.

i
EXECUTIVE SUMMARY
Continuous investment in the creation and renewal of worker skills is essential if Maryland is to remain attractive to business owners and employees. This study, sponsored by the Governor's Workforce Investment Board, investigates two questions: 1. Do trainees completing occupational training in Maryland stay here to work?
If so, the return on investment remains in Maryland. Ø More than 75 percent of the trainees covered in this study were still
working in Maryland during the State fiscal year that ended in June 2002 2. After completing training, do these trainees have higher earnings than before
completion of the training? If so, this is one indicator that the Maryland economy benefits from the investment in training.
Ø During the first full year following completion of training, annual inflation-
adjusted earnings of the trainees who were working in Maryland had increased between 16 and 200 percent over annual earnings in a pre training year, depending upon the type of training investment made. Median annual inflation-adjusted earnings more than doubled for six out of the fourteen sub-populations of trainees studied.
These highlights are drawn from twelve-year Maryland employment and
earnings histories (July 1990-June 2002) that were prepared for 21,766 trainees completing one of the covered training programs between July 1994 and June 2000. The Maryland Department of Business and Economic Development (DBED), the Maryland Department of Labor, Licensing and Regulation (DLLR), and the Maryland Higher Education Commission (MHEC) provided the administrative records used in the study.
This study does not document: 1. The size of investment in each type of training. 2. The rate-of-return on these investments. 3. Trainee gender, age, race/ethnicity, child-care responsibilities, and other
relevant considerations, such as local economic conditions, that are known to affect some employment opportunities and earnings levels.

ii
The categories of training covered are:
• The Maryland Industrial Training Program (MITP), and Partnership for
Workforce Quality (PWQ), using State funds overseen by the Department of Business and Economic Development. The MITP and PWQ investments are in high volume, short-term and low cost training geared to specific employer needs. These demand-side investments do not easily fit into the occupational classifications that are appropriate for some of the other categories of training.
• Federally funded Job Training Partnership Act (JTPA) occupational training
completed between July 1994 and June 2000, overseen by the Department of Labor, Licensing and Regulation. JTPA training targeted economically disadvantaged adults and youth, and workers who lost jobs because of plant closings and other mass layoffs. The Workforce Investment Act of 1998 succeeded the JTPA in Maryland in July 2000. WIA activities are delivered through twelve local Workforce Investment Areas.
• Formal registered apprenticeship training in the Construction Trades,
Machine Trades, and Services (including a large number of police, fire and emergency medical personnel), overseen by DLLR and made possible through cost sharing between sponsoring employers and apprentice employees.
• Occupational skills training programs in Business Careers, Information
Technologies and Data Processing, Health Services, Mechanical and Engineering Technologies, Natural Science Technologies, and Public Safety Related Technologies, offered by sixteen Maryland community colleges, and overseen by the Maryland Higher Education Commission.
Additional conclusions based on this study include:
1. There is a diverse investment of Federal, State of Maryland and local government funds, and business and worker commitments to occupational skills training. This study, which relied on available administrative data sources, covers a limited part of the overall investment stream and trainee flows.
2. The pre-training earnings of trainees covered in this study are starkly
different. The trainees included arrived for training with different work histories, needs and short-term goals. Similarly, the training activities that welcomed these participants had different missions, eligibility criteria and resource capacities.

iii
3. By June 2002, when these trainees were three years beyond the reference training activities, 72 percent had completed training in the categories with a median annual earnings level higher than $27,794. This figure was adopted for comparison purposes because it is the July 2001-June 2002 median annual earnings figure for the 1,832,615 workers who are known to have been working in Maryland in both this year and in the July 1997-June 1998 pre-training reference year.
4. More than 77 percent of the trainees had completed training in categories
with a July 2001-June 2002 Maryland UI wage record appearance rate higher than the 68 percent ‘retention’ rate for all 2,683,376 workers found in the July 1997-June 1998 Maryland UI wage records file.
5. Median annual earnings more than doubled in this brief time for six out of
the fourteen sub-populations of occupational skill trainees. Future Research Considerations
This study establishes a foundation of historical information about a subset of occupational training within Maryland’s overall investment in workforce development. The employer, community college and other provider pipelines of training opportunities and services described here remain open for business. Federal, State and local government funding streams for investment in occupational skills training are under pressure and further research is needed before information contained here could be used as the criteria for allocating authorized funds among competing pipelines. The Board recognizes that more in-depth research can and should be conducted to support the development of the needed case statements: • More intensive study of the training activities, employment and earnings
already covered here should be supported. Such analyses should include demographic descriptors such as gender, ethnicity and age, and additional descriptors of previous work history, educational attainment, the content of skills training provided, and local economies.
• The Maryland UI wage records were used in this study to prepare basic work
histories and earnings profiles. These data can be used in more intensive research to identify job retention patterns and, when combined with other administrative data maintained by DLLR, to reveal inter-industry mobility profiles and the association of these moves with earnings gain or loss.
• Return-on-investment estimates can be calculated if reliable and
appropriately detailed cost information is provided. • More components of the overall investment in workforce development in
Maryland could be covered in future research including the University System of Maryland and training funded by the Department of Human Resources.

iv
• Biannual updates should be conducted to offer the Governor, members of the General Assembly, other government officials, and the public a clear understanding of how progress is occurring in the continuous effort to maintain the productivity of the workforce.
• More detailed analysis of individual programs is needed to determine effective
training strategies for the vastly different populations served. § Using UI wage records it would be possible to track whether a worker moves
from one Maryland employer to another Maryland employer. Earnings trends can then be investigated including a descriptor of whether trainees changed employer affiliation soon after exit from training.
• Progress in expanding opportunities for new entrants and reentrants to the
workforce, and for those who make the effort to qualify for advancement, should be documented.
• The importance of human capital investments in probationers and
incarcerated prisoners with predictable release dates is known, but much more should be done to document the link between earnings and recidivism.

TABLE OF CONTENTS
PAGE
ACKNOWLEDGMENTS EXECUTIVE SUMMARY
1.0 INTRODUCTION 1 1.1 Sustained creation and renewal of workforce skills
1.2 Purpose of this study 1.3 Sequence of topics covered 2
1.4 Cautions 1.5 Limitations 3 1.6 The need for sustained creation and renewal of workforce skills 4 1.7 Responses to the need for creation and renewal of skills 5 1.8 Training coverage 6 2.0 STUDY DESIGN AND DATA SOURCES 7 2.1 Overview 2.2 Categories of training included 8 2.3 Placing the categories of training in the context of the continuous flow of workforce development activities in Maryland 2.4 Trainee time coverage 9
2.5 Employment and earnings profile time coverage
2.6 Inflation adjusted earnings 10 2.7 Data sources 3.0 ADDITIONAL TRAINING BENEFITS OTHER THAN INCREASED EARNINGS 11

PAGE 4.0 FINDINGS
4.1 Statewide findings
4.1.1 The training mix 12 4.1.2 Pre year earnings 14 4.1.3 Exit year earnings 4.1.4 Post year one earnings 4.1.5 Median earnings change pre year to post year one 15 4.1.6 Median earnings in post years two and three 16 4.1.7 The post year three 'hit' rate
4.2 Program-specific earnings trend charts and analyses 17
4.2.1 The Maryland Industrial Training Program (MITP) 18 4.2.2 The Partnership for Workforce Quality (PWQ) 19 4.2.3 The Job Training Partnership Act (JTPA) Title 2a Adults 20 4.2.4 The Job Training Partnership Act (JTPA)
Title 2c Youths 21 4.2.5 The Job Training Partnership Act (JTPA)
Title 3 Dislocated Workers 22 4.2.6 Certificate of Completion of Apprenticeship Recipients 26 4.2.7 Community college occupational skills training programs 28 5.0 FUTURE RESEARCH OPPORTUNITIES AND PRIORITIES 31

PAGE APPENDIX 33 A.1 Maryland Industrial Training Program and Partnership for Workforce Quality
Statewide Descriptive Statements 34 A.2 Job Training Partnership Act 37 A.2.1 JTPA Statewide Descriptive Statement A.2.2 JTPA Local Workforce Investment Area Charts and Individual Descriptive Statements 40 A.3 Maryland Apprentice and Training Program Statewide Descriptive Statement 54 A.4 Community Colleges
A.4.1 Statewide Descriptive Statement 56 A.4.2 Individual Community College Descriptive Statements 59

1.0 INTRODUCTION
1.1 Sustained Creation and Renewal of Workforce Skills
Sustained investment in the creation and renewal of worker skills is essential if Maryland is to remain attractive to business owners and workers. Reliable availability of needed skills in the workforce has replaced location as the main criterion in many business start-up, continuation and expansion decisions.
Federal, State and local government investments in workforce
development are subject to annual appropriation of funds decisions and periodic recasting of enabling legislation. These public sector decisions interact with business management and employee decisions that also affect the full inventory of available skills.
1.2 Purpose of This Study
Using selected training completion data and Maryland employment and earnings information, this study, sponsored by the Governor’s Workforce Investment Board, investigates two questions: 1. Do trainees stay here to work? If so, the return on investment remains in
Maryland. 2. After completion of occupational training in Maryland, do the trainees have
higher earnings than before completion of the training? If so, this is one indicator that the Maryland economy benefits from the investment in training. A higher earning amount is assumed to reflect higher productivity.

2
1.3 Sequence of Topics Covered in Remaining Sections Sections 1.4 (Cautions) through 1.8 (Training Coverage, and all of Section
2 (Study Design and Data Sources) and Section 3 (Additional Training Benefits Other Than Increased Earnings), contain background information. These sections are needed to understand the Findings that appear in Section 4. Section 2 describes the study design and data sources relied upon. This is followed in Section 3 by acknowledgment of training outcomes that are not covered here. Section 4 presents and analyzes findings that resulted from this study. This coverage includes program-specific results for each of the categories of training covered. The approach taken in Section 4 is straightforward—calculate before and after average earnings amounts for clients who exited from different training activities in the same reference year (July 1998-June 1999). Maryland Department of Labor, Licensing and Regulation employment and earnings data, commonly known as UI wage records, are used. Section 5 concludes with suggestions for further research that can strengthen our understanding of the performance of the public components of Maryland’s workforce development system. An Appendix contains earnings trend profiles for sub-populations of training clients in Maryland’s 12 local workforce investment areas and 16 community colleges.
1.4 Cautions
Some readers will be disappointed after reading this report because
related topics of intense interest and substantial importance are not covered. These unexamined topics include:
• Nothing is said here about the explicit public and private, or business and
worker sharing of training costs or receipt of the benefits that flow from these investments (e.g., lower costs of production, higher earnings, and reduced spending on welfare, food stamps and subsidized child-care).
• Funding agency, training provider and student differences in training goals are
described, but not analyzed, here. Trainee demographics, living circumstances, prior work histories and other pertinent aspects of the complex lives of the trainees remain unknown. These are known to be important for understanding employment and earnings trend differences.
• The use of earnings as an acceptable measure of a worker’s human capital
and the contribution of this productive capacity in the workplace is not universally accepted. Many market conditions must be satisfied for this ‘signal of value’ to be reliable.

3
• Some interested parties express concern that employment and earnings information alone, particularly Maryland employment and earnings amounts described using only Maryland UI wage record information, offers an incomplete accounting of the multi-faceted contributions of the entities covered. The Appendix includes additional information about the training activities and other outcomes achieved by the programs included in the study.
1.5 Limitations Accurate warnings about some limitations of this study should accompany any use of the findings presented and analyzed in Section 4. Three of these limitations arise from reliance on Maryland UI wage records for documentation of employment status and earnings amount: 1. Employment status is defined by the presence of quarterly earnings in the Maryland UI wage records file. No distinction between earnings for full-time
or part-time employment is included because this information is not available. 2. The Maryland UI wage record file does not include an occupational descriptor. Nothing can be said about a former trainee’s use of newly acquired skill. 3. Some types of employment are not included in the Maryland UI wage records.
The most important examples of omitted categories of employment are: Federal government civilian employees and military personnel; self-employed individuals and other independent contractors; workers who receive only commission or piece-rate compensation (i.e., no wage or salary); and out-of-state jobs held by Maryland residents.. The Federal government civilian and military employment and out-of-state employment affiliations can be added from other available data sources.
4. A fourth limitation of this study results from decisions that were made to
concentrate on a one year cohort of trainees and to analyze earnings trends based on a five-year time horizon. Different timeframes would have unknown effects on the findings reported here.
These limitations are highlighted to encourage proper interpretation and
use of the findings that appear in Section 4. This statement of ‘boundaries’ is not a disavowal of the accuracy or importance of these findings.

4
1.6 The Need for Sustained Creation and Renewal of Workforce Skills
Figure 1 shows why sustained creation and renewal of skills is important to the Maryland economy.
FIGURE 1
THE NEED FOR SUSTAINED CREATION AND RENEWAL OF WORKFORCE SKILLS
NEW BUSINESS START-UPS AND EXISTING BUSINESS GROWTH
(expands incumbent employee base)
NEW TECHNOLOGIES, JOB ASSIGNMENTS AND EXPECTATIONS
(‘twists’ but does not change the size of incumbent employee base) • New businesses need to recruit qualified employees or train recruits after they
are hired. Some existing businesses expand, thus increasing the demand for workforce skills.
• Over time, unless renewed, incumbent employee skills fall out of alignment
with demand. New technologies and new ideas about best-practice uses of personnel are adopted. Again, this increases the demand for higher level or different skills.
INCUMBENT EMPLOYEE
BASE
MOVERS RETIREMENTS
REPLACEMENT NEED?
(perhaps)
REPLACEMENT NEED?
(perhaps)

5
• Even, or particularly when skills are kept in alignment with best-practice use, highly qualified employees become targets for raiding by competitors seeking quick access to needed skills. Employers must decide whether to ‘make or buy’ needed skills. An employer’s selection of an optimal combination of recruitment and training costs depends upon many considerations that are not explored further here.
• Senior employees retire, usually taking valuable human capital with them. Net growth in demand for skills, obsolescence of employee skills, and departure combine to require sustained creation and renewal of skills. 1.7 Responses to the Need for Creation and Renewal of Skills Business, worker and public responses to the need for creation and renewal of skills are not isolated from each other. The responses interact. • Continued learning of new skills is a routine expectation in many businesses.
Larger businesses often have their own training unit. More often, large and small businesses hire vendors to offer specialized on- and off-site training modules.
• Concurrent with these internal training activities, with and without employer
support, many employees return to a public community college, university or private training entity to learn new skills. Internet learning is a growing component of this renewal activity.
• All workers are not fortunate enough to be able to upgrade their skills while
still employed. Displaced workers often invest in renewal of skills to improve their prospects of finding a new job consistent with their goals.
• Others have never worked, or have not worked recently, and know that
continued learning is a necessity if they are to find and keep a new job.

6
Figure 2 shows the basic ways creation or renewal of skills happens.
FIGURE 2
RESPONSES TO THE NEED FOR SUSTAINED CREATION AND RENEWAL OF SKILLS
BUSINESS RESPONSE WORKER RESPONSE PUBLIC RESPONSE On-site on-the-job Incumbent employees Public university training return to school offerings Off-site upgrading Employees change Public community employer affiliation college offerings to gain access to new Hiring from local skills Other Federal, State sources and local government Displaced workers, purchases of training Out-of-state new first-time workers services from public recruitment and returning workers and private providers return to school or Relocation accept a new job with Payments to private continued learning providers, businesses opportunities and other training entities
Together, Figure 1 and Figure 2 show there is a need for sustained creation and renewal of employee skills in Maryland, and there are multiple channels of current and potential public and private response to this need. 1.8 Training Coverage This study covers 28 categories of training in Maryland: • Training offered through two Maryland Department of Business and Economic
Development (DBED) programs—the Industrial Training Program (MITP) and the Partnership for Workforce Quality (PWQ) (see Sections 4.2.1 and 4.2.2 for additional details). All trainees who participated in each program are included. No minimal exposure or completion criteria were imposed.

7
• Seventeen categories of on-the-job and classroom skills training managed by the Maryland Department of Labor, Licensing and Regulation (DLLR) using Job Training Partnership Act (JTPA) funds on behalf of Title 2a Adults, Title 2c Youths, and Title 3 Dislocated Workers (see Sections 4.2.3, 4.2.4 and 4.2.5 for additional details). In Fiscal Year 1999, JTPA Title 2a served 6,754 adults, 5,403 (80%) of whom received training of some type. The participants in this study represent 27.1% (1,465) of the total adults trained under Title 2a. In the same fiscal year, JTPA Title 2c served 2,663 youths, 2,290 (86%) of whom received training. The youth in this study represent 6.3% (143) of the total youth trained under Title 2c. JTPA Title 3, in fiscal year 2000, served 11,028 adults, 7,168 (65%) of whom received training. The adults in this study represent 39% (2,797) of the total adults trained under Title 3. The Workforce Investment Act of 1998 (WIA) replaced the JTPA program, effective July 1, 2000 in Maryland.
• Three types of formal registered apprenticeship training administered by the
Maryland Apprenticeship and Training Program in the Department of Labor, Licensing and Regulation—construction trades, machine trades, and services (see Section 4.2.6 for additional details).
• Six occupational programs offered by Maryland public community colleges—
business, information technologies and data processing, health services, mechanical and engineering technologies, natural science technologies, and public safety related technologies (see Section 4.2.7 for additional details).
2.0 STUDY DESIGN AND DATA SOURCES
2.1 Overview
Interested parties convened in January 2002 to begin the study design process. State agency affiliations represented included the Board, the Maryland Higher Education Commission (MHEC), the Department of Business and Economic Development (DBED), and the Department of Labor, Licensing and Regulation (DLLR). Other participants included a community college institutional researcher, a local workforce investment area evaluation staff person, and the principal investigator from The Jacob France Institute at the University of Baltimore. Questions addressed at the outset included: • What categories of training should be included? • What sub-populations of former trainees and students should be included?

8
• What time coverage of employment and earnings histories should be included?
• Having answered these questions, how should the employment and earnings
profiles be summarized for public release? The answers to each of these questions are described next. This is followed by a brief description of the data sources used in the study. 2.2 Categories of Training Included What categories of training are covered? Issues that had to be resolved include: • Expected cell-sizes that would be required to satisfy legal non-disclosure of
identity stipulations in Federal and State laws and a practical relevance criterion.
• Adoption of a minimum threshold of trainee exposure to content. The JTPA
definition adopted was “at least 30 days of elapsed time between the entry date and exit date associated with the training activity”, recognizing that this is not a direct measure of exposure to content. The community colleges definition adopted was “one year course content equivalent” coupled with the completion definition defined in the next bullet.
• Selection of a practical definition of training completion. The community
colleges definition adopted was “award of a certificate or degree” coupled with the minimum threshold of content criterion defined in the previous bullet. The JTPA data file contains a ‘completion’ data element.
• The State agency and local partners in the conduct of this study each decided
how occupational skills training would be defined for the selection of the sub-populations to be included in the analysis. Training content varies among some of the categories of training studied. .
2.3 Placing the Categories of Training in the Context of the Continuous Flow of Workforce Development Activities in Maryland
Together, the investments covered in this study constitute an unknown part of the total investment in workforce development in Maryland. Continuous investment in workforce development occurs in the workplace, without direct public subsidy. Each year, the State’s public and private universities, colleges and community colleges add substantial value to the stock of human capital that is available to Maryland employers.

9
2.4 Trainee Time Coverage
The original specification of trainee time coverage developed by Board staff was six State fiscal years: July 1994-June 1995 through July 1999-June 2000. The advantages gained by adopting the State fiscal year as the unit of observation and analysis include: • MHEC collects administrative information from community colleges on a July-
June school-year cycle, so no other ‘cutting’ of the community colleges data would have been practical.
• State funding of the PWQ and MITP activities is on a State fiscal year basis. • Federal JTPA funding was on a July-June Program Year basis.
The July 1999-June 2000 cutoff was chosen to ensure that at least several years of post-training employment and earnings history would be available for this most recent of the annual sub-populations. It also conveniently defined the end of the JTPA era in Maryland and the beginning of its Workforce Investment Act (WIA) successor. 2.5 Employment and Earnings Profile Time Coverage
The study design team agreed from the outset that: • The intent in collecting pre-training and post-training employment and
earnings information is not to estimate the net impact or value-added of each category of occupational skills training covered. However, the consistent increase in income can be considered a change in productivity of employees as measured by earnings.
• There is no consensus definition of the optimal length of time to be included
for either pre-training or post-training coverage.
There is no practical definition of a common date of entry into training that could be used for all categories of training covered. The response to the issue of date of entry differences was to adopt a one-year definition of pre-training, dated from the reference year of exit from training for the PWQ, MITP, JTPA and community colleges training activities. Apprentices pre-training year was defined as the year prior to entry into the apprenticeship. From a practical perspective, this definitional distinction is more symbolic than real. Many of the PWQ, MITP and JTPA training activities, and some of the one-year certificate programs offered through community colleges, involve occupational skills training that begins and ends in the same July -June cycle, which means they are actually treated the same as the apprentices.

10
Three years of post-training earnings history was agreed upon as a
common observation period for the findings to be reported in Section 4. This means that the trainees with exit dates between July 1998 and June 1999 fall in the most recent time segment that could be included. The common three-year post-training time horizon is defined as July 1999-June 2002. 2.6 Inflation Adjusted Earnings
All earnings amounts that appear in Section 4 have been inflation-adjusted. This means that annual earnings amounts have been indexed to 2001 equivalent purchasing power. An inflation-adjusted 2000 earnings amount will be higher than the nominal, or actual, 2000 earnings amount because it has been ‘inflated’ to reflect purchasing power at the 2001 cost-of-living. This step is designed to focus attention on ‘real’ changes in earnings levels, having removed annual increments associated with persistent increases in the cost of living over time. 2.7 Data Sources
Six data sources were used in this study: 1. Partnership for Workforce Quality (PWQ) administrative records, provided by
the Maryland Department of Business and Economic Development. 2. Maryland Industrial Training Program (MITP) administrative records, provided by the Maryland Department of Business and Economic Development. 3. Job Training Partnership Act (JTPA) administrative records for twelve local
Investment areas, provided by the Maryland Department of Labor, Licensing and Regulation.
4. Apprenticeship administrative records, provided by the Maryland Apprenticeship and Training Program in the Maryland Department of Labor, Licensing and Regulation. 5. Certificate and degree recipient administrative records for sixteen community
colleges, provided by the Maryland Higher Education Commission. 6. Maryland Unemployment Insurance Program administrative records (UI Wage Records), provided by the Maryland Department of Labor, Licensing and Regulation.

11
The next brief section highlights the fact that only two performance indicators are included here—employment in Maryland and changes in Maryland earnings from a pre year, through the exit-from-training year, to three post years. The participating entities want readers to know that their activities are multi-faceted. The occupational training activities covered here represent incomplete coverage of the overall flow of customers served by each State and local agency.
3.0 ADDITIONAL TRAINING BENEFITS OTHER THAN INCREASED EARNINGS
An overlooked aspect of participation in the acquisition and renewal of skills is that these are often needed to retain a job. Figure 1 shows that technologies evolve and new job assignments and expectations are announced. MITP and PWQ show earning gains, but job creation and retention are the core goals of these programs.
A hypothetical finding of no change in earnings following an investment in training can be consistent with success, if the training was needed to keep a job. A displaced worker who has invested in training typically receives lower earnings immediately following the training than had been received prior to displacement. This is not a signal of failure.
Another overlooked return on an investment in training is that it provides an ‘option’ value—it broadens the range of employment opportunities available for trainee consideration. If the trainee does not immediately act to take advantage of this option value there will be no observed change in earnings, but the trainee is comforted by the fact that “I could change jobs now if I wanted to”. Both the individual and society benefit from this new flexibility. Unlike targeted short-term training activities, such as those typically associated with the PWQ and MITP investments, and unlike targeted long-term training activities like formal registered apprenticeships, community colleges offer broad bundles of academic and occupational enhancement. Community colleges take pride in a broad portfolio of student, employer and social impacts, including understanding the importance of a continued investment in learning, awareness and acceptance of diversity beyond one’s immediate neighborhood and workplace, and a deeper understanding of civic responsibilities.
Table 1: Summary of Occupational Skills Training Earnings Profiles, is presented next in Section 4. There is much to be enthusiastic about the findings summarized there, but this remains a narrow window through which to view the overall contribution of the entities covered.

12
4.0 FINDINGS 4.1 Statewide Findings
There are 16 public community colleges, 12 local workforce investment areas, and many individual PWQ, MITP and registered apprenticeship agreements represented in the data that have been assembled to describe occupational skills training in Maryland. Brief statements about the MITP, PWQ, JTPA, Apprenticeship and community college sub-populations appear in sections 4.2.1 through 4.2.7. 4.1.1 The Training Mix
Table 1 includes information about 21,766 individuals with training exit dates between July 1998 and June 1999. Each row represents a category of training—MITP, PWQ, JTPA Titles 2A, 2C, and 3, registered apprenticeships in services, machine trades, and construction trades categories, and community college certificate or degree recipients in Business, IT, Health, Mechanical and Engineering Technologies, Natural Science Technologies, and Public Safety Technologies.
Treating PWQ and MITP as independent activities, the respective shares of July 1998-June 1999 reference year exits covered here are: PWQ (31%) MITP (27%) JTPA (20%) Community colleges (19%) Apprentices (3%) Conclusion: There is a diverse investment in occupational training in Maryland.

PERCENT PRE- EXIT POST Yr $ Change % Change POST Yr POST Yr 2001-2002N= OF TOTAL YEAR YEAR ONE Pre-Post Pre-Post TWO THREE HIT RATE
$17,185 * $27,794 * 68%DBED 57.3
PWQ 6,681 30.7 $32,000 $34,000 $37,000 $5,000 15.6 $36,500 $36,500 79%MITP 5,784 26.6 $26,750 $32,750 $35,000 $8,250 30.8 $37,750 $38,750 79%
DLLR 23.5JTPAAdults 1,465 6.7 $5,000 $6,000 $11,500 $6,500 130.0 $12,250 $13,500 73%Youth 143 0.7 $3,250 $5,250 $9,750 $6,500 200.0 $8,250 $9,250 75%Dislocated Worker 2,797 12.8 $15,000 $11,000 $17,750 $2,750 18.3 $20,500 $21,500 66%
APPRENTICESServices 276 1.3 $19,000 $38,000 $41,250 $22,250 117.1 $43,500 $49,750 96%Mchn Trds 34 0.2 $26,000 $36,000 $35,500 $9,500 36.5 $41,500 $40,750 88%Const Trds 390 1.8 $14,000 $32,500 $37,750 $23,750 169.6 $39,500 $40,250 90%
MHEC 19.2COMM COLLEGESBusiness 1,001 4.6 $15,750 $16,250 $19,750 $4,000 25.4 $23,500 $25,000 64%IT 507 2.3 $17,750 $18,250 $24,000 $6,250 35.2 $28,500 $32,500 61%Health 1,565 7.2 $9,500 $11,500 $26,750 $17,250 181.6 $34,000 $38,250 77%Mech-Eng 375 1.7 $22,500 $25,500 $30,750 $8,250 36.7 $35,000 $36,250 70%Natural Sciences 85 0.4 $9,500 $12,000 $19,500 $10,000 105.3 $22,750 $24,500 73%Public Safety 663 3.0 $11,500 $14,000 $17,500 $6,000 52.2 $20,000 $22,000 66%
TOTAL N 21,766 100.0
TABLE 1
Summary Of Maryland Statewide Median Inflation Adjusted Annual Earnings Profiles
July 1998 - June 1999 Exiters From Training
. The 2001-2002 'hit' rate is the percent of the row N that had reported earnings of any amount in the Maryland UI wage records file in any one, two, three or four quarters between July 2001 and June 2002.
. The 'pre-' year for each of the Apprentice dollar amounts is the July-June year prior to the year of entry into the apprenticeship.
SOURCES: The Jacob France Institute, University of Baltimore; Maryland Department of Business and Economic Development; Maryland Department of Labor, Licensing and Regulation; Maryland Higher Education Commission.
* The $17,185 pre year figure is the July 1997 - June 1998 median inflation adjusted annual earnings amount for all workers appearing in the Maryland UI wage records file during that reference year. The $27,794 post year three amount is the comparable July 2001 - June 2002 figure for the 68 percent of these workers who also appears in the Maryland UI wage records file for that reference year.
Refer to Section 4.2.1 through 4.2.7 for briefdescriptions of program and trainee sub-population differences. Awareness of these differences discourages comparion of earnings amounts between rows in this table.

14
4.1.2 Pre Year Earnings Median pre year inflation adjusted earnings range from a low of just over $3,000 for the JTPA Title 2c youths, who typically do not have high school diplomas and possess a limited work history, to $32,000 for the Partnership for Workforce Quality trainees. Again, the pre year was July 1997-June 1998 for the 21,066 non-apprenticeship trainees. Each of the 700 apprenticeship trainees has a pre year defined by their individual date of entry into the reference apprenticeship. Conclusion: The documented prior earning capacities of the trainees are starkly different. Caution is urged in interpreting this statement. Our only evidence of prior earning capacity is what the trainees earned, documented using Maryland UI wage record information. Nothing is known about the full-time or part-time, seasonal or year-round employment circumstances that produced these recorded earnings amounts. Nothing can be said about what the trainees were capable of earning during this observation year, only what they actually earned. 4.1.3 Exit Year Earnings
Exit year median earnings amounts appear in Table 1. The exit year should be interpreted as a ‘bridge’ between pre and post earnings. Individuals in the 14 categories of occupational skills training included in Table 1 may have exited at any time between July 1, 1998 and June 30, 1999. Engagement in some of the occupational skills training activities was a barrier to working, while in other cases it was concurrent with, and even dependent upon working. Conclusion: Exit year earnings amounts are included in Table 1 as a separator between meaningful pre- and post- earnings figures. This cell in each row of Table 1 is intended to remind readers that there is not always an ‘abrupt’ change in earnings level coincident with the timing of exit from training. 4.1.4 Post Year One Earnings
What is called ‘post year one’ here actually begins between one day and twelve months after a particular trainee’s exit date. A trainee who exited from occupational skills training on July 1, 1998 would have a post year one beginning date of July 1, 1999, a full year later, consistent with the desire to place a reference year between the pre and post observation periods. However, a trainee who exited from occupational skills training on June 30, 1999 would also have a post year one beginning date of July 1, 1999, just one day later.

15
Eight out of fourteen median earnings amounts during the pre year had been less than $17,185 (the statewide median annual inflation adjusted earnings amount for all workers found in the July 1997-June 1998 Maryland UI wage records file). Now, during the first year following exit from training, only two of the fourteen median earnings amounts are that low. Again, all earnings amounts in Table 1 are inflation adjusted, so this improvement is ‘real’. The median annual earnings amounts for economically disadvantaged JTPA Title 2a Adults and Title 2c Youths that fall below $17,185, (, were still more than double their respective pre year median annual earnings amounts. So, while earnings were still low compared with the other sub-populations of occupational skill trainees, substantial earnings growth was evident after training. Conclusion: Recall the phrasing used in Section 1.2--"a higher earning amount is assumed to reflect higher productivity." The former trainees who exited from covered training activities between July 1998 and June 1999 had clearly contributed more to the Maryland economy during this first year following exit. Here, ‘higher productivity’ reflects an unknown combination of being more productive each hour worked, working more hours per pay period, and working more consistently year-‘round. 4.1.5 Median Earnings Change Pre Year to Post Year One
Unfortunately, nothing can be done to overcome the barrier to understanding posed by the fact that ‘higher productivity’ reflects an unknown combination of being more productive each hour worked, and working more hours. Having said that, the percentage increase of median earnings amounts between the pre and first post years, which appear in Table 1, is impressive across the board. The percentage increases range between 16 percent and 200 percent. Median annual earnings more than doubled in this brief time for six out of the fourteen sub-populations of occupational skill trainees. Conclusion: The rates of increase in inflation adjusted median annual earnings between the pre and first post years are substantial, ranging from a low of 16 percent to a high of 200 percent.

16
4.1.6 Median Earnings in Post Years Two and Three
Average annual inflation adjusted earnings continued to increase through mid-2002. Table 1 shows that eight of the fourteen July 2001-June 2002 sub-population inflation adjusted median annual earnings amounts were now higher than $27,794. This benchmark is the July 2001-June 2002 median annual inflation adjusted earnings amount for all workers found in the Maryland UI wage records file in both the July 1997-June 1998 and July 2001-June 2002 reference years. Section 4.1.4 showed that these workers had a median annual inflation adjusted earnings amount of $17,185 in the pre year, July 1997-June 1998. Conclusion: Median annual earnings continued to rise through the middle of 2002, despite several years of a ‘softer’ State economy than had been enjoyed through mid-2000. More than half of the sub-populations covered had already achieved a median annual inflation adjusted earnings level higher than the statewide median for workers known to have been working in Maryland in both 1997-1998 and 2001-2002.
There is no reason to expect all of the trainee sub-populations studied to have achieved this level of average annual earnings. The demographics of the trainee sub-populations are different. The previous work histories of the trainees are different. The goals of the training activities offered are different. 4.1.7 The Post Year Three ‘Hit’ Rate
Perhaps most satisfying of all to Maryland taxpayers is the July 2001-June 2002 ‘hit’ rate column in Table 1—the percent of each sub-population of trainees appearing in the Maryland UI wage record file in the most recent reference year. More than 75 percent of the former trainees were employed in Maryland in the past year (documented by reported earnings appearing in the Maryland UI wage record file). This does not include Federal government civilian employees, military personnel, independent contractors and commission-only agents. Conclusion: The Maryland economy is ‘open’ because of the ease of commuting to concentrations of employment opportunity in Delaware, the District of Columbia, Pennsylvania, Virginia and West Virginia. Workers have faced ‘soft’ economic conditions in Maryland since mid-2000. Despite these forces that combine to ‘push’ some former trainees toward out-of-state opportunities, more than 75 percent of the recipients of Federal, State and local investments in training in Maryland continue to work here. This 75 percent 'retention' level compares favorably with the 68 percent 'retention' level for all workers found in the July 1997-June 1998 Maryland UI wage records file and in the July 2001-July 2002 reference quarters.

17
4.2 Program-Specific Earnings Trend Charts
Table 1 presents more than 100 numbers for readers to interpret. This section transforms 70 of these numbers—five median annual inflation adjusted earnings amounts for each of the categories of training—into 14 earnings trend charts with accompanying interpretation.
The 14 charts are presented in the following sequence: • The Department of Business and Economic Development MITP and PWQ
charts appear on pages 18 and 19 respectively (see Appendix Section A.1 for additional information about these programs).
• The Department of Labor, Licensing and Regulation JTPA Title 2a Adult, Title
2c Youth, and Title 3 Dislocated Worker program charts appear on pages 20, 21 and 22. Occupational detail, including Table 2, appears on pages 23, 24 and 25. (Also see Appendix Section A.2 for additional information about these programs statewide and by local workforce investment area).
• The Department of Labor, Licensing and Regulation Apprenticeship program
charts appear on pages 26 and 27 (see Appendix Section A.3 for additional information about this program).
• The community college occupational program charts appear on pages 28, 29
and 30 (see Appendix Section A.4 for additional information about these programs at both the statewide and individual college levels).
The 14 charts contain only information already included in Table 1. Each
was prepared from the median annual inflation adjusted earnings amounts presented in Table 1. However, the brief interpretive text is new.
18
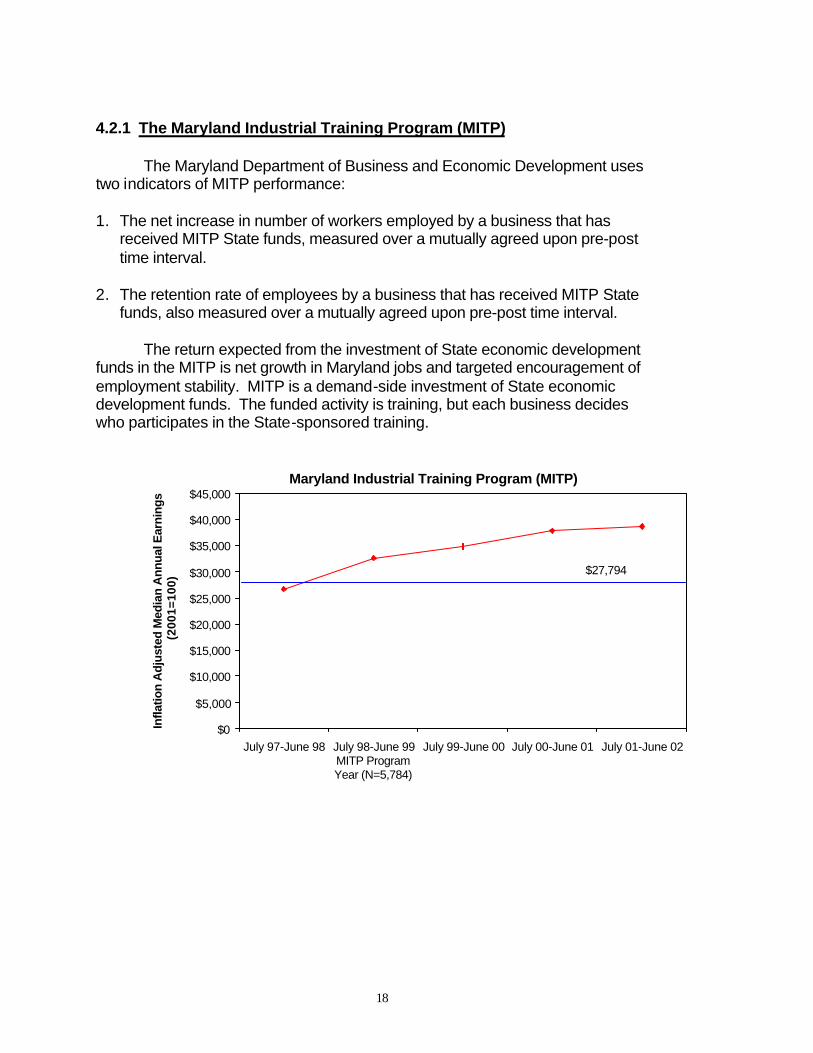
4.2.1 The Maryland Industrial Training Program (MITP) The Maryland Department of Business and Economic Development uses two indicators of MITP performance: 1. The net increase in number of workers employed by a business that has
received MITP State funds, measured over a mutually agreed upon pre-post time interval.
2. The retention rate of employees by a business that has received MITP State
funds, also measured over a mutually agreed upon pre-post time interval.
The return expected from the investment of State economic development funds in the MITP is net growth in Maryland jobs and targeted encouragement of employment stability. MITP is a demand-side investment of State economic development funds. The funded activity is training, but each business decides who participates in the State-sponsored training.
Maryland Industrial Training Program (MITP)
$0
$5,000
$10,000
$15,000
$20,000
$25,000
$30,000
$35,000
$40,000
$45,000
July 97-June 98 July 98-June 99MITP ProgramYear (N=5,784)
July 99-June 00 July 00-June 01 July 01-June 02
Infla
tion
Ad
just
ed M
edia
n A
nn
ual
Ear
nin
gs
(200
1=10
0)
$27,794

19
4.2.2 The Partnership for Workforce Quality (PWQ)
The PWQ, also managed by the Maryland Department of Business and Economic Development, targets small and medium-size manufacturing and technology businesses. Unlike the MITP, which focuses on job creation, the PWQ concentrates on targeted investments in employee upgrading designed to stabilize and improve the competitiveness of a sponsored business. Like the MITP, the PWQ is a demand-side investment carried out through employee training. Higher employee earning, per se, is not a PWQ performance measure.
Participants in both MITP and PWQ experienced higher earnings after training even though increasing employees’ earnings is not a planned outcome for the programs. Further the ‘hit rate’ (percent of trainees with earnings in Maryland 3 years after exiting training) of 79% is higher than the average of 68%.
Partnership for Workforce Quality (PWQ)
$25,000
$27,000
$29,000
$31,000
$33,000
$35,000
$37,000
$39,000
$41,000
$43,000
$45,000
July 97-June 98 July 98-June 99PWQ ProgramYear (N=6,681)
July 99-June 00 July 00-June 01 July 01-June 02
Infla
tion
Ad
just
ed M
edia
n A
nn
ual
Ear
nin
gs
(200
1=10
0)
$27,794

20
4.2.3 The Job Training Partnership Act (JTPA) Title 2a Adults The Federally funded JTPA Title 2a program, managed by the Maryland Department of Labor, Licensing and Regulation, ended in June 2000. The successor Federal program is the Workforce Investment Act (WIA). The JTPA Title 2a targeted hard-to-serve or most-in-need customers. The 12 local workforce investment area earnings trend charts (in the Appendix) clearly reflect different choices made and challenges confronted. However, the difficult-to-serve criterion applied to all.
The Federal JTPA Title 2a Adults funds were a supply-side investment, intended to provide customers having limited or no work history, often welfare recipients, with enough entry-level skills to get a job. Once on the job, just like other coworkers, opportunities for further learning and promotion would be available to these newly hired employees.
Job Training Partnership Act, Title 2A Adults
$0
$2,000
$4,000
$6,000
$8,000
$10,000
$12,000
$14,000
$16,000
July 97-June 98 July 98-June 99 JTPATitle 2A Exit (N=1,465)
July 99-June 00 July 00-June 01 July 01-June 02
Infl
atio
n A
dju
sted
Med
ian
An
nu
al E
arn
ing
s(2
001=
100)

21
4.2.4 The Job Training Partnership Act (JTPA) Title 2c Youth The targeted youth population under the JTPA was out-of-school young people, all without a high school diploma and/or limited prior work history. Like the adults targeted with Federal JTPA funds, these youths had not succeeded in establishing an employment affiliation consistent with immediate self-sufficiency and future retention and promotion. The limited supply-side investment of Federal funds in these youths leaves them with the lowest post- year three median earnings level in Table 1, despite the fact that their average inflation adjusted earnings had almost tripled over the five years covered. Only 143 Title 2C youths remained in the analytical database after imposing the minimum 30 days length of training filter. The transition destinations other than employment covered in the Maryland UI wage records file (e.g., military enlistment and continued education) further reduced the numbers included in each year’s median earnings calculation.
Job Training Partnership Act, Title 2C Youth Training
$0
$2,000
$4,000
$6,000
$8,000
$10,000
$12,000
July 97-June 98 July 98-June 99 JTPATitle 2C Exit (N=143)
July 99-June 00 July 00-June 01 July 01-June 02
Infl
atio
n A
dju
sted
Med
ian
An
nu
al E
arn
ing
s(2
001=
100)

22
4.2.5 The Job Training Partnership Act (JTPA) Title 3 Dislocated Workers This sub-population helps us to recognize why comparisons of earnings trends among the categories of training in Table 1 should be approached with care. Unlike the JTPA Title 2a and Title 2c sub-populations, each targeted because of weak or non-existent work histories, the Title 3 customers usually had solid prior employment records. But were unemployed, for reasons largely beyond employee control, such as a business closed or moved, or a particular product or service component within a continuing business was terminated.
Local workforce investment area charts in the Appendix show a consistent ‘dip’ pattern in the five-year earnings trend, reflecting a substantial loss of prior earnings capacity. Table 1 shows the consequence of this loss—the post year three median inflation adjusted earnings level was 43 percent higher than the pre- year median, but these dislocated workers had still lost ground relative to the other training categories. The relevant difference between the sub-populations is that the dislocated workers had lost human capital (i.e., productive capacity), while many of the other trainees stayed employed, often with the same employer, while gaining new skills. Recovery of the previous earnings level, rather than earnings gain, was the immediate objective of JTPA Title 3 investments in training.
Job Training Partnership Act, Title 3 Dislocated Workers
$0
$5,000
$10,000
$15,000
$20,000
$25,000
July 97-June 98 July 98-June 99 JTPATitle 3 Exit (N=2,797)
July 99-June 00 July 00-June 01 July 01-June 02
Infla
tion
Ad
just
ed M
edia
n A
nn
ual
Ear
nin
gs
(200
1=10
0)
Source: The Jacob France Institute, University Of Baltimore. Data provided by Maryland Department Of Labor, Licensing And Regulation.

23
JTPA training activities, like MITP and PWQ training, are not
concentrated in easily defined categories as specific as the apprentice and community colleges classifications. Table 2 describes the JTPA sub-population earnings trends and July 2001-June 2002 ‘hit’ rates by one-digit Dictionary of Occupational Titles (DOT) descriptors of the training activities. The one-digit DOT descriptors are inclusive: 0/1 Professional, Technical and Managerial Occupations § 2 Clerical and Sales Occupations § 3 Service Occupations § 4 Agricultural, Fishery, Forestry, and Related Occupations § 5 Processing Occupations § 6 Machine Trades Occupations § 7 Benchwork Occupations § 8 Structural Work Occupations § 9 Miscellaneous Occupations
A minimum cell size of 25 was adopted in the preparation of Table 2 for non-disclosure compliance and practical interpretation reasons. This resulted in the following mix of one-digit DOT categories appearing in Table 2 by JTPA title: § JTPA Title 2a Adults—DOT codes 0, 1, 2, 3, 6, 8 and 9. § JTPA Title 2c Youths—DOT codes 2 and 3. § JTPA Title 3 Dislocated Workers—DOT codes 0, 1, 2, 3, 6, 7, 8 and 9.
Table 2 presents median annual inflation adjusted pre earnings amounts for the 17 pairings of JTPA Title and one-digit DOT codes. The pre year earnings amounts range from $2,882 for the Title 2c Youths who received ‘Service Occupations’ training to $17,121 for the Title 3 Dislocated Workers who received ‘Professional, Technical, and Managerial Occupations’ training.

24
JTPA One Digit DOT PRE- EXIT POST Yr % Change POST Yr POST Yr 2001-2002Title DOT Code Title N= YEAR YEAR ONE Pre-Post TWO THREE HIT RATE
Adults 0 Prof. Tech, Mgr 166 $6,610 $6,295 $13,317 101.5 $17,802 $17,653 79%Adults 1 81 $7,095 $9,031 $12,439 75.3 $12,578 $15,233 68%Adults 2 Clerical /Sales 491 $4,931 $5,852 $12,008 143.5 $13,882 $14,244 73%Adults 3 Service 339 $3,803 $5,868 $9,528 150.5 $9,840 $10,900 79%Adults 6 Machine Trades 50 $5,619 $10,254 $14,001 149.2 $17,223 $16,224 68%Adults 8 Structural Work 71 $6,132 $5,248 $9,634 57.1 $11,810 $11,636 51%Adults 9 Misc. 141 $6,623 $6,022 $14,356 116.8 $13,820 $17,462 70%
Youth 2 Clerical/Sales 40 $3,258 $4,070 $8,865 172.1 $8,325 $8,082 80%Youth 3 Service 33 $2,882 $6,725 $13,520 369.1 $11,603 $11,394 82%
Dislocated Worker 0 Prof. Tech, Mgr 480 $15,884 $13,018 $20,927 31.7 $22,907 $25,440 67%Dislocated Worker 1 576 $17,121 $11,352 $18,970 10.8 $21,559 $23,577 62%Dislocated Worker 2 Clerical/Sales 887 $15,324 $10,795 $17,266 12.7 $20,820 $20,636 69%Dislocated Worker 3 Service 151 $7,974 $8,615 $12,285 54.1 $16,870 $15,547 70%Dislocated Worker 6 Machine Trades 67 $15,047 $12,157 $18,209 21.0 $25,934 $25,652 75%Dislocated Worker 7 Benchwork 28 $12,977 $10,621 $12,213 -5.9 $18,749 $10,895 75%Dislocated Worker 8 Structural Work 56 $11,419 $7,812 $17,510 53.3 $16,991 $20,060 73%Dislocated Worker 9 Misc. 189 $16,834 $10,337 $19,599 16.4 $22,044 $21,558 73%
_________TOTAL N 3,846 (lower than Table 1 N=4,405 because 559 DOT codes were not available)
NOTES: The 2001-2002 'hit' rate is the percent of the row N that had reported earnings of any amount in the Maryland UI wage records file in any one, two, three or four quarters between July 2001 and June 2002.
SOURCES: The Jacob France Institute, University of Baltimore; Maryland Department of Business and Economic Development; Maryland Department of Labor, Licensing and Regulation; Maryland Higher Education Commission.
TABLE 2
Summary Of Maryland Statewide Occupational Skills Training Median Earnings ProfilesBy JTPA Title and Type of Occupational Training Activity
July 1998 - June 1999 Exiters

25
Eleven of the seventeen median annual inflation adjusted earnings amounts shown in Table 2 for the pre year are less than $12,000. Only three of the seventeen post year one median amounts are this low—Title 2a Adult training for ‘Service Occupations’, Title 2a Adult training for ‘Structural Work Occupations’, and Title 2c Youth training for ‘Clerical and Sales Occupations’.
Table 2 shows percentage changes in median annual inflation adjusted earnings amounts between the pre year and post year one. These percentage change figures range from minus 5.9 percent for the Title 3 Dislocated Workers receiving training in “Benchwork Occupations’ to plus 369.1 percent for the Title 2c Youth receiving training in ‘Service Occupations’. The latter is an example of why percentage change figures and earnings amounts should usually be interpreted together. The percentage change in this case is the highest among the 17 occupational categories of JTPA occupational training by title, but the end-year earnings level is lower than all but two other pairings of occupational training classification and JTPA title. The July 2001-June 2002 ‘hit’ rates, or percentage of each sub-population in Table 2 that had reported Maryland UI wage record earnings in the most recent reference year available, are consistent with the favorable ‘hit’ rates found in Table 1. Only one of the sub-populations in Table 2, JTPA Title 2a Adults who received training in ‘Structural Work Occupations’, exhibits a ‘hit’ rate of lower than 60 percent.

26
4.2.6 Certificate of Completion of Apprenticeship Recipients Table 1 shows that the three categories of registered apprenticeships included—Services, Machine Trades, and Construction Trades, were ranked one, two and three respectively in post year three median inflation adjusted earnings. Only 700 (3.3 percent) of the 21,766 trainees included in Table 1 received a Certificate of Completion of Apprenticeship, but those who did so achieved the highest levels of average earnings. The results showed that participants in apprenticeships in these occupations increased earnings beyond the median in the first year after completion and those earnings were greater yet 3 years after the year of completion. The investment reflected in these high earnings is fundamentally different from the MITP, PWQ and JTPA investments of public funds: • The total cost of training is shared between the employer and apprentice, no State
funds are used. A typical apprentice starts at 50 percent of the journey-person wage and receives increments throughout the apprenticeship.
• A minimum of one year of on-the-job training is required, but most apprenticeships
have more demanding three, four and five year requirements. • A minimum of 144 hours of related classroom training is required during each year of
the apprenticeship—the equivalent of more than 3 three-credit hour community college courses.
• There are an increasing number of articulation agreements that pair the award of a
Certificate of Completion of Apprenticeship with completion of a community college degree program.
Construction Trades Apprentices
$5,000
$10,000
$15,000
$20,000
$25,000
$30,000
$35,000
$40,000
$45,000
Pre- Registration July 98-June 99
Year Varies Year of Completion(N=390)
July 99-June 00 July 00-June 01 July 01-June 02
Infl
atio
n A
dju
sted
Med
ian
An
nu
al E
arn
ing
s(2
001=
100) $27,794

27
Machine Trades Apprentices
$5,000
$10,000
$15,000
$20,000
$25,000
$30,000
$35,000
$40,000
$45,000
Pre- Registration July 98-June 99
Year Varies Year of Completion(N=34)
July 99-June 00 July 00-June 01 July 01-June 02
Infla
tion
Ad
just
ed M
edia
n A
nn
ual
Ear
nin
gs
(200
1=10
0)
$27,794
Service Sector Apprentices
$5,000
$10,000
$15,000
$20,000
$25,000
$30,000
$35,000
$40,000
$45,000
$50,000
$55,000
Pre- Registration July 98-June 99
Year Varies Year of Completion (N=276)
July 99-June 00 July 00-June 01 July 01-June 02
Infl
atio
n A
dju
sted
Med
ian
An
nu
al E
arn
ing
s(2
001=
100) $27,794

28
4.2.7 Community College Occupational Skills Training Programs The mixture of five-year earnings trends that appear for these community college sub-populations in Table 1 is a clear example of the interpretive limitations imposed by not including demographic, curriculum content, and previous work history and local economy descriptors in the analysis:
Statewide, the median career program graduate salary increased 25 percent between the first and third years after graduation. The charts below indicate that earnings after graduation increased for each of the six program areas with the largest increase overall being in the year immediately after graduation. The career area with the greatest impact on pre and post graduation earnings was health sciences where a community college degree and a licensing credential can open the doors to significant employment opportunities. Maryland community colleges are leaders in preparing nursing professionals.
Many additional insights about the community college programs and former student earning profiles are included in the statewide summary and individual community college profiles found in the Appendix. Readers are strongly encouraged to take advantage of this detailed information.
MARYLAND COMMUNITY COLLEGES Business Career Graduates
$5,000
$10,000
$15,000
$20,000
$25,000
$30,000
$35,000
$40,000
$45,000
July 97-June 98 July 98-June 99Certificate/Degree
Award Year (N=1,001)
July 99-June 00 July 00-June 01 July 01-June 02
Infla
tion
Ad
just
ed M
edia
n A
nn
ual
E
arni
ngs
(200
1=10
0)
$27,794

29
Information Technologies and Data Processing Graduates
$5,000
$10,000
$15,000
$20,000
$25,000
$30,000
$35,000
$40,000
$45,000
July 97-June 98 July 98-June 99Certificate/Degree
Award Year (N=507)
July 99-June 00 July 00-June 01 July 01-June 02Infla
tion
Ad
just
ed M
edia
n A
nn
ual
Ear
nin
gs
(200
1=10
0)
$27,794
Health Services Graduates
$5,000
$10,000
$15,000
$20,000
$25,000
$30,000
$35,000
$40,000
$45,000
July 97-June 98 July 98-June 99Certificate/Degree
Award Year(N=1,565)
July 99-June 00 July 00-June 01 July 01-June 02
Infla
tion
Ad
just
ed M
edia
n A
nn
ual
E
arni
ngs
(200
1=10
0)
$27,794
Mechanical and Engineering Technologies Graduates
$5,000
$10,000
$15,000
$20,000
$25,000
$30,000
$35,000
$40,000
$45,000
July 97-June 98 July 98-June 99Certificate/Degree
Award Year (N=375)
July 99-June 00 July 00-June 01 July 01-June 02Infla
tion
Ad
just
ed M
edia
n A
nn
ual
Ear
nin
gs
(200
1=10
0)
$27,794

30
Natural Science Technologies Graduates
$5,000
$10,000
$15,000
$20,000
$25,000
$30,000
$35,000
$40,000
$45,000
July 97-June 98 July 98-June 99Certificate/Degree
Award Year (N=85)
July 99-June 00 July 00-June 01 July 01-June 02Infla
tion
Ad
just
ed M
edia
n A
nn
ual
Ear
nin
gs
(200
1=10
0)
$27,794
Public Safety Related Technologies
$5,000
$10,000
$15,000
$20,000
$25,000
$30,000
$35,000
$40,000
$45,000
July 97-June 98 July 98-June 99Certificate/Degree
Award Year (N=663)
July 99-June 00 July 00-June 01 July 01-June 02
Infla
tion
Ad
just
ed M
edia
n A
nn
ual
Ear
nin
gs
(200
1=10
0)
Source: The Jacob France Institute, University Of Baltimore. Data provided by Maryland Higher Education Commission and Maryland Department Of Labor, Licensing And Regulation.
$27,794

31
Section 5 addresses some of these issues as topics for further research that can be undertaken with available data sources.
5.0 FUTURE RESEARCH OPPORTUNITIES AND PRIORITIES
This study establishes a foundation of historical information about a subset of occupational training within Maryland’s overall investment in workforce development. The employer, community college and other provider pipelines of training opportunities and services described here remain open for business. Federal, State and local government funding streams for investment in occupational skills training are under pressure and further research is needed before information contained here could be used as the criteria for allocating authorized funds among competing pipelines.
The Board recognizes that more in-depth research can and should be conducted to support the development of the needed case statements: • More intensive study of the training activities, employment and earnings already
covered here should be supported. Such analyses should include demographic descriptors such as gender, ethnicity and age, and additional descriptors of previous work history, educational attainment, the content of skills training provided, and local economies.
• The Maryland UI wage records were used in this study to prepare basic work
histories and earnings profiles. These data can be used in more intensive research to identify job retention patterns and, when combined with other administrative data maintained by DLLR, to reveal inter-industry mobility profiles and the association of these moves with earnings gain or loss.
• Return-on-investment estimates can be calculated if reliable and appropriately
detailed cost information is provided. • More components of the overall investment in workforce development in Maryland
should be covered in future research, particularly the University System of Maryland. • Biannual updates should be conducted to offer the Governor, members of the
General Assembly, other government officials and the public a clear understanding of whether and how progress is occurring in the continuous effort to maintain the productivity of the workforce.
• Progress in expanding opportunities for new entrants and reentrants to the
workforce, and for those who make the effort to qualify for advancement, should be documented.

32
• The importance of human capital investments in probationers and incarcerated prisoners with predictable release dates is known. Much more should be done to document the connection between earnings and incarceration, particularly the link between earnings following parole and subsequent return to prison.

33
APPENDIX
A.1 MITP and PWQ statewide summaries A.2 Job Training Partnership Act A.2.1 JTPA statewide summary A.2.2 Local workforce investment area charts and descriptive summaries A.3 Apprenticeship statewide descriptive summary A.4 Community Colleges A.4.1 Community colleges statewide descriptive summary A.4.2 Individual community college descriptive summaries

34
A.1 DBED Business Development Program Descriptive Statements MITP
The Maryland Industrial Training Program has been in existence since the 1960s. MITP provides incentive grants for the development, retention and training of new employees in firms locating or expanding their workforce in Maryland. Companies require a well-trained proficient workforce and seek assistance from states to recruit and prepare their employees as an incentive. MITP reimburses the firm up to 100% of the direct costs of training, i.e., no trainee salaries or capital equipment costs are included in a training grant agreement.
The level of funding provided to a company is based on a combination of factors including:
• Number of full time positions • Level of wages/salaries • Benefit packages • Proposed location and rate of unemployment in the area • Strategic importance to the Maryland economy
Company performance requirements include specified number of new jobs and their retention over a number of years. There are reimbursement provisions to recover the funds if the company fails to meet performance goals.
Fiscal Year 2001 funding for MITP was $5,867,826.
PWQ
PWQ provides a stimulus for small and medium sized manufacturing and technology companies in Maryland to invest in modernization: • Improve business competitiveness and worker productivity • Upgrade worker skills for new technologies and production processes • Promote employment stability
PWQ operates to: • Target small and medium sized manufacturers and technology companies with 500
or fewer employees • Direct 60 percent of expenditures to firms of 150 or fewer employees

35
Each participating business undertakes an assessment to determine growth potential and targets upgrade skill training to achieve progress. A training plan for the current workforce is developed, consistent with the company’s strategic business and financial plans. Companies develop measurable business performance objectives based on anticipated effects of upgrading employee skills. Each award provides for 50/50 reimbursable grants to companies for the direct cost of training. A follow up system is required to determine individual company performance.
Fiscal Year 2001 funding for PWQ was $4,436,986. Measures of Success
As business development programs, the success of MITP and PWQ is measured in terms of impact on the health of the company. The following tables represent the key measures used by the Department for Fiscal Year 2001.
Indicator FY 2001 Performance Grant Assisted Businesses 384 Jobs Retained 14,557 Jobs Created 6,228 Increase in Gross Sales $1,152 million Capital Investment $1,167 million Worker Productivity Gain $5,754
Company Demographics These programs are committed to serving small businesses, as can be seen from the graphic the majority of the companies served had fewer that 150 employees.
Companies Served by Employment Size
Less than 15056%
150 or more44%
The programs also target manufacturing and technology, the chart below reflects the major sectors served by the programs. Manufacturing reflects traditional

36
manufacturing, while technology manufacturing reflects the production of high technology products, and other includes finance and transportation and warehousing.
Companies Served by Sector
Tech Manufacturing
23%
Manufacturing41%
Others4%
Technology & Bio32%

37
A.2 Job Training Partnership Act A.2.1 JTPA Statewide Descriptive Statement The federally funded Job Training Partnership Act (JTPA) programs, managed by the Maryland Department of Labor, Licensing and Regulation (DLLR), ended in June 2000. The successor federal program is the Workforce Investment Act (WIA). During the timeframe of this study, DLLR received JTPA grants from the U.S. DOL, as they now receive for WIA. The great majority of these funds are formula allocated and granted to Maryland’s twelve Local Workforce Investment Areas (LWIAs) to provide services.
Essentially, it is the LWIAs that assess the customer's needs, provide employability enhancement, and arrange for contractor provided training; the ultimate goal is job placement. The LWIAs have had a long history of operating federal workforce programs, dating back to CETA and MDTA prior to JTPA and WIA. DLLR closely monitors the fiscal and programmatic performance of the LWIAs. The primary funding sources (and target groups) are Dislocated Workers, Adults (economically disadvantaged), and Youth. In Fiscal Year 2000, the total federal JTPA funds allocated to the twelve local areas were:
Adult (II-A) $11,420782 Youth (II-C) $ 1,623,651
Dislocated Worker (III) $11,637,976 The JTPA Title II-A program targeted hard-to-serve or most-in-need Adult customers. The twelve local workforce investment area earnings trend charts (in the Appendix) clearly reflect different choices made and challenges confronted. However, the difficult-to-serve criterion applied to all. The II-A funds were a supply-side investment, intended to provide customers having limited or no work history, particularly welfare recipients, with enough entry-level skills to get a job.Statewide, 6,754 participants were served; 80% received training and 71% entered employment. Participant demographics reveal 27% were school dropouts and 14% had reading skills below the 7th grade level.

38
The targeted youth population under the JTPA Title II-C was out-of-school young people, all without a high school diploma and/or limited prior work history. Like the adults targeted with Federal JTPA funds, these youths had not succeeded in establishing an employment affiliation consistent with immediate self-sufficiency and future retention and promotion. It is important to note that this population has numerous other successful program performance measures that are not related to wages. Other positive outcome measures include placement in apprenticeship, military, advanced training and educational programs. Statewide, 2,663 participants were served; 86% of them received training. The Dislocated Worker population was served with JTPA Title III funds. Unlike the JTPA Title II-A and Title II-C populations, each targeted because of weak or non-existent work histories, the Title III customers usually had solid prior employment records. But, for reasons largely beyond employee control, a business closed or moved, or a particular product or service component within a continuing business was terminated. Statewide, of the 11,028 participants served, 66% were Unemployment Insurance recipients. Of those served, 65% received training and 87% entered employment. Under JTPA, and now under WIA, the State (DLLR) is required to report to the U.S.DOL on the core indicators of performance for adult, dislocated worker, and youth programs. Under WIA, fifteen core measures apply to the adult, dislocated worker and youth programs, and two measures of customer satisfaction apply across these three funding streams for a total of 17 required measures. The core performance measures are the key measures of success in achieving the legislative goals of WIA. The measures are used to: set agreed upon performance goals on a State and local level; ensure comparability of state performance results to maintain objectivity in measuring results for incentive and sanction determinations; and provide information for system wide reporting and evaluation for program improvement.

39
In Fiscal Year 2002, the State exceeded federal performance requirements for 15 of the 17 measures and was within 80% of the federal requirement for the other 2 measures. It is important to note that the U.S.DOL considers performance within 80% of the requirement as “meeting the requirement” and eligible for incentive payments. The following chart reflects State performance for Fiscal Year 2002: State State Standard Performance
Program Participants 68% 85.1% Customer
Satisfaction Employers 66% 85.5% Adults 70% 96.5% Dislocated Workers
76% 95.2%
Entered Employment Rate
Older Youth 62% 59.6% Adults 79% 96.8% Dislocated Workers 83% 98.1%
Older Youth 75% 87.7%
Retention Rate
Younger Youth 50.2% 69.3% Adults $3,181 $3,980 Dislocated Workers
91% 128%
Earnings Change/ Replacement in Six Months
Older Youth $2,688 $2,783 Adults 61% 87.1% Dislocated Workers 60% 90.1%
Older Youth 50.0% 56.8%
Credential/ Diploma Rate
Younger Youth 56% 47.2% Skill Attainment Rate Younger Youth 73% 94.4%

40
A.2.2 JTPA Local Workforce Investment Area Charts and Statements
Statewide
JOB TRAINING PARTNERSHIP ACT (JTPA)LOCAL WORKFORCE INVESTMENT AREA: STATEWIDE
FIVE-YEAR EARNINGS TREND BY JTPA TITLE
$0
$5,000
$10,000
$15,000
$20,000
$25,000
Annual Median July 97-June 98
Annual Median July 98-June 99
Annual Median July 99-June 00
Annual Median July 00-June 01
Annual Median July 01-June 02
Med
ian
Infl
atio
n A
dju
sted
An
nu
al $
Adults
Youth
DislocatedWorker
Source: The Jacob France Institute, University Of Baltimore. Data provided by Maryland Department Of Labor, Licensing And Regulation.

41
Anne Arundel Workforce Development Corporation
The Anne Arundel Workforce Development Corporation (AAWDC) is a private, nonprofit
organization that coordinates, plans, and oversees Workforce Investment Act programs in Anne
Arundel County. For over 25 years, it has been dedicated to providing quality services to the
residents and businesses in Anne Arundel County.
GWIB’s 1990’s JTPA earnings-trend analysis illustrates AAWDC’s success during this
period in helping Anne Arundel County’s economically disadvantaged residents to begin their
journey toward self-sufficiency. In addition, AAWDC has a long-term commitment to developing
and implementing programs that engage and guide youth down the path to employment and
productive citizenship. We also have assisted numerous adults who have lost their jobs due to
an unstable economy.
In 2003, AAWDC works with a broad spectrum of county residents, including public
school students, high school dropouts, the economically disadvantaged, and individuals
impacted by corporate downsizing and closings. AAWDC responds to the needs of area
residents and businesses by supporting a variety of initiatives that promote and sustain the
economic viability of Anne Arundel County and Maryland. AAWDC provides these clients with
individualized career guidance, training assistance, and job-search support. As a result of these
efforts, 97% of our adult clients re-entered the workforce, according to our most recent
performance reports. These individuals filled essential jobs that support and sustain the local
economy.
JOB TRAINING PARTNERSHIP ACT (JTPA)LOCAL WORKFORCE INVESTMENT AREA: ANNE ARUNDEL COUNTY
FIVE-YEAR EARNINGS TREND BY JTPA TITLE
$0
$5,000
$10,000
$15,000
$20,000
$25,000
$30,000
Annual Median July97- June 98
Annual Median July98- June 99
Annual Median July99- June 00
Annual Median July00- June 01
Annual Median July01- June 02
Med
ian
Infl
atio
n A
dju
sted
An
nu
al $
Adults
Youth
DislocatedWorker
Source: The Jacob France Institute, University Of Baltimore. Data provided by Maryland Department Of Labor, Licensing And Regulation.

42
Mayor’s Office of Employment Development
Mayor Martin O’Malley has designated the Mayor’s Office of Employment Development (MOED) as the local entity charged with coordinating and directing all workforce development initiatives for the City of Baltimore. In concert with the Baltimore Workforce Investment Board, a dynamic group of top business, education and community leaders, MOED is committed to building a workforce development system in Baltimore that responds to both sides of the workforce equation-businesses and job seekers. Partnerships are key to the success of the City’s local workforce efforts. MOED complements the work of the Baltimore Development Corporation, the city’s economic development agency, through its Employ Baltimore arm, which offers both existing and potential employers access to a large pool of qualified job candidates and a full menu of outreach, recruitment, screening and customized training support services. And, with a diverse array of state and local human services providers conveniently located at all four of MOED’s One Stop Career Centers, job seekers, dislocated workers and career changers are able to benefit from multiple employment assistance and training resources under one roof. Annually, over 16,000 City residents visit the One Stops to take advantage of the centers’ no cost on site workforce services---labor market information, open job listings, state of the art computer training labs, internet and e-mail access, professional career counselors , GED classes, financial seminars, EITC tax credit support, and enrollment in occupational skills training accounts. In FY 02, more than 6,000 adults were directly placed in jobs and more than 5,500 teens were linked to valuable summer work and learning experiences through the one stop system. In FY 02, MOED also worked with over 2,300 companies, large and small, hosting job fairs and staffing hiring halls, brokering customized training opportunities for new and incumbent workers, and helping several industries look at ways to minimize their costs of recruitment and hiring practices. In many instances, MOED assisted businesses negatively impacted by the economy in their efforts to provide outplacement support to laid off employees. And, MOED helped all businesses who were awarded city contracts to meet their First Source Hiring Agreements by hiring MOED referred City residents. While MOED is responsible for the oversight of WIA funds which support the One Stop Centers and Employ Baltimore services, it has actively secured many federal and state grants that support a number of the city’s workforce priorities. Of note is the multi-million dollar Youth Opportunity grant, which has allowed MOED to focus on building its future workforce by serving over 2,700 young residents of city’s Empowerment Zones, the most economically distressed areas of Baltimore. Another significant award, Skills-Based Training for Employment Promotion (STEP), is enabling MOED and its workforce board to implement a career ladder strategy that is providing opportunities to low wage working parents in typically entry-level positions in the health care industry to gain higher skills and access better paid jobs. Prior to WIA, the JTPA dollars focused only on the economically disadvantaged, unemployed, and low skilled job seekers. These target populations were clearly the hardest to employ, facing documented barriers including illiteracy, teen parenting, low reading and math levels, and high dropout rates. Despite those challenges, MOED’s involvement with these populations, as indicated by the chart below, yielded results that indicate that effective training leads to higher earnings. Even with the onset of WIA, Baltimore City continues to focus many of its efforts on these populations.

43
JOB TRAINING PARTNERSHIP ACT (JTPA)LOCAL WORKFORCE INVESTMENT AREA: BALTIMORE CITY
FIVE-YEAR EARNINGS TREND BY JTPA TITLE
$0
$5,000
$10,000
$15,000
$20,000
$25,000
Annual Median July97- June 98
Annual Median July98- June 99
Annual Median July99- June 00
Annual Median July00- June 01
Annual Median July01- June 02
Med
ian
Infl
atio
n A
dju
sted
An
nu
al $
Adults
Youth
DislocatedWorker
Source: The Jacob France Institute, University Of Baltimore. Data provided by Maryland Department Of Labor, Licensing And Regulation.

44
Baltimore County Workforce Investment Area Narrative Information not provided
JOB TRAINING PARTNERSHIP ACT (JTPA)LOCAL WORKFORCE INVESTMENT AREA: BALTIMORE COUNTY
FIVE-YEAR EARNINGS TREND BY JTPA TITLE
$0
$5,000
$10,000
$15,000
$20,000
$25,000
$30,000
Annual Median July97- June 98
Annual Median July98- June 99
Annual Median July99- June 00
Annual Median July00- June 01
Annual Median July01- June 02
Med
ian
Infl
ated
Ad
just
ed A
nn
ual
$
Adults
Youth
DislocatedWorker
Source: The Jacob France Institute, University Of Baltimore. Data provided by Maryland Department Of Labor, Licensing And Regulation.

45
Frederick County Job Training Agency (JTA) Frederick County JTA is proud to contribute Maryland’s Workforce Investment system; one which is accountable and responsive to its customers, its business led Workforce Development Board, local elected officials, and state and federal government in delivering a wide array of employment and training services to diverse population groups in our area. JTA is recognized for its collaborative spirit and reputation for success in its commitment to workforce excellence and its brokering of Frederick County’s workforce development resources. JTA’s Career Center served over 2,000 customers last year and responded to 18 county businesses which laid off 695 employees due to downsizing or plant closing. For every $1.00 invested in training job seekers, $2.39 was returned to the local economy. Investment in training our workforce is indeed working in Frederick County.
JOB TRAINING PARTNERSHIP ACT (JTPA)LOCAL WORKFORCE INVESTMENT AREA: FREDERICK COUNTY
FIVE-YEAR EARNINGS TREND BY JTPA TITLE
$0
$5,000
$10,000
$15,000
$20,000
$25,000
$30,000
Annual Median July 97-June 98
Annual Median July 98-June 99
Annual Median July 99-June 00
Annual Median July 00-June 01
Annual Median July 01-June 02
Med
ian
Infl
atio
n A
dju
sted
An
nu
al $
Adults
Youth
DislocatedWorker
Source: The Jacob France Institute, University Of Baltimore. Data provided by Maryland Department Of Labor, Licensing And Regulation.

46
Lower Shore Workforce Investment Area
The Lower Shore Workforce Investment Area encompasses Somerset, Worcester, and Wicomico Counties. The geographical scope of the area is 1177 square miles or approximately 12% of the land area of the state. The population of the Lower Shore Workforce Investment Area is 155,934 people or approximately 3% of the population of the state. Taken together, the land area and population indicate a rural area.
The Lower Shore economy is changing. The area has evolved from a natural resource based economy to a manufacturing based economy to most recently, a service-based economy. Hospitality and healthcare are emerging as the growth engines in the Lower Shore economy. Farming, fishing and manufacturing are declining.
The Lower Shore economy has historically been characterized by wages that lag behind the wages in other regions in the state. As the service economy has evolved, wages have remained low. Simultaneously, the region is evolving as an attractive area for retirees. These relatively affluent residents increase measures of per capita income and increase the need for healthcare and other services.
Against the backdrop of a rural service based economy, the Lower Shore Workforce Investment Board strives to provide the highest quality workforce services to the three county Lower Shore areas allowing opportunities for advancement to workers of all ages and skill levels and meeting the current and future needs of local employers. The data contained in the Governor's Workforce Investment Board Occupational Study indicates the success of the Lower Shore and the Maryland job training, job placement and job retention system.
JOB TRAINING PARTNERSHIP ACT (JTPA)LOCAL WORKFORCE INVESTMENT AREA: LOWER SHORE
FIVE-YEAR EARNINGS TREND BY JTPA TITLE
$0
$2,000
$4,000
$6,000
$8,000
$10,000
$12,000
$14,000
$16,000
$18,000
$20,000
Annual Median July97- June 98
Annual Median July98- June 99
Annual Median July99- June 00
Annual Median July00- June 01
Annual Median July01- June 02
Med
ian
Infl
atio
n A
dju
sted
An
nu
al $
Adults
Youth
DislocatedWorker
Source: The Jacob France Institute, University Of Baltimore. Data provided by Maryland Department Of Labor, Licensing And Regulation.

47
Mid-Maryland Workforce Investment Area
Mid-Maryland Workforce Investment Area, comprised of Carroll and Howard Counties, serves a highly mobile combined workforce of 320,000. Approximately 11,000 businesses have access to these workers. Carroll County’s commuting patterns show that up to 62% of the workforce population work outside of the county, primarily for higher pay. In addition to those 57,500 residents who remain in the county to work, Howard County businesses employ 77,500 workers coming into the county for jobs and 93,700 residents travel to the Baltimore Metro and Montgomery county areas for work. Both counties provide a superior quality of life with traditionally low unemployment rates.
Both counties enjoy a reputation for excellent public school systems supported by strong community college and higher education institutions. Over 85% of Carroll’s population earns a high school diploma or equivalent with about 23% of the graduates entering the workforce upon completion. Ninety-two percent of Howard county’s population possesses at least a high school education or equivalent with 9% entering the workforce after graduation. Howard’s median household income is the highest within the state.
Given the above strengths and commonalities of the region, the Mid-Maryland workforce challenges focus on the brokering of services to keep up with the marketplace demands for new skills within the inherent industrial and business diversity of the area. Carroll County’s comprehensive One-Stop, (the Business and Employment Resource Center), is structured under the Office of Economic Development, thus enabling a window for providing direct labor/staff development services to employers. Developing partnerships that integrate joint case management services with other agencies serving the same potential workers is the foundation for improved service delivery in both counties. The One-Stop office in Columbia became the pilot CareerNet resource site providing the gamut of job readiness and career transition services. Through the use of MetroTech’s alternative funding, Howard County businesses have developed training partnerships with Employment and Training to provide an additional amount of $465,000 for skills upgrades of incumbent workers or training for new hires.
Together the counties of Mid-Maryland, through the organizations of BERC and Employment & Training, make a measurable impact with business customers and with people needing workforce services in order to meet the local labor market needs.
JOB TRAINING PARTNERSHIP ACT (JTPA)LOCAL WORKFORCE INVESTMENT AREA: MID MARYLAND
FIVE-YEAR EARNINGS TREND BY JTPA TITLE
$0
$5,000
$10,000
$15,000
$20,000
$25,000
Annual Median July97- June 98
Annual Median July98- June 99
Annual Median July99- June 00
Annual Median July00- June 01
Annual Median July01- June 02
Med
ian
Infl
atio
n A
dju
sted
An
nu
al $
Adults
Youth
DislocatedWorker
Source: The Jacob France Institute, University Of Baltimore. Data provided by Maryland Department Of Labor, Licensing And Regulation.

48
Montgomery County Workforce Investment Area
Since 2002, the Montgomery County Division of Workforce Investment Services (DWIS), a division of the County’s Department of Economic Development, has administered workforce investment programs throughout the County. The central mission is to develop a local workforce development plan for Montgomery County and to oversee the performance of the local workforce investment system. This includes the administration all federal workforce and job training funds and the oversight of two, one-stop career centers. The Division has a 30 member business led Workforce Investment Board, appointed by the County Executive, that provides policy guidance to the County. Members include business executives; the County’s Economic Development Director, other high level State and local appointed officials, executives of community based organizations, and organized labor leaders. Its primary funding is from the United States Department of Labor, the Maryland State Department of Labor, Licensing, and Regulation, and Montgomery County government. The Division oversees several core initiatives. They are Montgomery Works, the County’s one-stop employment and training system with locations in Wheaton and Gaithersburg. Last year these centers served over 23,000 citizens, received over 10,000 employer job orders and placed 3,900 people in jobs. Montgomery Works is also a virtual career center at www.montgomeryworks.com -- that last year received over 700,000 visitors, enabling citizens to access a wide array of workforce services electronically. Another initiative, Montgomery Youth Works was established to provide youth with meaningful employment and training opportunities. Last year Montgomery Youth Works placed over 300 at-risk youth in subsidized jobs and trained over 2,400 youth. Other initiatives include the provision of general career exploration services to any citizen seeking job search assistance or training, unique job training programs to serve low income and the working poor, and technology based training programs to meet the employment needs of the County’s growing information and bio technology businesses.
The data presented in this study shows significant increases in the earnings of dislocated workers and the hardest to serve adult clients with multiple barriers to employment under the JTPA program. This demonstrates the success of the County’s commitment in serving the hardest to serve population, the strength of Montgomery County’s vibrant economy, and the strong business partnerships forged with the local employment and training system.
JOB TRAINING PARTNERSHIP ACT (JTPA)LOCAL WORKFORCE INVESTMENT AREA: MONTGOMERY COUNTY
FIVE-YEAR EARNINGS TREND BY JTPA TITLE
$0
$5,000
$10,000
$15,000
$20,000
$25,000
$30,000
Annual Median July97- June 98
Annual Median July98- June 99
Annual Median July99- June 00
Annual Median July00- June 01
Annual Median July01- June 02
Med
ian
Infl
atio
n A
dju
sted
An
nu
al $
Adults
DislocatedWorker
Source: The Jacob France Institute, University Of Baltimore. Data provided by Maryland Department Of Labor, Licensing And Regulation.

49
Prince George’s Workforce Services Corporation (WSC)
The Prince George’s Workforce Services Corporation (WSC) has a twenty year
history of effectively serving the needs of business for skilled, trained workers. The corporate Board of Directors has guided the service delivery system to one that is business driven and responsive to the identified needs of industry sectors. The Workforce Development Partnership organizes the supply side of the workforce development equation. Members of the Partnership include the County Economic Development Corporation, Prince George’s County Public Schools, the Maryland Job Service, the County Department of Social Services, Prince George’s Community College, University of Maryland College Park, University of Maryland University College, Bowie State University, Capitol College, TESST College of Technology and the Maryland Department of Business and Economic Development. Representatives of each of these partners meet monthly to develop integrated solutions to the workforce needs of business. The demand side is organized by nine Industry Advisory Committees in the following sectoral areas: Business and Finance, Technology and Manufacturing, Health Care, Hospitality, Sales and Service, Transportation, Arts, Media and Communication, Construction and Development and Public Service. There are ten to twelve business leaders on each of these Advisory Committees. They meet quarterly and look at the workforce needs of their particular industry. The development of the Workforce Services Corporation’s annual plan is guided by the input from these committees. WSC has a goal of investing training dollars when industry has identified needs as well as jobs that trainees will fill. This approach to workforce development in Prince George’s County will result in ever improving earnings for those the corporation serves.
JOB TRAINING PARTNERSHIP ACT (JTPA)LOCAL WORKFORCE INVESTMENT AREA: PRINCE GEORGE'S COUNTY
FIVE-YEAR EARNINGS TREND BY JTPA TITLE
$0
$2,000
$4,000
$6,000
$8,000
$10,000
$12,000
$14,000
$16,000
$18,000
$20,000
Annual Median July97- June 98
Annual Median July98- June 99
Annual Median July99- June 00
Annual Median July00- June 01
Annual Median July01- June 02
Med
ian
Infl
atio
n A
dju
sted
An
nu
al $
Adults
Youth
DislocatedWorker
Source: The Jacob France Institute, University Of Baltimore. Data provided by Maryland Department Of Labor, Licensing And Regulation.

50
Southern Maryland Works
The Southern Maryland Workforce Investment Board, also known as Southern Maryland Works, Inc., is a regional not for profit consortium representing St. Mary’s Charles and Calvert counties workforce development community. Our mission is to support a thriving Southern Maryland economy by addressing the workforce investment needs of employers and job seekers. Increased per capita income, a higher percentage fully employed workers, and fewer vacant jobs will ultimately be or measure of performance. Our vision is that the Southern Maryland region will have and continue to develop a dynamic workforce to meet the economic and social growth needs of the area.
As this report highlights, the sustained investment in the creation and renewal of worker skills is not only critical, but is a proven return on investment for business and community. Businesses have responded to the impact of these local programs by engaging displaced workers, new first-time workers and youth in employment with continued learning opportunities. Southern Maryland Works coordinates its efforts with the Southern Maryland Economic Development Association, Boards of Education, Post-secondary educational institutions, Dept. of Social Services, Dept. of Rehabilitation Services and other state and community organizations. These efforts ensure maximization of dollars, seamless delivery of customer service and regional involvement in workforce investment issues. The philosophy of customer choice allows SMW to individualize and customize services based on the needs of the individual job seeker or employer. Our role to impact the Southern Maryland region as a convener of workforce related issues is an integral one to the current and ongoing ability of Southern Maryland to retain and attract business, and to ensure reliable availability of needed skills in the workforce.
JOB TRAINING PARTNERSHIP ACT (JTPA)LOCAL WORKFORCE INVESTMENT AREA: SOUTHERN MARYLAND
FIVE-YEAR EARNINGS TREND BY JTPA TITLE
$0
$5,000
$10,000
$15,000
$20,000
$25,000
Annual Median July97- June 98
Annual Median July98- June 99
Annual Median July99- June 00
Annual Median July00- June 01
Annual Median July01- June 02
Med
ian
Infl
atio
n A
dju
sted
An
nu
al $
Adults
Youth
DislocatedWorker
Source: The Jacob France Institute, University Of Baltimore. Data provided by Maryland Department Of Labor, Licensing And Regulation.

51
Susquehanna Workforce Network, Inc. (SWN)
The Susquehanna Workforce Network, Inc. (SWN) is a private, nonprofit corporation directed by a Board that oversees, coordinates, or plans workforce development programs and services for businesses and individuals in Cecil and Harford Counties. SWN represents an affiliation of over 50 local businesses, organizations, and agencies that work collaboratively to implement and maintain a system of education, training, employment, and outreach initiatives responsive to local economic challenges and designed to meet the needs of businesses, workers, and youth. SWN develops solutions that maximize worker potential and regional economic success. Although clearly limited, the results of the Earnings Trends Analysis reflect what we long have believed: job training programs fundamentally are positive economic strategies with redeeming social value. Under WIA, SWN continues to coordinate targeted economic development efforts through workforce development activities designed to engage youth, prepare workers, and mitigate local business challenges. In addition to job search assistance, employment planning, and skill training, job seekers have access to instructional sessions designed to improve their employability, such as through the Job Readiness Institute. Likewise, our Business Services staff conducts community-wide outreach and personalized representation to support the region’s commercial sector. Our efforts emphasize solving workforce problems and addressing competitive, operational, or economic issues that otherwise might inhibit growth or profitability.
JOB TRAINING PARTNERSHIP ACT (JTPA)LOCAL WORKFORCE INVESTMENT AREA: SUSQUEHANNA
FIVE-YEAR EARNINGS TREND BY JTPA TITLE
$0
$5,000
$10,000
$15,000
$20,000
$25,000
Annual Median July97- June 98
Annual Median July98- June 99
Annual Median July99- June 00
Annual Median July00- June 01
Annual Median July01- June 02
Med
ian
Infl
atio
n A
dju
sted
An
nu
al $
Adults
Youth
DislocatedWorker
Source: The Jacob France Institute, University Of Baltimore. Data provided by Maryland Department Of Labor, Licensing And Regulation.
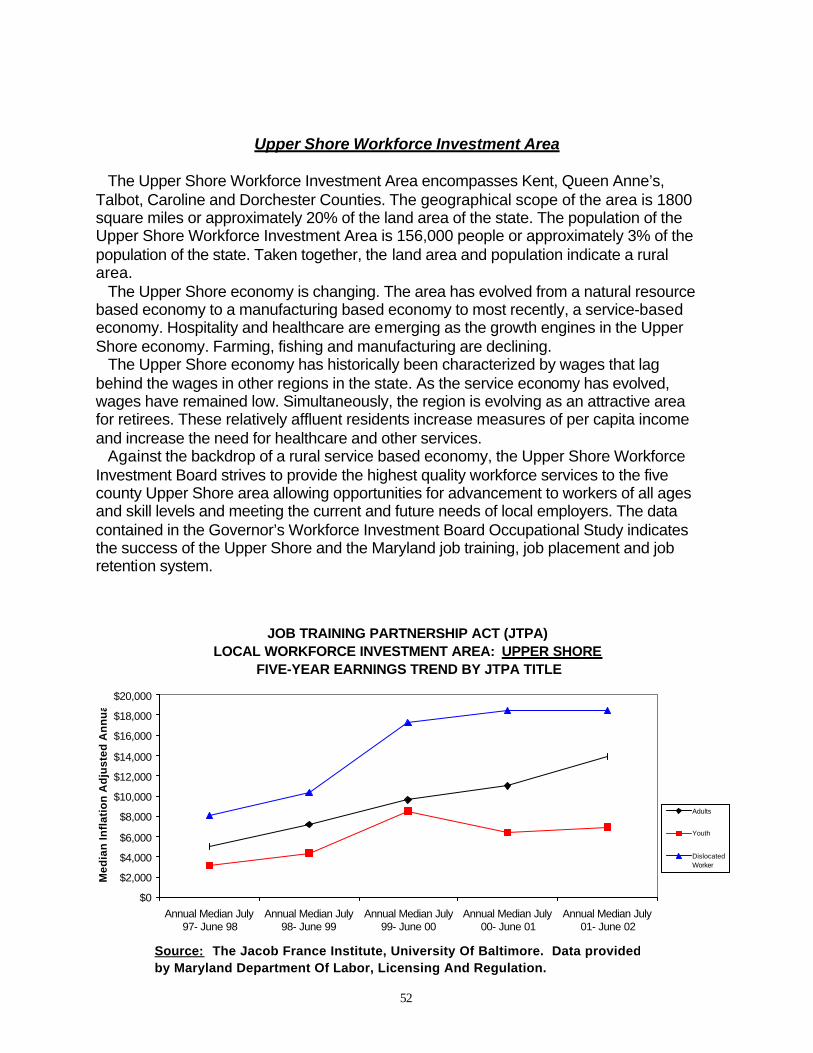
52
Upper Shore Workforce Investment Area
The Upper Shore Workforce Investment Area encompasses Kent, Queen Anne’s, Talbot, Caroline and Dorchester Counties. The geographical scope of the area is 1800 square miles or approximately 20% of the land area of the state. The population of the Upper Shore Workforce Investment Area is 156,000 people or approximately 3% of the population of the state. Taken together, the land area and population indicate a rural area. The Upper Shore economy is changing. The area has evolved from a natural resource based economy to a manufacturing based economy to most recently, a service-based economy. Hospitality and healthcare are emerging as the growth engines in the Upper Shore economy. Farming, fishing and manufacturing are declining. The Upper Shore economy has historically been characterized by wages that lag behind the wages in other regions in the state. As the service economy has evolved, wages have remained low. Simultaneously, the region is evolving as an attractive area for retirees. These relatively affluent residents increase measures of per capita income and increase the need for healthcare and other services. Against the backdrop of a rural service based economy, the Upper Shore Workforce Investment Board strives to provide the highest quality workforce services to the five county Upper Shore area allowing opportunities for advancement to workers of all ages and skill levels and meeting the current and future needs of local employers. The data contained in the Governor’s Workforce Investment Board Occupational Study indicates the success of the Upper Shore and the Maryland job training, job placement and job retention system.
JOB TRAINING PARTNERSHIP ACT (JTPA)LOCAL WORKFORCE INVESTMENT AREA: UPPER SHORE
FIVE-YEAR EARNINGS TREND BY JTPA TITLE
$0
$2,000
$4,000
$6,000
$8,000
$10,000
$12,000
$14,000
$16,000
$18,000
$20,000
Annual Median July97- June 98
Annual Median July98- June 99
Annual Median July99- June 00
Annual Median July00- June 01
Annual Median July01- June 02
Med
ian
Infl
atio
n A
dju
sted
An
nu
al $
Adults
Youth
DislocatedWorker
Source: The Jacob France Institute, University Of Baltimore. Data provided by Maryland Department Of Labor, Licensing And Regulation.

53
Western Maryland Consortium (WMC)
The Western Maryland Consortium (WMC) is an instrumentality of the local county governments of Allegany, Garrett and Washington counties. It has functioned as a regional organization since its formation in 1974, serving the unemployed youth and adult populations and the dislocated workers of the region under various U. S. Department of Labor programs including CETA, JTPA and WIA.
The success of the local programs, as evidenced in the accompanying graph, is due in large measure to the successful partnerships with the education community, human service organizations, community based organizations and the large number of employers who hire our program participants.
While worker dislocation remains an on-going challenge, particularly in the manufacturing sector, the Western Maryland Consortium continues to successfully return dislocated workers to the workplace with new or enhanced skills that allow them to regain and surpass their previous earnings level. It is important to note that the current retention rate of dislocated workers after six (6) months beyond placement is 100%. This same retention rate has been achieved by youth and adult program completers.
JOB TRAINING PARTNERSHIP ACT (JTPA)LOCAL WORKFORCE INVESTMENT AREA: WESTERN MARYLAND
FIVE-YEAR EARNINGS TREND BY JTPA TITLE
$0
$2,000
$4,000
$6,000
$8,000
$10,000
$12,000
$14,000
$16,000
$18,000
$20,000
Annual Median July97- June 98
Annual Median July98- June 99
Annual Median July99- June 00
Annual Median July00- June 01
Annual Median July01- June 02
Med
ian
Infl
atio
n A
dju
sted
An
nu
al $
Adults
Youth
DislocatedWorker
Source: The Jacob France Institute, University Of Baltimore. Data provided by Maryland Department Of Labor, Licensing And Regulation.

54
A.3 Apprenticeship Program Statewide Descriptive Statement America’s national apprenticeship system has its origin in the National Apprenticeship Act of 1937 known also as the Fitzgerald Act. Under this act, the U.S. Secretary of Labor is authorized and directed to formulate and promote the furtherance of labor standards necessary to safeguard the welfare of apprentices, to extend the application of such standards by encouraging the inclusion thereof in contracts of apprenticeship, to bring together employers and labor for the formulation of programs of apprenticeship, to cooperate with State agencies engaged in the formulation and promotion of standards of apprenticeship, and to cooperate with the U.S. Secretary of Education in accordance with the act. The National Apprenticeship Act built upon existing U.S. Department of Labor efforts to promote and encourage apprenticeship training for “youths.” The roots of the modern apprenticeship system go back to the centuries-old concept of contracts of apprenticeship between masters and their apprentices in a trade or craft. The U.S. Department of Labor established a Bureau of Apprenticeship and Training (BAT), now a part of the Office of Apprenticeship Training, Employer and Labor Services, to carry out the mandate of the National Apprenticeship Act. In states where there is no recognized State apprenticeship registration agency, BAT promotes, develops and registers local apprenticeship program sponsors. BAT has direct responsibility for certain large apprenticeship programs that are national in their scope of operation as well. BAT also registers industry formulated national guideline Standards of Apprenticeship which then become a basis for local apprenticeship programs; thus assuring that local apprenticeship programs are adequate to meet the needs of industry and providing a degree of consistency in training within an industry nationwide. BAT recognizes over 850 occupations as requiring a sufficient level of skills and technical knowledge as to be recognized as apprenticeable with new occupations regularly being reviewed for inclusion on the list at the request of industry. The National Apprenticeship Act encourages cooperation with State agencies in the formulation and promotion of standards of apprenticeship. In 27 States, the District of Columbia, Puerto Rico and the Virgin Islands, State Apprenticeship Councils/Agencies are recognized by BAT as apprenticeship registration agencies for “federal purposes” and are monitored each year by BAT for compliance with federal apprenticeship and training law and regulations. Maryland is among the States that have a recognized State Apprenticeship Council. Legislation creating the Maryland Apprenticeship and Training Council was enacted by the General Assembly in 1962. Maryland became a member of the National Association of State and Territorial Apprenticeship Directors (NASTAD) in 1964. The work of the Council is supported by the Maryland Apprenticeship and Training Program which is situated within the Division of Labor and Industry, a division of DLLR.

55
In order for an occupation to be recognized as being apprenticeable, it must be sufficiently skilled so as to require a minimum of one year of on-the-job training. Apprenticeships in Maryland range in length from one to five years depending upon the occupation. Most recognized occupations require three, four or five years of training depending upon the occupation.
By regulation, each year of on-the-job training must be accompanied by not less than 144 hours of related classroom instruction covering technical aspects of the occupation. This classroom instruction is usually provided at a local community college or by the apprenticeship program sponsor in conjunction with a local community college. Apprenticeship training is based in the workplace in both the private and public sectors. An apprenticeship program sponsor may be a single employer, an association of employers or a joint labor-management apprenticeship committee. All proposed apprenticeship programs must be reviewed by the Council for the adequacy of the content of the proposed training as well as consistency of program administration with Maryland Apprenticeship and Training law and regulations before they can begin to employ, train and register individual apprentices. Under apprenticeship, the employer-employee relationship between the apprentice and the apprentice’s sponsor is established at the beginning of the apprenticeship, thus assuring that apprentices will have the opportunity for continued employment in the occupation for which they are being trained. Apprentices earn regular wages over the entire course of their training; typically starting at about 50% of the wage rate of a fully qualified worker or journeyperson and advancing at regular intervals to approximately 80% to 90% of the journeyperson wage rate in the final interval prior to completion. Upon completion, apprentices advance to the journeyperson wage and are awarded a Certificate of Completion of Apprenticeship that is a nationally recognized employment credential. More and more the Certificate of Completion of Apprenticeship is also becoming a steppingstone to even further career advancement as local community colleges implement the granting of academic credit towards an Associates degree for the successful completion of apprenticeship training. In Maryland, approximately 78% of all apprentices are in the building and construction industry, 2% are in manufacturing and the remainder are in services and other industries. This distribution of apprentices is consistent with the distribution of apprentices nationally.

56
A.4 Community Colleges A.4.1 Statewide Descriptive Statement
Community College Analysis Allegany College of Maryland Anne Arundel Community College Baltimore City Community College The Community College of Baltimore County Carroll Community College Cecil Community College Chesapeake College College of Southern Maryland Frederick Community College Garrett Community College Hagerstown Community College Harford Community College Howard Community College Montgomery College Prince George’s Community College Wor-Wic Community College
Maryland Community Colleges
Maryland’s 16 community colleges are vital to the State’s education and economic development policies. In fact, the Maryland State Plan for Postsecondary Education describes community colleges as the primary provided of workforce training. As our businesses and industries demand more
programs and education services that blend both academic and applied knowledge, community colleges have stepped forward to supply these services to Maryland citizens.
Maryland community colleges have a presence in every county. From multiple campuses, extension centers and satellite locations in local schools, community and senior centers and training programs in local businesses, community colleges are serving the citizens of Maryland and its business community. Community colleges provide credit and continuing education instruction in areas of technical, career and workforce development training, transfer preparation for a baccalaureate program, and lifelong learning opportunities, in a variety of instructional formats including distance learning classes, making educational access available to even remote areas of the state. Last year, community colleges across the State enrolled over 350,000 students. Approximately 150,000 enrolled in credit instruction while continuing education and workforce development courses enrolled 200,000 students. Maryland’s community college’s enroll over 54 percent of all undergraduates attending public and private institutions and are the primary provider of workforce development training. The core mission of Maryland community colleges is to provide a diverse range of education services, with particular emphasis on community-centered programs and programs that afford open access to persons with a variety of educational backgrounds. In accordance with the role envisioned by the legislature, Maryland community colleges are comprehensive institutions serving their immediate

Governor’s Workforce Investment Board Graduate Outcomes Study College Analysis
57
communities. These institutions offer a flexible, lower cost higher education alternative to accommodate the needs of a wide variety of students and provide training and re-training services to business and industry in the region. Every community college in Maryland provides custom-designed and regularly scheduled programs for businesses, government agencies, and professional and labor organizations in their regions. These programs include specific fields of vocational, technical and apprenticeship training, quality management training for all levels of supervisors, retirement planning, basic skills training, and certification courses for many professional organizations and career areas. Fifteen of the sixteen Maryland community colleges are funded through a State appropriation (approximately 26%), local funding through a negotiated process (35%), and student tuition and fees (36%). In fiscal year 2001, over $500 million dollars in revenue were received from all sources by the 15 community colleges. Baltimore City Community College is a state institution and receives the majority of its funding from the State through a funding formula. Value Added from a Maryland Community College Credential The Governor’s Workforce Investment Board’s training outcomes project provided a unique opportunity for all Maryland community colleges to receive wage data on its career program graduates. Unlike most traditional bachelor’s degree recipients, community college graduates are typically older individuals, working full-time while attending a community college and already employed when they received their credential. Annual median wage information, adjusted for inflation, is provided for all career program graduates between 1995 and 2000. Two thirds of these graduates received a credential in health services (37%) or business (25%). The remaining credentials are in public service (17%), information technology (10%), mechanical and engineering technology (8%) or natural science (2%). Findings: At least 75 percent of Maryland career graduates were matched to the Maryland unemployment insurance system and are working in Maryland the year after graduation. Most of those not matched to earnings record were working in Maryland but were not identified because self-employment, salaries based on commission, contractual employees or those working for the Department of Defense or other federal government agency are not included in the Maryland database. Statewide, the median career program graduate salary increased 25% between the first year after graduation to the third year after graduation. The chart below indicates that earnings after graduation increased dramatically for each of the six program areas with the largest increase being in the year immediately after graduation. The career area with the greatest impact on pre- and post- graduation earnings was health sciences where a community college degree and a licensing credential can open the doors to significant employment opportunities. Maryland community colleges are leaders in preparing nursing professionals.

Governor’s Workforce Investment Board Graduate Outcomes Study College Analysis
58
Median Pre- and Post-Earnings (adjusted for inflation) of 1999 Community College Career Graduates
$0$5,000
$10,000$15,000$20,000$25,000$30,000$35,000$40,000$45,000
All CareerGraduates
Business IT & DataProcessing
Health Mech & EngTech
Natural SciTech
PublicSafety
Year Prior to Grad Year of Grad 1st year after 2nd year after 3rd year after
Maryland Community College Accountability Each Maryland community college is accountable to its students, contract-training clients, Board of Trustees, local jurisdictions, the State and federal government to provide quality instructional and educational services at a reasonable cost. Faculty are accountable to students for providing an environment that promotes learning through the use of multiple instructional strategies and technologies. The course evaluation process is one way to affirm the faculty member’s ability to meet student needs. Community colleges follow up with each business and government contract-training client to ensure satisfaction with the provided services. Boards of trustees are apprised of current fiscal, operational, academic issues through regular meetings and reports on institutional progress in meeting current year operational plans and long-term strategic plan objectives. During the local budget process, many jurisdictions ask community colleges to demonstrate fiscal responsibility and institutional effectiveness. Each year community colleges submit reports to the Maryland Higher Education Commission (MHEC) that demonstrate institutional attainment of benchmarks in the areas of accessibility and affordability, learner-centered focus for student success, diversity, support of regional economic and workforce development, effective use of public funds and community outreach and service. The complete set of community college accountability reports are available on MHEC’s Web site – www.mhec.state.md.us In addition, MHEC requires colleges to respond to programs it identifies as non-productive enrollment and degree-generating programs. MHEC has also set statewide goals for community colleges that are reported as part of the State budget process. Community colleges are responsible for meeting a variety of federal government reporting requirements to maintain Title IV federal financial aid eligibility and to demonstrate performance of grant requirements. The bottom line is that community colleges career graduates are increasing their standard of living, increasing their economic purchasing power and are actively supporting Maryland’s tax base after graduation.

Governor’s Workforce Investment Board Graduate Outcomes Study College Analysis
59
A.4.2 Individual Community College Descriptive Statements Allegany College of Maryland Allegany College of Maryland (ACM) exists to improve the lives of people by providing them with quality, higher education opportunities and support services at reasonable cost in a convenient and comfortable environment. In order to achieve its mission, the College offers career credit programs designed to provide the skills for specific employment, transfer credit programs designed to provide the first two years of a bachelor's degree, and comprehensive, continuing education offerings. The College also offers an array of student services that help support this mission and assure student success. The location of the College in the narrow neck of the Western part of the State places it in a unique situation regarding its service area. Pennsylvania is only two miles to the North and West Virginia is a mile to the South. Thus, the majority of the typical service region for commuting students is out of state. Because of the shape of Allegany County and the geographic orientation of its mountains, its economic and social systems trend North and South and are thus tri-state in nature. The service region has experienced economic problems for much of the last quarter century that set it apart from much of Maryland. It has experienced a rapid decline in high-paying manufacturing jobs during the 1980s, aggravated by the closure of Kelly Springfield (Tires), Celanese (Chemicals), and Pittsburgh Plate Glass. Through local economic development efforts, the region has become much more economically diversified than before, with a larger proportion of jobs in the services, retail trade, and government sectors. The College has been a critical element of that strategy by offering targeted educational curricula in the areas of rapidly growing fields such as Allied Health, Technology, Criminal Justice, and Hospitality. The Jacob France Institute data provided by this report show that Allegany College of Maryland career graduates are achieving a solid return on their educational investments (see figure 1 below). Three years after graduation earnings are on average between three and four times pre-graduate earnings. Moreover, graduate earnings on average exceed mean Allegany County earnings $26,127 (as indicated by data available from the Bureau of Economic Analysis Regional Economic Information System) after only five years of post-graduate job experience.
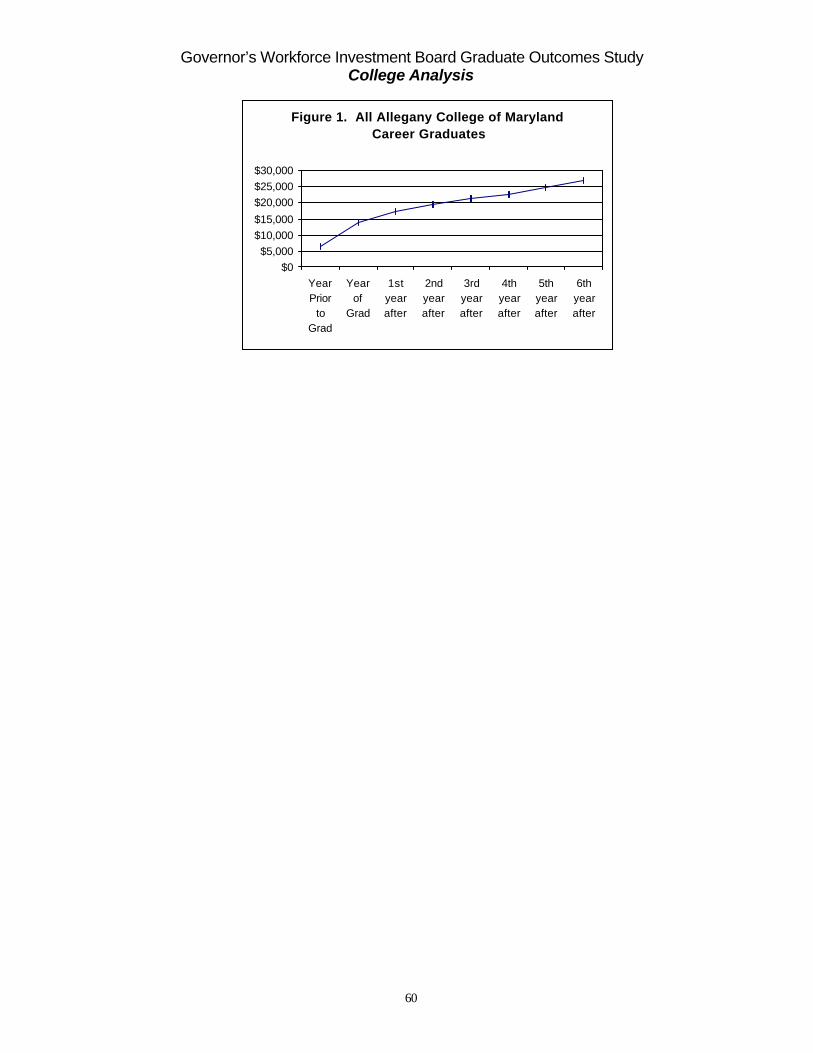
Governor’s Workforce Investment Board Graduate Outcomes Study College Analysis
60
Figure 1. All Allegany College of Maryland Career Graduates
$0
$5,000
$10,000
$15,000
$20,000
$25,000
$30,000
YearPrior
toGrad
Yearof
Grad
1styearafter
2ndyearafter
3rdyearafter
4thyearafter
5thyearafter
6thyearafter

Governor’s Workforce Investment Board Graduate Outcomes Study College Analysis
61
Anne Arundel Community College Anne Arundel Community College, a National Alliance of Business (NAB) Community College of the Year, thrives at the heart of Maryland’s Golden Triangle connecting Annapolis, Baltimore and Washington, D.C. The 2001 NAB award recognized AACC’s leadership in improving student achievement and work force effectiveness. In 2002, the National Council for Continuing Education and Training awarded a county-backed partnership with Northrop Grumman Corporation’s Electronic Systems its highest award in work force development. AACC’s first such award went to a Teacher Technology Training project, which trains county public school teachers to better use classroom technology. Maryland’s Higher Education Commission in 2002 also honored the T3 program. Six of 10 county college students attend AACC. The college awards more associate degrees than any other single-campus Maryland community college. Students choose between 85 associate degree options and 60 certificates. A record 57,169 students enrolled in FY 2002 in 2,693 credit and noncredit classes. Day, evening and weekend classes meet at the 230-acre Arnold campus, Glen Burnie Town Center, new Hospitality, Culinary Arts and Tourism Institute, a Sales and Service Training Center at Arundel Mills, and over 90 county sites, online classes, telecourses and interactive distance education classes. AACC envisions itself a premier learning community whose students are among the best-prepared citizens and workers of the world. Its mission: to provide quality higher education that’s convenient, affordable, accessible and accountable to community needs. AACC annually assesses performance measured against its five-year Strategic Plan goals, seeking ways to improve and meet changing community needs. The college surveys graduates to examine the impact of their education on employment and earnings. The data presented in this report supplement our own documentation of the value the college provides. The data clearly document that earning an AACC credential can translate to increased earnings over time.

Governor’s Workforce Investment Board Graduate Outcomes Study College Analysis
62
AACC 1999 Cohort -- Median Earnings
$0
$5,000
$10,000
$15,000
$20,000
$25,000
$30,000
$35,000
$40,000
$45,000
$50,000
2 Years Prior to Grad 1 Year Prior to Grad Year of Grad 1st year after Grad 2nd year after Grad 3rd year after Grad
All AACC Career Graduates Business Career
Information Technologies and Data Processing Health Services
Mechanical and Engineering Technology Public Safety Related Technologies

Governor’s Workforce Investment Board Graduate Outcomes Study College Analysis
63
Baltimore City Community College
The mission of Baltimore City Community College is: To educate and train a world-class workforce for Baltimore. The Baltimore City Economic Growth Strategy (2002) states, “An educated and skilled workforce is one of the most important factors in an area’s ability to attract businesses and help them grow and prosper. Therefore, building the skills of our most critical asset – our human capital – must be at the heart of Baltimore’s economic growth strategy.” Baltimore City Community College (BCCC) has responded to the workforce needs of the City of Baltimore through rising enrollment and high market share; strong partnerships with the Baltimore Public School System; academic programs that correspond with critical workforce needs; students enrolled in critical need fields; and successful graduates. The Governor’s Workforce Invest Board has identified critical workforce skill shortage areas as technology, healthcare, teaching, construction, and tourism. More than 6,000 BCCC students are enrolled in degree or certificate programs with the largest career areas of concentration being allied health, business, and information technology. During the last 10 years, a number of new academic programs have been introduced at BCCC, including Hospitality Management, Surgical Technology, LPN Nursing, Network Specialist, Management/Leadership, Teacher Certification, Dental Assisting, Construction Supervision, and Public Policy. BCCC’s expanded off-campus instructional sites include the Emerging Technology Center in Canton, Patterson High School, Northern High School, the 5th Regiment Armory, Reisterstown Plaza Center, and the new Business and Continuing Education Center at 710 E. Lombard Street. The College has two main campuses, the Liberty Campus and the Harbor Campus, and 85 off-campus sites. Thirty-nine Associate degree career programs are offered, with special emphases in health, human services, and business, and eight Associate degree transfer programs. BCCC’s Business and Continuing Education Center offers three main areas for continuing education: customized training, adult and community education, and continuing professional education. Graduates of Baltimore City Community College are successful: 93 percent of career program graduates are employed or continuing their education and pass rates on licensure exams are among the highest in the State: Dental Hygiene (100%), Registered Nursing (92 %), and Licensed Practical Nursing (100%). Today, with 7,095 credit and 12,309 non-credit students, BCCC has the highest market share of Baltimore City residents enrolled in higher education in Maryland. In the charts below we see the dramatic impact on earnings that a degree from BCCC has on all graduates and on those in the Health Sciences in particular.
Median Earnings of 2000 Graduates
$0
$5,000
$10,000
$15,000
$20,000
$25,000
$30,000
$35,000
$40,000
$45,000
FY1998 FY1999 FY2000 FY2001 FY2002
All Degrees Health Sciences
Median Earnings of 1995 Graduates
$0
$5,000
$10,000
$15,000
$20,000
$25,000
$30,000
$35,000
$40,000
$45,000
$50,000
All Degrees Health Sciences

Governor’s Workforce Investment Board Graduate Outcomes Study College Analysis
64
The Community College of Baltimore County
The Community College of Baltimore County (CCBC) is a single college, multi-campus institutions with three ethnically diverse campuses and five extension centers, all located in suburban Baltimore County, Maryland. As the largest community college in the State, CCBC is the preferred provider of undergraduate education and workforce development training in the Baltimore metropolitan area. CCBC enrolls more than half of all undergraduate Baltimore County residents and the Division of Continuing Education and Workforce Development (CEED) is a leading partner for business and industry, serving more than 175 companies annually with customized employee training. During the past fiscal year, over 73,000 individuals enrolled in a broad array of general education, transfer and career programs, and workforce development and lifelong learning at CCBE.
The College’s Strategic Plan LearningFirst focuses on measurable outcomes. The plan’s core strategic direction of student learning and its emphasis on learning support, learning college, infusing technology, creating management excellence, embracing diversity, building community, and building enrollment, drive annual high priority operational objectives. Measurable accomplishments of faculty, staff, administrators and students resulting from these objectives are used to help to improve courses and programs and to validate community support. Partnerships with local colleges, public schools, area health care facilities, business, and other organizations are key elements in the CCBC strategy for building a strong and unified presence in the Baltimore County community.
Over 78 associate degree options and 108 certificate options are available through CCBC. Career programs include accounting, automotive technology, aviation management, business, computer-aided design, computer graphics and visual communications, criminal justice, dance, environmental science, horticulture, nursing, network technology, paralegal studies, occupational therapy assistant, surveying technology and veterinary technology. Over half of students in career programs work while attending CCBC and over 90 percent are employed in their field of study within one year of graduation.
The data provided by the Jacob France Institute supports the economic value of CCBC. Career program graduate salaries increased 17 percent after graduation. Three years after graduation median salaries were double salaries prior to graduation. The program areas with the biggest impact on earnings are in the information technology and health profession where a CCBC degree opens the door to a number of important career opportunities.
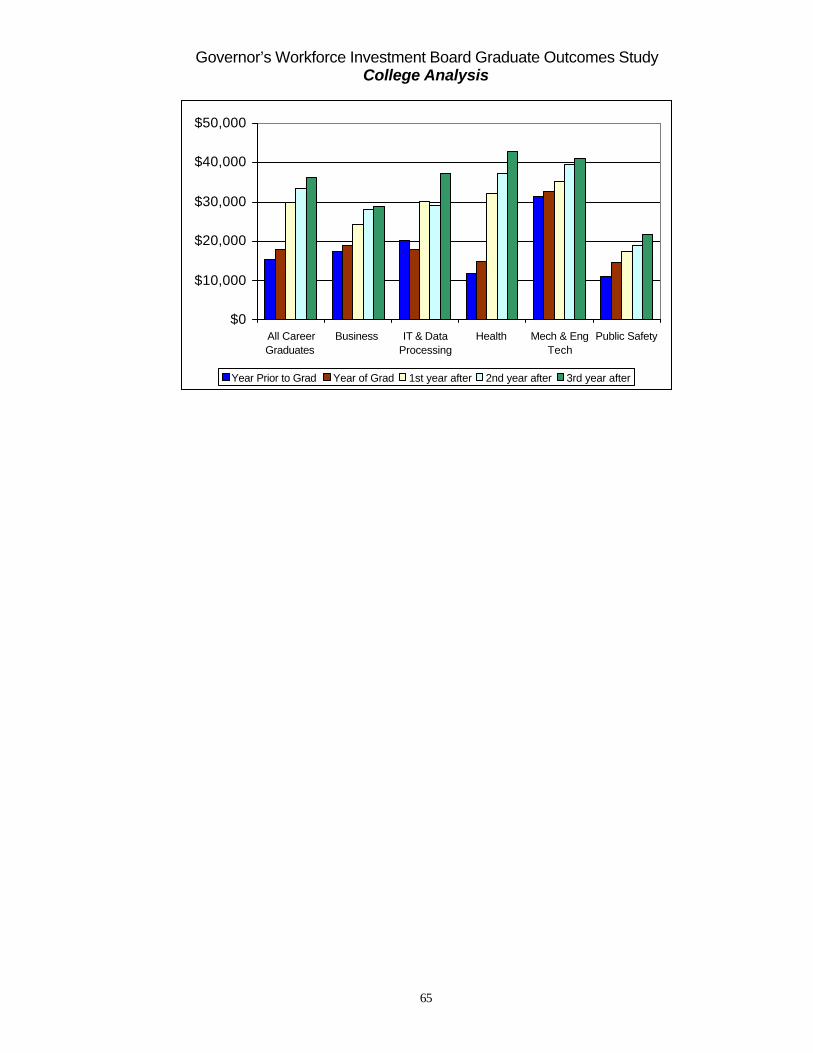
Governor’s Workforce Investment Board Graduate Outcomes Study College Analysis
65
$0
$10,000
$20,000
$30,000
$40,000
$50,000
All CareerGraduates
Business IT & DataProcessing
Health Mech & EngTech
Public Safety
Year Prior to Grad Year of Grad 1st year after 2nd year after 3rd year after

Governor’s Workforce Investment Board Graduate Outcomes Study College Analysis
66
Carroll Community College
Carroll Community College came into being with its first Board of Trustees and degree-granting authority in 1993, and gained accreditation in 1996. A relatively young college, Carroll’s career program offerings are limited. Over 80 percent of Carroll’s credit students are in baccalaureate-transfer programs. Expansion of career degree programs is constrained by budget limitations. Career programs are generally more expensive to deliver than transfer programs, due to program-specific accreditation requirements, specialized equipment needs, mandated small class sizes, and laboratory and clinical courses. Thus this study included a relatively low number of graduates—an average of 39 per cohort. The study was able to find data for an average of 86 percent of the graduates. Overall, for the cohorts studied, the median annual income of Carroll Community College graduates three years after graduation was 2.4 times their income prior to graduation. Put another way, completion of the community college career program was associated with student incomes more than doubling in three years. Information technology graduates had the highest average income three years after graduation, $38,014. Physical therapist assistants who graduated from Carroll were earning $29,709 per year on average. Graduates of business and accounting programs earned an average of $27,006. Early childhood education graduates had the lowest median income, $13,344, but this was $3,168 higher than their incomes prior to completing their degree.
Information Technology Graduates
$0$10,000$20,000$30,000$40,000$50,000
YearPrior toGrad
Year ofGrad
1st yearafter
2nd yearafter
3rd yearafter
All Career Graduates
$0$5,000
$10,000$15,000$20,000$25,000$30,000
YearPrior toGrad
Year ofGrad
1st yearafter
2nd yearafter
3rd yearafter

Governor’s Workforce Investment Board Graduate Outcomes Study College Analysis
67
Cecil Community College
Cecil Community College is located in the northeastern corner of Maryland, and is equidistant to Baltimore and Philadelphia. Cecil Community College is a small, publicly funded, open-access institution and is one of the fastest growing colleges in the State. The College serves the higher education needs of the county residents by offering a variety of associate and certificate courses towards career and transfer programs. In addition, the College offers courses for licensure, job preparation, and training for community business and industry through its division of continuing education and community services, thereby fulfilling its mission as the lifelong learning partner of the community.
As a participant in the Governor’s Workforce Investment Board manpower training, Cecil Community College produces graduates in occupational career fields such as business and commercial technology, information technology and data processing, allied health services, and mechanical and engineering technologies. The fact that just 16.4% of persons over the age of 25 years in Cecil county has a bachelor’s degree or higher, the College enhances the capacity to develop the manpower base, as well as the earning power of the community. Because of its location, on the other hand, more than 50% of Cecil county professional and technical residents commute to work outside the county. This situation is captured in the match percentages reported in the GWIB earning data for Cecil.
The GWIB median earning data (1995-2000 cohorts) for the College’s occupational program participants show some remarkable rates of growth in earnings. However, this growth varies by career program. The rate of earning growth steadily increased for engineering technology–related graduates immediately after graduation, but growth was minimal for IT and data processing graduates until after the second year of graduation when it rapidly outgrew others. The earning growth rate for health services graduates went up at an increasing rate upon graduation and then at a decreasing rate afterwards. The business graduates’ earning growth was more subtle after graduation in comparison to other career fields. In summary, the data show the value of investing in higher education. Most of the participants seem to have benefited from the programs, considering the growth in the indexed values of their pre- and post-earning trends.

Governor’s Workforce Investment Board Graduate Outcomes Study College Analysis
68
Weighted Average of Median Earnings for All Graduates
$5,658
$10,939
$21,948
$24,224
$28,780
$0
$5,000
$10,000
$15,000
$20,000
$25,000
$30,000
$35,000
Year Prior Graduation First Yr after Second Yr after Third Yr after
Earn ing

Governor’s Workforce Investment Board Graduate Outcomes Study College Analysis
69
Chesapeake College College/Service Area Profile: Chesapeake College, the first of three regional community colleges in the State, serves the learning needs of residents of five Upper Eastern Shore counties, an area comprising almost 20% of the State’s land mass. Through its partnership with Caroline, Dorchester, Kent, Queen Anne’s and Talbot counties, the College is uniquely situated to serve as a regional educational, economic development and cultural center offering associate degrees, certificates, workforce development and continuing education offerings, and collaborative initiatives with other regional organizations. Manufacturing, services, agriculture and the health industries play an important role in the region’s economy, and major employers include Airpax, Allen Family Foods, Black & Decker, Dixon Valve and Coupling, Maryland Plastics, and Memorial Hospital at Easton. Chesapeake College offers associate degree and certificate Career Programs that are designed primarily to meet regional demands for technicians, nurses and skilled health care professionals, public safety officers, human services and business professionals and other workers employed by local industry, government, education, and the professions. Between FY 1995 and FY 2000, 576 Career Program students graduated from Chesapeake College. These graduates came from a variety of programs including Accounting, Business Management, Computer Information Systems, Criminal Justice, Early Childhood Development, Engineering Technologies, Human Services, Nursing, Paralegal Studies, EMT - Paramedic, Physical Therapy Assistant, and Surgical Technology. Earnings Data: From data made available to Maryland community colleges in October 2002 by the Jacob France Institute at the University of Baltimore, annual earnings of Chesapeake College Career Program graduates showed a fairly consistent level of income for the five years prior to graduation and significant increases in the years following graduation. During the five years prior to graduation, the average annual earnings median increased 10% ($13,162 to $14,461). The year following graduation, earnings increased 38% ($5,462) to $19,923. By the second year after graduation, earnings increased 18% ($3,595) over the previous year to $23,518. Career program graduates of 1999 demonstrated a similar path. For those graduates, earnings increased 20% from $19,306 for the year following graduation to $23,213 for the second year following graduation. This growth increased another 5% during the third year after graduation to $24,350. The following graph charts this progress; for further details about the data, contact the Institutional Research and Planning Office at Chesapeake College. It should be noted that the data does not include matches against those employed by the federal government, outside the state of Maryland, and self-employed.

Governor’s Workforce Investment Board Graduate Outcomes Study College Analysis
70
Annual Earnings Median for Chesapeake Career Program Graduates1999 Cohort (Includes Associate Degrees and Certificates)
$14,779
$16,496
$19,306
$23,213$24,350
$10,000
$15,000
$20,000
$25,000
Year Prior toGraduation
Year of Graduation 1st year afterGraduation
2nd year afterGraduation
3rd year afterGraduation

Governor’s Workforce Investment Board Graduate Outcomes Study College Analysis
71
College of Southern Maryland
The College of Southern Maryland prepares its students and community to meet the challenges of individual, social, and global changes. The college, through partnerships with local businesses, agencies and organizations has addressed serious workforce development needs, particularly technology-related industries.
According to a recent survey, tri-county area adult residents indicated the need for technology training for both personal and career goals. Challenges stem from the emergence of wholly new industries in the IT field, such as Internet applications, e-commerce, photonics, and wireless computer systems. CSM was one of the first thirteen community colleges to be awarded the Microsoft Working Connections grant in 1998. With this grant CSM enhanced its IT curriculum and developed the A++ certificate program that conveniently links to an associate degree program. This allowed students a stepping- stone to an associate degree as well as to a bachelor degree opportunity through UMUC. For the 1999 IT graduates of the College of Southern Maryland, average median earnings from the year prior to graduation to one year after graduation increased 48%, compared to the median 26% increase of other IT graduates in the state. The college works closely with the three local hospitals and other health care providers to expand program offerings in health care. According to the Maryland Board of Nursing, 55% of new graduate nurses in Maryland have been prepared at the community college. These same graduates historically have a high success rate. The median annual earnings for CSM health services and paramedical technologies graduates over the period 1998 to 2000 (year prior to one year post graduation), increased 299%, from $8,250 to $32,921. Most remain employed in Maryland and 60-70% stay in the southern Maryland area.
1999 Information Services Technologies Graduates Average Median Earnings
Information Services Technologies
$20,782
$25,337
$28,835$27,486
$34,305
$17,225
$20,862
$24,807
$28,934
$32,733
$0
$5,000
$10,000
$15,000
$20,000
$25,000
$30,000
$35,000
$40,000
Year Prior to Grad Year of Grad 1st year after 2nd year after 3rd year after
1999Avg. Median
1999 Health Services and Paramedical Technologies Graduates
Average Median Earnings Health Services and Paramedical Technologies
$8,250
$10,645
$32,921
$37,092$38,101
$9,152$10,463
$29,065
$32,535
$36,598
$0
$5,000
$10,000
$15,000
$20,000
$25,000
$30,000
$35,000
$40,000
$45,000
Year Prior to Grad Year of Grad 1st year after 2nd year after 3rd year after
1999Avg. Median

72
Frederick Community College Frederick Community College (FCC) is the primary provider of work force training in Frederick County. Each year, about 28% of the students are enrolled in career- related programs while 40% are graduates of career related programs. In the most recent statewide Graduate Follow-Up Survey, 83% of the graduates rated their preparation for employment as very good or good. In addition, 100% of the employers who responded to the Employer Survey were satisfied with the preparation of our graduates for the workforce. For the past six years, the pre- and post- annual median salary of FCC career program graduates demonstrates the importance of obtaining an education at FCC. For example, the salary growth of the 1999 graduates, compared to the salary before graduation, increased by 200% or about $17,000 in five year. This salary growth is calculated using an inflation deflator index. On average, 79% of FCC graduates work for an employer in Maryland. This rate is much higher (85%) for FCC Allied Health graduates and is higher than the average for all Maryland community college graduates (70%).
1999 Median Salary
$10,052$11,892
$21,604
$29,111 $30,026
$10,000
$15,000
$20,000
$25,000
$30,000
$35,000
Year Prior toGrad
Year of Grad 1st year after 2nd year after 3rd year after
The salary of the Allied Health graduates quadrupled from $9,583 to $38,490, and shows the highest salary increase among different career majors. Aviation, Drafting, and Engineering Technology graduates’ salary rose151% after graduation. Seventy-nine percent of FCC graduates continue to work in the state compared to 70% of the total graduates from all community colleges. To address current and future workforce demands of the region, the College has adopted many new initiatives to offer more career majors with a variety of formats such as AA, certificate, and letter of recognition. In addition, the College expanded its educational opportunities by networking community resources and building partnerships with business, industry, government and professional organizations.

73
Garrett College The mission of Garrett College is to provide quality higher education, lifelong learning, and access to the universe of information so that individuals, businesses, and the community can achieve personal, entrepreneurial, and collective success. As the smallest Community College in Maryland, Garrett is faced with unique opportunities and challenges. Despite its small size, the college must support a comprehensive and diversified range of career, technical, and transfer programs. The effect is operating courses at a 12:1 student to faculty ratio, the lowest in the State. In addition, Garrett County is rurally isolated, sparsely populated and lies outside the orbit of the State’s commercial center, restricting its involvement in the State’s center of economic life. Consequently, Garrett County suffers from historically high unemployment. The median family income is the second lowest in the state. Opportunities for well paying jobs are limited, causing the out-migration of young people. Feedback from employers of recent Garrett graduates indicates a consistent level of high satisfaction with the preparation that Garrett College graduates receive. GC offers five career programs, four of which are very specialized programs that provide students with exceptional opportunities for skill development. The outcome of the curriculum design and delivery is graduates who are well prepared for employment. In addition, the Career Services Office provides personalized assistance given to students searching for jobs. Assistance with job searches, resume writing and interviewing skills helps students secure employment in a job related to their college program. As a result a high percentage of graduates are employed full-time in employment related to their field of study. The data obtained from the Jacob France Institute shows Garrett’s career graduates are attaining significant income growth in the years after graduation (Chart 1). On average for career program graduates captured in this study, the median income rose 177% the year after graduation. The median income rose 27% from the year after graduation to three years after graduation. All programs experienced growth in income. This study is limited due to the inability to capture income data for graduates who are employed by the federal government or out of state agencies or who are self-employed.

74
$5,6
09
$6,6
02
$12,
793
$14,
252
$14,
749
3,76
1
3,88
2
9,51
5
14,1
47
15,2
93
2,16
4
3,96
9
11,0
40
11,0
14
16,2
93
3,99
2
4,28
5
11,9
39 14,1
32
15,2
19
$0
$6,000
$12,000
$18,000
Year Prior toGraduation
Year ofGraduation
Year AfterGraduation
2 Years AfterGraduation
3 Years AfterGraduation
Business Career (N=34) Natural Science and Technology (N=12)Public Safety (N=22) All Programs (N=68)
CHART 1: ANNUAL MEDIAN EARNINGS FOR GARRETT 1999 CAREER PROGRAM GRADUATES

75
Hagerstown Community College Hagerstown Community College is the only source for public higher education for the first two years of college in Washington County. The College fulfills many diverse needs as the only comprehensive, integrated educational, cultural, and recreational center within the region. It prepares students for career entry, college transfer and lifelong learning. Structures for instructional delivery are changing as employers look for skill sets and certifications in addition to traditional programming. The College is examining its curriculum and instructional delivery in an effort to be innovative and responsive to students’ needs, to meet current and future workforce needs, and to ensure proper allocation of resources. Critical for recruitment, retention, student success and institutional effectiveness, the curriculum assessment process facilitates a more effective coordination of course content among faculty, as well as the broader use of a variety of course delivery systems. During academic years 2001 and 2002, a Curriculum Assessment Committee conducted a curriculum and program review. New or repackaged degree/certificates career programs have been developed within the last year and include IT certifications and the networking option in the Computer Information Technology AAS. Graphic Design Technology courses will be offered in Fall 2003. The LPN transition program is being developed and the College plans to double the size of its Nursing program by Fall 2003 to help address the critical need for nurses. Initiatives that establish standards to improve services and the quality of curricula in all career programs have been developed and are expected to have a positive impact on student satisfaction and goal achievement. In June 2002, career program faculty developed program standards, quality indicators and student outcomes for the College’s career programs. Standards include mission and goals, business and community involvement in programs, curriculum, student services, program management, and professional development. By Fall 2003, all career programs will incorporate these common standards, thereby enhancing the process of program evaluation. In tandem with curricula, career development services are essential elements in recruiting and retaining students. A Career Development Task Force assessed HCC’s career development services. Integration with outcomes assessment was identified as a critical component to complement enrollment management initiatives. The development of outcomes and methods to measure them will be a priority in career development over the next year. As indicated by the data from the Jacob France Institute (JFI), career program graduates are showing steady income gains in the years following graduation. This is significant, particularly in light of the economic challenges facing Western Maryland. The impact of the AA degree and training that the graduates received is most apparent in the year following graduation. Within one year of graduation, the average salaries of graduates in all of the programs cited exceeded the average per capita income of $24,

76
267 for Washington County. It should be noted that the JFI data does not include graduates who work out-of-state, federal employees or those who are self-employed.

77
Harford Community College
Harford Community College’s commitment to provide students with high quality, accessible and affordable career programs that promote professional competence and economic development is an essential component of the College’s mission and vision. The earning trend analysis for graduates of occupational programs shows that Harford graduates can expect an immediate opportunity for improvement in quality of life through increased annual income and is evidence of the College’s contribution towards strengthening the county’s educated workforce. The 1999 cohort of 211 Harford career program graduates improved their median annual income 70%, from $14,563 in the year of graduation to $24,669 in the first year after graduation. By the third year after graduation, this increase was over 100% with a median annual income of nearly $30,000. Furthermore, 81% of HCC career program graduates could be matched to Maryland unemployment records by the third year after graduation. This indicates that HCC career program graduates are finding employment in Maryland and at a higher rate than the overall average for all MD community colleges (69%). Match rates for HCC graduates may even be higher, as the matching process did not include federal employees, one of the largest employers in Harford County. Harford graduates of career programs in the health services occupational cluster (n=89 for the 1999 cohort) had the most notable increase in median annual income, a 113% rise from the year of graduation to the first year after graduation. By the third year after graduation, annual median income soared to nearly $38,000, a 218% increase from the year of graduation. Due to the demand for well-educated workers, particularly in areas experiencing shortages such as nursing, it is important that 88% of Harford health services graduates were working in Maryland three years after graduation. In accordance with the State Plan, Harford Community College will continue to provide programs and services that are responsive to the educational and training needs of the community.

78
Annual Median Income and Match Rate of 1999 Cohort of Harford Community College Career Program Graduates (N=211)
$12,250$14,563
$24,669
$28,107$29,587
$0
$5,000
$10,000
$15,000
$20,000
$25,000
$30,000
$35,000
Year Priorto Grad
Year ofGrad
1st yearafter
2nd yearafter
3rd yearafter
Ann
ual M
edia
n In
com
e
60%
65%
70%
75%
80%
85%
90%
95%
100%
Mat
ch R
ate
Annual Median Income (left scale) Match Rate (right scale)
Source: Jacob France Institute of the University of Baltimore under contract with the Governor’s Workforce Investment Board

79
Howard Community College Howard Community College (HCC) is a dynamic institution characterized by a long history of innovation and commitment to excellence in teaching and service. Since the college’s beginning in 1966, its mission has been to serve the community and its learners, to value their diversity, and to provide the academic and developmental environment to help students reach their goals. Howard Community College is located on 120 acres in the center of Howard County, Maryland, one of Maryland’s fastest-growing regions. Howard County increased its population by 32% over the past decade and is projected to grow to 291,700 by 2020. Nearly 6,200 credit students a semester pursue studies at HCC in a variety of academic programs leading to transfer to four-year colleges or immediate employment upon graduation. The college offers six transfer Associate in Arts degree programs, each with varying curricular patterns, twenty Associate in Applied Science career programs, twenty-three Certificates of Proficiency, nine Letters of Recognition and two Professional Certification Training opportunities. All academic divisions are committed to maintaining up-to-date programs and curricula. Division chairs and faculty continually study and assess their disciplines in order to remain aware of academic and industry needs. HCC is strongly committed to outcomes assessment as an effective means of improving student learning, and the process contributes to program effectiveness. New programs and emphases are instituted according to need. Programs are also deleted when no longer viable. As indicated by the Jacob France Institute data, the HCC career graduates captured by this particular study are achieving good income growth in the years after graduation. The slight third year leveling in the Information Technologies and Data Processing graduates is understandable in light of recent economic challenges in that sector. Of course, this is a limited snapshot of the success of HCC graduates since the Institute database did not include federal employees, students who work at out of state agencies and self-employed persons.

80
Average Median Salaries of HCC Career Program Graduates over Time (N=116)
$0
$10,000
$20,000
$30,000
$40,000
$50,000
1 ye
ar p
rior
GRADUA TIO
N
1 ye
ar a
fter
2 ye
ars a
fter
3 ye
ars a
fter
Business Programs
IT/Data Processing
Health Services
Mech/Engineering
All Career
Note: Other career programs had too few 1999 graduates to display.

81
Montgomery College
Montgomery College is a multi-campus comprehensive community college serving the transfer preparation, workforce development, and personal growth needs of the citizens of Montgomery County for over 50 years. The College was established in 1946, and has campuses in Takoma Park, Rockville, and Germantown, as well as Workforce Development & Continuing Education sites in Gaithersburg and Wheaton, thus providing geographic access to the entire County population of over 850,000 residents. Each fall semester the College enrolls over 21,000 students in its credit programs of study, and during a fiscal year some 32,000 unduplicated students enroll for one or more credit courses. Each year more than 4,000 students transfer to baccalaureate institutions and more than 1,000 receive Associate’s Degrees or Certificates. Annually, the College has more than 27,000 enrollments in Workforce Development and Continuing Education noncredit programs that include apprenticeship programs, contract training courses, and extensive professional and personal development offerings. Median salaries for the 1999 graduates of the College’s career programs whose salary data could be obtained (n=475) ranged from $13,800 in the year of graduation to $28,700 in the third year after graduation (an increase of 107%). These graduates’ salaries rose 55% from the first year after graduation to that third year after graduation. Graduates of the College’s Health Sciences programs showed the most dramatic increase in median salaries, earning $12,200 the year of graduation and $34,300 by the third year after graduation (an increase of 181%) and an increase of 150% from the first year after graduation to that third year.

82
Median Annual Salaries of 1999 Montgomery College Career Program Graduates
$0
$5,000
$10,000
$15,000
$20,000
$25,000
$30,000
$35,000
$40,000
All CareerGrads
BusinessCareers
IT & DataProcessing
HealthSciences
Mech.&Eng.Tech
Natural Sci.Tech
Public Safety
Program
Med
ian
Sala
ry
Year Prior To Grad
Year of Graduation
1st Year After Grad.
2nd Year After Grad.
3rd Year After Grad.

83
Prince George’s Community College Salary data obtained from the Jacob France Institute of the University of Baltimore indicates that students who graduate in a career program from Prince George’s Community College can expect significant financial returns as a result of their educational investment. In the first year following receipt of a diploma, the median salary of 1999 graduates increased to over $23,000 – nearly twice the salary those same students were earning in the year prior to their graduation. In the second year following graduation, students continued to add value to their earning potential as reflected by an average gain of 32% over the previous year’s salary. Students graduating with degrees in Information Technology and Health Services experienced the most significant gains. By the third year following graduation, these students had annual median salaries that were three times greater than the year in which they graduated. Graduates in Business Career and Public Safety areas were not far behind, recording median salary increases of 27% and 31% respectively over the same period. While considerations of “value added” are appropriate for those concerned with general education outcomes, the Jacob France salary data provides tangible evidence of career program worth for large numbers of community college students. Median Annual Income
Prince George's Community College
Year Prior to Grad
Year of Grad
1st year after
2nd year after
3rd year after
1999 (N=496) $12,051 $13,670 $23,042 $30,469 $31,513 All PGCC Career Graduates 1999 (N=156) $11,841 $13,080 $27,314 $36,885 $39,748 Health Services Graduates 1999 (N=84) $9,323 $8,592 $17,727 $19,284 $27,356 Information Technologies Graduates

84
1999 Cohort
$0$10,000$20,000$30,000$40,000$50,000
Graduation Year Relationship
An
nu
al S
alar
y
Year PriorTo Grad
Year Of Grad
1st Year After
2nd Year After
3rd Year After
Source: Jacob France Institute of the University of Baltimore under contract with the Govenor's Workforce Investment Board
All PGCC Career Grads
Information Technologies
Health Services

85
Wor-Wic Community College Wor-Wic is a comprehensive community college serving the residents of Worcester, Wicomico and Somerset counties on Maryland’s Lower Eastern Shore. The college provides quality transfer and career credit programs as well as community and continuing education courses that promote workforce development. The college assists local economic development efforts by providing consulting services, specialized training and diversified occupationally-oriented courses and programs. Wor-Wic has experienced continuous enrollment growth for the past 15 years, with a 42 percent increase in the last five years alone. The number of career programs has increased by 40 percent and career program graduates by 22 percent in the last five years. Responding to community needs for a trained work force, the college created early childhood education and construction engineering technology programs in FY 2000 and elementary and secondary education transfer programs in FY 2002. By partnering with local health organizations in FY 2003, the college increased the number of nursing program slots and added an emergency medical services program. The graduate earnings data compiled by the Jacob France Institute clearly indicate that Wor-Wic’s career program graduates experience significant earnings growth in each of the three years after graduation. The largest growth occurred for health services graduates, who also had the highest percentage of graduates with reported earnings. Business and criminal justice graduates experienced a steady increase in earnings each year after graduation, while earnings for computer studies graduates increased in the year immediately following graduation and then leveled off.
Wor-Wic Community College1999 Career Program Graduates
Annual Median Earnings (Adjusted For Inflation)
$0
$5,000
$10,000
$15,000
$20,000
$25,000
$30,000
$35,000
$40,000
Year Prior to Grad Year of Grad 1st Year After 2nd Year After 3rd Year After

86