Embed Size (px)
Citation preview

Occupational COPD
Susan M Tarlo, MB BS FRCP(C)
Toronto Western and and St
Michael’s Hospital,
University of Toronto, Dept Med and
Dalla Lana School of Public Health

Issues to consider
• Definition: epidemiologic vs case definition
• Causes
• Confounding factors: smoking, others
• Diagnosis
• Surveillance issues
• Specific risk populations (e.g.,
flavour/fragrance, aluminum smelters, hog
farmers and other farmers, welders, miners)

Definition of COPD
• COPD = chronic obstructive pulmonary
disease
= a PFT diagnosis (from spirometry)
– not synonymous with chronic bronchitis
(defined as chronic cough and sputum)
– not synonymous with emphysema
But often co-exists with chronic bronchitis and/or
emphysema

COPD is not a single disease:
“other” chronic obstructive lung diseases
can co-exist or overlap
• Asthma – may result in a component of
irreversible airflow limitation (COPD)
• Chronic bronchiolitis – e.g. from nitrogen
oxides, sulphur dioxide or from popcorn butter
flavoring (smoking-related airway disease
usually starts in bronchioles)
• Bronchiectasis
Studies of COPD usually aim to exclude other
airway diseases
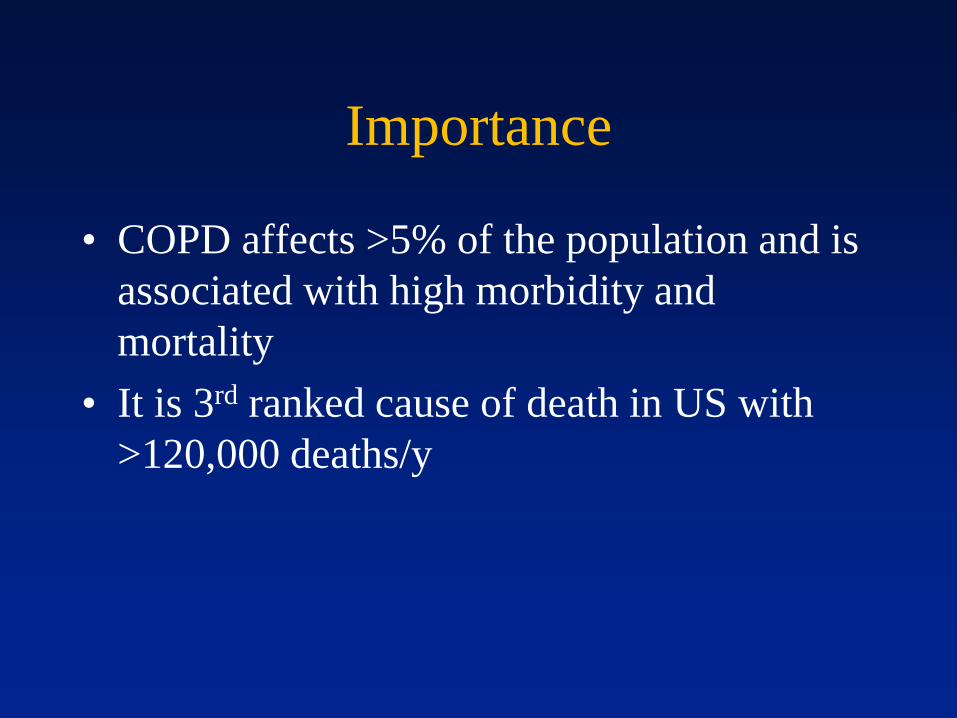
Importance
• COPD affects >5% of the population and is
associated with high morbidity and
mortality
• It is 3rd ranked cause of death in US with
>120,000 deaths/y

Global Strategy for Diagnosis, Management and Prevention of COPD
Diagnosis and Assessment: Key Points
A clinical diagnosis of COPD should be considered in any patient who has dyspnea, chronic cough or sputum production, and a history of exposure to risk factors for the disease.
Spirometry is required to make the diagnosis; the presence of a post-bronchodilator FEV1/FVC < 0.70 confirms the presence of persistent airflow limitation and thus of COPD.
© 2013 Global Initiative for Chronic Obstructive Lung Disease

Criteria for COPD
• GOLD criteria (since 2001) of FEV1/FVC ≤70%
– Widely used but widely criticized in correspondence
(e.g. Enright, Thorax ’07, Enright, Thorax ‘09,
“GOLD Stage 1 is crying wolf”) since FEV1/FVC
ratio varies with age: taking a fixed ratio will
overestimate disease, e.g., in men >40y (by~16%)
and underestimate in younger individuals (by~13%)
• ATS/ERS criteria (Eur Respir J 2005;26:319-
338) are to use the LLN of the FEV1/FVC ratio
(based on age, sex and height) as the cutoff for
normal

Global Strategy for Diagnosis, Management and Prevention of COPD
Assessment of Airflow Limitation: Spirometry
Spirometry should be performed after the administration of an adequate dose of a short- acting inhaled bronchodilator to minimize variability.
A post-bronchodilator FEV1/FVC < 0.70 confirms the presence of airflow limitation.
Where possible, values should be compared to age-related normal values to avoid overdiagnosis of COPD in the elderly.
© 2013 Global Initiative for Chronic Obstructive Lung Disease

Global Strategy for Diagnosis, Management and Prevention of COPD
Classification of Severity of Airflow Limitation in COPD*
In patients with FEV1/FVC < 0.70: GOLD 1: Mild FEV1 > 80% predicted GOLD 2: Moderate 50% < FEV1 < 80% predicted GOLD 3: Severe 30% < FEV1 < 50% predicted GOLD 4: Very Severe FEV1 < 30% predicted *Based on Post-Bronchodilator FEV1 © 2013 Global Initiative for Chronic Obstructive Lung Disease
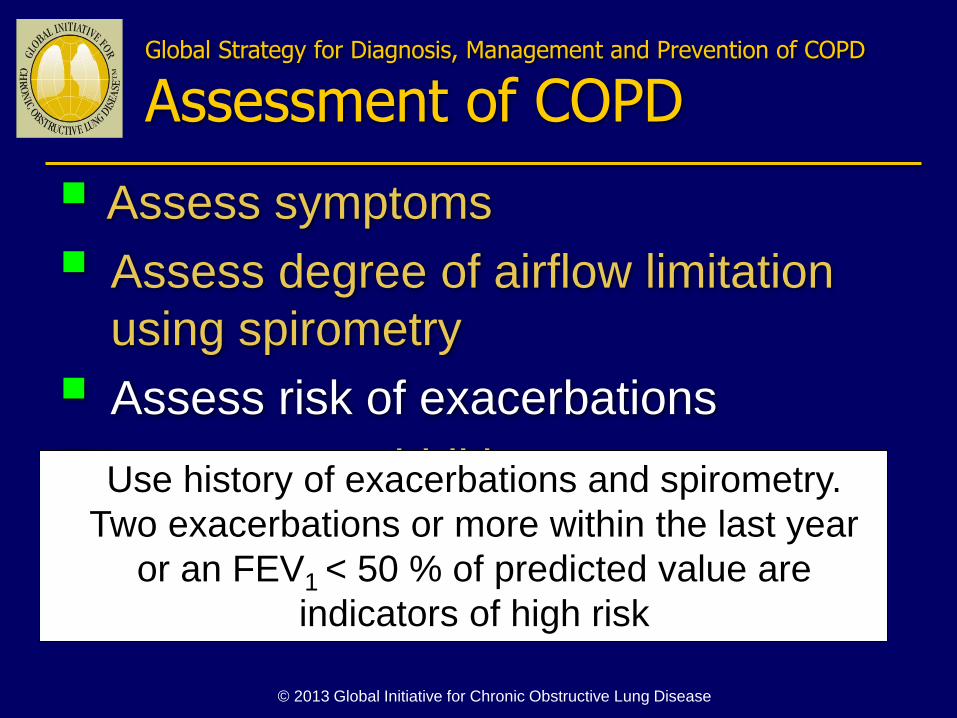
Assess symptoms
Assess degree of airflow limitation
using spirometry
Assess risk of exacerbations
Assess comorbidities
Use history of exacerbations and spirometry.
Two exacerbations or more within the last year
or an FEV1 < 50 % of predicted value are
indicators of high risk
Global Strategy for Diagnosis, Management and Prevention of COPD
Assessment of COPD
© 2013 Global Initiative for Chronic Obstructive Lung Disease

Global Strategy for Diagnosis, Management and Prevention of COPD
Risk Factors for COPD
Lung growth and development
Gender
Age
Respiratory infections
Socioeconomic status
Asthma/Bronchial hyperreactivity
Chronic Bronchitis
Genes
Exposure to particles
Tobacco smoke
Occupational dusts, organic and inorganic
Indoor air pollution from heating and cooking with biomass in poorly ventilated dwellings
Outdoor air pollution
© 2013 Global Initiative for Chronic Obstructive Lung Disease

Occupational COPD
• COPD caused in whole or in part by
occupational exposures
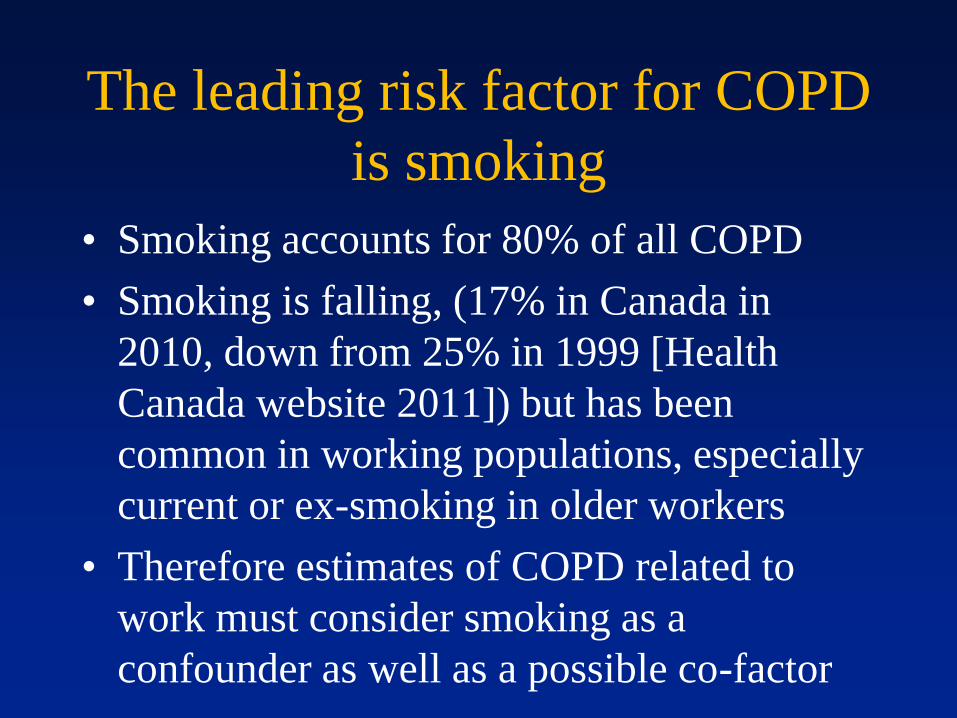
The leading risk factor for COPD
is smoking
• Smoking accounts for 80% of all COPD
• Smoking is falling, (17% in Canada in
2010, down from 25% in 1999 [Health
Canada website 2011]) but has been
common in working populations, especially
current or ex-smoking in older workers
• Therefore estimates of COPD related to
work must consider smoking as a
confounder as well as a possible co-factor


ATS Statement
• Published in 2003; data through 1999
• Reviewed occupational links to asthma and to COPD
• Concentrated on population attributable risk (PAR) %
• Work hazard defined broadly - typically: “exposure to vapors, gas, dust, and fumes”
• Assessed risks of chronic cough and sputum, exertional dyspnoea and COPD

ATS Statement: COPD
airflow limitation (PFT Deficit)
• 6 epidemiological studies reviewed
including > 12,000 subjects
• U.S. (1977,1987), Italy (1991), Norway
(1991), Spain (1998), New Zealand (1997)
• PAR% for occupational dust/fume:
Range = 12-55%, Median = 18%

ATS Statement: Conclusion
‘ ……a value of 15% is a reasonable estimate
of the occupational contribution to the
population of the burden of COPD. ’

Occupation in chronic obstructive lung disease
and chronic bronchitis: an update (2007)
Blanc & Torén, Int J Tuberc Lung Dis (IJTLD) 2007; 11:122-33
• Systematic review
• Medline search with cross check of citations
• Studies published since the ATS review

COPD Post-ATS Review Airflow Limitation (PFT Deficit)
• 6 studies including > 18,000 subjects;
1 mortality study >300,000 subjects
• Sweden (2), USA (2), Spain, Australia,
International (13 countries);
• PAR% for occupational exposure:
Range = 0-37%, Median = 15%
• PAR% Non-smokers (5 estimates)
Range =27-53%, Median = 31%
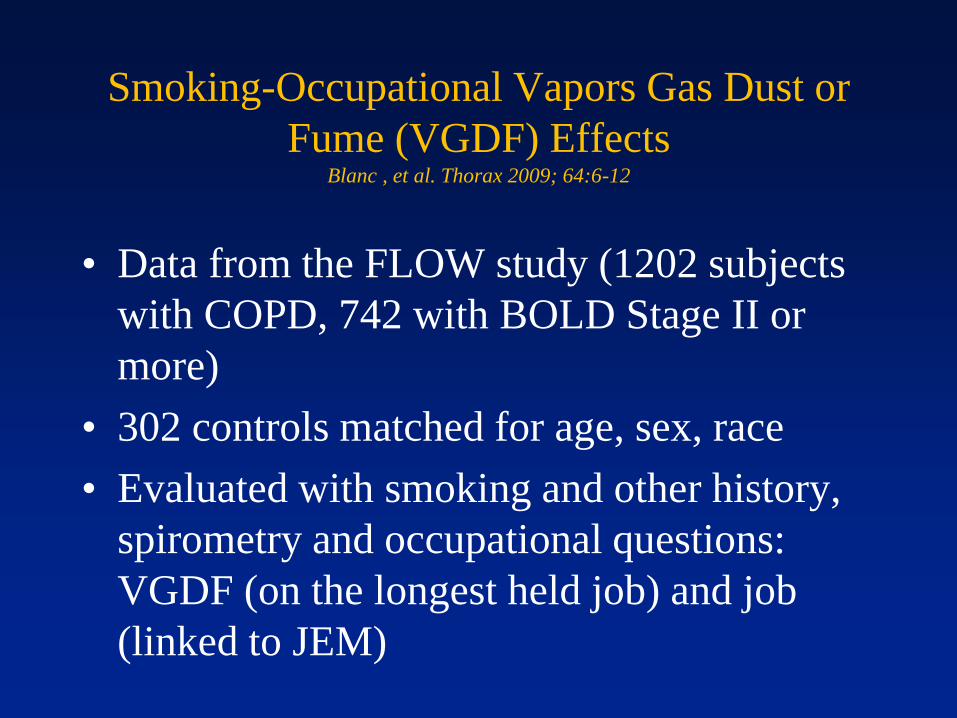
Smoking-Occupational Vapors Gas Dust or
Fume (VGDF) Effects Blanc , et al. Thorax 2009; 64:6-12
• Data from the FLOW study (1202 subjects
with COPD, 742 with BOLD Stage II or
more)
• 302 controls matched for age, sex, race
• Evaluated with smoking and other history,
spirometry and occupational questions:
VGDF (on the longest held job) and job
(linked to JEM)
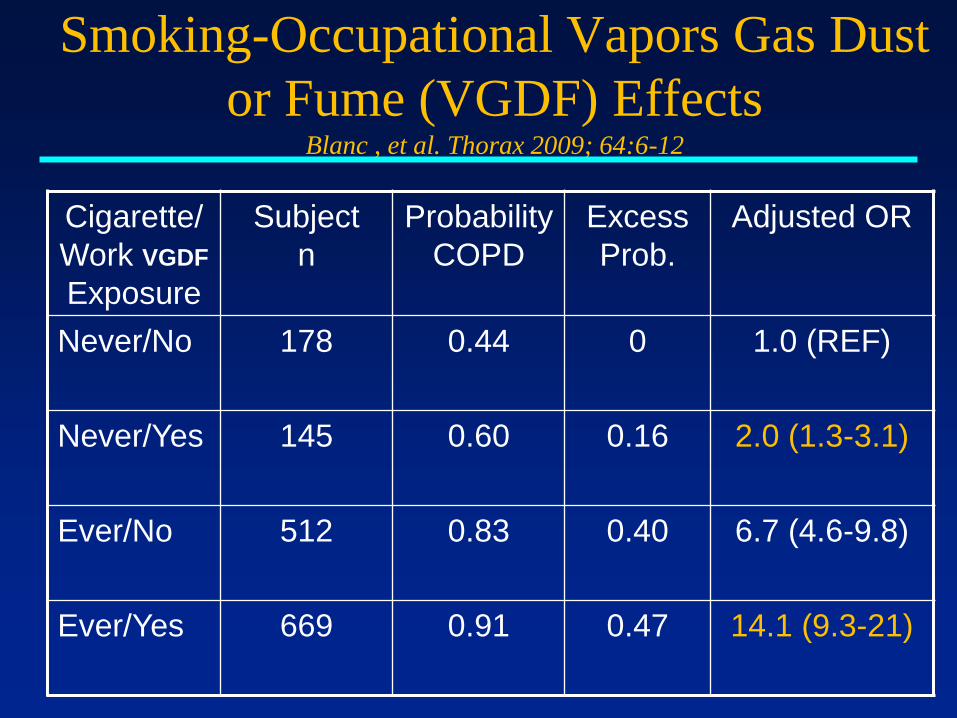
Smoking-Occupational Vapors Gas Dust
or Fume (VGDF) Effects Blanc , et al. Thorax 2009; 64:6-12
Cigarette/
Work VGDF
Exposure
Subject
n
Probability
COPD
Excess
Prob.
Adjusted OR
Never/No 178 0.44 0 1.0 (REF)
Never/Yes 145 0.60 0.16 2.0 (1.3-3.1)
Ever/No 512 0.83 0.40 6.7 (4.6-9.8)
Ever/Yes 669 0.91 0.47 14.1 (9.3-21)

Risk of COPD (cases v. referent) by exposure
group and smoking status
Blanc et al. J Occup Environ Med 2009
51:804-10
• Adults age 55-75 with self-reported doctor-
diagnosed COPD, emphysema or chronic
bronchitis recruited by random-digit dialing,
+ same age-range controls
• Evaluated with smoking and other history,
spirometry and occupational questions:
VGDF and job (linked to JEM)
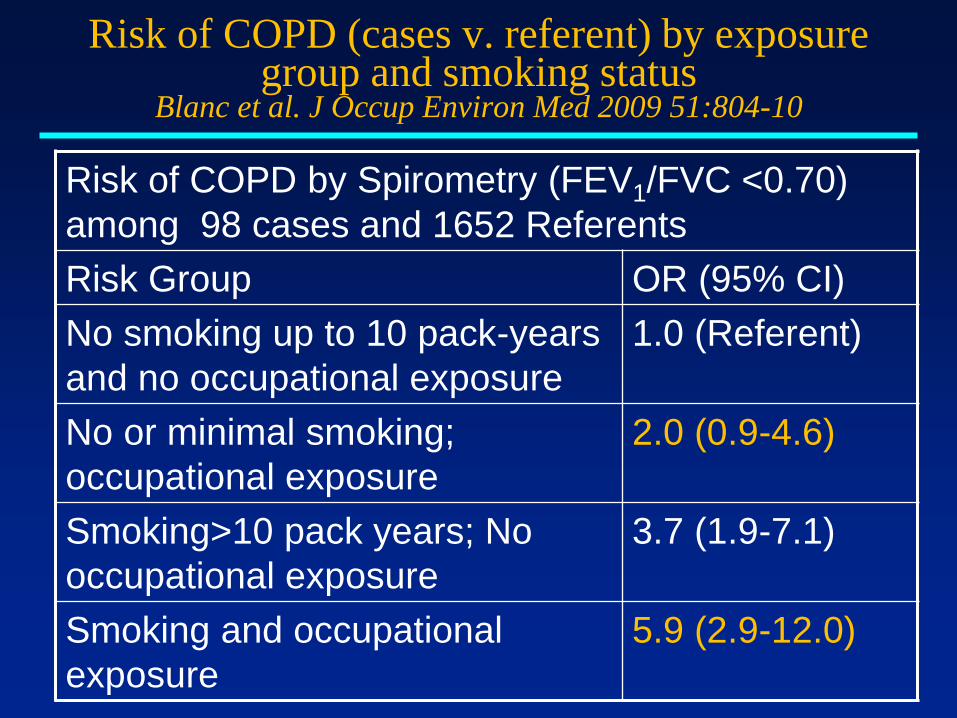
Risk of COPD (cases v. referent) by exposure group and smoking status
Blanc et al. J Occup Environ Med 2009 51:804-10
Risk of COPD by Spirometry (FEV1/FVC <0.70)
among 98 cases and 1652 Referents
Risk Group OR (95% CI)
No smoking up to 10 pack-years
and no occupational exposure
1.0 (Referent)
No or minimal smoking;
occupational exposure
2.0 (0.9-4.6)
Smoking>10 pack years; No
occupational exposure
3.7 (1.9-7.1)
Smoking and occupational
exposure
5.9 (2.9-12.0)
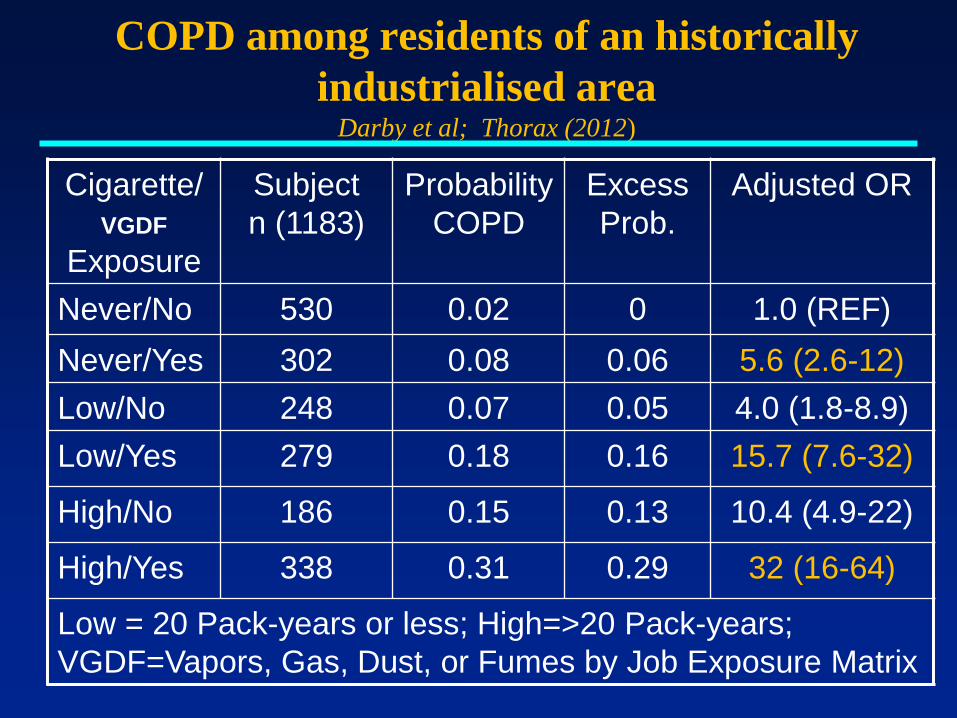
COPD among residents of an historically
industrialised area Darby et al; Thorax (2012)
Cigarette/
VGDF
Exposure
Subject
n (1183)
Probability
COPD
Excess
Prob.
Adjusted OR
Never/No 530 0.02 0 1.0 (REF)
Never/Yes 302 0.08 0.06 5.6 (2.6-12)
Low/No 248 0.07 0.05 4.0 (1.8-8.9)
Low/Yes 279 0.18 0.16 15.7 (7.6-32)
High/No 186 0.15 0.13 10.4 (4.9-22)
High/Yes 338 0.31 0.29 32 (16-64)
Low = 20 Pack-years or less; High=>20 Pack-years;
VGDF=Vapors, Gas, Dust, or Fumes by Job Exposure Matrix

Summary of Data
• Multiple studies, worldwide, various methods: occupation COPD, chronic bronchitis
• Both COPD and chronic bronchitis: PAR% estimates yield a median value ~ 15%
• COPD among non-smokers (n=5 values):
PAR% = 27%, 30%, 31%, 42%, 43%, 53%

Implications of epi studies
• The occupational contribution to COPD is
especially high among non-smokers
• However, greatest risks of COPD are seen
among smokers with occupational
exposures to VGDF
Other interacting factors
• Alpha-one antitrypsin deficiency
• Other genetic factors poorly identified to-
date
• ? Confounding and/or interactions with
other risk factors such as non-occupational
second-hand smoke, biomass fuel exposure,
and air pollution

Case example
• Mr MB, age 55
• Smoked 2-3 per day x20y, quit 2004
• Worked x 23 years with TTC as a welder in
tunnels, exposed to dusts, including
asbestos and welding and diesel fumes
(included stainless steel welding and
manganese), mostly arc welding
• Progressive SOBOE x2y, now climbing 10
steps
• Cough and clear sputum at work
Case contd
• FEV1 47%, FEV1/VC 40%, FEV1 ↑ 14%
(>200ml) post-bd
• Moderate hyperinflation, severe gas
trapping, normal DLCO
• Allergy skin tests all negative, including Ni,
Chr
• Serial PEFRs 320-360, higher range after
prn bd
• CT chest mosaic attenuation, bronchial wall
thickening, mucus plugs – no Asb changes

Example of mosaic attenuation in
bronchiolitis (exp image)

Case continued
• ∆ Occ COPD with asthmatic component
and likely component of bronchiolitis
• Changed work to outdoor delivery for TTC
• Combination LABA and inhaled steroid +
tiotropium + SABA
• Follow-up FEV1 58%, FEV1/FVC 46%, no
further bd response
• Symptomatically improved with outdoor
work
• WSIB claim accepted for occ COPD

Occupations with increased risk
airflow obstruction (Hnizdo et al, AJIM ’04)
• From NHANES III data, population aged 30-75
• Defined obstruction as FEV1/FVC <75% and
FEV1 <80% predicted
• Most frequent associated industries: armed forces;
rubber, plastics, and leather manufacturing;
utilities; textile mill manufacturing; health care;
food products manufacturing; sales; construction;
and agriculture

Examples of higher risk occupations for chronic
obstructive airways diseases (excluding asthma)
• Hog/poultry farmers
• Cotton and textile
workers (byssinosis)
• Welders
• Flavoring workers
• Aluminum pot-workers
• Miners
• WTC dust,
• Deployed military
workers in Asia
• Organic dust, gases
• Dust, endotoxin
• Nitrogen oxides, ozone
• Diacetyl (popcorn)
• Al fluorides
• Silica dust
• High pH Calcium oxide
dust
• Gases from burn pits,
dusts
Occupational diagnostic issues:
medical surveillance • Has been performed for flavoring workers,
miners, and some other higher-risk settings
• Spirometry needs: quality tests, preferably
with pre-placement baseline values and
longitudinal comparisons
• Need to recognize that baseline values in
workers are often “supernormal” and a fall
to “normal” values may be a significant
change

Spirometry surveillance issues
• Need accurate measures of height and
weight and appropriate reference values for
the workers being tested
• Standing values are slightly higher than
sitting – need consistency in posture, and
need to consider weight changes and co-
morbidities (smoking, recent URI etc.)
• Need appropriate training for staff
performing tests outside a hospital lab, e.g.
in an occupational setting

Appropriate reference values
• Reference values based on age, sex, height
and preferably would be from those of
similar ethnic background living in the
same geographic region
• Canadian reference values are not adjusted
for ethnic background – these may
overestimate volumes for workers of some
ethnic background (NHANES has reference
values for some N Am ethnic groups).
Recent “global” values suggested (Quanjer
‘12)

Cross-sectional and longitudinal
abnormalities • Criteria need to be present for “action levels” i.e.
for referral to physician to determine safety to
continue work
• ATS/ERS has recommended use of LLN from
appropriate reference values for cross-sectional
spirometry
• ATS/ERS (2005) for longitudinal changes
recommended 15% above the expected decline
with age – depending on risk level smaller
changes may need physician assessment.

Computerized programs for
longitudinal changes
• NIOSH has a computerized program (Spirola)
freely available from website
• It can be used to plot individual and group
changes and can determine the program’s
(technical) variance that for a quality program can
allow smaller changes to be identified after several
years of data (5-8y)
• Typical decline in healthy non-smokers is
~29ml/y, declines ~50-90ml/y have been
associated with morbidity and mortality

Spirola program, CDC NIOSH www.cdc.gov/niosh/topics/spirometry/spirola.html


When is this compensable?
• - depends on the workers’ compensation system
• - criteria are not published
• - relies on “greater or equal probability” of being
work-related
• Recognizes partial contribution from smoking etc
• For particular exposures, decisions will likely
consider extent of exposures (years x levels), and
• epi studies for particular jobs such as welding +
smoking pack years

Prevention
• Smoking cessation
• Prevention of exposures – avoidance of
high-risk agents (diacetyl), good ventilation,
RPDs (fit tested), worker-education
• Medical surveillance and removal when
indicated
• Tertiary measures: pharmacological and
general management of COPD