Embed Size (px)
Citation preview

Occupants’ Thermal Comfort in Reading Room of
CSA Building, Faculty of Engineering
Hasanuddin University Arinda Wahyuni#1, Baharuddin Hamzah*2, Rosady Mulyadi#3
#* Departement of Architecture Engineering, Faculty of Engineering, Hasanuddin University, Gowa, Indonesia [email protected]
Abstract— Some literature finds that there is a positive correlation between thermal environment and worker productivity in office
buildings. Similar to the office building, thermal comfort is also an important requirement in educational buildings so that it is possible
for students to study productively. Therefore, in the building of a library, class, or reading room, thermal comfort is highly preferred.
As in the Reading Room of Center of Scientifitic Activities (CSA) building, Faculty of Engineering Hasanuddin University (Unhas)
where the use of transparent glass in the reading room of the Faculty of Engineering Unhas CSA building makes users feel hot. The
scope taken was two rooms, namely the glass-walled reading room and the brick-walled reading room. This first room has a glass wall
which is quite optimal. Whereas the bricks-walled reading room that is close to the glass reading room also has the same function. The
measurement results of the highest temperature objective data for five days carried out measurement is 27.5 ℃ for the reading room
with brick walls and the highest is 28.2 ℃ for the reading room with glass walls which can be concluded that it does not meet the
standard of comfort temperature according to SNI. The air velocity is around 0.22-0.24 m/s for the brick wall reading room and 0.10-
0.15 m/s for the glass-walled reading room so that it is also concluded that it does not meet the standard of comfort temperature
according to SNI. Furthermore, for the humidity of the surrounding air is 50.9-55.2% for the reading room with brick walls and 47.8-
52% for the glass-walled reading room where the humidity is included in the comfortable category according to the SNI air humidity
comfort standard. The respondents of the reading room with the brick-walled room wanted no change in the temperature of the reading
room with brick walls while in the glass-walled reading room, respondents wanted a little cooler. The reading room with brick-walled
room wants no slight windy changes for reading room airspace with brick walls while for glass-walled reading rooms it is found that
more respondents want to increase the speed of the wind, and about the sensation of air humidity felt for reading rooms with brick
walls most respondents gave answers that were a little dry-it was suitable as well as reading rooms with glass walls but more of them
gave slightly dry answers. From the simulation results, it is explained that the higher the reflectivity in the glass material and the lower
the U-value, the more difficult it is to enter the temperature from outside the building into the building. Providing sun shadings on
building facades is also one of the solutions to filter the heat that enters the building.
Keywords— Comfort, Thermal, Glass, Bricks
I. INTRODUCTION
Three of the goals that need to be fulfilled by an architectural work are the fulfillment of aesthetic demands, the fulfillment of
the demands of comfort (psychological and physical) and fulfillment of energy-saving demands. [1] Good architecture is the
architecture that is designed in such a way as to be able to modify the uncomfortable outside climate to be comfortable by using
the help of electrical or mechanical equipment to a minimum [2]. In today's era, various functions are developed with diverse
technologies and are not often combined with many other aspects to achieve the aesthetics and comfort that the user wants. The
dominant use of glass in building materials is familiar to us in modern buildings because it is not only aesthetics but also because
its function which is to minimize artificial lighting so that it saves energy that is used. Glass material that is closely related to the
use of technology brings the basic view of society as building material that is valued futuristic, modern but minimalist [3]. The
simplicity simply makes consumers judge that this material will be easily applied in order to maximize natural lighting and view
to the influence of the psychological aspects of the user. In a similar position, the demand for networks related to the user's main
activities is also very closely related to the intensity of the use of the dominant glass material, that the impact can greatly affect
the pattern of activities in the building [4]. Some literature finds that there is a positive correlation between thermal environment
and worker productivity in office buildings [5]. Similar to office buildings, thermal comfort is also an important requirement in
educational buildings to enable students to study productively [6]. Therefore, the building of the library, class, or reading room is
also very concerned with thermal comfort.
IAETSD JOURNAL FOR ADVANCED RESEARCH IN APPLIED SCIENCES
VOLUME VI, ISSUE VII, JULY/2019
ISSN NO: 2394-8442
PAGE NO:39

Lighting is one of the most important aspects of a building. The building envelope is the main and first way for natural light to
enter. In this section access to light must be designed and calculated correctly. Its existence certainly influences the appearance
of the building and must be a consideration in a design. Natural light coming from outside the building must be included in the
right way so that the comfort of space can be created. As in the case study of one of the reading rooms at the Central Library of
the Faculty of Engineering, Unhas Gowa, which applies natural lighting throughout the day by incorporating natural light through
transparent glass material on the walls of the building also incorporates heat in the building which affects the thermal comfort of
the user.
Giving curtains on the glass side of the reading room to reduce the entry of heat also reduces the entry of natural light so that
the incoming natural light is not optimal. In addition to using curtains in this room also uses AC that uses electrical energy to
reduce the effects of extreme heat when working.
The results of my brief interview with the majority of users found that most of them were more comfortable in the reading
room with brick walls than in the reading room with glass walls even though in the both of these rooms are provided with AC.
According to [7] temperatures that are too hot and too cold will have an effect that is equally not good for the health and
productivity of space users. This is one of the answers to reading room users when I interviewed them about the reason for
choosing a reading room with stone walls than a glass-walled reading room.
Since it is found that the use of transparent glass in the reading room of the Faculty of Engineering Universitas Hasanuddin
(Unhas) Gowa's library building makes users feel hot, the formulation of the problem that can be raised is how the level of thermal
comfort in glass-walled reading rooms and bricks-walled reading rooms of the library at Faculty of Engineering and how the
adaptive behavior of users at glass-walled reading room and brick-walled at the library of the Faculty of Engineering Unhas.
II. RESEARCH METHOD
A. Research Design
The research methods used in this study were literature studies, observations, respondent questionnaires, and measurements
with Hobo thermal measuring instruments. Literature studies are used to find out information on the comfort of reading room
users according to standards while observations are used to find out the effectiveness of the activities of building users. Personal
data was collected by collecting clothes and activities of each respondent.
B. Location and Time of Research
This research was carried out at the Faculty of Engineering, Gowa Hasanuddin University, Jalan Poros Malino, Gowa
Regency.
Figure 1. The Location of Research
The scope taken was 2 rooms, namely the glass-walled reading room and the brick-walled reading room. This first room has a
glass wall which is quite optimal. Whereas the bricks-walled reading room that is close to the glass reading room also has the
same function.
IAETSD JOURNAL FOR ADVANCED RESEARCH IN APPLIED SCIENCES
VOLUME VI, ISSUE VII, JULY/2019
ISSN NO: 2394-8442
PAGE NO:40

(a) (b) (c) (d)
Figure 2. (a) Outer Space of Research Location, (b) Layout of Physical Data Space, (c) Room Photograph in a Glass-Walled
Reading Room, (d) Room Photograph in a Bricks-Walled Reading Room
C. Population and Sampling Techniques
The population in this study was the Reading Room of the Faculty of Engineering Library at Hasanuddin University. Samples
in the study were air temperature, air humidity, and wind speed in the reading room of the Faculty of Engineering at Hasanuddin
University.
The sampling technique used was purposive sampling technique in the process of taking sample data such as air temperature,
humidity, and wind speed.
D. Variables of Research
In this study, the dependent variable as the object of this research focus is the thermal comfort of the glass reading room of the
Engineering Faculty library at Hasanuddin University, while the independent variables of this study are air temperature, air
humidity, air velocity, clothing, and user activity.
E. Method of Data Collection
Measurements were made using six tools, namely four Hobo-1 and two Hobo-2. The first tool, HOBO temperature / RH logger
(HOBO-1) is used to measure air temperature and relative humidity, while the second tool, HOBO temp / RH / Light / External
(HOBO-2) is used to measure air temperature, relative humidity, and speed air flow. Both of these tools are used simultaneously
so that the data from the three climate elements were obtained from the same conditions at each measurement point.
Objective data involves physical measurements of the library's reading room and taking readings of indoor air temperature,
relative humidity, and air movement. In collecting this data, researchers measured the temperature of the room if they did not use
air conditioning and used air conditioners which coincided with the collection of questionnaires in the range of five consecutive
days, namely Monday to Friday that was done at three times which is in the morning, afternoon and evening.
Subjective data is a questionnaire that looks for student perceptions on various items assessed and adopting the seven-point
ASHRAE standard 55-2013 scale which is widely used where questionnaire items take the opinion of thermal sensation (TSV)
and thermal comfort opinions (TCV) and analyze thermal sensations, thermal preferences, activities, and clothing isolation of
reading room users. In addition, questions related to airspeed and humidity was also included in the questionnaire. In the subjective
data retrieval process, respondents are allowed to take actions that make them feel comfortable at that time and fill it in one of the
questionnaire items. Sensors for measuring environmental data are installed at 100 cm above the floor surface.[6]
F. Data Analysis Techniques
Data processing was done by MS Excel spreadsheet software and statistical package for social science (SPSS). Spreadsheets
have been used to calculate the average value of thermal environment variables and to produce tables that show microclimate
conditions [6]. For statistical analysis, SPSS version 16 statistical software was used to calculate the descriptive analysis of the
questionnaire frequency and sample T-test. The sample T-test was conducted to compare two samples. Frequency descriptive
analysis also was used to discuss the statistical size of the questionnaire containing vote TSVs that were grouped according to the
ASHRAE scale, and TCV grouped using the Bedford scale. Then the analysis results were compared with thermal comfort
standards.
1 2
IAETSD JOURNAL FOR ADVANCED RESEARCH IN APPLIED SCIENCES
VOLUME VI, ISSUE VII, JULY/2019
ISSN NO: 2394-8442
PAGE NO:41

III. RESULT AND DISCUSSION
A. Thermal Comfort
Based on the results of measuring the highest temperature objective data for five days, we measured the temperature difference
of the reading room with glass walls and brick walls where the highest temperature was 27.5 ℃ for the reading room with brick
walls and 28.2 ℃ for the reading room with glass walls, so it can be concluded that it did not meet standard of comfort temperature
according to Indonesian Nasional Standard (SNI), which according to national standard SNI 03-6572-2001, where the building
must provide the following thermal environment as follows:
1. Cool Comfortable: 20.5–22.8◦C (Te);
2. Comfortable: 22.8–25.8◦C (Te); dan
3. Warm Comfortable: 25.8–27.1◦C (Te).
Another thermal comfort study conducted by Karyono in Jakarta involved 596 respondents consisting of employees who
worked in seven office buildings resulting in a comfortable temperature of the respondents namely 26.4ºC Ta or 26.7ºC To [8]
The measurement results can be seen in the first table and first graph below.
TABLE I
AVERAGE OF TEMPERATURE ON GLASS-WALLED READING ROOM AND BRICKS-WALLED READING ROOM
Figure 3. Average of temperature on glass-walled reading room and bricks-walled reading room
Time Brick Glass
09.00-10.00 27.4 27.9
10.00-11.00 27.4 28.2
11.00-12.00 27.4 27.9
12.00-13.00 27.5 28
13.00-14.00 27.6 28.1
14.00-15.00 27.2 27.8
27.9
27.4
28.2
27.4
27.9
27.4
28
27.5
28.1
27.6
27.8
27.2
26.6
26.8
27
27.2
27.4
27.6
27.8
28
28.2
28.4
Glass 09.00-10.00 Brick 09.00-10.002 Glass 10.00-11.00 Brick 10.00-11.002
Glass 11.00-12.00 Brick 11.00-12.002 Glass 12.00-13.00 Brick 12.00-13.002
Glass13.00-14.00 Brick 13.00-14.002 Glass 14.00-15.00 Brick 14.00-15.002
IAETSD JOURNAL FOR ADVANCED RESEARCH IN APPLIED SCIENCES
VOLUME VI, ISSUE VII, JULY/2019
ISSN NO: 2394-8442
PAGE NO:42
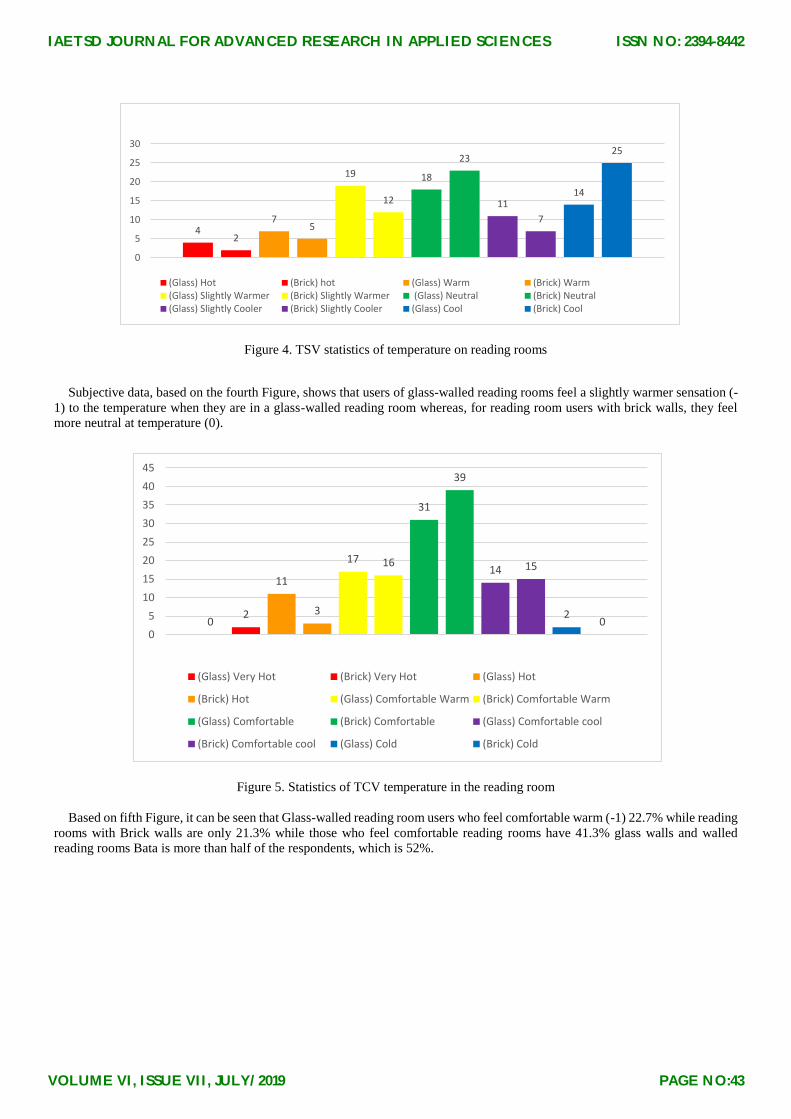
Figure 4. TSV statistics of temperature on reading rooms
Subjective data, based on the fourth Figure, shows that users of glass-walled reading rooms feel a slightly warmer sensation (-
1) to the temperature when they are in a glass-walled reading room whereas, for reading room users with brick walls, they feel
more neutral at temperature (0).
Figure 5. Statistics of TCV temperature in the reading room
Based on fifth Figure, it can be seen that Glass-walled reading room users who feel comfortable warm (-1) 22.7% while reading
rooms with Brick walls are only 21.3% while those who feel comfortable reading rooms have 41.3% glass walls and walled
reading rooms Bata is more than half of the respondents, which is 52%.
02
11
3
17 16
31
39
14 15
20
0
5
10
15
20
25
30
35
40
45
(Glass) Very Hot (Brick) Very Hot (Glass) Hot
(Brick) Hot (Glass) Comfortable Warm (Brick) Comfortable Warm
(Glass) Comfortable (Brick) Comfortable (Glass) Comfortable cool
(Brick) Comfortable cool (Glass) Cold (Brick) Cold
42
75
19
12
18
23
11
7
14
25
0
5
10
15
20
25
30
(Glass) Hot (Brick) hot (Glass) Warm (Brick) Warm(Glass) Slightly Warmer (Brick) Slightly Warmer (Glass) Neutral (Brick) Neutral(Glass) Slightly Cooler (Brick) Slightly Cooler (Glass) Cool (Brick) Cool
IAETSD JOURNAL FOR ADVANCED RESEARCH IN APPLIED SCIENCES
VOLUME VI, ISSUE VII, JULY/2019
ISSN NO: 2394-8442
PAGE NO:43

Figure 6. Statistics of TCV temperature in the reading room
Based on sixth figure, it can be seen that Glass-walled reading room users who want a little cooler is (-1) 48% while for the
Brick wall reading room is only 33% while those who want there are no changes in the temperature of the glass-walled reading
room is 36% and reading room with Brick walls is 44%.
TABLE II
AVERAGE OF AIRSPEED IN BRICKS-WALLED READING ROOM AND GLASS-WALLED READING ROOM
Time Brick
(m/s)
Glass
(m/s)
09.00-10.00 0.22 0.15
10.00-11.00 0.24 0.10
11.00-12.00 0.23 0.11
12.00-13.00 0.22 0.10
13.00-14.00 0.24 0.10
14.00-15.00 0.23 0.12
Figure 7. Average of airspeed in the bricks-walled reading room and glass-walled reading room
0 0 14
27
3336
33
11
5
0
5
10
15
20
25
30
35
40
(Glass) More Heat (Brick) More Heat (Glass) Slightly Warmer (Brick) Slightly Warmer
(Glass) No Change (Brick) No Change (Glass) Slightly Cooler (Bata) Slightly Cooler
(Glass) Cooler (Brick) Cooler
0.15
0.22
0.1
0.24
0.11
0.23
0.1
0.22
0.1
0.24
0.12
0.23
0
0.1
0.2
0.3
AVERAGE OF AIR SPEED IN BRICKS-WALLED READING ROOM AND GLASS-WALLED READING ROOM
Glass 09.00-10.00 Brick 09.00-10.00 Glass 10.00-11.00 Brick 10.00-11.00Glass 11.00-12.00 Brick 11.00-12.00 Glass 12.00-13.00 Brick 12.00-13.00Glass13.00-14.00 Brick 13.00-14.00 Glass 14.00-15.00 Brick 14.00-15.00
IAETSD JOURNAL FOR ADVANCED RESEARCH IN APPLIED SCIENCES
VOLUME VI, ISSUE VII, JULY/2019
ISSN NO: 2394-8442
PAGE NO:44

The results of air velocity measurements using hobo for 5 days at 09.00-15.00 WITA in the glass-walled reading room and
reading room with brick walls are comfortable airspeeds according to SNI. According to SNI, the air velocity is most comfortable
around 0.25-0.5 m/s. glass-In the reading room with glass walls, the lowest air velocity is 0.10 m/s while the highest is 0.15 m/s.
The next is for reading rooms with brick walls which has the lowest temperature which is 0.22 m/s and the highest temperature
is 0.24 m/s. It is nearing the most comfortable standard that can be seen in the following second tables and seventh figures.
Figure 8. Statistics of speed air TSV on the reading room users
Based on the eighth Figure, it can be seen that the users of glass-walled reading rooms feel a little calmer (-1) to the air velocity
when they are in the glass-walled reading room. Whereas for reading room users with brick walls, they feel more appropriate at
airspeed which is (0).
Figure 9. Statistics of reading room users desires on airspeed
Based on the ninth Figure, it can be seen that the Glass-walled reading room users who want no change (0) is 30.7% and those
who want a little airspeed speed (-1) is 48% while the users of Brick wall reading room who wants no change (0) is 41.3% and
wants little speed airspeed (-1) is 48%.
0 0 1 1
129
15
21
3634
0 00
10
20
30
40
(Glass) Very windy (Brick) Very windy (Glass) Windy
(Brick) Windy (Glass) A little windy (Brick) A little windy
(Glass) Already Match (Brick) Already Match (Glass) Little Quiet
(Brick) Little Quiet (Glass) Quiet (Brick) Quiet
30 0
3
23
31
36 36
13
5
0
10
20
30
40
(Glass) More Reduce Speed (Brick) More Reduce Speed (Glass) Slightly Reduces Speed
(Brick) Slightly Reduces Speed (Glass) Already Match (Brick) Already Matchi
(Glass) increases a little speed Brick) increases a little speed (Glass) Increases Speed
(Brick) Increases Speed
IAETSD JOURNAL FOR ADVANCED RESEARCH IN APPLIED SCIENCES
VOLUME VI, ISSUE VII, JULY/2019
ISSN NO: 2394-8442
PAGE NO:45
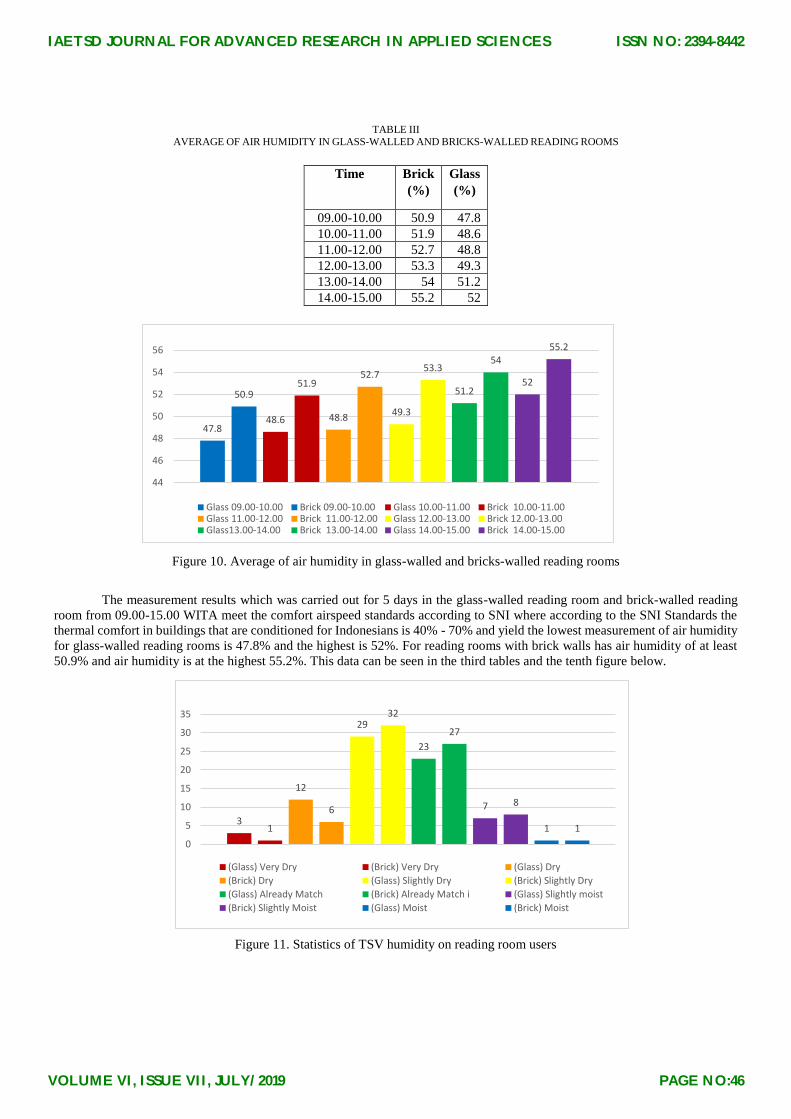
TABLE III
AVERAGE OF AIR HUMIDITY IN GLASS-WALLED AND BRICKS-WALLED READING ROOMS
Figure 10. Average of air humidity in glass-walled and bricks-walled reading rooms
The measurement results which was carried out for 5 days in the glass-walled reading room and brick-walled reading
room from 09.00-15.00 WITA meet the comfort airspeed standards according to SNI where according to the SNI Standards the
thermal comfort in buildings that are conditioned for Indonesians is 40% - 70% and yield the lowest measurement of air humidity
for glass-walled reading rooms is 47.8% and the highest is 52%. For reading rooms with brick walls has air humidity of at least
50.9% and air humidity is at the highest 55.2%. This data can be seen in the third tables and the tenth figure below.
Figure 11. Statistics of TSV humidity on reading room users
Time Brick
(%)
Glass
(%)
09.00-10.00 50.9 47.8
10.00-11.00 51.9 48.6
11.00-12.00 52.7 48.8
12.00-13.00 53.3 49.3
13.00-14.00 54 51.2
14.00-15.00 55.2 52
47.8
50.9
48.6
51.9
48.8
52.7
49.3
53.3
51.2
54
52
55.2
44
46
48
50
52
54
56
Glass 09.00-10.00 Brick 09.00-10.00 Glass 10.00-11.00 Brick 10.00-11.00Glass 11.00-12.00 Brick 11.00-12.00 Glass 12.00-13.00 Brick 12.00-13.00Glass13.00-14.00 Brick 13.00-14.00 Glass 14.00-15.00 Brick 14.00-15.00
31
12
6
2932
23
27
7 8
1 1
0
5
10
15
20
25
30
35
(Glass) Very Dry (Brick) Very Dry (Glass) Dry
(Brick) Dry (Glass) Slightly Dry (Brick) Slightly Dry
(Glass) Already Match (Brick) Already Match i (Glass) Slightly moist
(Brick) Slightly Moist (Glass) Moist (Brick) Moist
IAETSD JOURNAL FOR ADVANCED RESEARCH IN APPLIED SCIENCES
VOLUME VI, ISSUE VII, JULY/2019
ISSN NO: 2394-8442
PAGE NO:46

Subjective data, based on Figure 11 it can be seen that the percentage of the glass-walled reading room users who feel a little dry
(-1) is 38.7% of the air humidity when they are in the glass-walled reading room and feel it is appropriate for air humidity (0)
which is 30.7%, while for brick walled reading room users, the percentage of those who feel a little dry (-1) is 42.7% of the air
humidity when in the glass-walled reading room and feel it is appropriate for air humidity (0) which is 36%.
B. Adaptive Behaviour
The basic assumption of adaptive approaches is expressed by adaptive principles: if the change occurs as it produces discomfort,
people react in ways that tend to restore their comfort [9]. The adaptive hypothesis states that one's satisfaction with the indoor
climate is achieved by matching the actual thermal environment conditions that apply at that time in space and time to one's
thermal expectations as to what the climate in the room should be [10]. It is true that residents will feel more comfortable when
they are allowed to take action, such as wearing/removing clothes, opening/closing windows, turning on/off the fan or heating
and taking hot/cold drinks[11].
The results of the analysis of respondents data some respondents answered that they took an action to create their own comfort,
the following is explained in the table below.
Figure 12. Adaptive behavior of respondents in creating thermal comfort
In Figure 12, it was explained that respondents were more likely to "drink" to create thermal comfort, namely 36.7% of
respondents in the glass-walled reading room and 41.3% of respondents in bricks-walled reading room, followed by fans, wearing
comfortable clothes, looking for cold places, and also don't do a lot of movement. Seen in the graph above, the glass reading room
has more behavioral actions to create comfort than the reading room with brick walls because according to respondents the glass-
walled space is more uncomfortable than the reading room with brick walls.
C. The T-Test (Multiple Samples)
The result of T TEST correlation between the two variables is 0.958 which states that the correlation between glass-walled
reading rooms and reading rooms with brick walls is very close and is significantly related, and probability is 0.000. Because of
the probability <0.05 then H0 is rejected. Thus reading rooms with glass walls and reading rooms with brick walls are not the
same.
D. Simulation of Thermal Comfort in Reading Room Using Ecotect
The first experiment with the replacement of glass material also affected the temperature of the reading room with brick walls
because by replacing the glass material makes the reading room temperature with brick walls also changed lower.
0
5
10
15
20
25
30
35
Glass Wall Reading Room Brick Wall Reading Room
Not Answer Drink
Looking for a Cool Place Flutter
Use comfortable clothes Not a lot of motion
IAETSD JOURNAL FOR ADVANCED RESEARCH IN APPLIED SCIENCES
VOLUME VI, ISSUE VII, JULY/2019
ISSN NO: 2394-8442
PAGE NO:47

(a)
(b)
(c)
Figure 13. (a) Ecotect Design by Replacing Glass Material in Reading Room, (b) Asahimas Glass Specifications "sunergy
sigma green", (c) Analysis Grid Spatial Comfort by replacing glass wall material
IAETSD JOURNAL FOR ADVANCED RESEARCH IN APPLIED SCIENCES
VOLUME VI, ISSUE VII, JULY/2019
ISSN NO: 2394-8442
PAGE NO:48

Figure 13 above which explains about the grid analysis shows the radiant temperature changes in the reading room. It can be
seen that the temperature of the glass-walled reading room which (26.1 ℃ - 26.3 ℃) is lower than the reading room with brick
walls which is (26.2 ℃ - 26.7 ℃).
The second experimental result was by replacing glass material and providing sun shading on the glass wall of the library
reading room of the Faculty of Engineering Hasanuddin University. Providing sun shadings on building facades is also one of the
solutions to filter the heat that enters the building because from simulations conducted using Ecotect sun shading on building
facades can further reduce the temperature in the room.
(a)
(b)
Figure 14. (a) Ecotect Design by Replacing Glass Material Types Reading Room and providing sun shading on the glass wall of
the reading room, (b) Analysis Grid Spatial Comfort by replacing glass wall material and providing sun shading on the glass
wall of the reading room
The picture above shows changes in the radiant temperature of the reading room. It can be seen that the temperature of the
glass-walled reading room is lower than the first experiment (26.1 ℃ - 26.3 ℃) from the reading room with brick walls (26.2 ℃
- 26.6 ℃).
This experiment is more recommended for glass buildings that are located densely around the building so that reflective glass
does not interfere with buildings or users around the outside of the building.
IV. CONCLUSION
Based on the results of the measurement of objective data, the highest temperature found for five days of measurement
is 27.5 ℃ for reading rooms with brick walls and 28.2 ℃ for reading rooms with glass walls. From these data, it can be concluded
that the reading room temperature does not meet the comfort temperature standards according to SNI. The air velocity is around
0.22-0.24 m/s for brick-walled reading rooms and 0.10-0.15 m/s for glass-walled reading rooms so that it does not meet the
comfort temperature standards according to SNI. Next is about the humidity of the surrounding air, which is 50.9-55.2% for
reading rooms with brick walls and 47.8-52% for glass-walled reading rooms where the data is included in the comfortable
category according to SNI air humidity standards.
The respondents of a reading room with brick-walled room users wanted no change in the temperature of the reading room
with brick walls, while for the glass-walled reading room, respondents wanted a little cooler. The brick-walled reading room
respondents wanted no slight windy changes to airspeed in the brick-walled reading room, while for glass-walled reading rooms,
more respondents wanted a slight increase in speed. About the sensation of air humidity felt for reading rooms with brick walls,
the answers of most respondents that it has been a little dry-it's appropriate so does the reading room with glass walls but more
than giving answers to a little dry.
IAETSD JOURNAL FOR ADVANCED RESEARCH IN APPLIED SCIENCES
VOLUME VI, ISSUE VII, JULY/2019
ISSN NO: 2394-8442
PAGE NO:49
Based on the results of the respondent's answers through a statement in the questionnaire, it was found that there are some
statements about adaptive behavior that they do to create thermal comfort. More respondents create comfort by drinking, fans,
using comfortable clothes, looking for a cool place, and also not doing much movement.
The result of T TEST correlation between the two variables is 0.958 which states that the correlation between glass-walled
reading rooms and reading rooms with brick walls is very close and is significantly related, and probability is 0.000 because of
the probability <0.05 then H0 is rejected. Thus reading rooms with glass walls and reading rooms with brick walls are not the
same.
From the simulation results explain the reflective height in the glass material and the lower the U-value, the more difficult it is
to enter the temperature from outside the building into the building.
Providing sun shadings on building facades is also one of the solutions to filter the heat that enters the building since the
simulations carried out using Ecotect sun shading on building facades can reduce indoor temperatures. However, providing sun
shadings can reduce the incoming natural light so this solution is better used for buildings that are densely located so that reflective
glass does not disturb users outside the building.
REFERENCES
[1] Z. Gou, S. S. Y. Lau, dan F. Chen, “Subjective and objective evaluation of the thermal environment in a three-star green office building in China,” Indoor Built Environ., 2012.
[2] T. H. Karyono, “Kenyamanan Termal dan Penghematan Energi: Teori dan Realisasi dalam Desain Arsitektur,” in Seminar dan Pelatihan Ikatan Arsitek Indonesia (IAI), Gedung Jakarta Desain Center, 20 Maret 2010, 2010.
[3] A. D. Aziiz dan E. Setiyowati, “Focus on glass as the main building material in designing architecture case study: Malang abroad education center design,” J. Teknol., 2016.
[4] A. D. Aziiz, “Penggunaan Material Dominan Kaca terhadap Bangunan,” TEMU Ilm. IPLBI, 2015. [5] O. Seppänen, W. Fisk, dan Q. Lei, “Effect of Temperature on Task Performance in Office Environment,” in 5th International Conference
on Cold Climate Heating, Ventilating and Air Conditioning, 2006. [6] B. Hamzah, Z. Gou, R. Mulyadi, dan S. Amin, “Thermal Comfort Analyses of Secondary School Students in the Tropics,” Buildings,
2018. [7] Nurlaili, “Optimalisasi Kualitas Kenyamanan Thermal di Ruang Kantor dan Aula Islamic Centre UIN SUSKA Riau,” hal. 115–121, 2013. [8] Tri Harso Karyono, “PENELITIAN KENYAMANAN TERMIS DI JAKARTA SEBAGAI ACUAN SUHU NYAMAN MANUSIA INDONESIA,”
Dimens. (Jurnal Tek. Arsitektur), 2001. [9] J. F. Nicol dan M. A. Humphreys, “Adaptive thermal comfort and sustainable thermal standards for buildings,” in Energy and Buildings,
2002.
[10] G. S. Brager dan R. J. de Dear, “Thermal adaptation in the built environment: a literature review,” Energy Build., 1998.
[11] M. R. Sharma dan S. Ali, “Tropical summer index-a study of thermal comfort of Indian subjects,” Build. Environ., 1986.
IAETSD JOURNAL FOR ADVANCED RESEARCH IN APPLIED SCIENCES
VOLUME VI, ISSUE VII, JULY/2019
ISSN NO: 2394-8442
PAGE NO:50