Embed Size (px)
Citation preview

The OCC’s quarterly report on bank trading and derivatives activities is based on call report information provided by all insured U.S. commercial banks, savings associations and trust companies (collectively, “banks”), reports filed by U.S. financial holding companies, and other published data. Beginning in the first quarter of 2012, savings associations reported their financial results in the call reports. As a result, their trading and derivatives activity is now included in the OCC’s quarterly derivatives report. A total of 1,421 insured U.S. commercial banks and savings associations reported derivatives activities at the end of the second quarter, 9 fewer than in the first quarter. Derivatives activity in the U.S. banking system continues to be dominated by a small group of large financial institutions. Four large commercial banks represent 91.1% of the total banking industry notional amounts and 81.3% of industry NCCE. The OCC and other supervisors have examiners on-site at the largest banks to evaluate continuously the credit, market, operational, reputation, and compliance risks of bank derivatives activities. In addition to the OCC’s on-site supervisory activities, the OCC continues to work with other financial supervisors and major market participants to address infrastructure, clearing, and margining issues in over-the-counter (OTC) derivatives. Activities include development of objectives and milestones for stronger trade processing and improved market transparency across all OTC derivatives categories, migration of certain highly-liquid products to clearinghouses, and requirements for posting and collecting margin. Revenue Insured U.S. commercial banks and savings associations reported $5.5 billion in trading revenue in the second quarter, $2.2 billion lower (28.1%) than in the first quarter, and $0.9 billion lower (14.2%) than in the second quarter of 2014. For a more historical perspective, second quarter trading revenue was $0.2 billion (3.0%) lower than the average of second quarter performance since 2009, when the landscape for bank trading activities changed after former investment banks took commercial bank charters during the financial crisis. Trading revenue typically peaks in the first quarter, and then falls throughout the rest of the year. Since 2009, trading revenue in the second quarter has averaged a 25% decline from the first quarter, making the decline this year only slightly greater than in prior years. Moreover, trading revenue has fallen in the second quarter 12 of the 16 times since 2000. Relative to the first quarter of 2015, the $2.2 billion decline in trading revenue was led by a $1.4 billion decline in combined interest rate and foreign exchange revenue, and a $0.5 billion decline in commodity and other revenue.
OCC’s Quarterly Report on Bank Trading and Derivatives Activities Second Quarter 2015
Executive Summary
Insured U.S. commercial banks and savings associations reported trading revenue of $5.5 billion in the second quarter, $2.2 billion lower (28.1%) than in the first quarter, and $0.9 billion lower (14.2%) than in the second quarter of 2014.
Credit exposure from derivatives fell sharply in the second quarter, due to a rise in interest rates. Net current credit exposure (NCCE) decreased $97.4 billion, or 19.4%, to $405.6 billion.
Trading risk, as measured by Value-at-Risk (VaR), fell again in the second quarter. Average VaR across the top 5 dealer banking companies declined $26 million, or 6.9%, to $347 million.
Notional derivatives fell $5.2 trillion, or 2.6%, to $197.9 trillion, the lowest level since the third quarter of 2008. Derivative contracts remain concentrated in interest rate products, which comprise 77.7% of total derivative notional amounts. Credit derivatives, which represent 4.3% of total derivatives notionals, declined 5.9% from the first quarter to $8.5 trillion.

2
For the first six months of 2015, insured U.S. commercial banks and savings associations reported $13.2 billion in trading revenue, $0.6 billion higher (4.5%) than in 2014, driven by a $0.9 billion increase in combined interest rate and foreign exchange trading revenue. The improvement in first half results in 2015 primarily reflects the very strong first quarter results, as trading revenue in the second quarter was slightly weaker than normal. Trading revenue for the first half of 2015 was $0.2 billion lower (1.5%) than the $13.4 billion average since 2009. The downward trend in first-half trading revenue results from weakness in combined interest rate and foreign exchange revenue. These sources have averaged $10.6 billion in revenue since 2009, or $0.7 billion (6.6%) more than in 2015.
2Q2015
AveragePast 12
Q2's
Past 8Quarter
Average
Past 8Quarter
Hi
Past 8Quarter
Low
Since2000
Average Max All Min All
Interest Rate
Foreign Exchange
Equity
Commodity & Other
Credit
Total Trading Revenue -10,580
-10,237
-307
-1,059
-1,069
-5,282
10,217
2,727
789
1,830
4,830
9,291
3,906
-236
219
545
1,746
1,631
2,911
-79
129
233
588
-819
7,671
756
672
924
4,830
3,404
5,606
408
385
632
2,544
1,638
4,768
7
261
554
2,020
1,926
5,517
530
129
598
855
3,404
Source: Call Reports
in $
mill
ions

3
Holding Company Quarterly Trading Revenue1 To get a more complete picture of trading revenue in the banking system, it is important to consider consolidated holding company trading performance. As illustrated in the table below, consolidated holding company trading revenue of $12.9 billion in the second quarter was $5.8 billion (31.1%) lower than in the first quarter, and also $1.8 billion (12.3%) lower than in the second quarter of 2014. Relative to the first quarter, trading revenue fell in all categories, led by a $2.0 billion decline in combined interest rate and FX revenue. It is not a surprise that trading revenue fell from the first quarter, as there are pronounced seasonality patterns in trading activities. Trading revenue at bank holding companies in the second quarter, however, was the second weakest since 2009 when the former investment banks took bank charters during the financial crisis, or were acquired by bank holding companies. During this period, the only weaker second quarter was in 2012, when a large bank suffered significant credit trading losses from poorly understood hedging activities. Trading revenue that quarter totaled only $9.2 billion. Trading revenue in the second quarter was also $2.5 billion (16.2%) below the $15.4 billion average of the past seven second quarters. Compared to the second quarter of 2014, the $1.8 billion decline in trading revenue was led by a $2.0 billion decline in credit trading revenue, which generally offset small increases in other product sectors.
For the first six months of 2015, trading revenue for bank holding companies was virtually unchanged over 2014 at $31.6 billion. The strength in first quarter revenue helped to offset the weakness in second quarter performance.
1 The OCC’s Quarterly Report on Bank Trading and Derivatives Activities focuses on the activity and performance of insured U.S. commercial banks and savings associations. Discussion of consolidated bank holding company (BHC) activity and performance is limited to this section, discussion of value-at-risk (VaR), as well as the data in Table 2 and Graph 8.
2009 2010 2011 2012 2013 2014 2015
Q2 Q2 Q2 Q2 Q2 Q2 Q2
0
2,000
4,000
6,000
8,000
10,000
12,000
14,000
in $
mill
ions
Averaage: 10,625
YTD INTEREST RATE & FX TRADING REVENUE
Source: Call Reports
Interest Rate
Foreign Exchange

4
Bank Trading Revenue as a Percent of Consolidated Holding Company Revenue Prior to the financial crisis, trading revenue at banks typically ranged from 60-80% of consolidated holding company trading revenue. Since the financial crisis, and the adoption of bank charters by the former investment banks, the percentage of trading revenue at banks to consolidated company revenue has generally fallen into a range of 30-50%. This decline reflects the significant amount of trading activity by the former investment banks that, while included in holding company results, remains outside the insured commercial bank. More generally, insured U.S. commercial banks and savings associations have more limited legal authorities than do their holding companies, particularly in commodity and equity products.
In the second quarter, banks generated 42.9% of consolidated company trading revenue, up from 41.0% in the first quarter. The higher percentage of bank trading revenue, relative to holding company revenue, resulted from an increase in the percentage of bank revenue from interest rate and FX products, which more than offset a decline in revenue from commodity activities. Combined interest rate and FX revenue at banks increased from 30.3% to 33.1% of total holding company trading revenue. Revenue from commodity products at bank fell from 3.1% to 1.0% of total holding company trading revenue. Credit Risk Credit risk is a significant risk in bank derivatives trading activities. The notional amount of a derivative contract is a reference amount that determines contractual payments, but it is generally not an amount at risk. The credit risk in a derivative contract is a function of a number of variables, such as whether counterparties exchange notional principal, the volatility of the underlying market factors (interest rate, currency, commodity, equity or corporate reference entity), the maturity and liquidity of the contract, and the creditworthiness of the counterparty. Credit risk in derivatives differs from credit risk in loans due to the more uncertain nature of the potential credit exposure. With a funded loan, the amount at risk is the amount advanced to the borrower. The credit risk is unilateral; the bank faces the credit exposure of the borrower. However, in most derivatives transactions, such as swaps (which make up the bulk of bank derivative contracts), the credit exposure is bilateral. Each party to the contract may (and, if the contract has a long enough tenor, probably will) have a current credit exposure to the other party at various points in time over the contract’s life. Moreover, because the credit exposure is a function of movements in market factors, banks do not know, and can only estimate, how much the value of the derivative contract might be at various points of time in the future. Measuring credit exposure in derivative contracts involves identifying those contracts where a bank would lose value if the counterparty to a contract defaulted today. The total of all contracts with positive value (i.e., derivatives receivables) to the bank is the gross positive fair value (GPFV) and represents an initial measurement of credit exposure. The total of all contracts with negative value (i.e., derivatives payables) to the bank is the gross negative fair value (GNFV) and represents a measurement of the exposure the bank poses to its counterparties.

5
GPFV (i.e., derivatives receivables) fell by $1.0 trillion (24.6%) in the second quarter to $3.1 trillion, driven by sharp declines in receivables from interest rate and foreign exchange contracts, which declined by $0.8 trillion and $0.2 trillion respectively. Because interest rate contracts make up the lion’s share (77.7%) of total notional derivatives contracts, changes in interest rates drive credit exposure in derivatives portfolios. Rises in interest rates tend to reduce exposure. As noted further below in the discussion of derivatives notionals, the maturity profile of interest rate derivatives is becoming longer, making credit exposure more sensitive to changes in longer-term rates. Interest rates moved higher in the second quarter, as market participants began to fear that stronger economic growth would lead to monetary tightening by the Federal Reserve Board. Yields on 10-year interest rate swaps increased 44 basis points to 2.46%. Because banks hedge the market risk of their derivatives portfolios, the change in GPFV was matched by a similar decrease in GNFVs (i.e., derivatives payables). Derivatives payables also fell $998.2 billion (24.9%) to $3.0 trillion, driven by declines in payables on interest rate and FX contracts. A legally enforceable netting agreement with a counterparty creates a single legal obligation for all transactions (called a “netting set”) under the agreement. Therefore, when banks have such agreements with their counterparties, contracts with negative values (an amount a bank would pay to its counterparty), can offset contracts with positive values (an amount owed by the counterparty to the bank), leaving a NCCE as shown in the example below:
Bank A Portfolio with Counterparty B # of Contracts Value of Contracts Credit Measure/Metric
Contracts With Positive Value to Bank A 6 $500 Gross Positive Fair Value
Contracts With Negative Value to Bank A 4 $350 Gross Negative Fair Value
Total Contracts 10 $150 Net Current Credit Exposure (NCCE) to Bank A from Counterparty B
Most, but not necessarily all, derivatives transactions a bank has with an individual counterparty are subject to a legally enforceable netting agreement. For example, some transactions may be subject to the laws of a jurisdiction that does not provide legal certainty of netting agreements, in which case banks must regard such transactions as separate from the netting set. Other transactions may involve non-standard contractual documentation. Transactions that are not subject to the same legally enforceable netting agreement become unique “netting sets” that have distinct values that cannot be netted, and for which the appropriate current credit measure is the gross exposure to the bank, if that amount is positive. In some cases, transactions that fall under separate netting sets may be tied together under a separate legally enforceable netting agreement. While banks can net exposures within a netting set under the same netting agreement, they cannot net exposures across netting sets without a separate legally enforceable netting agreement. As a result, a bank’s NCCE to a particular counterparty equals the sum of the credit exposures across all netting sets with that counterparty. A bank’s NCCE across all counterparties equals the sum of its NCCE to each of its counterparties. NCCE is the primary metric used by the OCC to evaluate credit risk in bank derivatives activities. NCCE for insured U.S. commercial banks and saving associations fell $97.4 billion (19.4%) to $405.6 billion in the second quarter.2 NCCE peaked at $804.1 billion at the end of 2008, during the financial crisis, when interest rates had plunged and credit spreads were very high. While interest rates are still very low, they have remained low for a long period of time, during which substantial growth in notionals has occurred at those low rates, and longer-tenor contracts have become shorter-tenor contracts. Each of these factors has narrowed the difference between very low current market swap rates and prevailing swap rates in dealers’ interest rate books, which creates credit exposure. The significant decline in NCCE since 2008 results from sharp declines in the GPFV of interest rate and credit contracts. GPFV from interest rate contracts has fallen from $5.1 trillion at the end of 2008 to $2.2 trillion currently. The yield on the 10-year Treasury note has generally been below 3% since the fourth quarter of 2008, at the peak of the financial crisis. At June 30, 2015, exposure from credit contracts of $129.6 billion is $992.9 billion lower (88.5%) than $1.1 trillion at December 31, 2008.
2 Banks report NCCE in two different schedules (RC-R and RC-L) of the call report, and the amounts reported are not the same because of differences in the scope of coverage. Neither measure comprehensively captures NCCE. RC-L includes exposure only from over-the-counter derivatives transactions; it excludes exchange-traded transactions. RC-R excludes transactions not subject to capital requirements. The recent change to reflect central counterparty exposures in RC-R, however, has led to a convergence in the two schedules. This report, which has used RC-L for NCCE since the second quarter of 2014, now again uses the RC-R measure for NCCE.

6
Legally enforceable netting agreements allowed banks to reduce GPFV exposures by 86.8% ($2.7 trillion) in the second quarter. The distribution of NCCE3 in the banking system is concentrated in banks/securities firms (54.8%) and corporations/other counterparties (37.4%). In the second quarter, there was a shift in credit exposure, with larger exposures to banks and securities firms, which increased from 51.8% to 54.8% of the total, and smaller exposure to corporates and other counterparties (from 40.3% to 37.4% of the total). Exposure to hedge funds, sovereign governments and monoline financial firms is very small (7.8% in total). However, the sheer size of aggregate counterparty exposures results in the potential for major losses, even in sectors where credit exposure is a small percentage of the total. For example, notwithstanding the minimal share of NCCE to monolines, banks suffered material losses on these exposures during the credit crisis. Because banks have taken credit charges (via credit valuation adjustments) to completely write down their monoline exposures, current credit exposures to monolines are now virtually 0% of total NCCE. Sovereign credit exposures are also a small component (5.8%) of NCCE and, like monoline exposures before the financial crisis, are largely unsecured.
A more risk sensitive measure of credit exposure would also consider the value of collateral held against counterparty exposures. Commercial banks and savings associations with total assets greater than $10 billion report the fair value of collateral held against various classifications of counterparty exposure. Reporting banks held collateral against 85.1% of total NCCE at the end of the second quarter, up sharply from 79.0% in the first quarter, due to the shift in counterparty exposure more toward banks and securities firms. Because coverage of banks and securities firms’ exposures are nearly 100%, shifts in the distribution of exposure toward this sector, as happened during the second quarter, result in greater collateral coverage of derivatives exposures.
3 This section of the report uses the Schedule RC-L measure for NCCE because Schedule RC-R does not provide exposures by counterparty type.
2Q2015 1Q2015Q/Q
ChangeQ/Q %
Change
Total Fair Value
NCCE RC-R
Netting Benefit RC-R
Netting % RC-R -1%
-25%
-19%
-25%
-1
-903
-97
-1,000
88
3,564
503
4,067
87
2,661
406
3,067
10-Year Interest Rate Swap
Dollar Index Spot
Credit Derivative Index - North America IG (bps)
Credit Derivative Index - High Volatility (bps) -33
10
-3
-52
6
-3
0.44
158
64
98
2.02
106
71
95
2.46
Source: Call Reports, BloombergNote: Numbers may not add due to rounding.
in $ billions

7
Credit exposures to banks/securities firms and hedge funds remain very well secured; banks held collateral against 95.8% of their current exposure to banks and securities firms, down from 97.2% in the first quarter. Collateral held against hedge fund exposures increased to 441.6% in the second quarter. Hedge fund exposures have always been very well secured, because banks take “initial margin” on transactions with hedge funds, in addition to fully securing any current credit exposure. Collateral coverage of corporate, monoline and sovereign exposures is much less than for financial institutions and hedge funds, although coverage of corporate exposures has been increasing over the past several years due to increases in the volume of trades cleared at central counterparties.
Collateral quality held by banks is very high and liquid, with 74.8% held in cash (both U.S. dollar and non-dollar), and an additional 6.0% held in U.S. Treasuries and government agencies. Supervisors assess changes in the quality of collateral held as a key early warning indicator of potential easing in credit terms. Indeed, the quality of collateral held to secure derivatives exposures has slipped slightly over the past year. In the second quarter, equity securities increased from 1.4% of total collateral to 4.5%. Additionally, “other” collateral has increased from 12.9% in the second quarter of 2013 to 13.9% currently. Examiners review the collateral management practices of derivatives dealers as a regular part of their ongoing supervision activities.
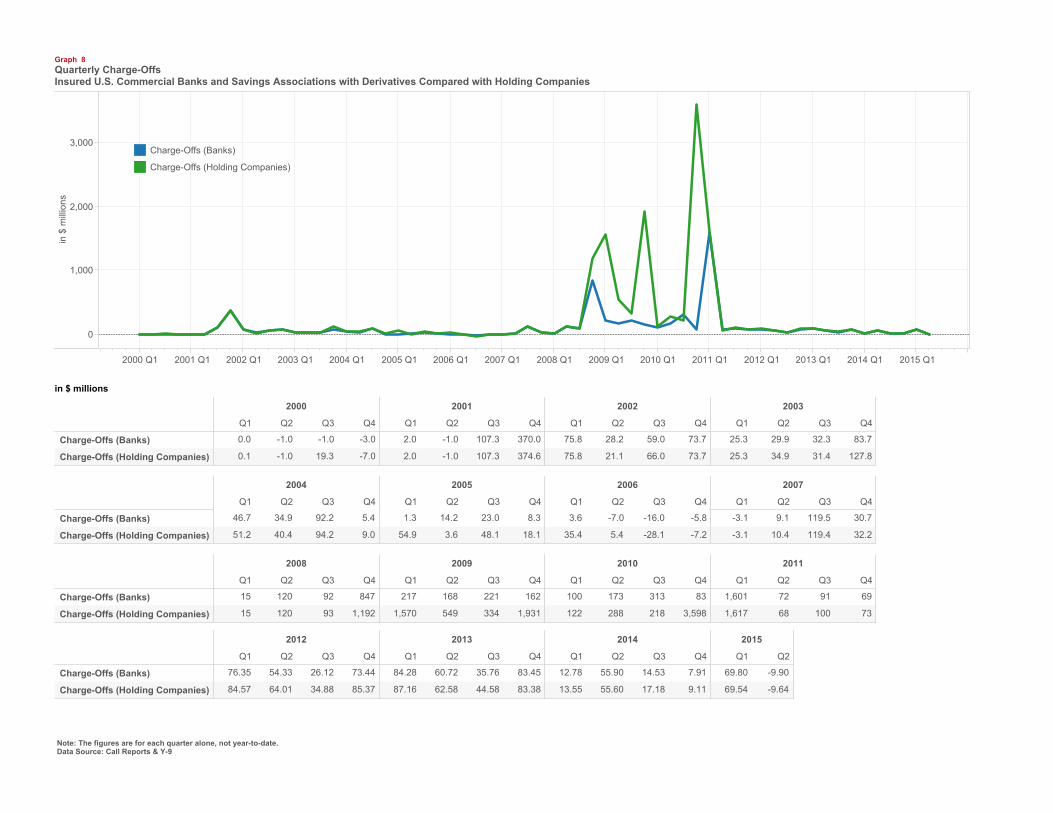
Credit quality metrics for derivatives exposures improved in the second quarter, as banks reported net recoveries of $9.9 million, the first time since 2007 that recoveries exceeded charge-offs. In the first quarter, banks reported $69.8 million of charge-offs. While the number of banks reporting charge-offs increased from 19 to 22, a record 7 banks reported recoveries. Net recoveries in the second quarter of 2015 represented -0.002% of the NCCE from derivative contracts. [See Graph 7.] For comparison purposes, Commercial and Industrial (C&I) loan net charge-offs increased $326.3 million, or 43.3%, to $1.08 trillion. Net C&I charge-offs increased from the first quarter to 0.06% of total C&I loans. Charge-offs of derivatives exposures typically are associated with problem commercial lending exposures, where the borrower has an associated swap transaction. The level of charge-offs of derivatives credit exposures is typically much less than for C&I exposures. Two factors account for the historically favorable charge-off performance of derivatives. First, the credit quality of the typical derivatives counterparty is higher than the credit quality of the typical C&I borrower. Second, most of the large credit exposures from derivatives, whether from other dealers, large non-dealer banks, or hedge funds, are collateralized daily, typically by cash and/or government securities. Market Risk Value-at-Risk Banks control market risk in trading operations primarily by establishing limits against potential losses. VaR is a statistical measure that banks use to quantify the maximum expected loss, over a specified horizon and at a certain confidence level, in normal markets. It is important to emphasize that VaR is not the maximum potential loss; it provides a loss estimate at a specified confidence level. A VaR of $50 million at 99% confidence measured over one trading day, for example, indicates that a trading loss of greater than $50 million in the next day on that portfolio should occur only once in every 100 trading days under normal market conditions. Since VaR does not measure the maximum potential loss, banks stress test trading portfolios to assess the potential for loss beyond the VaR measure. Banks and supervisors have been working to expand the use of stress analyses to complement the VaR risk measurement process banks typically use to assess a bank’s exposure to market risk.
8
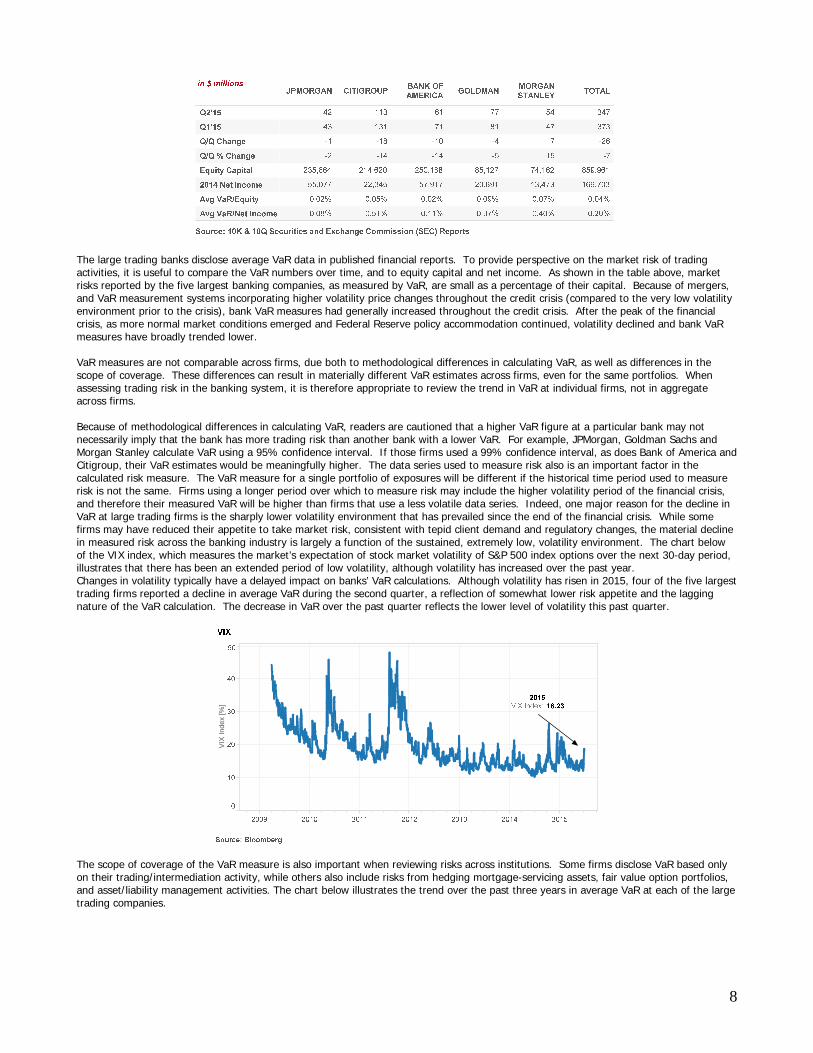
The large trading banks disclose average VaR data in published financial reports. To provide perspective on the market risk of trading activities, it is useful to compare the VaR numbers over time, and to equity capital and net income. As shown in the table above, market risks reported by the five largest banking companies, as measured by VaR, are small as a percentage of their capital. Because of mergers, and VaR measurement systems incorporating higher volatility price changes throughout the credit crisis (compared to the very low volatility environment prior to the crisis), bank VaR measures had generally increased throughout the credit crisis. After the peak of the financial crisis, as more normal market conditions emerged and Federal Reserve policy accommodation continued, volatility declined and bank VaR measures have broadly trended lower. VaR measures are not comparable across firms, due both to methodological differences in calculating VaR, as well as differences in the scope of coverage. These differences can result in materially different VaR estimates across firms, even for the same portfolios. When assessing trading risk in the banking system, it is therefore appropriate to review the trend in VaR at individual firms, not in aggregate across firms. Because of methodological differences in calculating VaR, readers are cautioned that a higher VaR figure at a particular bank may not necessarily imply that the bank has more trading risk than another bank with a lower VaR. For example, JPMorgan, Goldman Sachs and Morgan Stanley calculate VaR using a 95% confidence interval. If those firms used a 99% confidence interval, as does Bank of America and Citigroup, their VaR estimates would be meaningfully higher. The data series used to measure risk also is an important factor in the calculated risk measure. The VaR measure for a single portfolio of exposures will be different if the historical time period used to measure risk is not the same. Firms using a longer period over which to measure risk may include the higher volatility period of the financial crisis, and therefore their measured VaR will be higher than firms that use a less volatile data series. Indeed, one major reason for the decline in VaR at large trading firms is the sharply lower volatility environment that has prevailed since the end of the financial crisis. While some firms may have reduced their appetite to take market risk, consistent with tepid client demand and regulatory changes, the material decline in measured risk across the banking industry is largely a function of the sustained, extremely low, volatility environment. The chart below of the VIX index, which measures the market’s expectation of stock market volatility of S&P 500 index options over the next 30-day period, illustrates that there has been an extended period of low volatility, although volatility has increased over the past year. Changes in volatility typically have a delayed impact on banks’ VaR calculations. Although volatility has risen in 2015, four of the five largest trading firms reported a decline in average VaR during the second quarter, a reflection of somewhat lower risk appetite and the lagging nature of the VaR calculation. The decrease in VaR over the past quarter reflects the lower level of volatility this past quarter.
The scope of coverage of the VaR measure is also important when reviewing risks across institutions. Some firms disclose VaR based only on their trading/intermediation activity, while others also include risks from hedging mortgage-servicing assets, fair value option portfolios, and asset/liability management activities. The chart below illustrates the trend over the past three years in average VaR at each of the large trading companies.
VIX
Inde
x [%
]

9
To test the effectiveness of VaR measurement systems, trading institutions track the number of times that daily losses exceed VaR estimates. Under the Market Risk Rule, which establishes regulatory capital requirements for U.S. commercial banks and savings associations with significant trading activities, a bank’s capital requirement for market risk is based on its VaR measured at a 99% confidence level and assuming a 10-day holding period. Banks back-test their VaR measure by comparing the actual daily profit or loss to the VaR measure. The results of the back-test determine the size of the multiplier applied to the VaR measure in the risk-based capital calculation. The multiplier adds a safety factor to the capital requirements. An “exception” occurs when a dealer has a daily loss in excess of its VaR measure. Some banks disclose the number of such “exceptions” in their published financial reports. Because of the unusually high market volatility and large write-downs in Collateralized Debt Obligations during the financial crisis, as well as poor market liquidity, a number of banks experienced back-test exceptions and therefore an increase in their capital multiplier. Currently, however, none of the top 5 trading banks are required to hold additional capital for market risk due to back-test exceptions. Level 3 Trading Assets Another measure used to assess market risk is the volume of, and changes in, level 3 trading assets. Level 3 assets are assets whose fair value cannot be determined by using observable inputs, such as market prices. Since the peak of the financial crisis at the end of 2008, major dealers have sharply reduced the volume of level 3 trading assets. Because the fair value of these illiquid exposures cannot be determined by using observable inputs, banks estimate their fair values using pricing models based upon assumptions.. Level 3 assets peaked at $204.1 billion at the end of 2008. At the end of the second quarter of 2015, banks held $50.4 billion of level 3 assets, down 15.1% from the first quarter, and 19.4% lower than a year ago. Level 3 assets are $153.7 billion lower (75.3%) than the peak level from 2008.
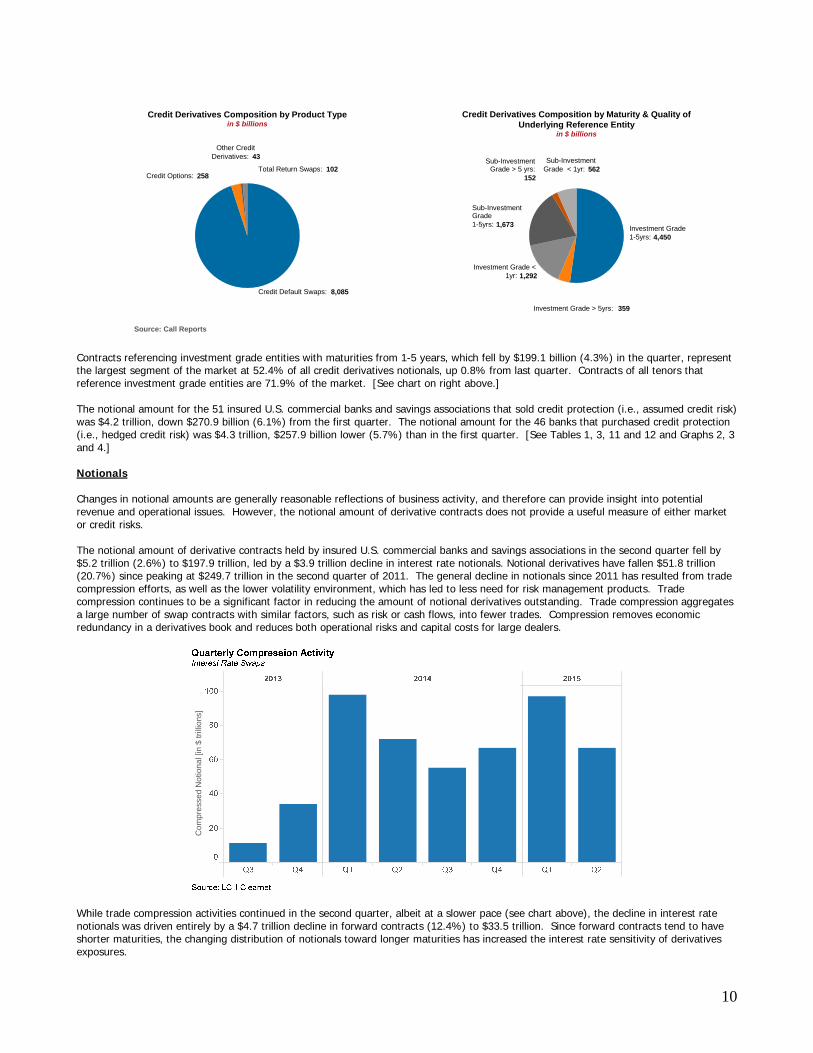
Credit Derivatives The secular trend toward declining notional amounts of credit derivatives continued in the second quarter, with notionals falling another $528.8 billion (5.9%) to $8.5 trillion. Contracts referencing non-investment grade fell $216.8 billion while contracts referencing investment grade firms declined $312.0 billion. The decline in total credit derivatives in the second quarter is the thirteenth in the past fifteen quarters. Credit derivatives outstanding remain well below the peak of $16.4 trillion in the first quarter of 2008. From year-end 2003 to 2008, credit derivative contracts grew at a 100% compounded annual growth rate. Industry efforts to eliminate offsetting trades (“trade compression”), as well as reduced demand for structured products, has led to a decline in credit derivative notionals. Tables 11 and 12 provide detail on individual bank holdings of credit derivatives by product and maturity, as well as the credit quality of the underlying reference entities. As shown in the first chart below, credit default swaps are the dominant product at 95.3% of all credit derivatives notionals. [See charts below, Tables 11 and 12, and Graph 14.]
in $
mill
ions
2007 2008 2009 2010 2011 2012 2013 2014 2015
0
50
100
150
200
Leve
l 3 A
sset
s
Level 3 Assets: 50.4
Level 3 Assetsin $ billions
2Q2015 1Q2015Q/Q
ChangeQ/Q %
Change2Q2014
Y/YChange
Y/Y %Change
TRADING ASSET LEVEL 3 FV MEASURE -19.4%-12.1662.52-15.1%-8.9959.3550.37
Source: Call Reports
10
Contracts referencing investment grade entities with maturities from 1-5 years, which fell by $199.1 billion (4.3%) in the quarter, represent the largest segment of the market at 52.4% of all credit derivatives notionals, up 0.8% from last quarter. Contracts of all tenors that reference investment grade entities are 71.9% of the market. [See chart on right above.] The notional amount for the 51 insured U.S. commercial banks and savings associations that sold credit protection (i.e., assumed credit risk) was $4.2 trillion, down $270.9 billion (6.1%) from the first quarter. The notional amount for the 46 banks that purchased credit protection (i.e., hedged credit risk) was $4.3 trillion, $257.9 billion lower (5.7%) than in the first quarter. [See Tables 1, 3, 11 and 12 and Graphs 2, 3 and 4.] Notionals Changes in notional amounts are generally reasonable reflections of business activity, and therefore can provide insight into potential revenue and operational issues. However, the notional amount of derivative contracts does not provide a useful measure of either market or credit risks. The notional amount of derivative contracts held by insured U.S. commercial banks and savings associations in the second quarter fell by $5.2 trillion (2.6%) to $197.9 trillion, led by a $3.9 trillion decline in interest rate notionals. Notional derivatives have fallen $51.8 trillion (20.7%) since peaking at $249.7 trillion in the second quarter of 2011. The general decline in notionals since 2011 has resulted from trade compression efforts, as well as the lower volatility environment, which has led to less need for risk management products. Trade compression continues to be a significant factor in reducing the amount of notional derivatives outstanding. Trade compression aggregates a large number of swap contracts with similar factors, such as risk or cash flows, into fewer trades. Compression removes economic redundancy in a derivatives book and reduces both operational risks and capital costs for large dealers.
While trade compression activities continued in the second quarter, albeit at a slower pace (see chart above), the decline in interest rate notionals was driven entirely by a $4.7 trillion decline in forward contracts (12.4%) to $33.5 trillion. Since forward contracts tend to have shorter maturities, the changing distribution of notionals toward longer maturities has increased the interest rate sensitivity of derivatives exposures.
Credit Default Swaps: 8,085
Credit Options: 258
Other CreditDerivatives: 43
Total Return Swaps: 102
Credit Derivatives Composition by Product Typein $ billions
Investment Grade1-5yrs: 4,450
Sub-InvestmentGrade < 1yr: 562
Sub-InvestmentGrade > 5 yrs:
152
Sub-InvestmentGrade1-5yrs: 1,673
Investment Grade <1yr: 1,292
Investment Grade > 5yrs: 359
Credit Derivatives Composition by Maturity & Quality ofUnderlying Reference Entity
in $ billions
Source: Call Reports
Co
mp
ress
ed
No
tion
al [
in $
trill
ion
s]

11
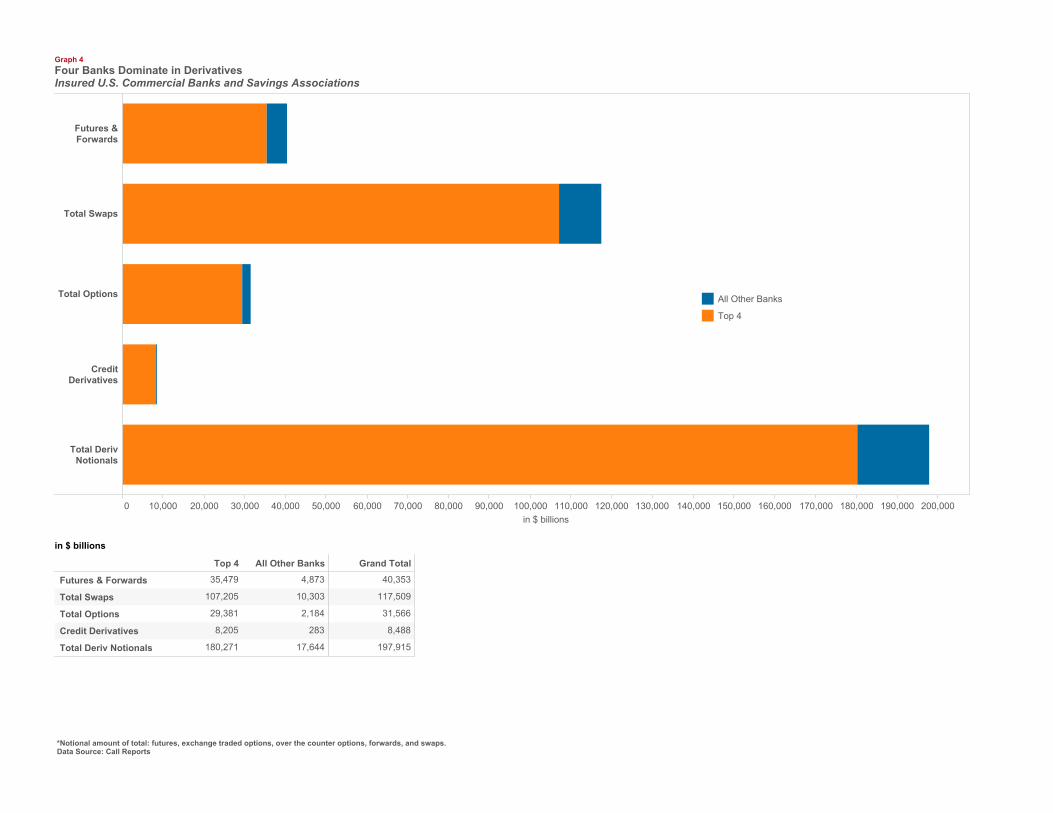
The four banks with the most derivatives activity hold 91.1% of all derivatives, while the largest 25 banks account for nearly 100% of all contracts. [See Tables 3, 5 and Graph 4.]
Interest rate contracts continue to represent the lion’s share of the derivatives market at 77.7% of total derivatives. FX and credit derivatives are 16.1% and 4.3% of total notionals, respectively. Commodity and equity derivatives collectively are less than 2% of total notional derivatives.
Swap contracts continue to represent the bulk of the derivatives market for insured commercial banks at $117.5 trillion, or 59.4% of all notionals.
In the first quarter of 2015, banks began reporting their volumes of both cleared and non-cleared derivatives transactions, as well as risk weights for counterparties in each of these categories. Graph 15 illustrates that in the second quarter 34.9% of the derivatives market is currently cleared. From a market factor perspective, 43.0% of interest rate derivatives contracts outstanding are cleared, while virtually none of the FX derivatives market is cleared. The credit derivatives market remains largely uncleared, as 21.2% of investment grade and 15.9% of non-investment grade transactions are cleared. Cleared derivatives transactions are heavily concentrated at qualified central counterparties (QCCPs), with 86.0% reflecting the 2% risk weight applicable to such counterparties.
in $
bill
ions

12
GLOSSARY OF TERMS Bilateral Netting: A legally enforceable arrangement between a bank and a counterparty that creates a single legal obligation covering all included individual contracts. This means that a bank’s receivable or payable, in the event of the default or insolvency of one of the parties, would be the net sum of all positive and negative fair values of contracts included in the bilateral netting arrangement. Credit Derivative: A financial contract that allows a party to take, or reduce, credit exposure (generally on a bond, loan or index). Our derivatives survey includes over-the-counter (OTC) credit derivatives, such as credit default swaps, total return swaps, and credit spread options. Derivative: A financial contract whose value is derived from the performance of underlying market factors, such as interest rates, currency exchange rates, commodity, credit, and equity prices. Derivative transactions include a wide assortment of financial contracts including structured debt obligations and deposits, swaps, futures, options, caps, floors, collars, forwards and various combinations thereof. Gross Negative Fair Value (GNFV): The sum total of the fair values of contracts where the bank owes money to its counterparties, without taking into account netting. This represents the maximum losses the bank’s counterparties would incur if the bank defaults and there is no netting of contracts, and no bank collateral was held by the counterparties. Gross negative fair values associated with credit derivatives are included. Gross Positive Fair Value (GPFV): The sum total of the fair values of contracts where the bank is owed money by its counterparties, without taking into account netting. This represents the maximum losses a bank could incur if all its counterparties default and there is no netting of contracts, and the bank holds no counterparty collateral. Gross positive fair values associated with credit derivatives are included. Net Current Credit Exposure (NCCE): For a portfolio of derivative contracts, NCCE is the gross positive fair value of contracts less the dollar amount of netting benefits. On any individual contract, current credit exposure (CCE) is the fair value of the contract if positive, and zero when the fair value is negative or zero. NCCE is also the net amount owed to banks if all contracts were immediately liquidated. Notional Amount: The nominal or face amount that is used to calculate payments made on swaps and other risk management products. This amount generally does not change hands and is thus referred to as notional. Over-the-Counter Derivative Contracts: Privately negotiated derivative contracts that are transacted off organized exchanges. Potential Future Exposure (PFE): An estimate of what the current credit exposure (CCE) could be over time, based upon a supervisory formula in the agencies’ risk-based capital rules. PFE is generally determined by multiplying the notional amount of the contract by a credit conversion factor that is based upon the underlying market factor (e.g., interest rates, commodity prices, equity prices, etc.) and the contract’s remaining maturity. However, the risk-based capital rules permit banks to adjust the formulaic PFE measure by the “net to gross ratio,” which proxies the risk-reduction benefits attributable to a valid bilateral netting contract. PFE data in this report uses the amounts upon which banks hold risk-based capital. Total Credit Exposure (TCE): The sum total of net current credit exposure (NCCE) and potential future exposure (PFE). Total Risk-Based Capital: The sum of tier 1 plus tier 2 capital. Tier 1 capital consists of common shareholders’ equity, perpetual preferred shareholders’ equity with noncumulative dividends, retained earnings, and minority interests in the equity accounts of consolidated subsidiaries. Tier 2 capital consists of subordinated debt, intermediate-term preferred stock, cumulative and long-term preferred stock, and a portion of a bank’s allowance for loan and lease losses.

Note: Numbers may not add due to rounding. Total derivative notionals are now reported including credit derivatives, for which regulatory reporting does not differentiate between trading and non-trading.Data Source: Call Reports
2000 2001 2002 2003 2004 2005 2006 2007 2008 2009 2010 2011 2012 2013 2014 2015 2016
0
50,000
100,000
150,000
200,000
250,000
in $ billions
Graph 1
Derivative Notionals by TypeInsured U.S. Commerical Banks and Savings Associations
Total Deriv Notionals Dealer (Trading) End User (Non-Trading) Credit Derivatives
2011
Q1 Q2 Q3 Q4
2012
Q1 Q2 Q3 Q4
2013
Q1 Q2 Q3 Q4
2014
Q1 Q2 Q3 Q4
2015
Q1 Q2
Total Deriv Notionals
Dealer (Trading)
End User (Non-Trading)
Credit Derivatives 14,759
4,613
211,626
230,998
15,661
4,510
227,975
248,146
15,229
4,427
230,067
249,723
14,900
4,081
224,950
243,932
13,190
4,560
204,044
221,794
13,998
4,867
206,772
225,637
13,624
4,843
202,805
221,272
14,051
4,845
209,383
228,279
11,191
4,812
219,990
235,992
12,793
4,610
221,425
238,827
13,327
4,776
214,240
232,342
13,901
4,733
211,353
229,987
9,449
3,918
207,023
220,390
10,408
3,732
225,309
239,449
10,827
3,903
222,078
236,808
11,165
4,008
213,838
229,011
8,488
3,349
186,078
197,915
9,017
3,631
190,472
203,120
in $ billions

*Notional amount of total: futures, exchange traded options, over the counter options, forwards and swaps.Note: Numbers may not add due to roundingData Source: Call Reports
2003 2004 2005 2006 2007 2008 2009 2010 2011 2012 2013 2014 2015
Q4 Q4 Q4 Q4 Q4 Q4 Q4 Q4 Q4 Q4 Q4 Q4 Q1 Q2
0
50,000
100,000
150,000
200,000
in $ billions
Graph 2
Derivative Contracts by ProductInsured U.S. Commercial Banks and Savings Associations
Futures & Forwards Total Options Total Swaps Credit Derivatives
2003
Q4
2004
Q4
2005
Q4
2006
Q4
2007
Q4
2008
Q4
2009
Q4
2010
Q4
2011
Q4
2012
Q4
2013
Q4
2014
Q4
2015
Q1 Q2
Futures & Forwards
Total Options
Total Swaps
Credit Derivatives
Total Deriv Notionals 70,112
0
44,090
14,616
11,406
85,536
0
56,411
17,754
11,370
95,627
0
64,712
18,858
12,057
131,519
9,020
81,340
26,277
14,882
165,559
15,863
103,102
27,727
18,867
211,416
16,029
143,111
29,747
22,529
214,786
14,112
139,138
31,884
29,652
231,099
14,151
149,331
32,078
35,539
230,998
14,759
146,266
32,505
37,469
221,794
13,190
136,608
30,375
41,621
235,992
11,191
152,469
32,305
40,027
220,390
9,449
135,170
32,403
43,368
197,915
8,488
117,509
31,566
40,353
203,120
9,017
117,711
31,855
44,537
in $ billions

*Notional amount of total: futures, exchange traded options, over the counter options, forwards, and swaps.Note: As of 2Q06 equities and commodities types are shown as separate categories. They were previously shown as “Other Derivs.” Numbers may not add due to rounding.Data Source: Call Reports
2003 2004 2005 2006 2007 2008 2009 2010 2011 2012 2013 2014 2015
Q4 Q4 Q4 Q4 Q4 Q4 Q4 Q4 Q4 Q4 Q4 Q4 Q1 Q2
0
50,000
100,000
150,000
200,000
in $ billions
Graph 3
Derivatives Contracts by TypeInsured U.S. Commercial Banks and Savings Associations
2003
Q4
2004
Q4
2005
Q4
2006
Q4
2007
Q4
2008
Q4
2009
Q4
2010
Q4
2011
Q4
2012
Q4
2013
Q4
2014
Q4
2015
Q1 Q2
Interest Rate
Foreign Exchange
Equities
Commodities
Credit Derivatives
Total Deriv Notionals 70,112
0
223
829
7,185
61,876
85,536
0
284
1,112
8,607
75,533
95,627
0
552
1,255
9,289
84,530
131,519
9,020
893
2,271
11,900
107,435
165,559
15,863
1,067
2,524
16,614
129,491
211,416
16,029
1,061
2,207
16,224
175,895
214,786
14,112
979
1,685
16,555
181,454
231,099
14,151
1,195
1,364
20,990
193,399
230,998
14,759
1,330
1,606
25,436
187,866
221,794
13,190
1,397
1,970
27,587
177,650
235,992
11,191
1,209
2,028
28,480
193,084
220,390
9,449
1,211
2,537
33,183
174,010
197,915
8,488
1,429
2,364
31,880
153,754
203,120
9,017
1,234
2,360
32,783
157,728
in $ billions
Interest Rate Foreign Exchange Equities Commodities Credit Derivatives
*Notional amount of total: futures, exchange traded options, over the counter options, forwards, and swaps.Data Source: Call Reports
0 10,000 20,000 30,000 40,000 50,000 60,000 70,000 80,000 90,000 100,000 110,000 120,000 130,000 140,000 150,000 160,000 170,000 180,000 190,000 200,000in $ billions
Futures &Forwards
Total Swaps
Total Options
CreditDerivatives
Total DerivNotionals
Graph 4
Four Banks Dominate in DerivativesInsured U.S. Commercial Banks and Savings Associations
Top 4 All Other Banks Grand Total
Futures & Forwards
Total Swaps
Total Options
Credit Derivatives
Total Deriv Notionals 197,915
8,488
31,566
117,509
40,353
17,644
283
2,184
10,303
4,873
180,271
8,205
29,381
107,205
35,479
in $ billions
All Other Banks
Top 4

Note: The methodology to calculate the Credit Risk Exposure to Capital ratio for the Top 4 category uses a weighted average of total current credit exposure.Data Source: Call Reports
Graph 5
Credit Exposure to Risk-Based Capital (in %)Top 4 Insured U.S. Commercial Banks and Savings Associations by Derivative Holdings
JPMorgan Chase Bank NA
2010 2011 2012 2014 2015
Q1 Q2 Q3 Q4 Q1 Q2 Q3 Q4 Q1 Q2 Q3 Q4 Q1 Q2 Q3 Q4 Q1 Q2
0
100
200
Bank of America NA
2010 2011 2012 2014 2015
Q1 Q2 Q3 Q4 Q1 Q2 Q3 Q4 Q1 Q2 Q3 Q4 Q1 Q2 Q3 Q4 Q1 Q2
0
50
100
150
Citibank NA
2010 2011 2012 2014 2015
Q1 Q2 Q3 Q4 Q1 Q2 Q3 Q4 Q1 Q2 Q3 Q4 Q1 Q2 Q3 Q4 Q1 Q2
0
50
100
150
200
Goldman Sachs
2010 2011 2012 2014 2015
Q1 Q2 Q3 Q4 Q1 Q2 Q3 Q4 Q1 Q2 Q3 Q4 Q1 Q2 Q3 Q4 Q1 Q2
0
200
400
600
800
2010
Q1 Q2 Q3 Q4
2011
Q1 Q2 Q3 Q4
2012
Q1 Q2 Q3 Q4
2014
Q1 Q2 Q3 Q4
2015
Q1 Q2
JPMorgan Chase Bank NA
Bank of America NA
Citibank NA
Goldman Sachs 628
182
174
265
638
197
177
267
685
171
166
257
666
180
164
266
794
177
176
256
801
195
187
285
788
203
182
274
781
185
182
275
705
170
132
229
727
170
139
247
738
171
141
246
751
172
149
250
516
173
93
177
539
190
107
181
620
156
107
189
689
147
109
183
563
183
95
228
547
182
100
229
278282287285 297313310304 271281282284 211224240248 242237TOTAL

2009 Q2 2009 Q4 2010 Q2 2010 Q4 2011 Q2 2011 Q4 2012 Q2 2012 Q4 2013 Q2 2013 Q4 2014 Q2 2014 Q4 2015 Q2
86.5
87.0
87.5
88.0
88.5
89.0
89.5
90.0
90.5
91.0
Netting Benefit %
2015 Q2Netting % RC-L/R: 86.8
Graph 6
Netting Benefit: Amount of Gross Credit Exposure Eliminated Through Bilateral NettingInsured U.S. Commercial Banks and Savings Associations by Derivative Holdings
2009
Q2 Q3 Q4
2010
Q1 Q2 Q3 Q4
2011
Q1 Q2 Q3 Q4
2012
Q1 Q2 Q3 Q4
2013
Q1 Q2 Q3 Q4
2014
Q1 Q2 Q3 Q4
2015
Q1 Q2
88.588.888.0 89.190.390.088.9 90.490.288.688.2 90.290.390.389.9 89.389.789.189.8 88.988.689.088.7 86.887.6
Netting Benefit (%)
*The netting benefit is defined as: $ amount of netting benefits/gross positive fair value.Data Source: Call Reports, beginning 1Q2015 RC-R otherwise RC-L

Note: The figures are for each quarter alone, not year-to-date.NCCE: Pre 2Q09 (RC-R); 2Q09-4Q14 (RC-L); 1Q15 onward (RC-R)Data Source: Call Reports
2000 2001 2002 2003 2004 2005 2006 2007 2008 2009 2010 2011 2012 2013 2014 2015 2016
0
500
1,000
1,500
Charge Offs [in $ millions]
0.000
0.001
0.002
0.003
0.004
0.005
Charge-Offs as % NCCE
Graph 7Quarterly Charge-Offs/(Recoveries) from DerivativesInsured U.S. Commercial Banks and Savings Associations with Derivatives
2000
Q1 Q2 Q3 Q4
2001
Q1 Q2 Q3 Q4
2002
Q1 Q2 Q3 Q4
2003
Q1 Q2 Q3 Q4
Charge-Offs (Banks) -3.0-1.0-1.00.0 370.0107.3-1.02.0 73.759.028.275.8 83.732.329.925.3
in $ millions
2004
Q1 Q2 Q3 Q4
2005
Q1 Q2 Q3 Q4
2006
Q1 Q2 Q3 Q4
2007
Q1 Q2 Q3 Q4
Charge-Offs (Banks) 5.492.234.946.7 8.323.014.21.3 -5.8-16.0-7.03.6 30.7119.59.1-3.1
2008
Q1 Q2 Q3 Q4
2009
Q1 Q2 Q3 Q4
2010
Q1 Q2 Q3 Q4
2011
Q1 Q2 Q3 Q4
Charge-Offs (Banks) 8479212015 162221168217 83313173100 6991721,601
2012
Q1 Q2 Q3 Q4
2013
Q1 Q2 Q3 Q4
2014
Q1 Q2 Q3 Q4
2015
Q1 Q2
Charge-Offs (Banks) 73.4426.1254.3376.35 83.4535.7660.7284.28 7.9114.5355.9012.78 -9.9069.80
Charge-Offs (Banks)
Charge-Offs as % NCCE
Note: The figures are for each quarter alone, not year-to-date.Data Source: Call Reports & Y-9
2000 Q1 2001 Q1 2002 Q1 2003 Q1 2004 Q1 2005 Q1 2006 Q1 2007 Q1 2008 Q1 2009 Q1 2010 Q1 2011 Q1 2012 Q1 2013 Q1 2014 Q1 2015 Q1
0
1,000
2,000
3,000
in $ millions
Graph 8Quarterly Charge-OffsInsured U.S. Commercial Banks and Savings Associations with Derivatives Compared with Holding Companies
2000
Q1 Q2 Q3 Q4
2001
Q1 Q2 Q3 Q4
2002
Q1 Q2 Q3 Q4
2003
Q1 Q2 Q3 Q4
Charge-Offs (Banks)
Charge-Offs (Holding Companies) -7.0
-3.0
19.3
-1.0
-1.0
-1.0
0.1
0.0
374.6
370.0
107.3
107.3
-1.0
-1.0
2.0
2.0
73.7
73.7
66.0
59.0
21.1
28.2
75.8
75.8
127.8
83.7
31.4
32.3
34.9
29.9
25.3
25.3
in $ millions
2004
Q1 Q2 Q3 Q4
2005
Q1 Q2 Q3 Q4
2006
Q1 Q2 Q3 Q4
2007
Q1 Q2 Q3 Q4
Charge-Offs (Banks)
Charge-Offs (Holding Companies) 9.0
5.4
94.2
92.2
40.4
34.9
51.2
46.7
18.1
8.3
48.1
23.0
3.6
14.2
54.9
1.3
-7.2
-5.8
-28.1
-16.0
5.4
-7.0
35.4
3.6
32.2
30.7
119.4
119.5
10.4
9.1
-3.1
-3.1
2012
Q1 Q2 Q3 Q4
2013
Q1 Q2 Q3 Q4
2014
Q1 Q2 Q3 Q4
2015
Q1 Q2
Charge-Offs (Banks)
Charge-Offs (Holding Companies) 85.37
73.44
34.88
26.12
64.01
54.33
84.57
76.35
83.38
83.45
44.58
35.76
62.58
60.72
87.16
84.28
9.11
7.91
17.18
14.53
55.60
55.90
13.55
12.78
-9.64
-9.90
69.54
69.80
2008
Q1 Q2 Q3 Q4
2009
Q1 Q2 Q3 Q4
2010
Q1 Q2 Q3 Q4
2011
Q1 Q2 Q3 Q4
Charge-Offs (Banks)
Charge-Offs (Holding Companies) 1,192
847
93
92
120
120
15
15
1,931
162
334
221
549
168
1,570
217
3,598
83
218
313
288
173
122
100
73
69
100
91
68
72
1,617
1,601
Charge-Offs (Banks)
Charge-Offs (Holding Companies)

*The trading revenue figures above are for cash and derivative activities. Revenue figures are for each quarter alone, not year-to-date.Note: Numbers may not add due to rounding.Data Source: Call Reports
2010
Q1 Q2 Q3 Q4
2011
Q1 Q2 Q3 Q4
2012
Q1 Q2 Q3 Q4
2013
Q1 Q2 Q3 Q4
2014
Q1 Q2 Q3 Q4
2015
Q1 Q2
Interest Rate
Foreign Exchange
Equity
Commodity & Other
Credit
Total Trading Revenue 3,472
-472
258
301
1,903
1,482
4,106
515
94
404
-1,069
4,161
6,676
1,937
-25
417
4,274
73
8,269
2,727
297
979
3,962
304
2,539
-102
259
-111
2,235
257
8,451
1,764
558
1,442
2,595
2,093
6,624
1,406
307
808
491
3,611
7,671
1,699
319
762
35
4,855
4,778
-713
30
187
753
4,521
5,093
-1,242
350
508
1,020
4,457
2,147
-4,243
390
1,140
1,990
2,870
6,359
-1,444
412
260
1,505
5,627
2,911
245
265
491
1,550
360
4,527
222
481
233
588
3,002
7,125
339
292
924
3,303
2,268
7,520
890
364
838
3,185
2,243
4,471
-79
335
650
2,902
664
5,612
535
411
654
4,830
-819
6,428
500
293
726
2,026
2,883
6,192
756
672
612
2,137
2,015
5,517
530
129
598
855
3,404
7,671
624
587
797
4,703
960
in $ millions
1Q 2010 3Q 2010 1Q 2011 3Q 2011 1Q 2012 3Q 2012 1Q 2013 3Q 2013 1Q 2014 3Q 2014 1Q 2015 3Q 2015
-4,000
-2,000
0
2,000
4,000
6,000
8,000
in $ millions
Graph 9Quarterly Trading Revenue (Cash & Derivative Positions)Insured U.S. Commercial Banks and Savings Associations
Interest Rate Foreign Exchange Equity Commodity & Other Credit Total Trading Revenue

*The trading revenue figures above are for cash and derivative activities. Revenue figures are quarterly, not year-to-date numbers.Note: Gross Revenue equals interest income plus non-interest income.Data Source: Call Reports
JPMorgan Chase Bank NA
2010 2011 2012 2014 2015
Q1 Q2 Q3 Q4 Q1 Q2 Q3 Q4 Q1 Q2 Q3 Q4 Q1 Q2 Q3 Q4 Q1 Q2
0
5
10
15
Trading Revenue to Gross Revenue
Graph 10Quarterly Trading Revenue (Cash & Derivatives Positions) as a Percentage of Gross Revenue (in %)Top 4 Insured U.S. Commercial Banks and Savings Associations by Derivative Holdings
Bank of America NA
2010 2011 2012 2014 2015
Q1 Q2 Q3 Q4 Q1 Q2 Q3 Q4 Q1 Q2 Q3 Q4 Q1 Q2 Q3 Q4 Q1 Q2
0
2
4
6
8
Trading Revenue to Gross Revenue
Citibank NA
2010 2011 2012 2014 2015
Q1 Q2 Q3 Q4 Q1 Q2 Q3 Q4 Q1 Q2 Q3 Q4 Q1 Q2 Q3 Q4 Q1 Q2
0
5
10
15
Trading Revenue to Gross Revenue
Goldman Sachs
2010 2011 2012 2014 2015
Q1 Q2 Q3 Q4 Q1 Q2 Q3 Q4 Q1 Q2 Q3 Q4 Q1 Q2 Q3 Q4 Q1 Q2
0
20
40
60
Trading Revenue to Gross Revenue
2010
Q1 Q2 Q3 Q4
2011
Q1 Q2 Q3 Q4
2012
Q1 Q2 Q3 Q4
2014
Q1 Q2 Q3 Q4
2015
Q1 Q2
JPMorgan Chase Bank NA
Bank of America NA
Citibank NA
Goldman Sachs 7.04
2.15
1.82
6.35
52.60
4.84
5.76
5.39
59.50
14.82
4.44
11.74
71.25
12.00
5.97
15.57
30.93
1.18
0.07
4.33
56.57
14.79
9.48
14.82
57.61
11.11
5.60
10.84
54.26
9.44
6.34
15.64
17.68
3.94
1.35
10.50
33.26
5.74
1.28
13.79
12.48
5.36
4.16
-1.48
65.27
10.95
0.67
10.24
13.06
4.78
3.68
6.97
13.74
5.48
5.11
13.47
22.21
7.43
9.11
13.31
23.67
8.51
7.80
12.63
17.32
8.41
0.49
13.25
15.85
9.17
6.78
17.73
Trading Revenue to Gross Revenue (%)*
3.666.2511.3812.80 2.3614.1610.3211.67 5.727.862.788.70 5.358.5310.4510.06 7.6211.68TOTAL

2000 2001 2002 2003 2004 2005 2006 2007 2008 2009 2010 2011 2012 2013 2014 2015
Q4 Q4 Q4 Q4 Q4 Q4 Q4 Q4 Q4 Q4 Q4 Q4 Q4 Q4 Q4 Q1 Q2
0
50,000
100,000
150,000
in $ billions
Graph 11Notional Amounts of Interest Rate and Foreign Exchange + Gold Contracts by MaturityInsured U.S. Commercial Banks and Savings Associations Interest Rate
IR: < 1 yr IR: 1-5 yr IR: > 5 yrs
2000 2001 2002 2003 2004 2005 2006 2007 2008 2009 2010 2011 2012 2013 2014 2015
Q4 Q4 Q4 Q4 Q4 Q4 Q4 Q4 Q4 Q4 Q4 Q4 Q4 Q4 Q4 Q1 Q2
0
10,000
20,000
30,000
in $ billions
FX & Gold
FX&GOLD: < 1 yr FX&GOLD: 1-5 yr FX&GOLD: > 5 yrs
2000
Q4
2001
Q4
2002
Q4
2003
Q4
2004
Q4
2005
Q4
2006
Q4
2007
Q4
2008
Q4
2009
Q4
2010
Q4
2011
Q4
2012
Q4
2013
Q4
2014
Q4
2015
Q1 Q2
IR: < 1 yr
IR: 1-5 yr
IR: > 5 yrs
FX&GOLD: < 1 yr
FX&GOLD: 1-5 yr
FX&GOLD: > 5 yrs 361
626
4,397
5,843
9,925
9,708
499
686
3,816
7,451
11,709
10,379
439
857
4,078
9,735
14,328
12,982
582
1,146
4,510
13,117
20,404
13,581
762
1,317
5,384
16,492
25,893
15,921
689
1,381
5,728
19,825
27,683
18,483
594
1,452
7,730
23,273
31,386
29,552
622
1,639
11,660
27,724
37,222
39,085
1,082
2,195
10,640
36,868
47,456
58,618
1,347
2,473
10,490
26,374
33,970
81,236
1,290
2,462
14,629
24,307
33,497
90,843
1,503
3,117
17,632
24,168
32,750
87,812
1,480
2,910
18,386
21,175
30,191
82,948
1,029
2,341
18,372
24,630
44,157
77,758
969
2,587
22,145
22,214
33,727
71,809
1,613
3,859
25,075
35,838
54,760
63,466
1,612
3,917
25,507
35,099
54,762
68,441
in $ billions
Note: Figures above exclude foreign exchange contracts with an original maturity of 14 days or less, written options, basis swaps, and any other contracts not subject to risk-based capital requirements.Effective Q1 2015, the reporting form and call report instructions changed. Schedule RC-R now requires banks to report gold and FX notionals in aggregate, rather than separately. Data Source: Call Reports

2000 2001 2002 2003 2004 2005 2006 2007 2008 2009 2010 2011 2012 2013 2014 2015
Q4 Q4 Q4 Q4 Q4 Q4 Q4 Q4 Q4 Q4 Q4 Q4 Q4 Q4 Q4 Q1 Q2
0
10
20
30
in $ billions
Graph 12Notional Amounts of Precious Metals Contracts by MaturityInsured U.S. Commercial Banks and Savings Associations
Precious Metals
2000
Q4
2001
Q4
2002
Q4
2003
Q4
2004
Q4
2005
Q4
2006
Q4
2007
Q4
2008
Q4
2009
Q4
2010
Q4
2011
Q4
2012
Q4
2013
Q4
2014
Q4
2015
Q1 Q2
Prec Met: < 1 yr
Prec Met: 1-5 yr
Prec Met: > 5 yrs 0.16
0.25
2.51
0.00
0.23
2.44
0.00
0.46
2.72
0.00
0.33
3.87
0.00
0.51
4.04
0.06
1.29
8.59
0.33
1.75
10.35
0.01
2.10
10.72
0.00
1.51
7.55
0.00
1.24
11.55
0.03
1.89
17.47
0.10
4.74
21.12
0.03
5.82
27.68
0.00
3.80
21.41
0.29
2.84
19.29
0.02
3.43
31.80
0.00
2.96
23.98
Prec Met: < 1 yr Prec Met: 1-5 yr Prec Met: > 5 yrs
Note: Figures above exclude foreign exchange contracts with an original maturity of 14 days or less, written options, basis swaps, and any other contracts not subject to risk-based capital requirements.Data Source: Call Reports

2000 2001 2002 2003 2004 2005 2006 2007 2008 2009 2010 2011 2012 2013 2014 2015
Q4 Q4 Q4 Q4 Q4 Q4 Q4 Q4 Q4 Q4 Q4 Q4 Q4 Q4 Q4 Q1 Q2
0
1,000
2,000
3,000
4,000
in $ billions
Graph 13Notional Amounts of Commodity and Equity Contracts by MaturityInsured U.S. Commercial Banks and Savings Associations Commodity
Comm: < 1 yr Comm: 1-5 yr Comm: > 5yrs
2000 2001 2002 2003 2004 2005 2006 2007 2008 2009 2010 2011 2012 2013 2014 2015
Q4 Q4 Q4 Q4 Q4 Q4 Q4 Q4 Q4 Q4 Q4 Q4 Q4 Q4 Q4 Q1 Q2
0
1,000
2,000
in $ billions
Equity
2000
Q4
2001
Q4
2002
Q4
2003
Q4
2004
Q4
2005
Q4
2006
Q4
2007
Q4
2008
Q4
2009
Q4
2010
Q4
2011
Q4
2012
Q4
2013
Q4
2014
Q4
2015
Q1 Q2
Comm: < 1 yr
Comm: 1-5 yr
Comm: > 5yrs
Equity: < 1 yr
Equity: 1-5 yr
Equity: > 5 yrs 38
180
162
11
27
36
18
209
121
2
25
31
25
249
127
9
35
55
84
674
197
14
103
43
140
736
273
40
205
64
383
1,428
321
175
707
133
45
221
341
20
235
185
70
297
473
25
297
206
72
256
409
43
233
179
82
228
312
33
198
176
85
191
296
25
209
203
94
210
427
46
209
261
82
262
627
28
208
261
136
291
645
6
144
235
101
352
996
20
164
257
163
580
1,567
32
228
796
168
519
1,471
22
376
3,980
in $ billions
Equity: < 1 yr Equity: 1-5 yr Equity: > 5 yrs
Note: Figures above exclude foreign exchange contracts with an original maturity of 14 days or less, written options, basis swaps, and any other contracts not subject to risk-based capital requirements.Data Source: Call Reports

2010 2011 2012 2013 2014 2015
Q1 Q2 Q3 Q4 Q1 Q2 Q3 Q4 Q1 Q2 Q3 Q4 Q1 Q2 Q3 Q4 Q1 Q2 Q3 Q4 Q1 Q2
0
2,000
4,000
6,000
8,000
10,000
12,000
14,000
16,000
in $ billions
Graph 14Notional Amounts of Credit Derivative Contracts by Credit Quality and MaturityInsured U.S. Commercial Banks and Savings Associations
2010
Q1 Q2 Q3 Q4
2011
Q1 Q2 Q3 Q4
2012
Q1 Q2 Q3 Q4
2013
Q1 Q2 Q3 Q4
2014
Q1 Q2 Q3 Q4
2015
Q1 Q2
Investment-Grade: < 1yr
Investment-Grade: 1-5 yr
Investment-Grade: > 5 yrs
Total Investment Grade 8,033
1,446
5,731
856
8,402
1,681
5,850
871
9,145
1,803
6,372
970
9,581
2,310
6,286
986
8,742
1,220
5,963
1,559
9,326
1,699
6,508
1,119
9,151
1,586
6,564
1,002
8,447
1,614
5,928
905
8,326
736
5,832
1,757
8,723
1,200
5,580
1,943
8,592
1,104
5,567
1,921
8,513
1,386
5,519
1,607
7,455
409
5,661
1,384
8,228
552
6,127
1,548
8,541
455
6,536
1,550
8,906
948
6,168
1,790
6,764
382
5,007
1,375
7,633
433
5,722
1,478
8,064
448
5,909
1,707
8,218
577
6,227
1,414
6,101
359
4,450
1,292
6,413
508
4,649
1,256
in $ billions
Sub-Investment-Grade: < 1yr
Sub-Investment-Grade: 1-5 yr
Sub-Investment-Grade: > 5 yrs
Total Sub-Investment Grade 6,118
1,254
4,073
791
6,148
1,400
3,998
750
4,816
968
3,263
585
4,870
1,101
3,195
574
6,017
885
3,797
1,335
6,336
1,180
4,131
1,024
6,078
1,083
4,056
939
6,453
1,403
4,217
833
4,865
352
3,473
1,040
5,275
623
3,349
1,303
5,032
541
3,139
1,353
5,538
835
3,413
1,290
3,736
179
2,792
765
4,565
262
3,424
879
4,786
197
3,656
933
4,995
414
3,491
1,090
2,685
140
1,887
658
2,775
157
1,948
671
2,763
160
1,960
642
2,946
200
2,127
619
2,387
152
1,673
562
2,604
194
1,813
596
Investment-Grade: < 1yr Investment-Grade: 1-5 yr Investment-Grade: > 5 yrs Sub-Investment-Grade: < 1yr Sub-Investment-Grade: 1-5 yr Sub-Investment-Grade: > 5 yrs
Note: Figures above exclude foreign exchange contracts with an original maturity of 14 days or less, written options, basis swaps, and any other contracts not subject to risk-based capital requirements.Data Source: Call Reports

Interest Rate
Foreign Exchange
Equity
Precious Metals
Credit
Investment Grade Non-Investment Grade
Other
BAC C
GS
HSBC
JPM
MS
WFC
BAC C
GS
HSBC
JPM
MS
WFC
BAC C
GS
HSBC
JPM
MS
WFC
BAC C
GS
HSBC
JPM
MS
WFC
BAC C
GS
HSBC
JPM
MS
WFC
BAC C
GS
HSBC
JPM
MS
WFC
BAC C
GS
HSBC
JPM
MS
WFC
0
20,000
40,000
in $ billions
Graph 15Notional Amounts of Over-The-Counter and Centrally Cleared Derivative ContractsInsured U.S. Commercial Banks and Savings Associations
Bank Name
Interest Rate
Cleared Uncleared
Foreign Exchange
Cleared Uncleared
Equity
Cleared Uncleared
Precious Metals
Cleared Uncleared
Credit
Investment Grade
Cleared Uncleared
Non-Investment Grade
Cleared Uncleared
Other
Cleared Uncleared
GrandTotal
JPMCBACGSHSBCWFCMSGrand Total 86,567
11,1771,31932,3937,35019,34724,981
65,1990
4,1791,58510,62913,55416,41418,838
28,1911,7623511,1158246,5757,7029,864
823000291140
1,96006634522933111,205
309025003114239
3402800420
10000010
3,8891151938787612,102
1,0470080
371178490
1,7504164361569212845
3300150
10967147
9030350840131690
1150220005043
190,3781,7715,8744,16944,05929,79845,20459,503
in $ billions
Bank Name
Interest Rate
Cleared Uncleared
Foreign Exchange
Cleared Uncleared
Equity
Cleared Uncleared
Precious Metals
Cleared Uncleared
Credit
Investment Grade
Cleared Uncleared
Non-Investment Grade
Cleared Uncleared
Other
Cleared UnclearedJPMCBACGSHSBCWFCMS 100%
22%45%75%35%54%57%
0%78%55%25%65%46%43%
100%100%100%100%100%100%100%
0%0%0%0%0%0%0%
73%100%100%90%96%83%
27%0%0%10%4%17%
100%100%
81%100%
0%0%
19%0%
100%100%86%100%70%81%81%
0%0%14%0%30%19%19%
100%93%89%100%84%76%85%
0%7%11%0%16%24%15%
62%100%100%100%72%94%
38%0%0%0%28%6%
% of Total
1,2631,034 2,2703 391 00 40 40 390 4,658
ALL OTHER
87,83066,233 30,46286 2,000310 341 3,8931,047 1,753330 942115 195,036
TOTAL
Data Source: Call Reports, Schedule RC-R.
Cleared
Uncleared

TABLE 1
TOTALTOTAL TOTAL TOTAL TOTAL TOTAL CREDIT
TOTAL TOTAL FUTURES OPTIONS FORWARDS SWAPS OPTIONS DERIVATIVES SPOTRANK BANK NAME STATE ASSETS DERIVATIVES (EXCH TR) (EXCH TR) (OTC) (OTC) (OTC) (OTC) FX1 JPMORGAN CHASE BANK NA OH $1,971,380 $53,319,455 $1,309,323 $1,559,276 $9,701,149 $27,984,692 $9,083,422 $3,681,593 $750,0902 CITIBANK NATIONAL ASSN SD 1,336,201 52,169,657 1,316,643 766,988 7,298,189 32,334,235 8,024,321 2,429,281 1,421,0773 GOLDMAN SACHS BANK USA NY 122,681 45,718,947 1,502,901 1,148,482 5,173,545 31,518,699 6,207,499 167,821 16,4894 BANK OF AMERICA NA NC 1,606,232 29,062,647 2,137,033 188,099 7,040,486 15,367,800 2,403,403 1,925,826 595,3105 Wells Fargo Bank NA SD 1,553,871 6,091,938 312,176 131,326 596,428 4,470,984 551,155 29,869 10,4016 HSBC NA VA 190,500 4,567,318 76,492 24,471 933,141 2,940,737 371,794 220,682 65,1647 MORGAN STANLEY BANK NA UT 126,643 2,153,784 19,065 3,924 398,595 1,056,039 670,719 5,442 55,2298 STATE STREET BANK&TRUST CO MA 289,425 1,315,480 12,127 0 1,270,468 4,629 28,027 229 68,6399 BANK OF NEW YORK MELLON NY 320,204 1,187,765 52,125 1,019 564,703 475,355 94,563 0 80,01010 PNC BANK NATIONAL ASSN DE 343,630 374,547 41,426 30,000 20,705 246,109 31,134 5,174 1,01111 SUNTRUST BANK GA 184,223 258,557 23,153 15,175 17,785 135,691 61,935 4,818 10712 NORTHERN TRUST CO IL 119,600 257,570 0 0 244,341 12,481 748 0 21,02513 TD BANK NATIONAL ASSN DE 235,030 182,927 0 0 13,077 168,683 501 667 1914 U S BANK NATIONAL ASSN OH 414,002 174,729 4,439 3,125 60,558 81,799 20,712 4,096 1,13715 REGIONS BANK AL 120,932 76,824 2,584 77 15,933 52,698 3,876 1,658 1116 MUFG UNION BANK NA CA 113,525 76,509 4,032 0 3,019 58,614 10,835 10 46217 FIFTH THIRD BANK OH 139,250 71,195 467 144 8,994 43,958 15,539 2,092 57518 KEYBANK NATIONAL ASSN OH 92,481 67,860 13,090 0 7,367 41,631 5,267 505 1,19619 BRANCH BANKING&TRUST CO NC 186,643 62,206 629 0 12,024 39,008 10,545 0 4020 CAPITAL ONE NATIONAL ASSN VA 255,291 59,565 0 0 1,798 56,188 12 1,568 821 CITIZENS BANK NATIONAL ASSN RI 106,948 44,239 0 0 8,873 31,362 2,568 1,436 19122 BOKF NATIONAL ASSN OK 30,616 43,156 232 366 37,461 2,863 2,233 0 2723 HUNTINGTON NATIONAL BANK OH 68,662 33,184 71 0 2,783 27,436 1,784 1,110 424 COMPASS BANK AL 82,894 31,370 447 0 2,146 22,602 6,176 0 6625 CAPITAL ONE BANK USA NA VA 93,338 26,958 0 0 8,249 18,709 0 0 0
TOP 25 COMMERCIAL BANKS, SAs & TCs WITH DERIVATIVES $10,104,203 $197,428,388 $6,828,455 $3,872,471 $33,441,817 $117,193,001 $27,608,769 $8,483,875 $3,088,288OTHER COMMERCIAL BANKS, SAs & TCs WITH DERIVATIVES 4,084,754 486,246 2,017 1,251 80,230 315,561 83,267 3,920 1,854TOTAL COMMERCIAL BANKS, SAs & TCs WITH DERIVATIVES 14,188,957 197,914,633 6,830,472 3,873,723 33,522,047 117,508,562 27,692,035 8,487,795 3,090,142
Note: Before the first quarter of 1995 total derivatives included spot foreign exchange. Beginning in the first quarter, 1995, spot foreign exchange was reported separately.Note: Numbers may not add due to rounding.Data source: Call Reports, schedule RC-L
NOTIONAL AMOUNT OF DERIVATIVE CONTRACTSTOP 25 COMMERCIAL BANKS, SAVINGS ASSOCIATIONS AND TRUST COMPANIES IN DERIVATIVES
June 30, 2015, $ MILLIONS
Note: Credit derivatives have been included in the sum of total derivatives. Credit derivatives have been included as an "over the counter" category, although the Call Report does not differentiate by market currently.

TABLE 2
CREDITTOTAL TOTAL FUTURES OPTIONS FORWARDS SWAPS OPTIONS DERIVATIVES SPOT
RANK HOLDING COMPANY STATE ASSETS DERIVATIVES (EXCH TR) (EXCH TR) (OTC) (OTC) (OTC) (OTC) FX1 CITIGROUP INC. NY $1,829,370 $55,293,239 $2,239,639 $3,519,550 $8,192,730 $31,174,749 $7,770,115 $2,396,456 $1,397,7402 GOLDMAN SACHS GROUP, INC., THE NY 859,932 53,008,470 1,773,927 2,452,718 7,346,162 30,819,292 8,328,186 2,288,185 304,4833 JPMORGAN CHASE & CO. NY 2,447,994 52,957,671 1,329,916 1,661,933 10,060,736 27,403,246 8,821,680 3,680,160 749,9044 BANK OF AMERICA CORPORATION NC 2,152,082 45,662,998 2,799,459 926,052 10,298,244 24,934,086 4,581,568 2,123,589 492,9365 MORGAN STANLEY NY 825,755 32,975,519 1,904,823 1,523,202 3,393,836 18,753,632 5,754,245 1,645,781 48,6306 WELLS FARGO & COMPANY CA 1,720,617 6,042,653 322,860 146,476 627,533 4,369,687 547,637 28,460 10,3917 HSBC NORTH AMERICA HOLDINGS INC. NY 277,249 4,571,245 82,882 24,621 936,902 2,928,512 377,646 220,682 65,1648 STATE STREET CORPORATION MA 294,571 1,320,548 12,354 0 1,271,017 8,921 28,027 229 68,6399 BANK OF NEW YORK MELLON CORPORATION, THE NY 395,254 1,200,748 53,270 2,191 592,871 457,852 94,564 0 79,98910 PNC FINANCIAL SERVICES GROUP, INC., THE PA 354,202 370,538 41,796 30,000 20,711 238,522 34,336 5,174 1,01111 SUNTRUST BANKS, INC. GA 189,108 258,047 23,384 15,175 17,785 134,691 61,935 5,077 10712 NORTHERN TRUST CORPORATION IL 119,943 256,820 0 0 244,341 11,731 748 0 21,02513 GENERAL ELECTRIC CAPITAL CORPORATION CT 466,871 244,118 0 0 105,296 130,998 3,539 4,285 86414 TD BANK US HOLDING COMPANY NJ 253,196 193,402 0 0 18,998 173,237 501 667 1915 U.S. BANCORP MN 419,075 177,726 4,439 3,125 60,648 85,105 20,712 3,697 1,13716 CAPITAL ONE FINANCIAL CORPORATION VA 310,636 95,010 0 0 10,047 83,383 12 1,568 817 ALLY FINANCIAL INC. MI 156,472 79,915 18,288 1 417 25,424 35,785 0 018 MUFG AMERICAS HOLDINGS CORPORATION NY 114,266 76,509 4,032 0 3,019 58,614 10,835 10 46219 BB&T CORPORATION NC 191,017 76,180 629 0 20,926 44,081 10,545 0 4020 REGIONS FINANCIAL CORPORATION AL 121,967 76,139 2,584 77 15,933 52,013 3,876 1,658 1121 FIFTH THIRD BANCORP OH 141,658 72,900 467 144 8,994 45,663 15,539 2,092 57522 KEYCORP OH 94,675 71,252 13,090 0 7,367 44,103 6,187 505 1,19623 AMERICAN EXPRESS COMPANY NY 157,141 53,656 0 0 35,577 18,073 6 0 16324 CITIZENS FINANCIAL GROUP, INC. RI 137,564 53,388 0 0 8,927 39,304 3,260 1,896 19125 SANTANDER HOLDINGS USA, INC. MA 126,127 53,035 0 0 1,380 33,698 17,943 15 20
TOP 25 HOLDING COMPANIES WITH DERIVATIVES $14,156,743 $255,241,727 $10,627,838 $10,305,264 $43,300,397 $142,068,615 $36,529,428 $12,410,184 $3,244,705
Note: Currently, the Y-9 report does not differentiate credit derivatives by contract type. Credit derivatives have been included in the sum of total derivatives.Note: Prior to the first quarter of 2005, total derivatives included spot foreign exchange. Beginning in that quarter, spot foreign exchange has been reported separately.Note: Numbers may not add due to rounding.Data source: Consolidated Financial Statements for Bank Holding Companies, FR Y- 9, schedule HC-L
NOTIONAL AMOUNT OF DERIVATIVE CONTRACTSTOP 25 HOLDING COMPANIES IN DERIVATIVES
June 30, 2015, $ MILLIONS

TABLE 3
PERCENT PERCENT PERCENT PERCENT PERCENT PERCENTTOTAL TOTAL EXCH TRADED OTC INT RATE FOREIGN EXCH OTHER CREDIT
RANK BANK NAME STATE ASSETS DERIVATIVES CONTRACTS CONTRACTS CONTRACTS CONTRACTS CONTRACTS DERIVATIVES(%) (%) (%) (%) (%) (%)
1 JPMORGAN CHASE BANK NA OH $1,971,380 $53,319,455 5.4 94.6 72.5 16.6 4.0 6.92 CITIBANK NATIONAL ASSN SD 1,336,201 52,169,657 4.0 96.0 76.5 17.2 1.6 4.73 GOLDMAN SACHS BANK USA NY 122,681 45,718,947 5.8 94.2 94.7 4.8 0.1 0.44 BANK OF AMERICA NA NC 1,606,232 29,062,647 8.0 92.0 71.5 20.6 1.2 6.65 Wells Fargo Bank NA SD 1,553,871 6,091,938 7.3 92.7 90.5 5.7 3.3 0.56 HSBC NA VA 190,500 4,567,318 2.2 97.8 67.2 26.1 1.8 4.87 MORGAN STANLEY BANK NA UT 126,643 2,153,784 1.1 98.9 0.9 98.8 0.0 0.38 STATE STREET BANK&TRUST CO MA 289,425 1,315,480 0.9 99.1 1.1 97.1 1.8 0.09 BANK OF NEW YORK MELLON NY 320,204 1,187,765 4.5 95.5 57.3 42.5 0.3 0.010 PNC BANK NATIONAL ASSN DE 343,630 374,547 19.1 80.9 94.5 3.6 0.5 1.411 SUNTRUST BANK GA 184,223 258,557 14.8 85.2 75.8 2.3 20.0 1.912 NORTHERN TRUST CO IL 119,600 257,570 0.0 100.0 4.3 95.7 0.0 0.013 TD BANK NATIONAL ASSN DE 235,030 182,927 0.0 100.0 88.8 10.8 0.1 0.414 U S BANK NATIONAL ASSN OH 414,002 174,729 4.3 95.7 69.6 27.8 0.3 2.315 REGIONS BANK AL 120,932 76,824 3.5 96.5 94.2 1.4 2.2 2.216 MUFG UNION BANK NA CA 113,525 76,509 5.3 94.7 83.5 5.9 10.6 0.017 FIFTH THIRD BANK OH 139,250 71,195 0.9 99.1 58.9 30.5 7.7 2.918 KEYBANK NATIONAL ASSN OH 92,481 67,860 19.3 80.7 88.3 10.0 0.9 0.719 BRANCH BANKING&TRUST CO NC 186,643 62,206 1.0 99.0 99.0 1.0 0.0 0.020 CAPITAL ONE NATIONAL ASSN VA 255,291 59,565 0.0 100.0 96.6 0.3 0.4 2.621 CITIZENS BANK NATIONAL ASSN RI 106,948 44,239 0.0 100.0 79.6 17.1 0.0 3.222 BOKF NATIONAL ASSN OK 30,616 43,156 1.4 98.6 93.0 2.7 4.3 0.023 HUNTINGTON NATIONAL BANK OH 68,662 33,184 0.2 99.8 85.9 5.7 5.0 3.324 COMPASS BANK AL 82,894 31,370 1.4 98.6 90.8 3.2 6.0 0.025 CAPITAL ONE BANK USA NA VA 93,338 26,958 0.0 100.0 69.4 30.6 0.0 0.0
TOP 25 COMMERCIAL BANKS, SAs & TCs WITH DERIVATIVES $10,104,203 $197,428,388 $10,700,926 $186,727,462 $153,315,088 $31,848,338 $72 $8,483,875OTHER COMMERCIAL BANKS, SAs & TCs WITH DERIVATIVES 4,084,754 486,246 3,268 482,978 439,244 31,442 2,355 3,920TOTAL FOR COMMERCIAL BANKS, SAs & TCs WITH DERIVATIVES 14,188,957 197,914,633 10,704,194 187,210,439 153,754,332 31,879,780 2,428 8,487,795
(%) (%) (%) (%) (%) (%) (%)TOP 25 COMMERCIAL BANKS, SAs & TCs: % OF TOTAL COMMERCIAL BANKS, SAs & TCs WITH DERIVATIVES 99.8 5.4 94.3 77.5 16.1 0.0 4.3OTHER COMMERCIAL BANKS, SAs & TCs: % OF TOTAL COMMERCIAL BANKS, SAs & TCs WITH DERIVATIVES 0.2 0.0 0.2 0.2 0.0 0.0 0.0TOTAL FOR COMMERCIAL BANKS, SAs & TCs: % OF TOTAL COMMERCIAL BANKS, SAs & TCs WITH DERIVATIVES 100.0 5.4 94.6 77.7 16.1 0.0 4.3
Note: "Foreign Exchange" does not include spot fx.
Note: "Other" is defined as the sum of commodity and equity contracts.Note: Numbers may not add due to rounding.Data source: Call Reports, schedule RC-L
DISTRIBUTION OF DERIVATIVE CONTRACTSTOP 25 COMMERCIAL BANKS, SAVINGS ASSOCIATIONS AND TRUST COMPANIES IN DERIVATIVES
June 30, 2015, $ MILLIONS
Note: Currently, the Call Report does not differentiate credit derivatives by over the counter or exchange traded. Credit derivatives have been included in the "over the counter" category as well as in the sum of total derivatives here.

TABLE 4
BILATERALLY TOTAL CREDIT (%)TOTAL NETTED CURRENT POTENTIAL EXPOSURE TOTAL CREDIT
TOTAL TOTAL RISK-BASED CREDIT FUTURE FROM ALL EXPOSURERANK BANK NAME STATE ASSETS DERIVATIVES CAPITAL EXPOSURE EXPOSURE CONTRACTS TO CAPITAL1 JPMORGAN CHASE BANK NA OH $1,971,380 $53,319,455 $170,346 $146,309 $242,001 $388,310 2282 CITIBANK NATIONAL ASSN SD 1,336,201 52,169,657 151,595 76,296 201,640 277,936 1833 GOLDMAN SACHS BANK USA NY 122,681 45,718,947 24,210 65,391 70,832 136,223 5634 BANK OF AMERICA NA NC 1,606,232 29,062,647 160,221 41,651 109,977 151,628 955 Wells Fargo Bank NA SD 1,553,871 6,091,938 136,742 20,779 28,241 49,020 366 HSBC NA VA 190,500 4,567,318 26,828 10,548 19,485 30,033 1127 MORGAN STANLEY BANK NA UT 126,643 2,153,784 14,190 2,415 6,164 8,579 608 STATE STREET BANK&TRUST CO MA 289,425 1,315,480 15,958 14,377 0 14,377 909 BANK OF NEW YORK MELLON NY 320,204 1,187,765 16,171 5,964 7,221 13,185 8210 PNC BANK NATIONAL ASSN DE 343,630 374,547 37,173 2,661 1,045 3,707 1011 SUNTRUST BANK GA 184,223 258,557 19,776 1,394 2,811 4,204 2112 NORTHERN TRUST CO IL 119,600 257,570 8,852 1,377 1,713 3,090 3513 TD BANK NATIONAL ASSN DE 235,030 182,927 20,501 3,299 1,772 5,072 2514 U S BANK NATIONAL ASSN OH 414,002 174,729 39,527 1,070 2,815 3,885 1015 REGIONS BANK AL 120,932 76,824 14,222 502 494 996 716 MUFG UNION BANK NA CA 113,525 76,509 13,555 1,153 299 1,452 1117 FIFTH THIRD BANK OH 139,250 71,195 15,056 1,183 893 2,076 1418 KEYBANK NATIONAL ASSN OH 92,481 67,860 10,434 739 31 769 719 BRANCH BANKING&TRUST CO NC 186,643 62,206 19,310 859 357 1,217 620 CAPITAL ONE NATIONAL ASSN VA 255,291 59,565 23,587 776 444 1,219 521 CITIZENS BANK NATIONAL ASSN RI 106,948 44,239 12,827 689 396 1,085 822 BOKF NATIONAL ASSN OK 30,616 43,156 2,643 253 228 481 1823 HUNTINGTON NATIONAL BANK OH 68,662 33,184 6,463 470 310 781 1224 COMPASS BANK AL 82,894 31,370 8,859 468 306 774 925 CAPITAL ONE BANK USA NA VA 93,338 26,958 11,961 152 49 201 2
TOP 25 COMMERCIAL BANKS, SAs & TCs WITH DERIVATIVES $10,104,203 $197,428,388 $981,006 $400,775 $699,524 $1,100,300 112OTHER COMMERCIAL BANKS, SAs & TCs WITH DERIVATIVES 4,084,754 486,246 448,774 4,779 4,206 8,985 2TOTAL AMOUNT FOR COMMERCIAL BANKS, SAs & TCs WITH DERIVATIVES 14,188,957 197,914,633 1,429,780 405,555 703,731 1,109,285 78
Commercial banks also hold on-balance sheet assets in volumes that are multiples of bank capital. For example:
EXPOSURES FROM OTHER ASSETS EXPOSURE TO RISKALL COMMERCIAL BANKS & SAVINGS ASSOCIATIONS BASED CAPITAL 1-4 FAMILY MORTGAGES 197% C&I LOANS 107% SECURITIES NOT IN TRADING ACCOUNT 189%
Note: Total credit exposure is defined as the credit equivalent amount from derivative contracts (RC-R line 54), which is the sum of netted current credit exposure and PFE.Note: The total credit exposure to capital ratio is calculated using risk based capital (tier one plus tier two capital). Note: Currently, the Call Report does not differentiate credit derivatives by contract type. Credit derivatives have been included in the sum of total derivatives here.Note: Numbers may not add due to rounding.Data source: Call Reports, Schedule RC-R.
CREDIT EQUIVALENT EXPOSURESTOP 25 COMMERCIAL BANKS, SAVINGS ASSOCIATIONS AND TRUST COMPANIES IN DERIVATIVES
June 30, 2015, $ MILLIONS

TABLE 5
TOTAL % TOTAL %HELD FOR HELD FOR NOT FOR NOT FOR
TOTAL TOTAL TRADING TRADING TRADING TRADINGRANK BANK NAME STATE ASSETS DERIVATIVES & MTM & MTM MTM MTM1 JPMORGAN CHASE BANK NA OH $1,971,380 $49,637,862 $49,324,622 99.4 $313,240 0.62 CITIBANK NATIONAL ASSN SD 1,336,201 49,740,376 49,675,039 99.9 65,337 0.13 GOLDMAN SACHS BANK USA NY 122,681 45,551,126 45,526,134 99.9 24,992 0.14 BANK OF AMERICA NA NC 1,606,232 27,136,821 25,621,569 94.4 1,515,252 5.6
TOP 4 COMMERCIAL BANKS, SAs & TCs WITH DERIVATIVES $5,036,494 $172,066,185 $170,147,364 98.9 $1,918,821 1.1OTHER COMMERCIAL BANKS, SAs & TCs WITH DERIVATIVES 9,152,463 17,360,653 15,930,634 91.8 1,430,019 8.2TOTAL AMOUNT FOR COMMERCIAL BANKS, SAs & TCs WITH DERIVATIVES 14,188,957 189,426,838 186,077,998 98.2 3,348,840 1.8
Note: Currently, the Call Report does not differentiate between traded and not-traded credit derivatives. Credit derivatives have been excluded from the sum of total derivatives here.Note: Numbers may not add due to rounding.Data source: Call Reports, schedule RC-L
NOTIONAL AMOUNTS OF DERIVATIVE CONTRACTS HELD FOR TRADINGTOP 4 COMMERCIAL BANKS, SAVINGS ASSOCIATIONS AND TRUST COMPANIES IN DERIVATIVES
June 30, 2015, $ MILLIONS

TABLE 6
GROSS GROSS GROSS GROSS GROSS GROSSTOTAL TOTAL POSITIVE NEGATIVE POSITIVE NEGATIVE POSITIVE NEGATIVE
RANK BANK NAME STATE ASSETS DERIVATIVES FAIR VALUE* FAIR VALUE** FAIR VALUE* FAIR VALUE** FAIR VALUE* FAIR VALUE**1 JPMORGAN CHASE BANK NA OH $1,971,380 $53,319,455 $946,010 $933,207 $2,084 $3,056 $54,930 $54,5312 CITIBANK NATIONAL ASSN SD 1,336,201 52,169,657 620,658 615,507 583 674 40,171 39,8953 GOLDMAN SACHS BANK USA NY 122,681 45,718,947 767,401 740,880 371 28 3,000 2,6114 BANK OF AMERICA NA NC 1,606,232 29,062,647 337,875 338,122 29,542 33,485 26,848 26,904
TOP 4 COMMERCIAL BANKS, SAs & TCs WITH DERIVATIVES $5,036,494 $180,270,706 $2,671,944 $2,627,716 $32,580 $37,243 $124,949 $123,941OTHER COMMERCIAL BANKS, SAs & TCs WITH DERIVATIVES 9,152,463 17,643,927 215,103 210,626 17,779 10,571 4,671 4,510TOTAL AMOUNT FOR COMMERCIAL BANKS, SAs & TCs WITH DERIVATIVES 14,188,957 197,914,633 2,887,047 2,838,342 50,359 47,814 129,620 128,451
Note: Currently, the Call Report does not differentiate between traded and non-traded credit derivatives. Credit derivatives have been included in the sum of total derivatives here. Numbers may not sum due to rounding.*Market value of contracts that have a positive fair value as of the end of the quarter.**Market value of contracts that have a negative fair value as of the end of the quarter.Data source: Call Reports, schedule RC-L
GROSS FAIR VALUES OF DERIVATIVE CONTRACTSTOP 4 COMMERCIAL BANKS, SAVINGS ASSOCIATIONS AND TRUST COMPANIES IN DERIVATIVES
June 30, 2015, $ MILLIONS
TRADING NOT FOR TRADING CREDIT DERIVATIVES

TABLE 7
TOTAL TRADING TRADING REV TRADING REV TRADING REV TRADING REV TRADING REVREV FROM CASH & FROM FROM FROM FROM FROM
TOTAL TOTAL OFF BAL SHEET INT RATE FOREIGN EXCH EQUITY COMMOD & OTH CREDITRANK BANK NAME STATE ASSETS DERIVATIVES POSITIONS POSITIONS POSITIONS POSITIONS POSITIONS POSITIONS1 JPMORGAN CHASE BANK NA OH $1,971,380 $53,319,455 $2,548 $678 $589 $686 $108 $4872 CITIBANK NATIONAL ASSN SD 1,336,201 52,169,657 1,366 1,004 532 (270) 118 (18)3 GOLDMAN SACHS BANK USA NY 122,681 45,718,947 177 1,801 (1,569) (8) 4 (51)4 BANK OF AMERICA NA NC 1,606,232 29,062,647 91 (304) 269 136 (99) 89
TOP 4 COMMERCIAL BANKS, SAs & TCs WITH DERIVATIVES $5,036,494 $180,270,706 $4,182 $3,179 ($179) $544 $131 $507OTHER COMMERCIAL BANKS, SAs & TCs WITH DERIVATIVES 9,152,463 17,643,927 1,335 225 1,034 54 (2) 23TOTAL AMOUNT FOR COMMERCIAL BANKS, SAs & TCs WITH DERIVATIVES 14,188,957 197,914,633 5,517 3,404 855 598 129 530
Note: Trading revenue is defined here as "trading revenue from cash instruments and off balance sheet derivative instruments."Note: Numbers may not sum due to rounding.Data source: Call Reports, schedule RI
Note: Effective in the first quarter of 2007, trading revenues from credit exposures are reported separately, along with the four other types of exposures. The total derivatives column includes credit exposures.
TRADING REVENUES FROM CASH INSTRUMENTS AND DERIVATIVESTOP 4 COMMERCIAL BANKS, SAVINGS ASSOCIATIONS AND TRUST COMPANIES IN DERIVATIVES
June 30, 2015, $ MILLIONSNOTE: REVENUE FIGURES ARE FOR THE QUARTER (NOT YEAR-TO-DATE)

TABLE 8
INT RATE INT RATE INT RATE INT RATE FX and GOLD FX and GOLD FX and GOLD FX and GOLDTOTAL TOTAL MATURITY MATURITY MATURITY ALL MATURITY MATURITY MATURITY ALL
RANK BANK NAME STATE ASSETS DERIVATIVES < 1 YR 1 - 5 YRS > 5 YRS MATURITIES < 1 YR 1 - 5 YRS > 5 YRS MATURITIES1 JPMORGAN CHASE BANK NA OH $1,971,380 $53,319,455 $19,507,535 $14,767,775 $9,543,831 $43,819,141 $6,953,482 $2,018,952 $931,332 $9,903,7662 CITIBANK NATIONAL ASSN SD 1,336,201 52,169,657 16,654,090 11,583,313 7,523,207 35,760,610 7,051,946 486,662 173,975 7,712,5833 GOLDMAN SACHS BANK USA NY 122,681 45,718,947 15,529,978 16,490,637 11,000,831 43,021,446 454,348 214,724 154,474 823,5464 BANK OF AMERICA NA NC 1,606,232 29,062,647 8,825,199 7,786,960 4,291,983 20,904,142 5,573,570 787,292 243,280 6,604,142
TOP 4 COMMERCIAL BANKS, SAs & TCs WITH DERIVATIVES $5,036,494 $180,270,706 $60,516,802 $50,628,685 $32,359,852 $143,505,339 $20,033,346 $3,507,630 $1,503,061 $25,044,037OTHER COMMERCIAL BANKS, SAs & TCs WITH DERIVATIVES 9,152,463 17,643,927 2,948,841 4,131,298 3,477,657 10,557,797 5,041,720 351,867 109,879 5,503,467TOTAL AMOUNT FOR COMMERCIAL BANKS, SAs & TCs WITH DERIVATIVES 14,188,957 197,914,633 63,465,643 54,759,983 35,837,509 154,063,136 25,075,066 3,859,497 1,612,940 30,547,504
Note: Figures above exclude any contracts not subject to risk-based capital requirements, such as foreign exchange contracts with an original maturity of 14 days or less, futures contracts, written options, and basis swaps.Therefore, the total notional amount of derivatives by maturity will not add to the total derivatives figure in this table.Numbers may not add due to rounding.Effective 1Q 2015, the reporting form and call report instructions changed. Schedule RC-R now requires banks to report foreign exchange (FX) and gold notionals in aggregate, rather than separately.
Data source: Call Reports, schedule RC-R
NOTIONAL AMOUNTS OF DERIVATIVE CONTRACTS BY CONTRACT TYPE & MATURITYTOP 4 COMMERCIAL BANKS, SAVINGS ASSOCIATIONS AND TRUST COMPANIES IN DERIVATIVES
June 30, 2015, $ MILLIONS

TABLE 9
PREC METALS PREC METALS PREC METALS PREC METALSTOTAL TOTAL MATURITY MATURITY MATURITY ALL
RANK BANK NAME STATE ASSETS DERIVATIVES < 1 YR 1 - 5 YRS > 5 YRS MATURITIES1 JPMORGAN CHASE BANK NA OH $1,971,380 $53,319,455 $18,890 $1,519 $22 $20,4312 CITIBANK NATIONAL ASSN SD 1,336,201 52,169,657 4,451 607 0 5,0583 GOLDMAN SACHS BANK USA NY 122,681 45,718,947 0 0 0 04 BANK OF AMERICA NA NC 1,606,232 29,062,647 0 0 0 0
TOP 4 COMMERCIAL BANKS, SAs & TCs WITH DERIVATIVES $5,036,494 $180,270,706 $23,341 $2,126 $22 $25,489OTHER COMMERCIAL BANKS, SAs & TCs WITH DERIVATIVES 9,152,463 17,643,927 8,458 1,305 0 9,763TOTAL FOR COMMERCIAL BANKS, SAs & TCs WITH DERIVATIVES 14,188,957 197,914,633 31,799 3,431 22 35,252
Note:Therefore, the total notional amount of derivatives by maturity will not add to the total derivatives figure in this table.
Note: Numbers may not add due to rounding.Data source: Call Reports, schedule RC-R
Figures above exclude any contracts not subject to risk-based capital requirements, such as foreign exchange contracts with an original maturity of 14 days or less, futures contracts, written options, and basis swaps.
June 30, 2015, $ MILLIONSTOP 4 COMMERCIAL BANKS, SAVINGS ASSOCIATIONS AND TRUST COMPANIES IN DERIVATIVES
NOTIONAL AMOUNTS OF DERIVATIVE CONTRACTS BY CONTRACT TYPE & MATURITY

TABLE 10
OTHER COMM OTHER COMM OTHER COMM OTHER COMM EQUITY EQUITY EQUITY EQUITYTOTAL TOTAL MATURITY MATURITY MATURITY ALL MATURITY MATURITY MATURITY ALL
RANK BANK NAME STATE ASSETS DERIVATIVES < 1 YR 1 - 5 YRS > 5 YRS MATURITIES < 1 YR 1 - 5 YRS > 5 YRS MATURITIES1 JPMORGAN CHASE BANK NA OH $1,971,380 $53,319,455 $601,550 $108,917 $22,072 $732,539 $972,077 $363,547 $108,002 $1,443,6262 CITIBANK NATIONAL ASSN SD 1,336,201 52,169,657 115,388 58,327 7,540 181,255 208,465 87,615 28,936 325,0163 GOLDMAN SACHS BANK USA NY 122,681 45,718,947 7,108 803 0 7,911 35,303 9,084 7,412 51,7994 BANK OF AMERICA NA NC 1,606,232 29,062,647 35,964 3,539 27 39,530 266,482 54,598 2,815 323,895
TOP 4 COMMERCIAL BANKS, SAs & TCs WITH DERIVATIVES $5,036,494 $180,270,706 $760,010 $171,586 $29,639 $961,235 $1,482,327 $514,844 $147,165 $2,144,336OTHER COMMERCIAL BANKS, SAs & TCs WITH DERIVATIVES 9,152,463 17,643,927 36,438 56,408 2,692 95,538 85,157 64,867 15,635 165,660TOTAL FOR COMMERCIAL BANKS, SAs & TCs WITH DERIVATIVES 14,188,957 197,914,633 796,448 227,994 32,331 1,056,773 1,567,484 579,711 162,800 2,309,996
Note: Figures above exclude any contracts not subject to risk-based capital requirements, such as foreign exchange contracts with an original maturity of 14 days or less, futures contracts, written options, and basis swaps. Therefore, the total notional amount of derivatives by maturity will not add to the total derivatives figure in this table.Note: Numbers may not add due to rounding.Data source: Call Reports, schedule RC-R
NOTIONAL AMOUNTS OF DERIVATIVE CONTRACTS BY CONTRACT TYPE & MATURITYTOP 4 COMMERCIAL BANKS, SAVINGS ASSOCIATIONS AND TRUST COMPANIES IN DERIVATIVES
June 30, 2015, $ MILLIONS

TABLE 11
TOTAL TOTAL TOTAL CREDIT MATURITY MATURITY MATURITY ALL MATURITY MATURITY MATURITY ALLRANK BANK NAME STATE ASSETS DERIVATIVES DERIVATIVES < 1 YR 1 - 5 YRS > 5 YRS MATURITIES < 1 YR 1 - 5 YRS > 5 YRS MATURITIES1 JPMORGAN CHASE BANK NA OH $1,971,380 $53,319,455 $3,681,593 $582,202 $1,942,043 $141,912 $2,666,157 $263,091 $691,907 $60,438 $1,015,4362 CITIBANK NATIONAL ASSN SD 1,336,201 52,169,657 2,429,281 366,596 1,362,433 139,119 1,868,148 116,035 414,540 30,558 561,1333 GOLDMAN SACHS BANK USA NY 122,681 45,718,947 167,821 14,823 71,129 9,016 94,968 22,785 42,259 7,809 72,8534 BANK OF AMERICA NA NC 1,606,232 29,062,647 1,925,826 296,536 969,489 55,613 1,321,638 134,746 431,142 38,300 604,188
TOP 4 COMMERCIAL BANKS, SAs & TCs WITH DERIVATIVES $5,036,494 $180,270,706 $8,204,521 $1,260,157 $4,345,094 $345,660 $5,950,911 $536,657 $1,579,848 $137,105 $2,253,610OTHER COMMERCIAL BANKS, SAs & TCs WITH DERIVATIVES 9,152,463 17,643,927 283,274 32,207 104,662 12,991 149,860 25,520 93,184 14,711 133,414TOTAL AMOUNT FOR COMMERCIAL BANKS, SAs & TCs WITH DERIVATIVES 14,188,957 197,914,633 8,487,795 1,292,364 4,449,756 358,651 6,100,771 562,177 1,673,032 151,816 2,387,024
Note: Figures above exclude any contracts not subject to risk-based capital requirements, such as foreign exchange contracts with an original maturity of 14 days or less, futures contracts, written options, and basis swaps. Therefore, the total notional amount of derivatives by maturity will not add to the total derivatives figure in this table.Note: Numbers may not add due to rounding.Data source: Call Reports, schedule RC-L and RC-R
INVESTMENT GRADE SUB-INVESTMENT GRADE
NOTIONAL AMOUNTS OF CREDIT DERIVATIVE CONTRACTS BY CONTRACT TYPE & MATURITYTOP 4 COMMERCIAL BANKS, SAVINGS ASSOCIATIONS AND TRUST COMPANIES IN DERIVATIVES
June 30, 2015, $ MILLIONS
CREDIT DERIVATIVES CREDIT DERIVATIVES

TABLE 12
TOTAL CREDIT TOTAL OTHER CREDIT TOTAL OTHERTOTAL TOTAL CREDIT DEFAULT RETURN CREDIT CREDIT DEFAULT RETURN CREDIT CREDIT
RANK BANK NAME STATE ASSETS DERIVATIVES DERVATIVES BOUGHT SOLD SWAPS SWAPS OPTIONS DERIVATIVES SWAPS SWAPS OPTIONS DERIVATIVES1 JPMORGAN CHASE BANK NA OH $1,971,380 $49,637,862 $3,681,593 $1,865,204 $1,816,389 $1,804,548 $14,295 $42,329 $4,032 $1,769,341 $2,341 $44,469 $2382 CITIBANK NATIONAL ASSN SD 1,336,201 49,740,376 2,429,281 1,234,659 1,194,622 1,156,394 25,272 52,993 0 1,141,929 11,018 41,675 03 GOLDMAN SACHS BANK USA NY 122,681 45,551,126 167,821 92,904 74,917 90,306 2,170 274 154 72,831 2,036 50 04 BANK OF AMERICA NA NC 1,606,232 27,136,821 1,925,826 964,469 961,357 919,583 8,546 36,340 0 904,871 18,519 37,967 05 Wells Fargo Bank NA SD 1,553,871 6,062,069 29,869 18,544 11,325 6,203 0 0 12,341 5,117 45 39 6,1246 HSBC NA VA 190,500 4,346,636 220,682 109,292 111,390 104,898 4,394 0 0 102,888 8,501 0 07 MORGAN STANLEY BANK NA UT 126,643 2,148,342 5,442 5,442 0 3,563 0 1,879 0 0 0 0 08 STATE STREET BANK&TRUST CO MA 289,425 1,315,251 229 229 0 0 0 0 229 0 0 0 09 BANK OF NEW YORK MELLON NY 320,204 1,187,765 0 0 0 0 0 0 0 0 0 0 010 PNC BANK NATIONAL ASSN DE 343,630 369,373 5,174 2,504 2,669 98 0 0 2,407 0 0 0 2,66911 SUNTRUST BANK GA 184,223 253,740 4,818 2,526 2,291 235 2,285 0 6 0 2,285 0 612 NORTHERN TRUST CO IL 119,600 257,570 0 0 0 0 0 0 0 0 0 0 013 TD BANK NATIONAL ASSN DE 235,030 182,260 667 662 5 662 0 0 0 5 0 0 014 U S BANK NATIONAL ASSN OH 414,002 170,633 4,096 1,454 2,643 455 0 0 999 400 0 0 2,24315 REGIONS BANK AL 120,932 75,167 1,658 145 1,513 0 0 0 145 0 0 0 1,51316 MUFG UNION BANK NA CA 113,525 76,499 10 10 0 10 0 0 0 0 0 0 017 FIFTH THIRD BANK OH 139,250 69,103 2,092 388 1,704 0 0 0 388 0 0 0 1,70418 KEYBANK NATIONAL ASSN OH 92,481 67,355 505 401 104 401 0 0 0 11 93 0 019 BRANCH BANKING&TRUST CO NC 186,643 62,206 0 0 0 0 0 0 0 0 0 0 020 CAPITAL ONE NATIONAL ASSN VA 255,291 57,997 1,568 547 1,021 0 0 0 547 0 0 0 1,02121 CITIZENS BANK NATIONAL ASSN RI 106,948 42,804 1,436 0 1,436 0 0 0 0 0 0 0 1,43622 BOKF NATIONAL ASSN OK 30,616 43,156 0 0 0 0 0 0 0 0 0 0 023 HUNTINGTON NATIONAL BANK OH 68,662 32,074 1,110 693 417 0 0 0 693 0 0 0 41724 COMPASS BANK AL 82,894 31,370 0 0 0 0 0 0 0 0 0 0 025 CAPITAL ONE BANK USA NA VA 93,338 26,958 0 0 0 0 0 0 0 0 0 0 0
TOP 25 COMMERCIAL BANKS, SAs & TCs WITH DERIVATIVES $10,104,203 $188,944,513 $8,483,875 $4,300,073 $4,183,801 $4,087,356 $56,962 $133,815 $21,940 $3,997,393 $44,838 $124,200 $17,370OTHER COMMERCIAL BANKS, SAs & TCs WITH DERIVATIVES 4,084,754 482,326 3,920 1,768 2,153 493 78 0 1,196 147 2 0 2,004TOTAL AMOUNT FOR COMMERCIAL BANKS, SAs & TCs WITH DERIVATIVES 14,188,957 189,426,838 8,487,795 4,301,841 4,185,954 4,087,849 57,041 133,815 23,137 3,997,540 44,840 124,200 19,374
(%) (%) (%) (%) (%) (%) (%) (%) (%) (%) (%)TOP 25 COMMERCIAL BANKS, SAs & TCs: % OF TOTAL COMMERCIAL BANKS, SAs & TCs WITH DERIVATIVES 100.0 50.7 49.3 48.2 0.7 1.6 0.3 47.1 0.5 1.5 0.2OTHER COMMERCIAL BANKS, SAs & TCs: % OF TOTAL COMMERCIAL BANKS, SAs & TCs WITH DERIVATIVES 0.0 0.0 0.0 0.0 0.0 0.0 0.0 0.0 0.0 0.0 0.0TOTAL AMOUNT FOR COMMERCIAL BANKS, SAs & TCs: % OF TOTAL COMMERCIAL BANKS, SAs & TCs WITH DERIVATIVES 100.0 50.7 49.3 48.2 0.7 1.6 0.3 47.1 0.5 1.5 0.2
Note: Credit derivatives have been excluded from the sum of total derivatives here.Note: Numbers may not add due to rounding.Data source: Call Reports, schedule RC-L
DERIVATIVES
DISTRIBUTION OF CREDIT DERIVATIVE CONTRACTS HELD FOR TRADINGTOP 25 COMMERCIAL BANKS, SAVINGS ASSOCIATIONS AND TRUST COMPANIES IN DERIVATIVES
June 30, 2015, $ MILLIONS
TOTAL CREDIT BOUGHT SOLD


