Embed Size (px)
Citation preview

© Yann Arthus-Bertrand / Altitude
Observations and Understanding of Recent Climate Change
Dennis L Hartmann, Josefino C Comiso, Nathan P Gillett, Jochem Marotzke, Valérie Masson-Delmotte and Monika Rhein
Includes information from Chapters 2, 3 ,4, 5, 8, 9 and 10 Fall AGU Meeting

Each of the last three decades has been successively warmer at the Earth’s surface than any preceding decade since 1850.
In the Northern Hemisphere, 1983–2012 was likely the warmest 30-year period of the last 1400 years (medium confidence).
(IPC
C 2
013,
Fig
. SP
M.1
a)

Warming in the climate system is unequivocal
(IPC
C 2
013,
Fig
. SP
M.1
b)

Multiple Independent Lines of Evidence for Global Warming
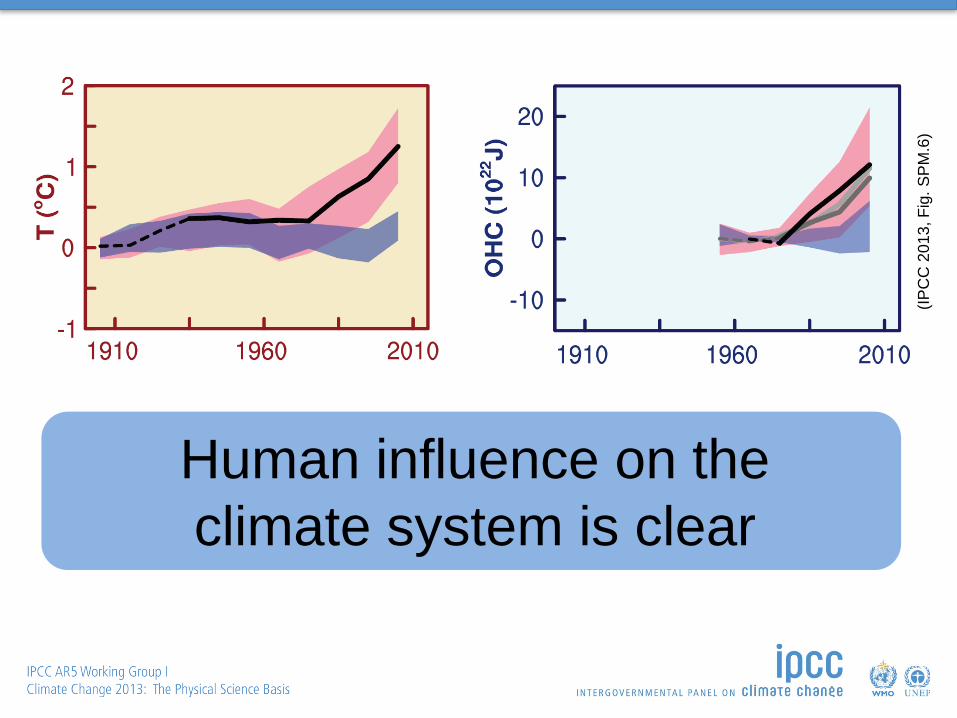
Human influence on the climate system is clear
(IPC
C 2
013,
Fig
. SP
M.6
)

Observed decadal mean warming
Fig SPM.5

Observed warming inconsistent with that expected from natural factors
Fig SPM.5

Observed warming consistent with simulations that include anthropogenic factors
Fig SPM.5

Attribution of warming to human influence in many continental regions
Over every continental region except Antarctica anthropogenic forcings have likely made a substantial contribution to surface temperature increases since the mid-20th century.
Fig SPM.5

Global mean warming since 1951 (°C)
Solar, Volcanic
Aerosols
CO2, CH4, N2O
Anthropogenic
Internal Variability
Observed
It is extremely likely that human influence has been the dominant cause of the observed
warming since the mid-20th century.
Fig. TS.10

Global mean warming since 1951 (°C)
Solar, Volcanic
Aerosols
CO2, CH4, N2O
Anthropogenic
Internal Variability
Observed
Human influence on the climate system is clear.
Fig. TS.10

Observed warming consistent with that expected from anthropogenic factors and inconsistent with
that expected from natural factors
The first decade of the 21st century has been the warmest on record.
Fig 10.7
1880 1920 1960 2000 1880 1920 1960 2000 1880 1920 1960 2000

Anthropogenic influences on the global water cycle
• Anthropogenic influences have contributed to: – Observed increases in atmospheric moisture (medium confidence) – Global-scale precipitation patterns over land (medium confidence) – Intensification of heavy precipitation over land regions where data is sufficient
(medium confidence)
WG1AR5_FD_Ch09_All_Final.pdf Fig 2.30
Increase in surface specific humidity

Trends in precipitable water and surface salinity
TFE-1 Figure 1.

It is likely that anthropogenic influences have affected the global water cycle
• It is very likely that anthropogenic forcings have contributed to ocean salinity
changes – Making fresher regions fresher over time and saltier regions saltier
WG1AR5_FD_Ch09_All_Final.pdf Changed ocean salinity Fig 3.21, TFE-1 Fig. 1

Strengthening of evidence for human influence on climate since AR4
• Studies consider the first decade of the 21st century and a new generation of climate models
• Multiple studies using different methods produce consistent results and strengthen confidence in the quantification of anthropogenic warming.
• There is higher confidence than at AR4 for a human influence on – Ocean warming – Changes in the global water cycle – Melting snow and ice – Sea level rise – Temperature extremes

17 WG1, AR5, Figure SPM 1a
In ºC, relative to 1961–1990
Observed global-mean surface temperature (GMST) since 1850 shows long-term warming trend, overlaid by fluctuations

The warming of the last 15 years has been lower than the long term trend
The rate of warming over the past 15 years (1998-2012; 0.05oC/decade) has been smaller than since 1951 (0.12oC/decade)
Fig 10.7
1880 1920 1960 2000 1880 1920 1960 2000 1880 1920 1960 2000

Periods of little or no warming can arise from internal variability
Box TS.3 Fig 1
Internal variability causes to a substantial degree the difference between the observations and the simulations (medium confidence).

20
Does surface-warming hiatus mean global warming has stopped?
• Sea ice continues to
melt.
• The ocean continues to take up heat.
• Sea level continues to rise.
No, it does not. Warming of the climate system continues
WG1, AR5, Figure SPM.3

• The reduced trend in radiative forcing is primarily due to volcanic eruptions and the downward phase of the solar cycle.
from 1 Evidence for a reduced forcing trend from 1998 compared to from 1951
Fig 8.19

The rate of warming over the past 15 years (1998-2012; 0.05oC/decade) has been smaller than since 1951 (0.12oC/decade)
Fig 10.7
1880 1920 1960 2000 1880 1920 1960 2000 1880 1920 1960 2000
Reduced warming trend is due in roughly equal measure to a reduced trend in radiative forcing and a cooling
contribution from internal variability (medium confidence)

Questions and Challenges
• More observational and modeling analysis of the recent reduction on warming rate (the hiatus) – applies to both global mean surface temperature and large-scale circulation changes. - Relative importance of forced variations and unforced internal variability - Relative importance of Pacific ENSO-like variability vs other modes of variability in the Atlantic and Southern Oceans.

Questions and Challenges
• Sea ice trends Arctic and Antarctic - Recent Arctic decline larger than models - Recent Antarctic increase not well understood
Sea Ice Concentration trends 2000-2012.

Questions and Challenges
• Extremes. - Precipitation extremes in observations and models - Moderate extremes shift with mean temperature - Extreme weather – tropical cyclones.

Thank You