Embed Size (px)
Citation preview

GLOBAL BIOGEOCHEMICAL CYCLES, VOL. 7, NO. 4, PAGES 785-809, DECEMBER 1993
OBSERVATIONS AND MODELING OF BIOMASS AND SOIL ORGANIC MATrER DYNAMICS FOR TIlE GRASSLAND BIOME WORLDWIDE
W. J. Parton, • J. M. O. Scurlock,'- D. S. Ojima, • T. G. Gilmanov, 3 R. J. Scholes, n D. S. Schimel, s T. Kirchner, • J-C. Menaut, • T. Seastedt, • E. Garcia Moya, s Apinan Kamnalrut, 9 and J. I. Kinyamario •ø
Abstract. Century is a model of terrestrial biogeochemistry based on relationships between climate, human management (fire, grazing), soil properties, plant productivity, and decomposition. The grassland version of the Century model was tested using observed data from 11 temperate and tropical grasslands around the world. The results show that soil C and N levels can be simulated to within + 25% of the
observed values (100 and 75% of the time, respectively) for
•Namral Resource Ecology Laboratory, Colorado State University, Ft. Collins.
ZDivision of Life Sciences, Kings College London, London.
3Departmere of Vertebrate Zoology and Ecology, Moscow State University, Moscow.
4Forestek, CSIR, Pretoria, South Africa 5Climate System Modelling Program, NCAR, Boulder,
Colorado.
CLabomtoire D'Ecologie, Ecole Normal Superieure, CNRS-URA, Paris.
?Institute of Arctic and Alpine Research, University of Colorado, Boulder.
SCentro de Botanica, Colegio de Postgraduados, Chapingo, Mexico.
•Faculty of Natural Resources, Prince of SongIda University, Hatyai, Thailand.
•øDepartment of Botany, University of Nairobi, Nairobi, Kenya.
Copyright 1993 by the American Geophysical Union.
Paper number 93GB02042. 0886-6236/93/93GB-02042510.00
a diverse set of soils. Peak live biomass and plant production can be simulated within + 25% of the observed values (57 and 60% of the time, respectively) for burned, fertilized, and irrigated grassland sites where precipitation ranged from 22 to over 150 cm. Live biomass can be generally predicted to within + 50% of the observed values (57% of the time). The model underestimated the live biomass in extremely high plant production years at two of the Russian sites. A comparison of Century model results with statistical models showed that the Century model had slightly higher r • values than the statistical models. Data and calibrated model results from this study are useful for analysis and description of grassland carbon dynamics, and as a reference point for testing more physiologically based models prediction's of net primary production and biomass. Results indicate that prediction of plant and soil organic matter (C and N) dynamics requires knowledge of climate, soil texture, and N inputs.
INTRODUCTION AND OBJECTIVES
Under the aegis of the Scientific Committee on Problems of the Environment (SCOPE) Project on "Effect of climate change on production and decomposition in coniferous forests and grasslands," the Century model for plant-soil ecosystems has been further developed by a Grasslands Modelling Group in order to apply it to a wide range of temperate and tropical grasslands worldwide. This study was undertaken to meet the overall aims of the SCOPE
Project, to review and identify models with wide application and predictive ability, in order to link plant and soil responses to the large-scale modeling of global change effects. Climate changes are expected to be manifest as a rise in mean annual temperature, together with perturbation of rainfall patterns, alongside a continuing rapid increase in atmospheric CO,_. Other modifications to the environment

786
may follow in the form of changes in nutrient availability and the rate of cycling of carbon and nitrogen between the biosphere, atmosphere, and geosphere.
The carbon in terrestrial vegetation and soils worldwide outweighs the amount found in the atmosphere and the ocean surface layers. The role of grasslands in global biogeochemical cycles should not be overlooked, especially when the contribution of worldwide grassland burning is considered [Hao et al., 1990; Hall and Scurlock, 1991]. Tropical grasslands occupy 15 million km,., and in terms of both land area and productivity are nearly equal to tropical forests. Together with 9 million kin,. of temperate grasslands, they cover nearly one fifth of the Earth's land surface and are likely to remain constant in area for the near future [Lieth, 1972; Hall and Scurlock, 1991]. Carbon stored in grassland soils, temperate and tropical, has been estimated at 30% of the world total of soil carbon
lAnderson, 1991 ]. The role of ecosystem models to evaluate the importance
of various ecosystems to global environmental change and subsequent impacts is fundamental to global change research. The Century model is being applied to global change impacts and has been critically evaluated by the SCOPE Project Grasslands Modelling Group. Century was developed into its present form (Version 3.0) [Parton et al., 1992] by the incorporation of routines derived from more mechanistic models or suggested by detailed site d_a_m. The model has now been pammeterized and successfully validated for many different grassland sites in temperate and tropical regions [Parton et al., 1987, 1989a, b]. The grassland sites used in this study range from temperate grasslands in the United States and Russia and natural and converted grasslands in wet and dry regions of the tropics.
The ability of the model to respond to burning, irrigation, and N fertilization were tested using observed data from these sites. We specifically tested the ability of the model to simulate: (1) seasonal patterns of live biomass, (2) peak live biomass, (3) annual plant production, and (4) soil C and N levels. All of the sites used for model testing have at least 3 years of seasonal live biomass data, observed soil C and N levels and required climate data. The statistical comparisons used to test the model include linear regression of observed and simulated results, comparison of Century model predictions with frequently used regression models (i.e., production versus annual precipitation), and an evaluation of the number of times that the ddference between the Century model and the observed data was less than + 25% of the
observed data.
MODEL DESCRIPTION
Century is a general computer model of plant-soil ecosystems which simulates the dynamics of grasslands, forests, crops, and savannas. It incorporates simplified representations of key processes relating to carbon assimilation and turnover, based on existing models. Century has been previously described in detail [Parton et al., 1987, 1988; Sanford et al., 1991] and is designed to work with the View output module of the program "Time- zero: the integrated modelling environment" [Kirchner 1989].
Parton et a•14. ß Modeling Grassland Biomes
Century simulates the dynamics of carbon (C), nitrogen (N), phosphorus (P), and sulphur (S) for different plant-soil systems, although only the carbon and nitrogen outputs will be reported here. Different plant production submodels for grasslands, forests and crops are linked to a common soil organic matter (SOM) submodel, with grasses and trees both included under Century's savanna option. The SOM submodel simulates the flow of selected elements through the different inorganic and organic pools in the soil, running on a monthly time step.
Version 3.0 of Century was used for these model runs [Parton et al., t992]. This version includes a substantial number of changes not described in the original publications. These changes include (1) adding an effect of clay on formation of passive SOM; (2) improving the surface litter decomposition model; (3) including the effect of anaerobiosis on decomposition; (4) simulating leaching of soluble organic material; (5) improving the inorganic leaching equations; and (6) developing a robust grassland production submodel. This paper will describe these significant changes to the model and present a general description of the overall model.
DECOlVIPOSrrION AND SOIL ORGANIC MATTER SUBMODEL
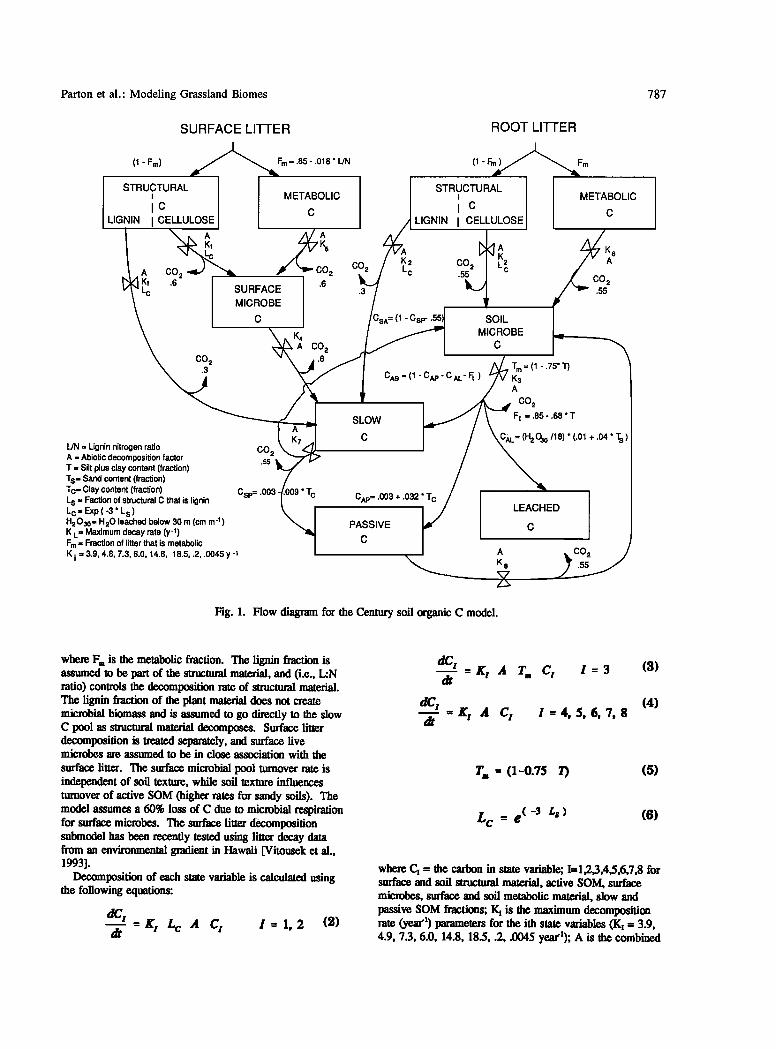
The soil organic matter (SOM) submodel simulates the dynamics of C, N, P, and S in the organic and inorganic parts of the soil system. The flow diagram for soil C (Figure 1) shows that soil C is divided up into three major components which include active, slow, and passive soil C. Active SOM includes live soil microbes plus microbial products (the total active pool is approximately 2 to 3 times the live soil microbial biomass), the slow pool includes resistant plant material (for instance, ligninlike components) and soil-stabilized plant and microbial material, while the passive material is very resistant to decomposition and includes physically and chemically stabilized SOM. The flows of C are controlled by the inherent maximum decomposition rate of the different pools and the water and temperature-controlled decomposition factor (Figure 2). Average monthly soil temperature at the soil surface controls the temperature function, and the ratio of stored water (0-30 cm depth) plus current monthly precipitation to potential evapotranspirafion is the input for the moisture function. Microbial respiration occurs for each of the decomposition flows. The partitioning of decomposition between stabilized SOM and CO,_ is a function of soil texture for the stabilization of active C into slow C (increasing CO,. for sandy soils and less soil C storage). Justification for these assumptions are presented in the earlier Century paper [Parton et al., 1987].
Plant residues (shoots and roots) are partitioned into structural (resistant to decomposition) and metabolic (readily decomposable) plant material as a function of the initial residue lignin (L)-to-nitrogen (N) ratio (L:N) using the following equation:
F m = 0.99 - (•N) 0.018 (1)
Parton et al.' Modeling Grassland Biomes 787
SURFACE LITTER
• Fm = .85 - .018 * L/N (1 -Fm) •k, STRUCTURAL
i METABOLIC
IC C LIGNIN I CELLULOSE
Lc
.c I "c; ø"" A CO 2
CO 2 .3
C• K 2 • Lc
.3
CsA= (1 - Csp- .55).
CAS = (1 - CAp- C AL- Ft )
L/N = Lignin nitrogen ratio A = Abiotic decomposition factor T = Silt plus clay content (fraction) Ts= Sand content (fraction) Tc= Clay content (fraction) L s = Faction of structural C that is lignin L c = Exp ( -3 ' L s ) H203o= H20 leached below 30 m (cm m '1) K L = Maximum decay rate (y-l) Fm = Fraction of litter that is metabolic
K i = 3.9, 4.8, 7.3, 6.0, 14.8, 18.5, .2, .0045 y -1
CO 2 .55
Csp= .003 ' 'r e
SLOW
C
CAp= .003 + .032' C
PASSIVE
C
STRUCTURAL I
i ¸ LIGNIN I CELLULOSE
ROOT LITTER
(1 -Fm )••Fm
A
CO2 L c .55
METABOLIC
C
CO •6 SOIL
MICROBE
C , ,
T m= (1-.75' T) K3 A
j cø2 F t =,85-.68'T
CAL= (H 2 030/18)* (.01 + .04' Ts)
LEACHED
C
: Fig. 1. Flow diagram for the Century soil organic C model.
where F,, is the metabolic fraction. The lignin fraction is assumed to be part of the stmc• material, and (i.e., L:N ratio) controls the decomposition rate of structural material. The lignin fraction of the plant material does not create microbial biomass and is assumed to go directly to the slow C pool as stmcua-al material decomposes. Surface litter decomposition is treated separately, and surface live microbes are assumed to be in close association with the
surface litter. The surface microbial pool ramover rate is independent of soil texture, while soil texture influences turnover of active SOM (higher rates for sandy-soils). The model assumes a 60% loss of C due to microbial respiration for surface microbes. The surface litter decomposition submodel has been recently tested using litter decay from an environmental gradient in Hawaii [Vitousek et al., 1993].
Decomposition of each state variable is calculated using the following equations:
dt -- KI l• c A C I .!' -.. 1, 2 (2)
dCt (3)
dCt (4) --r' c, t-4,
z'. = 33 (,5)
( ) (6) Lc=e
where Ci = the carbon in state variable; I= 1,2,3,4,5,6,7,8 for surface and soil stntcmml material, active SOM, surface microbes, surface and soil metabolic material, slow and passive SOM fractions; I• is the maximum decomposition rate (year '•) parameters for the ith state variables (Ki = 3.9, 4.9, 7.3, 6.0, 14.8, 18.5, .2, .0045 year'•); A is the combined

788 Parton et al.' Modeling Grassland Biomes
i .00
0.75
0.50
0.25
0 10 20 30 40 50
SOIL TEMPERATURE (øC)
1.0
n' 0.8
• 0.6
0 • 0.4 o
LU 0.2
-b /!
I I I I •/ I I I 0 0.20 0.40 0.60 0.80 '1.00 2.00 3.00
(STORED H20 + RAIN) / PET
Fig. 2. The abiofic effect of (a) soil temperature and Co) soil moisture on decomposition.
abiotic impact of soil moisture and soil temperature on decomposition (product of the soil moisture and temperature terms - see Figure 2), T, is the effect of soil texture on active SOM turnover, T is the silt plus clay content (fraction); and Lc is the impact of lignin content of structural material (Ls) on structural decomposition.
The model assumes that all C decomposition flows are associated with microbial activity and that microbial respiration occurs for each of these flows. The fraction of C lost due to microbial respiration with each C flow is shown in Figure 1 next to the CO2 arrows. Carbon leaving the active SOM box is divided into four different flows which
include microbial respiration, leaching of soluble organic C, and stabilization of C in the slow and passive pools (equations (7)-(10)), while the C flows out of slow SOM is allocated to passive SOM and active SOM (equations (11) and (12)).
0.85 - .68 T (?)
= (o.m + 0.o4 r) (8)
Co = 0.003+0.032 T,, (9)
(10)
where Ft is the fraction of C lost due to microbial respiration, L, is the fraction lost due to organic leaching, CA is the fraction allocated to passive SOM, Cs is the fraction sent to the slow pool, H,_O•o is the monthly water leached

Parton et al.: Modeling Grassland Biomes 789
below the 30 cm soil depth (cm month'x), S is the sand content (fraction), T• is the clay content (fraction). Q, is the fraction of slow C allocated to passive pool, and Cs is the fraction of slow allocated to the active pool (55% of the C is lost due to microbial respiration).
(11)
c a -- (t - -0.55) (12)
The formation of passive SOM is a function of clay content (higher for clay soils) and is primarily controlled by the stabilization of active SOM in microaggregates. Some passive SOM is also cremod by the decomposition of slow SOM, and includes a similar effect of clay. The effect of clay on these flows is based on soil x4C data [Becker- Heidman 1985] which show that the percent of modem x4C decreases with clay content, suggesting that clay soils have a higher fraction of passive SOM. This is also consistent with the way that Jenkinson [1990] included the impact of clay on SOM dynamics.
Leaching of soluble organic matter out of the top 30-cm of the soil is calculated as a function of the decay rate for active SOM (D,), the sand content of the soil, and the water flow below the 30-cm soil depth. The parameter values for formation of passive SOM were determined by fitting the model to observed soil C data at the U.S. Great Plains sites
(Konza and Central Plains Experimental Range (CPER)) and while the organic leaching parmmeters were derived by fitting the model to observed water chemistry data from a watershed in Puerto Rico (W. H. McDowel and C. E. Asbury, Export of carbon, nitrogen and major ions from three tropical montane watersheds, submiued to Journal of Limnology and Oceanography, 1993) (hereinafter referred to as McDowel and Asbury, submitted manuscript, 1993). A more complete description and justification for the C flows is presented by Parton et al. [1993]. '
BIOPHYSICAL SUBMODELS
The Century model includes a simplified water budget model which calculates monthly evaporation and transpiration water loss, water content of the soil layers, snow water content and saturated flow of water between soil
layers (Appendix B). If the average air temperature is less than 0øC monthly precipitation occurs as snow. Sublimation and evaporation of water from the snow pack occurs at a rate equal to the potential evapotranspirafion rate. Snow melt occurs if the average air temperature is greater than 0øC and is a linear function of the average air temperature. The potential evapotranspirafion rate (PET) is calculated as a function of the average monthly maximum and minimum air temperature using the equations developed by Linacre [1977]. Bare soil water loss is a function of standing dead and litter biomass (lower for high biomass levels), rainfall,
and PET. Interception water loss is a function of aboveground biomass (increases with biomass level), rainfall, and PET. Transpiration water loss is function of the live leaf biomass (exponential function of leaf biomass), rainfall, and PET. Interception of water and bare soil water losses are calculated as fractions of the monthly precipitation and are subtracted from the total monthly precipitation, with the remainder of the water added to the soil.
Water is distributed to the different layers by adding the water to the top layer (0-15 cm) and then draining excess water (water above field capacity) to the next layer. Transpiration water loss occurs after the water was added to the soil. Water loss occurs fu-st as interception, followed by bare soil evaporation and wanspirafion (the sum does not exceed the PET rate). The field capacity and wilting point for the different soil layers is calculated as a function of the bulk density, soil texture, and organic matter content using an equation developed by Gupta and Larson [1979]. The number of soil layers is an input variable in the model, and we used 15-cm increments for each layer up to the 60-cm soil depth and 30-cm increments below the 60-cm depth. Water leached below the last soil layer is not available for evapotranspirafion and is a measure of interflow, runoff, or leaching losses from the soil profile. Water going below the proffie can be lost as stream flow or leached into the subsoil where it can accumulate or move into the stream flow.
Appendix B gives all the equations used in the water flow model and detailed validation and descriptions are presented by W. J. Parton et al. (manuscript in preparation, 1993).
Average monthly soil temperature near the soil surface is calculated using equations developed by Parton [1984]. These equations calculate near surface maximum soil temperature as a function of the maximum air temperature (2 m heigh0 and the canopy biomass (lower for high biomass) while the minimum soil temperature is a function of the minimum air temperature (2 m heigh0 and canopy biomass (higher for higher biomass). The actual soil temperature used for decomposition and plant growth rate functions is the average of the minimum and maximum soil temperatures.
Leaching of labile mineral N (NO3' and NH[) occurs when saturated water flows between soil layers. The fraction of mineral N that flows from the upper layer to the lower layer (F=; 0-1) is calculated as a function of the sand content of the soil (Ts; 0-1), and the amount of saturated water flow between layers using the following equation:
(0.2+0.7 (13)
where H20•0 is the saunated water flow (cm H20 per month) from layer i to layer i+ 1. Parameter values in 13 were determined by fitting the model to observed water chemistry data from Puerto Rico 0VIcDowel and Asbury, submitted manuscript, 1993).
NITROGEN SUBMoDEL
The N submodel has the same general structure as the soil C model (Figure 3). The organic-N flows follow the C

790 Parton et al.' Modeling Grassland Biomes
'•z z o.
x
uJ z z
z
z
z
z
0

Parton eta!.' Modeling Grassland Biomes 791
flows and are equal to the product of the carbon flow and the N:C ratio of the state variable that receives the C. The
C:N ratios of the soil state variables receiving the flow of C are a function of the mineral N pool (NO3' plus NI-!• +) and vary within the ranges 3-15, 12-20, and 7-10, respectively, for active, slow and passive SOM (Figure 4). The C:N ratio of newly formed surface microbial biomass is a linear function of the N content of the material being decomposed, and increases from l0 to 20 as the N content decrea•s from
2.0% to 0.01% (,see Figure 3). The C:N ratio of slow SOM material formed from surface microbes is equal to the C:N ratio of the microbes plus 5.0. N associmed with carbon lost in respiration is assumed to be minemlized. Given the C:N ratio of the state variables and the microbial respiration loss, decomposition of metabolic residue, active, slow, and
passive pools generally results in net mineralization of N, while decomposition of strucawal material immobilizes N. The model also uses simple equations to represent N inputs due to atmospheric deposition and N fixation and calculates N losses due to N2, NO, N20, and NH3 gas fluxes (see Figure 3) and NO• leaching. A more complete description and justification for the N submodel is presented by Parton et al. œ1987, 1988].
PLANT PRODUCTION SUBMODEL
Century simuhtes plant production for grasslands, agricultural crops, forests, and mixed tree-grass (savanna) systems. The grassland submodel (Figure 5) simulates grass growth and includes the impact of grazing and fire on plant
a 20
!5
o 1- <•
n- lO
o
z
0
b 2o
15
n- lO O o
z
SLOW SOM (Ns)
0
:•'•,"•.•. PASSIVE SOM (Np) ••OM (N)
, I • I ., I [ I ,
o.• •.o •.• a.o a.•
SOIL NO• + NH 4 (gm -•)
SURFACE
MICROBE (N SM)
0 , I , I , I • I , 0 0.5 1.0 1.5 2.0 2.5
PLANT N CONTENT (%)
Fig. 4. Variation in C:N ratios of (a) the active, slow and passive SOM pools as a function of the mineral N pool, and (b) the newly formed microbial biomass as a function of the N content of decomposing plant matter.

792 Parton et al.: Modeling Grassland Biomes
GRASS MODEL
LIVE SHOOT
C
PLANT
PRODUCTION
PPT
PPT STANDING DEAD
C
SURFACE
LI-I-I'ER
LIVE ROOT
C
ROOT
LI-I-I'ER
PPT = Monthly Precipitation TEM = Monthly Soil Temperature BIO = Plant Biomass
GRZ = Grazing Rate FIRE = Fire Frequency
Fig. 5. Flow diagram for the brassland production submodel.
production. Potential plant production is calculated as function of soil temperature, available water, and a self- shading factor using the following equation:
(14)
where P], is the aboveground potential plant production rate (g m '2 month'l), P== is the maximum potential aboveground plant production rate (250 g m '2 month'l), Tp (Figure 6b) is the effect of soil temperature on growth, • is the effect of moisture on production (Figure 6a), and Sp is the effect of plant shading on plant growth (Figure 6c). The effect of moisture on production M v is a function of the ratio of current monthly precipitation plus the previous month's stored soil water (0-60 cm) to the potential evapotranspiration rate. The soil water holding capacity also influences M v by modifying the amount of stored soil water, so that lower water holding soils (e.g., sandy soils) have a higher growth rate under dry conditions (see Figure 6a). This function was added to the model in order to represent the observation that sandy soils are more productive in dry environments [Sala et al., 1988]. The temperature response curves for plant growth are based on data from Christie and Detling [1982] for C• and Cs plants. The shading factor
reduces plant production in the presence of large amounts of standing de.•d matter (Figure 0c).
The potential plant production rate (P•) is reduced if there is insufficient nutrient supply of N, P, or S, with the most limiting nutrient constraining production. A maximum and minimum carbon to element (E) ratio is specified for roots and live shoots, and the nutrient concentration not allowed to be greater than the minimum C:E ratio for each nutrient. The live shoot C:E ratio is a linear function of the live plant biomass. The fraction of the labile nutrient pools that are available for plant growth (Fs) are a function of the live root biomass (ROOT; g m '2) according to the following equation:
(15) = - 0.s (-o.0t
This equation is based on data presented by Wedin and Tilman [1990]. Live root and shoot death are calculated as a function of the available soil water in the 0-60 cm layer (H,_O(,•) using the following equations:
R,• = 0.12 [exp (-5.0 H20(a))] (16)

Parton et al.' Modeling Grassland Biomes 793
"• 1.00 - a
• 0.75
uJ 0.50
.,-, 0.25
o
:• 0
Sand .,,,,,,•• • / Clay
0.25 0.50 0.75
(Rainfall + Stored H20) / PET
i
1.00
1.2
0.6
0.4
0.2 0
O0 04 08 12 16 20 24 28 32 36 40 44
Soil T (øC)
1.OFC • •/.•---
• 0.5
0 I I I 0 1 2 3
Live/Dead
Fig. 6. The effect of (a) moisture, (b) soil temperature, and (c) shading on potential grass growth.
= o.2o [xp //,O(D] (z?) where 1• and Sa are the fraction of roots and shoots, respectively, which die per month. Shoot death also occurs when live plant biomass exceeds 400 g m '2 at a rate of 10% per month. This death rate is designed to simulate death due to shading of lower leaves in the canopy.
The model calculates root/shoot ratios as a function of the annual rainfall using equations presented in the original description of Century [Parton et al., 1987]. The effect of fire and grazing on plant production are based on data from Holland et al. [1992] and Ojima et al. [1990], respectively. The impacts of fire are to increase the root/shoot ratio, and to increase the C:N ratio of live shoots (plus 10 for temperate sites; 0 for tropical sites) and roots (plus 30 for all sites), removing vegetation and returning inorganic nutrients.
Grazing removes vegetation, returns nutrients to the soil (by urination and defecation), alters the root/shoot ratio and increases the N content of live shoots and roots [Holland et al., 1992].
Note that Century assumes that incoming solar radiation does not contribute significantly to interannual variability and so can be neglected as a control on the time-scales of interest here. This assumption is born out by the generally high correlations between observed and simulated NPP. Increasingly, climatic data_ and ecological data_ [Knapp and Smith, 1990] suggest this may be a poor assumption for the future, given trends in cloudiness suggested as part of global change scenarios. Future versions of the model will need to include this interaction, as well as CO: interactions.
DESCRIffHON OF SITES
The grassland study sites used for the modeling work (see Figure 7) reported here cover most of the world's major grassland types, ranging from the continental plains of the United States and Russia (22 to 81 cm per year precipitation) to both natural and converted grasslands in wet and dry regions of the tropics (59 to 154 cm per year precipitation). Soil tyw• cover a wide range of textures: 20- 85% sand, 10-40% silt, and 2-70% clay. Six of the important biogeographic regions identified by the International Geosphere-Biosphere Programme (IGBP) for global change research are included: temperate northern hemisphere, central arid Asia, Caribbean, northern Afric• (including West Africa), southern and eastern Africa, and the tropical Asian Monsoon Region [Eddy et al., 1991]. Site descriptions are summarized in Table 1. The diversity of soils, climatic conditions and plant growth patterns of these sites provide a robust test of Century for global grasslands. While the sites permit a general global intercomparison, each site has made a unique contribution to the analysis presented here.
The large grassland region of the U.S. Central Plains represents a natural west-to-east moisture gradient. The Central Plains Experimental Range (CPER) at the arid end of the gradient is a shortgrass steppe experiencing wide diurnal, seasonal, and annual variation in temperature and precipitation. Vegetation there is dominated by C4 shortgrasses. The Konza Prairie Research Natural Area at the more mesic end of the moisture gradient, is characterized by warm-season (Cn) tallgrass prairie species. Data available at CPER include a 5-year time series (1971-1975) of aboveground live biomass and plant production, for control, irrigated, fertilized, and both irrigated and fertilized plots. Konza data include estimates of aboveground plant production (1976-1990) and seasonality of aboveground live biomass (1984-1990) for annually burned and unburned plots. None of the data from Konza were used to develop the model. Soil data from the CPER was used in model
development; CPER live biomass data was not used in model development.
The five sites in the Commonwealth of Independent States (CIS; formerly Russia) characterize the "continentality" climate gradient from the European temperate meadows of Kursk and Otradnoye in western Russia, through the typical

794 Parton et al.' Modeling Grassland Biomes
SCOPE GLOBAL GRASSLAND STUDY
SITE NAME
1 NAIROBI NAT. PARK KENYA
2 KLONG HK HAT YAI THAILAND
3 MONTECILLOS CHAPINGO MEXICO
4 LAMTO
IVORY COAST
5 CPER PAWNEE
COLORADO U.S.A
6 KONZA PRAIRIE
KANSAS U.S.A
7 KHOMUTOV UKRAINE
8 KURSK RUSSIA
90TRADNOYE 1 RUSSIA
10 SHORTANDY
RUSSIA
11 TUVA KAZAKHSTAN
Fig. 7. Location of the sites used to test the Century model.
steppes of Khomutov in Ukraine, to the ultracontinental steppes of Tuva, at the geographical center of the Asian continent. The long time series of aboveground biomass data (1954-1983) for the Kursk site covers a wide range of year-to-year variation in weather conditions. At Otradnoyc, 5 years of monthly data (1967-1972) are available on aboveground biomass for a loamy and a sandy soft. The Khomutov site has 4 years of aboveground biomass data (1967-1970). More detailed data on vegetation dynamics is available for the Shortandy site, with monthly determinations of live and dead matter, both aboveground and belowground, over the period 1975-1979. The cold, dry Tuva site (aboveground biomass, 1977-1984) is a particularly interesting test for the Century model, since its climatic and physiological characteristics differ markedly from the grasslands of the U.S. Central Plains which were used originally to formulate Century [Parton et al., 1987].
In view of the importance of tropical grass-containing ecosystems or grasslands and savannas as perhaps the largest terresUial biome [Hall and Scurlock, 1991], it was an important objective of the present SCOPE Project to adapt Century for modeling of tropical grasslands. Three of the four tropical grassland sites (Kenya, Thailand, and Mexico) were studied under a United Nations Environment
Programme Project, and have used a common methodology to collect data on live and dead matter, aboveground and belowground, over the period 1984-1990 [Long et al., 1992]. The fourth tropical site was located at Lamto, Ivory Coast.
The Kenyan grassland is a dry grassland, established over
a long period on an ancient soil. By contrast, the Thailand site was probably conver• from forest within the last 50- 100 years, characteristic of many grasslands in southeast Asia. The Mexican grassland is derived from the bed of a saline lake, drained in 1911. The continuous record of aboveground and belowground dam from this site is one of the most detailed for any grassland worldwide. The humid grass savanna site at Lamto, Ivory Coast, has been intensively studied by J. C. Menaut and coworkers for the past 30 years, and a discontinuous record kept of monthly aboveground live and dead matter, and total root matter [Menaut and Cesar, 1979]. Like most tropical grasslands, all four sites were subjected to burning during the period of study. Century's ability to simulate the effects of burning has thus been tested under treatments ranging from annual fires to burning every 6 years.
ESTIMATION OF MODEL PARAMETERS
The robustness of the Century model at a variety of grassland sites, from tropical savannas to temperate steppes and wet meadow grasslands is tested using a single model with minimal changes to parameters. Most parameters used by Century are intended to remain constant in the majority of applications and are referred to as the fixed parameters. Other parameters which are particular to an individual site or group of sites are contained within a site-specific file. With the comparisons between different grassland sites worldwide, it was desirable for the majority of the model parameters to

Parton et al.' Modeling Grassland Biomes 795

o
o
o
o
o
o
,
o
,
,
-i- , o o
-i- o o o
-i- , o o
-i- o o o
-i- o o o
o o o , -i-
o o o o
o o o , -i-
o o o ,
, , + •

Parton et al.' Modeling Grassland Biomes 797
comprise a universal "world grassland" set, with a relatively small number of site-specific parameters changing according to data available from each study site.
Some of these site-specific parameters consist of the "minimum input" d•;• required to run the Century model, which include latitude and longitude, soil texture (sand, silt and clay), soil pH, soil depth for modeling water budget, plant type (Ca, C4), and growing season, and weather data (monthly precipitation, monthly maximum, and monthly minimum temperatures). The remaining site-specific parameters relate mainly to plant physiological functions controlling growth, death, turnover, and N inputs. These differences were kept to a minimum (Table 2 and Figure A1 lists values for all site specific parameters). A site file was first created by entering basic site identification and "minimum input" d_a_;_a into the "universal" grassland file. Phenological differences (length of growing season) and plant growth responses to temperature were also entered at this stage. The Century model was then run for a period of 5000 years, using repeated weather sequences based on long- term weather data from the sites. Appropriate patterns of grassland management (grazing and burning) were incorporated in these long-term runs, based on the known history of the sites (see Table 1).
The equilibrium levels of soil organic matter (SOM) of the long-term runs were used as initial conditions for the validation study. The validation runs were simulated using actual weather data recorded at the site, and a comparison of simulated and observed values of monthly biomass and dead matter, aboveground and belowground was made. For these short-term model runs, the management regime was based on recent grazing/burning practice at each site (see Appendix A for details).
Differences in physiological parameters between the 11 grassland sites are summarized in Table 2. At the Kenyan, Lamto, and Thailand sites, the relatively low belowground live biomass compared with aboveground live biomass required a change in the equations determining root/shoot ratio. Root death rate, determined by available soil water, was satisfactorily modeled by a common function at all the sites except for CPER, where a lower rate was required to achieve the observed balance between live and cl•_d root
biomass. Atmospheric deposition and N fixation inputs are normally determined as a simple linear function of precipitation based on data from the U.S. Great Plains, but increased inputs were required to predict the observed production at the (relatively dry) Confederation of Independent States (CIS) sites. This is consistent with the higher rates of N deposition in continental Europe compared with the U.S. Central Plains [B6nis et al., 1980]. Reduced N inputs were necessary at the Thailand site in order to limit production under conditions of high rainfall. At Konza, Lamto, and Kenya, the function determining C:N ratio was modified to allow wider ratios based on detailed information
available on the N content of plant matter. This modification was important because all these sites have frequent burning which would otherwise result in too much loss of nitrogen.
The death rate of aboveground biomass is determined in Century by the number of soil layers contributing water to
plant growth (and how quickly they dry), as well as by a direct soil water function. In order to produce sufficiently rapid turnover of aboveground matter, the number of soil layers was reduced at the Kenya, Thailand, Otradnoye, and Tuva sites (this had the effect of possibly reflecting differences in soil structure). The death rate function was further increased at the Kenya and Thailand sites. The transfer of standing dead to litter was highest for continental sites with snowfall (0.20 per month) and much lower for the tropical sites (0.10 per month). Most of these site specific differences reflect species specific and soil differences at the site. Documentation of the specific values of these sites are presented in Appendix A and a copy of site specific parameters are available from the authors.
MODEL TESTING
In this section we show a comparison of observed data and simulated model output variables. The model output variables that we will test include the following: (1) dynamics of live shoot biomass, (2) aboveground plant production, (3) peak standing live shoot biomass, and (4) soil C and N levels. These variables were selected because
they characterize grassland systems and interact with GCM models. Soil C level and plant production are important for the global C cycle, live plant biomass has a big impact on the energy and water budgets, and peak live biomass is frequently used as an estimate of aboveground plant biomass. Live plant biomass influences the energy budget by altering the canopy albedo and soil temperature latent heat fluxes.
We employed three •e•chniques for testing the Century model: (1) linear regression of observed data versus simulated model results, (2) comparison of the Century model predictions with empirical regression models predicted from climate variables [Lauenroth, 1978], and (3) calculating the number of times the difference between Century model prediction and observed data differed by less than a threshold proportion (25%) of the observed data. The results show that in general the observed versus simulated 1 • for the Century model and the empirical regression models are fairly similar. The advantage of the Century model is that it can predict total system behavior (e.g., nutrient cycling, N gas fluxes, water fluxes, leaching inorganic and organic compounds) and responses to manipulations such as fertilization, irrigation, and land use changes, while regression models can only predict what will happen for the particular observed data set used to generate the regression model coefficients. As a minimum criterion, in general, we felt Century should predict observed data at least as well as empirical climate regression models, which have limited extrapolation potential without including nutrient interactions [Esser, 1986].
ABOVEGROUND NET PRIMARY PRODUCTION
Aboveground plant production data were available from the CPER shortgrass prairie site and the Konza tallgrass site. The CPER site has plant production from 1971 to 1975 for a control, fertilized, irrigated, and irrigated and fertilized sites

798 Parton et al.' Modeling Grassland Biomes
[Lauenroth, 1978]. The Konza site has plant production data from 1976-1990 for annual burned and unburned sites
[Abrams et al., 1986, Bfiggs et al., 1989] (also see unpublished Long-Term Ecological Research records). The comparison of observed and simulated production data (Figure 8) shows that the model simulates these different treatments with an r • of 0.70. A linear regression where the independent factors were annual precipitation, fertilization, and burning has an r • -- 0.67. While Century may not greatly improve on predicting observations under current conditions, compared to simple regression models, its concurrent ability to predict the seasonality of foliage production has substantial significance to vegetation- atmosphere interactions studies and models of ecosystem dynamics. Sixty percent of Century's predicted plant production values have errors less than +25% of the observed plant production. The standard errors of the observed plant production across field replicates generally ranged from 10 to 20% of the observed values.
PEAK LIVE BIOMASS
The simulated peak live biomass from all of the different sites and treatments were compared to the observed peak live biomass (Figure 9). The observed peak live biomass is the maximum live biomass observed in a particular calendar year (January to December). Century results have an r • = 0.45. The r • for the best regression model was 0.40, with annual precipitation as the independent variable. Peak live biomass is frequently used to estimate annual plant production in ungrazed grasslands, with annual production being approximately 50% greater than the peak live biomass [Lauenroth and Sala, 1992].
An analysis of the residual error showed that all of the large underestimates of peak live biomass by Century came from the Khomutov and Kursk sites. For comparison, removing the extreme Khomutov and Kursk points from the analysis increased the r • from 0.45 to 0.65. Fifty-seven percent of the Century predictions had errors that were less than + 25% of the observed data. In general, the model simulated peak live biomass reasonably well for all of the sites, with the exception of peak live biomass for the observed high plant production years (9 years out of 32 years) at the Kursk and Khomutov sites. The reason for the Russian site errors is unclear. We suspect that changes in species composition occurred during the high production years. It is also important to note that these two sites recorded some of the highest peak live biomass observed at any site in spite of the fact that precipitation at the Russian sites is 1/2 to 1/3 of the values for the tropical sites.
LIVE PLANT BIOMASS DYNAMICS
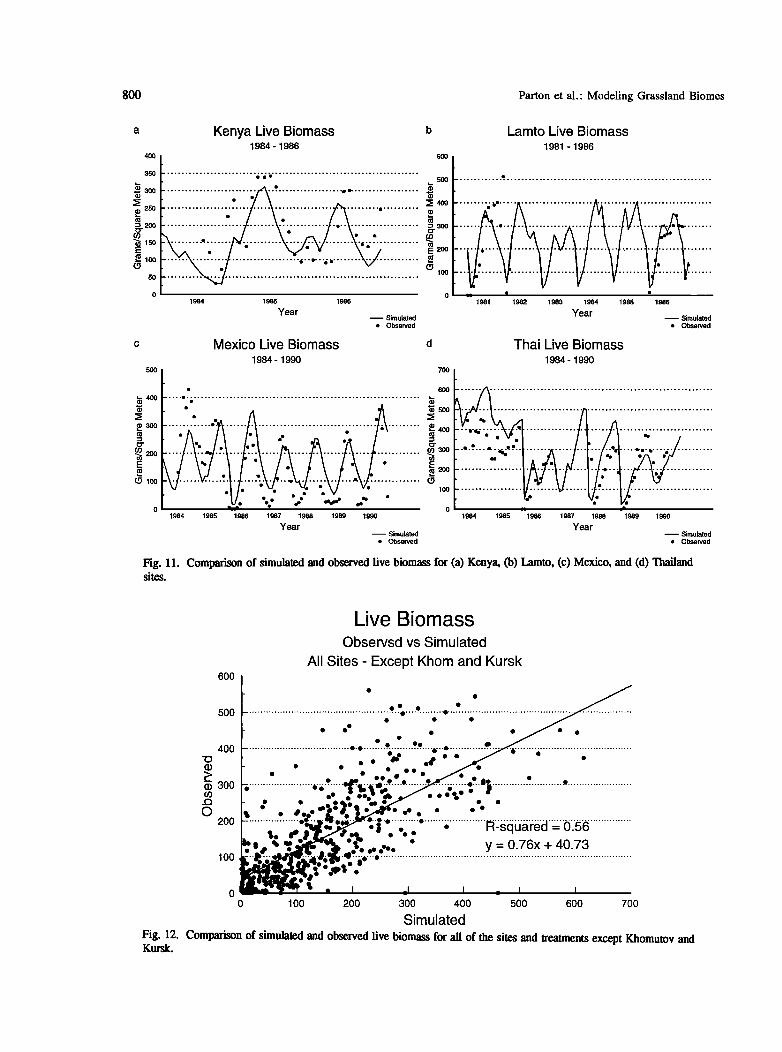
The comparison of observed and simulated live biomass for some of the temperate (Figure 10) and tropical (Figure 11) sites shows that general seasonal patterns were well simulated by the model. Difference between very dry and wet years (1989 versus 1990 at Konza and 1981 versus 1980 at Tuva) were well simulated, however, more subtle differences between years with similar precipitation (Konza 1984-1987 and Kursk 1975-1979) were not well simulated. For the tropical sites (Figure 10) the response to fire (1986 and 1989 at Thailand, 1986 at Lamto) was fairly well simulated. The death of live biomass at Mexico was
underestimated during the dry season.
1,000
Observed vs Simulated Production Burned, Unburned, & CPER
8OO
600
4oo
2OO
............................................... j,-..,-- e.•......• ................................................ ß .........................
................ ..... ' ..... ' ..... .............................................................................................. . e/•eeeee .•o ' ' ß y = 88 + .67x, r 2 = .70 i I I I
0 200 400 600 800 1,000
Simulated
Fig. 8. Comparison of observed and simulated aboveground plant production for all the CPER treatment and burned and unburned sites at Konza.

Parton et al.' Modeling Grassland Biomes 799
1,000
8OO
Peak Live Biomass - All Sites Observed vs Simulated
6OO
4OO
2OO
ß
ß ß
ß ß ß
oA ........... •A
ß ß
ß ß
ß e• oo e•
ß ß ß ß ß
o I I I 0 100 200 300 400 500
Simulated
ß Russian Sites
y = 78 + .80x, r2= .45 y-R= 48 + .83X, r2= .65
I
600 700
Fig. 9. Comparison of observed and simulated peak live biomass from all of the sites. The Kursk and Khomutov site data are shown with a.
lOO
• 80
(• 60
g 40
• 20
o
CPER Live Biomass b Konza Live Biomass 1973 - 1975 1984-1990
600
-• . • 400 ...........
•D..300 • ß ß i,, •, .................. •o ..................................
200 .......... • 100 .........
0
1973 1974 1975 1984 1985 1986 1987 1988 1989 1990 Year Year -- Simulated --- Simulated
ß Observed ß Observed
Kursk Live Biomass d Tuva Live Biomass 1975 - 1979 1978 - 1982
500 3oo
400 ................................... ' ............. -"' .................... • 250 .....................................................................
ß :•2oo 300 e
ß ' ß •'•$o
200 100 • so
0 o 1975 1976 1977 1978 1979 1978 1979 1980 1981 1982
Time Year -- Simulated ---- Simulated
ß Observed ß Observed
Fig. 10. Comparison of simulated and observed live biomass for (a) CPER, Co) Konza, (c) Kursk, and (d) Tuva sites.
800 Parton et al.' Modeling Grassland Biomes
400
350
ß ,.., 300
•D 250
• 200
u• 150
50
Kenya Live Biomass 1984 - 1986
600
ß ............ ........................... ß ß ................... •
ß . •) • 400
• 300
E 200
('• 100
0 0
• Simulated ß Observed
1984 1985 1986
Year
c Mexico Live Biomass d 1984 - 1990
500 700
Lamto Live Biomass 1981 - 1986
500 ............. e. .........................................................
1981
ß
1982 1983 1984 1985 1986
Year • Simulated
ß Observed
Thai Live Biomass 1984 - 1990
ß 600
,,- 400 .... ß ................................................................. •
'• ß • 500 :• ß
03 03 300 • 200 •
E E • • 200 •100 ................... •
lOO
o • • • • o 1984 1985 1986 1987 1988 1989 199o
Year • Simulated
ß Obse•ed
•d• ß ß ee '' * ß e--e.-- •. .... e.-e ..................... e.e.• .... d ...........
1984 1985 1986 1987 1988 1989 1990
Year • Simulated
ß Observed
Fig. 11. Comparison of simulated and observed live biomass for (a) Kenya, (b) Lamto, (c) Mexico, and (d) Thailand sites.
600
5OO
4O0
(D 300 ß
o 200
100
Live Biomass Observsd vs Simulated
All Sites - Except Khom and Kursk
$o •'
o o lOO
ß ß
...............
ß ß ß ß ß
. * •"0 .d* * * * * ß ß oo
ß ß ß .,.*..o,. ............ .*. ........... ., .......................
***%* *. *' ß
ß 1" .......... ' ....... ; ............. R:•'•ifi'•i•6'd"::'0'.'5• ............... eeee
,....... y = 0.76x + 40.73 •' 't'O" 'O ..........................................................................................
200 300 400 500 600 700
Simulated
Fig. 12. Comparison of simulated and observed live biomass for all of the sites and treatments except Khomutov and Kursk.

Parton et al.' Modeling Grassland Biomes 801
A comparison of observed versus simulated live plant biomass for aH of the sites and different treatments showed r • = 0.39. Again, the model tended to underestimate live biomass for high production years at the Kursk and Khomutov sites. Removing the data from the Kursk and Khomutov sites increased the r a to 0.56 (Figure 12), suggesting that the errors for the Russian high plant production years greatly reduce the r •. Thirty-one percent of the Century predictions had errors less than + 25% of the observed data, while 57% of Century predictions had errors less than + 50% of the observed data. These results
show that the model simulates peak live biomass and aboveground plant production better than live biomass.
SOIL C AND N
Soil C and N levels are fairly well simulated (r a = 0.93 and 0.89, respectively for C and N) across a range of soil C levels ranging from less than 2000 g C m '2 at Lamto to greater than the 10,000 g C m '2 at the Kursk site (Figure 13). The assumptions used to control soil C stability and decomposition (clay impact on passive SOM and silt plus
a
12,000
10,000
8,000
6,000
4,000
2,000
Soil C (0-20 cm)
.•' y=.93x-7.84 r2=,93
I I ! I !
2,000 4,000 6,000 8,000 10,000 12,000
Simulated (gm -2)
Soil N (0-20 cm)
E
1,000
800
6OO
4OO
200 • y=.73x-78.84
r • 88
I I I I
0 0 200 400 600 800 1,000
Simulated (gm -2) Fig. 13. Comparison of simulated and observed steady state soil (a) C and Co) N for 9 of the 11 sites. Mexico and Thailand sites were not used because they are not at equilibrium with their present land uses.

802 Parton et al.' Modeling Grassland Biomes
clay on slow SOM) seem to work across a diverse set of soil textures and soil mineralogies. One hundred percent for C and 75% for N of the model predictions had errors less than :t: 25% of the observed values. Soil C data from the CPER
and Konza site were used to fit some of the model
parameters in the SOM model. Burke et al. [1989] have developed a regression model for predicting soil C and N levels in grasslands as a function of climate and soil texture. We used the Burke et al. [1989] model to predict soil C and N levels at the different sites (excluding Thailand and Mexico), and r 2 between observed and simulated soil C and N levels were 0.89 and 0.90, respectively.
Appendix A shows the equilibrium soil C level for the different soil pools (presented as initial values for model runs). The data show that the fraction of soil C in active SOM generally ranged from 2% to 4%, and 35-60% for passive SOM. Sites with high clay (>35%) content had high amounts of passive SOM and less slow SOM. For example, the sandy soils at CPER had 61% slow SOM and 36% passive, while the clay loam soils at Konza has 41% slow and 55% passive SOM.
DISCUSSION
We think that difficulty in simulating live plant biomass is primarily a result of the fact tliat plant species changes are not considered in the model. Changes in species composition from Ca and C4 vegetation or structural changes resulting from shifts between grasslands and savannas affect nutrient dynamics, water utilization, biomass allocation, and other characteristics which modify plant production and seasonality of plant growth. Numerous grassland studies have shown that shifts in Ca and C4 grass dominance can be induced by drought [Albertson and Weaver, 1944], grazing and fire regime [Owensby et al., 1970; Towne and Owensby, 1984; Bragg and Hulbert 1976], or nitrogen additions [Owensby et al., 1970; Dodd and Lauenroth, 1978; Wedin and Tilman 1990; Seastedt et al., 1991]. Modifications of resource use efficiency among various vegetation communities are important to projecting how an ecosystem will respond to increased atmospheric CO,., change in climate, or increases in atmospheric deposition of N [W• and Tilman, 1990]. Studies of N additions to grassland ecosystems indicate that grassland communities are sensitive to the soil nitrogen status [Dodd and Lauenroth, 1978; Wedin and Tilman, 1990; Seastedt et al., 1991]. These shifts in plant communities have potentially major impacts on soil organic matter dynamics via controls of nitrogen immobilization and storage, however, our ability to predict changes in plant species composition is limited.
Additional factors contributing to these subtle interannual differences may restfit from (1) interannual variations in incident PAR, not included in the model, (2) effects of timing of rainfall not captured with a monthly time step, or (3) lag effects of nutrient or photosynthate storage in plants. Invest:.::;•,:z•&•n of the above effects is ongoing.
M• :•Je•s '•.'ke Century which simulate NPP form an ;m•no: ;am complement to more physiologically oriented
models which simtfiate photosynthesis and respiration. Physiological models require detailed climatic information, such as hourly incoming solar radiation relative humidity and wind speeds, that are not widely available for retrospective analyses such as are presented here. Physiological models may also be sensitive to species- dependent traits, though this sensitivity may be tractable for large-scale calculations [Schimel et al., 1990; McGuire et al., 1992]. The extensive body of NPP data over time, reflecting both geographic variability and the effects of climate variability allows the development of powerful calibrated models like Century. Such data and models are a crucial benchmark test for predicted time integral quantifies (e.g., NPP, biomass levels) from models based on calculation of instantaneous exchanges of CO,..
SUMMARY
The comparison of observed and simulated live peak biomass and plant production had r 2 values of 0.45 and 0.70, respectively; Century error terms for these variables were generally less than :t:25% of the observed data. Seasonal live biomass was not as well represented by the model (x a -- 0.39) and had errors less than :t: 50% of the observed d_a_m_: The model simulated differences bet/veen wet and dry years well, but was unable to simulate more subtle differences between years with similar precipitation. The model substantially underestimated live biomass for unusually high production years at the Kursk and Khomutov sites.
A comparison of the Century model predictions for plant production and peak live biomass with empirical regression equations fit to observed data showed that the Century model was slightly more successful than the regression equations. Steady state soil C and N levels were well simulated by the model (r 2 = 0.93 and 0.89) for a set of sites with differing climate and soil textures. The model was able to predict soil C and N levels to within :t: 25% of observed data. Globally, key controls over C storage, NPP, and biomass include climate, N inputs and losses, and soil particle size distribution. This model, rigorously calibrated against a large body of observations, is useful both as a descriptive and analytical tool, and as a baseline test for time-integrated predictions (e.g., of NPP or biomass) for physiologically based models, explicitly simulating CO,. exchange [e.g., Coughenour, 1984; Hunt et al., 1991].
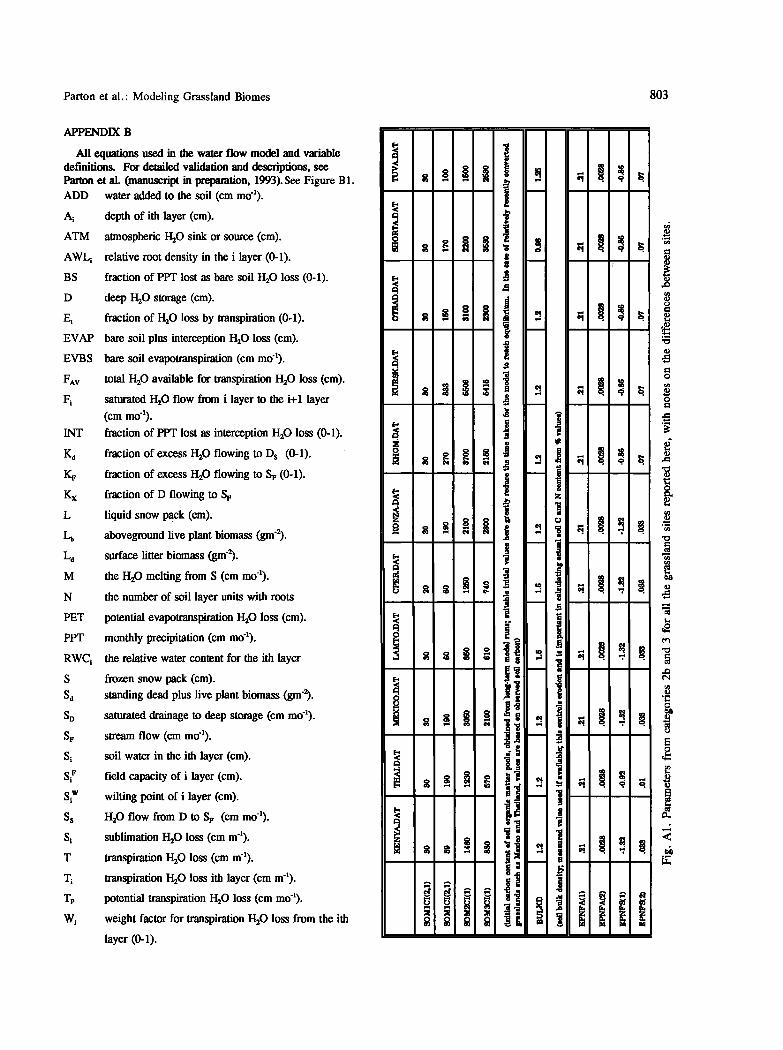
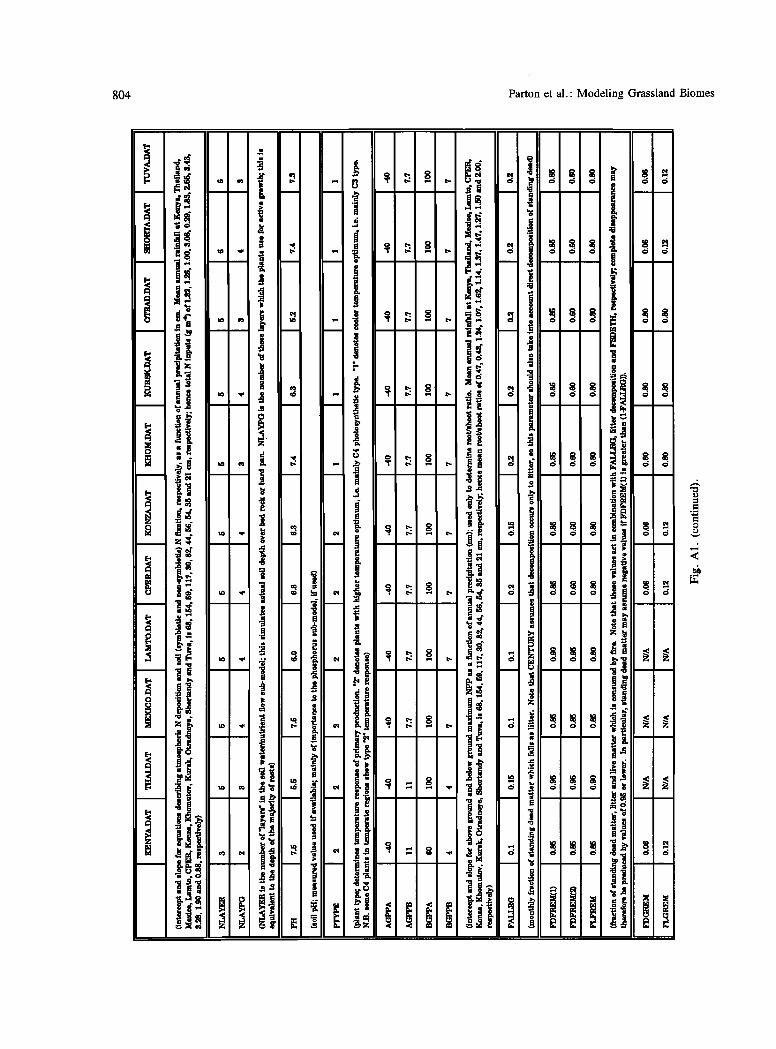
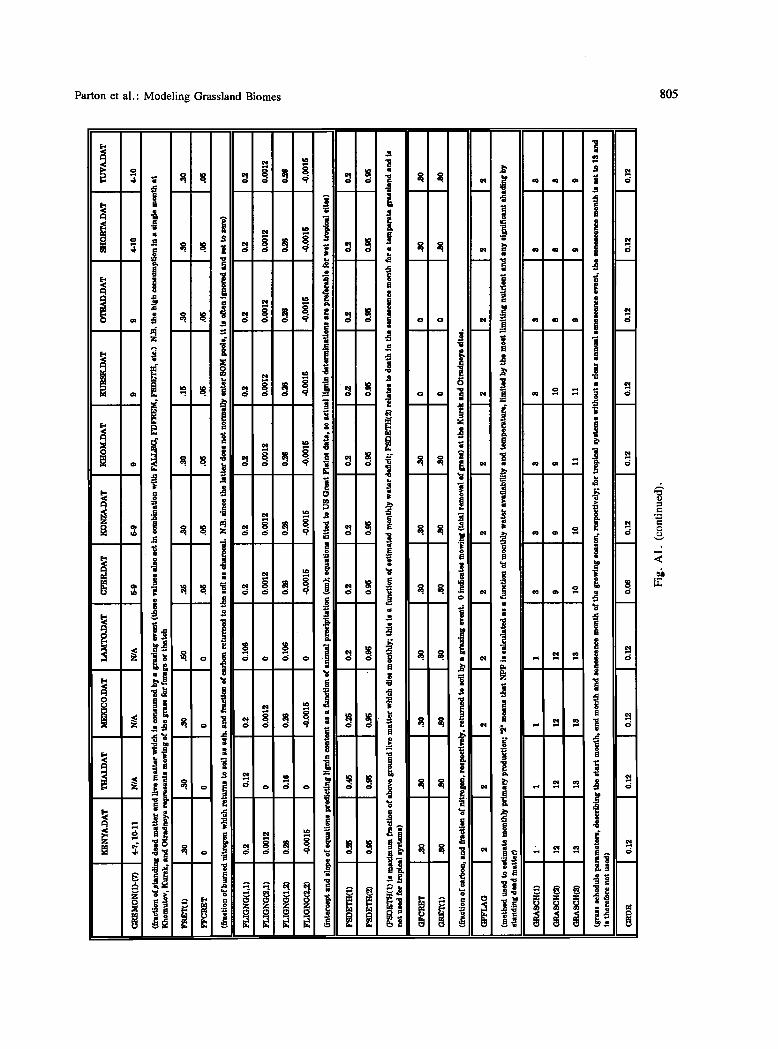
APPENDIX A
Site-specific parameters found in the SITENAME.DAT file may be divided into a number of categories (see Figure A1): (1) Basic site identification (e.g., SITLAT, SIllgqG); (2) "minimum input" data required to mn the Century model ((a) environmental information such as PRECIP, TMN2M, TMX2M; and Co) physical features such as sand, silt, clay); (c) parameters relating mostly to plant and soil physiology.
Figure A1 shows the parameters from categories 2b and 3 for all the grassland sites reported here, with notes on the differences between sites.
Parton et al.' Modeling Grassland Biomes 803
All equations used in the water flow model and variable definitions. For detailed validation and descriptions, see Parton et al. (manuscript in preparation, 1993).See Figure B1. ADD water added to the soil (cm mo4).
& depth of ith layer (cm).
ATM atmospheric H•.O sink or source (cm).
AWL i relative root density in the i layer (0-1).
BS fraction of PPT lost as bare soil H20 loss (0-1).
D deep H20 storage (cm).
E• fraction of H20 loss by transpiration (0-1).
EVAP bare soil plus interception H20 loss (cm).
EVBS bare soil evapotranspiration (cm mo4).
FAv
Kd
La
M
N
PET
PPT
RWC i
s
sa
sD
sv
si
s?
Si w
Ss
S•
T
T,
%
Wa
total H,.O available for transpiration H20 loss (cm).
saturated H,.O flow from i layer to the i+ 1 layer (cm mo4). fraction of PPT lost as interception H20 loss (0-1).
fraction of excess H,.O flowing to Ds (0-1).
fraction of excess H,.O flowing to Sv (0-1).
fraction of D flowing to Sv
liquid snow pack (cm).
aboveground live plant biomass (gm").
surface litter biomass (gm'2).
the H20 melting from S (cm mo4).
the number of soil layer units with roots
potential evapotranspiration H,.O loss (cm).
monthly precipitation (cm mo4).
the relative water content for the ith layer
frozen snow pack (cm).
standing dead plus live plant biomass (gm'2).
saturated drainage to deep storage (cm mo4).
stream flow (cm mo4).
soil water in the ith layer (cm).
field capacity of i layer (cm).
wilting point of i layer (cm).
H•.O flow from D to Sv (cm mo4).
sublimation H•.O loss (cm m4).
transpiration H20 loss (cm m4).
transpiration H20 loss ith layer (cm m4).
potential transpiration H,.O loss (cm mo4).
weight factor for transpiration H20 loss from the ith
layer (0-1).
804 Parton et al.' Modeling Grassland Biomes
Parton et al.' Modeling Grassland Biomes 805

806 Parton et al.. Modeling Grassland Biomes

Parton et al.' Modeling Grassland Biomes 807
n Z • Z *•
o•. A A , 0•1 --*•
•w- ^ v
,,&
o • • o u_• II f.,0 - A

808 Parton et al.: Modeling Grassland Biomes
Acknowledgements. Measurement of monthly biomass dynamics, NPP, and soil organic matter at the tropical grassland sites in Kenya, Thailand, and Mexico was carded out under United Nations Environment Programme (UNEP) Project FP/6108-88-01(2855) "Environment Changes and Productivity of Tropical Grasslands" (1989-1992), and more recently at the Kenya and Mexico sites under the UK Overseas Development Administration (ODA) Project R4744 "Productivity of Tropical Grasslands" (1991-1994). Analysis of da_to from the sites in the former USSR was carried out under the Russian National Scientific and Technical Programme 18 "Changes of Natural Environment and Climate." Data synthesis and model validation was made possible by the SCOPE (Scientific Committee on Problems of the Environmen0 Project "Effects of Climate Change on Production and Decomposition in Coniferous Forests and Grasslands" (1989-1992). Model development was primarily funded by the U.S. National Science Foundation (NSF) project BSR 9013888 "Coupling Ecosystem Processes and Vegetation Patterns Across Environmental Gradients" and the U.S. NASA Earth Observing System project NACW- 2662 "Using Multi-Sensor Data to Model Factors Limiting Carbon Balance in Global Grasslands," and U.S. NSF project BSR 9011659 "Long Term Ecological Research Program: Shortgrass Steppe."
REFERENCES
Abrams, M.D., A. K. Knapp, and L. C. Hulbert, A ten-year record of aboveground biomass in a tallgrass prairie: Effects of fire and topographic position, Am. J Bot. 73, 1509-1515, 1986.
Albertson, F. W., and J. E. Weaver, Nature and degree of recovery of grassland from the great drought of 1933 to 1940, Ecol. Monogr. 14, 395-479, 1944.
Anderson, J. M., The effects of climate change on decomposition processes in grassland and coniferous forests, Ecol. Appl. 1, 326-347, 1991.
Becker-Heidman, X., Die Tiefenfunktionen der nataHichen Kohlenstoff-lsotopen gehalte von vol lstancli g dannschichtweise beprobten Parabraunerden und ihre Relation zur Dynamik der organischen Substanz in diesen BOden. Herausgeber; Verein zur FOrderung der Bodenkunde, Hamburg, 1985.
B6nis, K., E. M6szfiros, and M. Putsay, On the atmospheric budget of nitrogen compounds over Europe, lddjdrds 84, 57-68, 1980.
Bragg, T. B., and L. C. Hulbert, Woody plant invasion of unburned Kansas bluestem prairie, J. Range Manage. 29, 19-23, 1976.
Briggs, J. M., T. R. Seastedt, and D. J. Gibson, Comparative analysis of temporal and spatial variability in aboveground production in a deciduous forest and prairie, Holarc. Ecol. 12, 130-136, 1989.
Burke, I. C., C. M. Yonker, W. J. Parton, C. V. Cole, K. Flach, and D. S. Schimel, Texture, climate, and cultivation effects on soil organic matter context in U.S. grassland soils, Soil Sci Soc. Am. J. 53, 800-805, 1989.
Christie, E. K., and J. K. Detling, Analysis of interference between C3 and C4 grasses in relation to temperature and soil nitrogen supply, Ecology, 63, 1277-1284, 1982.
Coughenour, M. B., A mechanistic simulation analysis of water use, leaf angles, and grazing in east African graminoids, Ecol. Model., 26, 203-230, 1984.
Dodd, J. L., and W. K. Lauenroth, Analysis of the response of a grassland ecosystem to stress, in Perspectives in Grassland Ecology, edited by N. French, pp. 43-58, Springer-Verlag, New York, 1978.
Eddy, J. A., T. F. Malone, J. J. McCarthy, and T. Rosswall (Eds.) Global Change Systems for Analysis, Research and Training (START) Rep. 15, IGBP, Stockholm, Sweden, 1991.
Esser, O., The carbon budget of the biosphere--structure and preliminary results of the Osnabruck Biosphere Model, Veroff. Naturf. Ges. Emden von 1814, 7, 1-160, 1986.
Gupta, S. C., and W. E. Larson, Estimating soil water retention characteristics from particle size distribution, organic matter content and bulk density, Water Resour. Res. 15, 1633-1635, 1979.
Hall, D. O., and J. M. O. Scurlock, Climate change and productivity of natural grasslands, Ann. Bot. 67 (suppl.), 49-55, 1991.
I-laG, W. M., M. H. Liu, and P. J. Crutzen, Estimates of annual and regional releases of CO: and other trace gases to the atmosphere from fires in the tropics, in Fire in the Tropical Biota, Ecol. Stud., vol. 84, edited by J. G. Goldammer, pp. 440-462, Springer-Verlag, New York, 1990.
Holland, E. A., W. J. Parton, J. K. Detling, and D. L. Coppock, Physiological responses of plant populations to herbivory and their consequences for ecosystem nutrient flows, Am. Nat. 140, 685-706, 1992.
Hunt, H. W., M. J. Trlica, E. F. Redente, J. C. Moore, J. K. Derling, T. G. F. Kittel, D. E. Walter, M. C. Fowler, D. A. Klein, and E. T. Elliott, Simulation model for the effects of climate change on temperate grassland ecosystems, Ecol. Model. 53, 205-246, 1991.
Jenkinson, D. S., The turnover of organic carbon and nitrogen. Philos. Trans. R. Soc. London B, Ser. 329, 361- 368, 1990.
Kirchner, T. B. Time zero: The integrated modelling environment, Ecol. Model. 47, 33-52, 1989.
Knapp, A. K., and W. K. Smith, Stomatal and physiological responses to variable sunlight. Phys. Plant. 78, 160-165, 1990.
Lauenroth, W. K., Grassland primary production: North American grasslands in perspective, in Perspectives in Grassland Ecology, edited by N. French, pp. 3-21, Springer-Verlag, New York, 1978.
Lauenroth, W. K., and O. E. Sala, Long-term forage production of North American shortgrass steppe, Ecol. Appl. 2, 397-403, 1992.
Lieth, H, Modelling the primary productivity of the world, UNESCO, Pads, Nature Res. 8, 5-10, 1972.
Linacre, E. T., A simple formula for estimating evaporation rates in various climates, using temperature data alone, Agric. Meteorol. 18, 409-424, 1977.

Parton et al.: Modeling Grassland Biomes 809
Long, S. P., M. B. Jones, and M. J. Roberts, Pr/mary Productivity of Grass Ecosystems of the Tropics and Sub- tropics, 267 pp, Chapman and Hall, London, 1992.
McGuire, A.D., J. M. Melillo, L. A. Joyce, D. W. Kicklighter, A. L. Grace, B. Moore III, and C. J. Vorosmarty, Interactions between carbon and nitrogen dynamics in estimating net primary productivity for potential vegetation in North America, Global Biogeochem. Cycles, 6, 101-124, 1992.
Menaut, J. C., and J. Cesar, Structure and primary productivity of Lamto savannas, Ivory Coast. Ecology 60, 1197-1210, 1979.
Ojima, D. S., W. J. Parton, D. S. Schimel, and C. E. Owensby, Simulated impacts of annual burning on prairie ecosystems, in Fire in the North American Prairies, edited by S. L. Collins and L. Wallace, University of Oklahoma Press, Norman, 1990.
Owensby, C. E., R. M. Hyde, and K. L. Anderson, Effects of clipping and supplemental nitrogen and water on loamy upland bluestem range, J. Range Manage. 23, 341-346, 1970.
Parton, W. J., Predicting soil temperatures in a shortgrass steppe, Soil Sci. 138, 93-101, 1984.
Parton, W. J., D. S. Schimel, C. V. Cole, and D. S. Ojima, Analysis of factors controlling soil organic matter levels in Great Plains grasslands, Soil Sci. Soc. Am. J. 51, 1173- 1179, 1987.
Parton, W. J., J. W. B. Stewart, and C. V. Cole, Dynamics of C, N, P and S in grassland soils: a model, Biogeochemistry 5, 109-131, 1988.
Parton, W. J., C. V. Cole, J. W. B. Stewart, D. S. Ojima, and D. S. Schimel, Simulating regional patterns of soil C, N, and P dynamics in the U.S. central grasslands region, in Ecology of Arable Land, edited by M. Clarholm and L. Bergstrom, pp. 99-108, Kluwer Academic, Hingham, Mass., 1989a.
Parton, W. J., R. L. Sanford, P. A. Sanchez, and J. W. B. Stewart, Modeling soil organic matter dynamics in tropical soils, in Dynamics of Soil Organic Matter in Tropical Ecosystems, edited by D.C. Coleman, J. M. Oades, and G. Uehara, pp. 153-171, NiITAL Project, University of Hawaii Press, Honolulu, 1989b.
Parton, W. J., B. McKeown, V. Kirchner, and D. Ojima, CENTURY Users' Manual, Natural Resource Ecology Laboratory, Colorado State University, Fort Collins, 1992.
Parton, W. J., D. S. Schimel, D. S. Ojima, and C. V. Cole, A general model for soil organic matter dynamics: sensitivity to litter chemistry, texture and management, Soil Sci. Soc. Am. J. in press, 1993.
Sala, O. E., W. J. Parton, L. A. Joyce, and W. K. Lauenroth, Primary production of the Central Grassland Region of the United States, Ecology 69, 40-45, 1988.
Sanford, Jr., R. L., W. J. Parton, D. S. Ojima, and D. J. Lodge, Hurricane effects on soil organic matter dynamics and forest production in the Luquil!o Experimental Forest, Puerto Rico: Results of simulation modeling, Biotropica 23, 364-372, 1991.
Schimel, D. S., W. J. Parton, T. G. F. Kittel, D. S. Ojima, and C. V. Cole, Grassland biogeochemistry: Links to atmospheric processes, Climatic Change 17, 13-25, 1990.
Seastedt, T. R., J. M. Brigs, and D. J. Gibson, Controls of nitrogen limitation in tallgrass prairie, Oecologia 87, 72- 79, 1991.
Towne, G., and C. E. Owensby, Long-term effects of annual burning at different dates in ungrazed Kansas tallgrass prairie, J. Range Manage. 37, 392-397, 1984.
Vitousek, P.M., D. R. Turner, W. J. Parton, and R. L. Sanford, Jr., Litter decomposition with Mauna Loa environmental matrix, Hawaii: Patterns, mechanisms and models, Ecology, in press, 1993.
Wedin, D. A., and D. Tilman, Species effects on nitrogen cycling: a test with perennial grasses, Oecologia 84, 433- 441, 1990.
E. Garcia Moya, Centro de Botanica, Colegio de Postgraduados, Cahpingo, Mexico 56230 Mexico
T. G. Gilmanov, Depamnent of Vertebrate Zoology and Ecology, Moscow State University, 119899 Moscow, Russia.
A. Kamnalmt, Faculty of Natural Resources, Prince of Songkla University, Hatyai 90110, Thailand.
J. I. Kinyamario, Department of Botany, Univeristy of Nairobi, P.O. Box 30197, Nairobi, Kenya.
T. Kirchner, D. S. Ojima, and W. J. Parton, Natural Resource Ecology Laboratory, Colorado State University, Ft. Collins, CO 80523.
J-C. Menaut, Laboratoire D-Ecologie, Ecole Normal Superieure, CNRS-URA 258, 46 Rue d'Ulm, 75230 Paris Cedex 05, France.
D. S. Schimel, Climate System Modelling Program, NCAR, 1850 Table Mesa Drive, P.O. Box 3000, Boulder, CO 80309.
R. J. Scholes, Forestek, CSIR, P.O. Box 395, Pretoria 0001, South Africa.
J. M. O. Scurlock, Division of Life Sciences, Kings College London, Campden Hill Road, London W8 7AH, United Kingdom.
T. Seastedt, Institute of Arctic and Alpine Research, University of Colorado, Campus Box 450, Boulder, CO 80309.
(Received January 29, 1993; revised June 21, 1993; accepted July 22, 1993.)