Embed Size (px)
Citation preview

©Institute for Clinical and Economic Review, 2021
Observational Real-World Evidence Update
Prophylaxis of Hereditary Angioedema with
Takhzyro and C1 Inhibitors:
Effectiveness and Value
August 24, 2021

©Institute for Clinical and Economic Review, 2021 Page i HAE RWE Update - Report
DATE OF
PUBLICATION: August 24, 2021
How to cite this document: Bloudek L*, Jaksa A*, McKenna A, Carlson J, Chen Y, Patrick A, Campbell
JD. Observational Real-World Evidence Update; Prophylaxis of Hereditary Angioedema with
Takhzyro and C1 Inhibitors: Effectiveness and Value. August 24, 2021.
https://icer.org/assessment/hereditary-angioedema-2018/#timeline
*Co-lead authors
Lisa Bloudek and Ashley Jaksa served as co-lead authors for the report. Avery McKenna led the
updated literature review and wrote the corresponding sections. Ashley Jaksa and Amanda Patrick
conducted the observational real-world evidence analyses and wrote the corresponding sections.
Lisa Bloudek, Yilin Chen, and Josh Carlson developed the cost-effectiveness model and authored the
corresponding sections of the report. Jon Campbell served as the senior scientific advisor across
the report and edited the full report for content and clarity. We would like to acknowledge the
work of Kanya Shah, who contributed to the updated literature review, and Krisha Patel and Hanaya
Raad, who contributed to the claims analysis. We would also like to thank Matt Seidner for his
contributions to this report, as well as the authors and contributors who worked on the 2018 ICER
review of prophylactic treatments for HAE.
ICER Staff University of Washington Modeling
Group Aetion
Avery McKenna, BS
Senior Research Assistant,
Evidence Synthesis
ICER
Jon D. Campbell, PhD, MS
Senior Vice President for Health
Economics
ICER
Lisa Bloudek, PharmD, MS Senior Research Scientist University of Washington Josh Carlson, PhD, MPH Associate Professor, Department of Pharmacy University of Washington Yilin Chen, MPH PhD Student, Department of Pharmacy University of Washington
The role of the University of
Washington is limited to the
development of the cost-
effectiveness model, and the
resulting ICER reports do not
necessarily represent the views of the
University of Washington.
Ashley Jaksa, MPH
Scientific Partnerships Lead
Aetion, Inc.
Amanda Patrick, MS
Sr. Principal Product Scientist
Aetion, Inc.
The role of Aetion is limited to the
development of the RWE, and the
resulting ICER reports do not
necessarily represent the views of
Aetion.

©Institute for Clinical and Economic Review, 2021 Page ii HAE RWE Update - Report
About ICER
The Institute for Clinical and Economic Review (ICER) is an independent non-profit research organization that
evaluates medical evidence and convenes public deliberative bodies to help stakeholders interpret and apply
evidence to improve patient outcomes and control costs. Through all its work, ICER seeks to help create a future in
which collaborative efforts to move evidence into action provide the foundation for a more effective, efficient, and
just health care system. More information about ICER is available at https://icer.org/.
The funding for this report comes from government grants and non-profit foundations, with the largest single
funder being the Arnold Ventures. No funding for this work comes from health insurers, pharmacy benefit
managers, or life science companies. ICER receives approximately 19% of its overall revenue from these
health industry organizations to run a separate Policy Summit program, with funding approximately equally split
between insurers/PBMs and life science companies. No life science companies relevant to this review participate
in this program. For a complete list of funders and for more information on ICER's support, please
visit https://icer.org/who-we-are/independent-funding/.
For drug topics, in addition to receiving recommendations from the public, ICER scans publicly available
information and also benefits from a collaboration with IPD Analytics, an independent organization that performs
analyses of the emerging drug pipeline for a diverse group of industry stakeholders, including payers,
pharmaceutical manufacturers, providers, and wholesalers. IPD provides a tailored report on the drug pipeline on
a courtesy basis to ICER but does not prioritize topics for specific ICER assessments.
The findings contained within this report are current as of the date of publication. Readers should be aware that
new evidence may emerge following the publication of this report that could potentially influence the results.
ICER may revisit its analyses in a formal update to this report in the future.
The economic models used in ICER reports are intended to compare the clinical outcomes, expected costs, and
cost effectiveness of different care pathways for broad groups of patients. Model results therefore represent
average findings across patients and should not be presumed to represent the clinical or cost outcomes for any
specific patient.

©Institute for Clinical and Economic Review, 2021 Page iii HAE RWE Update - Report
In the development of the original 2018 report, ICER’s researchers consulted with clinical experts,
patients, manufacturers, and other stakeholders. For this report update, ICER consulted with the
manufacturers of prophylactic HAE therapies and a clinical expert, Dr. Kevin Yee-Bien Tse. Dr. Tse is
not responsible for the final contents of this report, nor should it be assumed that he supports any
part of it. The report should be viewed as attributable solely to the ICER team and its affiliated
researchers.
For a complete list of stakeholders from whom we requested input during the original 2018
assessment, please visit: https://icer.org/wp-
content/uploads/2020/10/ICER_HAE_Key_Stakeholders_041218-1.pdf
Expert Reviewer
Kevin Yee-Bien Tse, MD
Department of Allergy
Kaiser Permanente Medical Center
Dr. Tse holds over $10,000 in Moderna stock. No other relevant conflicts of interest to disclose,
defined as more than $10,000 in health care company stock or more than $5,000 in honoraria or
consultancies during the previous year from health care manufacturers or insurers.

©Institute for Clinical and Economic Review, 2021 Page iv HAE RWE Update - Report
Table of Contents
1. Background ........................................................................................................................................ 1
2. Methods ............................................................................................................................................. 3
2.1 Overview ...................................................................................................................................... 3
2.2 Real-World Data Analysis ............................................................................................................. 3
2.3 Cost-Effectiveness Analysis .......................................................................................................... 4
3. Results ................................................................................................................................................ 5
3.1 Observational RWE Findings ........................................................................................................ 5
3.2 Observational RWE Updated Cost-Effectiveness Findings .......................................................... 6
3.3 New Health Benefit Price Benchmarks Based on Observational RWE Update ........................... 8
4. Discussion ........................................................................................................................................... 9
References ........................................................................................................................................... 11
A. Literature Review Update: Supplemental Information ...................................................................A1
A1. Methods Overview ....................................................................................................................A1
A2. Results ........................................................................................................................................A1
B. Real-World Data Analysis: Supplemental Information .................................................................... B1
B1. Baseline Analysis ........................................................................................................................ B1
B2. Post-Prophylaxis Descriptive Analyses ...................................................................................... B5
B3. Exploratory Analysis of Takhzyro Dose Reduction..................................................................... B7
B4. Patient Weight ........................................................................................................................... B8
B5. Firazyr/Icatibant Mix .................................................................................................................. B9
C. Long-Term Cost-Effectiveness: Supplemental Information ............................................................. C1
C1. Methods Overview ..................................................................................................................... C1
C2. Model Inputs and Assumptions ................................................................................................. C4
C3. Preliminary Phase Update Results ........................................................................................... C13
C4. Sensitivity Analysis ................................................................................................................... C14
C5. Scenario Analyses .................................................................................................................... C26
C6. Threshold Analyses .................................................................................................................. C30
C7. Model Validation ...................................................................................................................... C31

©Institute for Clinical and Economic Review, 2021 Page v HAE RWE Update - Report
List of Acronyms and Abbreviations Used in this Report
ACE Angiotensin-converting enzyme AE Adverse event AEP Aetion Evidence Platform AHRQ Agency for Healthcare Research and Quality ARB Angiotensin II receptor blocker ASP Average sales price CDC Centers for Disease Control and Prevention DPP4 Dipeptidyl-peptidase 4 ED Emergency department evLYG Equal value of life years gained HAE Hereditary angioedema HRQoL Health-related quality of life ICER Institute for Clinical and Economic Review IQR Interquartile range IV Intravenous NEP Neutral endopeptidase inhibitor PCE Personal consumption expenditure PDC Proportion of days covered PRISMA Preferred reporting items for systematic reviews and meta-analyses QALY Quality-adjusted life year RCT Randomized controlled trial RWD Real-world data RWE Real-world evidence SAE Severe adverse event SD Standard deviation WAC Wholesale acquisition cost

©Institute for Clinical and Economic Review, 2021 Page 1 HAE RWE Update - Report Return to Table of Contents
1. Background
This section incorporates information and language from the 2018 ICER assessment of prophylactic
treatments for hereditary angioedema (HAE).
In 2018, The Institute for Clinical and Economic Review (ICER) conducted a review of lanadelumab
(Takhzyro®, Takeda Pharmaceutical Company, Ltd.) and two C1 inhibitors (Haegarda®, CSL Behring,
GmbH; and Cinryze®, Takeda Pharmaceutical Company, Ltd.) for long-term prophylaxis against
acute attacks in patients with hereditary angioedema (HAE). The primary objective of this analysis
is to update the prior estimation of the cost effectiveness of Takhzyro, Haegarda, and Cinryze using
recent observational real-world evidence (RWE). This work is a pilot project to explore how ICER
can update review topics using observational RWE, with an emphasis on therapies that have been
approved through accelerated approval pathways and are in use for over two years.
HAE is a rare genetic disorder that causes painful attacks of swelling in the face, hands, feet, and
stomach, as well as potentially life-threatening swelling of the throat. Most HAE is caused by a
deficiency (Type I HAE) or dysfunction (Type II HAE) of a protein called C1 inhibitor (C1 esterase
inhibitor, C1-INH). Attacks can last for up to five days, and can be spontaneous or triggered by
stress, medical procedures, and certain medications like oral contraceptives or ACE inhibitors.
Attacks can occur rarely or as often as once every few days. Because of their severity and
unpredictability, attacks can significantly reduce a patient’s functioning and ability to perform
activities of daily living.
The goal of HAE treatment is to reduce the duration, frequency, and severity of attacks. On-
demand treatments are used to reduce the duration and severity of a single attack. Long-term
prophylactic treatments, the focus of the 2018 report1 and this update, are taken regularly to
prevent attacks and reduce attack severity. ICER’s 2018 report found that long-term prophylaxis
with either of the C1 inhibitors or Takhzyro resulted in fewer acute attacks and improved quality of
life for people living with HAE, but 2018 pricing of all three treatments exceeded traditional cost-
effectiveness thresholds. The 2018 report identified uncertainties in the evidence and key model
assumptions that influenced the cost-effectiveness findings. One of the most consequential
uncertainties in the 2018 model was the frequency and severity of attacks at baseline among
patients who would be prescribed prophylactic treatment. As demonstrated in the 2018 report,
small differences in the assumed attack rate resulted in a wide range of cost-effectiveness results.
As a first step, the 2018 economic model was assessed for inputs influential to the results that could
be reliably and validly analyzed in an observational claims analysis. The observational RWE
contributions to cost-effectiveness updates were identified a priori in an observational claims
analysis protocol. The primary contribution from observational RWE centers on estimating the
baseline monthly attack rate and health care resource use (i.e., severity) of attacks in individuals

©Institute for Clinical and Economic Review, 2021 Page 2 HAE RWE Update - Report Return to Table of Contents
who initiated prophylactic therapy of Takhzyro, Haegarda, or Cinryze, that had a large impact on the
incremental cost-effectiveness ratio in the 2018 report. Additional inputs from the observational
claims analysis included other baseline patient characteristics (age, gender, weight), the percentage
of patients who reduced Takhzyro dosing (i.e., one dose every four weeks instead of every two
weeks), and other health care resource use and unit cost estimates.
The updated cost-effectiveness analysis continues to rely on the pivotal randomized controlled trial
(RCT) evidence to quantify the relative reductions in attacks attributed to prophylactic treatment
(i.e., treatment efficacy). Treatment effectiveness was not considered to be reliably assessed within
the available claims data due to small sample size, limited duration of follow-up, and lack of ability
to identify an appropriate comparator due to the potential for unmeasured confounding.
Therefore, real-world treatment effectiveness was explored as a descriptive pre-post analysis but
did not replace RCT treatment efficacy in the updated cost-effectiveness analysis.
This report was developed specifically to pilot-test the impact of leveraging observational RWE to
update ICER reviews of drugs initially approved through the accelerated approval pathway. This
report does not include an assessment of berotralstat, a recently approved prophylactic treatment
that was not included in the 2018 Report.
©Institute for Clinical and Economic Review, 2021 Page 3 HAE RWE Update - Report Return to Table of Contents
2. Methods
2.1 Overview
The primary aim of this analysis was to update our 2018 cost-effectiveness analysis of Haegarda,
Cinryze, and Takhzyro for long-term prophylaxis against acute attacks in patients with HAE. We
started with the existing 2018 report economic model, developed in Microsoft Excel, as described in
the Supplement. The update was then conducted in two phases. The first (preliminary phase),
focused on incorporating new model inputs based on an updated review of the RCT literature. The
preliminary phase literature update and supporting studies are detailed in Supplement Section A.
The subsequent observational RWE phase addresses the primary aim. In the observational RWE
phase, we used real-world data (RWD) analyses to provide new inputs for model assumptions
regarding baseline attack frequency and utilization costs related to severity of attack. In addition,
where necessary, all unit costs from the 2018 report and 2020 US Dollars from the de novo RWE
analysis were inflated to 2021 US dollars using the Personal Consumption Expenditure (PCE) price
index.2
This two-phase update approach was taken to help make transparent the separate incremental
effects of updating the model with new RCT evidence and with RWE. This report emphasizes the
observational RWE phase whereas the preliminary phase RCT literature update may be found in the
Supplement. Consistent with the 2018 Report, the primary measure of cost effectiveness was the
incremental cost per quality-adjusted life years (QALYs) gained. Equal value of life years gained
(evLYG) as a measure of health gain was introduced after the 2018 Report and therefore is not
featured within this update.
2.2 Real-World Data Analysis
Full descriptions of the RWE protocol, including details of the approach used to identify patients,
can be found in Supplemental Appendix B. We performed our RWE analyses using Optum’s de-
identified Clinformatics® Data Mart Database. This database is comprised of administrative health
claims for members of large commercial and Medicare Advantage health plans and includes
approximately 65 million lives. These data allowed for the identification of HAE patients and the
capture of key study elements including prescription claims, costs, emergency department (ED)
visits and other health care resource utilization from April 13, 2008 through March 31, 2020.
Optum’s standard costs are based on algorithms that reflect the intensity of care provided,
including quantity of services, relative resource costs, and the nature of utilization. Standard cost is
an estimate of the allowed amount (i.e., the total cost of service) and is validated by Optum against
the paid amount. Analyses of this database were performed within the Aetion Evidence Platform®
(AEP).

©Institute for Clinical and Economic Review, 2021 Page 4 HAE RWE Update - Report Return to Table of Contents
In order to explore uncertainties raised in the November 2018 report,1 the real-world data (RWD)
analysis had the following primary objective: to describe baseline demographic characteristics,
attack rates, and attack-related medical service utilization among patients initiating treatment with
Takhzyro, Haegarda, or Cinryze, identified via prescription claims. HAE attack rates were calculated
in total and by severity. Severe attacks were defined as an ED visit or hospitalization due to HAE
(please see protocol for algorithms and code lists). Non-severe attacks were defined as treatment
with on-demand therapy administered in an outpatient visit, home nurse visit, or self-administered
by the patient. Data on the duration of attacks by severity is limited, however attacks generally last
between two and five days.3 Thus, on-demand therapy administered by a health care professional
in an outpatient or home setting, during an ED visit, and during inpatient hospitalizations occurring
within five days of each other were considered part of a single attack episode. Secondary
objectives were to explore attack rates and utilization following long-term prophylaxis initiation
with Takhzyro, Haegarda, or Cinryze and to explore the percentage of Takhzyro initiators who
moved to less frequent dosing after six months attack free. All other cohort, exposure, and
outcome definitions, and statistical and sensitivity analysis were detailed in the pre-defined study
protocol.
The design, study execution, analysis, and reporting (across the report, supplement, and protocol)
of this RWE study met published good practices guidelines.4 In addition, we sought public comment
from stakeholders on the research protocol. Based on comments received from the manufacturers
and clinical experts, we included descriptive information on therapies that may be associated with
increased risk of HAE attacks and added suggested limitations and interpretations to the study.
2.3 Cost-Effectiveness Analysis
All updated model assumptions and inputs are listed in Supplement Section C2 and further detailed
in the model analysis plan. The key assumption related to incorporation of new RWE was that
attacks were counted through claims for attack-related prescriptions and/or ED visits or
hospitalizations coded as due to HAE. Thus, all attacks were assumed to be treated. Patients might
have experienced some form of episode but if they did not seek and receive medical care it would
not have been counted in our RWE analysis.
In the observational RWE phase, the preliminary phase model was updated to include data from the
de novo RWE claims analysis. Supplement Section C2 presents a comparison of model inputs that
were updated for this effort versus the inputs used in the 2018 assessment. A complete listing of all
original model inputs can be found in the 2018 Final Report.1 We performed both one-way and
probabilistic sensitivity analyses according to standard methodologies in the field.

©Institute for Clinical and Economic Review, 2021 Page 5 HAE RWE Update - Report Return to Table of Contents
3. Results
3.1 Observational RWE Findings
As shown in Supplement Table B1, during the 12-year timespan covered by the RWE analysis, 158
patients initiated prophylactic treatment with Cinryze (49.4%), Haegarda (24.0%), or Takhzyro
(26.6%).
In the six months prior to initiation of prophylaxis therapy, 136 of these 158 patients (86%) had
evidence of at least one attack episode (note: attacks occurring within five days of each other were
considered part of a single attack episode). Out of 1,783 total attack episodes observed for all
patients in the six months prior to initiation of prophylaxis therapy, 5.7% were severe, and 94.3%
were non-severe (Table 3.1).
On average, the 158 patients had 1.88 HAE attacks per month prior to initiation of prophylaxis
therapy.
Table 3.1. Baseline HAE Attack Rates over Six Months
Attacks N (%)
Mean Attack Rate (per Patient per Month)
Severe HAE attack episodes 102 (5.7%) 0.11
Non-severe HAE attack episodes 1,681 (94.3%) 1.77
Total attacks (severe and non-severe) 1,783 (100%) 1.88
Supplement Section C4 provides details on the results of sensitivity analyses of attack rates and
other utilization, cost, and exploratory analyses. Sensitivity analyses were conducted varying the
definition of HAE attacks. Data on the precise timing of self-administered treatment is not
available. Rather, the number of treatments administered was estimated from pharmacy
dispensing data, including date and quantity dispensed, and dosing guidelines. In estimating the
number of self-treated attacks, we assumed, based on clinical guidelines, that patients would have
on-demand treatment on hand to treat up to two attacks. These two on-hand doses were
subtracted out in the calculation of self-administered doses in the primary analysis. In sensitivity
analysis, each prescription dose was counted as an attack. This increased the non-severe attacks to
1,871 and total attacks to 1,973 and resulted in 2.08 attacks per patient per month.
In the primary analysis we treated attack-related visits within five days of each other to be part of
the same attack. In sensitivity analyses, we reduced the assumed attack duration to two days and
then to one day, treating events on distinct days as separate attacks in the one-day duration
analysis. Estimated attack rates increased to 1.90 and 1.96 in these analyses, respectively.
©Institute for Clinical and Economic Review, 2021 Page 6 HAE RWE Update - Report Return to Table of Contents
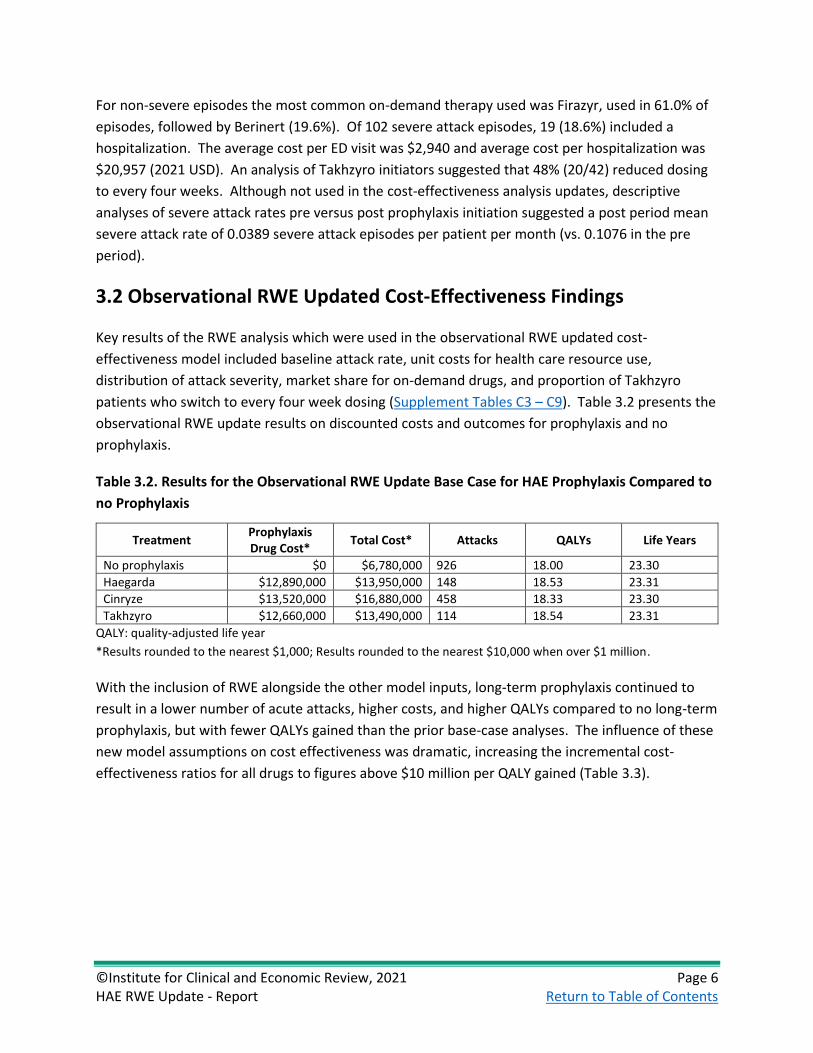
For non-severe episodes the most common on-demand therapy used was Firazyr, used in 61.0% of
episodes, followed by Berinert (19.6%). Of 102 severe attack episodes, 19 (18.6%) included a
hospitalization. The average cost per ED visit was $2,940 and average cost per hospitalization was
$20,957 (2021 USD). An analysis of Takhzyro initiators suggested that 48% (20/42) reduced dosing
to every four weeks. Although not used in the cost-effectiveness analysis updates, descriptive
analyses of severe attack rates pre versus post prophylaxis initiation suggested a post period mean
severe attack rate of 0.0389 severe attack episodes per patient per month (vs. 0.1076 in the pre
period).
3.2 Observational RWE Updated Cost-Effectiveness Findings
Key results of the RWE analysis which were used in the observational RWE updated cost-
effectiveness model included baseline attack rate, unit costs for health care resource use,
distribution of attack severity, market share for on-demand drugs, and proportion of Takhzyro
patients who switch to every four week dosing (Supplement Tables C3 – C9). Table 3.2 presents the
observational RWE update results on discounted costs and outcomes for prophylaxis and no
prophylaxis.
Table 3.2. Results for the Observational RWE Update Base Case for HAE Prophylaxis Compared to
no Prophylaxis
Treatment Prophylaxis Drug Cost*
Total Cost* Attacks QALYs Life Years
No prophylaxis $0 $6,780,000 926 18.00 23.30
Haegarda $12,890,000 $13,950,000 148 18.53 23.31
Cinryze $13,520,000 $16,880,000 458 18.33 23.30
Takhzyro $12,660,000 $13,490,000 114 18.54 23.31
QALY: quality-adjusted life year
*Results rounded to the nearest $1,000; Results rounded to the nearest $10,000 when over $1 million.
With the inclusion of RWE alongside the other model inputs, long-term prophylaxis continued to
result in a lower number of acute attacks, higher costs, and higher QALYs compared to no long-term
prophylaxis, but with fewer QALYs gained than the prior base-case analyses. The influence of these
new model assumptions on cost effectiveness was dramatic, increasing the incremental cost-
effectiveness ratios for all drugs to figures above $10 million per QALY gained (Table 3.3).

©Institute for Clinical and Economic Review, 2021 Page 7 HAE RWE Update - Report Return to Table of Contents
Table 3.3. Comparison of 2018 and Observational RWE Update Base-Case Results for HAE
Prophylaxis versus no Prophylaxis
Treatment 2018 Report
Cost per QALY gained Observational RWE Update
Cost per QALY gained
Cinryze $5,950,000 $30,070,000
Haegarda $328,000 $13,430,000
Takhzyro $1,110,000 $12,370,000
QALY: quality-adjusted life year
*Results rounded to the nearest $1,000; Results rounded to the nearest $10,000 when over $1 million. Note: Due
to ratio properties of incremental cost-effectiveness ratios, results can become extreme with small denominators.
Sensitivity analysis, scenario analysis, and threshold analysis for the Observational RWE Phase
updates are presented in Supplement Section C4.
The incremental contribution of key inputs to the difference in the cost-effectiveness ratios
between the original 2018 report, the preliminary phase update, and the observational RWE phase
update is presented in Table 3.4 below. The first row presents the incremental cost per QALY of
prophylaxis compared with no prophylaxis from the 2018 evaluation. The second row presents the
results of the preliminary phase updates (Supplement Tables C10 and C11). Each subsequent row
builds upon the previous with the addition of another group of RWE inputs. More detailed tables
by drug are provided in Supplement Tables C26, C27, and C28.
Table 3.4. Impact of RWE Update on Incremental Cost per QALY
Incremental Cost per QALY
Haegarda Cinryze Takhzyro
2018 evaluation base-case results $328,000 $5,954,000 $1,108,000
Preliminary phase literature update results
$461,000 $7,060,000 $1,280,000
Observational RWE Update Steps Haegarda Cinryze Takhzyro
1. Proportion on Takhzyro that switch to every 4-week dosing
N/A N/A $199,000
2. Baseline attack rate $10,390,000 $24,280,000 $10,010,000
3. Population and clinical parameters* $13,790,000 $30,360,000 $12,730,000
4. Cost parameters† $13,430,000 $30,070,000 $12,370,000
Final RWE Update Results $13,430,000 $30,070,000 $12,370,000
QALY: quality-adjusted life year, RWE: real-world evidence
* Population parameters, pretreatment attack severity, treatment pathway (proportion of mild and moderate
attacks treated with home self-administration, home nurse, or outpatient; proportion of severe attacks which
result in hospitalization, hospitalization resource utilization mortality)
† Direct cost of emergency department visits and hospitalization, cost of administration, market shares of on
demand drugs

©Institute for Clinical and Economic Review, 2021 Page 8 HAE RWE Update - Report Return to Table of Contents
3.3 New Health Benefit Price Benchmarks Based on Observational
RWE Update
As shown in Table 3.5 below, based on the Observational RWE Phase updates, all the HAE
prophylaxis agents would need to be priced significantly lower than the current list prices to reach
health-benefit price benchmarks (HBPBs). Discounts needed to reach cost-effectiveness thresholds
are more substantial than those suggested in the original 2018 report.
Table 3.5. Observational RWE Update HBPBs for HAE Prophylactic Therapies
Annual
WAC
Price to Achieve
$100,000 per QALY
Price to Achieve
$150,000 per QALY
Discount from List Price to Reach
Threshold Prices
Discounts from List Price to Reach 2018
Report Threshold Prices
Haegarda $536,694 $247,669 $248,779 53.6% to 53.9% 27.7% to 28.2%
Cinryze $548,563 $139,742 $140,550 74.5% to 75.4% 59.7% to 60.0%
Takhzyro $461,611* $218,858* $219,844* 52.4% to 52.6% 33.7% to 34.2%
QALY: quality-adjusted life year
*Considers proportion with dose reduction

©Institute for Clinical and Economic Review, 2021 Page 9 HAE RWE Update - Report Return to Table of Contents
4. Discussion
The goal of this update to the 2018 ICER report on prophylactic treatments for HAE was to evaluate
the impact of integrating new inputs based on observational RWE. We were aware from our 2018
model and corresponding sensitivity analyses that cost effectiveness of prophylaxis was sensitive to
the baseline rate of HAE attacks. This sensitivity is because the cost of rescue treatment is high and
because attacks are common so that even a small change in baseline rates, higher or lower, could
determine whether prophylaxis was highly cost-effective or highly overpriced for the absolute
benefit to patients. This analysis aimed to address these key assumptions in the model and update
them, given that these treatments have all been available on the market for two years since the
original report was issued.
In the observational RWE update, the most influential new finding was a reduction in the assumed
baseline rate of HAE attacks from 3.39 per month in the 2018 report, which was based on data from
the pivotal trials of these agents, to 1.88 per month in the RWE cohort of 158 patients newly
initiating Takhzyro, Haegarda, or Cinryze. RWE findings for population parameters (e.g., age and
weight), and pre-treatment attack severity further increased the incremental cost per QALY
whereas RWE findings for health care utilization by attack severity, costs associated with attacks,
and the market share distribution of on-demand drugs reduced the incremental cost per QALY.
We note several limitations to the observational RWE analysis. This analysis uses one primary
evidence source, insurance claims. Other potential sources, such as patient registries that include
patient reported outcomes, could provide updates to other domains (e.g., quality of life) of
comparative effectiveness and cost effectiveness. The claims-based analysis was not able to
differentiate between HAE patient sub-types which might have different underlying risks of attacks.
However, clinical expert input indicated that practice is not generally targeted based on patient
subtypes, thus we believe the inability to differentiate by subtype in the claims analysis does not
substantially impact the findings.
Importantly, there are currently no published consensus algorithms for measuring HAE attack rates
in claims data. We sought information from a clinical expert, treatment guidelines, and published
literature to create operational definitions for severe and non-severe HAE attacks, but alternative
definitions may be suggested that would change the number of baseline attacks counted in this
dataset. While we are confident that claims data can validly capture severe attacks treated via ED
and inpatient hospitalizations, using prescription claims for measuring non-severe attacks could
either under- or overestimate attack rates. For example, 22 patients did not have any evidence of
attacks in the six months prior to initiating prophylactic treatment. In a sample of coverage policies
for health plans included in the Optum data, the plans require that at least one attack is
documented every four weeks in order to qualify for prophylactic therapy (Takhzyro), or that
prescriber attests that patient experiences attacks and would benefit from prophylactic therapy

©Institute for Clinical and Economic Review, 2021 Page 10 HAE RWE Update - Report Return to Table of Contents
(Cinryze and Haegarda).5-7 These discrepancies suggest that our definition of non-severe attack may
not be sensitive enough to capture all attacks and that attacks may be underestimated. However,
using dispenses of on-demand therapies may overestimate non-severe attack counts. The relatively
short shelf life of on-demand treatments may cause patients to refill without using previously filled
prescriptions. Ultimately, even when we evaluated results using more relaxed definitions for non-
severe attacks, the attack rates observed in the real-world data were far lower than those
documented for patients participating in the pivotal RCTs for these three treatments.
As with the 2018 analysis, our estimates of long-term comparative clinical effectiveness of
prophylaxis remain uncertain due to a lack of data on the natural history of attack rates over
patients’ lifetimes and by the sample sizes and the short duration of the available clinical trials and
claims data. We also note continued uncertainty in the proportion of patients who require re-
dosing of acute treatment for HAE attacks, with wide ranges reported in published literature. Due
to limitations of claims data to capture self-administered treatment, we were unable to update
these model inputs in the observational RWE phase updates. Higher rates of re-dosing than
assumed in this analysis may lead to more favorable cost-effectiveness findings for prophylaxis than
in our updated base-case analysis.
Cost-effectiveness analyses should be considered alongside other potential benefits and contextual
considerations, described in the 2018 report, for the purposes of judging a treatment’s overall
value. Further, patient heterogeneity and individual management goals should be considered
alongside population estimates of cost effectiveness.
This pilot, a collaboration between researchers at ICER, Aetion, and the University of Washington,
demonstrates the feasibility of using observational RWE to address uncertainties in aspects of cost-
effectiveness findings and corresponding health-benefit price benchmarks. In this case, the
observational RWE findings suggest that patients initiating prophylactic treatment do not have as
many attacks as was previously assumed from clinical trial data. The addition of observational RWE
confirms the conclusions of the 2018 HAE review that at current drug prices, prophylactic treatment
for HAE does not meet traditional cost-effectiveness thresholds. HAE prophylactic agents are
effective, but real-world experience suggests that patients being treated are less severely affected
by HAE than those in clinical trials, and thus prophylaxis with these treatments is far less cost-
effective in a real-world patient population than was suggested in our first report.

©Institute for Clinical and Economic Review, 2021 Page 11 HAE RWE Update - Report Return to Table of Contents
References
1. Lin GA, Carlson J, Agboola F, et al. Prophylaxis for Hereditary Angioedema with Lanadelumab and C1 Inhibitors: Effectiveness and Value; Final Evidence Report. Institute for Clinical and Economic Review. https://icer.org/wp-content/uploads/2020/10/ICER_HAE_Final_Evidence_Report_111518-1.pdf. Published 2018. Accessed July 23, 2021.
2. Bureau of Economic Analysis. Table 2.3.6U. Real Personal Consumption Expenditures by Major Type of Product and by Major Function. https://apps.bea.gov/iTable/iTable.cfm?reqid=19&step=2#reqid=19&step=2&isuri=1&1921=survey. Published 2021. Accessed February 18, 2021.
3. Cicardi M, Zuraw B. Hereditary angioedema: Treatment of acute attacks. UpToDate. 2018. https://www.uptodate.com/contents/hereditary-angioedema-treatment-of-acute-attacks. Accessed June 28 2018.
4. Dreyer NA, Velentgas P, Westrich K, Dubois R. The GRACE checklist for rating the quality of observational studies of comparative effectiveness: a tale of hope and caution. J Manag Care Spec Pharm. 2014;20(3):301-308.
5. UnitedHealthcare. Cinryze® (C1 esterase inhibitor, human) - Prior Authorization/Notification - UnitedHealthcare Commercial Plans. https://www.uhcprovider.com/content/dam/provider/docs/public/prior-auth/drugs-pharmacy/commercial/a-g/COMM-Notification-Cinryze.pdf. Published 2020. Updated September 1, 2020. Accessed March 5, 2021.
6. UnitedHealthcare. Takhzyro™ (lanadelumab-flyo) - Prior Authorization/Medical Necessity - UnitedHealthcare Commercial Plans. Published 2020. Updated September 1, 2020. Accessed March 5, 2021.
7. UnitedHealthcare. Haegarda - Prior Authorization/Medical Necessity - UnitedHealthcare Commercial Plans. https://www.uhcprovider.com/content/dam/provider/docs/public/prior-auth/drugs-pharmacy/commercial/h-p/COMM-PA-Med-Nec-Haegarda.pdf. Published 2020. Updated September 1, 2020. Accessed March 5, 2021.
8. Cook DJ, Mulrow CD, Haynes RB. Systematic reviews: synthesis of best evidence for clinical decisions. Annals of internal medicine. 1997;126(5):376-380.
9. Higgins JP GS. Cochrane Collaboration Handbook for Systematic Reviews of Interventions. Version 5.1.0 [updated March 2011]. The Cochrane Collaboration and John Wiley & Sons Ltd2008.
10. Moher D, Liberati A, Tetzlaff J, Altman DG. Preferred reporting items for systematic reviews and meta-analyses: the PRISMA statement. International journal of surgery (London, England). 2010;8(5):336-341.
11. Zuraw BL, Busse PJ, White M, et al. Nanofiltered C1 inhibitor concentrate for treatment of hereditary angioedema. N Engl J Med. 2010;363(6):513-522.
12. Longhurst H, Cicardi M, Craig T, et al. Prevention of Hereditary Angioedema Attacks with a Subcutaneous C1 Inhibitor. Paper presented at: New England journal of medicine2017.
13. Craig T, Zuraw B, Longhurst H, et al. Long-Term Outcomes with Subcutaneous C1-Inhibitor Replacement Therapy for Prevention of Hereditary Angioedema Attacks. J Allergy Clin Immunol Pract. 2019;7(6):1793-1802.e1792.

©Institute for Clinical and Economic Review, 2021 Page 12 HAE RWE Update - Report Return to Table of Contents
14. Li HH, Zuraw B, Longhurst HJ, et al. Subcutaneous C1 inhibitor for prevention of attacks of hereditary angioedema: additional outcomes and subgroup analysis of a placebo-controlled randomized study. Allergy Asthma Clin Immunol. 2019;15:49.
15. Lumry WR, Craig T, Zuraw B, et al. Health-Related Quality of Life with Subcutaneous C1-Inhibitor for Prevention of Attacks of Hereditary Angioedema. J Allergy Clin Immunol Pract. 2018;6(5):1733-1741.e1733.
16. Lumry WR, Martinez-Saguer I, Yang WH, et al. Fixed-Dose Subcutaneous C1-Inhibitor Liquid for Prophylactic Treatment of C1-INH-HAE: SAHARA Randomized Study. J Allergy Clin Immunol Pract. 2019;7(5):1610-1618.e1614.
17. Lumry WR, Zuraw B, Cicardi M, et al. Long-term health-related quality of life in patients treated with subcutaneous C1-inhibitor replacement therapy for the prevention of hereditary angioedema attacks: findings from the COMPACT open-label extension study. Orphanet J Rare Dis. 2021;16(1):86.
18. Food and Drug Administration. HAEGARDA® (C1 Esterase Inhibitor Subcutaneous [Human]) Package Insert. 2020.
19. Banerji A, Riedl MA, Bernstein JA, et al. Effect of Lanadelumab Compared With Placebo on Prevention of Hereditary Angioedema Attacks: A Randomized Clinical Trial. Jama. 2018;320(20):2108-2121.
20. Lumry WR, Weller K, Magerl M, et al. Impact of lanadelumab on health-related quality of life in patients with hereditary angioedema in the HELP study. Allergy. 2021;76(4):1188-1198.
21. Riedl MA, Maurer M, Bernstein JA, et al. Lanadelumab demonstrates rapid and sustained prevention of hereditary angioedema attacks. Allergy. 2020;75(11):2879-2887.
22. Riedl MA, Banerji A, Manning ME, et al. Treatment patterns and healthcare resource utilization among patients with hereditary angioedema in the United States. Orphanet J Rare Dis. 2018;13(1):180.
23. Banerji A, Riedl M. Managing the female patient with hereditary angioedema. Womens Health (Lond). 2016;12(3):351-361.
24. Thalanayar PM, Ghobrial I, Lubin F, Karnik R, Bhasin R. Drug-induced visceral angioedema. J Community Hosp Intern Med Perspect. 2014;4(4).
25. Sanders GD, Neumann PJ, Basu A, et al. Recommendations for Conduct, Methodological Practices, and Reporting of Cost-effectiveness Analyses: Second Panel on Cost-Effectiveness in Health and Medicine. Jama. 2016;316(10):1093-1103.
26. Riedl MA, Grivcheva-Panovska V, Moldovan D, et al. Recombinant human C1 esterase inhibitor for prophylaxis of hereditary angio-oedema: a phase 2, multicentre, randomised, double-blind, placebo-controlled crossover trial. The Lancet. 2017;390(10102):1595-1602.
27. Riedl MA, Banerji A, Gower R. Current medical management of hereditary angioedema: Follow-up survey of US physicians. Ann Allergy Asthma Immunol. 2021;126(3):264-272.
28. Banerji A, Busse P, Shennak M, et al. Inhibiting Plasma Kallikrein for Hereditary Angioedema Prophylaxis. N Engl J Med. 2017;376(8):717-728.
29. Fryar CD, Gu Q, Ogden CL, Flegal KM. Anthropometric Reference Data for Children and Adults: United States, 2011-2014. Vital Health Stat 3. 2016(39):1-46.
30. Banerji A RM, Bernstein J, et al. Lanadelumab for prevention of attacks in hereditary angioedema: Results from the phase 3 help study. Annals of Allergy, Asthma and Immunology. 2017;119(5):S5.
31. Banerji A, Riedl MA, Bernstein JA, et al. Effect of Lanadelumab Compared With Placebo on Prevention of Hereditary Angioedema Attacks: A Randomized Clinical Trial. JAMA. 2018;320(20):2108-2121.
©Institute for Clinical and Economic Review, 2021 Page 13 HAE RWE Update - Report Return to Table of Contents
32. Riedl MA, Bygum A, Lumry W, et al. Safety and Usage of C1-Inhibitor in Hereditary Angioedema: Berinert Registry Data. J Allergy Clin Immunol Pract. 2016;4(5):963-971.
33. Riedl MA, Banerji A, Gower R. Current medical management of hereditary angioedema: follow-up survey of US physicians. J Allergy Clin Immunol Pract. 2015;3(2):220-227.
34. Zilberberg MD, Nathanson BH, Jacobsen T, Tillotson G. Descriptive epidemiology of hereditary angioedema emergency department visits in the United States, 2006-2007. Allergy Asthma Proc. 2011;32(5):390-394.
35. Bork K, Hardt J, Witzke G. Fatal laryngeal attacks and mortality in hereditary angioedema due to C1-INH deficiency. J Allergy Clin Immunol. 2012;130(3):692-697.
36. Graham C, Supina D, Knox H, Krishnarajah S. Cost Savings Associated With Subcutaneous C1-Inhibitor (Human) Long-Term Prophylaxis for Hereditary Angioedema. Academy of Managed Care Pharmacy, Dallas, TX, US, October 16-19, 2017. 2017.
37. Zilberberg MD, Nathanson BH, Jacobsen T, Tillotson G. Descriptive epidemiology of hereditary angioedema hospitalizations in the United States, 2004-2007. Allergy Asthma Proc. 2011;32(3):248-254.
38. Wilson DA, Bork K, Shea EP, Rentz AM, Blaustein MB, Pullman WE. Economic costs associated with acute attacks and long-term management of hereditary angioedema. Ann Allergy Asthma Immunol. 2010;104(4):314-320.
©Institute for Clinical and Economic Review, 2021 Page 14 HAE RWE Update - Report Return to Table of Contents
Supplemental Materials

©Institute for Clinical and Economic Review, 2021 Page A1 HAE RWE Update - Report Return to Table of Contents
A. Literature Review Update: Supplemental
Information
A1. Methods Overview
Procedures for the updated systematic literature review assessing the evidence on Takhzyro,
Haegarda, and Cinryze followed the Preferred Reporting Items for Systematic Reviews and Meta-
Analyses (PRISMA) guidelines and other established best practice guidelines.8-10 The search strategy
from the 2018 review of HAE was re-run in MEDLINE and EMBASE to identify any references
published in the time after the final posting of the prior report. The detailed research protocol and
search strategy of the prior report can be found here.
After the literature search, study selection was accomplished through two levels of screening, at the
abstract and full-text level. Two reviewers independently screened the titles and abstracts of all
publications identified using DistillerSR (Evidence Partners, Ottawa, Canada); a third reviewer
worked with the initial two reviewers to resolve any issues of disagreement through consensus.
Reviewers screened references in accordance with pre-specified research questions. The findings
were first categorized into randomized controlled trial literature versus real-world evidence to
support corresponding updates to the preliminary phase and RWE phase of this research. The
preliminary phase literature updates focused on randomized controlled trials that support/enhance
efficacy outcomes (e.g., data on reductions in attack rates) and other clinical model inputs (Table
2.1). Literature from non-randomized sources that include measures consistent with cost-
effectiveness model inputs were categorized as supporting the RWE update phase, alongside the
corresponding observational claims analyses.
A2. Results
Study Selection
Our literature search identified 563 potentially relevant references (see Supplement Figure A1), of
which 17 references related to three drugs met our inclusion criteria. Primary reasons for study
exclusion included outcomes out of scope of pre-specified research questions, duplicate/previously
known information, and interventions not of interest. At the time of the 2018 report, full text RCTs
were available for Cinryze (Zuraw 201011) and Haegarda (Longhurst 201712). The HELP trial for
Takhzyro was available in abstract form. The nine included publications are categorized in Table A1
and described in further detail below. The remaining eight abstracts were evaluated and
determined to not influence the cost-effectiveness analyses summarized in Chapter 4.

©Institute for Clinical and Economic Review, 2021 Page A2 HAE RWE Update - Report Return to Table of Contents
Table A1. New Literature to Inform Updates Across Phases
Full Text RCTs Available at the
Time of 2018 Report
Preliminary Phase Randomized Controlled Trial Literature to
Support / Enhance:
Observational RWE Phase RWE Literature to Support
/ Enhance:
Efficacy Other Inputs Model Inputs
Takhzyro 0 (HELP trial abstract)
1 (Banerji 2018) 2 (Lumry 2021, Riedl 2020)
0
Cinryze 1 (Zuraw 2010) 0 0 0
Haegarda 1 (COMPACT – Longhurst 2017)
1 (Lumry 2019 – out of scope)
4 (Craig 2019, Li 2019, Lumry 2018, Lumry 2021)
1 (Riedl 2018)
Cinryze
No references relating to either efficacy / other model inputs (first phase) or supporting RWE
literature (observational RWE phase) were identified in the updated literature search.
Haegarda
Five references were identified relating to either the previously published Phase III COMPACT trial
or a new Phase III RCT (SAHARA) focused on a fixed-dose subcutaneous Haegarda treatment.13-17
Craig 201913 is the open-label extension of the COMPACT RCT, and Li 201914 is a pre-specified
exploratory subgroup analysis of patients in the COMPACT study. Both references do not add any
new evidence to inform subsequent phases of this report but support current model assumptions.
Two references (Lumry 201815 and Lumry 202117) reported on long-term health-related quality of
life (HRQoL) in patients enrolled in the main COMPACT trial and the COMPACT open-label extension
trial. The SAHARA randomized study (Lumry 201916) was identified as a new RCT that compares a
fixed-dose of subcutaneous plasma-derived C1-INH versus placebo. We view the fixed-dose efficacy
evidence as outside the scope of this review given the weight-based dosing schedule per the Food
and Drug Administration label.18
Takhzyro
Three references relating to one Phase III RCT were identified.19-21 Banerji 201819 was identified as
the main publication of the Phase III HELP study, which informed updates to baseline characteristics
and efficacy rates of Takhzyro in the model. Lumry 202120 is a health-related quality of life (HRQoL)
analysis of the HELP study that reports endpoints such as EQ-5D-5L score. Riedl 202021 was
identified as an exploratory analysis with a focus on time to onset of effect and long-term efficacy
of Takhzyro. Results from this study support current model assumptions.

©Institute for Clinical and Economic Review, 2021 Page A3 HAE RWE Update - Report Return to Table of Contents
Literature to Support RWE Phase
One reference was identified as literature to support the RWE phase of this report, specifically in
the phase of protocol development. Riedl 201822 is a retrospective study looking at treatment
patterns and health care resource utilization in the HAE patient population in the US.
Figure A1. PRISMA flow Chart Showing Results of Literature Search for Hereditary Angioedema
9 references identified
through other sources
563 references after
duplicate removal
93 references assessed for
eligibility in full text
534 references identified
through literature search
470 citations excluded 563 references screened
76 citations excluded
47 - Outcomes out of scope
22 – Duplicate Information
5 – Intervention
2 - Population
17 total references
9 Full Text Publications
(2 RCTs)
8 Abstracts

©Institute for Clinical and Economic Review, 2021 Page A4 HAE RWE Update - Report Return to Table of Contents
Table A2. Evidence Table for Included References (N=9)
Drug Trial Main Outcomes
To Support: Efficacy
Takhzyro
Effect of Lanadelumab Compared With Placebo on Prevention of Hereditary Angioedema Attacks: A Randomized Clinical Trial. [HELP Study] Banerji, A. JAMA. 2018.19
Main Outcomes: Mean rate ratio relative to placebo (95%CI):
• 0.24 (0.15, 0.39) in 150-mg every-4-week arm
• 0.27 (0.18 to 0.41) in 300-mg every-4-week arm
• 0.13 (0.07 to 0.24) in 300-mg every-2-week arm
• adjusted P < 0.001 for all comparisons.
Haegarda
Fixed-Dose Subcutaneous C1-Inhibitor Liquid for Prophylactic Treatment of C1-INH-HAE: SAHARA Randomized Study. Lumry, W. The Journal of Allergy & Clinical Immunology in Practice. 2019.16
Main Outcomes:
• From Day 1, LS means of NNA reduced from 3.9 with placebo to 1.6 with pdC1-INH (P <
0.0001).
• From Day 1, median 79.5% reduction in HAE attacks v. placebo (mean [SD] 59.52% [69.06])
• From Day 15, mean 84.6% reduction in HAE attacks v. placebo (mean [SD] 63.48% [58.45]).
• Most patients had >50% NNA reduction with pdC1-INH (from day 1, 78%).
• Of patients with data in both treatment periods, 77.6% and 76.6% receiving pdC1-INH liquid from days 1 and 15, respectively, were clinical responders (P < 0.0001).
Provides evidence on severity % post Haegarda
• 8.8% of placebo-treated patients were attack-free
• 5.3%, 22.8%, and 63.2% of placebo-treated patients had mild, moderate, and severe attacks
• 37.5% of pdC1-INH treated patients were attack free
• 8.9%, 26.8%, and 26.8% of pdC1-INH treated patients had mild, moderate, and severe attacks, respectively.
To Support: Economic Inputs and Assumptions
Takhzyro
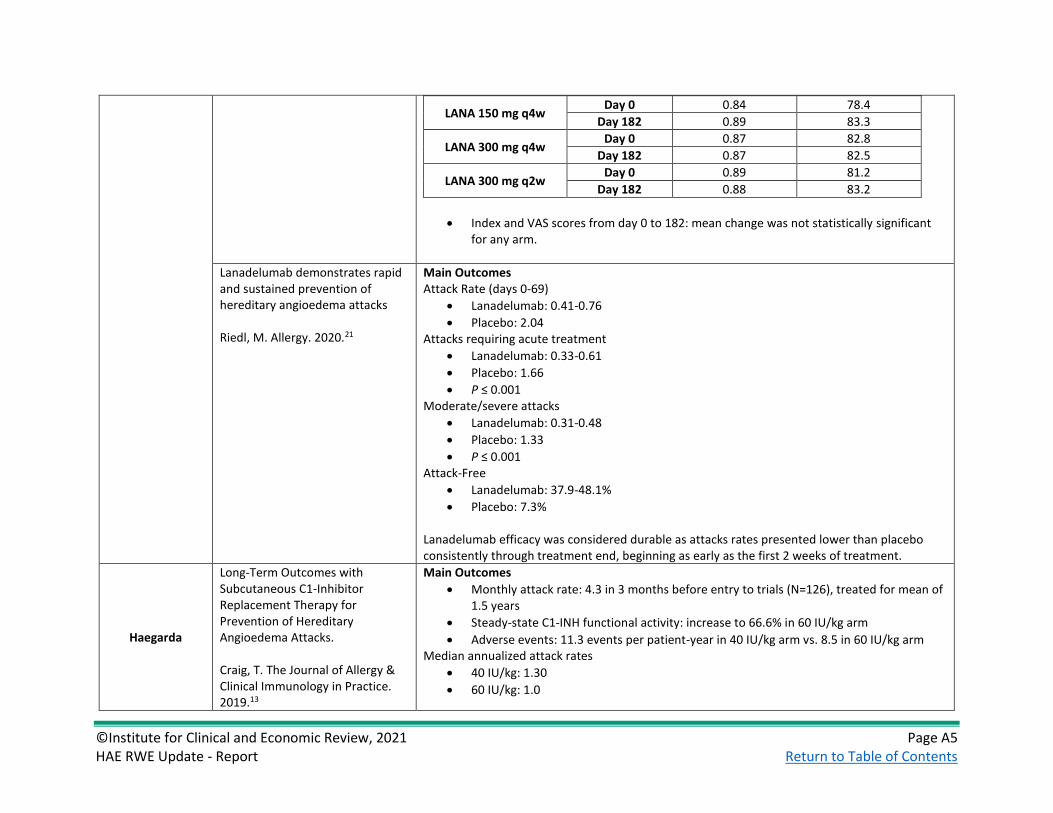
Impact of lanadelumab on health-related quality of life in patients with hereditary angioedema in the HELP Study Lumry, W. Allergy. 2021.20
Main Outcomes:
• Day 0: Mean EQ-5D-5L scores were high in all groups – no significant changes observed at day 182
Arm Timeframe Mean Index Scores Mean VAS Scores
Placebo Day 0 0.89 81.9
Day 182 0.88 84.2
©Institute for Clinical and Economic Review, 2021 Page A5 HAE RWE Update - Report Return to Table of Contents
LANA 150 mg q4w Day 0 0.84 78.4
Day 182 0.89 83.3
LANA 300 mg q4w Day 0 0.87 82.8
Day 182 0.87 82.5
LANA 300 mg q2w Day 0 0.89 81.2
Day 182 0.88 83.2
• Index and VAS scores from day 0 to 182: mean change was not statistically significant for any arm.
Lanadelumab demonstrates rapid and sustained prevention of hereditary angioedema attacks Riedl, M. Allergy. 2020.21
Main Outcomes Attack Rate (days 0-69)
• Lanadelumab: 0.41-0.76
• Placebo: 2.04 Attacks requiring acute treatment
• Lanadelumab: 0.33-0.61
• Placebo: 1.66
• P ≤ 0.001 Moderate/severe attacks
• Lanadelumab: 0.31-0.48
• Placebo: 1.33
• P ≤ 0.001 Attack-Free
• Lanadelumab: 37.9-48.1%
• Placebo: 7.3% Lanadelumab efficacy was considered durable as attacks rates presented lower than placebo consistently through treatment end, beginning as early as the first 2 weeks of treatment.
Haegarda
Long-Term Outcomes with Subcutaneous C1-Inhibitor Replacement Therapy for Prevention of Hereditary Angioedema Attacks. Craig, T. The Journal of Allergy & Clinical Immunology in Practice. 2019.13
Main Outcomes
• Monthly attack rate: 4.3 in 3 months before entry to trials (N=126), treated for mean of 1.5 years
• Steady-state C1-INH functional activity: increase to 66.6% in 60 IU/kg arm
• Adverse events: 11.3 events per patient-year in 40 IU/kg arm vs. 8.5 in 60 IU/kg arm Median annualized attack rates
• 40 IU/kg: 1.30
• 60 IU/kg: 1.0

©Institute for Clinical and Economic Review, 2021 Page A6 HAE RWE Update - Report Return to Table of Contents
Median Rescue Medication Use
• 49 IU/kg: 0.2 times per year
• 60 IU/kg: 0.0 times per year 23 patients received 60 IU/kg for over 2 years. Nineteen of these patients were attack-free during months 25 to 30 of treatment.
Subcutaneous C1 inhibitor for prevention of attacks of hereditary angioedema: Additional outcomes and subgroup analysis of a placebo-controlled randomized study. Li, H. Allergy, Asthma, and Clinical Immunology. 2019.14
Main Outcomes Attacks of any severity
• 60 UI/kg: 10.43 (23.0%)
• Placebo: 34/42 (81%) Need for Rescue Medicine
• 60 UI/kg: 35 treated attacks
• Placebo: 358 treated attacks Conclusion: Consistent treatment effect was observed with C1-INH (SC) 60 UI/kg dosing in all subgroups of patients with type I/II HAE across different measures.
Health-Related Quality of Life with Subcutaneous C1-Inhibitor for Prevention of Attacks of Hereditary Angioedema. Lumry, W. Journal of Allergy and Clinical Immunology. 2018.15
[Week 32] Reports Mean difference of HRQoL scores (EQ-5D, HADS, WPAI, TSQM) between both doses of Haegarda and placebo treatments (Lumry 2021 has more updated estimates)
Long-term health-related quality of life in patients treated with subcutaneous C1-inhibitor replacement therapy for the prevention of hereditary angioedema attacks: findings from the COMPACT open-label extension study Lumry, W. Orphanet Journal of Rare Diseases. 2021.17
Main Outcomes [Week 88] EQ-5D, mean change from baseline (SD)
• Health state value: 0.05 (0.153)
• VAS: 5.83 (14.601) WPAI, mean change from baseline (SD)
• Absenteeism: -4.89 (23.296)
• Presenteeism: -14.31 (31.765)
• Work Productivity: -15.97 (34.946)
• Activity Impairment: -14.35 (32.013) C1-INH(SC) 60 IU/kg arm: significant improvements from baseline for 3 domains
• presenteeism (mean change [95% CI], − 23.33%[ − 34.86, − 11.81]),
• work productivity loss (− 26.68% [− 39.92, − 13.44]),
• activity impairment (− 16.14% [− 26.36, − 5.91])

©Institute for Clinical and Economic Review, 2021 Page A7 HAE RWE Update - Report Return to Table of Contents
C1-INH(SC) 40 IU/kg group: significant improvement from baseline in only activity impairment: mean change [95% CI], − 12.71 [− 21.63, − 3.79]
To Support: RWE Phase
Haegarda
Treatment patterns and healthcare resource utilization among patients with hereditary angioedema in the United States Riedl, M. Orphanet Journal of Rare Diseases. 201822
Main Outcomes:
• Out of 631 patients, 68.8% reported C1-INH(IV) use and 62.8% reported using ecallantide and/or icatibant
• 306 episodes of prophylactic use of C1-INH(IV) in 155 patients
• Use of ≥ on-demand rescue medication was used during 53% (163/306) of those episodes
• Sixty-eight (20.2%) of 336 C1-INH(IV) users eligible for the HCRU analysis were hospitalized at least once
• Eighteen patients had a central venous access device (CVAD); of these, 5 required hospitalization and 14 required an emergency department visit
• Adjusted relative risk of hospitalization and/or ED visits for patients with a CVAD was 2.6 (95% CI: 0.17, 39.23) compared to C1-INH(IV) users without a CVAD
©Institute for Clinical and Economic Review, 2021 Page B1 HAE RWE Update - Report Return to Table of Contents
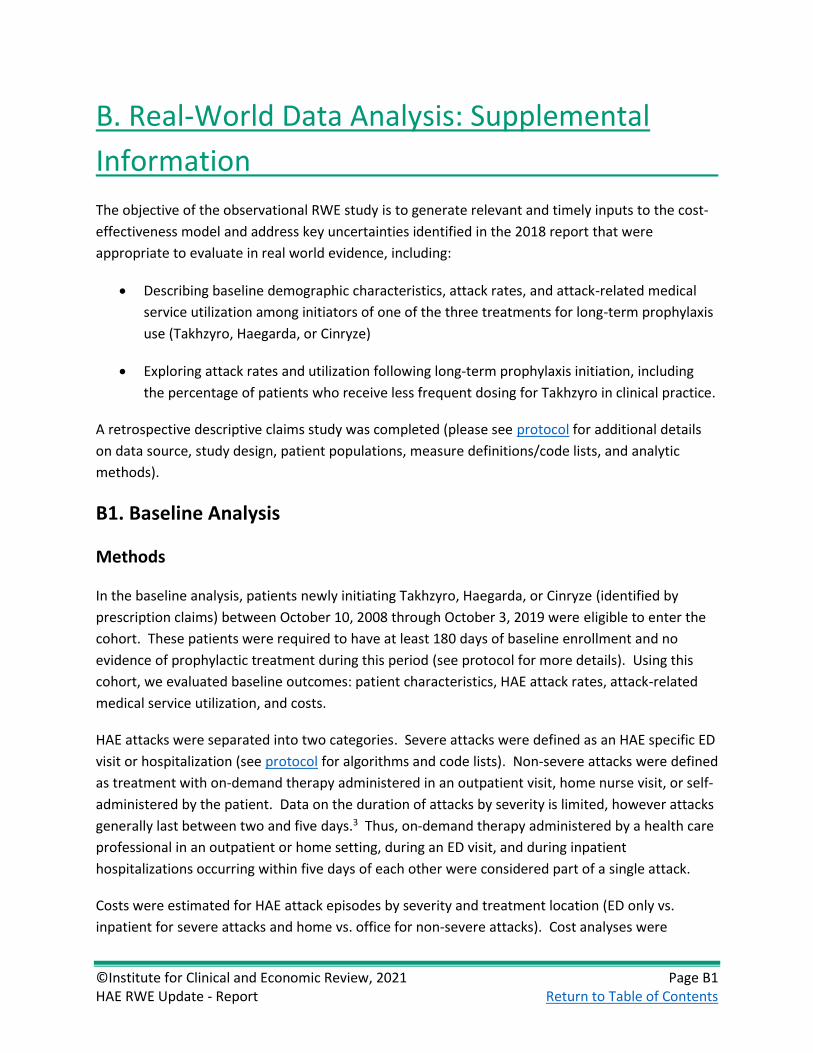
B. Real-World Data Analysis: Supplemental
Information
The objective of the observational RWE study is to generate relevant and timely inputs to the cost-
effectiveness model and address key uncertainties identified in the 2018 report that were
appropriate to evaluate in real world evidence, including:
• Describing baseline demographic characteristics, attack rates, and attack-related medical
service utilization among initiators of one of the three treatments for long-term prophylaxis
use (Takhzyro, Haegarda, or Cinryze)
• Exploring attack rates and utilization following long-term prophylaxis initiation, including
the percentage of patients who receive less frequent dosing for Takhzyro in clinical practice.
A retrospective descriptive claims study was completed (please see protocol for additional details
on data source, study design, patient populations, measure definitions/code lists, and analytic
methods).
B1. Baseline Analysis
Methods
In the baseline analysis, patients newly initiating Takhzyro, Haegarda, or Cinryze (identified by
prescription claims) between October 10, 2008 through October 3, 2019 were eligible to enter the
cohort. These patients were required to have at least 180 days of baseline enrollment and no
evidence of prophylactic treatment during this period (see protocol for more details). Using this
cohort, we evaluated baseline outcomes: patient characteristics, HAE attack rates, attack-related
medical service utilization, and costs.
HAE attacks were separated into two categories. Severe attacks were defined as an HAE specific ED
visit or hospitalization (see protocol for algorithms and code lists). Non-severe attacks were defined
as treatment with on-demand therapy administered in an outpatient visit, home nurse visit, or self-
administered by the patient. Data on the duration of attacks by severity is limited, however attacks
generally last between two and five days.3 Thus, on-demand therapy administered by a health care
professional in an outpatient or home setting, during an ED visit, and during inpatient
hospitalizations occurring within five days of each other were considered part of a single attack.
Costs were estimated for HAE attack episodes by severity and treatment location (ED only vs.
inpatient for severe attacks and home vs. office for non-severe attacks). Cost analyses were

©Institute for Clinical and Economic Review, 2021 Page B2 HAE RWE Update - Report Return to Table of Contents
restricted to 2017-2020 in order to estimate the most timely and relevant costs and were inflated to
2021 US dollars (see protocol for more details) Attack costs for ED visits and hospitalizations (Table
B5) were estimated by summing costs across the medical services utilized during an attack, then
excluding the costs of on-demand therapies, which are included in the cost -
effectiveness model separately.
Patient Characteristics
One hundred and fifty-eight (158) patients initiated prophylactic treatment with Cinryze (49.4%),
Haegarda (24.0%), or Takhzyro (26.6%; Table B1). The mean age of patients at the time of
prophylaxis initiation was 40.7 (SD: 19.0), and 72% of patients were female (Table B2; see modeling
section on how results compared to 2018 model inputs). The literature has shown that DPP4
inhibitors, ACE inhibitors, ARBs, and NEP inhibitors can increase the risk of angioedema attacks.23,24
Of the 158 patients in the prophylaxis treatment cohort, 13% were prescribed a drug within one of
these therapy classes in the six months prior to initiation of prophylaxis treatment.
Table B1. Baseline Inclusion/Exclusion Flow Table
Criteria Less Excluded Patients Remaining Patients
All patients - 67,691,644
Patients meeting inclusion criteria (use of Cinryze, Haegarda, or Takhzyro)
-67,691,227 417
Excluded due to < 180 days baseline enrollment -59 358
Excluded patients initiating Cinryze who do not have evidence of prophylactic use for 90 days post cohort entry
-137 221
Excluded based on prior prophylactic use of Cinryze during the baseline period (dose >= 1500 / week during period 90 days to 1 day prior to cohort entry (13 weeks))
-2 219
Excluded based on prior prophylactic use of Cinryze during baseline period (dose >= 1500/ week during the period 180 days to 91 days prior to cohort entry (13 weeks))
0 219
Excluded based on prior use of Haegarda -28 191
Excluded based on prior use of Takhzyro -32 159
Excluded based on prior use of older prophylactic (Berotralstat, Danazol, Oxandrolone, Tranexamic Acid, Aminocaproic Acid, Methyltestosterone, Stanozolol)
-1 158
Final cohort - 158

©Institute for Clinical and Economic Review, 2021 Page B3 HAE RWE Update - Report Return to Table of Contents
Table B2. Baseline Cohort Patient Characteristics
Variable Value
Number of patients 158
Age - mean (SD) 40.65 (19.03)
Age - median [IQR] 39.00 [26.00, 54.00]
Male; n (%) 45 (28.5%)
Female; n (%) 113 (71.5%)
Attack Rates
In the six months prior to initiation of prophylaxis therapy, 86% of patients (N = 136) had evidence
of at least one attack episode. Thus, 22 patients were free from an HAE attack before initiating
prophylaxis therapy; 10 of these patients initiated Takhzyro, four initiated Haegarda, and eight
initiated Cinryze. Eighty-six percent of patients were severe attack-free in the six-month baseline
time period.
Out of 1,783 total attack episodes observed for all patients in the six months prior to initiation of
Takhzyro, Haegarda, and Cinryze, 5.7% were severe and 94.3% were non-severe (Table B3). On
average, patients had 1.88 HAE attacks per month.
Table B3. Six-month Baseline HAE Attack Rates
Attacks N (%)
Mean attack rate (per patient per month)
Severe HAE attack episodes 102 (5.72%) 0.11
Non-severe HAE attack episodes 1,681 (94.28%) 1.77
Total attacks (severe and non-severe) 1,783 (100%) 1.88
Sensitivity analyses were conducted on the definition of HAE attacks. Data on the precise timing of
self-administered treatment is not available. Rather, the number of treatments administered was
estimated from pharmacy dispensing data, including the date and quantity dispensed, and dosing
guidelines. In estimating the number of self-treated attacks, we assumed, based on clinical
guidelines, that patients would have on-demand treatment on hand to treat up to two attacks.
These two on-hand doses were subtracted out in the calculation of self-administered doses in the
primary analysis. In sensitivity analysis, each prescription dose was counted as an attack. This
increased the non-severe attacks to 1,871 and total attacks to 1,973 and resulted in 2.08 attacks per
patient per month.
As noted above, in the primary analysis, we treated attack-related visits within five days of each
other as part of the same attack. In sensitivity analyses, we reduced the assumed attack duration to
two days and then to one day, treating events on distinct days as separate attacks in the one-day
duration analysis. Estimated attack rates increased to 1.90 and 1.96 in these analyses, respectively.

©Institute for Clinical and Economic Review, 2021 Page B4 HAE RWE Update - Report Return to Table of Contents
Utilization
We assessed the distribution of care settings for treated attacks. Among hospitalizations, we
assessed the prevalence of intubation, cricothyrotomy/tracheotomy, and artificial respiration.
Among 102 severe attack episodes, a total of 19 hospitalizations were observed (Table B4).
Intubation occurred in 23.5% (n=4) of these hospitalizations and cricothyrotomy/tracheotomy in
11.8% (n=2). All patients who were intubated or had a cricothyrotomy/tracheotomy were put on
mechanical ventilation. Fifteen of the 19 hospitalizations were preceded by an ED visit. We
observed a total of 108 ED visits.
Among 1,681 non-severe HAE attack episodes, there were 20 outpatient setting visits where on-
demand treatment was administered and 152 home visits with on-demand treatment administered.
1,509 doses of on-demand therapy were administered by the patient. Across all non-severe
attacks, the most common on-demand therapy used was Firazyr (61.0%), followed by Berinert
(19.6%).
Table B4. Utilization by Severity of Attack
Total Counts
Severe HAE attack episodes†
ED visit only 93
Inpatient hospitalizations 19
Non-severe HAE attacks
Treated in outpatient setting with on-demand therapy 20
Treated at home with on-demand therapy 152
Self-administered on-demand therapy 1,509
†Severe attack episodes were defined as any attack-related hospitalization that happened within a five-day time
period. There were on average, 1.05 ED visits per HAE severe attack and 1.12 ED visits per attack with an inpatient
hospitalization.
Costs
Average cost per ED visit was $2,940 and average cost per hospitalization was $20,957 (B5).
Table B5. Costs Associated with HAE Attacks
Costs
Cost per ED visit $2,940 (SD: $2,901)
Cost per hospitalization $20,957 (SD: $13,628)
ED: emergency department, SD: standard deviation

©Institute for Clinical and Economic Review, 2021 Page B5 HAE RWE Update - Report Return to Table of Contents
B2. Post-Prophylaxis Descriptive Analyses
Methods
As an exploratory and descriptive analysis, we evaluated severe attack rates following prophylactic
treatment initiation among a cohort of patients who met the inclusion/exclusion criteria for the
baseline analyses and had at least 90 days of continuous enrollment following prophylaxis initiation.
Patients were censored upon the first of: maximum follow up of 365 days, disenrollment, end of
data, or death.
Patient Characteristics
134 patients were included in the post-prophylaxis exploratory analysis (B6). The majority of
patients initiated Cinryze (72), followed by Takhzyro (34) and Haegarda (28; Table B7)
Table B6. Post-Prophylaxis Exploratory Cohort Inclusion/Exclusion Flow Table
Criteria Less Excluded Patients Remaining Patients
All patients - 67,691,644
Patients meeting inclusion criteria (use of Cinryze, Haegarda, or Takhzyro)
-67,691,227 417
Excluded due to < 180 days baseline enrollment -59 358
Exclude patients initiating Cinryze who don't have prophylactic use for 90 days post cohort entry
-143 215
Excluded based on prior prophylactic use of Cinryze during the baseline period (dose >= 1500 / week during period 90 days to 1 day prior to cohort entry (13 weeks))
-2 213
Excluded based on prior prophylactic use of Cinryze during the baseline period (dose >= 1500/ week during the period 180 days to 91 days prior to cohort entry (13 weeks))
0 213
Excluded based on prior use of Haegarda -33 180
Excluded based on prior use of Takhzyro -35 145
Excluded based on Use of older prophylactic (Berotralstat, Danazol, Oxandrolone, Tranexamic Acid, Aminocaproic Acid, Methyltestosterone, Stanozolol)
-1 144
Excluded due to <90 days follow-up -10 134
Final cohort - 134

©Institute for Clinical and Economic Review, 2021 Page B6 HAE RWE Update - Report Return to Table of Contents
Table B7. Post-Prophylaxis Exploratory Cohort Patient Characteristics
Variable Overall Takhzyro Initiators Haegarda Initiators Cinryze Initiators
Number of patients 134 34 28 72
Age - mean (SD) 39.83 (18.77) 46.53 (15.48) 39.61 (22.31) 36.75 (18.11)
Age - median [IQR] 37.00 [26.00, 54.00] 47.50 [34.00, 58.00] 39.00 [20.25, 57.75] 34.00 [22.00, 48.00]
Male; n (%) 40 (29.9%) 6 (17.6%) 11 (39.3%) 23 (31.9%)
Female; n (%) 94 (70.1%) 28 (82.4%) 17 (60.7%) 49 (68.1%)
IQR: interquartile range, SD: standard deviation
Severe Attack Rates
The average follow-up time in the cohort was 24 months, though this differed by drug. Patients
initiating Cinryze, which was the first drug approved, tended to initiate earlier in the study period
and thus had more follow-up time available. They were followed for a mean of 33.1 months, as
opposed to 9.6 months for Takhzyro and 18.5 months for Haegarda (Table B8). Across all patients
in the post-prophylaxis exploratory cohort, patients initiating Takhzyro had the highest percentage
of severe attack-free months in the follow-up period (92.3%), followed by Cinryze (73.0%) and
Haegarda (69.7%; Table B8).
Table B8. Post-prophylaxis Treatment Initiation Severe Attack Rates
Number of Patients Average Follow-up Time per Patient
(min, max)
Average Severe Attack-Free Months
per Patient
Average Proportion of Months Severe
Attack Free
Overall 134 24.1 (4, 119) 16.2 77.0%
Takhzyro 34 9.6 (4, 18) 9.0 92.3%
Cinryze 72 33.1 (4,119) 23.0 73.0%
Haegarda 28 18.5 (5, 32) 12.5 69.7%
Due to the small sample size, there is insufficient power to complete a formal pre/post analysis to
detect a meaningful difference in attack rates. Thus, the comparison between baseline and post-
prophylaxis exploratory cohorts is descriptive only. Compared to the baseline period, patients had
fewer severe HAE attacks per month on average (0.11 vs. 0.04; Table B9). The 64% reduction in
severe attacks per month is in line with results from the pivotal RCTs, which measured reduction in
all HAE attacks compared with placebo over the entire study period and demonstrated a range of
50%-87% reduction in HAE attacks. While this is not an equal comparison (e.g., difference in severe
attacks vs. all attacks) and the RWE results are descriptive, the RWE results appear to be consistent
with the RCT estimates.

©Institute for Clinical and Economic Review, 2021 Page B7 HAE RWE Update - Report Return to Table of Contents
Table B9. Descriptive Comparison of Severe Attack Rates in Baseline versus Follow-up Period
Baseline Period Follow-up Period
Number of patients 158 134
Total number of patient months 948 (fixed, 6 months per patient) 2982 (variable)
Total number of severe HAE attacks 102 116
Severe HAE attacks per patient per month 0.11 0.04
Adherence and Switching
Adherence to prophylaxis therapy could impact the cost and effectiveness of these treatments. To
assess real-world patterns, we evaluated adherence using proportion of days covered (PDC). PDC
was calculated as the proportion of days covered with any prophylactic medication – not just the
medication initiated - for the first six months post initiation of a prophylaxis therapy. The six-month
follow-up period was selected to increase comparability across the three therapies. The percentage
of patients with PDC greater than 80% during the six months post initiation was highest for
Takhzyro patients (70.6%), followed by Cinryze (56.9%) and Haegarda (53.6%).
As noted above, patients switching to a different prophylactic were not censored from follow-up.
Of the patients that switched, the majority switched to Takhzyro; 22% of patients that initiated
Cinryze and 25% of Haegarda initiators switched to Takhzyro. Only 2.9% and 5.9% of Takhzyro
patients switched to Haegarda and Cinryze, respectively.
B3. Exploratory Analysis of Takhzyro Dose Reduction
Methods
According to the FDA-approved label, patients on Takhzyro who are attack free for six months can
reduce the frequency of dosing from every two weeks to every four weeks. To assess the frequency
of dose reduction in real-world setting, we analyzed refill patterns in a cohort of patients initiating
Takhzyro. Patients were required to have a minimum of nine months follow-up: six months to
assess eligibility for dose reduction plus 90 days to evaluate whether an actual dose reduction
occurred.
Patient Characteristics
Forty-two patients initiating Takhzyro met cohort entry criteria (Table B10). These patients were
slightly older and more likely to be female compared to the baseline cohort (Table B11).

©Institute for Clinical and Economic Review, 2021 Page B8 HAE RWE Update - Report Return to Table of Contents
Table B10. Takhzyro Dose Reduction Cohort Inclusion/Exclusion Flow Table
Less Excluded Patients Remaining Patients
All patients - 67,691,644
Did not meet cohort entry criteria (use of Takhzyro) -67,691,570 74
Excluded due to <180 days baseline enrollment -14 60
Excluded due to prior use of Takhzyro -16 44
Excluded due to < 270 days of enrollment following cohort entry
-2 42
Final cohort - 42
Table B11. Takhzyro Dose Reduction Cohort Patient Characteristics
Variable Value
Number of patients 42
Age - mean (SD) 48.55 (15.97)
Age - median [IQR] 48.50 [39.25, 59.50]
Male; n (%) 10 (23.8%)
Female; n (%) 32 (76.2%)
IQR: interquartile range, SD: standard deviation
Dose Reduction
Among 42 patients initiating Takhzyro, 27 patients were both attack free and on bi-weekly dosing
during the first six months following initiation. Of these 27 patients eligible for a reduction in
dosing, 20 (74%) reduced dosing to every four weeks. Thus, 48% (20/42) of those who initiated
Takhzyro were observed to reduce dosing to every four weeks.
B4. Patient Weight
Methods
Patient weight is of interest due to the weight-based dosing of some HAE therapies. A limitation of
claims data is incomplete data capture on patient weight, thus we created a separate cohort in
Optum’s De-identified Integrated Claims-Clinical dataset, which combines adjudicated claims data
with Optum’s Electronic Health Record data, to obtain a larger sample of HAE patients with weight
values. This cohort included all patients with a diagnosis related to HAE or with a prescription for
an HAE drug (Table B12).
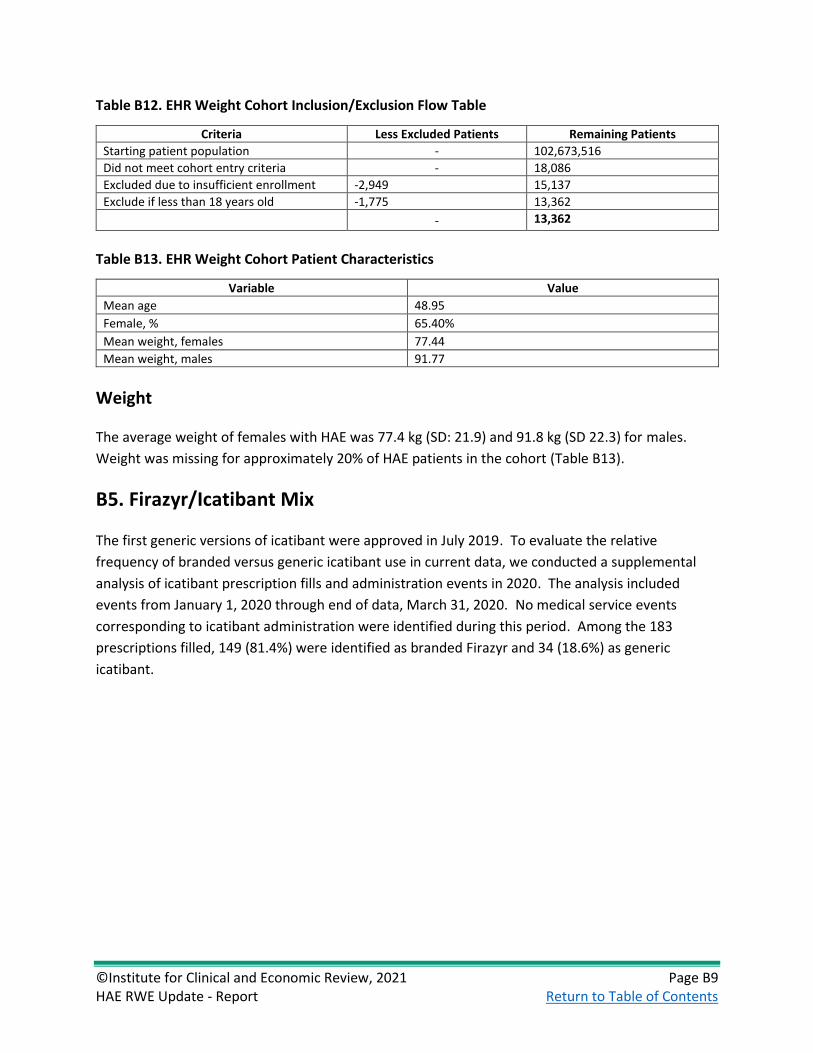
©Institute for Clinical and Economic Review, 2021 Page B9 HAE RWE Update - Report Return to Table of Contents
Table B12. EHR Weight Cohort Inclusion/Exclusion Flow Table
Criteria Less Excluded Patients Remaining Patients
Starting patient population - 102,673,516
Did not meet cohort entry criteria - 18,086
Excluded due to insufficient enrollment -2,949 15,137
Exclude if less than 18 years old -1,775 13,362
- 13,362
Table B13. EHR Weight Cohort Patient Characteristics
Variable Value
Mean age 48.95
Female, % 65.40%
Mean weight, females 77.44
Mean weight, males 91.77
Weight
The average weight of females with HAE was 77.4 kg (SD: 21.9) and 91.8 kg (SD 22.3) for males.
Weight was missing for approximately 20% of HAE patients in the cohort (Table B13).
B5. Firazyr/Icatibant Mix
The first generic versions of icatibant were approved in July 2019. To evaluate the relative
frequency of branded versus generic icatibant use in current data, we conducted a supplemental
analysis of icatibant prescription fills and administration events in 2020. The analysis included
events from January 1, 2020 through end of data, March 31, 2020. No medical service events
corresponding to icatibant administration were identified during this period. Among the 183
prescriptions filled, 149 (81.4%) were identified as branded Firazyr and 34 (18.6%) as generic
icatibant.

©Institute for Clinical and Economic Review, 2021 Page C1 HAE RWE Update - Report Return to Table of Contents
C. Long-Term Cost-Effectiveness: Supplemental
Information
C1. Methods Overview
The HAE model was developed as a Markov model with two health states: “alive with HAE” and
“dead” (Figure C1). The model used one-month cycles over a lifetime time horizon. Transition from
the “alive with HAE” state to “dead” were based on background mortality from US life tables and
HAE-specific mortality. Within the “alive with HAE” health state, health-related quality of life,
number of acute attacks and time spent in acute attacks were estimated. For each attack, severity
of attack, anatomical location of the attack for severe attacks (i.e., laryngeal and non-laryngeal),
mortality from asphyxiation due to laryngeal attack, and attack-specific disutility, as well as
treatment patterns (setting and drugs), emergency department (ED) visits, hospitalizations and
associated costs were considered (Figure C2). These outcomes were tracked over time for persons
receiving long-term prophylaxis with Takhzyro and the C1 inhibitors, and those not receiving long-
term prophylaxis.
The base-case analysis took a health care system perspective (i.e., focus on direct medical care costs
only) and a lifetime time horizon. Productivity impacts were included in a modified societal
perspective scenario analysis. A 3% per year discount rate was applied for future costs and health
outcomes. Model output cost-effectiveness summary measures included: cost per attack avoided,
cost per quality-adjusted life years (QALYs) gained, and cost per life-year gained. Note that equal
value of life years gained (evLYGs) was not included in the 2018 evaluation and therefore was not
included within this update.
Figure C1. Model Framework
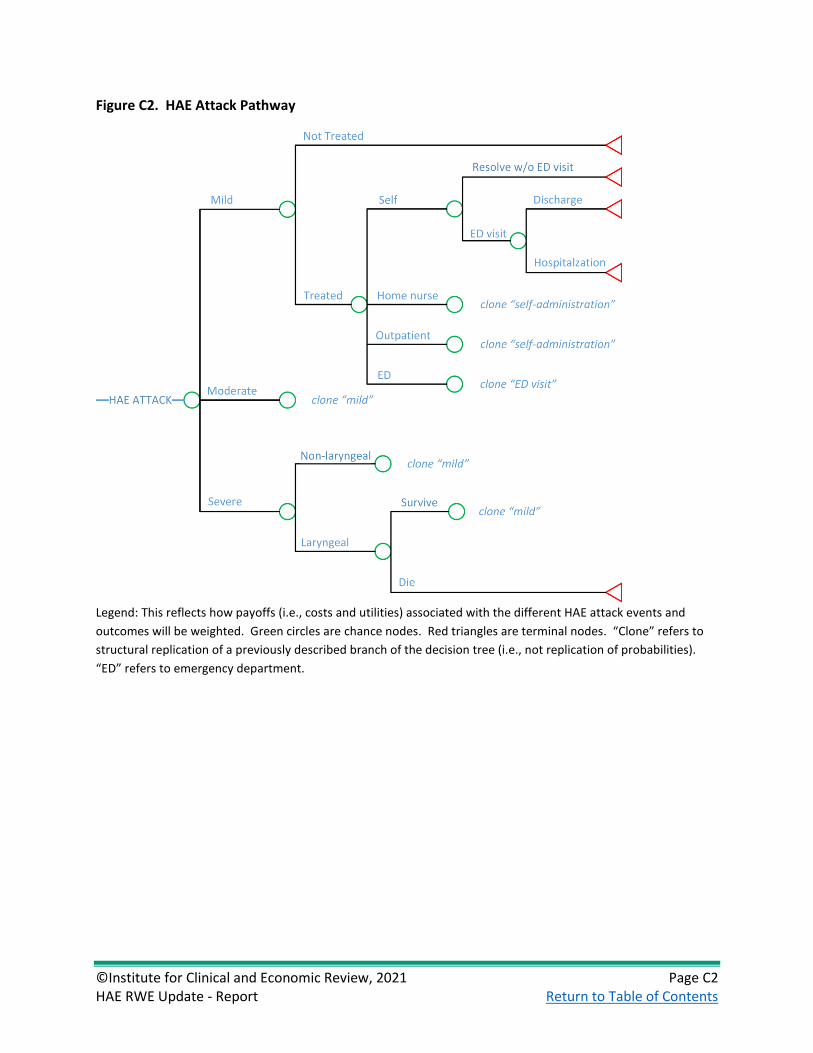
©Institute for Clinical and Economic Review, 2021 Page C2 HAE RWE Update - Report Return to Table of Contents
Figure C2. HAE Attack Pathway
Legend: This reflects how payoffs (i.e., costs and utilities) associated with the different HAE attack events and
outcomes will be weighted. Green circles are chance nodes. Red triangles are terminal nodes. “Clone” refers to
structural replication of a previously described branch of the decision tree (i.e., not replication of probabilities).
“ED” refers to emergency department.

©Institute for Clinical and Economic Review, 2021 Page C3 HAE RWE Update - Report Return to Table of Contents
Table C1. Impact Inventory
Sector Type of Impact
(Add additional domains, as relevant)
Included in This Analysis from […] Perspective?
Notes on Sources (if quantified), Likely
Magnitude & Impact (if not)
Health Care Sector
Societal
Formal Health Care Sector
Health Outcomes
Longevity effects X X
Health-related quality of life effects X X
Adverse events X X
Medical Costs Paid by third-party payers X X
Paid by patients out-of-pocket
Future related medical costs
Future unrelated medical costs
Informal Health Care Sector
Health-Related Costs
Patient time costs NA
Unpaid caregiver-time costs NA
Transportation costs NA
Non-Health Care Sector
Productivity Labor market earnings lost NA X
Cost of unpaid lost productivity due to illness
NA X
Cost of uncompensated household production
NA
Consumption Future consumption unrelated to health NA
Social services Cost of social services as part of intervention
NA
Legal/Criminal Justice
Number of crimes related to intervention NA
Cost of crimes related to intervention NA
Education Impact of intervention on educational achievement of population
NA
Housing Cost of home improvements, remediation
NA
Environment Production of toxic waste pollution by intervention
NA
Other Other impacts (if relevant) NA
NA: not applicable
Adapted from Sanders et al25
Target Population
Consistent with the original analysis, the population for this analysis consisted of patients in the US
with HAE I/II who are candidates for long-term prophylactic treatment.

©Institute for Clinical and Economic Review, 2021 Page C4 HAE RWE Update - Report Return to Table of Contents
Treatment Strategies
The interventions assessed in this model were:
• Haegarda (C1-INH, subcutaneous injection [human])
• Cinryze (C-INH, intravenous injection [human])
• Takhzyro (lanadelumab)
The comparator was no long-term prophylaxis. Patients in all intervention and comparator groups
could receive on-demand treatment for acute attacks.
C2. Model Inputs and Assumptions
Table C2. Key Model Choices and Assumptions
Assumption Rationale
Model Choice: Prior model inputs will be supplemented with real-world evidence from published literature and real-world evidence analysis
Observational RWE will aid in updating baseline attack rates and other model inputs. For the updated base case, we will continue to rely on randomized controlled trials for comparative efficacy inputs.
All moderate and severe attacks are treated. Treatment guidelines and empirical data suggest that moderate and severe attacks are treated.3
In the RWE Observational Update, all mild, moderate, and severe attacks are treated
The baseline attack rate which is generated from the de novo RWE analysis is based on treated attacks
Non-severe attacks do not result in ED visits or hospitalizations.
Treatment guidelines and empirical data suggest that non-severe attacks are not typically treated in the ED nor do they result in hospitalizations.3
Market share distribution of on-demand drugs is consistent across treatment settings (e.g., home use, physician, emergency department).
Update of previous assumptions based on real-world evidence of claims data which is not stratified by treatment setting.
Patients do not discontinue prophylactic therapies over their lifetime.
There is no indication that attack rate declines with age.
As with the original economic assessment, we will not model adverse events (AEs).
There were no serious/treatment-related AEs attributable to the prophylactic therapies in the clinical trials.
We will use consistent health state utility values across treatments evaluated in the model.
In the original model, health state utilities were derived from publicly available literature and applied to health states. No new utility values were identified as part of this RWE update.
The preliminary phase updates focused on randomized controlled trials, updated drug prices, and
inflation of unit costs to 2021 US dollars. Key updates to inputs in the preliminary phase were:
mean annual baseline attack frequency (from 3.39 in the 2018 Report to 3.81 based on the
inclusion of one additional RCT26), proportion of patients self-administering on-demand treatment
for attacks (64.9% in 2018 Report to 76.3% in preliminary phase update based on recently published
data for treatment patterns,27 and drug acquisition costs (an average of 43% increase from 2018
©Institute for Clinical and Economic Review, 2021 Page C5 HAE RWE Update - Report Return to Table of Contents
Report to preliminary phase update [range +10% for Cinryze ASP pricing to +186% for Berinert list
price) (Table C7).
Updated inputs from the Observational RWE Phase were applied to the preliminary phase model,
with RWE updates overriding the preliminary phase inputs where applicable. Key updates to inputs
in the observational RWE phase were the baseline attack rate, now based on real-world data for
patients initiating HAE prophylaxis rather than clinical trials, severity of attacks, proportion of
patients self-administering on-demand treatment for attacks, market share of acute treatments,
and cost of ED and hospitalizations. Original and updated values for model inputs which were
updated from the original 2018 cost-effectiveness analysis are shown in the following sections. A
complete listing of all original model inputs can be found in the 2018 HAE final report.1

©Institute for Clinical and Economic Review, 2021 Page C6 HAE RWE Update - Report Return to Table of Contents
Model Inputs
Inputs
Table C3. Source of Key Model Input Updates
Full Text RCTs Available at the
time of 2018 Report
Preliminary Phase: Randomized Controlled Trial literature
to support / enhance:
Observational RWE Phase: De novo RWE claims
analysis and literature to support / enhance:
Efficacy Other Inputs Model Inputs
Epidemiology N/A N/A Age, gender, baseline attack rate
Age, gender, weight, baseline attack rate, pre-treatment severity of attack distribution
Treatment Pathway
N/A N/A
Mode of treatment administration for mild and moderate attacks, HAE laryngeal attack mortality rate
Mode of treatment administration for mild and moderate attacks, Proportion of severe attacks that start in the ED that result in hospitalization, proportion of attacks with cricothyrotomy and intubation
Health Care Resource Use and Cost
N/A N/A
Direct cost of home nurse, physician office visits, ED visits, hospitalizations, indirect cost per mild, moderate, severe attack, other direct costs of treatment (e.g., IV administration), drug acquisition costs for preventive and on-demand treatment
Direct cost of ED visits and hospitalizations, Market share of on-demand drugs
Takhzyro 0 (HELP – Banerji 2017 conference abstract)
% reduction in attack frequency (Banerji 2018)
- Proportion of patients that switch to every four-week dosing
Cinryze 1 (Zuraw 2010) - - -
Haegarda 1 (COMPACT – Longhurst 2017)
- - -
Population Inputs
In the original 2018 analysis, the baseline age, gender, and attack frequency used in the model
reflected the weighted average of these baseline characteristics across the three pivotal clinical

©Institute for Clinical and Economic Review, 2021 Page C7 HAE RWE Update - Report Return to Table of Contents
trials for the interventions the baseline weight for males and females was obtained from Centers for
Disease Control and Prevention (CDC) anthropometric reference data.11,12,26,28,29 In the preliminary
phase updates, inputs for age, gender, and attack frequency were updated with an additional RCT
publication to reflect the weighted average across four clinical trials.
Baseline attack rate in the 2018 evaluation was an average of three RCTs: Banerji 2017, Longhurst
2017 and Zuraw 2010).11,12,30 In the preliminary phase updates, baseline attack rate was updated to
the average of four available RCTs: Banerji 2018 (full publication of earlier Banerji 2017 conference
presentation), Longhurst 2017, Zuraw 2010, and Riedl 2017.12,26,30 The baseline attack rate changed
from 3.39 per month in the 2018 report to 3.81 per month in the preliminary phase updates. Drug
acquisition cost for prophylactic and acute treatments were updated to current WAC or ASP pricing.
The market share for acute treatments remained consistent with the 2018 analysis, assuming equal
use of Berinert, Firazyr, and Ruconest for mild and moderate attacks and equal use of Berinert,
Firazyr, Ruconest, and Kalbitor for severe attacks.
In the Observational RWE Phase, these inputs were updated again to reflect the mean age, gender,
weight, and baseline attack frequency in the cohort of HAE patients initiating prophylaxis that were
identified in the RWE analysis.
Table C4. Base-Case Model Cohort Characteristics
Variable Original Value
Source
Preliminary Phase
Updated Value
Source
Observational RWE Phase
Updated Value
Source
Age in years (mean)
39.6
Zuraw 201011, Longhurst 201712, Riedl 201726, Banerji 201728
40.8
Zuraw 201011, Longhurst 201712, Riedl 201726, Banerji 201831
40.65 RWE analysis
Gender (% female)
68.4%
Zuraw 201011, Longhurst 201712, Riedl 201726, Banerji 201728
72.1%
Zuraw 201011, Longhurst 201712, Riedl 201726, Banerji 201831
71.5% RWE analysis
Weight, female (kg)
76.40 Fryar 201629 Same as original value 77.44 RWE analysis
Weight, male (kg)
88.80 Fryar 201629 Same as original value 91.77 RWE analysis
Baseline attack frequency (per month)
3.39
Zuraw 201011, Longhurst 201712, Riedl 201726, Banerji 201728
3.81 Longhurst 201712, Riedl 201726, Banerji 201831
1.88 RWE analysis
RWE: real-world evidence

©Institute for Clinical and Economic Review, 2021 Page C8 HAE RWE Update - Report Return to Table of Contents
Clinical Inputs
In the preliminary phase updates, clinical inputs largely remained the same as the 2018 analysis
with the exception of a publication with updated treatment patterns for the proportion of mild-
moderate attacks self-treated, treated by a home nurse, or treated in an outpatient setting.27 For
the Observational RWE phase updates, the proportion of attacks which are mild, moderate, and
severe was derived using a combination of literature and RWE estimates. First, we identified the
proportion of all HAE attacks that resulted in an ED visit with or without hospitalization. These
attacks were considered severe (5.7% of attacks). The ratio of mild to moderate attacks from
published literature was used to generate the proportion mild vs moderate for the remaining 94.3%
of attacks.32 The proportion of Takhzyro patients who switch to every four week dosing was
updated based of RWE estimates of the proportion of Takhzyro initiators who met switched to
every four week dosing. No efficacy reduction was assumed for patients who switch to every four-
week dosing. Market share for acute treatments was updated based on observed market share in
the de novo RWE analysis and applied to both mild/moderate and severe attacks.

©Institute for Clinical and Economic Review, 2021 Page C9 HAE RWE Update - Report Return to Table of Contents
Table C5. Key Clinical Model Inputs
Variable Original Value
Source Preliminary
Phase Updated Value
Source Observational
RWE Phase Updated Value
Source
Pre-treatment severity of attack
Mild Moderate Severe
36.6% 46.2% 17.2%
Riedl 201632 Same as original value
41.7% 52.6% 5.7%
RWE analysis
Mild/moderate HAE attack mode of treatment administration: Self Home nurse Outpatient
64.9% 13.8% 21.3%
Riedl 201533
76.3% 11.8% 11.9%
Riedl 202021
89.8% 9.0% 1.2%
RWE analysis
Proportion of severe attacks that start in the ED that result in hospitalization
40.9% Zilberberg 201134
Same as original value 26.5% RWE analysis
Proportion of hospitalized patients who receive a cricothyrotomy
69.4% Bork 201235 Same as original value 7.4% RWE analysis
Proportion of hospitalized patients who are intubated
40.0% Bork 201235 Same as original value 18.5% RWE analysis
Proportion of cricothyrotomy patients who receive artificial respiration
60.0% Bork 201235 Same as original value 100.0% RWE analysis
Proportion of intubated patients who receive artificial respiration
40.0% Bork 201235 Same as original value 100.0% RWE analysis
Clinical Probabilities/Response to Treatment
During the preliminary phase updates, the reduction in attack frequency was revised for Takhzyro
to reflect new RCT data. Other inputs remained the same as the original 2018 analysis. Results of
the observational RWE data analysis provided additional evidence on the proportion of patients
using Takhzyro who successfully remain attack free and switch to lower dosing.
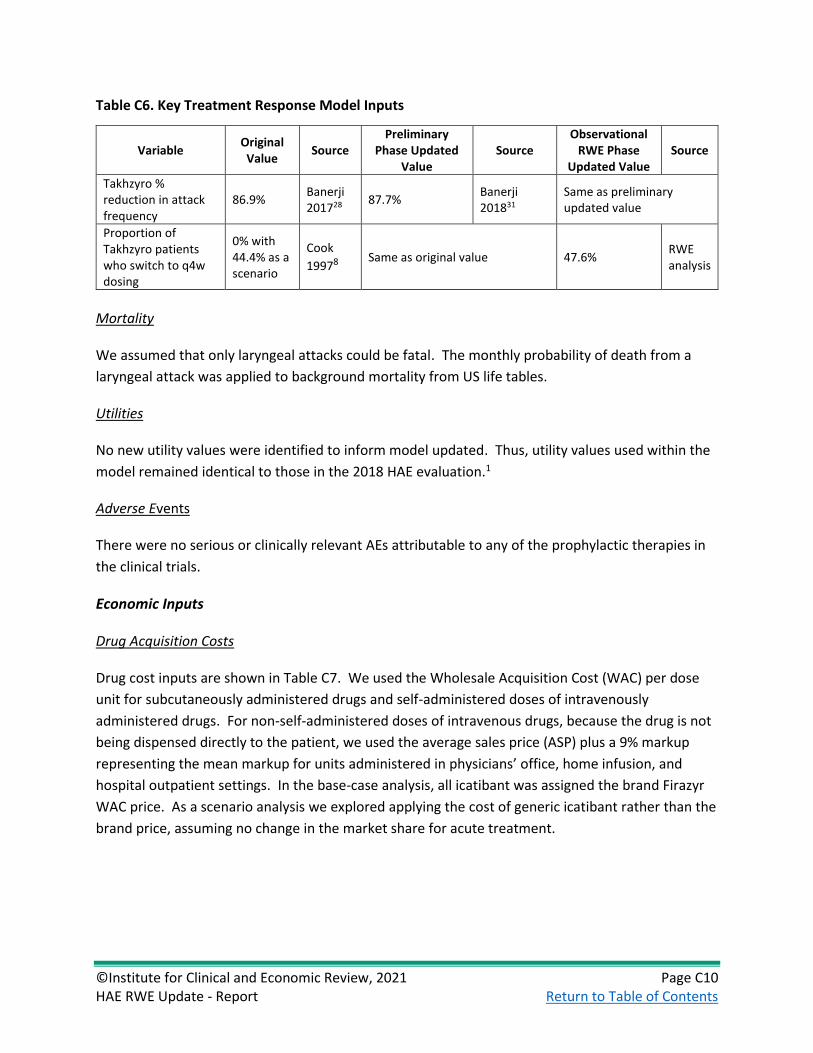
©Institute for Clinical and Economic Review, 2021 Page C10 HAE RWE Update - Report Return to Table of Contents
Table C6. Key Treatment Response Model Inputs
Variable Original Value
Source Preliminary
Phase Updated Value
Source Observational
RWE Phase Updated Value
Source
Takhzyro % reduction in attack frequency
86.9% Banerji 201728
87.7% Banerji 201831
Same as preliminary updated value
Proportion of Takhzyro patients who switch to q4w dosing
0% with 44.4% as a scenario
Cook
19978 Same as original value 47.6% RWE analysis
Mortality
We assumed that only laryngeal attacks could be fatal. The monthly probability of death from a
laryngeal attack was applied to background mortality from US life tables.
Utilities
No new utility values were identified to inform model updated. Thus, utility values used within the
model remained identical to those in the 2018 HAE evaluation.1
Adverse Events
There were no serious or clinically relevant AEs attributable to any of the prophylactic therapies in
the clinical trials.
Economic Inputs
Drug Acquisition Costs
Drug cost inputs are shown in Table C7. We used the Wholesale Acquisition Cost (WAC) per dose
unit for subcutaneously administered drugs and self-administered doses of intravenously
administered drugs. For non-self-administered doses of intravenous drugs, because the drug is not
being dispensed directly to the patient, we used the average sales price (ASP) plus a 9% markup
representing the mean markup for units administered in physicians’ office, home infusion, and
hospital outpatient settings. In the base-case analysis, all icatibant was assigned the brand Firazyr
WAC price. As a scenario analysis we explored applying the cost of generic icatibant rather than the
brand price, assuming no change in the market share for acute treatment.

©Institute for Clinical and Economic Review, 2021 Page C11 HAE RWE Update - Report Return to Table of Contents
Table C7. Drug Cost Inputs
Variable Original Value
Source Preliminary
Phase Updated Value
Source Observational
RWE Phase Updated Value
Cost of Takhzyro (300 mg dose)
$16,520 FSS* $23,414 WAC† Same as preliminary updated value
Cost of Cinryze (500 U)
$2,012 FSS* $2,842 WAC† Same as preliminary updated value
$2,797 ASP $3,075 ASP (Jan 2021) Same as preliminary updated value
Cost of Haegarda (2000 UI)‡
$1,393 FSS* $1,994 WAC† Same as preliminary updated value
Cost of Berinert
$1,135 FSS* $3,250 WAC† Same as preliminary updated value
$2,447 ASP (June 2018)
$2,713 ASP (Jan 2021) Same as preliminary updated value
Cost of Kalbitor (30 mg dose)
$11,174 FSS* $15,211 WAC† Same as preliminary updated value
$14,306 ASP (June 2018)
$16,092 ASP (Jan 2021) Same as preliminary updated value
Cost of Firazyr (30 mg dose)
$7,178 FSS* $11,147 WAC† Same as preliminary updated value
Cost of generic icatibant (30 mg dose; scenario)
Not included
N/A $2,796 WAC† Same as preliminary updated value
Market share of on-demand drugs – self or home nurse Cinryze Berinert Kalbitor Firazyr Ruconest
0.0% 33.3% 0.0% 33.3% 33.3%
Assumption Same as original value
9.97% 19.61% 0.88% 61% 8.54%
Market share of on-demand drugs – physician or ED Cinryze Berinert Kalbitor Firazyr Ruconest
0% 25.0% 25.0% 25.0% 25.0%
Assumption Same as original value
9.97% 19.61% 0.88% 61% 8.54%
*Federal Supply Schedule (FSS) price as of October 1, 2018.
†WAC (wholesale acquisition cost) price as of February 22, 2021.
Administration and Monitoring Costs
A cost of administration is applied to intravenously and subcutaneously administered medications
which are not self-administered. These unit costs were updated to 2021 dollars in the preliminary

©Institute for Clinical and Economic Review, 2021 Page C12 HAE RWE Update - Report Return to Table of Contents
phase updates and again using results of the observational RWE for the cost of subcutaneous
administration and IV administration.
Table C8. Cost of Administration
Variable Original Value
Source Preliminary
Phase Updated Value
Source Observational
RWE Phase Updated Value
Source
Cost of subcutaneous administration
$20.88 CPT 96372 $14.31 CPT 96372 $65.99 RWE analysis inflated to 2021 USD
Cost of IV administration
$47.16 CPT 96374 $41.87 CPT 96374 $157.38 RWE analysis inflated to 2021 USD
Cost of physician office visit
$80.00 CPT 99214 $131.20 CPT 99214 Same as preliminary updated
value
Health Care Utilization Costs
Direct costs of acute attacks included drug costs, costs of a home nurse, and physician office
administration of on-demand treatment, costs of ED visits and hospitalizations.
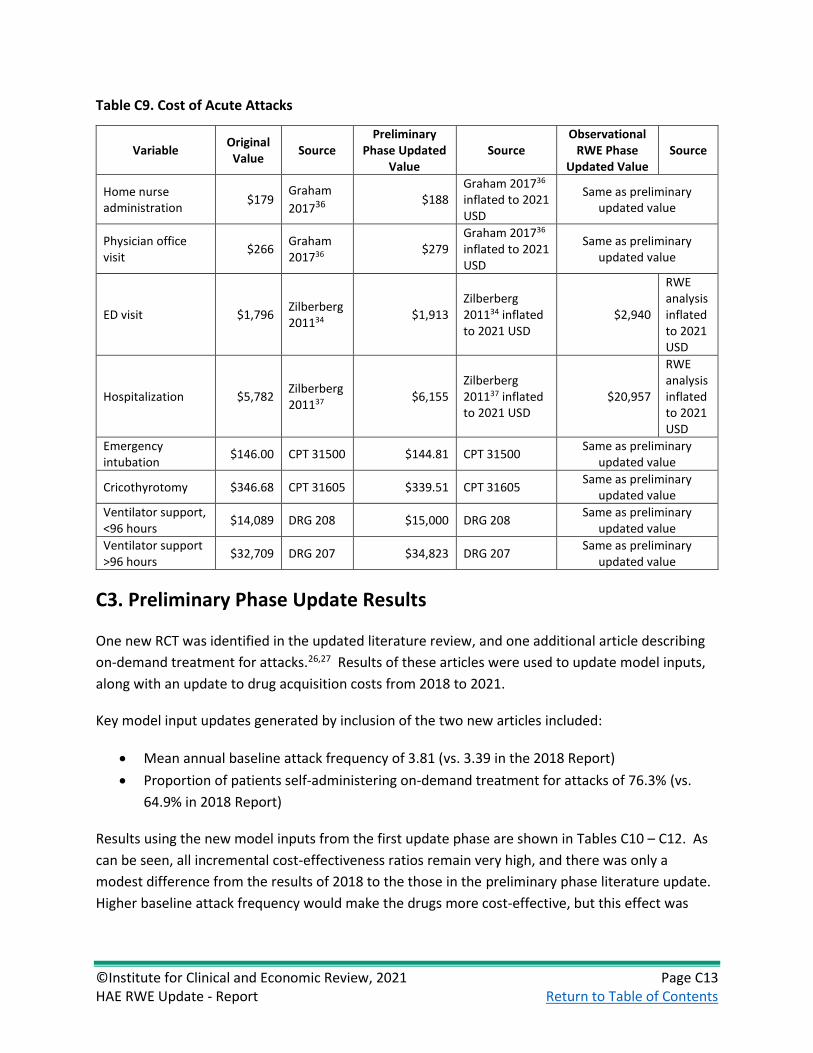
©Institute for Clinical and Economic Review, 2021 Page C13 HAE RWE Update - Report Return to Table of Contents
Table C9. Cost of Acute Attacks
Variable Original Value
Source Preliminary
Phase Updated Value
Source Observational
RWE Phase Updated Value
Source
Home nurse administration
$179 Graham
201736 $188
Graham 201736 inflated to 2021 USD
Same as preliminary updated value
Physician office visit
$266 Graham 201736 $279
Graham 201736 inflated to 2021 USD
Same as preliminary updated value
ED visit $1,796 Zilberberg 201134 $1,913
Zilberberg 201134 inflated to 2021 USD
$2,940
RWE analysis inflated to 2021 USD
Hospitalization $5,782 Zilberberg 201137 $6,155
Zilberberg 201137 inflated to 2021 USD
$20,957
RWE analysis inflated to 2021 USD
Emergency intubation
$146.00 CPT 31500 $144.81 CPT 31500 Same as preliminary
updated value
Cricothyrotomy $346.68 CPT 31605 $339.51 CPT 31605 Same as preliminary
updated value
Ventilator support, <96 hours
$14,089 DRG 208 $15,000 DRG 208 Same as preliminary
updated value
Ventilator support >96 hours
$32,709 DRG 207 $34,823 DRG 207 Same as preliminary
updated value
C3. Preliminary Phase Update Results
One new RCT was identified in the updated literature review, and one additional article describing
on-demand treatment for attacks.26,27 Results of these articles were used to update model inputs,
along with an update to drug acquisition costs from 2018 to 2021.
Key model input updates generated by inclusion of the two new articles included:
• Mean annual baseline attack frequency of 3.81 (vs. 3.39 in the 2018 Report)
• Proportion of patients self-administering on-demand treatment for attacks of 76.3% (vs.
64.9% in 2018 Report)
Results using the new model inputs from the first update phase are shown in Tables C10 – C12. As
can be seen, all incremental cost-effectiveness ratios remain very high, and there was only a
modest difference from the results of 2018 to the those in the preliminary phase literature update.
Higher baseline attack frequency would make the drugs more cost-effective, but this effect was

©Institute for Clinical and Economic Review, 2021 Page C14 HAE RWE Update - Report Return to Table of Contents
more than counter-balanced by the increase in costs related to a higher rate of self-administration
of on-demand treatment.
Table C10. Results for the Preliminary Phase Base Case for HAE Prophylaxis Compared to no
Prophylaxis
Treatment Prophylaxis Drug Cost*
Total Cost* Attacks QALYs Life Years
No prophylaxis $0 $13,950,000 1,871 17.11 23.26
Haegarda $12,490,000 $14,560,000 299 18.43 23.27
Cinryze $12,890,000 $19,800,000 926 17.94 23.26
Takhzyro $11,960,000 $15,660,000 230 18.44 23.27
QALY: quality-adjusted life year
* Results rounded to the nearest $1,000; Results rounded to the nearest $10,000 when over $1 million.
Table C11. Incremental Cost-Effectiveness Ratios for the Preliminary Phase Base Case
Treatment Comparator Cost per Attack
Avoided Cost per QALY
Gained*
2018 Report Cost per QALY
Gained
Haegarda No prophylaxis $387 $462,000 $328,000
Cinryze No prophylaxis $6,188 $7,060,000 $5,950,000
Takhzyro No prophylaxis $1,042 $1,280,000 $1,110,000
QALY: quality-adjusted life year
* Results rounded to the nearest $1,000; Results rounded to the nearest $10,000 when over $1 million.
Note: Due to ratio properties of incremental cost-effectiveness ratios, results can become extreme with small
denominators.
Table C12. Preliminary Phase HBPBs for HAE Prophylactic Therapies
Annual WAC
Price to Achieve
$100,000 per QALY
Price to Achieve
$150,000 per QALY
Discount from List Price to Reach
Threshold Prices
Discounts from List Price to Reach 2018
Report Threshold Prices
Haegarda $536,694 $515,969 $518,930 3.3% to 3.9% 27.7% to 28.2%
Cinryze $548,563 $306,377 $308,114 43.8% to 44.1% 59.7% to 60.0%
Takhzyro $599,403 $531,665 $534,506 10.8% to 11.3% 33.7% to 34.2%
QALY: quality-adjusted life year.
C4. Sensitivity Analysis
To demonstrate effects of uncertainty on both costs and health outcomes, we varied input
parameters using available measures of parameter uncertainty (i.e., standard errors) or reasonable
ranges to evaluate changes in cost per addition QALY for Haegarda, Cinryze, and Lanadelumab for
both the Preliminary Phase updates and Observational RWE Phase Updates. In both phases, key
model inputs were the baseline attack rate, drug cost, and reduction in attack frequency.

©Institute for Clinical and Economic Review, 2021 Page C15 HAE RWE Update - Report Return to Table of Contents
Preliminary Phase Sensitivity Analyses
We found that baseline attack rate, prophylactic drug acquisition costs, and the treatment effect (%
mean reduction in attack frequency) in most cases had the largest impact on the incremental cost-
effectiveness ratio. See Tornado Figures C3, C4, and C5 for each prophylactic agent.
Figure C3. Preliminary Update Tornado Diagram for Haegarda
Table C13. Preliminary Update Tornado Diagram Inputs and Results for Haegarda versus no
Prophylaxis
Lower ICER Upper ICER Lower Input*
Upper Input*
Baseline attack rate (per month) $1,540,000 -$419,000 3.43 4.19
Haegarda Drug cost (WAC per 2000IU vial)
-$485,000 $1,410,000 $1,795 $2,193
% mean reduction in attack frequency $1, 2400,000 -$238,000 75.6% 92.4%
Firazyr cost $716,000 $208,000 $10,032 $12,262
% of mild attacks treated $701,000 $221,000 81% 99% *Note lower input may reflect either upper or lower ICER value depending on the direction that the input has on
the incremental cost-effectiveness ratio output.
Table limited to top 5 most influential results
Figure C4. Preliminary Update Tornado Diagram for Cinryze

©Institute for Clinical and Economic Review, 2021 Page C16 HAE RWE Update - Report Return to Table of Contents
Table C14. Preliminary Update Tornado Diagram Inputs and Results for Cinryze versus no
Prophylaxis
Lower ICER Upper ICER Lower Input*
Upper Input*
Baseline attack rate (per month) $8,920,000 $5,5300,000 3.43 4.19
Cinryze drug cost (WAC per 500 unit vial) $5,600,000 $8,520,000 $2,557 $3,126
% mean reduction in attack frequency $8,420,000 $5,800,000 45.5% 55.6%
% attack free post-treatment $7,680,000 $6,324,000 5.4% 36.3%
Disutility of moderate attack $7,430,000 $6,720,000 0.27 0.33 *Note lower input may reflect either upper or lower ICER value depending on the direction that the input has on
the incremental cost-effectiveness ratio output.
Table limited to top five most influential results
Figure C5. Preliminary Update Tornado Diagram for Takhzyro
Table C15. Preliminary Update Tornado Diagram Inputs and Results for Takhzyro versus no
Prophylaxis
Lower ICER Upper ICER Lower Input*
Upper Input*
Baseline attack rate (per month) $2,470,000 $313,000 3.43 4.19
Cinryze drug cost (WAC per 500 unit vial) $236,000 $2,330,000 $21,073 $25,755
% mean reduction in attack frequency $2,520,000 $802,000 76.2% 92.8%
% of mild attacks which are treated $1,560,000 $1,010,000 81% 99%
Firazyr cost $1,550,000 $1,020,000 $10,032 $12,262 *Note lower input may reflect either upper or lower ICER value depending on the direction that the input has on
the incremental cost-effectiveness ratio output.
Table limited to top 5 most influential results

©Institute for Clinical and Economic Review, 2021 Page C17 HAE RWE Update - Report Return to Table of Contents
Table C16. Preliminary Update Results of Probabilistic Sensitivity Analysis for Haegarda versus no
Prophylaxis
Haegarda No Prophylaxis Incremental
Mean Credible Range
Mean Credible Range
Mean Credible Range
Total Costs $14,630,000 $13,190,000, $16,470,000
$14,420,000
$13,500,000, $14,920,000
$404,000
-$1,210,000, $2,310,000
Total QALYs 18.39 16.40, 20.09 17.07 15.09, 18.76 1.32 1.21, 1.42
Incremental cost-effectiveness ratio
- - - - $319,000
-$881,000, $1,830,000
Table C17. Preliminary Update Results of Probabilistic Sensitivity Analysis for Cinryze versus no
Prophylaxis
Cinryze No Prophylaxis Incremental
Mean Credible Range
Mean Credible Range
Mean Credible Range
Total Costs $19,920,000
$18,490,000, $21,320,000
$14,420,000
$13,500,000, $14,920,000
$5,700,000
$4,240,000, $7,090,000
Total QALYs 17.90 15.88, 19.60 17.07 15.09, 18.76 0.83 0.72, 0.96
Incremental cost-effectiveness ratio
- - - - $6,930,000
$4,87,000,
$9,130,000
Table C18. Preliminary Update Results of Probabilistic Sensitivity Analysis for Takhzyro versus no
Prophylaxis
Takhzyro No Prophylaxis Incremental
Mean Credible Range
Mean Credible Range
Mean Credible Range
Total Costs $15,630,000 $14,040,000, $17,550,000
$14,420,000 $13,500,000, $14,920,000
$1,410,000 -$406,000, $3,350,000
Total QALYs 18.40 16.43, 20.08 17.07 15.09, 18.76 1.33 1.20, 1.44
Incremental cost-effectiveness ratio
- - - - $1,070,000 -$299,000, $2,640,000

©Institute for Clinical and Economic Review, 2021 Page C18 HAE RWE Update - Report Return to Table of Contents
Figure C6. Preliminary Update Probabilistic Sensitivity Analysis Results: Cost-Effectiveness Clouds
This panel presents cost-effectiveness clouds from the probabilistic sensitivity analysis.
Observational RWE Phase Sensitivity Analyses
Baseline attack rate, prophylactic drug acquisition costs, and the treatment effect (% mean
reduction in attack frequency) remained the most impactful inputs on the incremental cost-
effectiveness ratios (See Tornado Figures C7-C9).
Figure C7. Observational RWE Phase Tornado Diagram for Haegarda

©Institute for Clinical and Economic Review, 2021 Page C19 HAE RWE Update - Report Return to Table of Contents
Table C19. Observational RWE Phase Tornado Diagram Inputs and Results for Haegarda versus no
Prophylaxis
Lower ICER Upper ICER Lower Input*
Upper Input*
Baseline attack rate (per month) $16,130,000 $11,220,000 1.69 2.07
Haegarda drug cost (WAC per 2000IU vial)
$11,010,000 $15,840,000 $1,795 $2,193
% mean reduction in attack frequency $15,230,000 $11,820,000 75.6% 92.4%
Duration of a moderate attack (hours) $14,120,000 $12,800,000 21.6 26.4
Disutility of a moderate attack $14,110,000 $12,810,000 0.27 0.33 *Note lower input may reflect either upper or lower ICER value depending on the direction that the input has on
the incremental cost-effectiveness ratio output.
Table limited to top 5 most influential results
Figure C8. Observational RWE Phase Tornado Diagram for Cinryze
Table C20. Observational RWE Phase Tornado Diagram Inputs and Results for Cinryze versus no
Prophylaxis
Lower ICER Upper ICER Lower Input*
Upper Input*
Baseline attack rate (per month) $34,670,000 $26,300,000 1.69 2.07
Cinryze drug cost (WAC per 500 unit vial) $26,360,000 $33,780,000 $2,557 $3,126
% mean reduction in attack frequency $33,580,000 $27,070,000 45.5% 55.6%
% attack free post-treatment $32,520,000 $27,150,000 5.4% 36.3%
Duration of a moderate attack (hours) $31,710,000 $28,590,000 21.6 26.4 *Note lower input may reflect either upper or lower ICER value depending on the direction that the input has on
the incremental cost-effectiveness ratio output.
Table limited to top 5 most influential results

©Institute for Clinical and Economic Review, 2021 Page C20 HAE RWE Update - Report Return to Table of Contents
Figure C9. Observational RWE Phase Tornado Diagram for Takhzyro
Table C21. Observational RWE Phase Tornado Diagram Inputs and Results for Takhzyro versus no
Prophylaxis
Lower ICER Upper ICER Lower Input*
Upper Input*
Baseline attack rate (per month) $14,980,000 $10,240,000 1.69 2.07
Cinryze drug cost (WAC per 500 unit vial) $10,040,000 $14,710,000 $21,073 $25,755
% mean reduction in attack frequency $14,950,000 $11,370,000 76.2% 92.8%
% attack-free post treatment $13,680,000 $11,050,000 26.6% 63.1%
Firazyr cost $13,020,000 $11,720,000 $10,032 $12,262 *Note lower input may reflect either upper or lower ICER value depending on the direction that the input has on
the incremental cost-effectiveness ratio output.
Table limited to top 5 most influential results
None of the prophylactics met a cost-effectiveness threshold up to $200,000 in any of the
simulations in probabilistic sensitivity analysis.
Table C22. Probabilistic Sensitivity Analysis Cost per QALY Gained Results: HAE Prophylaxis versus
no Prophylaxis, Observational RWE Phase
Cost Effective at
$50,000 per QALY
Cost Effective at $100,000 per
QALY
Cost Effective at $150,000 per
QALY
Cost Effective at $200,000 per
QALY
Haegarda 0% 0% 0% 0%
Cinryze 0% 0% 0% 0%
Takhzyro 0% 0% 0% 0%
QALY: quality-adjusted life year

©Institute for Clinical and Economic Review, 2021 Page C21 HAE RWE Update - Report Return to Table of Contents
Table C23. Observational RWE Phase Results of Probabilistic Sensitivity Analysis for Haegarda
versus no Prophylaxis
Haegarda No Prophylaxis Incremental
Mean Credible Range
Mean Credible Range
Mean Credible Range
Total Costs $14,070,000 $13,600,000, $14,660,000
$7,720,000 $7,400,000, $8,040,000
$6,350,000 $5,770,000, $7,010,000
Total QALYs 18.45 16.30, 20.19 17.80 15.67, 19.55 0.65 0.60, 0.70
Incremental cost-effectiveness ratio
- - - - $9,840,000 $8,470,000,
$11,690,000
Table C24. Observational RWE Phase Results of Probabilistic Sensitivity Analysis for Cinryze versus
no Prophylaxis
Cinryze No Prophylaxis Incremental
Mean Credible Range
Mean Credible Range Mean Credible Range
Total Costs $17,260,000
$16,860,000, $17,710,000
$7,720,000
$7,400,000, $8,040,000
$9,540,000
$9,100,000, $10,040,000
Total QALYs 18.21 16.07, 19.95 17.80 15.67, 19.55 0.41 0.36, 0.47
Incremental cost-effectiveness ratio
- - - - $23,570,000 $19,94,000,
$27,670,000
Table C25. Observational RWE Phase Results of Probabilistic Sensitivity Analysis for Takhzyro
versus no Prophylaxis
Takhzyro No Prophylaxis Incremental
Mean Credible Range
Mean Credible Range Mean Credible Range
Total Costs $13,560,000 $12,780,000, $14,360,000
$7,720,000 $7,400,000, $8,040,000
$5,840,000 $5,000,000, $6,680,000
Total QALYs 18.46 16.32, 20.21 17.80
15.67, 19.55 0.65 0.59, 0.71
Incremental cost-effectiveness ratio
- - - - $8,950,000 $7,300,000,
$11,000,000
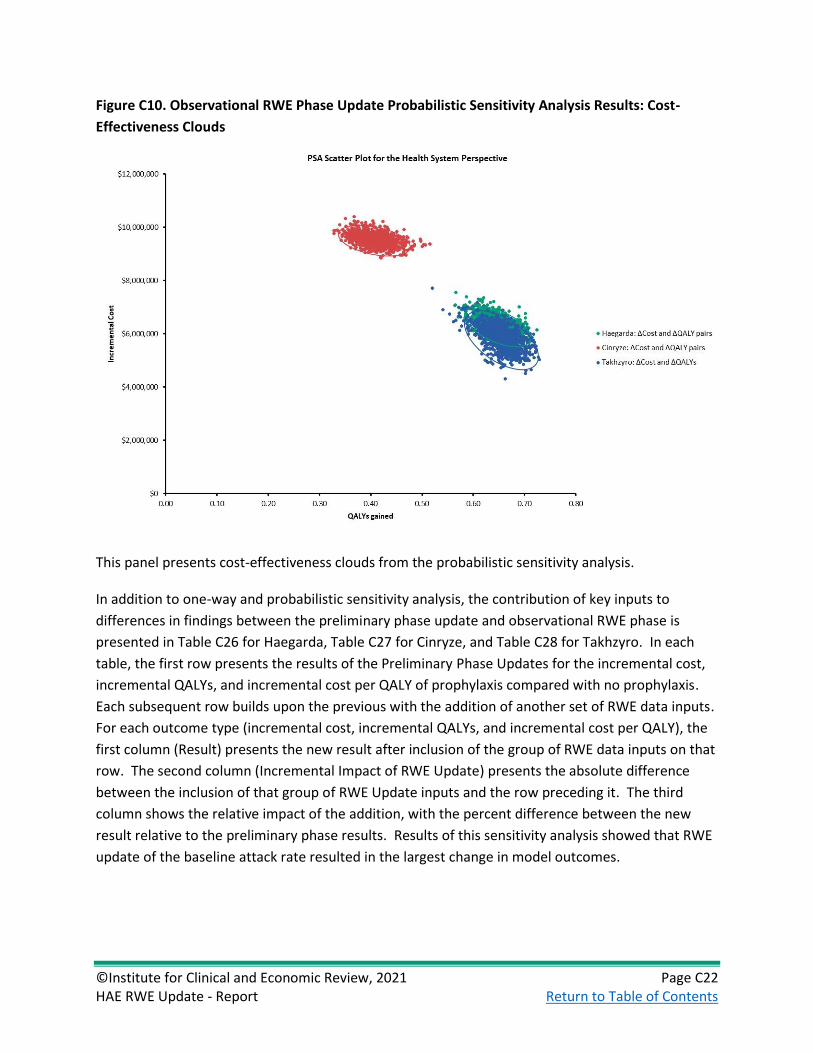
©Institute for Clinical and Economic Review, 2021 Page C22 HAE RWE Update - Report Return to Table of Contents
Figure C10. Observational RWE Phase Update Probabilistic Sensitivity Analysis Results: Cost-
Effectiveness Clouds
This panel presents cost-effectiveness clouds from the probabilistic sensitivity analysis.
In addition to one-way and probabilistic sensitivity analysis, the contribution of key inputs to
differences in findings between the preliminary phase update and observational RWE phase is
presented in Table C26 for Haegarda, Table C27 for Cinryze, and Table C28 for Takhzyro. In each
table, the first row presents the results of the Preliminary Phase Updates for the incremental cost,
incremental QALYs, and incremental cost per QALY of prophylaxis compared with no prophylaxis.
Each subsequent row builds upon the previous with the addition of another set of RWE data inputs.
For each outcome type (incremental cost, incremental QALYs, and incremental cost per QALY), the
first column (Result) presents the new result after inclusion of the group of RWE data inputs on that
row. The second column (Incremental Impact of RWE Update) presents the absolute difference
between the inclusion of that group of RWE Update inputs and the row preceding it. The third
column shows the relative impact of the addition, with the percent difference between the new
result relative to the preliminary phase results. Results of this sensitivity analysis showed that RWE
update of the baseline attack rate resulted in the largest change in model outcomes.

©Institute for Clinical and Economic Review, 2021 Page C23 HAE RWE Update - Report Return to Table of Contents
Table C26. Build-up of Incremental Impact of RWE Updates for Haegarda
Incremental Cost Incremental QALYs Incremental Cost per QALY
Build Step and RWE
Input Group Result
Incremental
Impact of RWE
Update
% Difference
from Phase 1 Result
Incremental
Impact of
RWE Update
%
Difference Result
Incremental
Impact of
RWE Update
%
Difference
2018 evaluation results $390,000 N/A N/A 1.19 N/A N/A $328,000 N/A N/A
Preliminary update
results (Reference) $609,000
N/A N/A 1.32 N/A N/A $462,000
N/A N/A
1. Baseline attack rate $6,770,000 $6,160,000 1012% 0.65 -0.67 -51% $10,390,000 $9,930,000 2149%
2. Population
parameters* $6,950,000 $180,000 1041% 0.65 0.00 -51% $10,640,000 $250,000 2203%
3. Pretreatment attack
severity $7,380,000 $430,000 1112% 0.54 -0.12 -59% $13,730,000 $3,090,000 2872%
4. Treatment pathway† $7,360,000 ($20,000) 1109% 0.53 0.00 -60% $13,790,000 $60,000 2885%
5. Direct cost of ED visits
and hospitalization $7,220,000 ($140,000) 1086% 0.53 0.00 -60% $13,520,000 ($270,000) 2826%
6. Cost of administration $7,220,000 $0 1086% 0.53 0.00 -60% $13,520,000 $0 2826%
7. Market shares of on
demand drugs $7,170,000 ($50,000) 1077% 0.53 0.00 -60% $13,430,000 ($90,000) 2807%
Final RWE Update
Results $7,170,000 $6,560,000 1077% 0.53 -0.79 -60% $13,430,000 $12,970,000 2807%
ED: emergency department, QALY: quality-adjusted life year, RWE: real-world evidence.
*Baseline age, sex, weight.
†Proportion of mild and moderate attacks treated with home self-administration, home nurse, or outpatient; proportion of severe attacks which result in
hospitalization, hospitalization resource utilization mortality.

©Institute for Clinical and Economic Review, 2021 Page C24 HAE RWE Update - Report Return to Table of Contents
Table C27. Build-up of Incremental Impact of RWE Updates for Cinryze
Incremental Cost Incremental QALYs Incremental Cost per QALY
Build Step and RWE
Input Group Result
Incremental
Impact of
RWE Update
% Difference Result
Incremental
Impact of
RWE Update
%
Difference Result
Incremental
Impact of
RWE Update
%
Difference
2018 evaluation results $4,443,000 N/A N/A 0.75 N/A N/A $5,954,000 N/A N/A
Preliminary update
results (Reference) $5,850,000 N/A N/A 0.83 N/A N/A $7,060,000 N/A N/A
1. Baseline attack rate $9,940,000 $4,090,000 70% 0.41 -0.42 -51% $24,280,000 $17,220,000 244%
2. Population
parameters* $9,930,000 ($10,000) 70% 0.41 0.00 -50% $24,210,000 ($70,000) 243%
3. Pretreatment attack
severity $10,200,000 $270,000 75% 0.34 -0.07 -59% $30,160,000 $5,950,000 327%
4. Treatment pathway† $10,190,000 ($10,000) 74% 0.34 0.00 -59% $30,360,000 $200,000 330%
5. Direct cost of ED visits
and hospitalization $10,120,000 ($70,000) 73% 0.34 0.00 -59% $30,140,000 ($220,000) 327%
6. Cost of administration $10,130,000 $10,000 73% 0.34 0.00 -59% $30,180,000 $40,000 328%
7. Market shares of on
demand drugs $10,100,000 ($30,000) 73% 0.34 0.00 -59% $30,070,000 ($110,000) 326%
Final RWE Update
Results $10,100,000 $4,250,000 73% 0.34 -0.49 -59% $30,070,000 $23,010,000 326%
ED: emergency department, QALY: quality-adjusted life year, RWE: real-world evidence.
*Baseline age, sex, weight.
†Proportion of mild and moderate attacks treated with home self-administration, home nurse, or outpatient; proportion of severe attacks which result in
hospitalization, hospitalization resource utilization mortality.

©Institute for Clinical and Economic Review, 2021 Page C25 HAE RWE Update - Report Return to Table of Contents
Table C28. Build-up of Incremental Impact of RWE Updates for Takhzyro
Incremental Cost Incremental QALYs Incremental Cost per QALY
Build Step and RWE
Input Group Result
Incremental
Impact of
RWE Update
% Difference Result
Incremental
Impact of
RWE Update
%
Difference Result
Incremental
Impact of
RWE Update
%
Difference
2018 evaluation results $1,321,000 N/A N/A 1.19 N/A N/A $1,108,000 N/A N/A
Preliminary update
results (Reference) $1,710,000 N/A N/A 1.33 N/A N/A $1,280,000 N/A N/A
1. Baseline attack rate $8,040,000 $6,330,000 370% 0.66 -0.67 -51% $12,230,000 $10,950,000 852%
2. Population
parameters* $8,000,000 ($40,000) 368% 0.66 0.00 -50% $12,140,000 ($90,000) 845%
3. Pretreatment attack
severity $8,410,000 $410,000 392% 0.55 -0.11 -59% $15,390,000 $3,250,000 1098%
4. Treatment pathway† $8,370,000 ($40,000) 390% 0.54 0.00 -59% $15,430,000 $40,000 1101%
5. Direct cost of ED visits
and hospitalization $8,240,000 ($130,000) 382% 0.54 0.00 -59% $15,190,000 ($240,000) 1082%
6. Cost of administration $8,240,000 $0 382% 0.54 0.00 -59% $15,190,000 $0 1082%
7. Market shares of on
demand drugs $8,170,000 ($70,000) 378% 0.54 0.00 -59% $15,070,000 ($120,000) 1073%
8. Proportion that
switch to every 4 week
dosing
$6,710,000 ($1,460,000) 293% 0.54 0.00 -59% $12,370,000 ($2,700,000) 863%
Final RWE Update
Results $6,710,000 $5,000,000 293% 0.54 -0.79 -59% $12,370,000 $11,090,000 863%
ED: emergency department, QALY: quality-adjusted life year, RWE: real-world evidence.
*Baseline age, sex, weight.
†Proportion of mild and moderate attacks treated with home self-administration, home nurse, or outpatient; proportion of severe attacks which result in
hospitalization, hospitalization resource utilization mortality.
‡ lower cost and higher QALYs compared with prophylaxis

©Institute for Clinical and Economic Review, 2021 Page C26 HAE RWE Update - Report Return to Table of Contents
C5. Scenario Analyses
No scenario analyses resulted in an incremental cost per QALY ratio which changed the conclusions
of the analysis relative to the base case. The detailed methods are presented following the
summary of findings across two scenarios. A modified societal perspective considering indirect
costs associated with HAE attacks results in lower cost per QALY for all prophylaxis drugs, although
all remain well above $200,000 per QALY gained. A scenario assuming 100% use of generic
icatibant rather than branded Firazyr for the treatment of acute HAE attacks, keeping the overall
market basket of acute treatments constant, results in substantially lower cost of no prophylaxis
owing to reduced cost of acute treatment. This also translates into reduced cost-offsets from
avoiding acute attacks with prophylactic treatment and higher incremental cost per QALY ratios.
Table C29. Preliminary Phase Scenario Analysis Results
Treatment Base-Case Results Modified Societal
Perspective Generic Icatibant
Haegarda $462,000 $343,000 $2,370,000
Cinryze $7,060,000 $6,950,000 $8,880,000
Takhzyro $1,280,000 $1,170,000 $3,260,000
* Results rounded to the nearest $1,000; Results rounded to the nearest $10,000 when over $1 million.
Table C30. Observational RWE Phase Scenario Analysis Results
Treatment Base-Case Results Modified Societal
Perspective Generic Icatibant
Haegarda $13,430,000 $13,300,000 $18,180,000
Cinryze $30,070,000 $29,960,000 $34,610,000
Takhzyro $12,370,000 $12,250,000 $17,250,000
QALY: quality-adjusted life year.
*Results rounded to the nearest $1,000; Results rounded to the nearest $10,000 when over $1 million.
Modified Societal Perspective
Indirect costs (including missed work, child care, and travel) for acute attacks (by severity) were
obtained from Wilson et al.,38 $959 for mild, $4,048 for moderate, and $6,656 for severe attacks.
These were adjusted by the mean number of attacks per year (22.6) to produce a cost per attack.
The cost of lost productivity was inflated to 2021 US dollars in the preliminary update phase.

©Institute for Clinical and Economic Review, 2021 Page C27 HAE RWE Update - Report Return to Table of Contents
Table C31. Cost of Lost Productivity
Variable Original Value
Source Preliminary
Phase Updated Value
Source Observational
RWE Phase Updated Value
Source
Indirect cost of mild attack
$45 Wilson 201038
$48 Wilson 201038 inflated to 2021 USD
Same as preliminary updated value
Indirect cost of moderate attack
$191 Wilson 201038
$203 Wilson 201038 inflated to 2021 USD
Same as preliminary updated value
Indirect cost of severe attack
$311 Wilson 201038
$331 Wilson 201038 inflated to 2021 USD
Same as preliminary updated value
A modified societal perspective considering indirect costs associated with HAE attacks results in
lower cost per QALY for all prophylaxis drugs, although all remain well $200,000 per QALY gained.
Table C32. Results for the Preliminary Phase Modified Societal Perspective for HAE Prophylaxis
Compared to no Prophylaxis
Treatment Prophylaxis Drug Cost
Total Cost Attacks QALYs Life Years
No prophylaxis $0 $14,130,000 1,871 17.11 23.26 Haegarda $12,490,000 $14,580,000 299 18.43 23.27 Cinryze $12,890,000 $19,890,000 926 17.97 23.26 Takhzyro $13,950,000 $15,680,000 230 18.44 23.27
QALY: quality-adjusted life year
Table C33. Incremental Cost-Effectiveness Ratios for the Preliminary Phase Modified Societal
Perspective for HAE Prophylaxis Compared to no Prophylaxis
Treatment Cost per Attack Avoided Cost per QALY Gained* Cost per Life Year Gained*
Haegarda $288 $342,000 $108,030,000
Cinryze $6,092 $6,950,000 >$1,000,000,000
Takhzyro $946 $1,170,000 $396,110,000
QALY: quality-adjusted life year
* Results rounded to the nearest $1,000; Results rounded to the nearest $10,000 when over $1 million.
Note: Due to ratio properties of incremental cost-effectiveness ratios, results can become extreme with small
denominators.

©Institute for Clinical and Economic Review, 2021 Page C28 HAE RWE Update - Report Return to Table of Contents
Table C34. Results for the Observational RWE Phase Modified Societal Perspective for HAE
Prophylaxis Compared to no Prophylaxis
Treatment Prophylaxis Drug Cost
Total Cost Attacks QALYs Life Years
No prophylaxis $0 $6,860,000 926 18.00 23.30 Haegarda $12,890,000 $13,960,000 148 18.53 23.31 Cinryze $13,520,000 $16,920,000 458 18.33 23.30 Takhzyro $12,660,000 $13,500,000 114 18.54 23.31
QALY: quality-adjusted life year
Table C35. Incremental Cost-Effectiveness Ratios for the Observational RWE Phase Modified
Societal Perspective for HAE Prophylaxis Compared to no Prophylaxis
Treatment Cost per Attack Avoided Cost per QALY Gained* Cost per Life Year Gained*
Haegarda $9,127 $13,300,000 >$1,000,000,000
Cinryze $21,510 $29,960,000 >$1,000,000,000
Takhzyro $8,180 $12,250,000 >$1,000,000,000
QALY: quality-adjusted life year
* Results rounded to the nearest $1,000; Results rounded to the nearest $10,000 when over $1 million.
Note: Due to ratio properties of incremental cost-effectiveness ratios, results can become extreme with small
denominators.
Generic Icatibant Scenario
A scenario was conducted assuming 100% use of generic icatibant rather than branded Firazyr for
the treatment of acute HAE attacks, keeping the overall market basket of acute treatments
constant.
Table C36. Cost of Generic Icatibant
Variable Original Value Source Scenario Value Source
Cost of generic icatibant (30 mg dose; scenario)
Not included N/A $2,796 WAC†
† WAC (wholesale acquisition cost) price as of February 22, 2021
This scenario resulted in substantially lower cost of no prophylaxis owing to reduced cost of acute
treatment. This translates into reduced cost-offsets from avoiding acute attacks with prophylactic
treatment and higher incremental cost per QALY ratios.

©Institute for Clinical and Economic Review, 2021 Page C29 HAE RWE Update - Report Return to Table of Contents
Table C37. Results for the Preliminary Phase Generic Icatibant Scenario for HAE Prophylaxis
Compared to no Prophylaxis
Treatment Prophylaxis Drug Cost
Total Cost Attacks QALYs Life Years
No prophylaxis $0 $11,109,116 1,871 17.11 23.26 Haegarda $12,490,000 $14,089,693 299 18.43 23.27 Cinryze $12,890,000 $18,390,310 926 17.94 23.26 Takhzyro $13,950,000 $15,290,281 230 18.44 23.27
QALY: quality-adjusted life year
Table C38. Incremental Cost-Effectiveness Ratios for the Preliminary Phase Generic Icatibant
Scenario for HAE Prophylaxis Compared to no Prophylaxis
Treatment Cost per Attack Avoided Cost per QALY Gained* Cost per Life Year Gained*
Haegarda $1,985 $2,370,000 >$1,000,000,000
Cinryze $7,788 $8,880,000 >$1,000,000,000
Takhzyro $2,641 $3,260,000 >$1,000,000,000
QALY: quality-adjusted life year
* Results rounded to the nearest $1,000; Results rounded to the nearest $10,000 when over $1 million. Note: Due
to ratio properties of incremental cost-effectiveness ratios, results can become extreme with small denominators.
Table C39. Results for the Observational RWE Phase Generic Icatibant Scenario for HAE
Prophylaxis Compared to no Prophylaxis
Treatment Prophylaxis Drug Cost
Total Cost Attacks QALYs Life Years
No prophylaxis $0 $3,760,000 926 18.00 23.30 Haegarda $12,890,000 $13,460,000 148 18.33 23.30 Cinryze $13,520,000 $15,380,000 458 18.33 23.30 Takhzyro $12,660,000 $13,120,000 114 18.54 23.31
QALY: quality-adjusted life year
Table C40. Incremental Cost-Effectiveness Ratios for the Observational RWE Phase Generic
Icatibant Scenario for HAE Prophylaxis Compared to no Prophylaxis
Treatment Cost per Attack Avoided Cost per QALY Gained* Cost per Life Year Gained*
Haegarda $12,472 $18,180,000 >$1,000,000,000
Cinryze $24,851 $34,610,000 >$1,000,000,000
Takhzyro $11,521 $17,250,000 >$1,000,000,000
QALY: quality-adjusted life year
* Results rounded to the nearest $1,000; Results rounded to the nearest $10,000 when over $1 million. Note: Due
to ratio properties of incremental cost-effectiveness ratios, results can become extreme with small denominators.

©Institute for Clinical and Economic Review, 2021 Page C30 HAE RWE Update - Report Return to Table of Contents
C6. Threshold Analyses
Preliminary Phase Threshold Analyses
As the most influential model parameter, relatively small changes (but treatment-specific ranges) in
the baseline monthly attack rate resulted in incremental cost per QALY results at or below
thresholds of $50,000 to $200,000 per QALY (Table C41).
Table C41. Preliminary Phase Threshold Analysis on Baseline Attack Rate
Attack Rate to
Achieve $50,000 per QALY
Attack Rate to Achieve $100,000
per QALY
Attack Rate to Achieve $150,000
per QALY
Attack Rate to Achieve $200,000
per QALY
Haegarda 3.98 3.96 3.94 3.92
Cinryze 6.53 6.50 6.46 6.43
Takhzyro 4.31 4.29 4.26 4.24
QALY: quality-adjusted life year
Table C42. Preliminary Phase QALY-Based Threshold Analysis Results
WAC per
Unit
Unit Price to Achieve
$50,000 per QALY
Unit Price to Achieve $100,000 per QALY
Unit Price to Achieve $150,000 per QALY
Unit Price to Achieve
$200,000 per QALY
Discount from List Price to
Reach Threshold Prices
Haegarda $1,994 $1,907 $1,917 $1,928 $1,938 2.8% to 4.4%
Cinryze $2,842 $1,577 $1,587 $1,596 $1,605 43.5% to 44.5%
Takhzyro $23,414 $20,656 $20,768 $20,879 $20,991 10.3% to 11.8%
QALY: quality-adjusted life year
Observational RWE Phase Threshold Analyses
Larger changes in the baseline monthly attack rate were needed to yield results at or below
thresholds of $50,000 to $200,000 per QALY (Table C43) in the RWE Observational Phase updates
than in the preliminary updates.
Table C43. Observational RWE Phase Threshold Analysis on Baseline Attack Rate
Attack Rate to
Achieve $50,000 per QALY
Attack Rate to Achieve $100,000
per QALY
Attack Rate to Achieve $150,000
per QALY
Attack Rate to Achieve $200,000
per QALY
Haegarda 4.17 4.15 4.13 4.11
Cinryze 6.75 6.72 6.70 6.67
Takhzyro 3.95 3.94 3.92 3.90
QALY: quality-adjusted life year
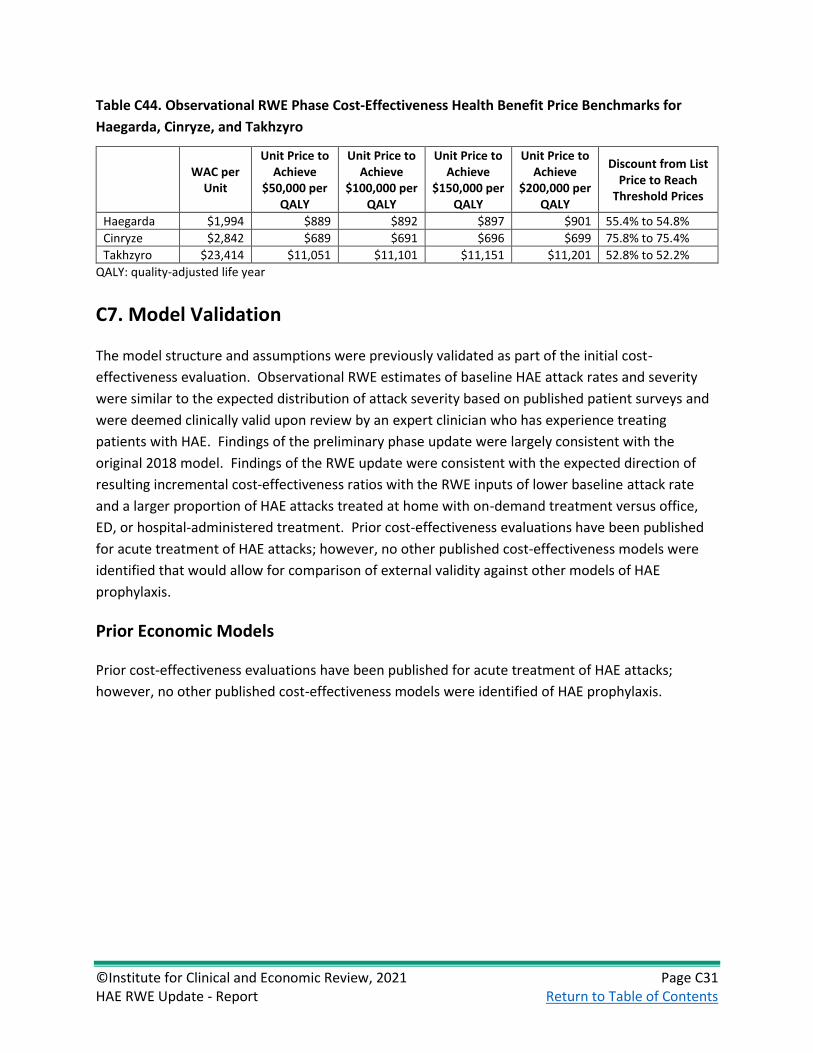
©Institute for Clinical and Economic Review, 2021 Page C31 HAE RWE Update - Report Return to Table of Contents
Table C44. Observational RWE Phase Cost-Effectiveness Health Benefit Price Benchmarks for
Haegarda, Cinryze, and Takhzyro
WAC per
Unit
Unit Price to Achieve
$50,000 per QALY
Unit Price to Achieve
$100,000 per QALY
Unit Price to Achieve
$150,000 per QALY
Unit Price to Achieve
$200,000 per QALY
Discount from List Price to Reach
Threshold Prices
Haegarda $1,994 $889 $892 $897 $901 55.4% to 54.8%
Cinryze $2,842 $689 $691 $696 $699 75.8% to 75.4%
Takhzyro $23,414 $11,051 $11,101 $11,151 $11,201 52.8% to 52.2%
QALY: quality-adjusted life year
C7. Model Validation
The model structure and assumptions were previously validated as part of the initial cost-
effectiveness evaluation. Observational RWE estimates of baseline HAE attack rates and severity
were similar to the expected distribution of attack severity based on published patient surveys and
were deemed clinically valid upon review by an expert clinician who has experience treating
patients with HAE. Findings of the preliminary phase update were largely consistent with the
original 2018 model. Findings of the RWE update were consistent with the expected direction of
resulting incremental cost-effectiveness ratios with the RWE inputs of lower baseline attack rate
and a larger proportion of HAE attacks treated at home with on-demand treatment versus office,
ED, or hospital-administered treatment. Prior cost-effectiveness evaluations have been published
for acute treatment of HAE attacks; however, no other published cost-effectiveness models were
identified that would allow for comparison of external validity against other models of HAE
prophylaxis.
Prior Economic Models
Prior cost-effectiveness evaluations have been published for acute treatment of HAE attacks;
however, no other published cost-effectiveness models were identified of HAE prophylaxis.