Embed Size (px)
Citation preview

arX
iv:a
stro
-ph/
0604
197v
1 1
0 A
pr 2
006
Observation of VHE Gamma Radiation from HESS
J1834-087/W41 with the MAGIC Telescope
J. Alberta, E. Aliub, H. Anderhubc, P. Antoranzd, A. Armadab, M. Asensiod, C. Baixerase,
J. A. Barriod, M. Barteltf , H. Bartkog,∗, D. Bastierih, S. R. Bavikadii, W. Bednarekj ,
K. Bergera, C. Bigongiarih, A. Bilandc, E. Bisesii, R. K. Bockg, P. Bordasu,
V. Bosch-Ramonu, T. Bretza, I. Britvitchc, M. Camarad, E. Carmonag, A. Chilingariank,
S. Ciprinil, J. A. Coarasag, S. Commichauc, J. L. Contrerasd, J. Cortinab, V. Curteff ,
T.M. Damev, V. Danielyank, F. Dazzih, A. De Angelisi, R. de los Reyesd, B. De Lottoi,
E. Domingo-Santamarıab, D. Dornera, M. Doroh, M. Errandob, M. Fagiolinio, D. Ferencn,
E. Fernandezb, R. Firpob, J. Flixb, M. V. Fonsecad, L. Fonte, M. Fuchsg , N. Galanteo,
M. Garczarczykg , M. Gaugh, M. Gillerj , F. Goebelg, D. Hakobyank, M. Hayashidag ,
T. Hengstebeckm, D. Hohnea, J. Hoseg, C. C. Hsug, P. G. Isarg, P. Jaconj, O. Kalekinm,
R. Kasyrag, D. Kranichc,n, M. Laatiaouig, A. Laillen, T. Lenisai, P. Liebingg, E. Lindforsl,
S. Lombardih, F. Longop, J. Lopezb, M. Lopezd, E. Lorenzc,g, F. Lucarellid, P. Majumdarg,
G. Manevaq, K. Mannheima, O. Mansuttii, M. Mariottih, M. Martınezb, K. Maseg,
D. Mazing, C. Merckg , M. Meuccio, M. Meyera, J. M. Mirandad, R. Mirzoyang ,
S. Mizobuchig , A. Moralejob, K. Nilssonl, E. Ona-Wilhelmib, R. Ordunae, N. Otteg, I. Oyad,
D. Panequeg , R. Paolettio, J. M. Paredesu, M. Pasanenl, D. Pascolih, F. Paussc,
N. Pavelm,w, R. Pegnao, M. Persicr, L. Peruzzoh, A. Picciolio, M. Pollera, E. Prandinih,
A. Raymersk , J. Ricob, W. Rhodef , M. Ribou, B. Riegela, M. Rissic, A. Roberte,
S. Rugamera, A. Saggionh, A. Sancheze, P. Sartorih, V. Scalzottoh, V. Scapinh,
R. Schmitta, T. Schweizerm, M. Shaydukm, K. Shinozakig, S. N. Shores, N. Sidrob,
A. Sillanpaal, D. Sobczynskaj , A. Stamerrao, L. S. Starkc, L. Takalol, P. Temnikovq ,
D. Tescarob, M. Teshimag, N. Tonellog, A. Torrese, D. F. Torresb,t, N. Turinio, H. Vankovq,
V. Vitalei, R. M. Wagnerg, T. Wibigj , W. Wittekg, R. Zaninh, J. Zapateroe

– 2 –
ABSTRACT
Recently, the HESS array has reported the detection of γ-ray emission
above a few hundred GeV from eight new sources located close to the Galactic
Plane. The source HESS J1834-087 is spatially coincident with SNR G23.3-0.3
(W41). Here we present MAGIC observations of this source, resulting in the
detection of a differential γ-ray flux consistent with a power law, described as
aUniversitat Wurzburg, D-97074 Wurzburg, Germany
bInstitut de Fısica d’Altes Energies, Edifici Cn., E-08193 Bellaterra (Barcelona), Spain
cETH Zurich, CH-8093 Switzerland
dUniversidad Complutense, E-28040 Madrid, Spain
eUniversitat Autonoma de Barcelona, E-08193 Bellaterra, Spain
fUniversitat Dortmund, D-44227 Dortmund, Germany
gMax-Planck-Institut fur Physik, D-80805 Munchen, Germany
hUniversita di Padova and INFN, I-35131 Padova, Italy
iUniversita di Udine, and INFN Trieste, I-33100 Udine, Italy
jUniversity of Lodz, PL-90236 Lodz, Poland
kYerevan Physics Institute, AM-375036 Yerevan, Armenia
lTuorla Observatory, FI-21500 Piikkio, Finland
mHumboldt-Universitat zu Berlin, D-12489 Berlin, Germany
nUniversity of California, Davis, CA-95616-8677, USA
oUniversita di Siena, and INFN Pisa, I-53100 Siena, Italy
pUniversita di Trieste, and INFN Trieste, I-34100 Trieste, Italy
qInstitute for Nuclear Research and Nuclear Energy, BG-1784 Sofia, Bulgaria
rOsservatorio Astronomico and INFN Trieste, I-34100 Trieste, Italy
sUniversita di Pisa, and INFN Pisa, I-56126 Pisa, Italy
tInstitut de Ciencies de l’Espai, E-08193 Bellaterra (Barcelona), Spain
uUniversitat de Barcelona, E-08028 Barcelona, Spain
vHavard-Smithsonian Center for Astrophysics, Cambridge, MA-02138
wdeceased
*correspondence: H. Bartko, [email protected]

– 3 –
dNγ/(dAdtdE) = (3.7 ± 0.6) × 10−12(E/TeV)−2.5±0.2 cm−2s−1TeV−1. We con-
firm the extended character of this flux. We briefly discuss the observational
technique used, the procedure implemented for the data analysis, and put this
detection in the perspective of the molecular environment found in the region
of W41. We present 13CO and 12CO emission maps showing the existence of a
massive molecular cloud in spatial superposition with the MAGIC detection.
Subject headings: gamma rays: observations, supernovae remnants
1. Introduction
In the Galactic Plane scan performed by the HESS Cherenkov array in 2004, with a
flux sensitivity of 3% Crab units for γ-rays above 200 GeV, eight sources were discovered
(Aharonian et al. 2005, 2006). One of the newly detected γ-ray sources is HESS J1834-
087 which is found to be, in projection, spatially coincident with SNR G23.3-0.3 (W41).
The possibility of a random correlation between the VHE source and SNR G23.3-0.3 was
estimated to be 6% for the central region of the Galaxy (Aharonian et al. 2005). The
high energy source could also be connected to the old pulsar PSRJ1833-0827 (Gaensler &
Johnston 1995), which would be energetic enough as to power HESS J1834-087. However, its
location at 24 arc minutes away from the center of HESS J1834-087, renders an association
unlikely (Aharonian et al. 2005, 2006). In addition, there is also no extended PWN detected
so far, whereas HESS J1834-087 has been found to be extended: A brightness distribution
ρ ∼ exp(−r2/2σ2) with a size σ = (0.09 ± 0.02)◦ has been reported by HESS (Aharonian
et al. 2006).
Here, we present observations of HESS J1834-087 with the Major Atmospheric Gamma
Imaging Cherenkov telescope (MAGIC). We briefly discuss the observational technique used
and the procedure implemented for the data analysis, derive a very high energy γ-ray spec-
trum of the source, and analyze it in comparison with other observations, including the
molecular environment found in the region of W41.
2. Observations
MAGIC (see e.g., Baixeras et al. (2004); Cortina et al. (2005) for a detailed description)
is the largest single dish Imaging Air Cherenkov Telescope (IACT) in operation. Located
on the Canary Island La Palma (28.8◦N, 17.8◦W, 2200 m a.s.l.), the telescope has a 17-m
diameter tessellated parabolic mirror, supported by a light weight space frame of carbon fiber

– 4 –
reinforced plastic tubes. It is equipped with a 576-pixel 3.5◦ field-of-view enhanced quantum
efficiency photomultiplier (PMT) camera. The analogue PMT signals are transported via
optical fibers to the trigger electronics and are read out by a 300 MSamples/s FADC system.
At La Palma, HESS J1834-087 culminates at about 37◦ zenith angle (ZA). This ZA
increases the energy threshold for MAGIC observations, but also, it provides a larger effective
collection area. The sky region around the location of HESS J1834-087 has a relatively high
and non-uniform level of background light. Within a distance of 1◦ from HESS J1834-087,
there are 3 stars brighter than 8th magnitude, with the star field being brighter in the
region NW of the source. MAGIC observations were carried out in the false-source tracking
(wobble) mode (Fomin et al. 1994). The sky directions (W1, W2) to be tracked are such that
in the camera the sky brightness distribution relative to W1 is similar to the one relative
to W2. The source direction is in both cases 0.4◦ offset from the camera center. These
two tracking positions are shown by white stars in figure 1. For each tracking position two
background control regions are used, which are located symmetrically to the source region
(denoted by the central white circle) with respect to the camera center. During wobble mode
data taking, 50% of the data is taken at W1 and 50% at W2, switching (wobbling) between
the 2 directions every 30 minutes. This observation mode allowed a reliable background
estimation least affected by the medium-scale ZA and the inhomogeneous star field. HESS
J1834-087 was observed for a total of 20 hours in the period August-September 2005 (ZA
≤ 45◦). In total, about 12 million triggers have been recorded.
3. Data Analysis
The data analysis was carried out using the standard MAGIC analysis and reconstruc-
tion software (Bretz & Wagner 2003), the first step of which involves the calibration of the
raw data (Gaug et al. 2005). It follows the general steps presented in (Albert et al. 2006a,b):
After calibration, image cleaning tail cuts of 10 photoelectrons (ph. el.) for image core pixels
and 5 ph. el. (boundary pixels) have been applied (see e.g. (Fegan 1997)). These tail cuts
are accordingly scaled for the larger size of the outer pixels of the MAGIC camera. The
camera images are parameterized by image parameters (Hillas 1985). In this analysis, the
Random Forest method (see Bock et al. (2004); Breiman (2001) for a detailed description)
was applied for the γ/hadron separation (for a review see e.g. Fegan (1997)) and the energy
estimation. For the training of the Random Forest a sample of Monte Carlo (MC) gener-
ated γ-showers (Majumdar et al. 2005) was used together with about 1% randomly selected
events from the measured wobble data. The MC γ-showers were generated between 35◦
and 45◦ ZA with energies between 10 GeV and 30 TeV with a SIZE distribution equal to

– 5 –
the one of the selected data events for the training. The source-position independent image
parameters SIZE, WIDTH, LENGTH, CONC (Hillas 1985) and the third moment of the
ph. el. distribution along the major image axis were selected to parameterize the shower
images. After the training, the Random Forest method allows to calculate for every event
a parameter, so-called hadronness, which is a measure of the probability that the event is
not γ-like. The γ-sample is defined by selecting showers with a hadronness below a specified
value. An independent sample of MC γ-showers was used to determine the cut efficiency.
The analysis at similar ZA angles was developed and verified using Crab nebula data
taken in September 2005, see also (Albert et al. 2006c). The Crab energy spectrum, as
determined by our studies, was consistent with measurements from other experiments (see
Fig. 4, dot-dashed line).
For each event the arrival direction of the primary γ-ray candidate in sky coordinates
is estimated using the DISP-method (Fomin et al. 1994; Lessard et al. 2001; Domingo-
Santamaria et al. 2005). A conservative lower SIZE cut of 200 ph. el. is applied to select
a subset of events with superior angular resolution. The corresponding analysis energy
threshold is about 250 GeV.
Figure 1 shows the sky map of γ-ray candidates (background subtracted, see e.g. (Rowell
2003)) from the direction of HESS J1834-087. It is folded with a two-dimensional Gaussian
with a standard deviation of 0.072◦ and a maximum of one. The MAGIC γ-ray PSF (stan-
dard deviation of a two dimensional Gaussian fit to the non-folded brightness profile of a
point source) is 0.1±0.01◦. The folding of the sky map serves to increase the signal-to-noise
ratio by smoothing out statistical fluctuations. However, it somewhat degrades the spatial
resolution. The sky map is overlayed with contours of 90 cm VLA radio data (green) from
White et al. (2005) (20 cm radio data from the same reference are overlayed in the following
figures) and 12CO emission contours from Dame et al. (2001) (black), integrated in the ve-
locity range 70 to 85 km/s, the range that best defines the molecular cloud associated with
W41. The MAGIC excess is centered at (RA, DEC)=(18h34m27s, -8◦42’40”). The statisti-
cal error is 0.5’, the systematic pointing uncertainty is estimated to be 2’ (see Bretz et al.
(2003)). A fit of a two dimensional Gaussian brightness profile to the non-folded sky map
yields after subtraction the MAGIC γ-ray PSF inquadrature an intrinsic source extension of
σ = (0.14±0.04)◦ (the extension reported by HESS is 0.09±0.02)◦ (Aharonian et al. 2006)).
Both, position and extension, coincide well with the shell-type SNR G23.3-0.3 (W41).
Figure 2 shows the distribution of the squared angular distance, θ2, between the re-
constructed shower direction and the excess center. The observed excess in the direction of
HESS J1834-087 has a significance of 8.6σ for θ2 ≤ 0.1deg2. Figure 3 shows images of HESS
J1834-087 with three different lower cuts on SIZE (200, 300, 600 ph.el), corresponding to

– 6 –
energy thresholds of about 250, 360 and 590 GeV. As in figure 1 the background subtracted
sky maps are folded with a two-dimensional Gaussian, but here the color scale shows directly
the excess significance. The total observed excess significance for θ2 ≤ 0.1deg2 (correspond-
ing to the sky region inside the central white circle of figure 1) are 8.6σ, 7.8σ and 7.3σ for
the three lower cuts on SIZE. Overlayed are contours of 20 cm VLA radio data from White
et al. (2005) (green) and 13CO emission contours (black) from Jackson et al. (2006). The
contours of the radio emission are at 0.0035 Jy/beam. The 13CO contours are integrated
from 70 to 85 km/s in velocity, as was the 12CO data in figure 1. For all three SIZE cuts the
MAGIC PSF is about 0.1◦, and the source position, extension and morphology stay roughly
constant. The characteristics of the MAGIC observation are compatible within errors with
the measurement of HESS (Aharonian et al. 2006).
For the spectral analysis a sky region of maximum angular distance of θ2 = 0.1deg2
around the excess center (indicated by the white circle in Figure 1) has been integrated.
Figure 4 shows the reconstructed very high energy γ-ray spectrum (dNγ/(dEγdAdt) vs. true
Eγ) of HESS J1834-087 after correcting (unfolding) for the instrumental energy resolution
(Anykeev et al. 1991). The horizontal bars indicate the bin size in energy, the marker is
placed in the bin center on a logarithmic scale. The full line shows the result of a forward
unfolding procedure: A simple power law spectrum is fitted to the measured spectrum
(dNγ/(dEγdAdt) vs. estimated Eγ) taking the full instrumental energy migration (true Eγ
vs. estimated Eγ) into account as described in Mizobuchi et al. (2005). The result is given
by (χ2/n.d.f = 7.4/7):
dNγ
dAdtdE= (3.7 ± 0.6) × 10−12
(
E
TeV
)−2.5±0.2
cm−2s−1TeV−1.
The quoted errors are statistical. The systematic error is estimated to be 35% in the flux
level determination and 0.2 in the spectral index, see also (Albert et al. 2006b). Within
the observation time (weeks) no flux variations exceeding the measurement errors have been
observed. Also, the flux is compatible within errors with the measurement of HESS made
one year earlier.
4. Discussion and concluding remarks
SNRs as gamma-ray sources have been extensively discussed in the past (e.g., see Torres
et al. 2003 for a review). Due to the spatial coincidence between the VHE γ-ray source and
the SNR G23.3-0.3 (W41), this SNR appears to be the natural candidate for generating the
– 7 –
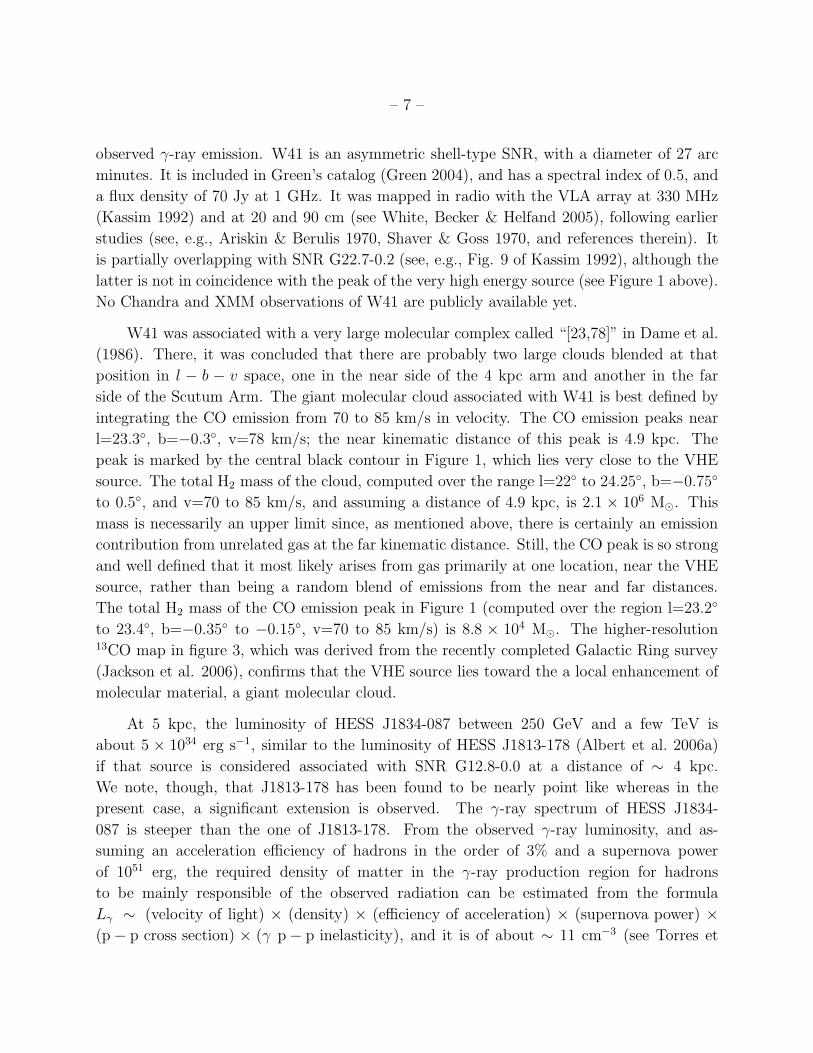
observed γ-ray emission. W41 is an asymmetric shell-type SNR, with a diameter of 27 arc
minutes. It is included in Green’s catalog (Green 2004), and has a spectral index of 0.5, and
a flux density of 70 Jy at 1 GHz. It was mapped in radio with the VLA array at 330 MHz
(Kassim 1992) and at 20 and 90 cm (see White, Becker & Helfand 2005), following earlier
studies (see, e.g., Ariskin & Berulis 1970, Shaver & Goss 1970, and references therein). It
is partially overlapping with SNR G22.7-0.2 (see, e.g., Fig. 9 of Kassim 1992), although the
latter is not in coincidence with the peak of the very high energy source (see Figure 1 above).
No Chandra and XMM observations of W41 are publicly available yet.
W41 was associated with a very large molecular complex called “[23,78]” in Dame et al.
(1986). There, it was concluded that there are probably two large clouds blended at that
position in l − b − v space, one in the near side of the 4 kpc arm and another in the far
side of the Scutum Arm. The giant molecular cloud associated with W41 is best defined by
integrating the CO emission from 70 to 85 km/s in velocity. The CO emission peaks near
l=23.3◦, b=−0.3◦, v=78 km/s; the near kinematic distance of this peak is 4.9 kpc. The
peak is marked by the central black contour in Figure 1, which lies very close to the VHE
source. The total H2 mass of the cloud, computed over the range l=22◦ to 24.25◦, b=−0.75◦
to 0.5◦, and v=70 to 85 km/s, and assuming a distance of 4.9 kpc, is 2.1 × 10⁶ M⊙. This
mass is necessarily an upper limit since, as mentioned above, there is certainly an emission
contribution from unrelated gas at the far kinematic distance. Still, the CO peak is so strong
and well defined that it most likely arises from gas primarily at one location, near the VHE
source, rather than being a random blend of emissions from the near and far distances.
The total H2 mass of the CO emission peak in Figure 1 (computed over the region l=23.2◦
to 23.4◦, b=−0.35◦ to −0.15◦, v=70 to 85 km/s) is 8.8 × 10⁴ M⊙. The higher-resolution13CO map in figure 3, which was derived from the recently completed Galactic Ring survey
(Jackson et al. 2006), confirms that the VHE source lies toward the a local enhancement of
molecular material, a giant molecular cloud.
At 5 kpc, the luminosity of HESS J1834-087 between 250 GeV and a few TeV is
about 5 × 1034 erg s−1, similar to the luminosity of HESS J1813-178 (Albert et al. 2006a)
if that source is considered associated with SNR G12.8-0.0 at a distance of ∼ 4 kpc.
We note, though, that J1813-178 has been found to be nearly point like whereas in the
present case, a significant extension is observed. The γ-ray spectrum of HESS J1834-
087 is steeper than the one of J1813-178. From the observed γ-ray luminosity, and as-
suming an acceleration efficiency of hadrons in the order of 3% and a supernova power
of 1051 erg, the required density of matter in the γ-ray production region for hadrons
to be mainly responsible of the observed radiation can be estimated from the formula
Lγ ∼ (velocity of light) × (density) × (efficiency of acceleration) × (supernova power) ×
(p − p cross section) × (γ p − p inelasticity), and it is of about ∼ 11 cm−3 (see Torres et

– 8 –
al. 2003 and references therein). With the extension of HESS J1834-087, and the gas mass
found to be in the innermost contour of the CO map, i.e., in close superposition with the very
high energy source, there is enough mass to generate the high energy radiation hadronically,
even if only part of the gas is interacting with the SNR shock.
All in all, the observation of HESS J1834-087 using the MAGIC Telescope confirms a
new very high-energy extended γ-ray source in the Galactic Plane. A reasonably large data
set was collected from observations at medium-scale zenith angles to infer the spectrum of
this source up to energies of a few TeV. Above 200 GeV, the differential energy spectrum
can be fitted with a power law of slope Γ = −2.5 ± 0.2. The results of the independent
observations of the HESS and MAGIC telescopes are in agreement within errors concerning
the level of flux, the spectral shape, the morphology, and the extension of the source. The
coincidence of the VHE γ-ray source with SNR G23.3-0.3 (W41) poses this SNR as a natural
counterpart, and although the mechanism responsible for the high energy radiation remains
yet to be clarified, a massive molecular cloud has been identified in the region.
We would like to thank the IAC for the excellent working conditions at the Observatory
de los Muchachos in La Palma. The support of the German BMBF and MPG, the Italian
INFN and the Spanish CICYT is gratefully acknowledged. This work was also supported by
ETH Research Grant TH 34/04 3 and the Polish MNiI Grant 1P03D01028. This paper is
dedicated to the memory of Nicolaj Pavel.
REFERENCES
Aharonian, F. et al., 2005, Science, 307, 1938.
Aharonian, F. et al., 2006, ApJ, 636, 777.
Albert, J. et al., 2006a, ApJ, 637, L41.
Albert, J. et al., 2006b, ApJ, 638, L101.
Albert, J. et al., 2006c, ApJ, 639, 761.
Anykeev, V. B., Spiridonov, A. A. & Zhigunov, V.B., 1991, Nucl. Instrum. Meth., A303,
350.
Ariskin V. I. & Berulis I. I., 1970, Soviet Astronomy, 13, 883.
Baixeras, C. et al., 2004, Nucl. Instrum. Meth., A518, 188.
Bock, R. K. et al., 2004, Nucl. Instrum. Meth., A516, 511.

– 9 –
Breiman, L., 2001, Machine Learning, 45, 5.
Bretz, T. et al. (MAGIC Collab.), 2003, Proc. of the 28th ICRC, Tsukuba, Japan, 2943.
Bretz, T. & R. Wagner (MAGIC Collab.), 2003, Proc. of the 28th ICRC, Tsukuba, Japan,
2947.
Cortina, J. et al. (MAGIC Collab.), 2005, Proc. of the 29th ICRC, Pune, India, 5-359,
astro-ph/0508274.
Dame, T. M., Elmegreen, B. G., Cohen, R. S. & Thaddeus, P., 1986, ApJ, 305, 892.
Dame, T. M., Hartmann, D. & Thaddeus, P., 2001, ApJ, 547, 792.
Domingo-Santamaria, E. et al. (MAGIC Collab.), 2005, Proc. of the 29th ICRC, Pune,
India, 5-363, astro-ph/0508274.
Fegan, D. J., 1997, J Phys G, 23, 1013.
Fomin, V. P. et al., 1994, Astroparticle Physics, 2, 137.
Gaensler, B. M. & Johnston, S., 1995, MNRAS, 275, L73.
Gaug, M. et al. (MAGIC Collab.), 2005, Proc. of the 29th ICRC, Pune, India, 5-375, astro-
ph/0508274.
Green, D. A., 2004, BASI, 32, 335G.
Hillas, A. M., 1985, Proc. of the 19th ICRC, La Jolla, 3, 445.
Jackson, J. M., et al. 2006, ApJ in press, astro-ph/0602160.
Kassim, N. E., 1992, AJ, 103, 943.
Lessard, R. W. et al., 2001, Astroparticle Physics, 15, 1.
Majumdar, P. et al. (MAGIC Collab.), 2005, Proc. of the 29th ICRC, Pune, India, 5-203,
astro-ph/0508274.
Mizobuchi, S. et al. (MAGIC Collab.), 2005, Proc. of the 29th ICRC, Pune, India, 5-323,
astro-ph/0508274.
Rowell, G. P., 2003, A&A, 410, 398.
Shaver P. A. & Goss W. M., 1970, AuJPA 14, 133.

– 10 –
Torres, D. F. et al., 2003, Phys. Rept., 382, 303.
White, R. L., Becker, R. H., & Helfand, D. J., 2005, AJ, 130, 586.
Wagner, R. et al. (MAGIC Collab.), 2005, Proc. of the 29th ICRC, Pune, India, 4-163,
astro-ph/0508244.
This preprint was prepared with the AAS LATEX macros v5.2.

– 11 –
l [deg]
b [
deg
]
-1.5
-1
-0.5
0
0.5
1
exce
ss e
ven
ts
-20
0
20
40
60
80
2222.52323.52424.5
PSF
Fig. 1.— Sky map of γ-ray candidate events (background subtracted) in the directions of
HESS J1834-087 for an energy threshold of about 250 GeV. The source is clearly extended
with respect to the MAGIC PSF. The two white stars denote the tracking positions in the
wobble mode. Overlayed are 12CO emission contours (black) from Dame et al. (2001) and
contours of 90 cm VLA radio data from White et al. (2005) (green). The 12CO contours
are at 25/50/75 K km/s, integrated from 70 to 85 km/s in velocity, the range that best
defines the molecular cloud associated with W41. The contours of the radio emission are at
0.04/0.19/0.34/0.49/0.64/0.79 Jy/beam, chosen for best showing both SNRs G22.7-0.2 and
G23.3-0.3 at the same time. Clearly, there is no superposition with SNR G22.7-0.2. The
central white circle denotes the source region integrated for the spectral analysis.

– 12 –
]2
[deg2θ0 0.05 0.1 0.15 0.2 0.25 0.3 0.35 0.4 0.45 0.5
]2
[deg2θ0 0.05 0.1 0.15 0.2 0.25 0.3 0.35 0.4 0.45 0.5
2ev
ents
/ 0.
01 d
eg
0
50
100
150
200
250
300
350
400
4501834 ONOFF data
J 1834-087August/September 2005observation time: 20 hzenith angle: 37-44 degexcess 570 events
σsignificance 8.6
Fig. 2.— Distributions of θ2 values for the source (full circles) and background control region
(shaded histogram), see text, for an energy threshold of about 250 GeV. It is seen also here
that the source is clearly extended with respect to the MAGIC PSF (σ2 ∼ 0.01deg2).

– 13 –
l [deg]
b [
deg
]
-1
-0.5
0
0.5
-1
0
1
2
3
22.52323.524l [deg]
b [
deg
]-1
-0.5
0
0.5
-1
0
1
2
3
22.52323.524l [deg]
b [
deg
]
-1
-0.5
0
0.5
sig
nif
ican
ce
-1
0
1
2
3
22.52323.524
Fig. 3.— Morphology of HESS J1834-087 above three different lower cuts in SIZE (200, 300,
600 ph.el.), corresponding to energy thresholds of 250, 360, 590 GeV. The color scale shows
the excess significance. Overlayed are contours of 20 cm VLA radio data from White et al.
(2005) (green) and 13CO emission contours (black) from Jackson et al. (2006). The contours
of the radio emission are at 0.0035 Jy/beam. The 13CO contours are at 10/20/30 K km/s,
integrated from 70 to 85 km/s in velocity, as was the 12CO data in figure 1. The white circle
indicates the MAGIC PSF which is about 0.1 deg for all three lower SIZE cuts.

– 14 –
E [GeV]10
210
3
E [GeV]10
210
3
]-2
cm
-1 s
-1/d
E d
A d
t [T
eVγ
dN
10-13
10-12
10-11
10-10
10-9
10-8
Crab, MAGIC
J 1834, MAGIC
J 1834, HESS
J 1834-087August/September 2005
observation time: 20 h
zenith angle: 37-44 deg
Fig. 4.— VHE γ-ray spectrum of HESS J1834-087 (statistical errors only). The solid line
shows the result of a power-law fit to the data points. The dotted line shows the result of
the HESS collaboration (Aharonian et al. 2006). The dashed line shows the spectrum of the
Crab nebula as measured by MAGIC (Wagner et al. 2005).