Embed Size (px)
Citation preview
Objective quality of multimedia
Multimeedia objektiivne kvaliteet
IRT0180
Marika Kulmar
1

Layered Model for QoSQoE (user-level QoS) is obtained from subjective test, where human viewers evaluate the quality of tested videos under a laboratory environment.
To avoid high cost and offline nature of such tests, objective quality models are developed to predict QoE based on objective QoSparameters
QoS – teenuse kvaliteet
QoE – tunnetatav kvaliteet
2
Quality of
Experience
Quality of
Service
Source: K. Nahrstedt

Audio quality assessmentSound quality, speech quality
3

Human auditory system (HAS)
4
Source: Kollmeier, B. (2005)

Audio quality assessment types
5Source: Zheng, Jia; Zhu, Mengyao; Song, Yao (2012)
Intrude - sekkuma
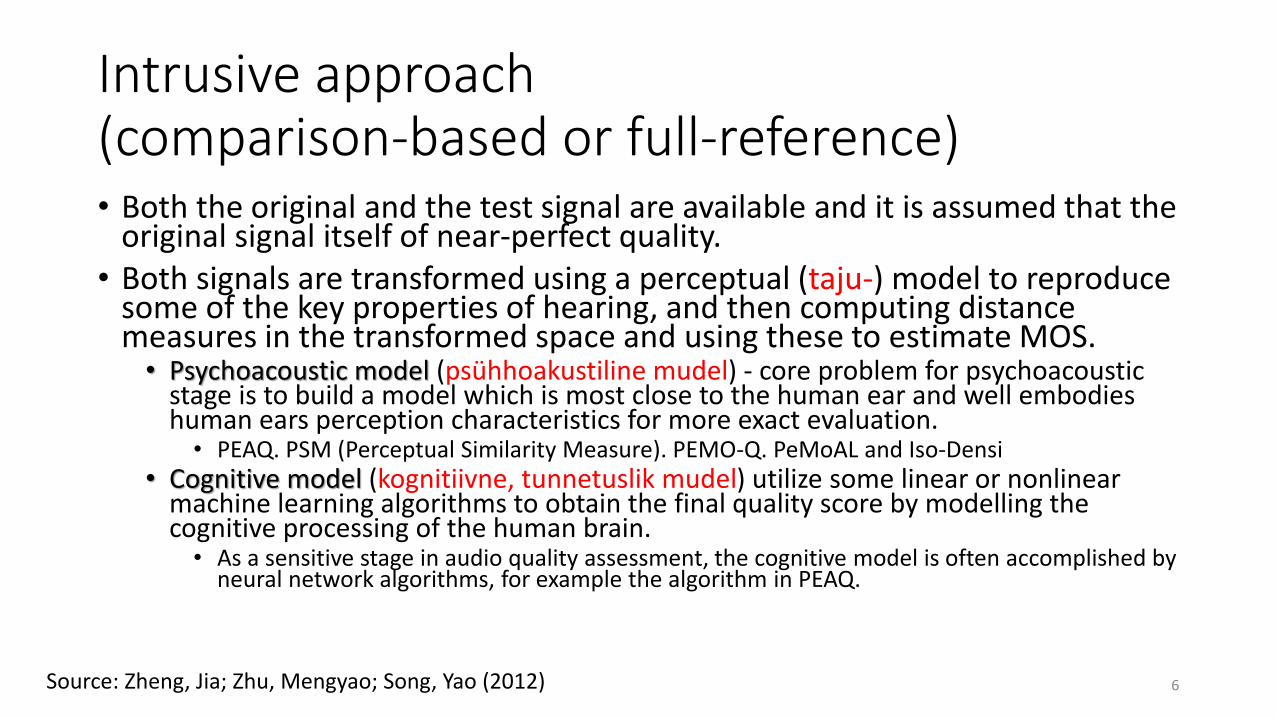
Intrusive approach(comparison-based or full-reference)• Both the original and the test signal are available and it is assumed that the
original signal itself of near-perfect quality.• Both signals are transformed using a perceptual (taju-) model to reproduce
some of the key properties of hearing, and then computing distance measures in the transformed space and using these to estimate MOS. • Psychoacoustic model (psühhoakustiline mudel) - core problem for psychoacoustic
stage is to build a model which is most close to the human ear and well embodies human ears perception characteristics for more exact evaluation.• PEAQ. PSM (Perceptual Similarity Measure). PEMO-Q. PeMoAL and Iso-Densi
• Cognitive model (kognitiivne, tunnetuslik mudel) utilize some linear or nonlinear machine learning algorithms to obtain the final quality score by modelling the cognitive processing of the human brain. • As a sensitive stage in audio quality assessment, the cognitive model is often accomplished by
neural network algorithms, for example the algorithm in PEAQ.
6Source: Zheng, Jia; Zhu, Mengyao; Song, Yao (2012)

Non-intrusive approach (in development)
• Audio• fuzzy logic-based metric FQI (Fuzzy Quality Index) (hägusal loogikal põhinev meetrika);
spectro-temporal modulation analysis of spectrogram
• Speech• PLP(Perceptual Linear Predictive) model• An output based speech quality evaluation by MPSDD (measuring perceptual spectral density
distribution) algorithm for evaluating quality by spectral distribution. • HMM (Hidden Markov Models), VQ (Vector Quantization) based on statistical probability• GMM (Gaussian-mixture probability models) that serve as artificial reference models of clean
speech behavior – based on distortion spectral measures.• Vocal tract model like P.563 is also a very important representative in the nonintrusive
methods for speech. • Other novel approaches, such as ANQUE and ANQUE+ model, don't use the source speech
information at all while other models need artificial reference signal or codebook representations. All these work plays a great role in promoting the development of non-intrusive audio quality.
7Source: Zheng, Jia; Zhu, Mengyao; Song, Yao (2012)

Basic evaluation theory frame of audio quality assessmentIt is not only the fundamental pattern of the quality evaluation work which has been carried out, but also the guidelines of the future trend on this research domain.
Eeltöötluse etapp->
tunnetatava kuulmise töötlus ->
kvaliteedi esitamise teisendus->
tunnetusliku otsustamise etapp.
8Source: Zheng, Jia; Zhu, Mengyao; Song, Yao (2012)

Quality of sound
9
Qualityof
sound
Qualityof
speech
Qualityof
audio
Subjectivetesting
Objectivetesting
Objectivetesting
Subjectivetesting
Non-intrusivetesting
No referencesignal

Quality evaluation of speech, subjectivetesting• Standardized in ITU-T P.800.1
• absolute category rating (ACR) –“What is your opinion on the quality of speech?” – average MOS.
• degradation category rating (DCR) - degraded signal immediately follows the original version. Compare the quality of the second speech sample with respect to the first one: from 1 (“annoyingly degraded”) to 5 (“inaudibly degraded”)
• comparative category rating (CCR) - the order of degraded and original signalis random. Compare the quality of the second speech sampli with respect to the firstone: from –3 (“much worse”) to +3 (“much better”) in the CCR.
10Source: de Lima et al (2008)
MOS scale
MOS Quality
5 Excellent
4 Good
3 Fair
2 Poor
1 Bad

Quality evaluation of speech, objectivetesting• Standard ITU-T P.862 • perceptual evaluation of speech quality (PESQ) method• composed by three successive stages:
• Pre-processing - level alignment, filtering, and time alignment of the reference and degraded signals. These procedures improve correlation of both signals, assuring a fairer comparison of their pre-processed versions.
• perceptual modeling - time-frequency mapping, frequency warping, and loudness mapping to emulate processing performed by the human hearing system on both signals.
• cognitive modeling - determines two measures of noise disturbance which are combined to generate the PESQ score between the two speech signals.
• PESQ method is suited for 300-3400 Hz telephone signals. • Wideband PESQ (W-PESQ), ITU-T P.862.2, for wideband audio systems 50-
7000 Hz.
11Source: de Lima et al (2008)

Quality evaluation of speech, non-intrusivetesting• No reference. Based solely on the corrupted signal.
• Standard ITU-T P.563. Implemented in three stages: • Pre-processing - normalizes the signal level, filters the input signal imposing a frequency
response similar to a telephone terminal, and detects intervals of silence, to discriminate speech from noise frames.
• distortion estimation - is performed by three parallel blocks. 1. employs a tube model for the human vocal track and detects speech distortion by identifying
unacceptable variations in the tube structure.2. performs signal reconstruction to allow a PESQ-like procedure to evaluate speech degradation.3. estimates specific degradations such as robotization and additive noise.
• and perceptual mapping - compares the three outputs from the previous stage to previously set thresholds for each type of disturbance. The significant distortions are then weighted together to determine an overall level of quality for the signal at hand.
• Despite its non-intrusive nature, P.563 results are highly correlated to subjective MOS levels
12Source: de Lima et al (2008)

Quality evaluation of audio, subjective testing
• ITU-R BS.1116 method targets small impairments.• at least 20 expert listeners, who are presented to triads (A,B,C) of signals: A is the
reference signal, B and C are either the signal under test or an identical copy of A. Listeners grade the impairments of B and C against A, according to a continuous scale from 1 (‘very annoying’) to 5 (‘imperceptible’).
• The corresponding subjective difference grade (SDG), ranging from ―4 to 0, between the test and reference signals can also be defined. The number of different triads should be made 1.5 times the number of systems, but at least 5.
• ITU-R BS.1534 • at least 20 experienced listeners. They are presented the reference signal and a set
containing a maximum of 15 unidentified versions of it, including the original and a lowpass version.
• Listeners grade the impairments of each signal in the test set against the reference, using a continuous scale from 0 to 100, divided into five equal intervals, ranging from ‘bad’ to ‘excellent’.
13Source: de Lima et al (2008)

Quality evaluation of audio, objective testing
• ITU-R BS.1387 - perceptual evaluation of audio quality (PEAQ) method, is described in two versions: Basic (less complex, for real-time applications) and advanced (a more complex, but more accurate procedure).
• Method receives at its inputs both the reference and the signal under test in stereo 16-bit PCM at 48 kHz, pre-aligned in time.
• The algorithm performs level adjustment of both signals, and maps them into a time-frequency domain. • In a warped frequency scale, based on auditory critical bands, a perceptual model (including hearing
threshold, masking etc.) is computed for each signal.• These models are pre-processed and then mutually compared under several criteria, yielding the so-called set
of model output variables (MOVs). • These features are input to a neural network with predefined weights, which delivers an objective difference
grade (ODG) between 0 (‘imperceptible impairment’) and −4 (‘very annoying impairment’) that is expected to emulate the subjective difference grade (SDG). Their reported correlation is stronger than 0.85.
• An arguable issue in PEAQ is the pre-trained neural network. It implies some specialization on the (coded) signals included in the training set. Moreover, defects ‘unknown’ to the net can yield unexpected results, thus preventing the use of the method for other impairments than coding artifacts.
14Source: de Lima et al (2008)

Audio, objective
• PEAQ Recommendation ITU-R BS.1387-1, 2001
• PEMO-Q
• perceptual similarity measure (PSM).
15Source: Huber, R.; Kollmeier, B. (2006)

Sources and further reading
• Huber, R.; Kollmeier, B. (2006) PEMO-Q - A New Method for Objective Audio Quality Assessment Using a Model of Auditory Perceptionhttp://ieeexplore.ieee.org/xpls/icp.jsp?arnumber=1709880
• Kollmeier, B. (2005)Auditory models for audio processing - beyond the current perceived quality?http://ieeexplore.ieee.org/xpls/icp.jsp?arnumber=1540199
• de Lima, A. A.; Freeland, F. P.; de Jesus, R. A.; Bispo, B. C.; Biscainho, L. W. P.; Netto, S. L.; Said, A.; Kalker, A.; Schafer, R.; Lee, B.; Jam, M. (2008) On the quality assessment of sound signalshttp://ieeexplore.ieee.org/xpls/icp.jsp?arnumber=4541443
• Zheng, Jia; Zhu, Mengyao; Song, Yao (2012). On objective assessment of audio quality — A review. http://ieeexplore.ieee.org/xpls/icp.jsp?arnumber=6376719
16

Video quality assessmentDigital video and/or still image
17

Video transmission path
18Source: Yanjiao Chen; Kaishun Wu; Qian Zhang. 2015

Typical visual distortions
• Blocking effect (ruudud) - discontinuity at the boundaries of two adjacent blocks. The reason is that the video coding is block-based, that is, individual blocks are coded separately, resulting in different types and levels of coding errors.
• Blurring (hägustatud) - loss of spatial information or edge sharpness, especially for roughly textured areas or around scene object edges.
• Edginess (ääred) - distortions happened at the edges of an image. The differences between the edge characteristics of the original video and those of the distorted video are often given special attention.
• Motion jerkiness (jõnksuline liikumine) - time-discrete intermission of the original continuous, smooth scene. This often happens due to delay variance (also known as “jitter”).
19Source: Yanjiao Chen; Kaishun Wu; Qian Zhang. 2015
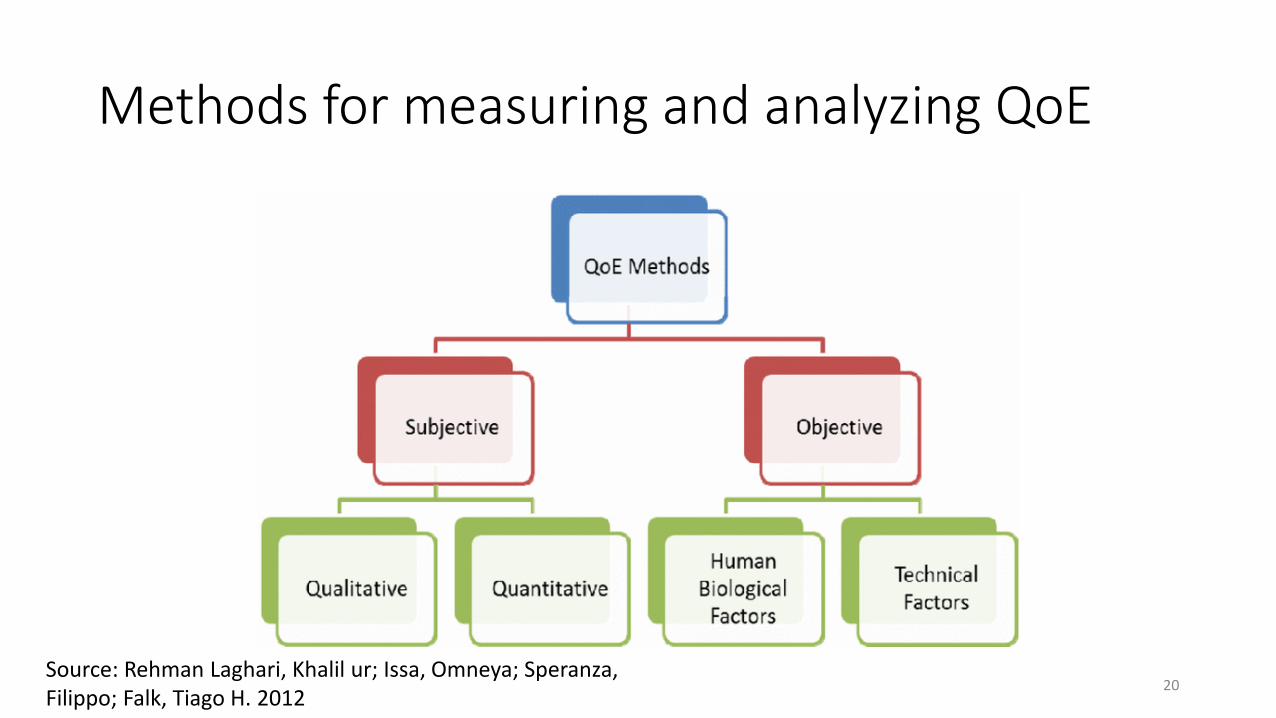
Methods for measuring and analyzing QoE
20Source: Rehman Laghari, Khalil ur; Issa, Omneya; Speranza, Filippo; Falk, Tiago H. 2012

Subjective QoE Assessment Methods
• Qualitative technique – human perceptions, feelings and opinions through verbal behavior.• The most meaningful metric for the analysis of verbal behaviors is the ratio of
positive to negative comments and it is also commonly known as CCA (catalog, categorize, analyze) framework. CCA categories the ratio of positive to negative comments and produces results in histogram formats and is explored here as a qualitative analysis technique.
• Quantitative Technique - numbers and statistics. • These methods typically involve the construction of questionnaire with rating
scales to produce quantitative data. • ITU-T Recommendation P.910 for video quality, P.800 for speech quality, and
G.1030 for web traffic quality.
21Source: Rehman Laghari, Khalil ur; Issa, Omneya; Speranza, Filippo; Falk, Tiago H. 2012

Objective QoE Assessment Methods
• QoS and Technology centric techniques - QoE is predicted from QoS data using some mathematical estimation techniques • The most popular are objective methods for the measurement of picture quality.
• PSNR, SSIM, VQM (all FR methods).
• Physiological and cognitive techniques - The human brain is the epicenter of every human action. • electroencephalography (EEG), magnetoencephalography (MEG) - measuring the
electrical/magnetic activity in the brain. Provide data with high time resolution (in the order of milliseconds), but limited spatial resolution.
• functional magnetic resonance imaging (fMRI), and near-infrared spectroscopy (NIRS) - based on tracking blood flow (and correlates) that accompanies neuronal activity. Provide good spatial resolution but relatively poor temporal resolution.
22Source: Rehman Laghari, Khalil ur; Issa, Omneya; Speranza, Filippo; Falk, Tiago H. 2012

Categories of quality assesment methods and metrics (both subjective and objective)Depending on the information that is made available to the algorithm:
• Full-reference (FR) algorithm has access to and makes use of the original reference sequence for a comparison. The highest accuracy and repeatability but tend to be processing intensive.
• Reduced reference (RR) algorithm uses parameters that are extracted at the sending side which help predicting the quality at the receiving side. Reduced accuracy and represent a working compromise if bandwidth for the reference signal is limited.
• No reference (NR) algorithm only uses the degraded signal for the quality estimation and has no information of the original reference sequence. Low accuracy estimates, only, as the originating quality of the source reference is completely unknown. • A common variant of NR algorithms don't even analyze the decoded video on a pixel level but
work on an analysis of the digital bit stream on an IP packet level, only.
23

Quality assessment
Subjective methods• Individual interests of the viewer;
• Quality expectations of the viewer;
• Video experience of the viewer, which also determines quality expectations;
• Display type (CRT, LCD, etc.) and properties (size, resolution, brightness, contrast, color, response time);
• Viewing setup and conditions;
• Quality and synchronization of the accompanying audio;
• Interaction with the service or display device (e.g. zap time, remote control, electronic program guide).
Objective metrics
• Objective quality metrics are algorithms designed to characterize the quality of video and predict viewer MOS.
24

Subjective video quality assessment methods
• Mean Opinion Score (MOS)• The MOS is the arithmetic mean of all
the individual scores, and can range from 1 (worst) to 5 (best).
• Used in audio and video tests
• Perceptual Evaluation of Video Quality (PEVQ, ITU-T J.247)• PEVQ is full-reference algorithm and
analyzes the picture pixel-by-pixel after a temporal alignment (also referred to as 'temporal registration') of corresponding frames of reference and test signal. PEVQ MOS results range from 1 (bad) to 5 (excellent).
Mean opinion score (MOS)
MOS Quality Impairment
5 Excellent Imperceptible
4 GoodPerceptible but not annoying
3 Fair Slightly annoying
2 Poor Annoying
1 Bad Very annoying
25

Subjective test suffers from three major drawbacks. • high cost in terms of time, money, and manual effort.
• subjective test is conducted in the laboratory environment, with limited test video types, test conditions, and viewer demography. Therefore, the results may not be applicable to video quality assessment in the wild.
• subjective test cannot be used for real-time QoE evaluation.
26

Classification of Objective quality metrics
• Data metrics - measure the fidelity of the signal without considering its content. (MSE, PSNR)
• Picture metrics - treat the video data as the visual information that it contains.• vision modeling approach – based on human visual system (HVS). Examples: Visual
Differences Predictor (VDP), JND (just noticeable differences), Picture Quality Metric(MPQM), perceptual distortion metric (PDM). Years 1970-1980.
• engineering approach - based primarily on the extraction and analysis of certain features or artifacts in the video. Examples Structural Similarity (SSIM), Pinson and Wolf's VQM video quality metric.
• Packet- or bitstream-based metrics - look at the packet header information and the encoded bitstream directly without fully decoding the video.
27Source: Winkler, S.; Mohandas, P., 2008
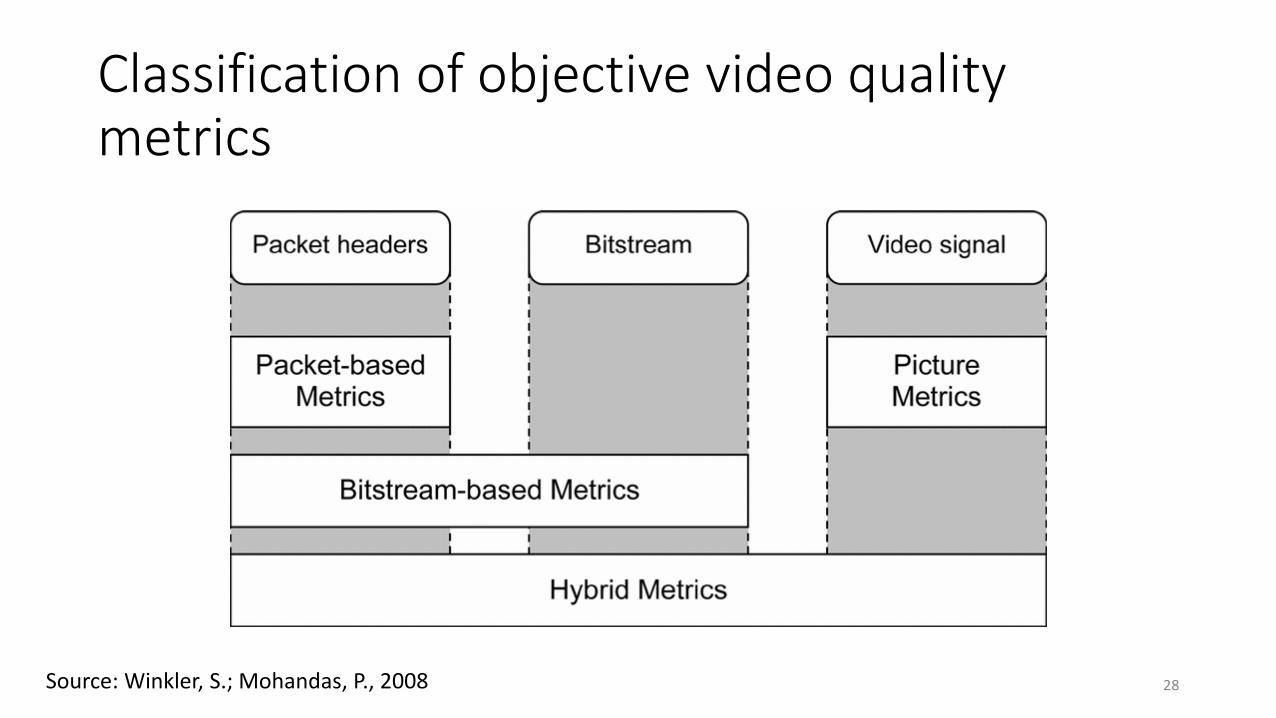
Classification of objective video qualitymetrics
28Source: Winkler, S.; Mohandas, P., 2008

Classification of no-reference methods of objective video quality metrics• No-Reference Methods (NR): assess the quality of a distorted video
without any reference to the original signal. They are less accurate than FR or RR approaches, but are more efficient to compute. • Pixel-Based Methods (NR-P): use a decoded representation of the signal and
analyze the quality based on the pixel information. They typically evaluate specific degradation types only, such as blurring or other coding artifacts.
• Parametric/Bitstream Methods (NR-B): make use of features extracted from the transmission container and/or video bitstream, e.g. MPEG-TS packet headers, motion vectors and quantization parameters.
• Hybrid Methods (Hybrid NR-P-B): Hybrid metrics combine parameters extracted from the bitstream with a decoded video signal.
29

Classification of objective quality measurementmethods by the type of input data being used(ITU)• Media-layer models — speech or video signal to compute the QoE. These models
do not require any information about the system under testing, hence can be best applied to scenarios such as codec comparison and codec optimization.
• Parametric packet-layer models — predict the QoE only from the packet-header information and do not have access to media signals. But this forms a lightweight solution for predicting QoE as it does not have to process the media signals.
• Parametric planning models — use quality planning parameters for networks and terminals to predict the QoE. As a result they require a priori knowledge about the system that is being tested.
• Bitstream-layer models — encoded bitstream information and packet-layer information that is used in parametric packet-layer models for measuring QoE.
• Hybrid models — combine two or more of the preceding models.
30Source: Chikkerur, S.; Sundaram, V.; Reisslein, M.; Karam, L.J., 2011

MethodsObjective image/video quality assessment
32

mean square error (MSE)
• The mean squared error (MSE) of an estimator measures the average of the squares of the "errors", that is, the difference between the estimator and what is estimated.
33

peak signal-to-noise ratio (PSNR)
• peak signal-to-noise ratio (PSNR) is the simplest and most common FR objective measurement method. It is mostly used with encoded signals and it is based on the mathematical difference between every pixel of the processed video and the original video
• PSNR is most easily defined via the mean squared error (MSE). Given a noise-free m×n monochrome image I and its noisy approximation K, MSE is defined as:
• The PSNR (in dB) is defined as:
34Source: Wikipedia

PSNR (cont.)
• Here, MAXI is the maximum possible pixel value of the image. When the pixels are represented using 8 bits per sample, this is 255.
• More generally, when samples are represented using linear PCM with B bits per sample, MAXI is 2B−1.
• For color images with three RGB values per pixel, the definition of PSNR is the same except the MSE is the sum over all squared value differences divided by image size and by three.
• Alternately, for color images the image is converted to a different color space and PSNR is reported against each channel of that color space, e.g., YCbCr or HSL.
• Typical values for the PSNR in lossy image and video compression are between 30 and 50 dB, provided the bit depth is 8 bits, where higher is better.
• For 16-bit data typical values for the PSNR are between 60 and 80 dB. Acceptable values for wireless transmission quality loss are considered to be about 20 dB to 25 dB.
• In the absence of noise, the two images I and K are identical, and thus the MSE is zero. In this case the PSNR is infinite (or undefined).
35
structural similarity index (SSIM)
• FR metric, SSIM is designed to improve on traditional methods such as peak signal-to-noise ratio (PSNR) and mean squared error (MSE), which have proven to be inconsistent with human visual perception. These approaches estimate absolute errors.
• SSIM is a perception-based model that considers image degradation as perceived change in structural information, while also incorporating important perceptual phenomena, including both luminance masking and contrast masking terms. • Structural information is the idea that the pixels have strong inter-dependencies especially when
they are spatially close. These dependencies carry important information about the structure of the objects in the visual scene.
• Luminance masking is a phenomena whereby image distortions (in this context) tend to be less visible in bright regions,
• while contrast masking is a phenomena whereby distortions become less visible where there is significant activity or "texture" in the image.
• SSIM is designed to measure the quality of still images. However, SSIM is heavily used to conduct video quality assessment, including throughout the Television industry, because of its excellent performance and efficiency.
37

video quality metric (VQM)
• Well-known FR method • Developed by the Institute for Telecommunications Sciences, National
Telecommunications and Information Administration (TIS/NTIA). • Standardized by the American National Standards Institute and adopted in
two ITU Recommendations, namely ITU-T J.144 and ITU-R BT.1683.• Each VQM tool estimates how people perceive video quality. These VQM
algorithms compare the processed video (output) with the original video (input). These models are suitable when the original video is good quality or better. Quality problems from the camera and original production are not considered.
• http://www.its.bldrdoc.gov/resources/video-quality-research/guides-and-tutorials/description-of-vqm-tools.aspx
38
Sources and further reading
• Chikkerur, S.; Sundaram, V.; Reisslein, M.; Karam, L.J. (2011) Objective Video Quality Assessment Methods: A Classification, Review, and Performance Comparison. http://ieeexplore.ieee.org/xpls/icp.jsp?arnumber=5710601
• Rehman Laghari, Khalil ur; Issa, Omneya; Speranza, Filippo; Falk, Tiago H. (2012) Quality-of-Experience perception for video streaming services: Preliminary subjective and objective resultshttp://ieeexplore.ieee.org/xpls/icp.jsp?arnumber=6411949
• Winkler, S.; Mohandas, P. (2008) The Evolution of Video Quality Measurement: From PSNR to Hybrid Metrics http://ieeexplore.ieee.org/xpls/icp.jsp?arnumber=4550731
• Yanjiao Chen; Kaishun Wu; Qian Zhang. (2015) From QoS to QoE: A Tutorial on Video Quality Assessment http://ieeexplore.ieee.org/xpls/icp.jsp?arnumber=6933929
• https://en.wikipedia.org/wiki/Peak_signal-to-noise_ratio
• https://en.wikipedia.org/wiki/Structural_similarity
• Video Quality Experts Group (VQEG) http://www.its.bldrdoc.gov/vqeg/vqeg-home.aspx• Test videos ftp://vqeg.its.bldrdoc.gov/MM/
42

Audiovisual quality
• In actual lip-sync experiments true to their name (showing content with a human speaker), viewers perceive audio and video to be in sync up to about 80 ms of delay.
• There is a consistently higher tolerance for video ahead of audio rather than vice versa, probably because this is also a more natural occurrence in the real world (light travels faster than sound).
• Similar results were obtained in experiments with non-speech clips showing a drummer; the same study found the noticeable delay to decrease with drumming frequency.
43Source: Winkler, S.; Mohandas, P. 2008

McGurk Effect
• How the eyes and ears work together to understand speech. This is called audiovisual perception or cross-modal perception.
• Audio of a woman saying "ba ba ba" has been dubbed over the picture of that woman saying "da da da".
• Your perception of what she is saying changes as you open and close your eyes.
• http://video.its.bldrdoc.gov/videos/mcgurk/
• https://www.youtube.com/watch?v=G-lN8vWm3m0 [BBC]
44