Embed Size (px)
Citation preview

Received: March 10, 2015Revision received: December 22, 2015Accepted: February 8, 2016OnlineFirst: April 20, 2016
Copyright © 2016 EDAMwww.estp.com.tr
DOI 10.12738/estp.2016.3.0429 June 2016 16(3) 987-1003
Research Article
KURAM VE UYGULAMADA EĞİTİM BİLİMLERİ EDUCATIONAL SCIENCES: THEORY & PRACTICE
Citation: Haciomeroglu, E. S. (2016). Object-spatial visualization and verbal cognitive styles, and their relation to cogni-tive abilities and mathematical performance. Educational Sciences: Theory & Practice, 16, 987-1003.
1 Correspondence to: Erhan Selcuk Haciomeroglu (PhD), School of Teaching, Learning, and Leadership, University of Central Florida, 4000 Central Florida Blvd. Education Complex ED 123-H Orlando, FL 32816-1250, USA. Email: [email protected] & [email protected]
Abstract
The present study investigated the object-spatial visualization and verbal cognitive styles among high
school students and related differences in spatial ability, verbal-logical reasoning ability, and mathematical
performance of those students. Data were collected from 348 students enrolled in Advanced Placement
calculus courses at six high schools. Correlational analysis revealed that spatial ability, verbal-logical
reasoning ability, and mathematical performance were significantly correlated with each other. High spatial
visualizers had significantly higher spatial ability and mathematical performance scores than high object
visualizers. No significant differences were found between verbalizers and high spatial visualizers in their
verbal-logical reasoning ability and mathematical performance scores. Results provide support for the
existence of two contrasting groups of visualizers with respect to their spatial ability.
Keywords
Visualization • Cognitive style • Cognitive ability • Mathematical performance • Calculus
Erhan Selcuk Haciomeroglu1
University of Central Florida
Object-spatial Visualization and Verbal Cognitive Styles, and Their Relation to Cognitive Abilities and
Mathematical Performance

988
EDUCATIONAL SCIENCES: THEORY & PRACTICE
The visualizer-verbalizer cognitive style dimension has been of considerable interest to researchers for many years. In these studies, students were identified as either visualizers or verbalizers, and significant differences favoring verbalizers were found in cognitive abilities and mathematical performance. Kozhevnikov, Hegarty, and Mayer (2002) and Kozhevnikov, Motes, and Hegarty (2007) have provided evidence for two distinct groups of visualizers—object and spatial visualizers—who process visual-spatial information and graphic tasks in different ways and further explained why the visualizer-verbalizer classification led to inconsistent findings in previous research studies. Thus, the purpose of this study was to examine differences in cognitive abilities and mathematical performance of high school students related to differences in their object-spatial visualization and verbal cognitive styles.
Visualizer-verbalizer Cognitive StyleThe lack of a relationship between self-reports of visual-verbal cognitive style
and both cognitive abilities and mathematical performance has been reported in the literature (e.g., Hegarty & Kozhevnikov, 1999; Lean & Clements, 1981). Researchers (e.g., Bishop, 1983, 1989; Dean & Morris, 2003; Guay, McDaniel, & Angelo, 1978; Krutetskii, 1976; Lohman, 1979; McAvinue & Robertson, 2006–2007; Presmeg, 2006) have presented hypotheses to account for the lack of a relationship between self-reports of the visual cognitive style and spatial ability: (a) Self-report instruments are not reliable and have poor predictive validity; (b) Spatial ability tests are susceptible to alternative solutions and often measure different abilities for different people; (c) Individuals who have the ability to generate and manipulate visual images might prefer not to do so when the use of visual processes is not required; (d) Items of spatial ability tests and self-report instruments measure different properties and processes of visual imagery. However, Kozhevnikov, Hegarty, and Mayer (2002) and Kozhevnikov, Kosslyn, and Shepard (2005) pointed to the visualizer-verbalizer classification as a factor that has led to inconsistent results in previous studies. According to Kozhevnikov and her associates, visualizers are not a homogenous group with respect to their spatial ability but rather consist of two distinct groups—object and spatial visualizers—who differ in processing visual-spatial information and graphic tasks, and thus, significant relationships can be found between visual cognitive style, spatial ability, and mathematical performance if visualizers are divided into these two distinct groups.
Some individuals use object imagery to construct detailed images of objects, which hinder effective spatial transformations and successful performance on spatial and mathematical tasks. Others use spatial imagery to create images representing spatial relations among objects, which facilitates efficient spatial transformations and successful performance on spatial and mathematical tasks. Object imagery

989
Haciomeroglu / Object-spatial Visualization and Verbal Cognitive Styles, and Their Relation to Cognitive...
characterizes color, vividness, shapes, or details of objects, whereas spatial imagery depicts spatial locations or relations between objects. When presented with the graph of a function and asked to draw the derivative graph, object and spatial visualizers used distinct strategies to interpret the graphs of functions. For instance, object visualizers constructed detailed images of slopes of tangent lines, but failed to transform them into derivative graphs, but spatial visualizers were able to visualize the changing slope of tangent lines as well as transform them into derivative graphs (Haciomeroglu, 2015; Haciomeroglu, Aspinwall, & Presmeg, 2010).
Recent research studies (e.g., Thomas & McKay, 2010; Pitta-Pantazi & Christou, 2010) have also provided support for the distinction between object and spatial imagery cognitive styles. In their studies with prospective teachers, Delice and Sevimli (2010) and Sevimli and Delice (2011a; 2011b; 2011c; 2012) developed case studies to examine students’ preferences for representations as they attempted to evaluate definite integrals presented in different representations. They observed that the participants relied heavily on algebraic representations to evaluate definite integrals and that their solution strategies differed from their preferences for representations. Similarly, Haciomeroglu (2015) and Haciomeroglu, Haciomeroglu, Bukova-Guzel, and Kula (2014) examined calculus students’ preferred mode of processing. They concluded that cognitive abilities and preference did not correspond and that the students demonstrated strong preference for verbal (or analytic) processing.
Mathematical Performance, Cognitive Ability, and Preference for Visual or Verbal Processing
Krutetskii (1976) identified types of mathematical giftedness based on students’ preferences for visual-pictorial or verbal-logical processing. According to Krutetskii, the level of mathematical giftedness is determined largely by the verbal-logical component of thinking, and the type of mathematical giftedness (i.e., visual-pictorial, verbal-logical, and harmonic) is determined largely by the strength of, and preference for, the visual-pictorial component of thinking. This assertion was supported by the findings of Suwarsono (1982) who concluded that verbal reasoning was the most significant predictor of mathematical performance of 7th grade students. Further, it was found that preference for visual processing did not correlate with mathematical performance, spatial ability, and verbal reasoning ability. Hegarty and Kozhevnikov (1999), with 6th grade students, also found that preference for visual processing did not correlate with mathematical performance, spatial ability, verbal ability, and nonverbal reasoning ability. They concluded that object visualizers generated pictorial representations of word algebra problems and tended to have low spatial ability, and spatial visualizers generated spatial representations of algebra word problems and tended to have high spatial ability. Additionally, Lean and Clements

990
EDUCATIONAL SCIENCES: THEORY & PRACTICE
(1981) concluded that preference for visual processing was negatively correlated with both spatial ability and mathematical performance and that verbalizers outperformed visualizers on both spatial ability and mathematical tests.
Not all research, however, supports a relationship between verbal processing and mathematical performance. In particular, the findings of the studies by Bremigan (2005), Ferrini-Mundy (1987), and Haciomeroglu, Chicken, and Dixon (2013) appear to be in direct conflict with those of Lean and Clements (1981) and Hegarty and Kozhevnikov (1999). Notably, they concluded that spatial visualization ability was related to calculus performance. Battista (1990) added the finding that spatial visualization ability and verbal-logical reasoning ability were significant factors of geometry achievement and geometric problem solving. Having analyzed solution strategies of elementary and middle school students to determine their preference for visual or verbal processing, Moses (1977) and Lowrie (2001) concluded that mathematical performance was related to spatial ability, but not to preference for visual processing.
However, in the studies by Galindo (1994) and Samuels (2010), calculus performance was not related to preference for visual processing. Galindo found that, although differences between the two groups were not significant in the sections of first semester calculus students using graphing calculators, verbalizers had significantly higher calculus scores than visualizers in the sections using Mathematica or no technology. Conversely, Husch (2001) reported no significant differences in the mean ACT mathematics and calculus test scores between visualizers and verbalizers enrolled in first and second semester calculus classes. Haciomeroglu et al. (2013) concluded that verbalizers scored significantly lower than visualizers on the calculus tests, indicating that stronger preference for visual thinking was associated with higher calculus performance. The results indicated that preference for visual processing and cognitive abilities (i.e., spatial ability and verbal-logical reasoning ability) were related to calculus performance and that preference did not correlate with cognitive abilities. These results support the hypothesis that preference for visual processing, spatial ability, and verbal-logical reasoning ability are significant factors of mathematical performance and that cognitive abilities did not predict students’ preference for visual or analytic processing.
Taken together, these studies suggest that research results relating visualizer-verbalizer cognitive styles to cognitive abilities and mathematical performance are not conclusive. Moreover, most previous studies investigating factors underlying differences in mathematical performances focused exclusively on ability testing and failed to consider the two contrasting groups of visualizers, which may account for inconclusive research findings between cognitive styles, cognitive abilities, and mathematical performance. Therefore, this study investigated the object-spatial

991
Haciomeroglu / Object-spatial Visualization and Verbal Cognitive Styles, and Their Relation to Cognitive...
visualization and verbal cognitive styles among high school students and related differences in spatial ability, verbal-logical reasoning ability, and mathematical performance of those students. More specifically, the current study investigated the following questions:
1) What is the relationship between spatial ability, verbal-logical reasoning ability, mathematical performance, and object-spatial visualization and verbal cognitive styles?
2) Are there differences among students’ spatial ability, verbal-logical reasoning ability, and mathematical performance that can be attributed to object-spatial visualization and verbal cognitive styles?
MethodThere is a large body of research examining students’ cognitive processes in
mathematics, and such studies have provided insights into the relationships between cognitive abilities, cognitive styles, and calculus performance (e.g., Battista, 1990; Delice & Sevimli, 2010; Galindo, 1994; Haciomeroglu, 2015; Haciomeroglu et al., 2010, 2013, 2014; Kozhevnikov et al., 2002, 2007; Lean & Clements, 1981; Moses, 1977; Sevimli & Delice, 2011a, 2011b, 2011c, 2012; Suwarsono, 1982). For instance, Haciomeroglu et al. (2010) and Delice and Sevimli (2010) developed case studies of students and provided comprehensive analyses of their preferences in problem-solving situations. The other researchers mentioned above, have explored the quantitative relationships between these processes in different content areas. However, there is no quantitative study examining the relationship of cognitive styles with both cognitive abilities and calculus performance. As a result, a quantitative research design was selected for this study.
ParticipantsThe participants were 348 students who were enrolled in Advanced Placement
(AP) calculus courses at six high schools in two districts in Southeastern United States at the time of the study. The sample included 208 males and 140 females. Approximately 58% of the sample were White, 17% were Hispanic, 15% were Asian, 5% were African American, and 2% were Multiracial. The remaining 3% indicated “Other” as their ethnic group.
Materials and ProcedureAll students received standardized instructions and were tested in their classrooms.
All participating students gave their informed consent and were debriefed at the end of the study. The paper-and-pencil tests were administered to measure spatial ability, verbal-logical reasoning ability, and cognitive styles. The students’ scores on the AP calculus exam were collected from their instructors at the end of the study.

992
EDUCATIONAL SCIENCES: THEORY & PRACTICE
Cognitive style measures. The Object-Spatial Imagery and Verbal Questionnaire (OSIVQ) is a self-report questionnaire designed to distinguish between object visualizers, spatial visualizers, and verbalizers (Blajenkova, Kozhevnikov, & Motes, 2006; Blazhenkova & Kozhevnikov, 2009). The OSIVQ consists of three 15-item scales that assess object visualization, spatial visualization, and verbal cognitive styles. The items from the Object and Spatial Imagery scales are designed to assess different characteristics (e.g., vividness and colorfulness for object imagery or abstractness and sketching for spatial imagery) of images. Examples of the questions in the self-report are as follows: “My mental images of different objects very much resemble the size, shape and color of actual objects that I have seen” (Object Imagery), and “My images are more like schematic representations of things and events rather than like detailed pictures” (Spatial Imagery). The items from the Verbal scale, on the other hand, assess the participants’ preferred used of imagery versus verbal modes of thinking (e.g., “When explaining directions, I would rather give verbal explanations than make drawings or sketches”). The students read and rated the 45 items of the OSIVQ on a 5-point scale (from 1 = totally disagree to 5 = totally agree). Scoring was arranged in such a way that a low score indicated weak visualizing or verbalizing tendencies, and a high score indicated strong visualizing or verbalizing tendencies. The internal reliability coefficients of object, spatial, and verbal scales of the OSIVQ were 0.79, 0.80, and 0.76, respectively.
Cognitive ability measures. The six tests, measuring spatial ability (Cube Comparisons, Card Rotations, Form Board, and Paper Folding) and verbal-logical reasoning ability (Nonsense Syllogisms and Diagramming Relationships), are part of the KIT of Reference Tests for Cognitive Factors (Ekstrom, French, & Harman, 1976). The scores on the tests of spatial and verbal-logical reasoning abilities were scaled and averaged to create two composite scores for each student: composite spatial ability score (SA) made up of Cube Comparisons, Card Rotations, Form Board, and Paper Folding; and composite verbal-logical reasoning ability score (VLR) made up of Diagramming Relationships and Nonsense Syllogisms. According to Ekstrom and her colleagues, logical reasoning ability refers to the ability to reason from premise to conclusion, or to evaluate the correctness of a conclusion. The four spatial ability tests are designed to measure two components of spatial ability: Spatial orientation and Spatial Visualization: Spatial Orientation refers to the ability
Figure 1. Items from cube comparisons test.
993
Haciomeroglu / Object-spatial Visualization and Verbal Cognitive Styles, and Their Relation to Cognitive...
to perceive spatial patterns or to maintain orientation with respect to objects in space. Spatial visualization is defined as the ability to manipulate or transform the image of spatial patterns into other arrangements.
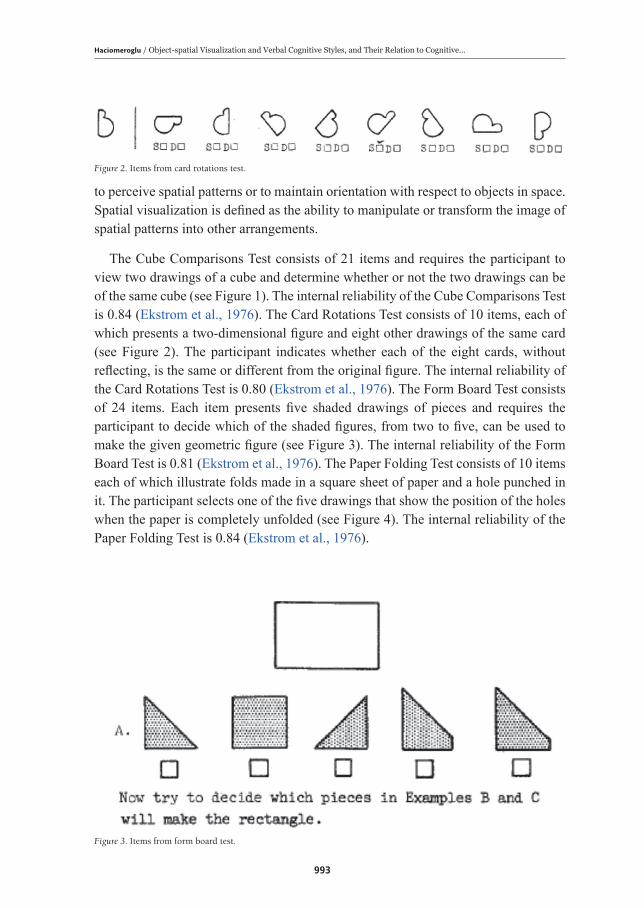
The Cube Comparisons Test consists of 21 items and requires the participant to view two drawings of a cube and determine whether or not the two drawings can be of the same cube (see Figure 1). The internal reliability of the Cube Comparisons Test is 0.84 (Ekstrom et al., 1976). The Card Rotations Test consists of 10 items, each of which presents a two-dimensional figure and eight other drawings of the same card (see Figure 2). The participant indicates whether each of the eight cards, without reflecting, is the same or different from the original figure. The internal reliability of the Card Rotations Test is 0.80 (Ekstrom et al., 1976). The Form Board Test consists of 24 items. Each item presents five shaded drawings of pieces and requires the participant to decide which of the shaded figures, from two to five, can be used to make the given geometric figure (see Figure 3). The internal reliability of the Form Board Test is 0.81 (Ekstrom et al., 1976). The Paper Folding Test consists of 10 items each of which illustrate folds made in a square sheet of paper and a hole punched in it. The participant selects one of the five drawings that show the position of the holes when the paper is completely unfolded (see Figure 4). The internal reliability of the Paper Folding Test is 0.84 (Ekstrom et al., 1976).
Figure 2. Items from card rotations test.
Figure 3. Items from form board test.
994
EDUCATIONAL SCIENCES: THEORY & PRACTICE
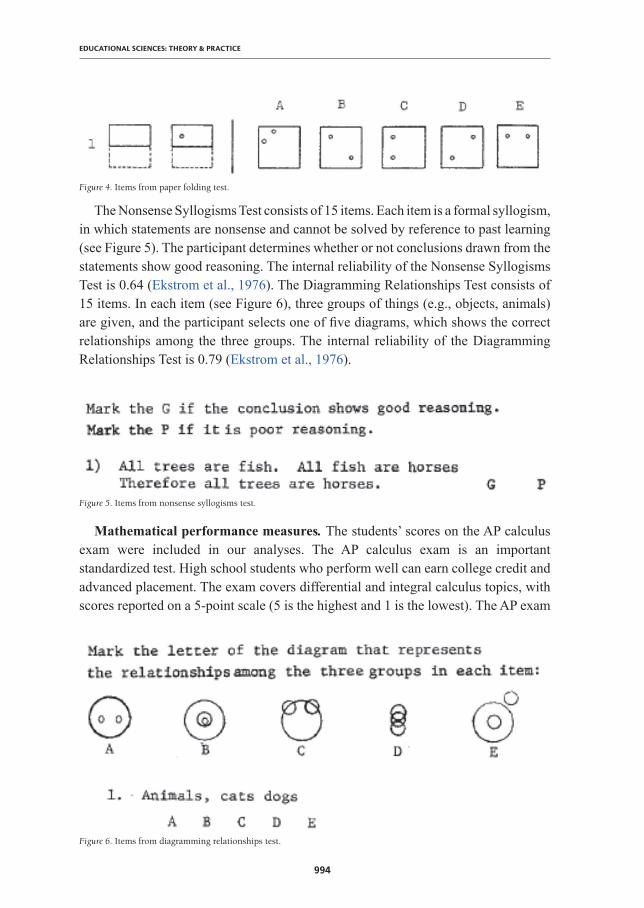
The Nonsense Syllogisms Test consists of 15 items. Each item is a formal syllogism, in which statements are nonsense and cannot be solved by reference to past learning (see Figure 5). The participant determines whether or not conclusions drawn from the statements show good reasoning. The internal reliability of the Nonsense Syllogisms Test is 0.64 (Ekstrom et al., 1976). The Diagramming Relationships Test consists of 15 items. In each item (see Figure 6), three groups of things (e.g., objects, animals) are given, and the participant selects one of five diagrams, which shows the correct relationships among the three groups. The internal reliability of the Diagramming Relationships Test is 0.79 (Ekstrom et al., 1976).
Figure 5. Items from nonsense syllogisms test.
Mathematical performance measures. The students’ scores on the AP calculus exam were included in our analyses. The AP calculus exam is an important standardized test. High school students who perform well can earn college credit and advanced placement. The exam covers differential and integral calculus topics, with scores reported on a 5-point scale (5 is the highest and 1 is the lowest). The AP exam
Figure 4. Items from paper folding test.
Figure 6. Items from diagramming relationships test.
995
Haciomeroglu / Object-spatial Visualization and Verbal Cognitive Styles, and Their Relation to Cognitive...
has two sections (multiple choice and free response), which are equally weighted in computing total scores. The multiple-choice section has two parts: Part A consisting of 28 questions does not allow the use of a graphing calculator, and Part B consisting of 17 questions requires the use of a graphing calculator. The free-response section also has two parts: Part A of the free response section (two problems) requires the use of a graphing calculator, and Part B (four problems) does not allow the use of a graphing calculator. The number of students for whom AP exam scores were available was 335. Therefore, results are based on the most available data in this study.
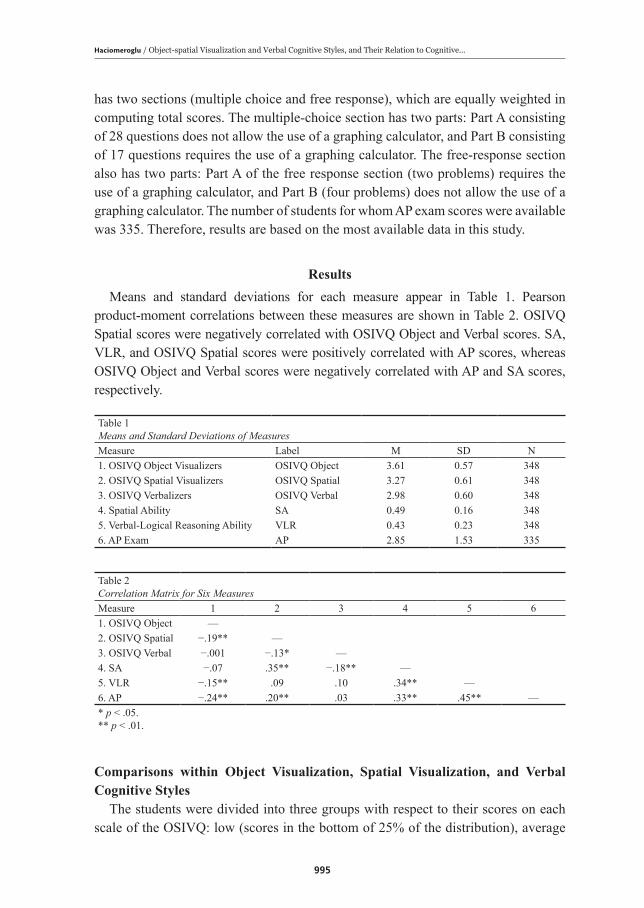
ResultsMeans and standard deviations for each measure appear in Table 1. Pearson
product-moment correlations between these measures are shown in Table 2. OSIVQ Spatial scores were negatively correlated with OSIVQ Object and Verbal scores. SA, VLR, and OSIVQ Spatial scores were positively correlated with AP scores, whereas OSIVQ Object and Verbal scores were negatively correlated with AP and SA scores, respectively.
Table 1Means and Standard Deviations of MeasuresMeasure Label M SD N1. OSIVQ Object Visualizers OSIVQ Object 3.61 0.57 3482. OSIVQ Spatial Visualizers OSIVQ Spatial 3.27 0.61 3483. OSIVQ Verbalizers OSIVQ Verbal 2.98 0.60 3484. Spatial Ability SA 0.49 0.16 3485. Verbal-Logical Reasoning Ability VLR 0.43 0.23 3486. AP Exam AP 2.85 1.53 335
Table 2Correlation Matrix for Six MeasuresMeasure 1 2 3 4 5 61. OSIVQ Object —2. OSIVQ Spatial −.19** —3. OSIVQ Verbal −.001 −.13* —4. SA −.07 .35** −.18** —5. VLR −.15** .09 .10 .34** —6. AP −.24** .20** .03 .33** .45** —* p < .05.** p < .01.
Comparisons within Object Visualization, Spatial Visualization, and Verbal Cognitive Styles
The students were divided into three groups with respect to their scores on each scale of the OSIVQ: low (scores in the bottom of 25% of the distribution), average

996
EDUCATIONAL SCIENCES: THEORY & PRACTICE
(scores in the middle 50%), and high (scores in the top 25%). Next, spatial ability, verbal-logical ability, and AP exam scores of the three groups within each cognitive style were compared. Table 3 presents the distribution of students with low, average, and high scores on object, spatial, and verbal scales of the OSIVQ. This approach has been used in previous studies (Kozhevnikov et al., 2002, 2007) because the students with a score in the middle 50% tend to employ both object and spatial imagery when solving a mathematical problem, and the students with a score in the top 25% were more likely to be spatial or object visualizers.
Table 3Distribution of Students with Low, Average, and High Scores on Object, Spatial, and Verbal Scales of OSIVQ
Low Average High TotalOSIVQ Object 85 172 91 348OSIVQ Spatial 90 173 85 348OSIVQ Verbal 93 166 89 348
A one-way between-groups multivariate analysis of variance was performed to investigate the differences in cognitive abilities and mathematical performance in calculus (AP). The independent variables were object, spatial, and verbal cognitive styles as assessed by the OSIVQ. The dependent variables were spatial ability (SA), verbal-logical reasoning ability (VLR), and AP exam scores. When the students were classified according to their OSIVQ Object scores, there was a statistically significant difference between low, average, and high object visualizers on AP and SA scores, F (6, 662) = 3.76, p < .01; Pillai’s Trace = .07; partial eta squared = .03. Therefore, separate ANOVA analyses on these variables were performed (see Tables 4 & 5). Low (MLowObject = 3.18, SDLowObject = 1.56, p < .01) and average (MAverageObject = 2.98, SDAverageObject = 1.47, p < .01) object visualizers had significantly higher mean AP scores than high object visualizers (MHighObject = 2.30, SDHighObject = 1.47). On Spatial Ability (SA scores), average object visualizers (MAverageObject = 0.52, SDAverageObject = 0.16, p < 0.01) had a significantly higher mean score than high object visualizers (MHighObject = 0.45, SDHighObject = 0.14). Low object visualizers (MLowObject = 0.49, SDLowObject = 0.16) did not differ significantly from the other groups on SA scores.
Table 4Test of OSIVQ Object, Spatial Ability, Verbal-Logical Reasoning Ability, and AP ExamEffect Value F Hypothesis df Error df Sig. Partial Eta SquaredOSIVQ Object Pillai’s Trace 0.07 3.76 6.00 662 .00 0.03
Table 5 ANOVA of OSIVQ Object on Spatial Ability, Verbal-Logical Reasoning Ability, and AP exam
Spatial VLR AP Mean SD Mean SD Mean SD
OSIVQ Object Low 0.49 0.16 0.46 0.25 3.18 1.56OSIVQ Object Average 0.52 0.16 0.44 0.21 2.98 1.47

997
Haciomeroglu / Object-spatial Visualization and Verbal Cognitive Styles, and Their Relation to Cognitive...
OSIVQ Object High 0.45 0.14 0.39 0.22 2.30 1.47
When the students were classified according to their OSIVQ Spatial scores, MANOVA indicated significant differences between low, average, and high spatial visualizers regarding their AP and SA scores, F (6, 662) = 6.38, p < .01; Pillai’s Trace = 0.11; partial eta squared = 0.06 (see Tables 6 & 7). High spatial visualizers (MHighSpatial = 3.27, SDHighSpatial = 1.60) had a significantly higher mean AP score than low spatial visualizers (MLowSpatial = 2.49, SDLowSpatial = 1.47, p < .01). The average spatial visualizers (MAverageSpatial = 2.83, SDAverageSpatial = 1.49) did not differ significantly from the other groups on AP exam scores. On Spatial Ability (SA scores), high spatial visualizers (MHighSpatial = 0.56, SDHighSpatial = 0.15) had a significantly higher mean score than average (MAverageSpatial = 0.49, SDAverageSpatial = 0.16, p < .01) and low (MLowSpatial = 0.43, SDLowSpatial = 0.13, p < .01) spatial visualizers. Average spatial visualizers had a significantly higher mean SA score than low spatial visualizers (p < .01).
Table 6Test of OSIVQ Spatial, Spatial Ability, Verbal-Logical Reasoning Ability, and AP ExamEffect Value F Hypothesis df Error df Sig. Partial Eta SquaredOSIVQ Spatial Pillai’s Trace 0.11 6.38 6.00 662 .00 0.06
Table 7ANOVA of OSIVQ Spatial on Spatial Ability, Verbal-Logical Reasoning Ability, and AP Exam
Spatial VLR AP Mean SD Mean SD Mean SD
OSIVQ Spatial Low 0.43 0.13 0.42 0.23 2.49 1.47OSIVQ Spatial Average 0.49 0.16 0.42 0.22 2.83 1.49OSIVQ Spatial High 0.56 0.15 0.47 0.23 3.27 1.60
When the students were classified according to their OSIVQ Verbal scores, MANOVA indicated significant differences between low, average, and high verbalizers regarding their SA and VLR scores, F (6, 662) = 3.4, p < .01; Pillai’s Trace = 0.06; partial eta squared = 0.03 (see Tables 8 & 9). When the results for SA and VLR scores were considered separately, the only difference to reach statistical significance was spatial ability (SA scores). An examination of the mean scores indicated that low verbalizers (MLowVerbal = 0.53, SDLowVerbal = 0.16) had a significantly higher mean SA score than average (MAverageVerbal = 0.48, SDAverageVerbal = 0.15, p = .04) and high (MHighVerbal = 0.48, SDHighVerbal = 0.15, p = .03) verbalizers. There was no significant difference in SA scores between average and high verbalizers.
Table 8Test of OSIVQ Verbal, Spatial Ability, Verbal-Logical Reasoning Ability, and AP Exam Effect Value F Hypothesis df Error df Sig. Partial Eta SquaredOSIVQ Verbal Pillai’s Trace 0.06 3.40 6.00 662 .00 0.03

998
EDUCATIONAL SCIENCES: THEORY & PRACTICE
Table 9ANOVA of OSIVQ Verbal on Spatial Ability, Verbal-logical Reasoning Ability, and AP Exam
Spatial VLR AP Mean SD Mean SD Mean SD
OSIVQ Verbal Low 0.53 0.16 0.40 0.21 2.84 1.51OSIVQ Verbal Average 0.48 0.15 0.42 0.22 2.84 1.51OSIVQ Verbal High 0.48 0.15 0.48 0.24 2.87 1.61
Comparisons between Low-average Visualizers, High Object Visualizers, High Spatial Visualizers, and Verbalizers
The students were first divided into two groups using the median score on the verbal scale of OSIVQ. The students with a score above the median were identified as verbalizers (n = 167), and those with a score below the median as visualizers (n = 166). Fifteen students with the median score were excluded from this analysis. Next, using the OSIVQ Object and Spatial scores, the visualizers were divided into two subgroups: high object visualizers (n = 33) with OSIVQ Object scores in the top 25% of the distribution, high spatial visualizers (n = 32) with OSIVQ Spatial scores in the top 25%, and low-average visualizers (n = 90) with OSIVQ Object and Spatial scores in the bottom 75%. Eleven visualizers, who had object and spatial scores in the top 25% of the distribution, were excluded from this analysis. Instead of a median split, a stricter cut- off point was used because the primary goal was to compare the students with unusually high OSIVQ Object and Spatial scores.
MANOVA indicated significant differences between the four groups on AP, SA, and VLR scores, F (9, 915) = 4.46, p < .01; Pillai’s Trace = 0.13; partial eta squared = 0.04. Since the homogeneity of variance assumption was not met with AP exam scores, Welch’s one-way ANOVA test was used instead (see Table 10). This showed that high object visualizers (M = 1.88, SD = 1.19) had a significantly lower mean AP score than high spatial visualizers (M = 3.0, SD = 1.69, p = .01), verbalizers (M = 2.94, SD = 1.56, p < .01), and low-average visualizers (M = 2.88, SD = 1.36, p < .01), F (3, 87.61) = 7.08, p < .01.
There was a statistically significant difference in SA scores for the four groups: F (3, 318) = 5.58, p < .01. High spatial visualizers (M = 0.59, SD = 0.17) had a significantly higher mean SA score than low-average visualizers (M = 0.50, SD = 0.15, p = .03), high object visualizers (M = 0.47, SD = 0.13, p = .01), and verbalizers (M = 0.47, SD = 0.16, p < .01).
Differences in VLR scores between verbalizers (M = 0.46, SD = 0.24) and high object visualizers were borderline significant (M = 0.35, SD = 0.20, p = .054). Despite reaching statistical significance, the effect size for this significant difference was small. The effect size, calculated using eta squared, was 0.03. High spatial visualizers (M = 0.46, SD = 0.24) and low-average visualizers (M = 0.39, SD = 0.20) did not

999
Haciomeroglu / Object-spatial Visualization and Verbal Cognitive Styles, and Their Relation to Cognitive...
differ significantly from each other on VLR scores.
Table 10ANOVA of Verbalizers, High Object Visualizers, High Spatial Visualizers, and Low-Average Visualizers
Spatial VLR AP Mean SD Mean SD Mean SD
Verbalizers 0.47 0.16 0.46 0.24 2.94 1.56High Object Vis. 0.47 0.13 0.35 0.20 1.88 1.19High Spatial Vis. 0.59 0.17 0.46 0.24 3.00 1.69Low-Average Vis. 0.50 0.15 0.39 0.20 2.88 1.36
DiscussionThis study examined differences in spatial ability, verbal-reasoning ability, and
mathematical performance in calculus associated with differences in cognitive styles. The correlational matrix revealed that spatial ability, verbal-logical reasoning ability, and calculus performance (or AP exam) scores were significantly correlated with each other. Spatial visualization cognitive style was positively related to spatial ability and calculus performance, whereas object visualization cognitive style did not correlate with spatial ability and was negatively related to calculus performance. The results support the conclusions of Battista (1990), Bremigan (2005), Ferrini-Mundy (1987), Haciomeroglu et al. (2013), and Lowrie (2001), but contradict those of Lean and Clements (1981) and Suwarsono (1982), who reported no significant relationship between spatial ability and mathematical performance. Both Kozhevnikov et al. (2002, 2005) and Pitta-Pantazi and Christou (2010) observed differences between object and spatial visualizers in their performance on spatial and geometric tasks. The correlations of object-spatial visualization cognitive styles with calculus performance and spatial ability confirm these observations on cognitive style-related differences in spatial ability and mathematical performance.
When the students were classified as low, average, and high object visualizers, although some differences were not significant, high object visualizers had the lowest mean scores in spatial ability and calculus performance. Low and average object visualizers had significantly higher calculus performance scores than high object visualizers. Average object visualizers also had significantly higher spatial ability scores than high object visualizers. However, when the students were classified as low, average, and high spatial visualizers, significant differences resulted in spatial ability and calculus performance scores in favor of high spatial visualizers. Although some differences were not significant, high spatial visualizers had the highest mean scores in spatial ability and calculus performance. High spatial visualizers had significantly higher calculus performance scores than low spatial visualizers and had significantly higher spatial ability scores than low and average spatial visualizers. When the students were classified as low, average, and high verbalizers, there were no

1000
EDUCATIONAL SCIENCES: THEORY & PRACTICE
significant differences between low, average, and high verbalizers in verbal-logical reasoning ability and calculus performance scores. As expected, low verbalizers had significantly higher spatial ability scores than average and high verbalizers. These findings suggest that the three cognitive styles (i.e., object visualizers, spatial visualizers, and verbalizers) underlie different cognitive processes, and thus, provide support for the existence of two contrasting groups of visualizers with respect to their spatial ability: spatial visualizers of high spatial ability and object visualizers of low spatial ability (Kozhevnikov et al., 2002, 2005).
The conclusions from comparisons within object visualization, spatial visualization and verbal cognitive styles are only part of the answer to understanding how students differ in cognitive abilities and mathematical performance. Thus, comparisons between the cognitive styles were made using analysis of variance (ANOVA) on spatial ability, verbal-logical reasoning ability, and calculus performance scores. Results showed that high spatial visualizers had significantly higher spatial ability and calculus performance scores than high object visualizers. Verbalizers had significantly higher calculus performance scores than high object visualizers, and significantly lower spatial ability scores than high spatial visualizers. There were no significant differences between verbalizers and high spatial visualizers in their verbal-logical reasoning ability and calculus performance scores. Despite reaching statistical significance, the effect size for the significant difference between verbalizers and high object visualizers in verbal-logical reasoning ability scores was small. The results support the findings of Hegarty and Kozhevnikov (1999) and Kozhevnikov et al. (2002), who reported that visualizers are not a homogeneous group with respect to their spatial ability, but contradict those of Galindo (1994) and Lean and Clements (1981), who reported significant differences favoring verbalizers in performance on spatial or mathematical tests. It should be noted that Galindo used the Mathematical Processing Instrument (MPI, Suwarsono, 1982; Presmeg, 1985) as a measure of preferred mode of processing. The MPI, which consists of algebra word problems and a corresponding questionnaire, is not an appropriate measure of preference in a research study examining the relationship between calculus performance and preference for visual processing because visual processes involved in solving calculus tasks may not be fully captured by a questionnaire associated with algebra problems. Further, the differences in findings of these studies may have been associated with the use of different populations. In this study, the students were volunteers enrolled in AP calculus courses at high schools, and the results may not be generalizable to students at different levels.
Differences in mathematical performance and cognitive abilities favoring verbalizers have been reported by a number of researchers (e.g., Galindo, 1994). In some studies where students were identified as either visualizers or verbalizers with respect to their preference for visual or verbal processing, researchers found no relationship between preference for visual processing and mathematical performance, and verbalizers
1001
Haciomeroglu / Object-spatial Visualization and Verbal Cognitive Styles, and Their Relation to Cognitive...
outperformed visualizers even on spatial tasks (e.g., Lean & Clements, 1981). As Kozhevnikov et al. (2002, 2005) have noted, the visualizer-verbalizer classification is too general because visualizers actually consist of two distinct groups who differ in processing spatial information. It is possible that the two contrasting groups of visualizers, which were not taken into account in previous studies, was a factor resulting in the misleading conclusions that preference for visual processing was not related to mathematical performance and that verbalizers outperformed visualizers on mathematical and spatial tasks. This possibility is supported by the results of this study. A different pattern of results was obtained in this study when the visualizers were divided into two groups according to their preference for object or spatial processing.
The present study focused specifically on the relationship between cognitive styles, cognitive abilities, and mathematical performance in calculus. There were no classroom observations to examine possible effects of instruction or interactions between teachers and students. Although the results have shed light on individual differences in cognitive abilities and mathematical performance associated with cognitive styles and helped to explain why previous studies found no relationship between visualization and mathematical performance, further research is required to investigate how visual processing differs between students. In particular, how interactions between teachers and students, affective and personal variables, and classroom instruction foster different types of visualization requires further examination.
ReferencesBattista, M. T. (1990). Spatial visualization and gender differences in high school geometry.
Journal for Research in Mathematics Education, 21, 47–60.
Bishop, A. J. (1983). Space and geometry. In R. Lesh & M. Landau (Eds.), Acquisition of mathematics concepts and processes (pp. 175–203). New York, NY: Academic Press.
Bishop, A. J. (1989). Review of research on visualization in mathematics education. Focus on Learning Problems in Mathematics, 11, 7–16.
Blajenkova, O., Kozhevnikov, M., & Motes, M. A. (2006). Object-spatial imagery: A new self-report imagery questionnaire. Applied Cognitive Psychology, 20, 239–263.
Blazhenkova, O., & Kozhevnikov, M. (2009). The new object-spatial-verbal cognitive style model: Theory and measurement. Applied Cognitive Psychology, 23, 638–663.
Bremigan, E. G. (2005). An analysis of diagram modification and construction in students’ solutions to applied calculus problems. Journal for Research in Mathematics Education, 36(3), 248–277.
Dean, G. M., & Morris, P. E. (2003). The relationship between self-reports of imagery and spatial ability. British Journal of Psychology, 9, 245–273.
Delice, A., & Sevimli, E. (2010). An investigation of the pre-service teachers’ ability of using multiple representations in problem-solving success: The case of definite integral. Educational Sciences: Theory & Practice, 10(1), 137–149.
Ekstrom, R. B., French, J. W., & Harman, H. H. (1976). Manual for kit of factor-referenced cognitive tests. Princeton, NJ: Educational Testing Service.

1002
EDUCATIONAL SCIENCES: THEORY & PRACTICE
Ferrini-Mundy, J. (1987). Spatial training for calculus students: Sex differences in achievement in visualization ability. Journal for Research in Mathematics Education, 18, 126–140.
Galindo, E. (1994). Visualization in the calculus class: Relationship between cognitive style, gender, and use of technology (Doctoral dissertation). The Ohio State University.
Guay, R. B., McDaniel, E. D., & Angelo, S. (1978). Analytic factor confounding spatial ability measurement. In R. B. Guay & E. D. McDaniel (Eds.), Correlates of Performance on Spatial Aptitude Tests. Purdue University. U. S. Army Research Institute for the Behavioral and Social Sciences.
Haciomeroglu, E. S. (2015). The role of cognitive ability and preferred mode of processing in students’ calculus performance. Eurasia Journal of Mathematics, Science & Technology Education, 11(5), 1165–1179.
Haciomeroglu, E. S., Aspinwall, L., & Presmeg, N. (2010). Contrasting cases of calculus students’ understanding of derivative graphs. Mathematical Thinking and Learning, 12(2), 152–176.
Haciomeroglu, E. S., Chicken, E., & Dixon, J. (2013). Relationships between gender, cognitive ability, preference, and calculus performance. Mathematical Thinking and Learning, 15, 175–189.
Haciomeroglu, E. S., Haciomeroglu, G., Bukova-Guzel, E., & Kula, S. (2014). Pre-service teachers’ visual, analytic, and harmonic problem solving preferences for derivative and antiderivative tasks. Dicle Universitesi Ziya Gokalp Egitim Fakultesi Dergisi, 22, 108–119.
Hegarty, M., & Kozhevnikov, M. (1999). Types of visual-spatial representations and mathematical problem solving. Journal of Educational Psychology, 91, 684–689.
Husch, S. D. (2001). An investigation of the relationships between learning styles, personality temperaments, mathematics self-efficacy, and post-secondary calculus achievement (Doctoral dissertation). The University of Tennessee, Knoxville.
Kozhevnikov, M., Hegarty, M., & Mayer, R. E. (2002). Revising the visualizer-verbalizer dimension: Evidence for two types of visualizers. Cognition and Instruction, 20(1), 47–77.
Kozhevnikov, M., Kosslyn, S. M., & Shepard, J. (2005). Spatial versus object visualizers: A new characterization of visual cognitive style. Memory and Cognition, 33(4), 710–726.
Kozhevnikov, M., Motes, M. A., & Hegarty, M. (2007). Spatial visualization in physics problem solving. Cognitive Science, 31, 549–579.
Krutetskii, V. A. (1976). The psychology of mathematical abilities in schoolchildren. Chicago: University of Chicago Press.
Lean, G., & Clements, K. (1981). Spatial ability, visual imagery, and mathematical performance. Educational Studies in Mathematics, 12, 267–299.
Lohman, D. F. (1979). Spatial ability: A review and reanalysis of the correlational literature (Technical Report No. 8, Aptitude Research Project). School of Education, Stanford University.
Lowrie, T. (2001). The influence of visual representations on mathematical problem solving and numeracy performance. In J. Bobis, B. Perry, & M. Mitchelmore (Eds.), Numeracy and beyond. Proceedings of the 24th Annual Conference of the Mathematics Education Research Group of Australasia (pp. 354–361). Sydney, Australia: MERGA.
McAvinue, L., & Robertson, I. (2006–2007). Measuring visual imagery ability: A review. Imagination. Cognition and Personality, 26(3), 191–211.
Moses, B. E. (1977). The nature of spatial ability and its relationship to mathematical problem solving (Doctoral dissertation). Indiana University.

1003
Haciomeroglu / Object-spatial Visualization and Verbal Cognitive Styles, and Their Relation to Cognitive...
Pitta-Pantazi, D., & Christou, C. (2010). Spatial versus object visualisation: The case of mathematical understanding in three-dimensional arrays of cubes and nets. International Journal of Educational Research, 49, 102–114.
Presmeg, N. C. (1985). The role of visually mediated processes in high school mathematics: A classroom investigation (Doctoral dissertation). University of Cambridge.
Presmeg, N. C. (2006). Research on visualization in learning and teaching mathematics: Emergence from psychology. In A. Gutierrez & P. Boero (Eds.), Handbook of Research on the Psychology of Mathematics Education: Past, Present and Future (pp. 205–235). Rotterdam, The Netherlands: Sense Publishers.
Samuels, J. (2010). The use of technology in calculus instruction (Doctoral dissertation). Columbia University.
Sevimli, E., & Delice, A. (2011a). Is what you prefer what you do? Representations in definite integral. In B. Ubuz (Eds.), Proceedings of the 35th Conference of the International Group for the Psychology of Mathematics Education. (pp. 153–160). Ankara, Turkey.
Sevimli, E., & Delice, A. (2011b). The influence of teacher candidates’ spatial visualization ability on the use of multiple representations in problem solving of definite integrals: A qualitative analysis. Research in Mathematics Education, 13(1), 93–94.
Sevimli, E., & Delice, A. (2011c). The investigation of the relationship between calculus students’ cognitive process types and representation preferences in definite integral problems. In C. Smith (Eds.), Proceedings of the British Society for Research into Learning Mathematics (pp. 137–142). Oxford, England.
Sevimli, E., & Delice, A. (2012). The relationship between students’ mathematical thinking types and representation preferences in definite integral problems. Research in Mathematics Education, 14(3), 295–296
Suwarsono, S. (1982). Visual imagery in the mathematical thinking of seventh grade students (Doctoral dissertation). Monash University, Melbourne, Australia.
Thomas, P. R., & McKay, J. B. (2010). Cognitive styles and instructional design in university learning. Learning and Individual Differences, 20, 197–202.