Embed Size (px)
Citation preview

Obesity as a CNS Disorder:Targeting the Neuronal Circuitry of Weight Loss
Robert F. Kushner, MD, MS Professor of MedicineFeinberg School of MedicineNorthwestern University Clinical DirectorNorthwestern Comprehensive Center on ObesityChicago, Illinois

Learning Objectives
Upon completion of this activity, you should be able to:
• Differentiate the mechanisms of action of the new targeted pharmacotherapies for obesity in development from the current approaches to obesity management
• Evaluate the efficacy, safety, and tolerability of emerging antiobesity therapies, and where they may fit into the current obesity algorithms

What percentage of your patients are either overweight or obese?< 25%25%-50%51%-75%> 75%I don’t see patients currently
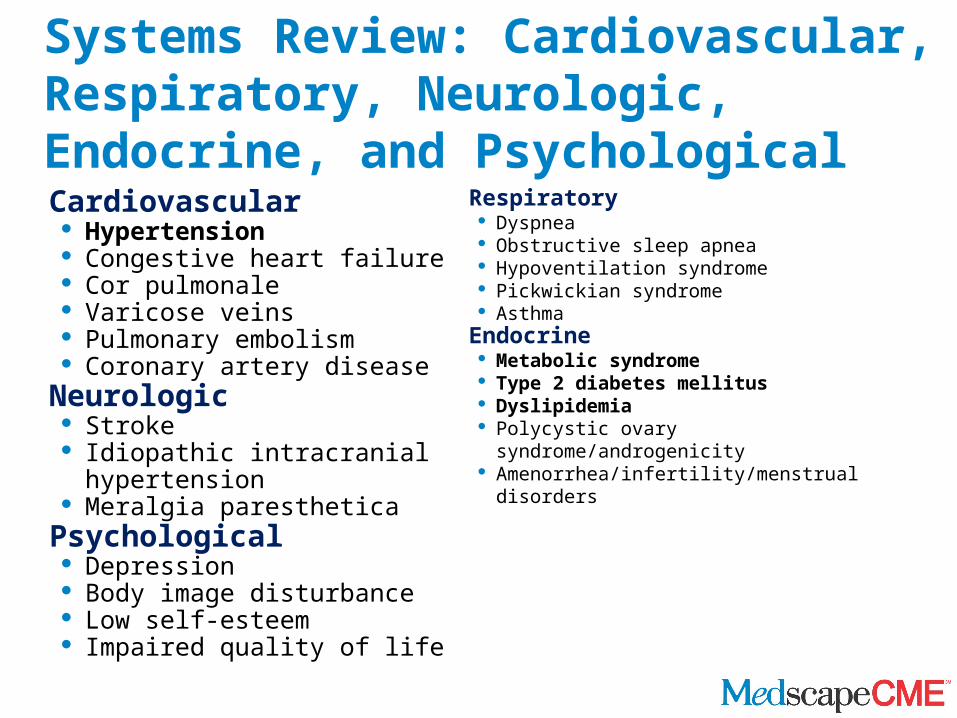
• Cardiovascular Hypertension Congestive heart failure Cor pulmonale Varicose veins Pulmonary embolism Coronary artery disease
• Neurologic Stroke Idiopathic intracranial
hypertension Meralgia paresthetica
Psychological Depression Body image disturbance Low self-esteem Impaired quality of life
Respiratory Dyspnea Obstructive sleep apnea Hypoventilation syndrome Pickwickian syndrome Asthma
Endocrine Metabolic syndrome Type 2 diabetes mellitus Dyslipidemia Polycystic ovary syndrome/androgenicity Amenorrhea/infertility/menstrual disorders
Systems Review: Cardiovascular, Respiratory, Neurologic, Endocrine, and Psychological
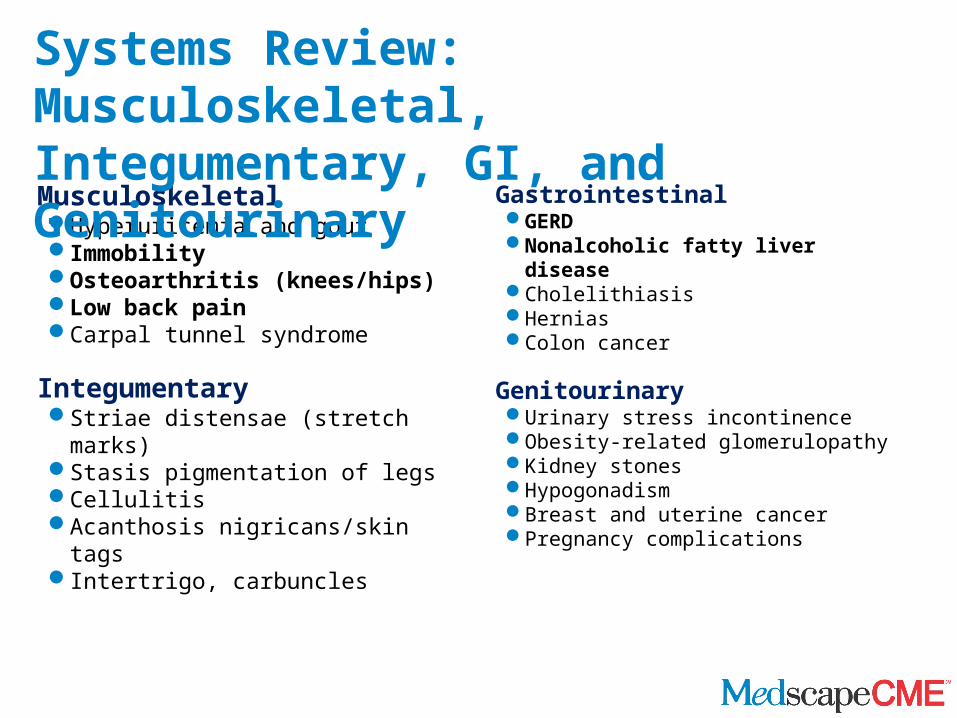
• MusculoskeletalHyperuricemia and goutImmobilityOsteoarthritis (knees/hips)Low back painCarpal tunnel syndrome
• IntegumentaryStriae distensae (stretch marks)Stasis pigmentation of legsCellulitisAcanthosis nigricans/skin tagsIntertrigo, carbuncles
• GastrointestinalGERDNonalcoholic fatty liver disease CholelithiasisHerniasColon cancer
• GenitourinaryUrinary stress incontinenceObesity-related glomerulopathyKidney stonesHypogonadism Breast and uterine cancerPregnancy complications
Systems Review: Musculoskeletal, Integumentary, GI, and Genitourinary
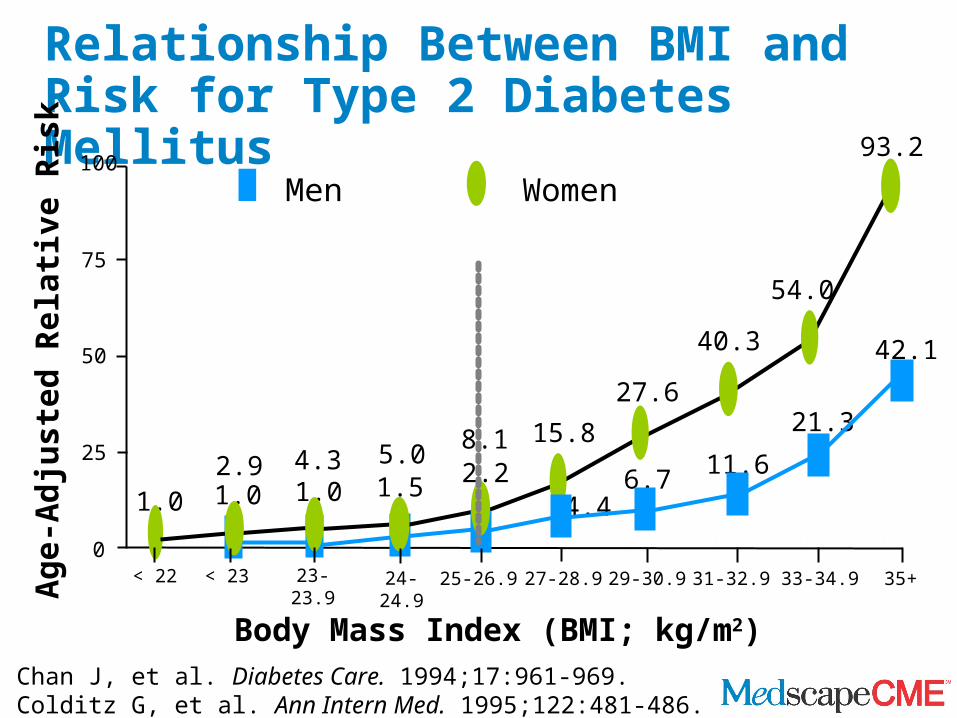
Relationship Between BMI and Risk for Type 2 Diabetes Mellitus
Chan J, et al. Diabetes Care. 1994;17:961-969. Colditz G, et al. Ann Intern Med. 1995;122:481-486.
Age-
Adju
sted
Rel
ative
Ris
k
Body Mass Index (BMI; kg/m2)
< 23 24-24.9 25-26.9 27-28.9 33-34.90
25
50
75
100
1.02.9 4.3 5.0 8.1 15.8
27.6
40.3
54.0
93.2
< 22 23-23.9 29-30.9 31-32.9 35+
1.0 1.54.4
6.7 11.6
21.3
42.1
1.02.2
Men Women

Association of Waist-to-Hip RatioWithin BMI Categories With MI
Yusuf S, et al. Lancet. 2005;366:1640-1649.
Results expressed by waist-to-height ratio quintiles and BMI categories
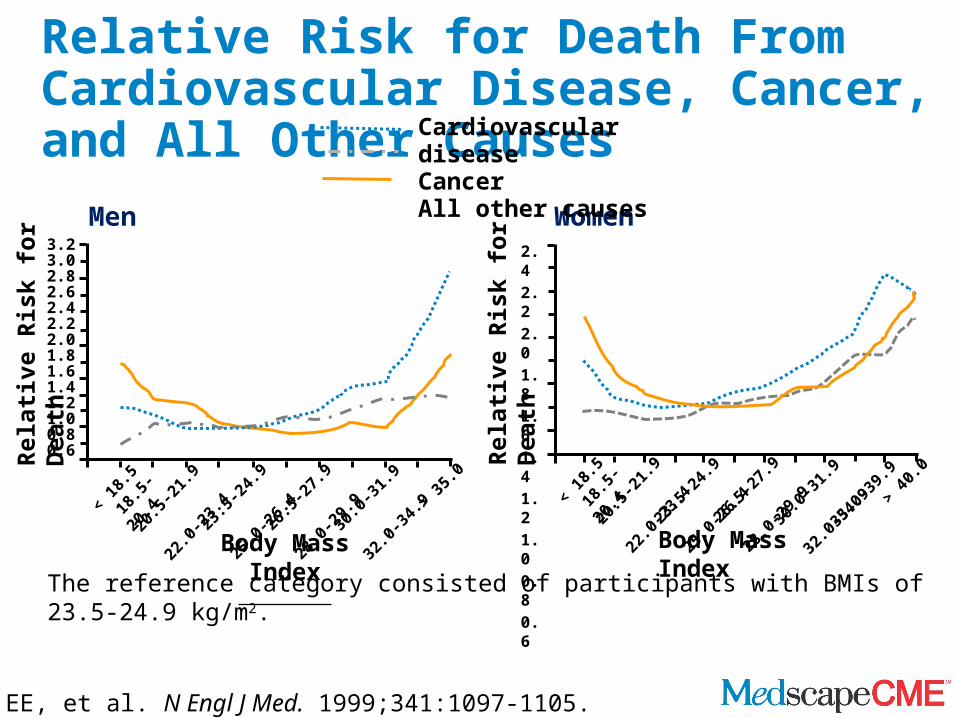
Relative Risk for Death From Cardiovascular Disease, Cancer, and All Other Causes
Body Mass Index
Women
Rela
tive
Risk
for D
eath
Body Mass Index< 18.5
18.5-20.4
20.5-21.9
22.0-23.4
23.5-24.9
25.0-26.4
26.5-27.9
28.0-29.9
30.0-31.9
32.0-34.9> 40.0
35.0-39.9
2.42.22.01.81.61.41.21.00.80.6
Cardiovascular diseaseCancerAll other causes
3.23.02.82.62.42.22.01.81.61.41.21.00.80.6Re
lativ
e Ri
sk fo
r Dea
th
Men
< 18.5 1
8.5-20.420.5-21.9
22.0-23.4
23.5-24.9
25.0-26.4
26.5-27.9
28.0-29.9
30.0-31.9
32.0-34.9> 35.0
Calle EE, et al. N Engl J Med. 1999;341:1097-1105.
The reference category consisted of participants with BMIs of 23.5-24.9 kg/m2.

BMI and All-Cause Mortality
Prospective Studies Collaboration. Lancet. 2009;373:1083-1096.
Hazard ratio (HR) per 5 kg/m2 higher BMI. HR less than 1 if BMI is inversely associated with risk . All analyses exclude the first 5 years of follow-up and adjust for study and age at risk (in 5-year groups). The overall and age-specific analyses also adjust for sex, and the all-participant analyses also adjust for baseline smoking status.
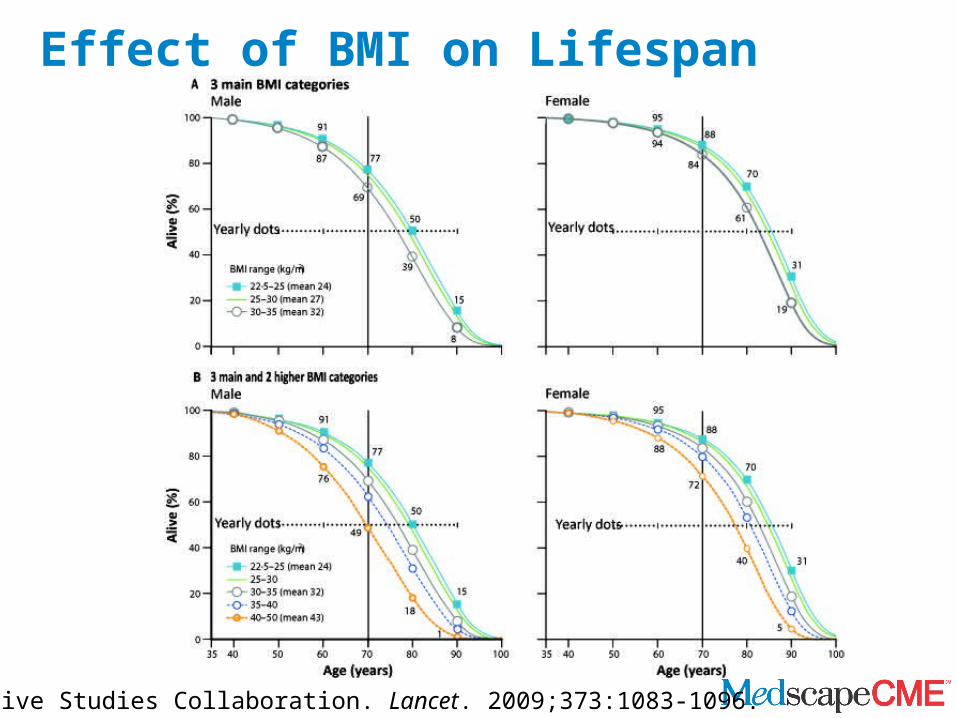
Effect of BMI on Lifespan
Prospective Studies Collaboration. Lancet. 2009;373:1083-1096.
All Healthcare Professionals Play a Role
• Screening for Obesity in Adults. The US Preventive Services Task Force recommends that clinicians screen all adult patients for obesity and offer intensive counseling and behavioral interventions to promote sustained weight loss for obese adults (Grade B recommendation)
U.S. Preventive Services Task Force. Ann Intern Med. 2003;139:930-932.
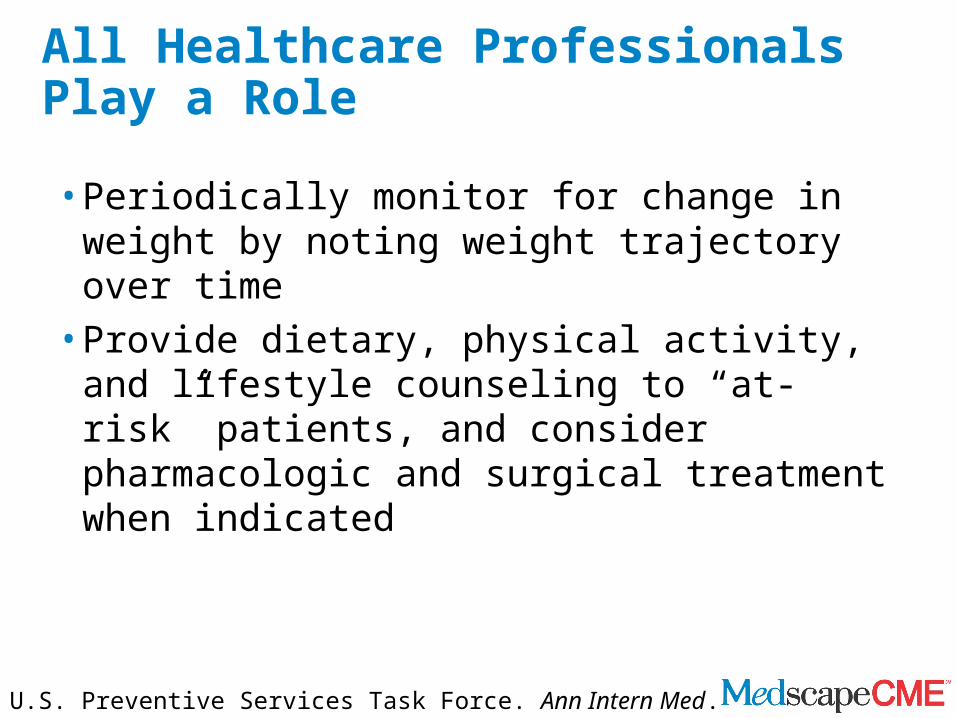
All Healthcare Professionals Play a Role
• Periodically monitor for change in weight by noting weight trajectory over time
• Provide dietary, physical activity, and lifestyle counseling to “at-risk” patients, and consider pharmacologic and surgical treatment when indicated
U.S. Preventive Services Task Force. Ann Intern Med. 2003;139:930-932.
I understand the role of the central nervous system in weight regulation.
Strongly agreeAgreeDisagreeStrongly disagreeNeither agree nor disagree
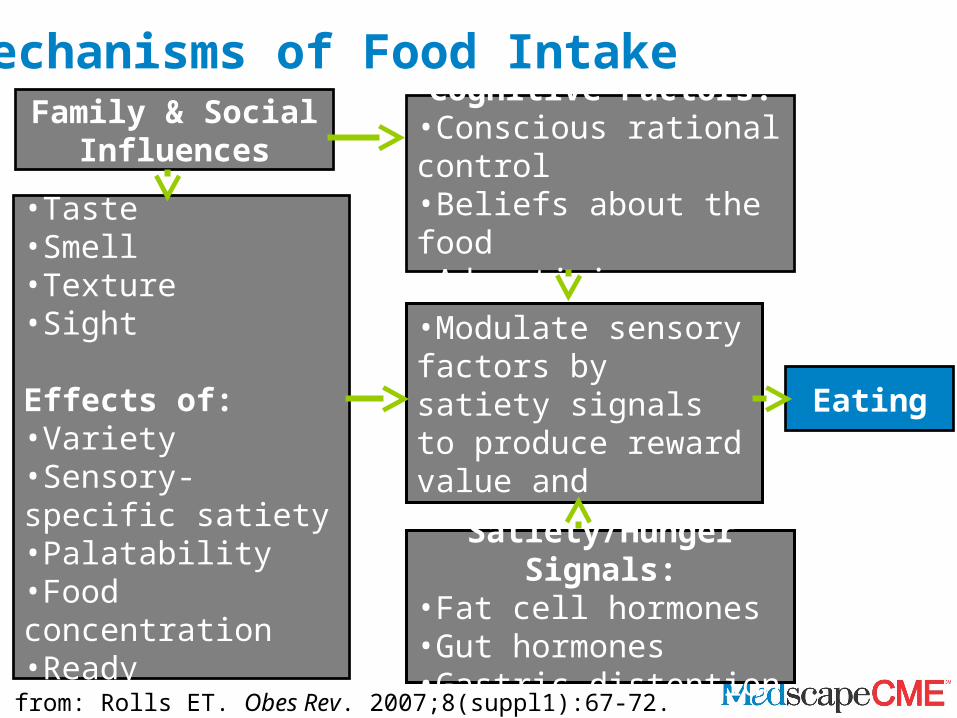
Sensory Factors:•Taste•Smell•Texture•Sight
Effects of:•Variety•Sensory-specific satiety•Palatability•Food concentration•Ready availability
Brain Mechanisms: •Modulate sensory factors by satiety signals to produce reward value and appetite
Satiety/Hunger Signals:•Fat cell hormones•Gut hormones•Gastric distention
Cognitive Factors:•Conscious rational control•Beliefs about the food •Advertising
Eating
Mechanisms of Food Intake
Adapted from: Rolls ET. Obes Rev. 2007;8(suppl1):67-72.
Family & Social Influences
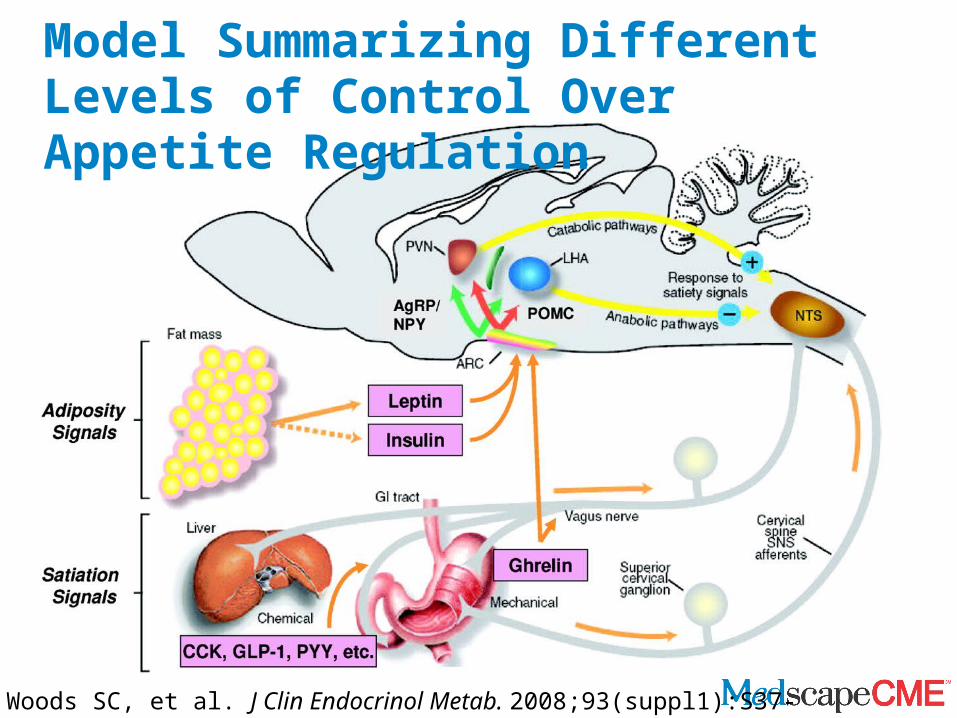
Woods SC, et al. J Clin Endocrinol Metab. 2008;93(suppl1):S37-S50.
Model Summarizing Different Levels of Control Over Appetite Regulation

Gut Peptides That Regulate Appetite
Murphy KG, Bloom SR. Nature. 2006;444:854-859.

Gut Peptides That Regulate Appetite
Murphy KG, Bloom SR. Nature. 2006;444:854-859.

The Importance of the Hypothalamus in Appetite Regulation
•Injury or lesions in the hypothalamus may result in a pattern of weight gain that is characterized as abrupt in onset and rapidly accelerating = hypothalamic obesity
•Causes include:• Craniopharyngioma• Head trauma• Sarcoidosis• Aneurysm
• Meningioma• Metastasis• Surgery• Radiation

A Case of Hypothalamic Obesity
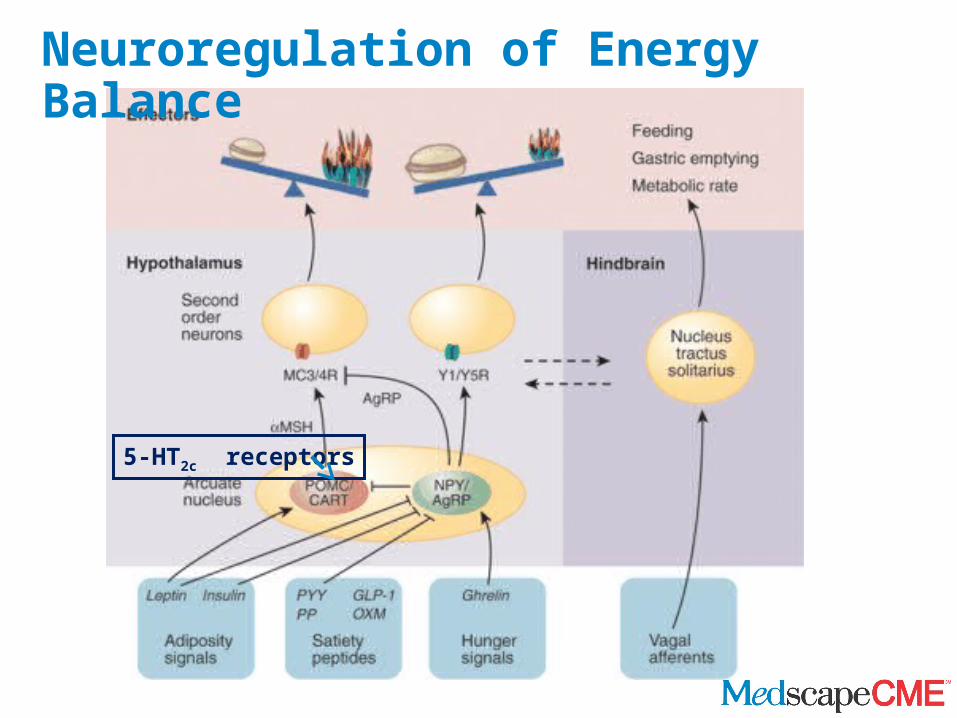
Neuroregulation of Energy Balance
5-HT2c receptors
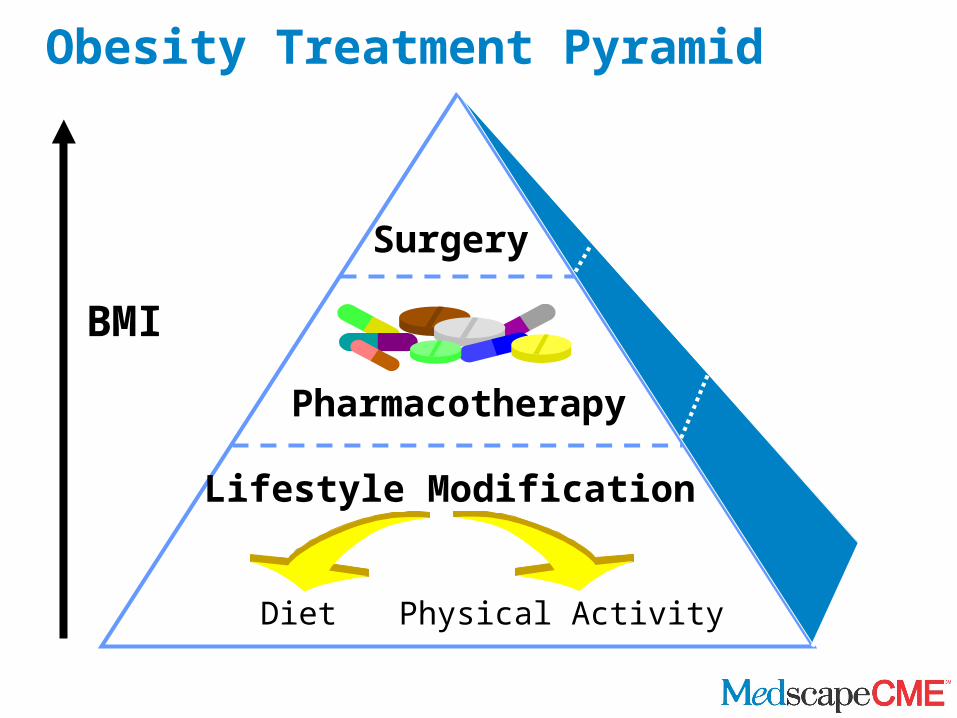
Obesity Treatment Pyramid
Surgery
Pharmacotherapy
Lifestyle Modification
Diet Physical Activity
BMI

How confident are you that your understanding of emerging pharmacotherapies for treatment of obesity is up-to-date?Very confidentSomewhat confidentNot very confident
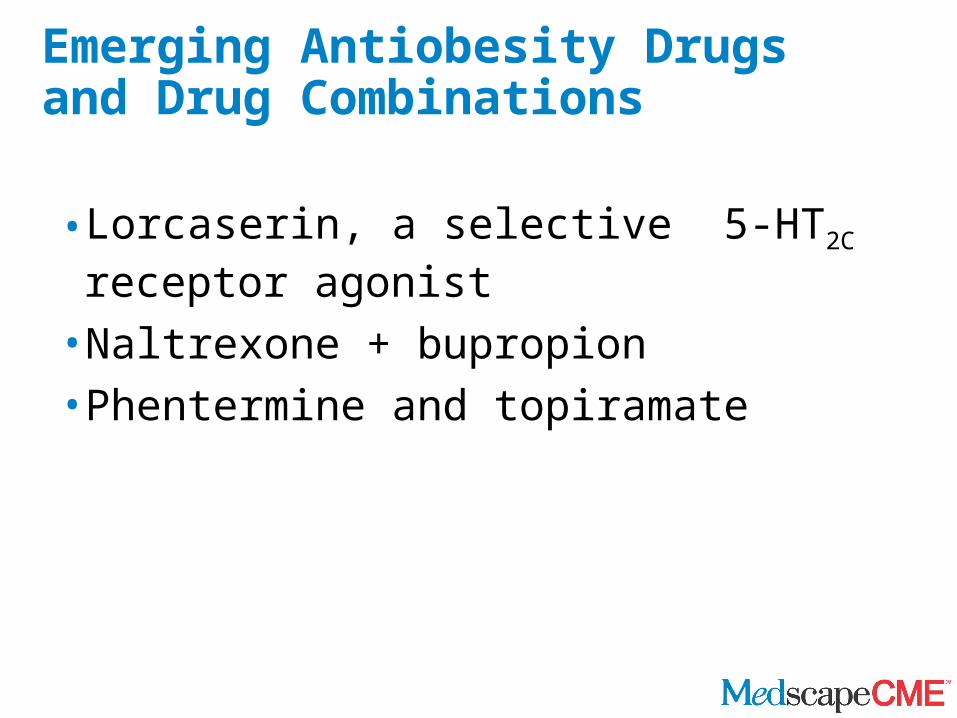
Emerging Antiobesity Drugs and Drug Combinations
•Lorcaserin, a selective 5-HT2C receptor agonist•Naltrexone + bupropion•Phentermine and topiramate

Lorcaserin
Lorcaserin: selective 5-HT2C receptor agonist designed to promote weight loss 5-HT2C receptor activation of proopiomelanocortin (POMC)
neurons results in α-MSH activation of melanocortin-4 receptors
Serotonin receptor as a pharmacologic target for weight loss was validated by fenfluramine
Fenfluramine in combination with phentermine (Fen-Phen) was highly efficacious for weight loss
Safety concerns led to withdrawal: Fenfluramine activation of 5-HT2B receptor was linked to cardiac valvular disease
Heisler LK, et al. Science. 2002;297:609-611.
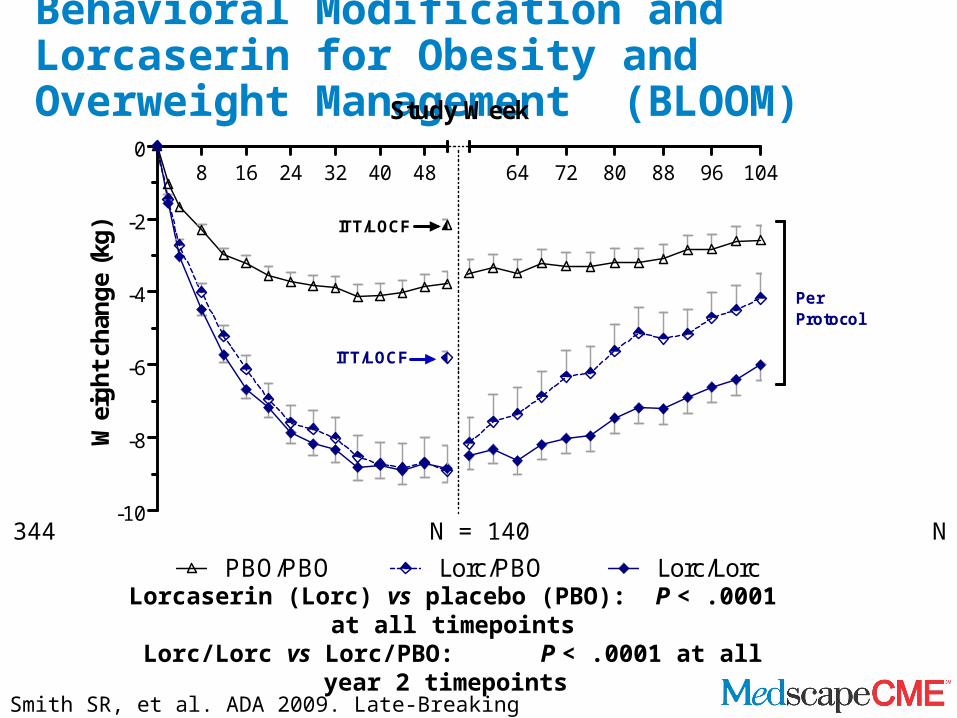
Behavioral Modification and Lorcaserin for Obesity and Overweight Management (BLOOM)
Lorcaserin (Lorc) vs placebo (PBO): P < .0001 at all timepointsLorc/Lorc vs Lorc/PBO: P < .0001 at all year 2 timepoints
8 16 24 32 40 48
-10
-8
-6
-4
-2
064 72 80 88 96 104
Lorc/LorcPBO/PBO Lorc/PBO
ITT/LOCF
ITT/LOCF
PerProtocol
Study WeekW
eig
ht
chan
ge
(kg
)
N = 344 N = 140 N = 308
Smith SR, et al. ADA 2009. Late-Breaking Abstract 96.

Echocardiographic Monitoring and Endpoints• Echoes were performed every 6 months• Heart valve insufficiency (or regurgitation) is rated as follows:
• Aortic: absent; trace; mild; moderate; severe• Mitral: absent; trace; mild; moderate; severe• Tricuspid: absent; trace; mild; moderate; severe• Pulmonic: absent; present
• The US Food and Drug Administration (FDA) defines significant valvular disease as MILD or greater aortic regurgitation, or MODERATE or greater mitral regurgitation
• Main endpoint: proportion of patients who develop “FDA valvulopathy”
• Secondary endpoints: shift analyses of individual heart valve regurgitant scores
CDC. MMWR Morb Mortal Wkly Rep. 1997;46:1061-1066.

Lorcaserin Did Not Increase the Rate of FDA Valvulopathy
N = number of evaluable echo pairs; n = number (%) with FDA valvulopathy
Treatment N n (%) PWeek 52
Lorcaserin 10 mg BID 1278 34 (2.66%) .70a
Placebo 1194 28 (2.35%)
Week 104Lorcaserin/lorcaserin 500 13 (2.6%) .99a
Lorcaserin/placebo 258 5 (1.9%)Placebo/placebo 627 17 (2.7%)
aVs placebo with Fisher’s exact test
Smith SR, et al. ADA 2009. Late-Breaking Abstract 96.

Lorcaserin: Adverse Events Reported by 5% or More in Any Group in Year 1
28
N (%) Lorcaserin(N = 1593)
Placebo(N = 1584)
Headache
287 (18.0) 175 (11.0)
Dizziness
130 (8.2) 60 (3.8)
Nausea
119 (7.5) 85 (5.4)
Constipation
106 (6.7) 64 (4.0)
Fatigue
95 (6.0) 48 (3.0)
Dry mouth 83 (5.2) 37 (2.3)
Smith SR, et al. ADA 2009. Late-Breaking Abstract 96.
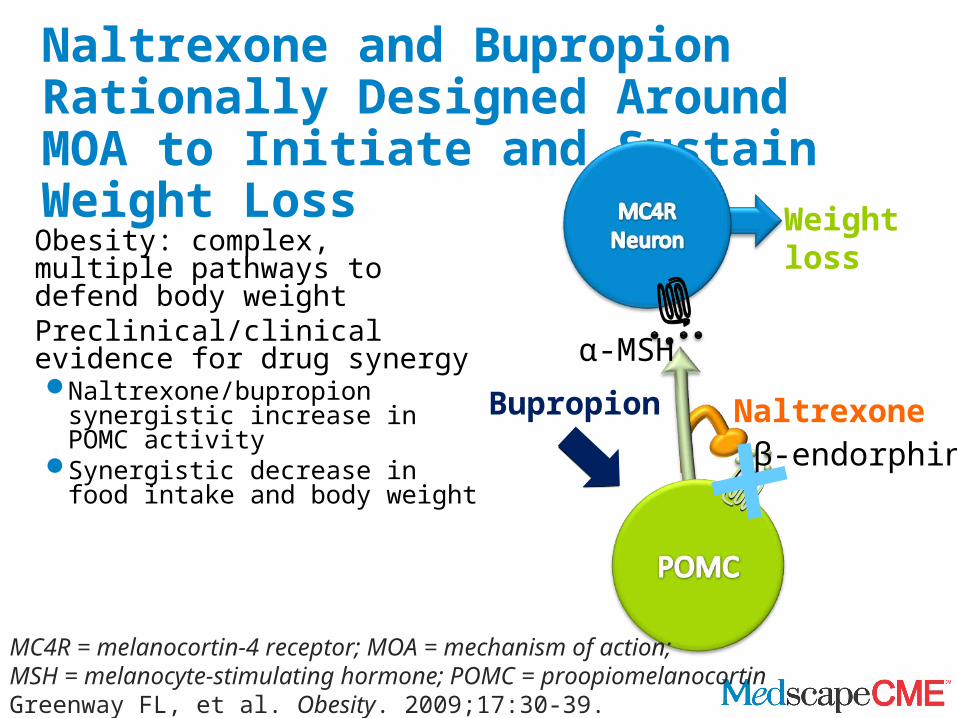
Naltrexone and Bupropion Rationally Designed Around MOA to Initiate and Sustain Weight Loss
Obesity: complex, multiple pathways to defend body weight
Preclinical/clinical evidence for drug synergyNaltrexone/bupropion synergistic
increase in POMC activitySynergistic decrease in food
intake and body weightβ-endorphin
Bupropion
α-MSH
Naltrexone
Weight loss
MC4R = melanocortin-4 receptor; MOA = mechanism of action; MSH = melanocyte-stimulating hormone; POMC = proopiomelanocortinGreenway FL, et al. Obesity. 2009;17:30-39.

COR-I, II: Body Weight, Percentage of Change From Baseline
0 8 16 24 32 40 48 56-10
-8
-6
-4
-2
0
56
-1.3%
-5.0%*
-6.1%*
-1.9%
-6.8%*
-8.2%*
Week
Cha
nge
from
bas
elin
e (%
)
0 8 16 24 32 40 48 56-10
-8
-6
-4
-2
0
56
-1.2%
-6.4%*
-1.4%
-8.1%*
WeekCha
nge
from
bas
elin
e (%
)
COR-IICOR-IITT-LOCFObserved#ITT-LOCFObserved
NB16 (N=471)
Completers: Placebo (N = 290): -1.8% , NB16 (N = 284): -6.7%*NB32 (N = 296): -8.1%*
Completers: Placebo (N = 267): -1.4%NB32 (N = 434): -8.2%*
NB = naltrexone/bupropion. #COR-II: NB observed data are NB32/NB48 pooled (N = 825); no differences were observed for patients rerandomized to NB32 vs NB48. LS mean ± SE; *P < .001 vs placebo at all timepoints. COR-II: week 56 ITT-LOCF data from patients rerandomized to NB32 are double weighted to account for the prespecified exclusion of patients rerandomized to NB48. ITT-LOCF: patients with a baseline and ≥ 1 postbaseline weight measurement while on study drug. Press release. October 27, 2009. Available at: http://ir.orexigen.com/phoenix.zhtml?c=207034&p=irol-newsArticle&ID=1346886&highlight Accessed April 29, 2010.
Placebo (N=456) NB32 (N=702)NB32 (N=471)Placebo (N=511)
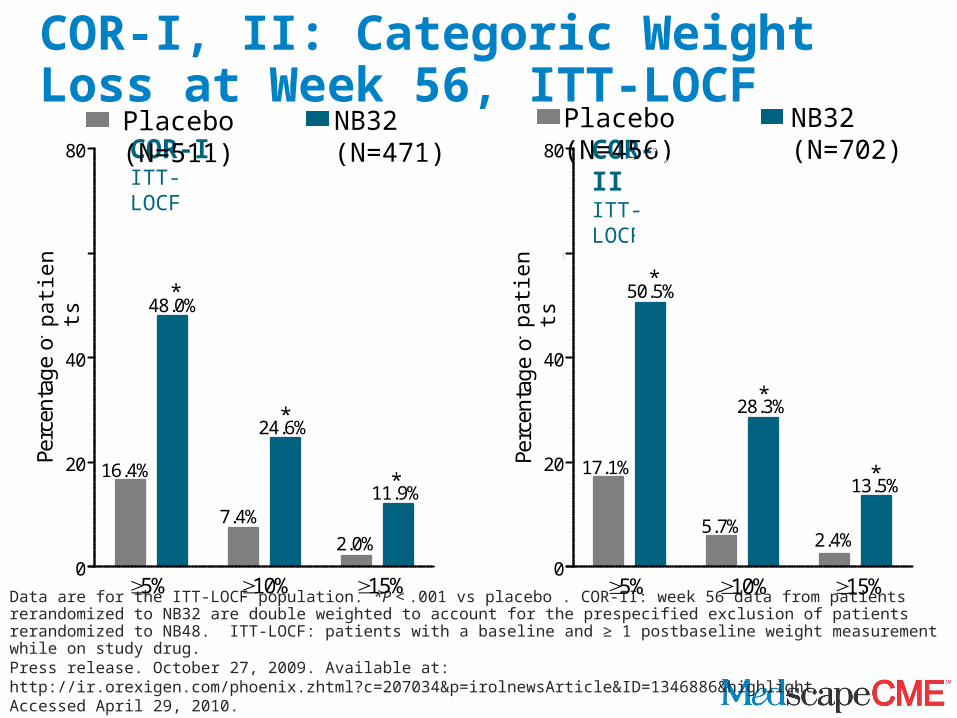
COR-I, II: Categoric Weight Loss at Week 56, ITT-LOCF
Data are for the ITT-LOCF population. *P < .001 vs placebo . COR-II: week 56 data from patients rerandomized to NB32 are double weighted to account for the prespecified exclusion of patients rerandomized to NB48. ITT-LOCF: patients with a baseline and ≥ 1 postbaseline weight measurement while on study drug. Press release. October 27, 2009. Available at: http://ir.orexigen.com/phoenix.zhtml?c=207034&p=irolnewsArticle&ID=1346886&highlight Accessed April 29, 2010.
COR-IIITT-LOCF
COR-IITT-LOCF
Placebo (N=456) NB32 (N=702)Placebo (N=511) NB32 (N=471)
0
20
40
60
80
16.4%
48.0%
24.6%
*
*
7.4%11.9%
*
2.0%
5% 10% 15%
Perc
enta
ge o
f su
bjec
ts
0
20
40
60
80
17.1%
50.5%
28.3%
*
*
5.7%
13.5%*
2.4%
5% 10% 15%
56.3%*
Perc
enta
ge o
f su
bjec
ts
patie
nts
patie
nts

COR-I: Improvements in Control of Eating, ITT-LOCF
Less More
How difficult has it been to control your eating?
How often have you eaten in response to food cravings?
How difficult has it been to resist any food cravings?
COR-I Placebo (N = 511) NB32 (N = 471)
Change from baseline to week 56 endpoint for eating/craving-related items showing differences (P < .05) at weeks 8, 16, 28, and 56 in both COR-I and COR-II; responses reflect experiences during the 7 days prior to answering the questionnaire; ITT-LOCF: patients with a baseline and ≥ 1 postbaseline weight measurement while on study drug. Data are LS mean ± SE; *P < .05 vs placebo; the COEQ consists of 21 questions with responses given using a 100-mm visual analogue scale. COR-II: week 56 data from patients rerandomized to NB32 are double weighted to account for the prespecified exclusion of patients rerandomized to NB48. Press release. October 27, 2009. Available at: http://ir.orexigen.com/phoenix.zhtml?c=207034&p=irolnewsArticle&ID=1346886&highlight Accessed April 29, 2010.

COR-II: Improvements in Control of Eating, ITT-LOCF
COR-II How difficult has it been to control your eating?
How often have you had food cravings?
How difficult has it been to resist any food cravings?
Change from baseline to week 56 endpoint for eating/craving-related items showing differences (P < .05) at weeks 8, 16, 28, and 56 in both COR-I and COR-II; responses reflect experiences during the 7 days prior to answering the questionnaire; ITT-LOCF: patients with a baseline and ≥ 1 postbaseline weight measurement while on study drug. Data are LS mean ± SE; *P < .05 vs placebo; the COEQ consists of 21 questions with responses given using a 100-mm visual analogue scale. COR-II: week 56 data from patients rerandomized to NB32 are double weighted to account for the prespecified exclusion of patients rerandomized to NB48. Press release. October 27, 2009. Available at: http://ir.orexigen.com/phoenix.zhtml?c=207034&p=irolnewsArticle&ID=1346886&highlight Accessed April 29, 2010.
More
Placebo (N = 456) NB32 (N = 702)
Less

COR-I, II: Most Common Treatment-Emergent Adverse Events (TEAE)
COR-I COR-II
PlaceboN=569
NB16N=569
NB32N=573
PlaceboN=492
NB32/48N=992
Nausea 5.3% 27.2%* 29.8%* 6.9% 29.2%*Headache 9.3% 16.0%* 13.8%* 8.7% 17.5%*Constipation 5.6% 15.8%* 15.7%* 7.1% 19.1%*Dizziness 2.6% 7.7%* 9.4%* 3.7% 6.9%*Vomiting 2.5% 6.3%* 9.8%* 2.0% 8.5%*Dry mouth 1.9% 7.4%* 7.5%* 2.6% 9.1%*
Patients discontinuing due to a TEAE 9.8% 21.4%* 19.5%* 13.8% 24.3%*Nausea 0.4% 4.6%* 6.3%* 0.2% 6.0%*Dizziness 0.5% 2.3%* 1.2% 0.2% 1.0%Headache 0.7% 1.6% 0.9% 0.8% 2.6%*Vomiting 0.2% 0.7% 0.9% 0% 0.8%
Insomnia 0.2% 0.7% 0.7% 1.0% 0.8%TEAEs > 5% in any NB group and 2x the incidence in the respective placebo group. Top 5 TEAEs leading to discontinuation in NB groups. Data are for the safety analysis set: patients taking ≥ 1 tablet of study drug and with ≥ 1 investigator contact/assessment at any time after the start of study treatment. *P < .05 vs placebo Press release. October 27, 2009. Available at: http://ir.orexigen.com/phoenix.zhtml?c=207034&p=irolnewsArticle&ID=1346886&highlightAccessed April 29, 2010.
0
5
10
15
100
MildModerateSevere
4 8 12 16 20 24 28 32 36 40 44 48 52 56
Week
Inci
denc
e of
nau
sea
(%)
0
5
10
15
100
MildModerateSevere
4 8 12 16 20 24 28 32 36 40 44 48 52 56
Week
Inci
denc
e of
nau
sea
(%)
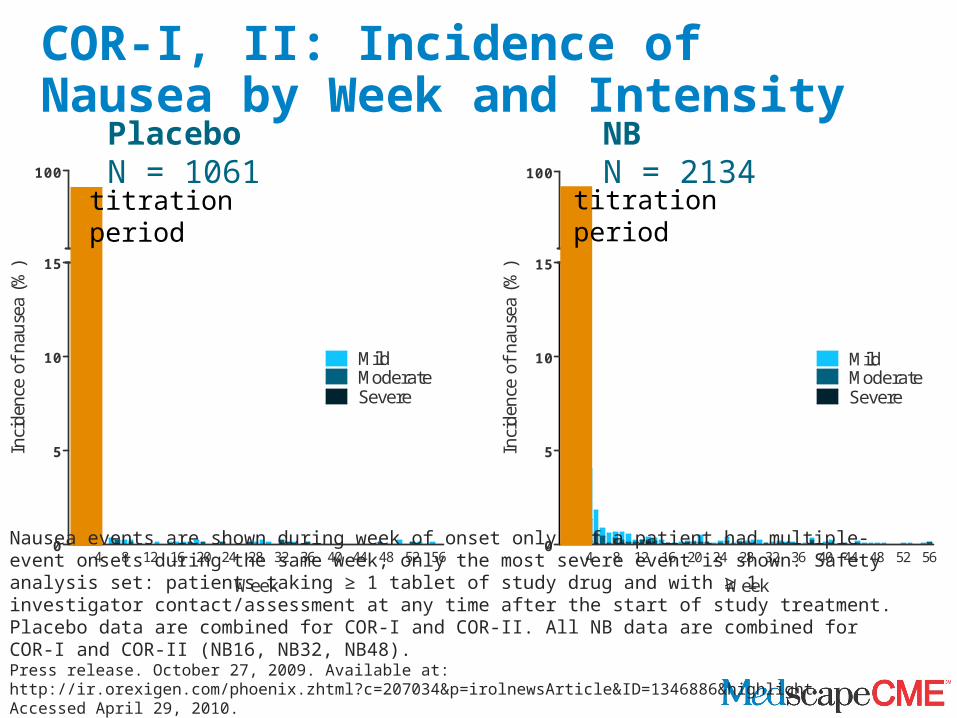
COR-I, II: Incidence of Nausea by Week and Intensity
Nausea events are shown during week of onset only. If a patient had multiple-event onsets during the same week, only the most severe event is shown. Safety analysis set: patients taking ≥ 1 tablet of study drug and with ≥ 1 investigator contact/assessment at any time after the start of study treatment. Placebo data are combined for COR-I and COR-II. All NB data are combined for COR-I and COR-II (NB16, NB32, NB48). Press release. October 27, 2009. Available at: http://ir.orexigen.com/phoenix.zhtml?c=207034&p=irolnewsArticle&ID=1346886&highlightAccessed April 29, 2010.
NBN = 2134
PlaceboN = 1061titrationperiod
titrationperiod

Activity Inhibits activity of glutamate at
AMPA/kainate receptors Inhibits activation of L-type
voltage-dependent Ca++ channels Inhibits carbonic anhydrase
(CA-II, CA-IV) Modulates lipoprotein lipase
activity Stimulates thermogenesis and
energy expenditure (some models) Downregulation of corticotropin-
releasing hormone, glucocorticoids (GC), and GC receptors (depends on model)
Other preliminary data
Reduces body weight (?)
Significance to Body Weight Loss
Reduces body weight (?)
Reduces body weight (?)
Reduces fat depositionand triglyceridesReduces body weight
Reduces body weight, other effects on energy metabolism
Effects on energy metabolism
Potential Activities of Topiramate Involved in Energy Balance

-10
-8
-6
-4
-2
0
0 2 4 6 8 10 12 14 16 18 20 22 24
Placebo (n=48)
64 mg/d TPM (n=57)
96 mg/d TPM (n=49)
192 mg/d TPM (n=50)
384 mg/d TPM (n=44)
Topiramate in Obesity: Percentage of Body Weight Change From Baseline to Week 24
P < .05 from week 4TPM = topiramateBray G, et al. Obes Res. 2003;11:722-733.
Weeks
Wei
ght C
hang
e (%
)

400 mg
Proprietary Investigational Treatment for Obesity
• Once-daily, oral, controlled-release formulation of low-dose phentermine and topiramate
• Specifically designed to affect normal eating patterns over 24 hours -- simultaneously addressing appetite, satiety, and cravings
0 200100 30050 150 250 350
Topiramate
0 30 mg(free base)
155 10 253.75 7.5
Phentermine
Maximum Approved Doses
20
23 46 92
Low Mid FullPress release. Sept 9, 2009. Available at: http://ir.vivus.com/releasedetail.cfm?ReleaseID=407933Accessed April 27, 2010.
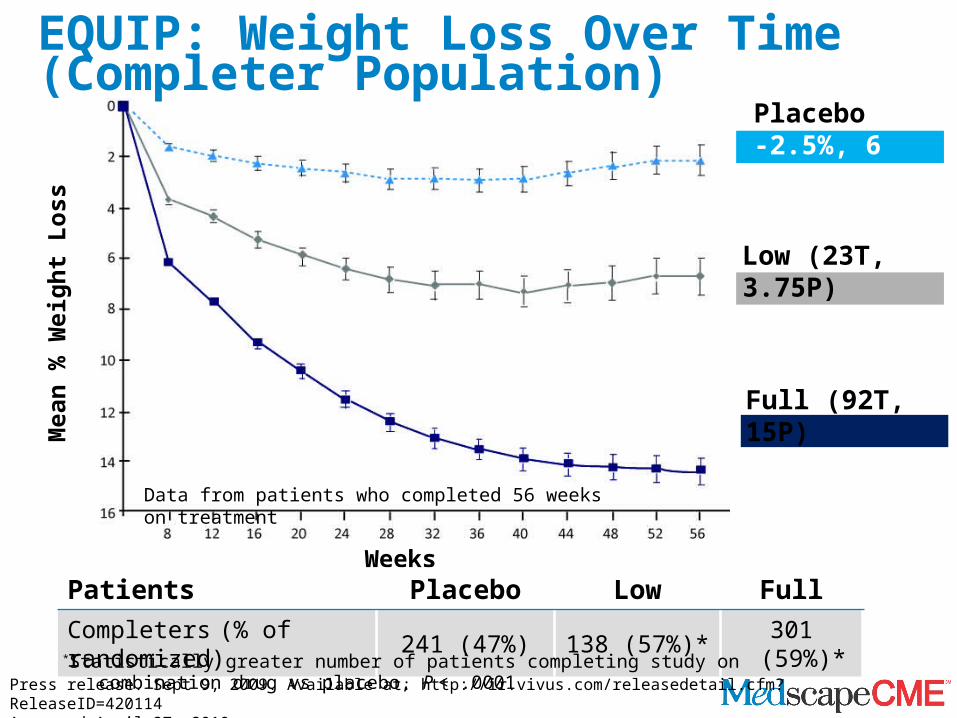
Low (23T, 3.75P)-7.0%, 18 lb
Placebo-2.5%, 6 lb
Full (92T, 15P)-14.7%, 37 lb
Mea
n %
Wei
ght L
oss
WeeksPatients Placebo Low FullCompleters (% of randomized) 241 (47%) 138 (57%)* 301 (59%)*
*Statistically greater number of patients completing study on combination drug vs placebo, P < .0001
EQUIP: Weight Loss Over Time (Completer Population)
Press release. Sept 9, 2009. Available at: http://ir.vivus.com/releasedetail.cfm?ReleaseID=420114 Accessed April 27, 2010.
Data from patients who completed 56 weeks on treatment
Mid (46T, 7.5P)-10.5%, 24 lb
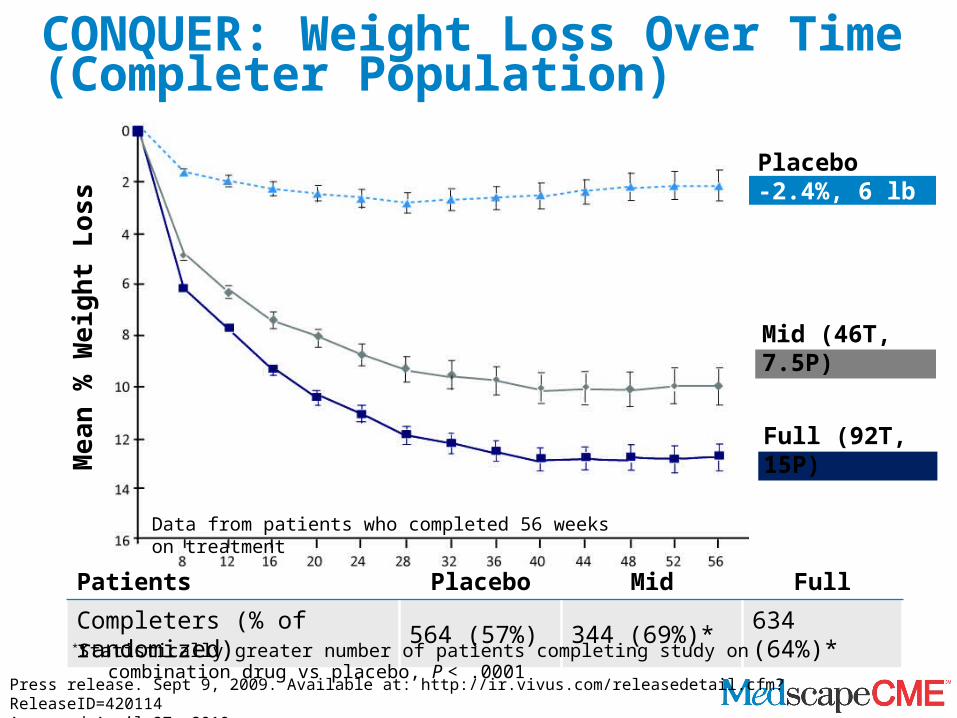
CONQUER: Weight Loss Over Time (Completer Population)
Placebo-2.4%, 6 lb
Mea
n %
Wei
ght L
oss
Weeks
Patients Placebo Mid Full
Completers (% of randomized) 564 (57%) 344 (69%)* 634 (64%)*
Full (92T, 15P)-13.2%, 30 lb
*Statistically greater number of patients completing study on combination drug vs placebo, P < .0001
Press release. Sept 9, 2009. Available at: http://ir.vivus.com/releasedetail.cfm?ReleaseID=420114 Accessed April 27, 2010.
Data from patients who completed 56 weeks on treatment
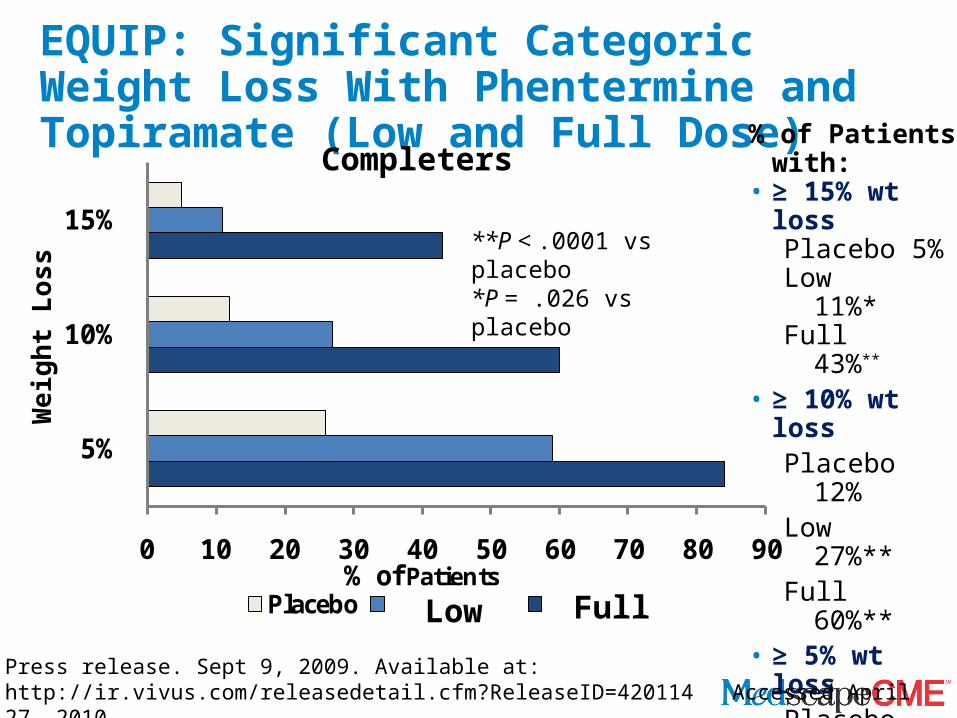
EQUIP: Significant Categoric Weight Loss With Phentermine and Topiramate (Low and Full Dose)
0 10 20 30 40 50 60 70 80 90
5%
10%
15%
% of PatientsPlacebo Qnexa Low Qnexa Full
% of Patients with:
• ≥ 15% wt lossPlacebo 5%Low
11%* Full
43%**
• ≥ 10% wt lossPlacebo 12%Low
27%**Full
60%**• ≥ 5% wt loss
Placebo 26%Low
59%**Full
84%**
Completers
**P < .0001 vs placebo*P = .026 vs placebo
Wei
ght L
oss
Low Full
Press release. Sept 9, 2009. Available at: http://ir.vivus.com/releasedetail.cfm?ReleaseID=420114 Accessed April 27, 2010.
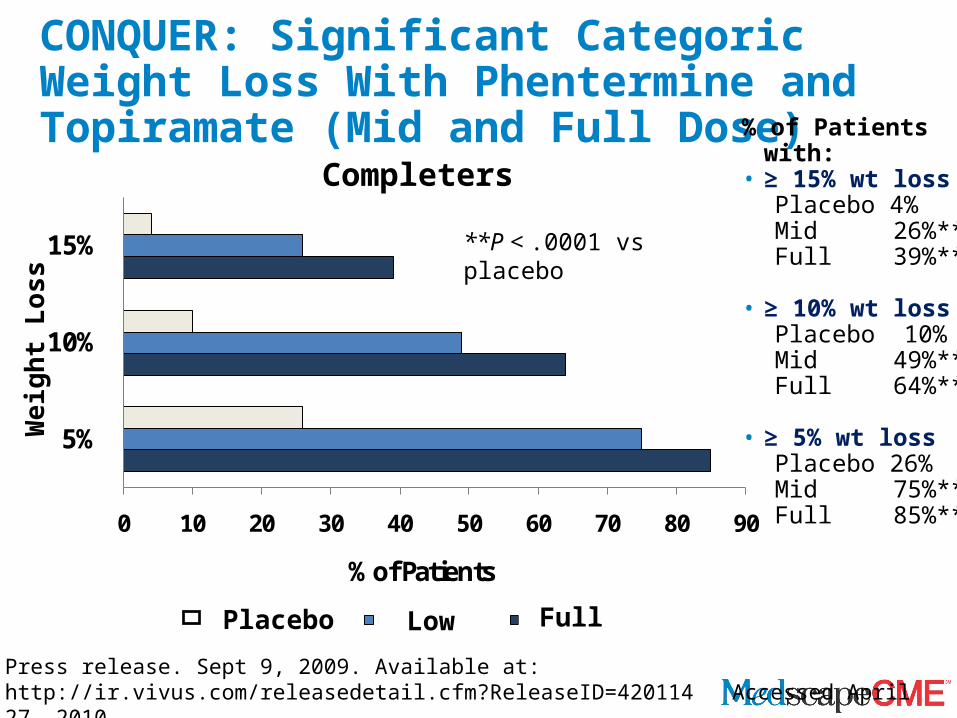
CONQUER: Significant Categoric Weight Loss With Phentermine and Topiramate (Mid and Full Dose)
0 10 20 30 40 50 60 70 80 90
5%
10%
15%
% of Patients
Placebo Qnexa Mid Qnexa Full
% of Patients with:• ≥ 15% wt loss
Placebo 4% Mid 26%**Full 39%**
• ≥ 10% wt loss Placebo 10% Mid 49%** Full 64%**
• ≥ 5% wt loss Placebo 26%Mid 75%**Full 85%**
Completers
**P < .0001 vs placebo
Wei
ght L
oss
Low FullPlacebo
Press release. Sept 9, 2009. Available at: http://ir.vivus.com/releasedetail.cfm?ReleaseID=420114 Accessed April 27, 2010.
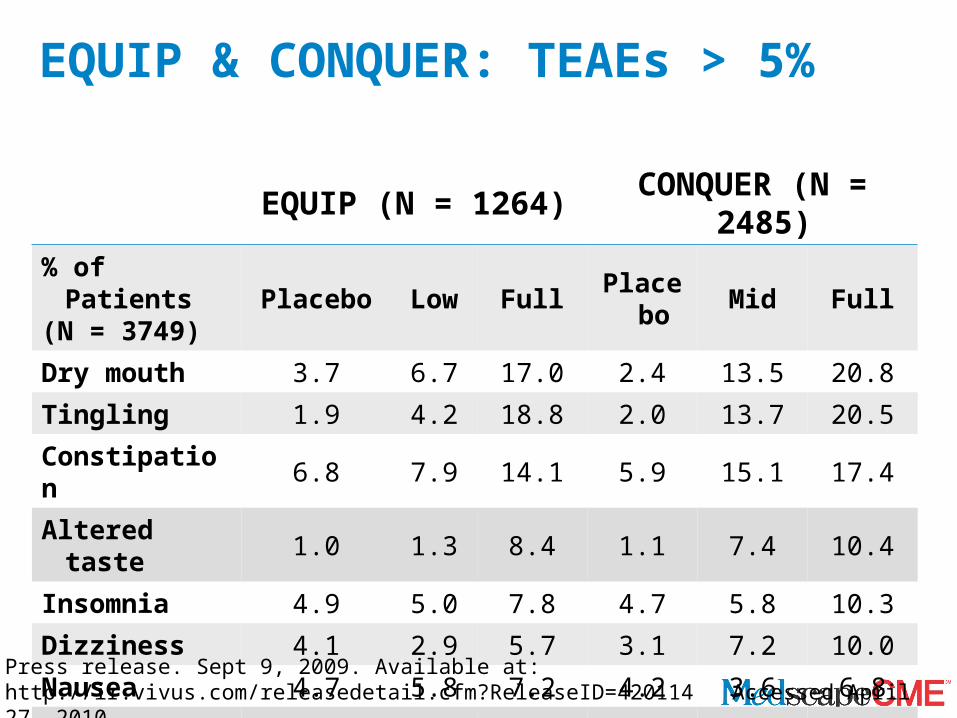
EQUIP & CONQUER: TEAEs > 5%
EQUIP (N = 1264) CONQUER (N = 2485)% of Patients(N = 3749) Placebo Low Full Placebo Mid Full
Dry mouth 3.7 6.7 17.0 2.4 13.5 20.8
Tingling 1.9 4.2 18.8 2.0 13.7 20.5
Constipation 6.8 7.9 14.1 5.9 15.1 17.4
Altered taste 1.0 1.3 8.4 1.1 7.4 10.4
Insomnia 4.9 5.0 7.8 4.7 5.8 10.3
Dizziness 4.1 2.9 5.7 3.1 7.2 10.0
Nausea 4.7 5.8 7.2 4.2 3.6 6.8
Blurred vision 3.1 6.3 4.5 3.6 4.0 6.0
Press release. Sept 9, 2009. Available at: http://ir.vivus.com/releasedetail.cfm?ReleaseID=420114 Accessed April 27, 2010.

EQUIP & CONQUER: Discontinuation RateDue to AEs in All Doses Studied
Placebo Low Mid Full
Number of patients 1508 241 498 1507Discontinuation due to AEs 9% 12% 12% 18% Blurred vision 0.5% 2.1% 0.8% 0.7% Headache 0.7% 1.7% 0.2% 0.9% Insomnia 0.4% 0.0% 0.4% 1.7% Depression 0.2% 0.0% 0.8% 1.4% Tingling 0.0% 0.4% 1.0% 1.2% Irritability 0.1% 0.8% 0.8% 1.2% Anxiety 0.3% 0.0% 0.2% 1.1% Dizziness 0.2% 0.4% 1.2% 0.8% Includes adverse events (AEs) by dose for EQUIP & CONQUER, which lead to discontinuation
in > 1% of patientsPress release. Sept 9, 2009. Available at: http://ir.vivus.com/releasedetail.cfm?ReleaseID=420114 Accessed April 27, 2010.
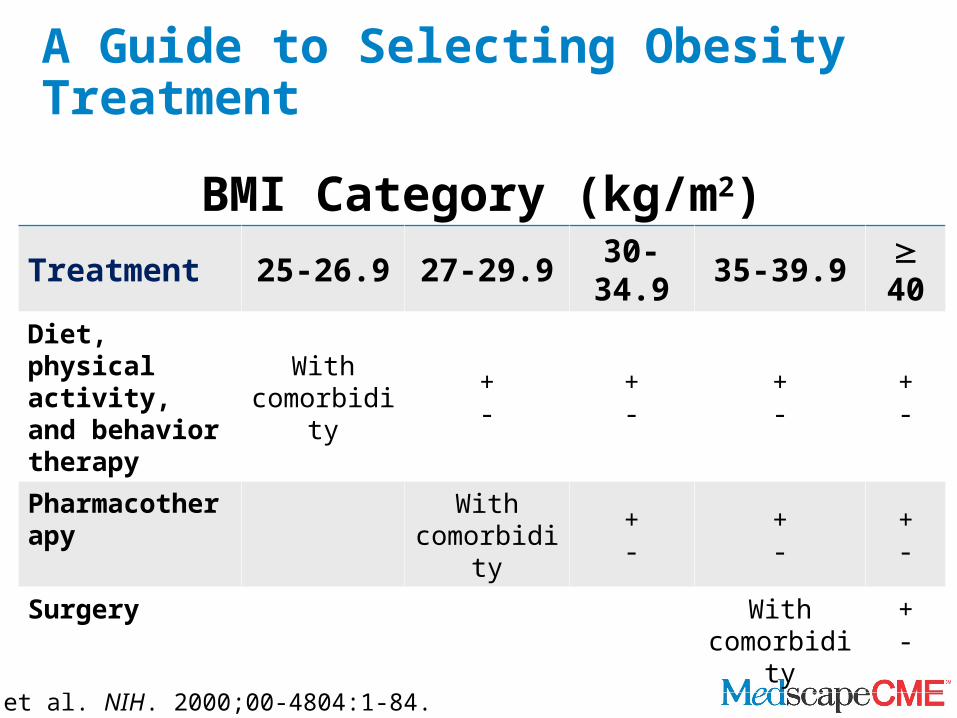
A Guide to Selecting Obesity Treatment
NIH, et al. NIH. 2000;00-4804:1-84.
BMI Category (kg/m2)Treatment 25-26.9 27-29.9 30-34.9 35-39.9
40Diet, physical activity, and behavior therapy
Withcomorbidity
+-
+-
+-
+-
Pharmacotherapy Withcomorbidity
+-
+-
+-
Surgery Withcomorbidity
+-
Summary• Appetite control and energy expenditure are
regulated by peripheral and central signaling mechanisms
• Newer antiobesity agents target these processes• Due to the complexity of the hypothalamic circuitry,
combined drug therapy is likely to be more effective than monotherapy for weight control
• Antiobesity medications are anticipated to have a more significant role in the treatment of patients with obesity

Thank you for participatingin this activity.
To proceed to the online CME test, click on the Earn CME Credit link on this page.