Embed Size (px)
Citation preview

Obesity and its Relation to Mortality
and Morbidity Costs
DECEMBER 2010
PREPARED BY
Donald F. Behan, PhD, FSA, FCA, MAAA
Samuel H. Cox, PhD, FSA, CERA
University of Manitoba
CONTRIBUTING CO-AUTHORS:
Yijia Lin, Ph.D.
Jeffrey Pai, Ph.D, ASA
Hal W. Pedersen, Ph.D, ASA
Ming Yi, ASA The opinions expressed and conclusions reached by the authors are their own and do not represent any official position or opinion of the Society of Actuaries or its members. The Society of Actuaries makes no representation or warranty to the accuracy of the information. © 2010 Society of Actuaries, All Rights Reserved
SPONSORED BY
Committee on Life Insurance Research
Society of Actuaries

Obesity and its Relation to Mortality andMorbidity Costs
Abstract
We reviewed almost 500 research articles on obesity and its relation to mortalityand morbidity, focusing primarily on papers published from January 1980 to June 2009.There is substantial evidence that obesity is a worldwide epidemic and that it has asignificant negative impact on health, mortality and related costs. Overweight andobesity are associated with increased prevalence of diabetes, cardiovascular disease,hypertension and some cancers. There also is evidence that increased weight is asso-ciated with kidney disease, stroke, osteoarthritis and sleep apnea. Moreover, empiricalstudies report that obesity significantly increases the risk of death.
We used the results to estimate costs due to overweight and obesity in the UnitedStates and Canada. We estimate that total annual economic cost of overweight andobesity in the United States and Canada caused by medical costs, excess mortalityand disability is approximately $300 billion in 2009.
JEL Classification: H10, H11, J11, J32
November 30, 2010The Society of Actuaries supported this project with a research grant.

Obesity and its Relation to Mortality and Morbidity Costs 1
Contents
1 Introduction 41.1 Definition of Obesity and Overweight . . . . . . . . . . . . . . . . . . . . 51.2 Effect of BMI on Medical Conditions . . . . . . . . . . . . . . . . . . . . 8
2 Prevalence of Obesity 92.1 More Results on Prevalence of Overweight and Related Disease . . . . . 92.2 Obesity in the United States . . . . . . . . . . . . . . . . . . . . . . . . . 102.3 Prevalence of Obesity in Canada . . . . . . . . . . . . . . . . . . . . . . . 12
3 Obesity and Cardiovascular Disease 13
4 Obesity and Diabetes 19
5 Obesity and Cancer 235.1 Other Literature on Cancer Risk . . . . . . . . . . . . . . . . . . . . . . 25
6 Obesity and Other Conditions 266.1 Osteoarthritis . . . . . . . . . . . . . . . . . . . . . . . . . . . . . . . . . 266.2 Asthma . . . . . . . . . . . . . . . . . . . . . . . . . . . . . . . . . . . . 276.3 Renal Disease . . . . . . . . . . . . . . . . . . . . . . . . . . . . . . . . . 286.4 In-Hospital Infection . . . . . . . . . . . . . . . . . . . . . . . . . . . . . 28
7 Excess Mortality Caused by Obesity 287.1 Overview . . . . . . . . . . . . . . . . . . . . . . . . . . . . . . . . . . . . 287.2 Population Studies of Excess Mortality due to Obesity . . . . . . . . . . 297.3 Excess Mortality due to Obesity in Life Insurance Studies . . . . . . . . 347.4 Effect of Overweight and Obesity on Mortality Rates . . . . . . . . . . . 377.5 Costs Related to Loss of Productivity Because of Excess Mortality . . . . 38
8 Disability 398.1 Overview . . . . . . . . . . . . . . . . . . . . . . . . . . . . . . . . . . . . 398.2 Disability Costs of Overweight and Obesity . . . . . . . . . . . . . . . . . 408.3 Effect of Juvenile Obesity . . . . . . . . . . . . . . . . . . . . . . . . . . 42
9 Economic Costs of Obesity 429.1 Articles on Obesity Costs . . . . . . . . . . . . . . . . . . . . . . . . . . 429.2 Risk Estimates . . . . . . . . . . . . . . . . . . . . . . . . . . . . . . . . 519.3 Excess Medical Costs Caused by Overweight and Obesity . . . . . . . . . 519.4 Medical Costs of Overweight in Children . . . . . . . . . . . . . . . . . . 539.5 Effect of the Definition of Overweight on the Estimated Excess Medical
Cost . . . . . . . . . . . . . . . . . . . . . . . . . . . . . . . . . . . . . . 539.6 Overweight and Osteoarthritis . . . . . . . . . . . . . . . . . . . . . . . . 539.7 Obesity in Older Populations . . . . . . . . . . . . . . . . . . . . . . . . 54
2 Obesity and its Relation to Mortality and Morbidity Costs
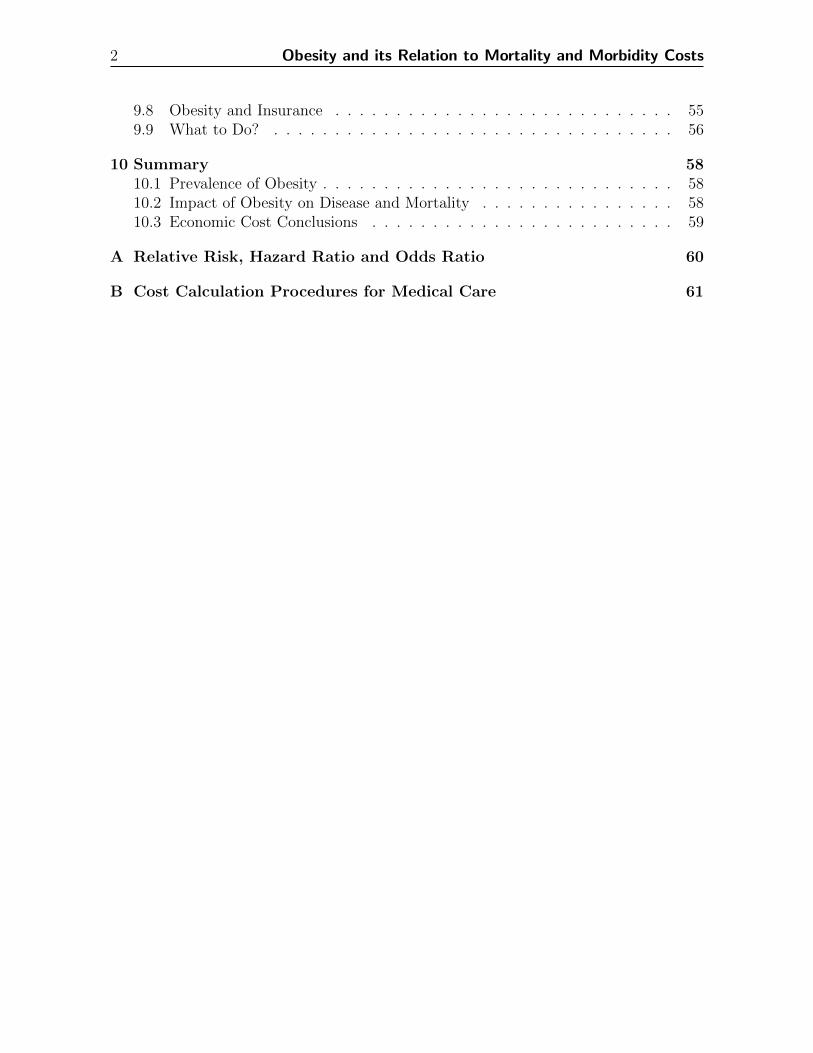
9.8 Obesity and Insurance . . . . . . . . . . . . . . . . . . . . . . . . . . . . 559.9 What to Do? . . . . . . . . . . . . . . . . . . . . . . . . . . . . . . . . . 56
10 Summary 5810.1 Prevalence of Obesity . . . . . . . . . . . . . . . . . . . . . . . . . . . . . 5810.2 Impact of Obesity on Disease and Mortality . . . . . . . . . . . . . . . . 5810.3 Economic Cost Conclusions . . . . . . . . . . . . . . . . . . . . . . . . . 59
A Relative Risk, Hazard Ratio and Odds Ratio 60
B Cost Calculation Procedures for Medical Care 61
Obesity and its Relation to Mortality and Morbidity Costs 3
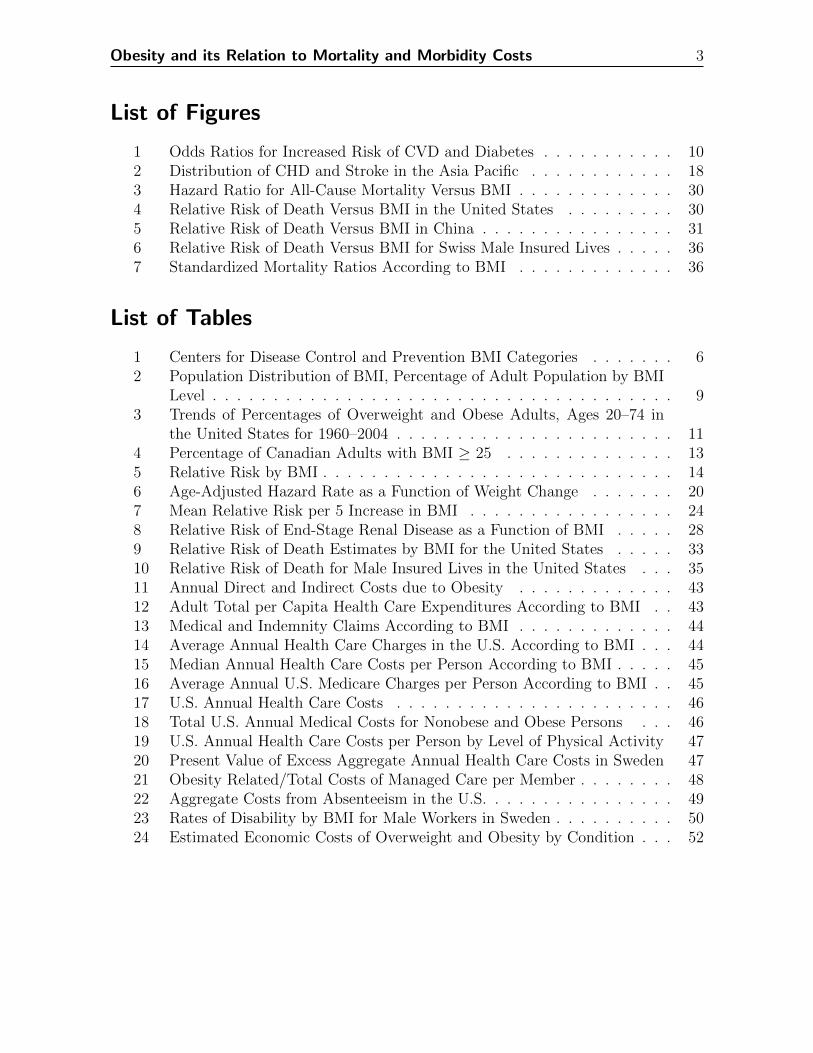
List of Figures
1 Odds Ratios for Increased Risk of CVD and Diabetes . . . . . . . . . . . 102 Distribution of CHD and Stroke in the Asia Pacific . . . . . . . . . . . . 183 Hazard Ratio for All-Cause Mortality Versus BMI . . . . . . . . . . . . . 304 Relative Risk of Death Versus BMI in the United States . . . . . . . . . 305 Relative Risk of Death Versus BMI in China . . . . . . . . . . . . . . . . 316 Relative Risk of Death Versus BMI for Swiss Male Insured Lives . . . . . 367 Standardized Mortality Ratios According to BMI . . . . . . . . . . . . . 36
List of Tables
1 Centers for Disease Control and Prevention BMI Categories . . . . . . . 62 Population Distribution of BMI, Percentage of Adult Population by BMI
Level . . . . . . . . . . . . . . . . . . . . . . . . . . . . . . . . . . . . . . 93 Trends of Percentages of Overweight and Obese Adults, Ages 20–74 in
the United States for 1960–2004 . . . . . . . . . . . . . . . . . . . . . . . 114 Percentage of Canadian Adults with BMI ≥ 25 . . . . . . . . . . . . . . 135 Relative Risk by BMI . . . . . . . . . . . . . . . . . . . . . . . . . . . . . 146 Age-Adjusted Hazard Rate as a Function of Weight Change . . . . . . . 207 Mean Relative Risk per 5 Increase in BMI . . . . . . . . . . . . . . . . . 248 Relative Risk of End-Stage Renal Disease as a Function of BMI . . . . . 289 Relative Risk of Death Estimates by BMI for the United States . . . . . 3310 Relative Risk of Death for Male Insured Lives in the United States . . . 3511 Annual Direct and Indirect Costs due to Obesity . . . . . . . . . . . . . 4312 Adult Total per Capita Health Care Expenditures According to BMI . . 4313 Medical and Indemnity Claims According to BMI . . . . . . . . . . . . . 4414 Average Annual Health Care Charges in the U.S. According to BMI . . . 4415 Median Annual Health Care Costs per Person According to BMI . . . . . 4516 Average Annual U.S. Medicare Charges per Person According to BMI . . 4517 U.S. Annual Health Care Costs . . . . . . . . . . . . . . . . . . . . . . . 4618 Total U.S. Annual Medical Costs for Nonobese and Obese Persons . . . 4619 U.S. Annual Health Care Costs per Person by Level of Physical Activity 4720 Present Value of Excess Aggregate Annual Health Care Costs in Sweden 4721 Obesity Related/Total Costs of Managed Care per Member . . . . . . . . 4822 Aggregate Costs from Absenteeism in the U.S. . . . . . . . . . . . . . . . 4923 Rates of Disability by BMI for Male Workers in Sweden . . . . . . . . . . 5024 Estimated Economic Costs of Overweight and Obesity by Condition . . . 52

4 Obesity and its Relation to Mortality and Morbidity Costs
1. Introduction
Obesity and overweight have been shown to increase the rate of several common adversemedical conditions, resulting in economic costs of $300 billion per year in the UnitedStates and Canada. These costs result from an increased need for medical care andthe loss of economic productivity resulting from excess mortality and disability. Thispaper reviews the literature on overweight and obesity and summarizes the evaluationof economic costs.
Medical conditions with a statistically significant relationship to obesity and over-weight include cardiovascular impairments, diabetes, hypertension, cancer, kidney dis-ease, strokes, osteoarthritis and sleep apnea. The causal relationship of most of theseconditions to overweight and obesity has been demonstrated by research projects inwhich individuals were assisted in losing weight and the degree of the conditions wasreduced or eliminated (Ross et al., 2000; Anderson et al., 2007).
Determining causation is a complex process that goes far beyond analysis of statis-tical data (Hitchcock, 2002). A condition such as diabetes may be caused by severalconcurring conditions, such as age, genetic predisposition and obesity. To measure theeconomic effects of obesity, we evaluated the cost difference in the absence of obesity.We believe the types of controlled studies reviewed here permit such an evaluation. Itis not necessary, for our purpose, to draw an inventory of conditions that bear on theprobability of occurrence of morbid conditions.
The fact that the level of obesity in the population may be influenced by educationand public policy and that the reduction in obesity, other things being equal, wouldlead to a decrease in morbidity and mortality, justify the isolation of obesity as one ofthe causes of morbidity. The papers on which our estimates of excess morbidity andmortality are based – all published in peer-reviewed journals – insist on the adequatecontrol of confounding variables. The evidence they provide in support of a strongstatistical association and the elimination of other potential causes points to a causalrelationship between obesity and certain diseases. Whether obesity is the primary causeof a disease or simply an aggravating factor, we believe the cost increases and economiceffects estimated in this paper would not arise but for obesity in the population.
There are significant issues that affect the quantitative effect of obesity on the con-ditions noted in this review. For example, some health problems cause a loss of weight,so there are elements of reverse causation in the relationship between low weight andcertain health problems. In addition, self-reported body weight is somewhat unreliableand the difference between actual and reported weight is not random, but tends to havean increased negative value as weight increases. There is evidence that some of thepapers we reviewed did not make adequate consideration of these issues and, as a re-sult, may have understated the effects of overweight and obesity. The purpose of thisreview was not to challenge peer-reviewed papers but rather to summarize their findingsfor potential users of the literature. It is important for users of the research results toconsider the possible lack of consideration of issues that may have caused some errorsin the results determined.

Obesity and its Relation to Mortality and Morbidity Costs 5
1.1. Definition of Obesity and Overweight
According to Spence-Jones (2003), body mass index (BMI) is the most commonly usedindicator of body fat1, providing the basis for determining whether someone may bedefined as obese, overweight, etc. BMI is the person’s weight in kilograms divided bythe square of the height in meters. As an example, the Centers For Disease Control andPrevention (CDC) website calculates that a person with weight 68 kilograms and height1.65 meters has a BMI of 68/(1.65)2 = 24.98. The value in terms of English measurementis approximately 703 times the weight in pounds divided by the square of the height ininches. (Some sources use an incorrect multiple of 704.5, which results from deriving afour-digit multiple on the basis of the two-digit approximation: 1kilogram ≈ 2.2pound.Multiplying by 700 would be sufficiently accurate for most purposes.)
The definitions of overweight and obesity have become accepted since the 1980s andwere based on the 85th and 95th percentiles of the adult population BMI from 1971 to1974. Excess rates of medical conditions in relation to BMI are not limited to a BMIin excess of 25. Moderate increases in several conditions with relations to obesity arefound in people with a BMI in excess of 22.
The definition of BMI itself goes back at least 160 years, when it was defined byAdolphe Quetelet, who provided mathematical evaluations of medical risks to insurancecompanies in France (Eknoyan, 2008). No significant challenge to this definition hasbeen made since the time of its establishment, but we are not aware of any attempts totest the basic structure of the BMI formula, to see whether it is the most appropriateway to relate body mass to health.
The National Heart Lung and Blood Institute organized an expert panel to developand publish clinical guidelines for identifying and treating overweight and obesity (Pi-Sunyer, 2000, 1998). The guidelines, and the definition of obesity in terms of BMI, havebeen widely accepted. The CDC, the World Health Organization and the great majorityof researchers use these BMI-based definitions, as shown in Table 1.
In this review, we will use these definitions of weight-status categories. If a citedpaper uses an alternative definition, we will note the difference; otherwise, we use theaccepted definitions. We have found that more recent research in Asia often uses differentdefinitions, which some researchers claim are more appropriate for Asian populations.However, Gu et al. (2006) conclude from a large study of adults in China from 1991 to2000 that their findings are consistent with studies of Western populations and that asingle standard for overweight and obesity is justified.
Although BMI is the most commonly used measure of body fat, perhaps because ofthe influence of the clinical guideline published in 1998, it may not be the best measure.Burkhauser and Cawley (2008) claim there is “wide agreement in the medical literature”that BMI is seriously flawed because it does not distinguish fat from fat-free body masssuch as muscle and bone. They advocate strongly for researchers to use more accuratemeasures such as bioelectrical impedance analysis, fat-free mass, total body fat and per-centage body fat. The differences they provide are dramatic. For example, using theNational Health and Nutrition Examination Survey (NHANES) III data, obesity preva-
1The Centers for Disease Control and Prevention has an easy-to-follow discussion of BMI on itswebsite: http://www.cdc.gov/healthyweight/assessing/bmi/

6 Obesity and its Relation to Mortality and Morbidity Costs
Table 1Centers for Disease Control and Prevention BMI Categories
BMI Weight Status
Below 18.5 Underweight18.5–24.9 Normal25.0–29.9 Overweight30.0 and above ObeseAbove 40.0 Extremely obese
Definitions apply to all adult men and women. Defini-tions for children vary by sex and age. The World HealthOrganization uses the same definitions. Source: http:
//www.cdc.gov/healthyweight/assessing/bmi/
lence using BMI is 23.7 percent for men and 19.0 percent for women. Using percentagebody fat, the prevalence is 70.4 percent for men and 43.4 percent for women. Romero-Corral et al. (2008) find similar results in their study of BMI versus body fat percentagefor a cross-sectional study of 13,601 U.S. adults. According to Romero-Corral et al., us-ing BMI as a measure dramatically understates the magnitude of the obesity epidemic.They discuss alternatives to BMI, including biometrical impedance, hydrostatic weigh-ing, dual-energy X-ray absorptiometry and air displacement plethysmography. Theyrecommend using bioelectrical impedance for measuring body fatness because it is moreaccurate than BMI, it is easy to obtain, it does not use radiation and it is relatively lowcost.
Janssen (2007) shows BMI is less useful for diagnosing obesity for older adults, over65, than in young and middle-age adults. On the other hand, Ryan et al. (2008) findthat metabolic syndrome and cardiovascular disease risk factor status did not vary sub-stantially when subjects were categorized by waist circumference or BMI.
Waist circumference and waist-to-hip ratio are other indicators of body fatness.Waist circumference is simply the person’s waist circumference in centimeters. Yusufet al. (2005) have shown that waist circumference and waist-to-hip ratio offer betterestimates of myocardial infarction attributable to obesity than BMI, even though BMIis much more widely used as a measure of weight status. In a large cohort study of Chi-nese women, Zhang et al. (2007) found a positive monotonic dose-response relationshipbetween waist-hip ratio and the risk of death. This positive association was independentof BMI and socio-demographic and lifestyle factors.
Although waist circumference may indeed be a better measure with respect to heartdisease, Cumming and Pinkham (2008) found that “BMI and waist circumference areessentially equivalent in their ability to predict mortality risk in a male insurance pop-ulation.” A majority of the papers we found use BMI rather than body fat percentage,waist circumference or waist-to-hip ratio.
Roudebush et al. (2006) studied 241,966 life insurance policies, using BMI calculatedat the time of issue and standardized mortality ratios. They found a U-shaped relation-

Obesity and its Relation to Mortality and Morbidity Costs 7
ship. The ratio of mortality to the standard table rates increases as BMI increases fromthe normal level.
In a 2004 survey, Mokdad et al. (2004) estimate that “roughly 400,000 deaths nowoccur annually due to poor diet and physical inactivity. The gap between deaths due topoor diet and physical inactivity and those due to smoking has narrowed substantially.”Their article generated a series of corrections and comments (Barnoya and Glantz, 2004;Blair et al., 2004; Anstadt, 2004; Gandjour, 2004; McGinnis and Foege, 2004; Flegalet al., 2005), without altering the main conclusion of Mokdad et al.: Poor diet andphysical inactivity lead to more deaths than every other cause except tobacco. In dis-cussing the Mokdad et al. paper in a Journal of the American Medical Associationeditorial McGinnis and Foege (2004) conclude that deaths due to poor diet and inac-tivity “are in fact likely greater contributors to mortality than tobacco”. Flegal et al.obtain lower estimates perhaps because of differences in statistical methods. They es-timated that 111,909 excess deaths were associated with obesity, very much lower thanthe the earlier studies. They suggest that “the possibility that improvements in med-ical care, particularly for cardiovascular disease, the leading cause of death among theobese, and its risk factors may have led to a decreased association of obesity with totalmortality” (Flegal et al., 2005).
Not all of the studies we reviewed reported negative effects for obesity. In fact, mostresearch suggests that, while severe obesity and underweight significantly increase all-cause mortality, overweight does not appear to be a similar risk factor. For example,Arndt et al. (2007) held that among nonsmoker, heavily working men, normal andoverweight men experienced similar mortality. Similarly, Kaestner and Grossman (2008)reported that data from the U.S. National Longitudinal Survey of Youth indicated thatoverweight and obese children had about the same academic achievement scores as thoseof normal weight children. However, it has been hypothesized that excess weight is arisk factor for delayed recovery from neck pain, such as from whiplash injuries. Yetin a recent study of 4,395 persons with whiplash injuries, Yang et al. (2007) found noevidence that the overweight or obese have longer recovery rates.
Puhl and Heuer (2009) described the high degree of prejudice and discriminationthat obese individuals suffer in employment, education and health care. The studiesthey reviewed showed that obese patients were less likely to get screenings for breast,cervical and colorectal cancer, among other examples. The stigma of obesity evidentlycompounds its effect on health status and mortality. Mitchell et al. (2008) found that,based on data from the Canadian Community Health Survey 2003, overweight andobesity were associated with a markedly lower use of cervical cancer screening.
Obesity has a variety of significant effects on the body. For example, excess weightputs additional pressure on tissue in joints, such as the knees, causing increased risk ofarthritis and damage to tendons and ligaments. It also inhibits healing of joints damagedby accidents or surgery. Higher weight increases the effort of movement, causing stresson the heart and muscles. An increased volume of tissue in the torso and abdomen caninhibit the normal function of organs. For example, excess abdominal tissue can causeesophageal reflux and other digestive problems, which excess consumption of food mayexacerbate.
Alternatively, obesity may result from reduced physical activity, and certain excess
8 Obesity and its Relation to Mortality and Morbidity Costs
morbidity associated with obesity, such as cardiovascular problems, may be caused by thelack of exercise. Fatty tissue affects the chemical balance of the body, interacting withhormones such as estrogen and insulin and thus altering their effect on the body (Rosin,2007). While this paper does not investigate the reasons for the relationships betweenobesity and morbidity, the direct effects of obesity show the statistical relationshipsbetween obesity and morbidity may generally be assumed to indicate the presence ofcausal relationships.
There is further support for the causal relationship between obesity and morbidityin studies that have followed groups of obese people whose controlled diets reduced theirdegree of overweight, thereby significantly diminishing their health problems (Andersonet al., 2007).
1.2. Effect of BMI on Medical Conditions
Research on the effect of excess BMI on various medical conditions tends to relate BMIto the increase in rate of the conditions by using either an odds ratio or relative risk inrelation to the level of BMI. Some measurements of excess risk are evaluated in termsof hazard ratio. Relative risk, odds ratio and hazard ratio each measure the increasein risk of the particular condition but in a somewhat different manner. The specificsof these measurements are explained in Appendix 1. We have used relative risk forour analyses, and have converted odds ratio and hazard ratio to relative risk when usingresults from papers that evaluated the effects in terms of odds ratio or hazard ratio. Thechoice of measurement basis has no effect on the final results, but relative risk makesthe intermediate calculations less complicated.
The various studies of medical conditions are not consistent in terms of the level ofBMI included in the measurement of excess risk. For example, some studies computerisks based on overweight separately from obesity, while some combine them. Othersuse levels of BMI that do not match the specific levels that currently define overweightand obesity. To combine the results of these various studies, it is necessary to apply theproportion of the population with various levels of BMI. We have based our evaluationof the effects of various levels of BMI on the population distribution obtained from theNHANES 2007-08 survey, which identified the BMI of over 6,000 individuals in a randomsample of the population.
The shape of the abdomen is related to BMI, but the degree of abdominal adiposity,while strongly positively correlated to BMI, can have independent effects in people of thesame BMI. Abdominal adiposity has been shown to have independent negative healtheffects (Zhang et al., 2008). The fact that abdominal adiposity is strongly related toBMI, as well as the fact that BMI has significant effects, whether or not abdominaladiposity is considered, as well as the fact that most of the published studies are basedon BMI without considering abdominal adiposity separately, has caused us to base theresults of this literature review on BMI, without attempting to separate the effects ofabdominal adiposity.

Obesity and its Relation to Mortality and Morbidity Costs 9
2. Prevalence of Obesity
The proportion of the United States and Canada population over age 20 in the standardBMI groups is shown in Table 2. We used the specific distribution of BMI for the U.S.
Table 2Population Distribution of BMI, Percentage of Adult Population by BMI Level
BMI United States Canada Combined
< 18.5 1.9 2.1 1.918.5–25 33.0 34.0 33.125–30 34.3 34.2 34.330–35 19.2 17.4 19.035–40 7.4 7.6 7.4≥ 40 4.2 4.7 4.3
Total 100.0 100.0 100.0
Source: Tjepkema (2006, Table 3); NCHS(2009); CDC (2008)
population for our calculations because the total percentages for the U.S. were veryclose to the percentages for the U.S. and Canada, and the U.S. results were available ata detailed level that allowed us to determine population percentages and average BMIfor each relevant portion of the population.
2.1. More Results on Prevalence of Overweight and Related Disease
Balkau et al. (2007) reported on their study of data collected in 63 countries during 2005through primary care physicians. Participating physicians recruited patients, aged 18to 80, on two pre-specified half-days for a total of 69,409 men and 98,750 women. Foreach participating patient, the physician collected BMI and waist circumference, andrecorded presence (or not) of cardiovascular disease (CVD) and diabetes.
The study is interesting in several respects. First, it covers Northwest Europe, SouthEurope, East Europe, North Africa, South Africa, Middle East, East Asia, South Asia,Australia, Canada and Latin America (but not the U.S.). A majority of adults (64percent of men and 57 percent of women) in the study were either overweight or obese.Moreover, in all regions except South and East Asia, a majority of adults were overweightor obese.
Second, the study found a statistically significant graded increase in the frequencyof cardiovascular disease and diabetes mellitus with both BMI and waist circumference.We illustrate some of their results in Figure 1.
We note that this study selected only members of the population who had access toand a willingness to visit their primary-care physician. Since this is not a populationstudy, the results cannot apply to the entire population. On the other hand, this study

10 Obesity and its Relation to Mortality and Morbidity Costs
Figure 1Odds Ratios for Increased Risk of CVD and Diabetes
Odds
Ratio
Men
WC < 94 94 < WC < 102 WC > 102
1
2
3
4 Women
WC < 80 80 < WC < 88 WC > 88
1
2
3
4
CVD
Diabetes
The graphs show the odds ratios for increased risk of cardiovascular disease (CVD)and diabetes for all 69,409 men and 98,750 women based on the waist circumfer-ence in centimeters. The average waist circumference for men was 95.8 centimeterswith a standard deviation of 14.0 centimeters. For women, the average waist cir-cumference was 88.7 centimeters with a standard deviation of 14.9 centimeters.Source: Balkau et al. (2007, Table 2)
supports the idea that obesity has become a worldwide epidemic and that increasedBMI and waist circumference are associated with significantly higher odds ratios forcardiovascular disease and diabetes mellitus. We also note that this is measured BMIand waist circumference while the national surveys in the U.S. and Canada have includedboth measured BMI and the participants’ reported values. In a Dutch study, Visscheret al. (2006) found significant underreporting of BMI in adults and under-estimation ofobesity prevalence in the period between 1998 and 2001.
Stamatakis et al. (2005) studied economic factors related to obesity trends amongchildren in England from 1974 to 2003. They determined that obesity prevalence hadbeen accelerating and that it varied by socioeconomic class. Children from lower socioe-conomic classes had an odds ratio of 1.14 for obesity, compared to an odds ratio of 0.74for children from higher socioeconomic classes.
2.2. Obesity in the United States
In 2001, the U.S. Surgeon General’s Call To Action to Prevent and Decrease Over-weight and Obesity declared, “The United States is experiencing substantial increasesin overweight and obesity that cut across all ages, racial and ethnic groups, and bothgenders” (Satcher, 2001). Call to Action’s description of the trend in overweight andobesity for adults and children is based on NHANES for 1976-80, 1988-94 and 1999.Ogden et al. updated the statistics based on NHANES for 2003-04 and added NHANES1971-74 (Ogden et al., 2007b). Table 3 is from their article.
The CDC website has a table showing obesity prevalence and costs attributable toobesity by state (CDC, 2008). It also shows aggregate medical spending attributable tooverweight and obesity in 1998. The prevalence data is updated in (NCHS, 2009).

Obesity and its Relation to Mortality and Morbidity Costs 11
Table 3Trends of Percentages of Overweight and Obese Adults, Ages 20–74 in the
United States for 1960–2004
Sex Survey Overweight Obese Extremely obesePeriod BMI ≥ 25 BMI ≥ 30 BMI ≥ 40
Men and women 1960–1962 44.8 13.3 0.91971–1974 47.2 14.5 1.31976–1980 47.1 15.0 1.41988–1994 55.8 23.2 3.01999–2000 64.5 30.9 5.02001–2002 65.7 31.3 5.42003–2004 66.3 32.9 5.1
Men 1960–1962 49.4 10.7 0.31971–1974 53.8 12.1 0.61976–1980 52.6 12.7 0.41988–1994 60.8 20.5 1.81999–2000 66.9 27.7 3.32001–2002 69.9 28.4 3.92003–2004 71.1 31.7 3.0
Women 1960–1962 40.5 15.8 1.41971–1974 40.9 16.6 2.01976–1980 41.9 17.0 2.21988–1994 51.0 25.9 4.11999–2000 62.0 34.0 6.62001–2002 61.4 34.1 6.82003–2004 61.4 34.0 7.3
The trends are significantly increasing overall and for men and womenseparately. The source document includes standard errors of the esti-mates. Source: Ogden et al. (2007b, Table 1)

12 Obesity and its Relation to Mortality and Morbidity Costs
While the percentage overweight, obese and extremely obese exhibited increases ineach study, the greatest increases for men occurred in the three studies beginning inthe period 1976–80 and ending with 1999–00. The situation for women was similar,although the percentages were a little lower. A recent study makes projections fromthe same data (Ruhm, 2007). By 2020, according to Ruhm’s analysis, 77.6 percent ofmen will be overweight and of those overweight 40.2 percent will be obese. For women,the percentages are 71.1 percent and 43.3 percent, respectively. In a subsequent study,Ogden et al. (2007a) found that there was no significant change in obesity prevalencebetween 2003–04 and 2005–06.
Haas et al. (2003) studied the distribution of BMI of children in the U.S. as itrelates to race, socioeconomic status and health insurance status. They found significantracial disparities in the prevalence of overweight among different ethnic groups, and theydocumented a significant association of health insurance status with the prevalence ofadolescent overweight.
Cumming and Pinkham (2008) studied BMI and waist circumference for a largesample of life-insured males and their relation to mortality. The percentage of lives withBMI ≥ 30 was 19.0 percent. This is lower than the prevalence in population studies(31.7 percent in NHANES 2003–04, see Table 3). However, this is to be expectedbecause insured lives are selected after underwriting, and extremely obese candidatesare typically not accepted (nor are candidates with very low BMI). The difference alsois consistent with population studies, in that candidates for life insurance typically havehigher income than average. Population studies have found lower obese prevalence withhigher income groups.
2.3. Prevalence of Obesity in Canada
Our review uses four national health surveys to describe the trend prevalence of obesityin Canada (Torrance et al., 2002; Raine, 2005; Tjepkema, 2005, 2006). Some of theresults are summarized in Table 4.
Torrance et al. (2002) found that lower education is associated with higher BMI.However, lower education is underreported, so the estimate could be biased. Smokingcessation was not a major factor in rising rates of overweight and obesity since BMI in-creased in smokers as well as never-smokers and former smokers. The trend in prevalenceof overweight and obesity is shown in Table 4.
Raine (2005) found that obesity varies regionally. Atlantic Canada has the highestprevalence of obesity. In Western Canada, rural men and women were significantly morelikely to be obese than urban men and women. In the 2000–01 survey, northern Ontario,the Atlantic provinces, the Prairie provinces, Nunavut and the Northwest Territories hadsignificantly higher obesity rates than the national average of 15 percent.
Tjepkema (2006) found that 23.1 percent of Canadians were obese in 2004 (comparedto 29.7 percent in the U.S. based on 1999-2002 NHANES) and another 36.1 percent areoverweight. This is a large increase over the 1978–79 Canada Health Survey estimate ofthe prevalence of obesity as 13.8 percent. This study also estimates the distribution ofBMI across the population. In addition, the author reports the relationships betweenobesity and physical activity. As one would expect, those reporting a sedentary lifestyle

Obesity and its Relation to Mortality and Morbidity Costs 13
had a higher rate of obesity. The study also found that, generally, obesity varies inverselywith educational attainment.
Table 4Percentage of Canadian Adults with BMI ≥ 25
Men WomenNutrition Canada Survey 1970–1972 47.0 33.9Canada Health Survey 1978–1979 55.6 42.3Canada Heart Health Survey 1986–1992 58.1 40.6Canadian Community Health Survey 2004 65.0 53.4
Trends in prevalence of overweight and obesity among Canadian adults.Source: Torrance et al. (2002, Figure 2); Tjepkema (2006, Table 3)
3. Obesity and Cardiovascular Disease
Calle et al. (1999) use data from the Cancer Prevention Study II to study the relation ofBMI to all-cause mortality, cardiovascular disease and cancer. This is a large prospective14-year cohort study of more than 1 million adults in the U.S. We discuss this again inSection 8 where we take up BMI and all-cause mortality. Calle et al. found a curvilinearrelation between BMI and the relative risk of death from cardiovascular disease. Relativeto normal weight, the relative risk of death due to cardiovascular disease increases foroverweight and obese men and women. However, it is also higher for BMI below normal.According to the authors, this is explained by increased risk of death among lean menand women as a result of cerebrovascular disease, pneumonia and diseases of the centralnervous system.
Oster et al. (2000) estimate health care costs attributable to obesity for a hypotheticalU.S. managed care health plan. They use survey data from 3,400 adults collected in 1996,as well as prevalence and relative risk data from published sources such as NHANES III.For each of eight conditions, they estimated the annual medical costs associated withobesity as
P (RR− 1)
1 + P (RR− 1)×N × C
where P is the prevalence of obesity in the population, RR is the relative risk for thecondition, N is the number of cases of the condition in the population, and C is theestimated annual cost of the condition per case. Table 5 shows the relative risks theyused; the costs are shown in the section on costs. The relative risk for coronary heartdisease is 2.4 for men and 3.0 for women. This study uses 29.0 as the BMI level forobesity, rather than the standard level 30.0, but that would not matter very much as ituses the standard definition for the normal BMI range.
In a large study, Bassuk and Manson (2008) reviewed the epidemiologic data on riskfactors for cardiovascular disease and diabetes. Cardiovascular disease is the leadingcause of death for American men and women, accounting for nearly half of all deaths,

14 Obesity and its Relation to Mortality and Morbidity Costs
Table 5Relative Risk by BMI
Obesity-Related Disease BMI < 25 25 ≤ BMI < 29 BMI ≥ 29
Men
Hypertension 1.0 1.9 2.6Hypercholesterolemia 1.0 – 1.8Diabetes 1.0 2.6 10.4Coronary heart disease 1.0 1.4 2.4Stroke 1.0 1.2 1.3Gallbladder disease 1.0 2.0 3.5Osteoarthritis of the knee 1.0 1.0 2.8
Women
Hypertension 1.0 2.3 3.8Hypercholesterolemia 1.0 – 1.8Diabetes 1.0 4.4 48.9Coronary heart disease 1.0 1.7 3.0Stroke 1.0 1.4 1.9Gallbladder disease 1.0 2.0 3.5Osteoarthritis of the knee 1.0 1.7 1.6Endometrial cancer 1.0 1.0 2.0
Relative risks of selected obesity-related diseases, by sex, disease andBMI. Source: Oster et al. (2000, Table 1)

Obesity and its Relation to Mortality and Morbidity Costs 15
and diabetes is a major risk factor for cardiovascular disease. This paper cites datafrom the Nurse’s Health Study. The authors suggest that 74 percent of cardiovasculardisease cases among women could be prevented by not smoking, engaging in regularphysical activity, eating healthier food and drinking alcohol in moderation. Galal et al.(2007) conducted a study on the relationship between BMI and mortality in patientswith known or suspected coronary artery disease, and found that BMI was inverselyrelated to long-term mortality in the patients. This result is different from most of theresults in the research documents. The incidence of long-term mortality in underweight,normal, overweight and obese was reported to be 39 percent, 35 percent, 24 percent and20 percent, respectively. They state that, compared with a normal BMI, the hazardrate for mortality in underweight patients was 2.4 (95 percent confidence interval 1.7 to3.7), and that overweight and obese patients had a significantly lower mortality than thenormal BMI (hazard rate 0.65, 95 percent confidence interval 0.6 to 0.7 for overweight;hazard rate 0.61, 95 percent confidence interval 0.5 to 0.7 for obese patients).
Yan et al. (2006) studied 17,643 workers who were recruited at ages 31 to 64 from1967 to 1973 to assess the relation of mid-life BMI to morbidity and mortality at olderages. They found that among individuals with no cardiovascular risk factors, those whowere obese in middle age have a significantly higher risk of death from cardiovasculardisease than those who had normal weight.
Yusuf et al. (2005) studied obesity and myocardial infarction in 27,000 participantsin 52 countries. They were trying to determine if the alternative obesity markers, waist-to-hip ratio, waist circumference and hip circumference, would be stronger indicators ofmyocardial infarction than BMI. They found that while BMI showed a modest associa-tion with myocardial infarction, it became insignificant after adjustment for other riskfactors. On the other hand, the alternative markers were closely associated with my-ocardial infarction even after adjustment. They conclude that using waist-to-hip ratiorather than BMI increases the estimate of myocardial infarction attributable to obesity.
Eisenstein et al. (2002) studied the effect of BMI on acute coronary syndrome andpatients’ long-term clinical and economic outcomes. They found that increased BMI wasassociated with younger age multi-morbidity, and less severe coronary artery disease. Itwas also associated with more clinical events, higher cumulative inpatient medical costs,and significant differences in unadjusted survival at 10 years. However, it was notassociated with differences in 10-year survival, after adjusting for baseline characteristicdifferences.
Abdulla et al. (2008) investigated the impact of obesity on disease-specific mortalityin high-risk patients with myocardial infarction or chronic heart failure. They found aU-shaped association between BMI and mortality with highest mortality in underweightand extremely obese groups (BMI < 18.5, BMI > 35 respectively) among patients withmyocardial infarction but not heart failure. They state that compared with normalweight, they found the following:
• Underweight patients were in increased death risk regardless of myocardial in-farction or heart failure, with myocardial infarction hazard rate of 1.54 with 95percent confidence interval 1.35 to 1.75 and heart failure hazard rate of 1.37 with95 percent confidence interval 1.18 to 1.59.
16 Obesity and its Relation to Mortality and Morbidity Costs
• Obese patients were not associated with increased risk of death in myocardialinfarction or heart failure.
• Overweight was associated with decreased death risk in myocardial infarction butnot heart failure. The hazard rate for myocardial infarction was 0.91 with 95percent confidence interval 0.87 to 0.96. The hazard rate for heart failure was 1.04with 95 percent confidence interval 0.97 to 1.12.
• Extreme obesity was associated with increased risk of death in patients with my-ocardial infarction (hazard rate 1.23 with 95 percent confidence interval 1.06 to1.44) and heart failure (hazard rate 1.13 with 95 percent confidence interval 0.95to 1.36).
Rogers et al. (2003) studied the effect of obesity on all-cause mortality, circulatorydisease and diabetes as well as the change in BMI distribution in the U.S. from 1987 to1997. Between 1987 and 1997, the population got heavier; the graph of the distributionshifted to the right and indicates a higher standard deviation. Based on an analysisof hazard ratios of death due to diabetes, circulatory disease and all-cause mortality,they conclude that obesity significantly contributes to increased mortality for all-cause,circulatory-specific and diabetes-specific mortality, even after accounting for socioeco-nomic and geographic differences. They comment that as the population becomes moreobese, the relationship between obesity and risk factors may change. For example, therelationship between obesity and income levels and obesity and education levels maychange as more people become obese. Rogers et al. also discuss the U-shape relation-ship between BMI and hazard ratios. Individuals in the overweight class have slightlyless risk of all-cause death than individuals of normal weight, but nevertheless haveslightly higher risk of death for circulatory disease and much higher risk of death fordiabetes. Moreover, higher than normal mortality of underweight individuals could bean artifact of cigarette smoking or underlying chronic conditions that cause weight loss,such as cancer, infectious diseases or heart disease.
Flegal et al. (2007b) studied the cause-specific relative risks of mortality using theNHANES I, II and III. Here is a summary of their conclusions:
• Underweight was associated with significantly increased mortality from non-cancer,noncardiovascular disease causes (23,455 excess deaths; 95 percent confidence in-terval 11,848 to 35,061), but not associated with cancer or cardiovascular diseasemortality.
• Overweight was associated with significantly decreased mortality from non-cancer,noncardiovascular disease causes (69,299 excess deaths; 95 percent confidence in-terval 100,702 to 37,897), but not associated with cancer or cardiovascular diseasemortality.
• Obesity was associated with significantly increased cardiovascular disease mor-tality (112,159 excess deaths; 95 percent confidence interval, 87,842 to 136,476),but not with either cancer mortality or with noncancer, noncardiovascular diseasemortality.

Obesity and its Relation to Mortality and Morbidity Costs 17
Another study using NHANES data, conducted by Flegal et al. (2007a), indicated thatsmoking or pre-existing illness had little effect on estimates of relative risk, and thatthe relative risk for BMI categories did not show large or systematic changes aftersimultaneous exclusion of persons who had ever smoked, persons with a history of canceror cardiovascular disease, and persons who died early in the follow-up period or had theirheights and weights measured at older ages.
Gregg et al. (2005) use the five NHANES from 1960 to 2000 to document the sub-stantial decline in the prevalence of key cardiovascular disease risk factors over the pastthree to four decades, affecting obese, overweight and lean segments of the population.The prevalence of high cholesterol, high blood pressure and smoking levels decreasedfor all BMI categories, while the prevalence of diabetes increased for the overweightand obese groups. In 2005, the prevalence of high cholesterol, high blood pressure andsmoking for obese people were 21, 18 and 12 percentage points lower, respectively, than30 to 40 years earlier.
Bogers et al. (2007) conducted a meta-analysis of 21 cohort studies including morethan 300,000 lives. They determined relative risks for cardiovascular disease of 1.17 and1.49 for overweight and obese persons relative to normal weight persons, with adjustmentfor blood pressure and cholesterol levels.
Weitoft et al. (2008) showed an association between overweight and increased risksfor circulatory diseases and musculoskeletal disease, where the population attributablerisks were large (13 percent for men and 8.1 percent for women for circulatory disease,and 12.7 percent for men and 12.9 percent for women for musculoskeletal disease).
Silva et al. studied adult obesity and survival with and without cardiovascular diseaseusing the Framingham Heart Study data (Silva et al., 2006). They found that 45-year-old obese men with no cardiovascular disease live six years fewer than normal weightcounterparts. For women, the figure was 8.4 years. On the other hand, obese men andwomen with cardiovascular disease lived longer than normal weight men and womenwith cardiovascular disease, 2.7 and 1.4 years, respectively.
Bibbins-Domingo et al. (2007) estimated the impact of U.S. adolescent overweight in2000 on the incidence of coronary heart disease in those attaining age 35 in 2020. Theyestimated that 30 to 37 percent of 35-year-old men will be obese and 34 to 44 percent of35-year-old women will be obese. The higher prevalence of obesity would be expected toincrease the overall prevalence of coronary heart disease by 2 percent in 2020 and by 11percent in 2035. Capewell and Critchley (2008) suggested that Bibbins-Domingo et al.underestimated the impact on coronary heart disease mortality, citing their own workas well as Bogers et al. (2007).
Falkner et al. (2006) studied BMI and blood pressure of U.S. children age 2 to 19;they concluded that overweight begins at a very young age and that the blood pressuregradient is associated with overweight throughout childhood. They urge adoption ofstrategies for prevention of childhood obesity.
Abell et al. (2008) analyzed cardiovascular disease mortality risk associated withobesity using meta-analysis of data from the Black Pooling Project for Black and Whiteindividuals, which is based on four studies including NHANES I and II. They findthat the association between obesity and cardiovascular disease mortality is significantlygreater in white individuals. Nevertheless, the obesity should be considered a significant
18 Obesity and its Relation to Mortality and Morbidity Costs
risk factor in both black and white people. A recent large prospective study of patientswith a certain type of myocardial infarction found that the obese and very obese hadhigher survivor rates.
Buettner et al. (2007) investigated the impact of obesity on mortality in unstableangina/non-ST-segment elevation myocardial infarction (UA/NSTEMI). Their conclu-sion was that obesity was associated with improved outcome after UA/NSTEMI treatedwith early revascularization. They reported that cumulative three-year mortality rateswere 9.9 percent for normal BMI, 7.7 percent for overweight, 3.6 percent for obese, and0 (no deaths) for very obese. Obese and very obese patients had less than half thelong-term mortality when compared with normal BMI patients. The hazard ratio was0.38, with 95 percent confidence interval 0.18 to 0.81.
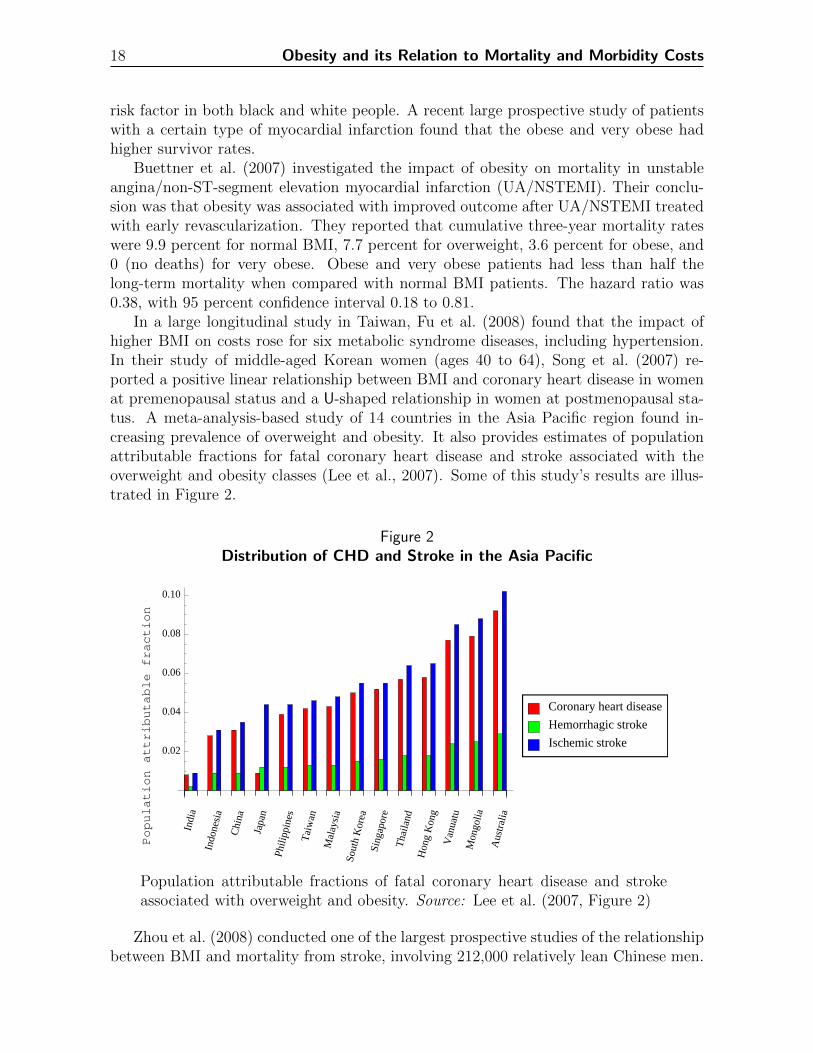
In a large longitudinal study in Taiwan, Fu et al. (2008) found that the impact ofhigher BMI on costs rose for six metabolic syndrome diseases, including hypertension.In their study of middle-aged Korean women (ages 40 to 64), Song et al. (2007) re-ported a positive linear relationship between BMI and coronary heart disease in womenat premenopausal status and a U-shaped relationship in women at postmenopausal sta-tus. A meta-analysis-based study of 14 countries in the Asia Pacific region found in-creasing prevalence of overweight and obesity. It also provides estimates of populationattributable fractions for fatal coronary heart disease and stroke associated with theoverweight and obesity classes (Lee et al., 2007). Some of this study’s results are illus-trated in Figure 2.
Figure 2Distribution of CHD and Stroke in the Asia Pacific
Population
attributable
fraction
Indi
a
Indo
nesi
a
Chi
na
Japa
n
Phili
ppin
es
Tai
wan
Mal
aysi
aSo
uth
Kor
eaSi
ngap
ore
Tha
iland
Hon
gK
ong
Van
uatu
Mon
golia
Aus
tral
ia
0.02
0.04
0.06
0.08
0.10
Coronary heart disease
Hemorrhagic stroke
Ischemic stroke
Population attributable fractions of fatal coronary heart disease and strokeassociated with overweight and obesity. Source: Lee et al. (2007, Figure 2)
Zhou et al. (2008) conducted one of the largest prospective studies of the relationshipbetween BMI and mortality from stroke, involving 212,000 relatively lean Chinese men.

Obesity and its Relation to Mortality and Morbidity Costs 19
BMI was strongly related to blood pressure throughout the range of BMI levels. Whileblood pressure was strongly related to stroke mortality, BMI was strongly associatedwith stroke mortality only in the range BMI above 25. Most men in the study hadBMI below 25 and among them BMI had little relation to risk of stroke mortality. ForBMI below 25, an inverse association between BMI and some other stroke risk factorscounterbalance the effects of BMI on blood pressure.
Gomez-Ambrosi et al. (2008) studied the relation between BMI and acute-phaseprotein serum amyloid A circulating in the blood of children and adolescents. Theyfound significant positive correlation between serum amyloid A and body fat. Increasedserum amyloid A levels may provide a direct link between obesity and comorbiditiessuch as diabetes and cardiovascular disease.
4. Obesity and Diabetes
According to a recent editorial in The Lancet, at least 246 million adults worldwidehave diabetes mellitus, and the figure is escalating to epidemic proportions (Lancet,2008). Moreover, the “inexorable rise of diabetes parallels that of the obesity pandemicspreading throughout both industrialized and developing countries.” In an editorial inDiabetes, Runge wrote that 60 percent of diabetes2 is directly attributable to weightgain (Runge, 2007).
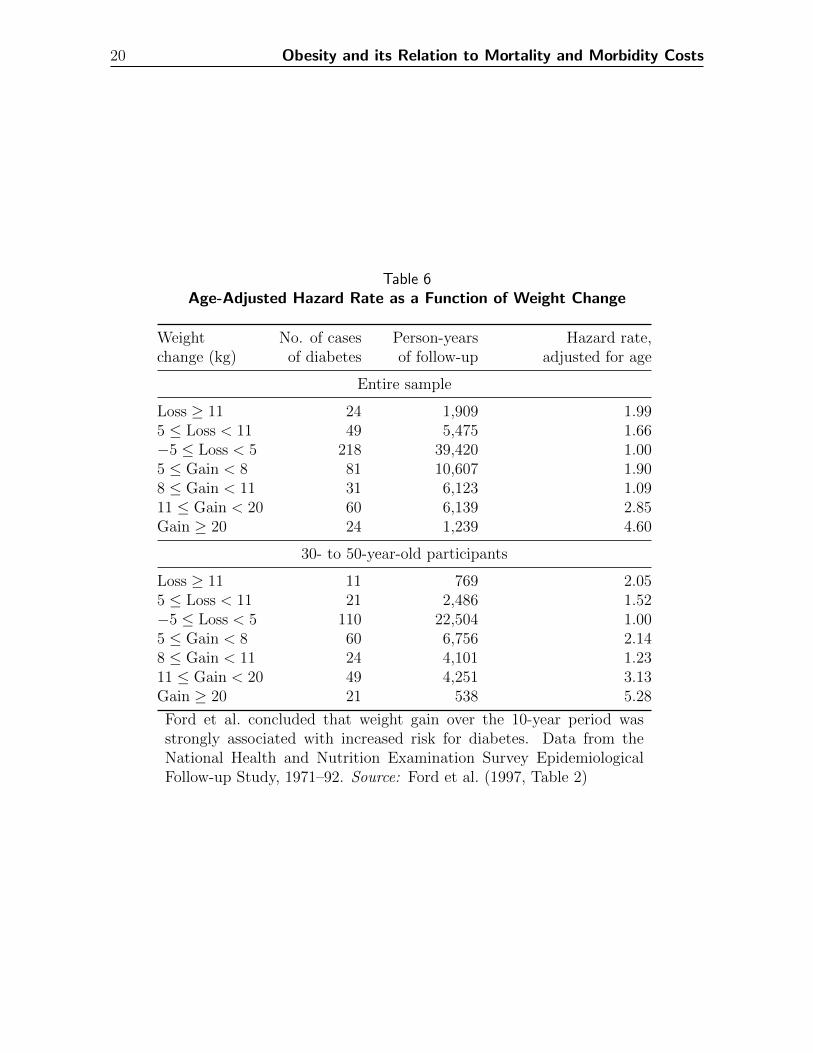
Ford et al. (1997) use a cohort of 14,407 people who were 25 or older at the NHANES Ibaseline examination between 1971 and 1975, followed through 1992. They found weightgain over a 10-year period was strongly associated with increased risk for diabetes. Table6 shows, in the last column, that adjusted hazard rates for diabetes increase steadilywith increased weight gain during the study period.
Detournay et al. (2000) used a sample of 14,670 from the adult population of France,age 18 and older. The results show that, with the reference to BMI at the normal level,obese subjects had a relative risk of 3.8 for diabetes. Moreover, the paper estimatedthe direct cost attributable to obesity to be in the range of 4.2 billion to 8.7 billion1992 French francs, which accounted for about 0.7 percent to 1.5 percent of total healthexpenditures.
Oster et al. (2000) used relative risk for diabetes of 10.4 for men and 48.9 for women.They estimated that for a hypothetical U.S. managed care health plan, 86 percent ofdiabetes related costs are associated with obesity.
Bloomgarden (2008) surveyed recent literature on BMI and diabetes. We reviewedthe main sources for this survey. Colditz et al. (1995) used data from a cohort study of114,281 female registered nurses, starting in 1976 with follow-up to 1990. They found,after adjustment for age, that BMI was the dominant predictor of risk for diabetesmellitus. The risk increased with increasing BMI even for normal weight women. Theresults are independent of family history.
Based on data retrieved from the Bureau of National Health Insurance of Taiwan,Fu et al. (2008) examined the costs of diseases and outpatient and inpatient services
2There are several forms of diabetes. We use diabetes to mean type-2 diabetes. This is the formassociated with overweight and inactivity.
20 Obesity and its Relation to Mortality and Morbidity Costs
Table 6Age-Adjusted Hazard Rate as a Function of Weight Change
Weight No. of cases Person-years Hazard rate,change (kg) of diabetes of follow-up adjusted for age
Entire sample
Loss ≥ 11 24 1,909 1.995 ≤ Loss < 11 49 5,475 1.66−5 ≤ Loss < 5 218 39,420 1.005 ≤ Gain < 8 81 10,607 1.908 ≤ Gain < 11 31 6,123 1.0911 ≤ Gain < 20 60 6,139 2.85Gain ≥ 20 24 1,239 4.60
30- to 50-year-old participants
Loss ≥ 11 11 769 2.055 ≤ Loss < 11 21 2,486 1.52−5 ≤ Loss < 5 110 22,504 1.005 ≤ Gain < 8 60 6,756 2.148 ≤ Gain < 11 24 4,101 1.2311 ≤ Gain < 20 49 4,251 3.13Gain ≥ 20 21 538 5.28
Ford et al. concluded that weight gain over the 10-year period wasstrongly associated with increased risk for diabetes. Data from theNational Health and Nutrition Examination Survey EpidemiologicalFollow-up Study, 1971–92. Source: Ford et al. (1997, Table 2)

Obesity and its Relation to Mortality and Morbidity Costs 21
caused by obesity. Their sample consisted of 4,318 subjects from 2000–02. However,they defined BMI categories differently from the existing literature. For Asians, 24 ≤BMI < 27 is overweight, 27 ≤ BMI < 30 is first-degree obesity, and BMI ≥ 30 is second-degree obesity. The study found that the relative risk for diabetes increased as BMIincreased. With diabetes, the relative risk of being overweight is 1.49, but 1.87 (2.35)in the first- (second-) degree obesity category. Furthermore, the population-attributablerisks for diabetes were 7.0%, 11.9% and 17.4% for overweight and first- and second-degreeobesity, respectively. The results also show that 0.42% of Taiwan’s annual medical costswere attributable to diabetes mellitus caused by overweight and first-and second-degreeobesity.
Janssen (2007) studied data retrieved from the Cardiovascular Health Study, onesample of 4,968 American males and females age 65 and older, from 1989–99. He orga-nized his subjects into three classes: normal, overweight and obese, based on the CDCdefinitions, with the exception of “normal.” Normal weight was defined as 20 ≤ BMI ≤24.9 while the CDC definition is 18.5 ≤ BMI ≤ 24.9. Janssen observed the incidence of10 health issues related to weight for the subjects he studied for nine years. Comparedto normal-weight peers, the risk for developing diabetes grew by 78 percent within theoverweight BMI group. Specifically, the relative risks for diabetes for overweight andobese groups were 1.78 and 4.15, respectively. In terms of sex-specific hazards ratios,the diabetes hazard ratio for overweight men (obese men) stood at 2.91 (5.96), but 1.12(3.26) for overweight women (obese women). Furthermore, when he analyzed two agegroups (the first age group consisting of 63- to 74-year-olds, the second age group 75-year-olds and older), Janssen found the hazard ratios for the first overweight (obese)age group and the second overweight (obese) age group were 1.16 (4.29), and 2.21 (2.96)respectively.
Fonarow et al. (2007) studied 108,927 subjects from October 2001 to December 2004and divided them into four BMI quartiles, QI, QII, QIII and QIV with BMI 16.0–23.6, 23.7–27.7, 27.8–33.3 and 33.4–60.0, respectively. The data came from the AcuteDecompensated Heart Failure National Registry (U.S.), with documented admissionheights and weights. They found that subjects who were younger and had a higherprevalence of diabetes history were in the higher BMI quartiles. However, they concludedthat in-hospital mortality risk for heart failure was inversely related to BMI. The resultsshowed that with QII as the mortality-risk BMI referent, the odds ratios for QI, QIIIand QIV were 1.21, 0.84 and 0.83, respectively. In other words, those with higher BMIwere less likely to suffer in-hospital heart failure.
Field et al. (2001) conducted a 10-year longitudinal study from 1986–96 on 77,690middle-aged women from the Nurses’ Health Study and 46,060 men from the HealthProfessionals Follow-up Study. They used subjects with normal BMI as a referent andcompared the results with three other categories: overweight, class 1 obese (the sameas CDC obese but not extremely obese) and class 2 obese (CDC extremely obese).They concluded that, as BMI increases, so the relative risk of getting diabetes increases,regardless of gender. The relative risk values for overweight, class 1 obese and class 2obese women (men) were 4.6 (3.5), 0.0 (11.2) and 17.0 (23.4), respectively. However,after changing the reference group to BMI between 18.5 and 21.9, the relative risk valuesfor the remaining part of CDC normal, 22.0 ≤ BMI ≤ 24.9, overweight, class 1 obese

22 Obesity and its Relation to Mortality and Morbidity Costs
and class 2 obese women (men) were 2.2 (1.8), 8.1 (5.6), 17.8 (18.2) and 30.1 (41.2),respectively.
In a study for the Texas Department of Health, McCusker et al. (2004) examined1,501,876 routine discharges among Texas adults age 18 and older in 2001. The data,obtained from the Texas Health Care Information Council, showed that 31.6 percent(22.3 percent) of the discharges were attributable to overweight (obese) men with typeII diabetes, while 22.3 percent (22.0 percent) were attributable to overweight (obese)women with diabetes. The findings further showed that, compared to normal weightstatus, the relative risks for diabetes for overweight, obese but not extremely obese andextremely obese men (women) were 3.5 (4.6), 11.2 (10.0) and 23.4 (17.0), respectively.The results also indicated that in 2001, among Texas adults age 18 and older, 2.1 percentof the total morbidity-related loss of productivity was attributable to overweight, 9.1percent of which was attributable to obesity.
In 2002–03, Tsai et al. (2004) conducted a one-and-a-half-year cross-sectional studyof 3,540 men and 2,778 women in southern Taiwan. They found the prevalence of typeII diabetes was higher among men than women. They categorize the subjects as normal(BMI < 23.0), overweight (23.0 ≤ BMI ≤ 24.9), first-degree obese (25.0 ≤ BMI ≤ 29.9,which is CDC overweight), and second-degree obesity (BMI ≥ 30.0, which is CDC obese)according to the definition of obesity for the Asia-Pacific region. For type II diabetes, theodds ratios for overweight men (women), first-degree obese men (women) and second-degree obese men (women) were 1.2 (2.0), 1.3 (2.2), and 3.7 (5.1), as compared to normalweight status subjects.
Using 2003 data obtained from the Medical Expenditure Panel Survey, Bhattacharyaand Bundorf (2009) examined the relationship between obesity and medical expendituresin the United States. Their results showed that obese women (men) were 3.49 percent(5.38 percent) more likely than nonobese women (men) to develop diabetes. In addition,obese women (men) diagnosed with diabetes spent $1,522 more ($802 less) in medicalbills than nonobese women (men).
In a recent survey, Malnick and Knobler (2006) concluded there is a strong associationbetween obesity and diabetes, in both genders and all ethnic groups. Even in healthyyoung men, obesity is an important risk factor for diabetes. They report on a survey ofyoung men in the Israel Defense Forces that found BMI > 30 was strongly associateddiabetes, compared to those men with a BMI < 25.
Alley and Chang (2007) retrieved two sets of data (1988-1994 and 1999-2004) fromthe NHANES and examined 5,724 and 4,984 adults 60 and older for the first and secondtime periods, respectively. The results showed that, over time, the prevalence of diabetesincreased among obese but not among nonobese subjects.
Hamman et al. (2006) studied the effects of intensive lifestyle intervention for 1,079participants in the Diabetes Prevention Program. They found weight loss was the domi-nant determinant in reduced risk for diabetes. A 5-kilogram weight loss over time couldaccount for a 55 percent reduction in the risk of diabetes over the 3.2-year follow-upperiod of their study.
Urbanski et al. (2008) studied recently published articles on the cost-effectivenessof diabetes prevention and treatment. Four of five studies found diabetes preventionwas cost saving. Another four studies found that diabetes prevention is more cost-

Obesity and its Relation to Mortality and Morbidity Costs 23
effective than treatment. Diabetes self-management training is likely cost-effective butmore research is needed. A solid body of evidence shows that medical nutrition therapychanges dietary behaviors resulting in improvement in metabolic control, blood glucose,hemoglobin A1c and cardiovascular risk factors. A small body of evidence indicatesmedical nutrition therapy is cost-effective in diabetes treatment.
Farin et al. (2006) studied insulin resistance as a function of BMI and waist circum-ference in 330 healthy volunteers. They found that the more overweight, with respectto both measures, the greater the degree of insulin resistance. The found no differencein the relation between the degree of insulin resistance and either index of adiposity.
Hart et al. (2007) studied the relationship between weight and development of dia-betes after age 45 in Scotland. Over 19,000 entered the study from 1970–76, with noreported diabetes, and were followed until March 31, 2004. Hospital discharge recordsand death certificates were used to identify cases of diabetes. They concluded thatoverweight and obesity account for about 60 percent of the cases of diabetes.
5. Obesity and Cancer
The American Institute for Cancer Research website has a brief description of theobesity-cancer link (AICR, 2006). The AICR is funding research to examine how fattyacids affect insulin-like growth factors, which may promote cancer. According to thisarticle, obesity results from long-term energy imbalance resulting in increases in storagefat and fatty acid levels. Higher levels of fatty acid result in insulin resistance, whichhas been linked to diabetes, heart disease and cancer. We found many articles providingempirical evidence of a link between increased BMI and these diseases. For example,Renehan et al. (2008a) review the epidemiological and clinical evidence associating ex-cess body weight with increased cancer risk and its impact on mortality in patientswith a diagnosis of certain cancers. A number of possible mechanisms explaining theseepidemiological observations are listed, focusing on the three most studied: insulin andinsulin-like growth factor, sex steroids and adipokine systems.
A paper by Renehan et al. (2008b) based on a meta-analysis of 141 articles covering221 data sets and more than 133 million person-years of exposure shows a significantincrease in cancer incidence in relation to obesity for 15 sites. This paper covers allprospective studies that could be identified at the time, the majority of which werepublished after the Surgeon General’s 2001 report on the effects of obesity. The Renehanet al. paper noted a causal link to obesity was suggested by the fact that the link toobesity varied significantly by site. Further evidence is provided by some of the specificsites with strong relationships, such as adenocarcinoma of the esophagus, which is relatedto esophageal reflux that can be associated with obesity.
Renehan et al. (2008a) reported the relative risk of cancer in relation to obesity bysex. In addition to the sites for which the relative risk of cancer increased in relationto obesity, a reduction in risk was indicated for three cancers, lung cancer, esophagealsquamous cell carcinoma and premenopausal breast cancer. The first two results appearto be based on the confounding effect of smoking and will be ignored in this study. Inthe case of lung cancer, the negative effect of obesity did not exist for nonsmokers. The
24 Obesity and its Relation to Mortality and Morbidity Costs
inverse relationship between BMI and the degree of smoking can explain the confoundingeffect of smoking measured in a nonquantitative manner, or with smoking intensity inbroad categories. The number of studies of esophageal squamous cell carcinoma is muchsmaller than the number of studies of lung cancer, so it is not possible to performthe same level of analysis of the negative relationship for this cancer, but smokinghas a strong association with this cancer, increasing its confounding effect. Thus, thenegative relationship between BMI and esophageal squamous cell carcinoma may notbe demonstrated to be the result of confounding, but this explanation is reasonable.The reduction of premenopausal breast cancer in relation to obesity may be a validrelationship, in view of the hormonal effects of obesity. Therefore, this reduction incancer has been included in our study as an offset to the economic costs of obesity.
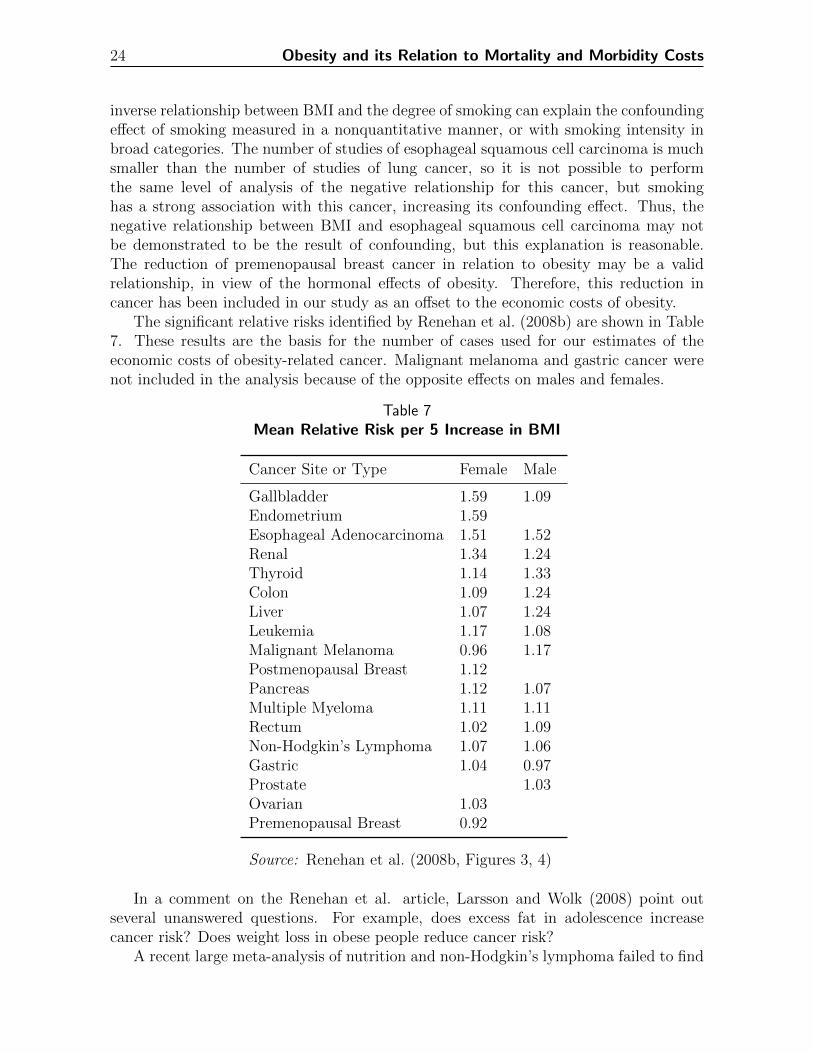
The significant relative risks identified by Renehan et al. (2008b) are shown in Table7. These results are the basis for the number of cases used for our estimates of theeconomic costs of obesity-related cancer. Malignant melanoma and gastric cancer werenot included in the analysis because of the opposite effects on males and females.
Table 7Mean Relative Risk per 5 Increase in BMI
Cancer Site or Type Female Male
Gallbladder 1.59 1.09Endometrium 1.59Esophageal Adenocarcinoma 1.51 1.52Renal 1.34 1.24Thyroid 1.14 1.33Colon 1.09 1.24Liver 1.07 1.24Leukemia 1.17 1.08Malignant Melanoma 0.96 1.17Postmenopausal Breast 1.12Pancreas 1.12 1.07Multiple Myeloma 1.11 1.11Rectum 1.02 1.09Non-Hodgkin’s Lymphoma 1.07 1.06Gastric 1.04 0.97Prostate 1.03Ovarian 1.03Premenopausal Breast 0.92
Source: Renehan et al. (2008b, Figures 3, 4)
In a comment on the Renehan et al. article, Larsson and Wolk (2008) point outseveral unanswered questions. For example, does excess fat in adolescence increasecancer risk? Does weight loss in obese people reduce cancer risk?
A recent large meta-analysis of nutrition and non-Hodgkin’s lymphoma failed to find

Obesity and its Relation to Mortality and Morbidity Costs 25
a significant association with severe obesity, defined as BMI ≥ 40, but suggested furtherinvestigation of severe obesity and some sub-types of non-Hodgkin’s lymphoma (Willettet al., 2008).
A number of studies have shown an increased risk of death in relation to obesity oncecancer is diagnosed. Only renal cancer has shown a decreased risk of death in relation toobesity following diagnosis. The data relating the risk of cancer death to obesity is notyet sufficient to form a basis for adjusting the economic results of obesity-related cancer.Therefore, our economic analysis assumes the outcome of cancers related to obesity isthe same as the general results for the specific site.
5.1. Other Literature on Cancer Risk
We mentioned the large prospective study by Calle et al. (1999) in the section on car-diovascular disease. They also studied BMI and cancer using the same cohort. The riskof death from cancer increases steadily with BMI at all ages. The graphs are in Figure4 of Section 7.2.
Efstathiou et al. (2007) studied 945 men with locally advanced prostate cancer.Greater BMI was significantly associated with higher prostate cancer-specific mortality.For overweight men, the hazard ratio was 1.52; for obese men, the hazard ratio was 1.64.They concluded, “Greater baseline BMI is independently associated with higher prostatecancer-specific mortality in men with locally advanced prostate cancer.” Freedlandet al. (2008) found that obese men have significantly lower prostate-specific antigenconcentrations and larger prostate volumes. While obesity was not significantly relatedto prostate cancer in univariate analysis, after multivariate adjustment, obesity wassignificantly associated with increased prostate-cancer risk, with an odds ratio of 1.98.
Larsson and Wolk (2007) performed a meta-analysis of the relation between BMI andgallbladder cancer based on 11 published studies with a total of 3,288 cases. Overweightor obese men had a relative risk of 1.15 for this cancer, compared to normal weight men.The relative risk for women was 1.35. They conclude that excess body weight is a riskfactor for gallbladder cancer.
Kabat et al. (2007) studied the relationship between obesity and lung cancer inwomen 40-59 years old. After adjustment for pack-years of smoking and other covariates,they found inverse associations in current smokers and in former smokers. However, fornever-smokers, BMI was positively associated with lung cancer. The results for currentand former smokers were not altered by exclusion of cases diagnosed within the firstfive years of follow-up; however, in never-smokers, the strength of the association wasreduced. Calle et al. (1999) found a similar relationship for BMI and all-cause mortalityin that the association of increased BMI with the risk of death was stronger for never-smokers than it was for former-smokers or smokers.
A study on risk factors in relation to survival after endometrial cancer diagnosis (Chiaet al., 2007) found that a history of obesity and diabetes increases the risk of mortalityafter endometrial cancer diagnosis. This study found obese women prior to endometrialcancer diagnosis had a hazard rate ratio of 1.6 (95 percent confidence interval 1.0 to2.5) for all-cause mortality and a hazard rate ratio 2.0 (95 percent confidence interval0.8 to 5.1) for mortality of endometrial cancer, compared with women who were not

26 Obesity and its Relation to Mortality and Morbidity Costs
overweight.Takata et al. (2007) found in a population of 80-year-olds that overweight was asso-
ciated with longevity and underweight with short life, due to lower and higher mortality,respectively, from cardiovascular disease and cancer. They argued that mortality dueto cardiovascular disease in the underweight group was 4.6 times (hazard rate 4.64 with95 percent confidence interval 1.68 to 12.80) higher than in the normal weight group,and that mortality due to cancers was 88 percent lower (hazard rate 0.12, 95 percentconfidence interval 0.02 to 0.78) in the overweight group than in the underweight group.
Schottenfeld and Beebe-Dimmer (2005) reviewed several aspects of cancer in theworldwide population, summarizing articles on related areas. Obesity plays an importantrole. They find, for example, that the preventive impact of maintaining a BMI belowthe overweight level was 15-20 percent of cancer deaths in women and 10-14 percent inmen.
6. Obesity and Other Conditions
6.1. Osteoarthritis
Allman-Farinelli et al. (2008) wrote a short letter to the editor describing the populationattributable risk for osteoarthritis associated with obesity for Australian men at 25percent and 22 percent for women. Farooqui and Jawad (2007) mainly cited otherworks and were omitted. All but one of the articles deals with osteoarthritis of the knee.
Cooper et al. (1998) focused on osteoarthritis of the hip, and presented an odds ratioof 1.7 for obese individuals. The frequency of this condition was low enough to makethe odds ratio a reasonable approximation to the relative risk; the relative risk providedthe basis for estimating obesity-related frequency and costs. We have not measured thefrequency and economic costs associated with obesity-related osteoarthritis of the hip.
The remaining articles deal with osteoarthritis of the knee. The low frequency of thiscondition (1.5 percent) made the odds ratio a reasonable approximation to the relativerisk. The odds ratios associated with obesity in several of these articles were reasonablyconsistent. Davis et al. (1989) presented an odds ratio of 6.6 and Hart and Spector(1993) found an odds ratio of 6.17. Coggon et al. (2001) offered a formula for computingthe odds ratio that associated these odds ratios with a BMI of 34, reasonably close toaverage BMI for obese individuals.
The article by Noskova et al. (2007) found osteoarthritis to be strongly associatedwith cholesterol and c-reactive protein, rather than with just obesity, but the summarygave no indication of how they controlled for the fact that cholesterol and obesity werehighly correlated in reaching this conclusion. In view of the majority of evidence, weignored this article (its text was excluded from our database).
Coggon et al. (2001) showed that almost all knee osteoarthritis was associated withbody weight. An individual with a BMI of 20 had an odds ratio of 0.1. In other words,only about one very thin person in 600 would have this condition, compared to thepopulation average of 1.5 percent. This meant that the portion associated with obesitywas less than the portion associated with body mass. The Coggon et al. article estimated

Obesity and its Relation to Mortality and Morbidity Costs 27
that 57.1 percent of osteoarthritis of the knee would be eliminated if obese people couldfall to normal weight. It reviewed 525 cases with 525 controls.
The cost of obesity-related osteoarthritis of the knee has been studied in Italy andfound to have direct costs of e934 and indirect costs of e1,236 per patient (a total ofabout $3,000). We do not know the corresponding cost in the U.S. and Canada butassume it to be higher in the U.S. Coggon et al. stated that 1.5 percent of people willhave knee surgery for osteoarthritis at some point in their lives. Assuming this to standfor about 90,000 cases per year in the U.S. and Canada, the total cost would be about$270 million. Of this amount, $154 million would be related to obesity. Anecdotalevidence indicates that recovery from knee surgery is slower for people who are moreobese. Therefore, the above estimate may well be understated, especially in relation toindirect costs. To date, however, we have found no scientific evidence to support thisobservation.
Hart and Spector (1993) used BMI greater than 26.4 (upper tertile), rather than theBMI ≥ 25 definition of overweight, to obtain an odds ratio of 6.17. Their odds ratio wasfor single-knee osteoarthritis. For double-knee osteoarthritis, the odds ratio was 17.99.Both odds ratios were compared to the bottom tertile, BMI less than 23.4.
Manninen et al. (1996) found the relationship between BMI and the incidence ofdisabling knee osteoarthritis was linear. The relative risk was 1.4. They found alsooverweight is a strong risk factor for disabling knee osteoarthritis.
Rosemann et al. (2008) studied obesity and quality of life, health service utilizationand physical activity in a large sample of primary care patients with osteoarthritis. Inthis cohort study of 1,029 osteoarthritis patients, they concluded that increased BMIhad a strong association with increased use of the health care system. The study em-phasized the need for appropriate approaches in primary care to break the vicious circleof overweight, depression, decreasing physical inactivity and diminishing quality of life.
Oster et al. (2000), in the study we mentioned earlier, found that 30 percent of healthcosts due to knee osteoarthritis are associated with obesity. They used a relative risk of2.9 for men and 1.6 for women.
6.2. Asthma
Luder et al. (2004) studied asthma-related risk factors in a cross-sectional survey of 5,524New York state adults. Women showed a steadily increasing association between BMIand asthma. On the other hand, men showed a U-shaped relation, with an increasedprevalence of asthma compared to normal associated with the low BMI category andobese category. Luder et al. conjecture that the gender difference may indicate obesityinfluences sex hormones, which in turn influences incidence of asthma. They cited relatedlongitudinal studies that show BMI predicts development of asthma.
Vargas et al. (2007) examined BMI and asthma for children in a small cross-sectionalstudy of children in the U.S. Head Start Program. Although they found no clear expla-nation for the link between asthma and BMI, the authors suggested an increased BMIsignificantly affected the well being of young asthmatic patients and should be studiedfurther. Moore (2005), who surveyed several studies on obesity and asthma, points toan association of asthma with obesity in adults and children. His survey includes a

28 Obesity and its Relation to Mortality and Morbidity Costs
prospective study of 85,911 women in the Nurses’ Health Study that reported a relativerisk for asthma of 2.7 for obese women relative to nonobese women.
Chen et al. (2002) used the longitudinal data from the first and second cycles of theNational Population Health Survey, conducted in Canada in 1994–95 and 1996–97, tostudy BMI and development of asthma. In the two-year follow up of 9,149 subjects whoreported no asthma initially, 1.6 percent of men and 2.9 percent of women developedasthma. Baseline BMI was a significant predictor of asthma for women but not for men.
6.3. Renal Disease
Hsu et al. focused on the relationship between obesity and end-stage renal disease ina cohort study of 320,252 adults, who were observed for 15 to 35 years (Hsu et al.,2006). The rate of end-stage renal disease increased in a stepwise manner as BMIincreased. Age-, sex- and race-adjusted rates of end-stage renal disease rose from 10per 100,000 person-years among those with normal weight to 108 per 100,000 amongthose with BMI ≥ 40. Blood pressure levels or diabetes did not affect this relationship.They reported these values for relative risk of end-stage renal disease for overweight andobese, compared with normal BMI, as shown in Table 8.
Table 8Relative Risk of End-Stage Renal Disease as a Function of BMI
BMI status Relative Risk
Overweight, nonobese 1.87Obese class I 3.57Obese class II 6.12Extreme obesity 7.07
Source: Hsu et al. (2006, Figure on page 23)
6.4. In-Hospital Infection
Smith et al. (2007) explored the association between BMI and mortality in patients withinfections. They found that increasing BMI is not associated with heightened mortalityrate in surgical/trauma intensive care unit patients.
7. Excess Mortality Caused by Obesity
7.1. Overview
As would be expected for a condition that increases the risk of heart disease, diabetes andother serious medical conditions, overweight and obesity increase the rate of mortality.All studies we reviewed found a significant increase in mortality associated with adult

Obesity and its Relation to Mortality and Morbidity Costs 29
obesity, and most of the studies found a significant increase associated with overweight.As explained in a paper by Greenberg et al. (2007), the measurement of the effect ofoverweight and obesity on mortality is subject to potential biases resulting from thevariation in an individual’s BMI over time, and the reverse causation resulting from thereduction in BMI associated with adverse medical conditions. Greenberg et al. foundsignificant increases in the effects of overweight and obesity if the results were correctedfor these biases, and also found that some of the published reports on the relationshipbetween obesity and mortality did not make these corrections. For this reason, themortality effects and related costs we have determined on the basis of published resultsshould be considered a conservative estimate of the economic productivity effects ofoverweight and obesity.
There is a strong association between very low BMI and increased mortality. Forexample, individuals with a BMI less than 18.5 have approximately double the mortalityof individuals with a BMI between 20 and 25. Since many serious health problems causeweight to decrease, this relationship is not necessarily an indication that low weightcauses increased mortality. In fact, it may be almost the opposite: certain conditionscausing higher mortality also cause low weight. In any case, the purpose of this researchproject is to evaluate the effects of overweight and obesity. The higher mortality ofpeople with extremely low weight does not affect the conclusions about the effect ofexcess weight in relation to normal weight, and therefore in our analysis we have notincluded any consideration of the effects of extremely low weight.
7.2. Population Studies of Excess Mortality due to Obesity
In a recent analysis of 57 prospective studies with 894,576 participants, primarily inwestern Europe and North America, Whitlock et al. (2009) found that lowest mortalitywas associated with BMI of 22.5 to 25. This impressive study also found the J-shape orU-shape for BMI and all-cause mortality. They found that each 5-unit increase of BMIwas associated, on average, with an increase of 30 percent in the hazard ratio for all-cause mortality. Below the 22.5 to 25 range, BMI was inversely associated with all-causemortality, mainly because of the strong inverse associations with respiratory disease andlung cancer. Figure 3 shows their graphic presentation of the relationship between BMIand annual deaths per 1,000.
We already mentioned the work of Calle et al. (1999) in the sections on cardiovasculardisease and cancer. As noted earlier, this is a large 14-year cohort study of more then1 million U.S. residents. The authors reported results for all-cause mortality as well ascardiovascular disease and cancer. In addition, they reported results related to smokinghabit, race and disease history.
For example, in Figure 4, we plot data from their study showing the relative risk ofdeath for all-causes as a function of BMI for participants who had never smoked and hadno history of disease at entry into the study (for each sex and race). The relationship isJ-shaped or U-shaped for all-causes and cardiovascular disease (not shown here), while,for cancer, it is increasing at all ages (not shown here).
Pednekar et al. (2008) found that cohort members with BMI < 16 were at highestrisk for death due to tuberculosis, with relative risk 7.20 for men and 14.94 for women.

30 Obesity and its Relation to Mortality and Morbidity Costs
Figure 3Hazard Ratio for All-Cause Mortality Versus BMI
Hazard
Ratio æ
æ
ææ
æ
æ
æ
æ
æ
æ
æ
à
àà à à
àà
à
à
à
à
20 25 30 35 40 45
5
10
15
20
25
30
35
à Female
æ Male
BMI
Note: Hazard ratio for all-cause mortality (annual expected deaths per 1,000 inthe U.S.) for ages 35-89 combined versus BMI for male and females in the BMIrange 15-50 (excluding the first five years of follow-up). The source article hasmuch more data, such as 95 percent confidence intervals for the estimates.Source: Whitlock et al. (2009, Figure 2)
Figure 4Relative Risk of Death Versus BMI in the United States
Relative
Risk
æ
æ
æ
æ ææ
æ
ææ
æ
æ
æ
à
à
àà
à
àà
à
à
à
à
à
ì
ì ì ì
ìì
ìì
ò
ò ò
ò
ò
òò
ò
ò ò
ò
ò
20 25 30 35 40
1.0
1.5
2.0
2.5
ò Black Female
ì Black Male
à White Female
æ White Male
BMI
Note: Multivariate relative risk of death from all-causes among men and womenwho have never smoked and who had no history of disease at enrollment, ac-cording to BMI.Source: Calle et al. (1999, Table 2)
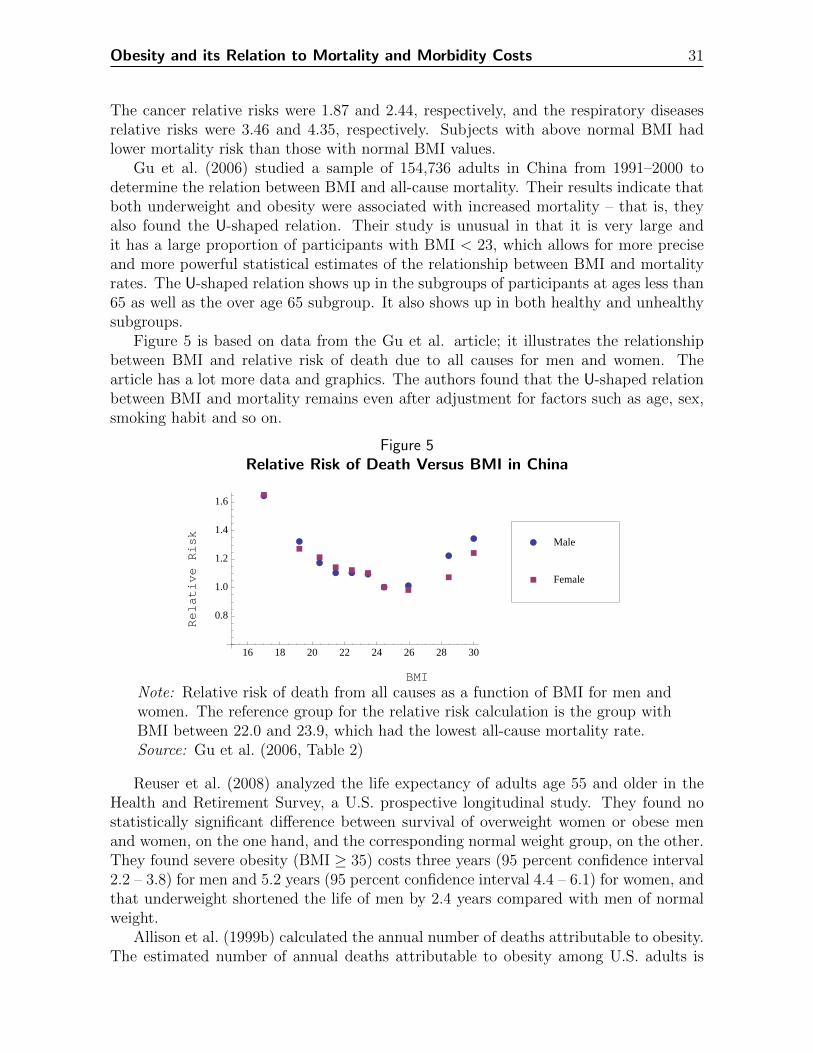
Obesity and its Relation to Mortality and Morbidity Costs 31
The cancer relative risks were 1.87 and 2.44, respectively, and the respiratory diseasesrelative risks were 3.46 and 4.35, respectively. Subjects with above normal BMI hadlower mortality risk than those with normal BMI values.
Gu et al. (2006) studied a sample of 154,736 adults in China from 1991–2000 todetermine the relation between BMI and all-cause mortality. Their results indicate thatboth underweight and obesity were associated with increased mortality – that is, theyalso found the U-shaped relation. Their study is unusual in that it is very large andit has a large proportion of participants with BMI < 23, which allows for more preciseand more powerful statistical estimates of the relationship between BMI and mortalityrates. The U-shaped relation shows up in the subgroups of participants at ages less than65 as well as the over age 65 subgroup. It also shows up in both healthy and unhealthysubgroups.
Figure 5 is based on data from the Gu et al. article; it illustrates the relationshipbetween BMI and relative risk of death due to all causes for men and women. Thearticle has a lot more data and graphics. The authors found that the U-shaped relationbetween BMI and mortality remains even after adjustment for factors such as age, sex,smoking habit and so on.
Figure 5Relative Risk of Death Versus BMI in China
Relative
Risk
æ
æ
æ
æ æ æ
æ æ
æ
æ
à
à
à
àà
à
àà
à
à
16 18 20 22 24 26 28 30
0.8
1.0
1.2
1.4
1.6
à Female
æ Male
BMI
Note: Relative risk of death from all causes as a function of BMI for men andwomen. The reference group for the relative risk calculation is the group withBMI between 22.0 and 23.9, which had the lowest all-cause mortality rate.Source: Gu et al. (2006, Table 2)
Reuser et al. (2008) analyzed the life expectancy of adults age 55 and older in theHealth and Retirement Survey, a U.S. prospective longitudinal study. They found nostatistically significant difference between survival of overweight women or obese menand women, on the one hand, and the corresponding normal weight group, on the other.They found severe obesity (BMI ≥ 35) costs three years (95 percent confidence interval2.2 – 3.8) for men and 5.2 years (95 percent confidence interval 4.4 – 6.1) for women, andthat underweight shortened the life of men by 2.4 years compared with men of normalweight.
Allison et al. (1999b) calculated the annual number of deaths attributable to obesity.The estimated number of annual deaths attributable to obesity among U.S. adults is

32 Obesity and its Relation to Mortality and Morbidity Costs
approximately 280,000 based on hazard ratios from all subjects and 325,000 based onhazard ratios from only nonsmokers and never-smokers.
Weitoft et al. (2008) investigated the effects of different BMI levels on mortality andhospitalization for a Swedish population age 16–74. They observed that the relativerisks adjusted for age, longstanding illness, smoking and educational level at baseline forall-cause mortality was 2.4 (95 percent confidence interval 1.6 to 3.6) for underweightmen, and 2.0 (95 percent confidence interval 1.5 to 2.7) for underweight women. Theydid not associate overweight with increased all-cause mortality but found obese menand women had about 50 percent higher risk of all-cause mortality than normal weightpeople.
In a cohort study of Americans 65 or older, Al Snih et al. (2007) observed thatdisability-free life expectancy was greatest among overweight subjects. The lowest haz-ard rate was in the overweight group, with a hazard rate of 0.78 (95 percent confidenceinterval 0.72 to 0.85), and obese but not severely obese, with a hazard rate of 0.80 (95percent confidence interval 0.72 to 0.90). They also found a U-shaped relationship. Theunderweight and severely obese experienced higher hazard rates for all-cause mortalitythan normal weight.
A study of an 80-year-old population in Japan found different results (Takata et al.,2007). Takata et al. found that overweight in the 80-year-old population was associ-ated with longevity and underweight was associated with higher mortality than normalweight. The lower mortality of overweight was associated with lower mortality fromcardiovascular disease and cancer.
Flegal et al. (2005) concluded that underweight and obesity were associated withincreased mortality relative to the normal weight group in the National Health andNutrition Examination Surveys for 1971–75, 1976–80 and 1988–84. They estimatedthe excess deaths to be 111,909 (95 percent confidence interval 53,754 to 170,064) forobesity, 33,746 (15,726 to 51,766) for underweight, and -86,094 (-161,233 to -10,966) foroverweight. They reached similar results using estimated relative risks. They reportedthat the relative risk of death for underweight and extreme obesity were significantlyhigher than for normal weight.
Manson et al. (2007) subsequently published a critique of the estimates of Allisonet al. (1999b), Mokdad et al. (2004), Mokdad et al. (2005) and Flegal et al. (2005). Acritique by Greenberg et al. (2007) is described below.
Using data from the Physicians’ Health Study, Ajani et al. (2004) estimated therelative risk of death for different BMI groups as follows. This is a cohort study of85,078 men age 40 to 84 with five-year follow-up. The relative risk for the obese groupwas statistically higher than that of the reference group (shown in Table 9). There wereno significant relative risk differences among the other BMI groups and the BMI groupwith BMI 22.5 to 24.9.
Kulminski et al. (2008) investigated the relationship of BMI and nine-year mortalityin Americans age 65 or older in the National Long Term Care Survey. Their findingsshowed that overweight or mild obesity (25 ≤ BMI ≤ 34.9) was not a risk factor fornine-year mortality. They observed a nonsymmetric U-shaped pattern, with larger risksassociated with underweight (BMI < 22) and minimal risks for BMI of 25 to 34.9compared with the normal group (22 ≤ BMI ≤ 24.9). Arndt et al. (2007) found a

Obesity and its Relation to Mortality and Morbidity Costs 33
Table 9Relative Risk of Death Estimates by BMI for the United States
BMI Men who never smoked All men
< 20 0.86 1.5720.0–22.4 0.98 1.0722.5–24.9 (Referent) 1.00 1.0025.0–27.4 1.05 1.0927.5–29.9 1.22 1.19≥ 30 1.67 1.61
This is based on the Physicians’ Health Study. The source articlehas much more information, including confidence intervals forthe estimates. Source: Ajani et al. (2004, Table 2)
strong U-shaped association between BMI and all-cause mortality in a cohort studywith a 10-year follow-up for men doing heavy physically work.
However, Greenberg et al. (2007) argued that all-cause mortality hazard ratios in-creased after correcting for putative biases. This is a very convincing argument that theU-shape and J-shaped earlier results are the result of bias induced by regression dilutionand reverse causation. This helps explain some of the discrepancy between previousestimates of mortality attributable to obesity. The Allison et al. (1999b) estimate of325,000 excess deaths attributable to obesity in the United States is 97 percent largerthan the Flegal et al. (2005) estimate of 164,836, when the same reference category isused. Allison et al. attempted to correct for reverse causation by excluding smokers.The Flegal et al. (2005) estimates were not corrected for regression dilution or reversecausation. A second important finding is that correcting for the putative biases changedthe hazard ratios for overweight from less than 1.00 to greater than 1.00. This was truefor all three ideal-weight categories tested. It is possible, therefore, that Flegal et al.found negative rather than positive estimates of mortality attributable to overweightbecause they did not correct for the putative biases.
The lowest all-cause mortality was also observed in overweight by Takata et al. (2007)in a cohort study with four-year follow-up for the 80-year-old population; by Janssen(2007) in a cohort of 65-year-old men and women; by the Study of Osteoporotic Fracturesin 65-year-old women (Dolan et al., 2007); and by some Asian studies (Pednekar et al.,2008; Song et al., 2007). Janssen argued that the all-cause mortality risk was 11 percentlower in the overweight group. Song et al. found a U-shaped association between BMIand all-cause deaths, with the lowest risk for BMI between 25 and 26.9 for middle-agedKorean women.
Corrada et al. (2006) explored the relationship between BMI and all-cause mortalityin the elderly (average age 73 at study entry) using data from a large California-basedcohort study. They used self-reported BMI at study, BMI at age 21, and weight changebetween age 21 and study entry. Relative to normal BMI, the relative risk of death forunderweight was 1.51. The relative risk for obesity was 1.25. Those who were eitheroverweight or obese at age 21 had increased relative risk of death of 1.17. This study

34 Obesity and its Relation to Mortality and Morbidity Costs
found a U-shaped relationship between BMI and relative risk for all-cause mortality,like the Calle et al. (1999) and Flegal et al. (2005) studies. Of course the mortalityrate for smokers is higher than the rate for non-smokers with the same BMI. The BMIwith lowest mortality for smokers is in the overweight range in the Calle et al. andFlegal et al. papers. But as stated in the Calle et al. paper, the analysis of mortalityin relation to BMI among smokers is difficult to evaluate because of the interaction ofhealth problems and weight loss among smokers. Calle et al. suggest that the bestway to evaluate the effect of BMI is to study the effects among non-smokers withoutpre-existing health problems.
Adams et al. (2006) conducted a cohort study of 527,265 U.S. men and women,ages 50 to 71 in 1995–96. After 10 years, 61,317 had died. The analysis, limited tohealthy nonsmoker participants, revealed that overweight and obesity were significantlyassociated with the risk of death for both men and women. For healthy 50-year-olds, therisk of death increased 20 to 40 percent for overweight persons and 200 to 300 percentfor obese persons.
Artham and Ventura (2007) contributed evidence in support of a U-shaped relation-ship between BMI and increased risk for cardiovascular disease and all-cause mortality.They asserted, “These data suggest that obesity should not be ruled out as a risk factorjust because of the existence of the obesity paradox and it continues to be a risk factorfor heart failure or coronary disease.”
Jeffreys et al. (2003) studied the mortality of 692 men in Scotland for which BMIwas measured in early adulthood and middle age. They found that overweight in earlyadulthood is more strongly associated with increased risk of death than is overweight atmid-adulthood. Men who were overweight at both ages had twice the risk of death asmen who were normal weight at both ages. The change in BMI between ages was notassociated with mortality.
7.3. Excess Mortality due to Obesity in Life Insurance Studies
In one of the few recent studies based on insured populations, Niverthi and Ivanovic(2001) describe results of a study of 356,926 individual life insurance applicants, fromdate of issue from 1975-1998 and followed until death, lapse or survival to the end of1999. In general, their results agree with general population studies. For example, formost groups defined by age, sex and smoking habit, the relative risk of death has thefamiliar J-shape, as shown in Table 10. The exception is the group of 40- to 59-year oldmale smokers.
As Niverthi and Ivanovic note, smokers over age 60 seem to benefit from extra weight.Moreover, because of the low expected death rates, healthy male nonsmokers appear tohave the greatest relative risk, and this is a group where competition for preferred issuesis high. The authors assert that even small deviations from the expected can have asignificant impact on profits.
Baldinger et al. (2006) reported on a long-term study of mortality of 22,927 life-insured Swiss males with high levels of sums insured. The prevalence of overweight was35.7 percent and prevalence of obese was 6.2 percent, about the same as the generalpopulation. BMI and all-cause mortality showed a U-shaped relationship with the nadir

Obesity and its Relation to Mortality and Morbidity Costs 35
Table 10Relative Risk of Death for Male Insured Lives in the United States
BMI Range Age Range
All 18–39 40–59 ≥ 60
Smoker 19–22 1.20 1.82 0.90 1.8322–24 1.15 1.23 1.08 1.0725–27 (Referent) 1.00 1.00 1.00 1.0028–30 1.06 1.20 0.97 1.58≥ 31 1.49 2.32 1.45 0.35
Nonsmoker < 22 1.37 1.06 1.69 0.9422–24 (Referent) 1.00 1.00 1.00 1.0025–27 1.18 0.91 1.37 1.0828–30 1.23 1.17 1.45 1.0231–33 (≥ 31) 1.68 1.67 1.84 2.23≥ 34 1.84
Source: Niverthi and Ivanovic (2001, Table 3)
at 22.0–23.9. Some results from this study are illustrated in Figure 6.Those with BMI above the normal range tended to be older than subjects with BMI
in the normal or underweight ranges. Hypertension was more prevalent and more severeas BMI increased. The authors note that the participants are from high socioeconomicclasses and yet all-cause mortality increases significantly with BMI. They concluded,“life insurers clearly share the same goals as public health authorities.”
Roudebush et al. (2006) studied 241,966 life insurance policies submitted from 1989–2003 with 10-policy-year follow-up, comparing actual BMI and standardized mortalitybased on the 2001 Valuation Basic Table (VBT). They found a U-shaped pattern withthe minimum attainted for the group with BMI in the 25–29 range, as illustrated inFigure 7. Roudebush et al. make the following conclusions:
• Extra mortality for obesity amounts to 25–75 percent. For underweight and ex-treme obesity it is 75–150 percent.
• There was excess mortality for the underweight and obese, even at the shortestdurations.
• The pattern of standardized mortality ratios by BMI was not materially differentby any significant underwriting factor. For example, the relationship is found inthe smoker and nonsmoker subgroups.
• There is an ongoing need for more extensive research like the historical sweepinginvestigations.
Cumming and Pinkham studied 54,387 male insurance policies, issued by a singlecompany during 1994–2004, and followed through 2005. Measured height, weight and

36 Obesity and its Relation to Mortality and Morbidity Costs
Figure 6Relative Risk of Death Versus BMI for Swiss Male Insured Lives
Relative
Risk
æ
æ
ææ
æ
ææ
æ
æ
20 25 30
1
2
3
4
5
BMI
Note: This relative risk of death from all causes according to body mass index,adjusted for age and calendar year, for Swiss males with high levels of lifeinsurance. The reference group has BMI between 24.0 and 25.9.Source: Baldinger et al. (2006, Figure on page 49)
Figure 7Standardized Mortality Ratios According to BMI
æ
æ
æ
ææ
æ
20 30 40 500.0
0.5
1.0
1.5
2.0
2.5
BMI
SMR
Note: These are the overall results for the entire group of policies. The stan-dardized mortality ratios are based on the 2001 Valuation Basic Table (VBT).BMI was calculated from measurements of height and weight. The source articlehas much more data, such as 95 percent confidence intervals for the estimates.Source: Roudebush et al. (2006, Figure 1)

Obesity and its Relation to Mortality and Morbidity Costs 37
waist circumference was available for all of these polices. Their main objective wasto determine whether BMI or waist circumference is a better predictor of future all-cause mortality. The relative risk of increased mortality due to obesity is 1.33 whenobesity is defined by BMI ≥ 30. The relative risk is 1.20 when obesity is defined aswaist circumference ≥ 40 inches (101.6 cm). They found that obesity has significant im-plications for underwriting and pricing life insurance, regardless of which measure is usedto define obesity. Mortality risk increased with both BMI and waist circumference, andBMI and waist circumference are highly correlated. Both BMI and waist circumferencepredict mortality well, at least in the male insured lives population.
7.4. Effect of Overweight and Obesity on Mortality Rates
We have used the results of seven published studies to estimate the average effect ofoverweight and obesity on mortality of individuals at an age from 20 to 65, which weconsider the typical working lifetime. In addition, we have used the results of a study thatshowed a declining effect of overweight and obesity with increasing age. The researchresults show that overweight and obesity are responsible for approximately 16 percentof population mortality from age 30 to 44, 17 percent from age 45 to 54, and 14% fromage 55 to 64.
While our analysis is based on empirical research, we found two articles based onmodels, rather than empirical analysis, that we should mention (Olshansky et al., 2005;Chatterjee et al., 2008).
Olshansky et al. (2005) adjusted a U.S. population mortality table, removing theeffect of obesity. In effect, the result is a mortality table for a population that is thesame as the original population except that each member with BMI ≥ 30 is replaced byan otherwise identical life with BMI = 24. The conclusions from this model analysis arerelatively pessimistic. The authors anticipate that life expectancy at birth and at olderages will level off or even decline within the next 50 years as a result of the increase inobesity. Perhaps their approach can be applied to obtain estimates of mortality costsdue to overweight and obesity, but they did not do it. (And we took another approach.)It is also possible that their approach could be adapted to insured life tables, providedoverweight and obesity prevalence data is available for the same population of insuredlives.
Chatterjee et al. (2008) used a very detailed stochastic model of an individual’s life-time that includes the effect of BMI on diabetes, heart disease and mortality (as wellas other factors). The model parameters were estimated with data from the Framing-ton Heart Study and the Health Survey for England. Their conclusions are relativelyoptimistic. For example, they find that even if the prevalence of obesity increases toan extreme degree, the effect on expected future lifetime would be small. However, thismodel does not work like most of the empirical studies in which data (age, sex, BMIetc.) is collected at the beginning of the study, the person is observed during the studyperiod, and results (onset of disease, treatment, death etc.) are recorded. This modelsimulates the life of the person over time with transitions between different states ofhealth. The results for someone age 20 would not be based only on their current BMI,but rather on a simulation of their future BMI. For example, the authors state that a
38 Obesity and its Relation to Mortality and Morbidity Costs
person who was obese, but as a result of health problems became underweight and thendied, would be considered an example of the death of an underweight person. This doesnot provide an evaluation of the causal effect of obesity. This approach, while interestingand valuable, does not really focus as much on the effect of BMI as on the effect of thepattern of change.
7.5. Costs Related to Loss of Productivity Because of Excess Mor-tality
We have estimated the costs of overweight and obesity related to the loss of productivitycaused by excess mortality. Our estimates are based only on labor productivity usingaverage earnings, and do not include the loss of an individual’s services to his or herfamily. We have made no assumption of any difference between the earnings level ofobese people who are working compared to nonobese people who are working. Thereis some evidence that obese individuals who are working may earn slightly less incomethan normal-weight individuals, but the large percentage of people who are obese oroverweight makes it unlikely that this represents a large difference between the averageearnings of working individuals who are not overweight versus those who are overweightor obese. In addition, to the extent that such a difference might reduce the economiceffect of mortality or disability, the reduction would be offset by the economic costrepresented by the lower income itself.
Worklife expectancy is defined as the expected number of years that an individualwill be employed during their future lifetime. This is affected by their life expectancy,and by the probability of working at each future age. Worklife expectancy has beenfound to vary significantly on the basis of age, sex, education, and whether or not theperson is actively employed at the time of determination (Millimeta et al., 2003). Todetermine average working lifetime for the population as a whole, we used the worklifeexpectancy for individuals age 20 published by the Bureau of Labor Statistics in 1986.While worklife data for individuals with various characteristics have been published byresearchers since 1986, the Bureau of Labor Statistics report is the most recent evaluationof worklife for the population as a whole. We were unable to find a population worklifeestimate for Canada, but the percentage of the population that is employed is verysimilar to that of the United States, which implies a similar worklife.
The average worklife expectancy for people age 20 in the United States is 36.8 years.For the purpose of evaluating the loss of productivity from obesity, we assumed peopletypically work a level percentage of their time from age 20 to 65. On the basis of thepopulation mortality rates published by the Social Security Administration, the averagenumber of years lived by a 20-year-old to age 65 is 43.1 years, so the number of yearsworked (i.e., 36.8) is 85 percent of the potential working lifetime while they are alive.The ratio of years lived from 20 to 65 to the potential 45 total years is 95 percent. Thismeans that when comparing worklife to the potential maximum total of 45 years, it isreduced 5 percent by mortality and 15 percent by the fact that, on average, 85 percentof the living population in that age group is working at any time.
The population mortality table published by the Social Security Administration in-
Obesity and its Relation to Mortality and Morbidity Costs 39
cludes any excess mortality caused by obesity, so, to determine the effect on worklife,we reduced the rate of mortality at each age to eliminate the excess mortality we havecomputed. We used the percentage of deaths caused by overweight or obesity as statedabove to provide an age-based distribution of the excess mortality caused by obesityduring the working lifetime.
We computed the years that would be lived from age 20 to 65 if the adverse effectsof overweight and obesity were eliminated, and used that increase to estimate the pro-ductivity gained if overweight and obesity were eliminated. This amount is the cost ofthe loss of productivity (excluding services to one’s family) caused by excess mortalityrelated to overweight and obesity.
According to the research of Stevens et al., the relative effect of overweight andobesity on mortality declines with age (Stevens et al., 1998). On the other hand, thedegree of obesity increases with age. We have combined the decreasing mortality effectof BMI by age, and the pattern of increasing BMI by age, to produce an age-relatedmortality effect. We then applied this effect to the base rates of mortality by age todetermine the effect on worklife. The effect of overweight and obesity excess mortalityis to reduce the population average worklife by 3.8 months. This is consistent withthe research of Olshansky et al. (2005), which found the overall effect of obesity on lifeexpectancy in the U.S. to be a reduction of 1/3 of a year to 3/4 of a year. That studyadjusted for obesity only; it did not adjust for overweight. To have this populationeffect caused by 65 percent of the adult population that is overweight or obese, the lossof worklife caused by excess mortality for overweight or obese individuals is an average of5.8 months. On the basis of average earnings of $35,700, and average employee benefitsof 19.4 percent, this creates an average lifetime cost of $20,600 per overweight or obeseindividual, which is equivalent to an annual cost of $49 billion for the working-agepopulation of the United States and Canada as a whole. Since the levels of overweightand obesity in Canada are less than those of the United States, the cost in the UnitedStates is $44 billion3. The cost in the United States and Canada related to overweightis $6 billion, and the cost of obesity is $43 billion.
8. Disability
8.1. Overview
Disability rates are increased by obesity. For example, a significant portion of disabilitycases are caused by the medical conditions identified as having an increased rate as aresult of obesity. In addition to these conditions, however, there are conditions, such asosteoarthritis, that have little or no effect on mortality, but have significant disabilityeffects, and for which obesity has a significant causal relationship. In addition to higherrates of these conditions, there is evidence that obesity significantly increases the timefor recovery from disabling medical conditions.
3$44 billion ≈ $35,700 × 119.4% × (5.8/12) × 65.1% overweight or obese × 148,000,000 workingage individuals × (1 year / 45 years)

40 Obesity and its Relation to Mortality and Morbidity Costs
8.2. Disability Costs of Overweight and Obesity
To evaluate the economic effects of disability, the disability considered in this evaluationis employment disability, which is a subset of general disability. Specifically, we consideremployment disability that is caused by physical disability resulting from overweight orobesity.
There are other forms of disability, such as mental disability, that reduce employ-ment, but we have not considered these, because the effect of overweight or obesityon these types of disability is minimal or absent. While there appears to be generalagreement about the increase in employment disability as a result of obesity, there islimited quantitative evidence of the degree of increase in employment disability causedby overweight or obesity. The majority of the studies relating obesity to disability areconcerned with physical function, rather than employment disability, and tend to focuson the elderly.
We have focused on four studies that deal with disability among individuals whocould be employed if not disabled. Cawley et al. (2007) and Bungum et al. (2003)studied the absenteeism caused by overweight or obesity among employed individuals. Astudy by Ferraro et al. (2002) evaluates the effect of overweight and obesity on disabilityin the sense that the individual is unable to perform various physical activities, ratherthan specifically having limited employment ability. A study by Østbye et al. (2007)evaluates the increase in workers’ compensation claims caused by overweight or obesity.The study by Ferraro et al. includes a definition of disability broader than the type ofdisability that would reduce productivity, and the study by Østbye et al. is based on amore narrow definition of disability. We were unable to obtain studies of employmentdisability associated with overweight or obesity in Canada, so our analysis of employmentdisability is limited to the United States.
While the two studies of worker absenteeism both found a statistically significantincrease in absenteeism associated with obesity, they produced somewhat different nu-merical results. The study of Cawley results in an estimate that 0.75 percent of potentialwork time is lost as a result of absenteeism associated with overweight or obesity. Thestudy of Bungum et al. results in an estimate that 0.19 percent of potential work timeis lost. The study by Bungum et al. was based on responses of 471 municipal employeeswho responded to a survey request mailed to 3,300 employees and requested in meetingswith portions of a 13,000 employee group. There was no adjustment in the Bungumet al. study for any bias that might have existed between the responses of employeeswho were willing to respond to a survey about their absences and the absenteeism ofthose who did not respond. On the other hand, the study of Cawley et al. was based onthe Medical Expenditure Panel Survey for 2002-04, which covered 55,000 individuals,and had a much higher response rate. For these reasons, we have used the Cawley et al.study to produce the numerical results for worker absenteeism caused by overweight orobesity.
Using the average earnings per year and the average employee benefit rate citedabove, the absenteeism identified by the Cawley et al. study results in a loss of produc-tivity of $43 billion per year.
The two studies of worker absenteeism deal with the absenteeism of active employ-
Obesity and its Relation to Mortality and Morbidity Costs 41
ees. The number of days of work missed per year as a result of sickness or accident inboth studies is approximately one week for all employees, including those in all weightclasses. While these studies produce results for the effect of overweight and obesity onthe productivity of active employees, they do not include a more significant reductionin productivity caused by long-term disability. The 2006 American Community Surveyconducted by the U.S. Census Bureau found that 23.9 million individuals in the U.S.from age 16 to 64 had physical disabilities. Of this group, 15.0 million, or 62.8 percentwere not employed. Among people who were not disabled, 25.6 percent were not em-ployed. In other words, a reduction of 37.2 percent in employment can be attributed tophysical disability, which represents 8.9 million individuals who are not employed. Thisrepresents a loss of 6.0 percent of existing productivity. This is eight times the loss of pro-ductivity identified in the above studies as caused by physical problems among employedindividuals. Therefore, to evaluate the total effect of obesity, the above studies must besupplemented with an estimate of the percentage of potential workers with employmentdisability caused by overweight or obesity who are not active employees because of theirdisability. Using a relative risk of 1.24, which is the relative risk identified for disabil-ity of active employees applied to the total 6 percent loss of productivity caused by allphysical disabilities, the annual cost caused by overweight and obesity is $72 billion peryear. This means the total loss of productivity caused by employment disability andincreased absence is approximately $115 billion in the United States. Based on the ratioof the number of overweight and obese individuals in Canada compared to the UnitedStates, the total annual cost for the United States and Canada would be about $128billion. We did not obtain any research data that split the cost of overweight and obesitybetween those two categories. If the relative rates are similar to the rates for medicalproblems, the cost in the United States and Canada would be approximately $39 billionfor overweight and $89 billion for obesity.
An important element of the study of workers’ compensation claims is the duration ofclaims based on BMI. There is a significant increase in the duration with increasing bodymass, with employees with a body mass over 40 having double the number of days perclaim compared to employees with a BMI between 18.5 and 25. This relationship wouldappear to be applicable to some degree to disability other than workers’ compensationclaims, which would provide support for the use of extended disability periods to estimatea portion of the overall reduction in productivity caused by conditions resulting fromoverweight or obesity.
Workers’ compensation claims are based on work-related injuries. Except for rela-tively rare situations in which an illness can be ascribed to employment, workers’ com-pensation claims do not include employment disability resulting from illness. This meansthat the reduction in productivity indicated by workers’ compensation claims is a frac-tion of the total loss of productivity caused by the increase in illness or injury causedby overweight or obesity. The increase in workers’ compensation claim costs caused byoverweight and obesity is $10 billion per year, approximately 10 percent to 15 percentof the total cost of workers’ compensation coverage.
In summary, the total cost caused by the loss of productivity due to excess deaths anddisability as a result of overweight and obesity, as well as the cost of work-related injuryassociated with overweight and obesity, is approximately $177 billion per year in the
42 Obesity and its Relation to Mortality and Morbidity Costs
United States. Based on the population ratio between the United States and Canada,and the relatively similar percentages of overweight and obesity, and the currently similarvalue of Canadian and U.S. dollars, we would estimate a total cost in Canada of excessmortality, disability and absenteeism associated with overweight and obesity at $18billion.
8.3. Effect of Juvenile Obesity
Our analysis of lost productivity associated with overweight and obesity has been carriedout to identify current costs. Therefore, we have not included effects of obesity onjuvenile individuals because they are not currently working. On the other hand, there isa clear relationship between juvenile obesity and a loss of productivity in the future. Themost obvious reason is that obesity tends to continue, i.e., an obese juvenile is much morelikely to be obese as an adult than a juvenile of normal weight. A second reason, whichhas recently been demonstrated, is that obesity of juveniles tends to produce healthproblems that can continue into adulthood and cause future losses of productivity ofthose individuals.
9. Economic Costs of Obesity
9.1. Articles on Obesity Costs
Wolf and Colditz (1998) used the prevalence-based approach to estimate an updateto earlier estimates of the economic costs of obesity in the U.S. The authors appliedpopulation-attributable risk percentages to total annual direct costs of diabetes, coro-nary heart disease, hypertension, gallbladder disease, cancer and osteoarthritis to deter-mine corresponding costs due to obesity. The authors also describe how indirect costindices (bed days, restricted-activity days and work-loss days) increase with BMI. Theywere able to convert these measures to annual costs. Table 11 summarizes direct and in-direct costs from their article. They concluded that direct costs associated with obesityrepresent 5.7 percent of U.S. aggregate health expenditure in 1995. In a similar analy-sis, Seidell and Deerenberg determined that about 4 percent of total health care costs inthe Netherlands are associated with obesity (Seidell and Deerenberg, 1994). They citedsimilar figures from other countries: direct costs of obesity amount to about 5 percentof total costs in industrialized societies in 1994.
Katzmarzyk and Janssen (2004) also used the prevalence-based approach to estimateeconomic health care costs attributable to inactivity and obesity in Canada. They foundthe economic burden of physical inactivity was $5.3 billion ($1.6 billion in direct costsand $3.7 billion in indirect costs) while the cost associated with obesity was $4.3 billion($1.6 billion of direct costs and $2.7 billion of indirect costs). The total economic costs ofphysical inactivity and obesity represented 2.6 percent and 2.2 percent, respectively, ofthe total health care costs in Canada. The costs are not additive because some obesityis due to inactivity.

Obesity and its Relation to Mortality and Morbidity Costs 43
Table 11Annual Direct and Indirect Costs due to Obesity
l Direct Cost Indirect Cost
Diabetes 32.400 30.740Coronary heart disease 6.990 —Hypertension 3.230 —Gallbladder disease 2.590 0.150Breast cancer 0.840 1.480Endometrial cancer 0.286 0.504Colon cancer 1.010 1.780Osteoarthritis 4.300 12.900
Total 51.646 47.564
Annual costs attributable to obesity in billions of1995 U.S. dollars for the indicated conditions. Source:Wolf and Colditz (1998, Table 2)
Thompson et al. (1998) estimated the economic costs of obesity to U.S. businesses in1994, using the prevalence-based approach. They estimated that at least 43 percent of allhealth care spending by U.S. businesses in 1994 was associated with obesity. The impactvaries considerably by disease with a low of about 16 percent for hypercholesterolemiaand a high of 86 percent for diabetes.
Arterburn et al. (2005) reported the following relationship between BMI and healthcare expenditures. Table 12 shows some of their results.
Table 12Adult Total per Capita Health Care Expenditures According to BMI
BMI Expenditures
< 18.5 2,54718.5–24.9 2,42425–29.9 2,66430–34.9 2,98435–39.9 3,511≥ 40 4,399
Annual costs per person in 2002 U.S. dollars.Source: Arterburn et al. (2005, Table 2)
Østbye et al. (2007) determined the relationship between BMI and workers’ compen-sation claim frequency, associated claim costs and lost workdays. Table 13 summarizesthe annual cost per employee.
Based on data collected in 1999 for a large Minnesota health plan, Anderson et al.estimated the proportion of total health care charges associated with physical inactivity,

44 Obesity and its Relation to Mortality and Morbidity Costs
Table 13Medical and Indemnity Claims According to BMI
BMI Medical Claims Indemnity ClaimsCosts Costs
< 18.5 71.09 39.2418.5–24.9 75.03 53.9625–29.9 133.38 135.6930–34.9 196.61 236.3335–39.9 233.73 342.93≥ 40 510.91 591.78
Annual claims costs per worker in U.S. dollars deter-mined from 1997–2004. Source: Østbye et al. (2007,Table 3)
overweight and obesity among U.S. populations age 40 and older (Anderson et al., 2005).Table 14 shows the average annualized charges per participant as a function of BMI. Theauthors concluded that 27 percent of U.S. national health care costs were associated withphysical inactivity, overweight and obesity.
Table 14Average Annual Health Care Charges in the U.S. According to BMI
BMI Average Annual Cost
< 25.0 3,99425.0–29.9 5,239≥ 30.0 6,146
Annual costs per person in U.S. dollars de-termined from 1996–99. Source: Andersonet al. (2005, Table 2)
Wang et al. (2003) conducted a cross-sectional study of 177,971 General Motorsemployees and adult dependents in the U.S. from 1996-97 to explore the relation betweenBMI groups and concurrent medical costs. Overall, they found the normal group hadlowest median costs. The underweight group had higher medical costs than the normalgroup. Median medical costs increased steadily from normal to overweight, and fromoverweight to obese. The results differ slightly for subgroups defined by age, but a clearJ-shape pattern is evident in the data overall. The study confirms that increased BMI,above normal, is associated with increased medical costs, as illustrated in Table 15.
We found several reports by state agencies. For example, according to Powell (2007),the CDC estimated Georgia spends $2.1 billion per year in costs associated with obesity.A Louisiana report describes obesity as one of the state’s greatest and most pressingpublic health challenges.

Obesity and its Relation to Mortality and Morbidity Costs 45
Table 15Median Annual Health Care Costs per Person According to BMI
BMI Annual Median Cost
< 18.5 3,18418.5–24.9 2,22525.0–29.9 2,38830.0–34.9 2,80135.0–39.9 3,182≥ 40 3,753
Annual costs per person in U.S. dollarsdetermined from 1996-97. Source: Wanget al. (2003, page 186)
Daviglus et al. (2004) reported on U.S. Medicare costs for cardiovascular disease anddiabetes for men and women 65 and older compared to the levels of BMI at youngerages, average age 46.0 for men and average age 48.4 for women. The results were similarfor three different models. Table 16 gives annual health costs in 2002 dollars per personas a function of BMI.
Table 16Average Annual U.S. Medicare Charges per Person According to BMI
BMI 18.5–24.9 25–29.9 30–34.9 ≥ 35
Male 7,339 8,319 10,155 13,531Female 6,637 7,525 9,270 11,985
These are average annual U.S. Medicare charges per per-son in 2002 dollars for inpatient and outpatient carefrom 1984–2002 by baseline BMI determined in 1967–73.Source: Daviglus et al. (2004, Table 2)
The study by Rosamond et al. (2008) gives total U.S. costs for medical conditionswhose relative-risk was increased by obesity. There is some overlap among the conditionscited. The 2008 costs in billions, by condition, are shown in Table 17.
Bhattacharya and Bundorf (2009) determined medical expenditures based on morethan 88,000 person-year observations of workers in the U.S. from 1989–2002. Table 18shows their estimates of total annual medical costs for nonobese and obese persons.
Wang et al. (2005) examined the influence of physical activity and BMI on healthcare utilization and costs among U.S. Medicare retirees. They concluded that promotingactive lifestyles would improve well-being of Medicare participants and save a substantialamount of health care costs. Some of their results are summarized in Table 19.
Borg et al. (2005) studied hospital days and BMI to determine annual aggregate ex-cess hospitalization and additional indirect costs due to obesity. They estimate that ag-

46 Obesity and its Relation to Mortality and Morbidity Costs
Table 17U.S. Annual Health Care Costs
Condition Total Cost
Heart Diseases 287.3CHD 156.4Stroke 65.5Hypertensive Diseases 69.4Heart Failure 34.8Total 448.5
Aggregate annual costs in the U.S. in billions ofdollars for various conditions in 2008. Source:Rosamond et al. (2008, Table 19-1)
Table 18Total U.S. Annual Medical Costs for Nonobese and Obese Persons
WomenAge Nonobese Obese Difference18-64 2,718 4,176 1,45820-50 2,406 3,193 78720-50 Privately Insured 2,586 3,169 583
MenAge Nonobese Obese Difference18-64 2,498 2,904 40620-50 1,719 1,881 16220-50 Privately Insured 1,896 1,949 53
Aggregate annual costs based on data for U.S. workers from 1989–2002,according to sex, age and obesity status determined by BMI. Source:Bhattacharya and Bundorf (2009)

Obesity and its Relation to Mortality and Morbidity Costs 47
Table 19U.S. Annual Health Care Costs per Person by Level of Physical Activity
BMI
18.5–24.9 25–29.9 ≥ 30
Level of PA (times/week)0 12,528 12,583 12,5861-3 10,439 10,567 11,306≥ 4 9,178 9,979 10,207
Annual U.S. Medicare health care costs (outpatient, inpatientand drug costs) per person in 2002 dollars, according to BMIand three levels of physical activity (PA). Source: Wang et al.(2005, Table 2)
gregate indirect lost production due to obesity-related early deaths at 2.9 billion Swedishkrona. Table 20 summarizes their results.
Table 20Present Value of Excess Aggregate Annual Health Care Costs in Sweden
Category Hospital Cost Indirect Cost Total
OverweightMale 39,526 26,663 66,189Female 40,215 9,193 49,408
Total ObeseMale 1,320,654 2,387,908 3,708,562Female 768,904 511,690 1,280,594
The present value is based on a discount rate of at 3 percent. The costsare in Swedish krona (approximately 7 krona per dollar). Source: Borget al. (2005, Table 7)
Buescher et al. (2008) studied the relationship between BMI and Medicaid costs ofNorth Carolina adolescents during 2004. They found that children who receive publichealth services are more likely to be overweight than children in a representative nationalsample (27.2 percent versus 17 percent). They found that overweight children in thestudy had greater risk of diabetes, asthma and mental disorders than normal weightchildren.
Bungum et al. (2003) studied the relationship between body mass index, medicalcosts and job absenteeism. They used self-reported data from 577 of the 1,300 employeesthey asked to participate. The results provide evidence that employee BMI classificationpredicts high health care costs and high absenteeism in the U.S. The average annualhealth care cost for the normal class ($114) increased to $573 for overweight and to$620 for obese. The bigger increase was from normal to overweight. Smoking habit and

48 Obesity and its Relation to Mortality and Morbidity Costs
gender did not predict health care costs or absenteeism.Finkelstein et al. (2003) used a regression model with U.S. data from the 1998 Medical
Expenditure Panel Survey (MEPS) and the 1996 and 1997 National Health InterviewSurveys (NHIS) to estimate aggregate medical spending attributable to overweight andobesity. They concluded that (in 1998) 9.1 percent of annual medical spending wasattributable to overweight and obesity. That rivals the cost attributable to smoking,which ranges between 6.5 and 14.4 percent, depending on the source.
Finkelstein et al. (2005) discussed the economics of the obesity epidemic, using pub-lished data and articles. They found economic medical costs for obese individuals are36 percent higher than for nonobese individuals. Absenteeism attributable to obesity inthe U.S. cost $2.4 billion in 1998.
Sturm (2002) compares the effects of obesity, overweight, smoking and problem drink-ing on health care costs based on a national telephone survey of about 10,000 U.S. house-holds from 1997-98. He found obesity has roughly the same association with chronicdisease as twenty years’ aging, and this greatly exceeds the associations of smoking orproblem drinking. Overweight was associated with average increase of $125 in annualhealth costs. The cost increases associated with obesity, smoking and problem drinkingwere $395, $230 and $225, respectively.
Oster et al. (2000) estimated the health and economic burden of obesity to a hypo-thetical U.S. health plan with 1 million members between ages 35 and 84. This paperhas more information, some of which we cited earlier. In Table 21 we summarize theresults on obesity-related costs.
Table 21Obesity Related/Total Costs of Managed Care per Member
Condition Male Female TotalHypertension 30.9/73.3 (0.42) 41.4/85.3 (0.49) 72.3/158.6 (0.46)Cholesterol 3.7/19.5 (0.19) 4.3/24.6 (0.17) 8.0/44.1 (0.18)Type 2 Diabetes 49.7/64.9 (0.77) 80.8/86.8 (0.93) 130.5/151.7 (0.86)CHD 54.2/153.0 (0.35) 29.3/88.2 (0.33) 83.5/241.2 (0.35)Stroke 8.3/71.9 (0.12) 15.4/83.7 (0.18) 23.7/155.6 (0.15)Gallbladder 3.3/7.4 (0.45) 6.9/16.8 (0.41) 10.2/24.2 (0.42)Osteoarthritis, Knee 7.1/20.2 (0.35) 10.1/37.0 (0.27) 17.2/57.2 (0.30)Endometrial Cancer – 0.5/2.2 (0.23) 0.5/2.2 (0.23)
Total 157.2/410.2 (0.38) 188.7/424.6 (0.44) 345.9/834.8 (0.41)
Obesity related costs over total costs, in millions of U.S. dollars, according tocondition. We added the numerical value of the ratio in parentheses. Source:Oster et al. (2000, Table 5)
Costs associated with obesity include obesity-related work absenteeism. Cawley et al.(2007) documented job absenteeism associated with obesity in the U.S. They found astrong association. Costs are much greater for women than men, as shown in Table 22.
Colditz (1999) surveyed the National Library of Medicine’s MEDLINE database forstudies reporting on economic costs of obesity or inactivity. The survey results include

Obesity and its Relation to Mortality and Morbidity Costs 49
Table 22Aggregate Costs from Absenteeism in the U.S.
Women Men
Morbidly MorbidlyObese Obese Total Obese Obese Total
Overall 1830.1 1337.7 3167.8 453.2 637.8 1091.0Managers 446.3 211.1 657.4 81.9 317.2 399.1Professionals 452.1 432.8 884.9 190.5 109.7 300.2Sales workers 186.8 130.0 316.8 73.0 39.6 112.6Office workers 301.8 278.8 580.6 14.4 32.0 46.4Equipment andtransportation operators 178.3 132.5 310.8 58.9 96.2 155.1
These are the aggregate costs per year associated with obesity andmorbid obesity, by gender and occupation (in millions of 2004 dollars).Source: Cawley et al. (2007, Table 6)
population-attributable risk for inactivity, which the author multiplied by annual costsof illnesses caused by physical inactivity. Overall, physical inactivity costs the U.S. $24.3billion per year (in 1995) for direct health care delivery costs. That is 2.4 percent of allhealth care costs.
Similarly, Colditz estimated that health care costs associated with obesity were about7 percent of total health care costs in 1995. Thus, direct health care costs associatedwith obesity and inactivity amounted to 9.4 percent of total direct costs in 1995. In-direct costs are given, but it is not clear how they were estimated. The author stated:“The indirect costs attributable to obesity amount to at least $48 billion. The majorcontributor to these costs is CHD (48 percent), which accounts for the large portion ofpremature mortality. Other indirect costs were non-insulin dependent diabetes mellitus(17.5 percent), and osteoarthritis (17.1 percent); the latter largely resulted from excessbed days, work days lost, and restricted activity days.”
Allison et al. (1999a) showed that the “prevalence-based” approach overestimatescosts because it does not take into account the fact that those with higher BMI havehigher mortality rates. They concluded that previous estimates overstate the cost at-tributable to obesity, although obesity nevertheless increases heath care costs.
The report on overweight and obesity in Canada we mentioned earlier (Raine, 2005)also discussed economic costs associated with obesity. The total direct cost of obesity-related health care in Canada in 1997 exceeded $1.8 billion, about 2.4 percent of totalhealth care costs (Birmingham et al., 1999). In Canada in 1997, about 50.7 percentcosts of type 2 diabetes were attributable to obesity. For hypertension, the percentagewas 31.6 percent, for pulmonary embolism is was 29.8 percent and for endometrialcancer it was 26.6%. There seems to be no national study, but a study in Nova Scotiacalculated that direct costs of obesity were $128 billion while indirect costs (productivity,absenteeism and disability) were another $140 billion, for a total of $268 billion. Thereport concluded: “In this Canadian context indirect costs of obesity to the economy

50 Obesity and its Relation to Mortality and Morbidity Costs
exceed direct health care costs.”Detournay et al. (2000) studied a large sample from the 1991–92 National Household
Survey in France to determine the relation of obesity to health care costs. They foundthe extra cost of obesity is in the range 0.7 to 1.5 percent of total French health carecosts (in 1992). The direct health care cost of obesity as a percentage of total cost variedby age. It ranged upward from 3 percent at age 20 to 8 percent at age 55, before movingdownward by about 0.3 percent per year. It was actually negative above age 80.
Wang et al. (2004) examined the relationship of body mass index and physical activityto health care costs among 196,000 employees of General Motors Corp. from 1995–96.They found that more physically active employees had significantly lower health costs. Ifobese sedentary employees adapted an active lifestyle, the total health care costs wouldbe reduced by 1.5 percent.
Visscher and Seidell (2001) stated: “The direct costs of obesity are now estimatedto be around 7 percent of total health care costs in the United States and around 1 to 5percent in Europe. Narbro calculated that approximately 10 percent of the total costsof loss of productivity due to sick leave and work disability might be attributable toobesity-related diseases.”
In a study of Swiss health costs for 2001, Schmid et al. (2005) found that over-weight and obesity contributed equally to health costs, although overweight was muchmore prevalent. Moreover, they went on, the latter was increasing and may even havebeen underreported. This observation led them to claim that overweight constituted afinancial time bomb.
Visscher et al. (2004) studied 19,518 adults in Finland for 15 years from entry in1973-77. They were able to quantify the number of years lived in an unhealthy staterelative to BMI. Obese men age 25–64 who have never smoked lived 0.63 more yearsof work disability than normal weight counterparts. The figure was 0.52 for women.Excess risk of morbidity and disability due to obesity were the highest in the youngestage groups.
Mansson et al. (1996) studied BMI and its relation to disability and mortality formore than 7,500 Swedish male workers. Some of their results are shown in Table 23.The incidence of disability was lowest for normal BMI and increased as BMI increased tooverweight and obese. The incidence was also higher for underweight, probably due tohigher incidence of musculoskeleletal and circulatory diseases and alcohol dependence.
Table 23Rates of Disability by BMI for Male Workers in Sweden
BMI Disability Rate
< 20.0 18.820.0–24.9 9.925.0–29.9 12.6> 30.0 23.9
Source: Mansson et al. (1996, page 82)

Obesity and its Relation to Mortality and Morbidity Costs 51
Schmier et al. (2006) surveyed the literature on worker absenteeism, sick leave anddisability associated with overweight and obesity. They found several studies showingoverweight and obese employees take more sick leave and have higher absenteeism thannormal weight employees. For example, one study found that approximately 10 percentof total sick leave and disability cost in Sweden is associated with overweight and obe-sity. Several studies report the rate of work-place injuries is significantly higher amongoverweight and obese workers. For example, a study of 10,000 oil company workersin Texas found the rate of lower back injuries is 1.42 times higher for overweight thannormal workers.
9.2. Risk Estimates
We combined the relative risk data from the published studies we reviewed by usingthe population percentage for each of the BMI groups covered by each study, and byweighting the results by the square root of the number of individuals included in eachstudy. Our reason for using the square root of the number, rather than the numberitself, was based on our observation that the variance in results between studies wasmuch higher than would be indicated by the variance of results based on the statisticaluncertainty caused by the number of individuals forming the basis of the study. Ifa series of identical studies found varying levels of effects, it would be appropriate toweight the results of each study by the number of individuals covered by the study.But when the variance of results is much higher than expected, it indicates that theprocedures followed by the studies were not identical and some judgment is thereforerequired in weighting the results. We felt the square root of the population providedincreased weight for larger studies while reflecting the fact that smaller studies could beof significant interest because of the variation in methodology. This decision does nothave an overwhelming effect on the ultimate results.
In the case of cancer, we used a different methodology because a meta-analysis byRenehan et al. (2008b) provided excess cancer rates caused by overweight or obesityon the basis of 141 published studies, covering almost all types of cancers identified asbeing related to obesity. The increase in the rate of uterine (endometrial) cancer wasnot covered in the Renehan et al. study, so we based our results for that cancer on astudy published by the World Cancer Research Fund (Marmot, 2007).
9.3. Excess Medical Costs Caused by Overweight and Obesity
Using the total medical costs reported by the Medical Expenditure Panel Survey (MEPS)4
combined with the base rate and relative risks of overweight and obesity determined asstated above, we have estimated the excess medical costs of cancer, cardiovascular dis-ease, diabetes, kidney disease and strokes caused by overweight and obesity. The MEPScosts were reported as of 2006, so we increased these costs by 11.4 percent to reflectthe medical cost inflation from 2006 to 2009. Because the documented relationship of
4Medical Expenditure Panel Survey, Table 3: Total Expenses for Selected Conditions by Type ofService: United States, 2006, published at website http://www.meps.ahrq.gov/mepsweb/data_stats

52 Obesity and its Relation to Mortality and Morbidity Costs
cancer to obesity relates only to certain specific types of cancer, we used other sourcesto estimate the medical costs for these types of cancer. The data upon which our costestimate is based for cancer, cardiovascular conditions, diabetes and hypertension areshown in the Table 21. The relative risk values are based on the overweight and obeseportion of the population.
Twenty-five percent of kidney-stone disease is caused by overweight or obesity (Tayloret al., 2005) with a cost of $0.6 billion (Pietrow and Karellas, 2006). More than 60 percentof end-stage renal disease is caused by overweight or obesity (Hsu et al., 2006) with acost of $22.6 billion5. Based on population ratios, we estimate the cost in Canada at$2.7 billion.
According to Silva et al., the rate of strokes in the population is increased by over-weight and obesity (Silva et al., 2006). Approximately 22 percent of the strokes in theU.S. are caused by overweight or obesity. The direct cost caused by the newly occurringstrokes was found to be $40.6 billion in 1990 (Taylor et al., 1996). Since much of thisamount is based on non-medical costs, such as nursing home care, we used nonmedicalinflation to project a value of $66.6 billion in 2009. The portion caused by overweight orobesity is approximately $6.2 billion. Based on population ratios, we estimate the costin Canada at $0.7 billion.
The cost of osteoarthritis is much less than that of the other conditions noted above,so it is not included in our estimate; however, osteoarthritis is discussed in more detailbelow because its relationship to BMI provides an interesting issue to consider whendefining normal and excess BMI.
Table 24Estimated Economic Costs of Overweight and Obesity by Condition
Condition Case Count Relative Risk Base Rate Total Cost BMI ≥ 25 Cost(millions) (billions) (billions)
Cancer 0.6 1.23 0.24% 48.0 $7Cardiovascular 26.8 1.30 8.15% 116.2 27Diabetes 18.3 3.15 3.26% 53.8 37Hypertension 45.8 1.79 13.35% 54 24Kidney Disease 25Stroke 7
Total 127
We have estimated the portion of the excess medical costs caused by overweight andthe portion caused by obesity. The overweight but not obese (25 ≤ BMI < 30) portionis $38 billion and the portion caused by obesity (BMI ≥ 30) is $89 billion. Case countis the annual rate of new cases. Source: Medical Expenditure Panel Survey, Table3: Total Expenses for Selected Conditions by Type of Service: United States, 2006,published online at http://www.meps.ahrq.gov/mepsweb/data_stats
5U.S.Renal Data System 2008 Annual Data Report

Obesity and its Relation to Mortality and Morbidity Costs 53
9.4. Medical Costs of Overweight in Children
The increase in medical costs associated with obesity occurs primarily at older ages.We have not found evidence of increased costs for children of a magnitude that wouldbe significant in relation to the total for adults. Therefore, we have not included theeffects of obesity of children in the above estimates. On the other hand, there is a clearrelationship between juvenile obesity conditions that could lead to medical problemsin the future. In addition, obesity of children tends to continue into the future, so thecurrent increase in juvenile obesity can be expected to lead to even higher future medicalcosts if juvenile obesity is not reduced.
9.5. Effect of the Definition of Overweight on the Estimated ExcessMedical Cost
As noted above, most of the analyses of excess rates of medical conditions are basedon the definitions of overweight and obesity, which were based on population BMI ratesin the 1980s, rather than on analyses of the level of BMI that starts increasing theseconditions. The few papers that evaluate the effect of BMI below 25 indicate that BMIlevels below the current overweight cutoff can have an adverse effect on these conditions.For example, Tsai et al. found a relative risk of diabetes equal to 1.57 for individualswith a BMI from 23 to 25 (Tsai et al., 2006). There is not enough data for these levelsof BMI to support an accurate overall analysis, but it is clear an increase in relative riskat these levels would increase the estimated excess medical costs in two ways. First, thenumber of individuals with excess risk would be increased to include some individualsnot currently considered to be overweight. Second, if the rate for lower BMI is even lessthan currently considered the base for a BMI less than 25, the relative risk for overweightindividuals in relation to this lower rate would be more than is estimated in relation tothe rate for a BMI less than 25. For example, if the result of the Tsai et al. paper isused to determine the portion of the population without excess risk and the relative riskof the remaining population, the excess cost of diabetes would be increased from $31billion to $41 billion.
9.6. Overweight and Osteoarthritis
While the medical costs of osteoarthritis are much less than the costs of the otherconditions we considered related to overweight and obesity, osteoarthritis is of interestbecause of the very specific relationship between osteoarthritis of the knee and BMI.Virtually all osteoarthritis of the knee is caused by body weight.
For individuals with a BMI of 20, the rate of osteoarthritis of the knee is 0.1 per-cent compared to the population average of 1.5 percent (Coggon et al., 2001; Hart andSpector, 1993). The relative risk of osteoarthritis of the knee for obese individuals isbetween 6 and 7 (Hart and Spector, 1993). This means that an obese individual hasmore than 60 times as much risk of having osteoarthritis of the knee as a thin individualwith a BMI of 20. The total cost of surgery for osteoarthritis of the knee is about $270million in the U.S. and Canada. Approximately $150 million of this amount is related

54 Obesity and its Relation to Mortality and Morbidity Costs
to obesity, and almost all of the rest is related to overweight or body weight in excessof a BMI of 20.
9.7. Obesity in Older Populations
We found several studies that focus on older age populations. The major findings onthe impact of overweight on morbidities in Janssen’s research for a 65 or older U.S.population are as follows (Janssen, 2007):
• The risks for arthritis and physical disability increased modestly in the overweightgroup.
• The risk for diabetes increased by 78 percent in the overweight group.
• Overweight and obesity were not associated with an increased risk for myocardialinfarction.
• Overweight and obesity were not associated with increased risk for sleep apnea.
• Overweight and obesity were not associated with increased risk for urinary incon-tinence.
• Overweight was not associated with increased risk for cancer.
• Moderately elevated BMI may have a slight effect on physical disability risk.
Zablotsky and Mack (2004) studied BMI for U.S. women from large sample surveystaken in 1990 and 2000. The prevalence of obesity increased from 14.4 percent in 1990 to21.7 percent in 2000. Prevalence of underweight declined from 3.1 percent to 2.4 percent.Factors related to obesity in older women are consistent with factors previously identifiedin younger women. The study is based on self-reported survey data, the Behavioral RiskFactor Surveillance System, which is thought to be reliable. The study identified diabeteswith the question, “Have you been told you have diabetes?” This led to an odds ratioof 2.55 for obese women age 50–69 and 2.19 for women age 70 or older.
Wray et al. studied self-reported diabetes and weight loss for overweight healthyadults age 51–61 (Wray et al., 2004). They found that these middle-aged adults were 50percent more likely to lose at least 10 pounds if they had been diagnosed with diabetesthan if they had not. The weight loss was not predicted by other variables such aseducation or net worth.
Krueger et al. studied mortality associated with BMI for the U.S. elderly (60 andolder) population (Krueger et al., 2004). They found that the general claims of theprotective or harmful effects of obesity at older ages may be misguided. For example,normal weight, overweight and obese class I individuals have equivalent or lower risksof overall, cancer and respiratory disease mortality, but increased risks of circulatorydisease mortality. Moreover, overweight and obese class I individuals have increasedrisks of diabetes mortality, relative to normal-weight individuals. These results areimportant, given the increased prevalence of obesity among the elderly. Circulatorydisease, cancer and diabetes are the first, second and fourth leading causes of death,respectively, among those 65 and older.

Obesity and its Relation to Mortality and Morbidity Costs 55
9.8. Obesity and Insurance
We found relatively few research articles based on insurance data. In Section 7.3, wementioned four of them (Niverthi and Ivanovic, 2001; Roudebush et al., 2006; Baldingeret al., 2006; Cumming and Pinkham, 2008). In addition, there are several insurancearticles that survey research and discuss implications for insurance. For example, thereinsurer reports (Eng, 2004) and (Hopkins and Bright, 2005) show that life and healthinsurers take obesity seriously and are trying to get this information to clients. However,these are descriptive articles; they do not model or quantify the impact of obesity andoverweight trends on life and health insurance.
The Eng et al. (2005) article is a very interesting comparison of public and insuranceindustry responses to obesity and smoking, based on peer-reviewed articles, news sourcesand government publications. However, the article itself is intended for insurance indus-try and public officials; it is not peer-reviewed and it presents no new scientific resultsor models.
The Hopkins and Bright article appears in a Hanover Re in-house publication, whichis not peer-reviewed. Nevertheless, the article is a very good review of scientific paperson BMI and its relation to life insurance, critical illness and disability income risks.There are no new results or models; however, they do describe how BMI is used inunderwriting. For example, they write that standard rates for life, critical illness anddisability insurance are not available for applicants with BMI ≥ 30. Applications for lifeinsurance with BMI ≥ 40 are declined and applications for critical illness and disabilityinsurance with BMI ≥ 45 are declined. They also note that, while obesity is moreprevalent among lower socio-economic groups, its prevalence is significant in typicalinsurance applicant groups.
In a report published by Swiss Re, Eng discusses the impact of obesity on life in-surance. It is a thorough and convincing presentation of increased mortality due tooverweight and obesity, based on peer-reviewed articles and government reports. Thisis a survey paper; it does not present new results or models. However, it explains verywell the impact on the life insurance industry (as of 2004), including this importantpoint: Not only is the prevalence of obesity increasing in insured populations, the rela-tive mortality risk is higher in insured populations than in the general population. Theincreasing obesity trend could reduce the profitability of existing life insurance business.Evidently, the trend has an impact on disability profitability also. In 2004, Unum Prov-ident, a large U.S. insurer, reported a tenfold increase in obesity-related, short-termdisability claims over the preceding decade (Unum, 2004).
Hartwig and Wilkinson (2004) give an overview of obesity and its impact on healthinsurance, life insurance, disability insurance, workers compensation, liability and ex-cess casualty insurance. It has an excellent discussion of obesity litigation, includingthe example of food-related advertising on children’s television. They also discuss thedifference between “fast food” litigation and tobacco litigation. It is very interesting,but there are no new research results.
Gutterman (2008a) wrote a monograph that synthesizes the research on the preva-lence and impacts of obesity and related factors on the future health of the population,with an emphasis on the United States. He summarized this monograph in a brief article

56 Obesity and its Relation to Mortality and Morbidity Costs
(Gutterman, 2008b). The monograph describes future obesity trends and the resultingimpact on mortality, morbidity, disability, health care costs and quality of life. His con-clusions are somewhat pessimistic. He warns against “a simple extrapolation of recentoverall mortality trends” without taking into account changes in human behaviors (eat-ing more fat, exercising less). This is an excellent discussion of the literature and futurepossible implications, but there are no new research results.
9.9. What to Do?
A recent preliminary study by Bleich et al. (2008) tries to answer the question “Why isthe developed world obese?” by studying the relative contribution of increased caloricintake and reduced physical activity. The introduction of the paper has interesting dataon trends and levels of obesity in various developed countries. They offer these summaryconclusions:
• The rapid increase in obesity across the developed world suggests a common cause.
• Increased caloric intake is primarily responsible for adult weight gain in developedcountries.
• The shift toward increased caloric intake is associated with technological innova-tions such as reduced food prices as well as changing socio-demographic factorssuch as increased urbanization and increased female labor force participation.
• Efforts should be made to reduce consumption and encourage low-calorie diets.
In a recent JAMA editorial, Gregg and Guralnik (2007) stated: “Disability representsin part the collective effects of multiple obesity-related conditions, which bodes poorly forany simple clinical or public health solutions to modify the obesity-associated disabilitytrends. This challenge is compounded by the lack of commonly practiced interventionsdirectly aimed at reducing disability in at-risk populations. Structured exercise andweight-loss programs may be among the most promising unifying interventions, becausethey appear to help prevent type 2 diabetes, reduce arthritis symptoms, and improvephysical functioning – i.e., they can reduce each of the outcomes of obesity that havepersisted over time. In the end, however, reducing the effect of obesity on morbidityby simply altering its course or accommodating its presence may never have an impactequal to a successful public health strategy to prevent obesity.”
Several sources recommend improving diet and increasing physical activity. How-ever, according to a study by Bauman et al. (2008), population-effective weight-loss andweight-maintenance intervention requires more than leisure-time physical activity. Theyrecommend serious efforts be made to promote active commuting, work-related activity,active living and domestic incidental energy expenditure. They found that in China, in-creases in obesity are clearly related to increasing sedentary lifestyles. They recommendusing public transportation, limiting car use, designing cities appropriately and offeringsocioeconomic incentives to engage in everyday leisure time activities. James (2008)also discussed the rise of overweight and obesity China. He asserted policymakers donot understand that the obesity epidemic is a normal population response to reduction
Obesity and its Relation to Mortality and Morbidity Costs 57
in the demand for physical activity and major changes in the food supply, which is seenclearly in China. He concluded the study with this: “How can the community of doctorsand others concerned with nutrition and physical activity engage the policy makers atthe highest government level? It is probably only at this level that major reforms canbe made.”
According to Mehrotra et al. (2005), there are few population-based studies of weigh-loss surgeries in the United States, despite the rapid adoption of weight-loss surgery. Nostudy has assessed the economic costs and complications associated with weight-losssurgery. Mehrotra et al. used Wisconsin hospital discharge data to examine the trends,costs and complications for all types of weight loss surgery from 1990 to 2003. From1990–92 and 2000–02, the total number of weight-loss surgeries increased by 600 percent,from 269 to 1,884. Total costs of weight-loss surgeries in Wisconsin were $3.3 million in1990-92 and $44.5 million in 2000–02.
Anderson et al. (2007) reported on a long-term follow-up of 118 obese patients, ar-guing that intensive behavioral intervention can be very effective. Brownell and Frieden(2009) proposed a tax on sugar-sweetened beverages. Fitzner et al. (2006) suggest amanaged-care approach to treating obesity.
Several states have reported on obesity, its impact on health care, and programsto encourage better diets and more physical activity. Alaska (Alaska, 2003), California(California, 2005), Georgia (Georgia, 2007), Louisiana (Louisiana, 2004) and Texas (Mc-Cusker et al., 2004) published results on prevalence of obesity, its relationship to healthcare and other costs, and the states’ responses. Washington established an ObesityProgram in its Department of Health & Social Services (Washington, 2007). In 2003,Georgia initiated a program to prevent obesity and related chronic diseases throughimproved nutrition and physical activity (Powell, 2007).
Roux and Donaldson (2004) argued that the abundance of studies on cost of illnessmerely confirmed that obesity was a serious societal issue, but that those studies did notlead to remedial policies. They asserted that an appropriate role of economics would beto focus on formal evaluation of different strategies for the prevention and treatment ofobesity.
Flynn et al. studied hundreds of articles and reports on childhood obesity to makea synthesis of evidence of best practice recommendations to funding agencies, programdevelopers, agencies serving children and governments (Flynn et al., 2006). We do nothave space to discuss all of this very thorough study. Here are key recommendations forfunding agencies:
• Develop obesity prevention and treatment programs for critical population sub-groups currently being underserved: immigrants, children younger than 5 andmales.
• Develop obesity prevention programs with rigorous evaluation components in thehome and community settings.
• Develop population-based obesity interventions to balance, support and extendcurrent emphasis on individual-based programs.
58 Obesity and its Relation to Mortality and Morbidity Costs
• Implement long-term follow-up to determine program impacts as relates to normalbody weight. For agencies serving youth, they say that intervening to preventobesity is worthwhile. They encourage schools to increase physical activity andhealthy eating.
According to Hill et al., recent efforts to address population obesity have been unsuc-cessful because they focus on individual interventions to prevent or treat obesity throughindividual changes in diet and physical activity (Hill et al., 2008). They propose pre-vention as an alternative to obesity treatment over a very long term, by first stoppingthe increasing obesity rates. Gradually, over a few generations, reduce levels to thoseof previous decades. The America On the Move initiative was started to translate theirtheory into practice. America On the Move promotes small changes to the environmentto help support and sustain the small behavior changes.
Cohen et al. recommend that future interventions to control weight address thesocial environment at the community level (Cohen et al., 2006). Their study supportsthe need to re-conceptualize the obesity epidemic to include group-level phenomena inaddition to individual choice and free will.
As part of his monograph, Gutterman (2008a) surveyed articles on obesity manage-ment and prevention, with somewhat pessimistic results. He found that attempts todecrease obesity which rely on changing individual behavior have been “pretty much in-effective.” In addition, he said there seems to be no single best approach, and proposesa combination of two big approaches, diet and exercise, with others such as educationand treatments such as bariatric surgery and drugs.
10. Summary
10.1. Prevalence of Obesity
Obesity has become a world wide epidemic. Almost 10 years ago, the U.S. Surgeon Gen-eral declared that the United States was experiencing substantial increases in overweightand obesity. While there is recent evidence the rate of increase in obesity is slowing, thecurrent prevalence of BMI ≥ 30 is now approximately 30 percent of the population ofthe U.S. (CDC, 2008). The prevalence in Canada was 23.1 percent (Tjepkema, 2006).Similar increases in obesity have occurred in many countries in Europe and Asia.
10.2. Impact of Obesity on Disease and Mortality
Perhaps the most convincing results concern the effect of overweight and obesity oncardiovascular disease and diabetes. Relative to normal weight, the relative risk ofdeath from CVD increases significantly for overweight men and women (Balkau et al.,2007; Calle et al., 1999; Oster et al., 2000). About 60 percent of diabetes is directlyrelated to weight gain (Runge, 2007). As of 2008, studies showed about 246 millionadults world wide have diabetes, and the figure is increasing (Lancet, 2008).
Several papers provide empirical evidence that obesity is significantly related to in-creased risk for certain cancers (Renehan et al., 2008b). The relationship is complex

Obesity and its Relation to Mortality and Morbidity Costs 59
and depends on the site of the cancer. The American Institute for Cancer Research isfunding examination of how fatty acids affect insulin-like growth factors, which may belinked to heart disease, diabetes and various cancers (AICR, 2006).
Overweight and obesity are significantly related to a variety of negative effects onthe body, such as delayed healing of joint injuries, increased risk of arthritis, impairedfunction of internal organs, and interference with hormone balances. For example, onestudy showed that more than 50 percent of osteoarthritis of the knee is due to obesity(Coggon et al., 2001). The negative effects play a role in a cycle of overweight, depressionand decreasing physical activity, which results in increased use of the health care system(Rosemann et al., 2008). Increasing BMI also is related to development of asthma (Luderet al., 2004) and renal disease (Hsu et al., 2006).
Many empirical studies found that obesity significantly increases the risk of death,that is, all-cause mortality (Whitlock et al., 2009; Calle et al., 1999; Gu et al., 2006;Flegal et al., 2005). The relationship between BMI and all-cause mortality is oftenfound to be U-shaped or J-shaped, since underweight also is associated with increasedmortality. The few studies of insured groups generally agree with population results(Niverthi and Ivanovic, 2001; Roudebush et al., 2006; Baldinger et al., 2006; Cummingand Pinkham, 2008). One article has relatively optimistic conclusions based on a verydetailed stochastic model with parameters based on the Framingham data (Chatterjeeet al., 2008).
10.3. Economic Cost Conclusions
The total economic cost of overweight and obesity we have estimated for the UnitedStates and Canada is the sum of excess medical costs and the cost of the loss of pro-ductivity caused by excess disability and mortality due to overweight and obesity. Asshown in Table 24, the total cost of excess medical care caused by overweight and obe-sity was estimated at $127 billion for 2009. The economic loss of productivity caused byexcess mortality is estimated at $49 billion per year in the United States and Canada,as explained in Section 7.5. The economic loss of productivity caused by disability isestimated at $43 billion per year for active workers, as discussed in Section 8.2. In thesame section, we discuss the costs for workers unable to work at all because of disability.We estimated the economic loss of productivity caused by overweight or obesity for to-tally disabled workers at $72 billion. In summary, the total economic cost of overweightand obesity in the United States and Canada caused by medical costs, excess mortalityand disability is approximately $300 billion per year. The portion of this total due tooverweight is approximately $80 billion, and approximately $220 billion is due to obesity.The portion of the total in the United States is approximately 90 percent of the totalfor the United States and Canada.

60 Obesity and its Relation to Mortality and Morbidity Costs
A. Relative Risk, Hazard Ratio and Odds Ratio
Analyses of the effects of BMI on health status use three different measures of the effect ofBMI; relative risk, hazard ratio and odds ratio. Relative risk is the ratio of the frequencyof a given condition for a given group to the frequency for the base or referent group. Forexample, if people with normal weight have a frequency of 3 percent for diabetes, andobese people have a frequency of 12 percent, then the relative risk for obese individualswould be 12 percent/3 percent = 4. Hazard ratio is the limit of relative risk as thetime period approaches zero. For chronic conditions, relative risk and hazard ratio arethe same. For acute conditions, the relationship between relative risk and hazard ratiodepends on the duration of the medical events. For example, suppose the probability ofa given short-term medical event for individuals with normal BMI is 1/365 per day, andthat the hazard ratio for overweight and obesity is 2. Suppose that when the conditionoccurs, it lasts for one month. Suppose, further, that the Poisson distribution applies tothe incidence of the event when the individual is healthy. Then the expected number ofcases per year for normal weight individuals would be close to 1 (actually 0.92), but theexpected number for overweight and obese individuals would be less than two times theprobability of 1 for the nonoverweight individuals (actually 1.73 = 1.9× 0.92) , becausethere would only be an 11-month healthy period for the second occurrence, and lesstime for higher numbers of occurrences. For the conditions considered in this study, thedifference between the results of relative risk and hazard ratio is either zero or smallenough that using hazard ratio as relative risk is an acceptable approximation.
On the other hand, numerous articles use the odds ratio to measure the effects ofBMI. Odds ratio is the ratio of the odds of having a given health problem for people ina given group to those in the referent group. For example, if one-fourth of people withnormal weight have hypertension, the odds are 1-to-3, i.e., one person with hypertensioncompared to three people without hypertension. If half of the obese individuals havehypertension, then their odds are 1-to-1. The odds ratio in this case would be 1 : 1/1 :3 = 3, in other words, one divided by one-third. There is a direct relationship betweenrelative risk and odds ratio, but the relationship uses the value of the base rate, whichis the rate of the normal population having the given condition. The formulas providingthese relationships are as follows:
Relative Risk =Odds Ratio
1− Base Rate + Odds Ratio× Base Rate
=Odds Ratio
1 + Base Rate× (Odds Ratio− 1))
=Odds Ratio
1− Base Rate× (1−Odds Ratio))
and

Obesity and its Relation to Mortality and Morbidity Costs 61
Odds Ratio = Relative Risk× 1− Base Rate
1− Relative Risk× Base Rate
The base rate can be determined from the total percentage rate with a given conditioncombined with the percentage of obese individuals in the population and either therelative risk or odds ratio. The formula for determining base rate in relation to relativerisk is as follows:
Base Rate =Population Rate
1−Obese Percentage + Obese Percentage× Relative Risk
=Population Rate
1 + Obese Percentage× (Relative Risk− 1)
=Population Rate
1−Obese Percentage× (1− Relative Risk)
The formula based on odds ratio is more complex, because it involves the solutionof a quadratic equation. To determine the base rate on the basis of odds ratio, firstdetermine the following three values:
A = (1−Obese Percentage)× (Odds Ratio− 1)
B = 1 + (Odds Ratio− 1)× (Obese Percentage− Population Rate)
C = −Population Rate
Then
Base Rate =−B +
√B2 − 4AC
2A
Because of the more simple formulas derived from the use of relative risk, we haveused relative risk for the determinations in this paper, and have converted odds ratiosto relative risk. This has no effect on the numerical results for frequency and cost ofmedical conditions.
B. Cost Calculation Procedures for Medical Care
We have estimated the cost to society of the effects of obesity on health problems andmortality by combining three components. These are the additional costs of medicalcare, the loss of productivity caused by disability and the loss of productivity caused byincreased mortality. This appendix summarizes the methods we used to calculate theseestimates.
The cost of excess medical care is based on the application of the average cost percase times the number of excess cases. This is based on an assumption that the averagecost for cases caused by overweight or obesity is similar to the average cost of other cases.This seems reasonable on the basis of the fact that overweight and obesity cause some

62 Obesity and its Relation to Mortality and Morbidity Costs
existing cases to become more serious, but also cause a particular medical condition inindividuals who would not otherwise have the condition and consequently may be lessserious than average. When obesity increases the rate of occurrence of a condition, this isan overall evaluation, and it may not be possible to identify particular cases specificallycaused by obesity. Therefore, it may not be possible to identify specific costs. In ourliterature review, we did not find any studies that provided this information.
For each article that identified the rates of increase in a medical condition for BMIgroups, we combined the results to obtain a population total. For example, the paper ofFu et al. (2008) found relative risks for cardiovascular conditions of 1.52, 1.71, and 2.04for the BMI groups 24–27, 27–30, and 30+, respectively. The population percentages forthese groups are 22.25 percent, 19.08 percent, and 30.78 percent respectively, resultingin a population relative risk of 1.57. The population relative risks from the variousarticles were combined by determining a weighted average based on the square-rootof the size of the sample count for each article. In this case the overall relative riskwas approximately 1.30. This means that 23.06 percent (i.e., (1.30 - 1)/1.30) of thepopulation cases result from overweight or obesity. We estimate the total populationmedical cost of cardiovascular conditions at $116.2 billion in 2009, which means the costrelated to obesity is 23.06 percent of $116.2 billion, or $26.8 billion. In retaining three-or four-digit numbers in these calculations, we do not intend to indicate that the resultsare accurate to within a tenth of 1 percent. In fact, the results may be uncertain by10 percent or more, but we have chosen not to round results until the end, so that theeffects of rounding can be easily seen on an overall basis.

Obesity and its Relation to Mortality and Morbidity Costs 63
References
Abdulla, Jawdat, Lars Kober, Steen Z. Abildstrom, Erik Christensen, W. Philip T.James, and Christian Torp-Pedersen. 2008. Impact of obesity as a mortality predictorin high-risk patients with myocardial infarction or chronic heart failure: a pooledanalysis of five registries. European Heart Journal 29:594–601.
Abell, J. E., B. M. Egan, P. W. Wilson, S. Lipsitz, R. F. Woolson, and D. T. Lack-land. 2008. Differences in cardiovascular disease mortality associated with body massbetween black and white persons. American Journal of Public Health 98(1):63–6.
Adams, K. F., A. Schatzkin, T. B. Harris, V. Kipnis, T. Mouw, R. Ballard-Barbash,A. Hollenbeck, and M. F. Leitzmann. 2006. Overweight, obesity, and mortality ina large prospective cohort of persons 50 to 71 years old. New England Journal ofMedicine 355(8):763–78.
AICR. 2006. The obesity-cancer link, vol. 2006. American Institute for Cancer Research.
Ajani, U. A., P. A. Lotufo, J. M. Gaziano, I. M. Lee, A. Spelsberg, J. E. Buring, W. C.Willett, and J. E. Manson. 2004. Body mass index and mortality among US malephysicians. Annals of Epidemiology 14(10):731–9.
Al Snih, Soham, Kenneth J. Ottenbacher, Kyriakos S. Markides, Yong-Fang Kuo, KarlEschbach, and James S. Goodwin. 2007. The effect of obesity on disability vs mortalityin older americans. Archives of Internal Medicine 167(8):774–780.
Alaska. 2003. The burden of overweight & obesity in Alaska. Tech. Rep., Alaska Depart-ment of Health & Social Services Division of Public Health Section of EpidemiologyHealth Promotion Unit.
Alley, Dawn E., and Virginia W. Chang. 2007. The changing relationship of obesity anddisability, 1988-2004. Journal of the American Medical Association 298(17):2020–2027.
Allison, D. B., R. Zannolli, and K. M. Narayan. 1999a. The direct health care costs ofobesity in the United States. American Journal of Public Health 89(8):1194–9.
Allison, David B., Kevin R. Fontaine, JoAnn E. Manson, June Stevens, and Theodore B.VanItallie. 1999b. Annual deaths attributable to obesity in the United States. Journalof the American Medical Association 282(16):1530–1538.
Allman-Farinelli, M. A., R. J. Aitken, L. A. King, and A. E. Bauman. 2008. Osteoarthri-tis – the forgotten obesity-related epidemic with worse to come. Medical Journal ofAustralia 188(5):317.
Anderson, J. W., S. B. Conley, and A. S. Nicholas. 2007. One hundred pound weightlosses with an intensive behavioral program: changes in risk factors in 118 patientswith long-term follow-up. American Journal of Clinical Nutrition 86(2):301–7.

64 Obesity and its Relation to Mortality and Morbidity Costs
Anderson, Louise H., Brian C. Martinson, A. Lauren Crain, Nicolaas P. Pronk, Robin R.Whitebird, Patrick J. O’Connor, and Lawrence J. Fine. 2005. Health care charges as-sociated with physical inactivity, overweight, and obesity. Preventing Chronic Disease2(4):A09.
Anstadt, George. 2004. Modifiable behavioral factors as causes of death “Letter 1”.Journal of the American Medical Association 291(24):2941–2942.
Arndt, V., D. Rothenbacher, B. Zschenderlein, S. Schuberth, and H. Brenner. 2007. Bodymass index and premature mortality in physically heavily working men–a ten-yearfollow-up of 20,000 construction workers. Journal of Occupational & EnvironmentalMedicine 49(8):913–21.
Arterburn, D. E., M. L. Maciejewski, and J. Tsevat. 2005. Impact of morbid obesity onmedical expenditures in adults. International Journal of Obesity 29(3):334–339.
Artham, S. M., and H. O. Ventura. 2007. The “obesity paradox” and heart failure: thestory continues. Revista Espanola de Cardiologıa 60(11):1113–7.
Baldinger, B., C. Schwarz, and C. Jaggy. 2006. Cardiovascular risk factors, bmi andmortality in a cohort of Swiss males (1976-2001) with high-sum-assured life insurancecover. Journal of Insurance Medicine 38(1):44–53.
Balkau, B., J. E. Deanfield, J. P. Despres, J. P. Bassand, K. A. Fox, Jr. Smith, S. C.,P. Barter, C. E. Tan, L. Van Gaal, H. U. Wittchen, C. Massien, and S. M. Haffner.2007. International day for the evaluation of abdominal obesity (IDEA): a study ofwaist circumference, cardiovascular disease, and diabetes mellitus in 168,000 primarycare patients in 63 countries. Circulation 116(17):1942–51.
Barnoya, Joaquin, and Stanton A. Glantz. 2004. Modifiable behavioral factors as causesof death “Letter 2”. Journal of the American Medical Association 291(24):2941–2942.
Bassuk, Shari S., and JoAnn E. Manson. 2008. Lifestyle and risk of cardiovascular diseaseand type 2 diabetes in women: A review of the epidemiologic evidence. AmericanJournal of Lifestyle Medicine 2(3):191–213.
Bauman, A., M. Allman-Farinelli, R. Huxley, and W. P. T. James. 2008. Leisure-timephysical activity alone may not be a sufficient public health approach to preventobesity - a focus on China. Obesity Reviews 9(s1):119–126.
Bhattacharya, Jay, and M. Kate Bundorf. 2009. The incidence of the health care costsof obesity. Journal of Health Economics 28(3):649–658.
Bibbins-Domingo, K., P. Coxson, M. J. Pletcher, J. Lightwood, and L. Goldman. 2007.Adolescent overweight and future adult coronary heart disease. New England Journalof Medicine 357(23):2371–9.

Obesity and its Relation to Mortality and Morbidity Costs 65
Birmingham, C. Laird, Jennifer L. Muller, Anita Palepu, John J. Spinelli, and Aslam H.Anis. 1999. The cost of obesity in Canada. Canadian Medical Association Journal160(4):483–8.
Blair, Steven N., Michael J. LaMonte, and Milton Z. Nichaman. 2004. Modifiable behav-ioral factors as causes of death. Journal of the American Medical Association 291(24):2942.
Bleich, Sara, David Cutler, Christopher Murray, and Alyce Adams. 2008. Why is thedeveloped world obese? Annual Review of Public Health 29:273–295.
Bloomgarden, Zachary T. 2008. Diabetes and obesity. Diabetes Care 31(1):176–182.
Bogers, Rik P., Wanda J. E. Bemelmans, Rudolf T. Hoogenveen, Hendriek C. Boshuizen,Mark Woodward, Paul Knekt, Rob M. van Dam, Frank B. Hu, Tommy L. S. Viss-cher, Alessandro Menotti, Roland J. Thorpe Jr., Konrad Jamrozik, Susanna Calling,Bjørn Heine Strand, and Martin J. Shipley. 2007. Association of overweight withincreased risk of coronary heart disease partly independent of blood pressure andcholesterol levels. Archives of Internal Medicine 167(16):1720–1728.
Borg, Sixten, Ulf Persson, Knut Odegaard, Goran Berglund, Jan-Ake Nilsson, and Pe-ter M. Nilsson. 2005. Obesity, survival, and hospital costs – findings from a screeningproject in Sweden. Value Health 8(5):562–571.
Brownell, Kelly D., and Thomas R. Frieden. 2009. Ounces of prevention – the publicpolicy case for taxes on sugared beverages. New England Journal of Medicine 360(18).
Buescher, P. A., J. T. Whitmire, and M. Plescia. 2008. Relationship between bodymass index and medical care expenditures for North Carolina adolescents enrolled inMedicaid in 2004. Preventing Chronic Disease 5(1):A04.
Buettner, H. J., C. Mueller, M. Gick, M. Ferenc, J. Allgeier, T. Comberg, K. D. Werner,C. Schindler, and F. J. Neumann. 2007. The impact of obesity on mortality in UA/non-ST-segment elevation myocardial infarction. European Heart Journal 28(14):1694–1701.
Bungum, Timothy, Monica Satterwhite, Allen W. Jackson, and James R. Morrow Jr.2003. The relationship of body mass index, medical costs, and job absenteeism. Amer-ican Journal Health Behavior 27(4):456–462.
Burkhauser, Richard V., and John Cawley. 2008. Beyond BMI: The value of moreaccurate measures of fatness and obesity in social science research. Journal of HealthEconomics 27:519–529.
California. 2005. The economics of obesity and physical inactivity. Tech. Rep., Centerfor Weight and Health, University of California, Berkeley.

66 Obesity and its Relation to Mortality and Morbidity Costs
Calle, Eugenia E., Michael J. Thun, Jennifer M. Petrelli, Carmen Rodriguez, andClark W. Heath. 1999. Body-mass index and mortality in a prospective cohort ofU.S. adults. New England Journal of Medicine 341(15):1097–1105.
Capewell, S., and J. A. Critchley. 2008. Adolescent overweight and coronary heartdisease. New England Journal of Medicine 358(14):1521; author reply 1522.
Cawley, J., J. A. Rizzo, and K. Haas. 2007. Occupation-specific absenteeism costs asso-ciated with obesity and morbid obesity. Journal of Occupational and EnvironmentalMedicine 49(12):1317–1324.
CDC. 2008. Overweight and obesity: Economic consequences. Center for Disease Con-trol and Prevention at http://www.cdc.gov/nccdphp/dnpa/obesity/economic_
consequences.htm.
Chatterjee, T., A. S. Macdonald, and H. R. Waters. 2008. A model for ischaemic heartdisease and stroke II: Modeling obesity. Annals of Actuarial Science 3(1-2).
Chen, Yue, Robert Dales, Mei Tang, and Daniel Krewski. 2002. Obesity may increasethe incidence of asthma in women but not in men: Longitudinal observations fromthe Canadian National Population Health Surveys. American Journal of Epidemiology155(3):191–197.
Chia, V. M., P. A. Newcomb, A. Trentham-Dietz, and J. M. Hampton. 2007. Obesity,diabetes, and other factors in relation to survival after endometrial cancer diagnosis.International Journal of Gynecological Cancer 17(2):441–446.
Coggon, C., I. Reading, P. Croft, M. McLaren, D. Barrett, and C. Cooper. 2001. Kneeosteoarthritis and obesity. International Journal of Obesity 25:622–627.
Cohen, D. A., B. K. Finch, A. Bower, and N. Sastry. 2006. Collective efficacy andobesity: the potential influence of social factors on health. Social Science & Medicine62(3):769–778.
Colditz, G. A. 1999. Economic costs of obesity and inactivity. Medicine & Science inSports & Exercise 31(11 Suppl):S663–S667.
Colditz, Graham A., Walter C. Willett, Andrea Rotnitzky, and JoAnn E. Manson. 1995.Weight gain as a risk factor for clinical diabetes mellitus in women. Annals of InternalMedicine 22(7):481–486.
Cooper, Cyrus, Hazel Inskip, Peter Croft, Lesley Campbell, Gillian Smith, MagnusMcLearn, and David Coggon. 1998. Individual risk factors for hip osteoarthritis:Obesity, hip injury and physical activity. American Journal of Epidemiology 147(6):516–522.
Corrada, M. M., C. H. Kawas, F. Mozaffar, and A. Paganini-Hill. 2006. Association ofbody mass index and weight change with all-cause mortality in the elderly. AmericanJournal of Epidemiology 163(10):938–949.

Obesity and its Relation to Mortality and Morbidity Costs 67
Cumming, Marianne E., and C. Allen Pinkham. 2008. Comparison of body mass indexand waist circumference as predictors of all-cause mortality in a male insured livespopulation. Journal of Insurance Medicine 40:26–33.
Daviglus, M. L., K. Liu, L. L. Yan, A. Pirzada, L. Manheim, W. Manning, D. B. Garside,R. Wang, A. R. Dyer, P. Greenland, and J. Stamler. 2004. Relation of body mass indexin young adulthood and middle age to Medicare expenditures in older age. Journalof the American Medical Association 292(22):2743–2749.
Davis, Maradee A., Walter H. Ettinger, John M. Neuhaus, Sangsook A. Cho, and Wal-ter W. Hauck. 1989. The association of knee injury and obesity with inilateral andbilateral osteoarthritis of the knee. American Journal of Epidemiology 130(2):278–288.
Detournay, B., F. Fagnani, M. Phillippo, C. Pribil, M. A. Charles, C. Sermet, A. Bas-devant, and E. Eschwege. 2000. Obesity morbidity and health care costs in France:an analysis of the 1991-1992 medical care household survey. International Journal ofObesity 24(2):151–155.
Dolan, C. M., H. Kraemer, W. Browner, K. Ensrud, and J. L. Kelsey. 2007. Associationsbetween body composition, anthropometry, and mortality in women aged 65 years andolder. American Journal of Public Health 97(5):913–918.
Efstathiou, J. A., K. Bae, W. U. Shipley, G. E. Hanks, M. V. Pilepich, H. M. Sandler,and M. R. Smith. 2007. Obesity and mortality in men with locally advanced prostatecancer: analysis of RTOG 85-31. Cancer 110(12):2691–2699.
Eisenstein, E. L., L. K. Shaw, C. L. Nelson, K. J. Anstrom, Z. Hakim, and D. B. Mark.2002. Obesity and long-term clinical and economic outcomes in coronary artery diseasepatients. Obesity Research 10(2):83–91.
Eknoyan, Garabed. 2008. Adolphe Quetelet (1796–1874) – the average man and indicesof obesity. Nephrology Dialysis Transplantation 23:47–51.
Eng, Ernest. 2004. Too big to ignore: the impact of obesity on mortality trends. Tech.Rep., Swiss Re.
Eng, Ernest, Ronald L. Klein, and Lawrence Segel. 2005. Obesity: The next smoking?Reinsurance Section News (55):12–19.
Falkner, B., S. S. Gidding, G. Ramirez-Garnica, S. A. Wiltrout, D. West, and E. B.Rappaport. 2006. The relationship of body mass index and blood pressure in primarycare pediatric patients. Journal of Pediatrics 148(2):195–200.
Farin, Helke M. F., Fahim Abbasi, and Gerald M. Reaven. 2006. Body mass index andwaist circumference both contribute to differences in insulin-mediated glucose disposalin nondiabetic adults. American Journal of Clinical Nutrition 83(1):47–51.
Farooqui, O. M., and A. S. Jawad. 2007. Osteoarthritis of knees and obesity. SaudiMedical Journal 28(9):1463.

68 Obesity and its Relation to Mortality and Morbidity Costs
Ferraro, Kenneth F., Ya-ping Su, Randall J. Gretebeck, David R. Black, and Stephen F.Badylak. 2002. Body mass index and disability in adulthood: A 20-year panel study.American Journal of Public Health 92(5):834–840.
Field, Alison E., Eugenie H. Coakley, Aviva Must, Jennifer L. Spadano, Nan Laird,William H. Dietz, Eric Rimm, and Graham A. Colditz. 2001. Impact of overweighton the risk of developing common chronic diseases during a 10-year period. Archivesof Internal Medicine 161(13):1581–1586.
Finkelstein, Eric A., Ian C. Fiebelkorn, and Guijing Wang. 2003. National medical spend-ing attributable to overweight and obesity: How much, and who’s paying? HealthAffairs published May 14, 2003 as a Web Exclusive.
Finkelstein, Eric A., C. J. Ruhm, and K. M. Kosa. 2005. Economic causes and conse-quences of obesity. Annual Review of Public Health 26:239–257.
Fitzner, Karen, O’Shea Gamble, and Elizabeth Heckinger. 2006. Making the case for anobesity care management program. Health Watch (52).
Flegal, Katherine M., Barry I. Graubard, David F. Williamson, and Mitchell H. Gail.2005. Excess deaths associated with underweight, overweight, and obesity. Journal ofthe American Medical Association 293(15):1861–1867.
———. 2007a. Impact of smoking and preexisting illness on estimates of the fractionsof deaths associated with underweight, overweight, and obesity in the US population.American Journal of Epidemiology 166(8):975–82.
———. 2007b. Weight-associated deaths in the United States. Journal of Women’sHealth 16:1368–1370.
Flynn, M. A. T., D. A. McNeil, B. Maloff, D. Mutasingwa, M. Wu, C. Ford, and S. C.Tough. 2006. Reducing obesity and related chronic disease risk in children and youth:a synthesis of evidence with ‘best practice’ recommendations. Obesity Reviews 7(suppl. 1).
Fonarow, G. C., P. Srikanthan, M. R. Costanzo, G. B. Cintron, and M. Lopatin. 2007.An obesity paradox in acute heart failure: analysis of body mass index and in-hospitalmortality for 108,927 patients in the acute decompensated heart failure national reg-istry. American Heart Journal 153(1):74–81.
Ford, E. S., D. F. Williamson, and S. Liu. 1997. Weight change and diabetes incidence:findings from a national cohort of US adults. American Journal of Epidemiology146(3):214–222.
Freedland, S. J., J. Wen, M. Wuerstle, A. Shah, D. Lai, B. Moalej, C. Atala, and W. J.Aronson. 2008. Obesity is a significant risk factor for prostate cancer at the time ofbiopsy. Urology 72:1102–1105.

Obesity and its Relation to Mortality and Morbidity Costs 69
Fu, T., T. Wen, P. Yeh, and H. Chang. 2008. Costs of metabolic syndrome-relateddiseases induced by obesity in Taiwan. Obesity Reviews 9:68–73.
Galal, W., R. T. van Domburg, H. H. Feringa, O. Schouten, A. Elhendy, J. J. Bax, A. M.Awara, J. Klein, and D. Poldermans. 2007. Relation of body mass index to outcomein patients with known or suspected coronary artery disease. American Journal ofCardiology 99(11):1485–1490.
Gandjour, Afschin. 2004. Modifiable behavioral factors as causes of death. Journal ofthe American Medical Association 291(24):2941.
Georgia. 2007. 2007 Georgia program and data summary: Obesity. Tech. Rep., GeorgiaDepartment of Human Resources.
Gomez-Ambrosi, J., C. Azcona, A. Patino-Garcia, and G. Fruhbeck. 2008. Serum amy-loid A concentration is increased in obese children and adolescents. Journal of Pedi-atrics 153(1):71–75.
Greenberg, J. A., K. Fontaine, and D. B. Allison. 2007. Putative biases in estimat-ing mortality attributable to obesity in the US population. International Journal ofObesity 31(9):1449–1455.
Gregg, E. W., Y. J. Cheng, B. L. Cadwell, G. Imperatore, D. E. Williams, K. M. Flegal,K. M. Narayan, and D. F. Williamson. 2005. Secular trends in cardiovascular diseaserisk factors according to body mass index in US adults. Journal of the AmericanMedical Association 293(15):1868–1874.
Gregg, E. W., and J. M. Guralnik. 2007. Is disability obesity’s price of longevity?Journal of the American Medical Association 298(17):2066–2067.
Gu, D., J. He, X. Duan, K. Reynolds, X. Wu, J. Chen, G. Huang, C. S. Chen, and P. K.Whelton. 2006. Body weight and mortality among men and women in China. Journalof the American Medical Association 295(7):776–783.
Gutterman, Sam. 2008a. Human behavior: An impediment to future mortality improve-ment a focus on obesity and related matter. Society of Actuaries website.
———. 2008b. Obesity: What it means for actuaries. The Actuary 5(5).
Haas, J. S., L. B. Lee, C. P. Kaplan, D. Sonneborn, K. A. Phillips, and S. Y. Liang.2003. The association of race, socioeconomic status, and health insurance status withthe prevalence of overweight among children and adolescents. American Journal ofPublic Health 93(12):2105–2110.
Hamman, R. F., R. R. Wing, S. L. Edelstein, J. M. Lachin, G. A. Bray, L. Delahanty,M. Hoskin, A. M. Kriska, E. J. Mayer-Davis, X. Pi-Sunyer, J. Regensteiner, B. Ven-ditti, and J. Wylie-Rosett. 2006. Effect of weight loss with lifestyle intervention onrisk of diabetes. Diabetes Care 29(9):2102–2107.

70 Obesity and its Relation to Mortality and Morbidity Costs
Hart, C. L., D. J. Hole, D. A. Lawlor, and G. Davey Smith. 2007. How many cases oftype 2 diabetes mellitus are due to being overweight in middle age? Evidence fromthe midspan prospective cohort studies using mention of diabetes mellitus on hospitaldischarge or death records. Diabetic Medicine 24:73–80.
Hart, D. J., and T. D. Spector. 1993. The relationship of obesity, fat distribution andosteoarthritis in women in the general population: the Chingford study. Journal ofRheumatology 20(2):331–335.
Hartwig, Robert P., and Claire Wilkinson. 2004. Obesity, liability & insurance. Tech.Rep., Insurance Information Institute.
Hill, J. O., J. C. Peters, V. A. Catenacci, and H. R. Wyatt. 2008. International strategiesto address obesity. Obesity Reviews 9(s1):41–47.
Hitchcock, C. 2002. Probabilistic causation. Stanford University Press.
Hopkins, Julie, and Caroline Bright. 2005. Epidemic proportions? Tech. Rep., HannoverLife Re.
Hsu, Chi-yuan, Charles E. McCulloch, Carlos Iribarren, Jeanne Darbinian, and Alan S.Go. 2006. Body mass index and risk for end-stage renal disease. Annals of InternalMedicine 144(1).
James, W. P. T. 2008. The fundamental drivers of the obesity epidemic. Obesity Reviews9(s1):6–13.
Janssen, I. 2007. Morbidity and mortality risk associated with an overweight BMI inolder men and women. Obesity 15(7):1827–1840.
Jeffreys, M., P. McCarron, D. Gunnell, J. McEwen, and G. D. Smith. 2003. Body massindex in early and mid-adulthood, and subsequent mortality: a historical cohort study.International Journal of Obesity 27(11):1391–1397.
Kabat, G. C., A. B. Miller, and T. E. Rohan. 2007. Body mass index and lung cancerrisk in women. Epidemiology 18(5):607–612.
Kaestner, Robert, and Michael Grossman. 2008. Effects of weight on children’s educa-tional achievement. Tech. Rep., NBER Working Paper No. 13764.
Katzmarzyk, P. T., and I. Janssen. 2004. The economic costs associated with physicalinactivity and obesity in Canada: an update. Canadian Journal of Applied Physiology29(1):90–115.
Krueger, Patrick M., Richard G. Rogers, Robert A. Hummer, and Jason D. Boardman.2004. Body mass, smoking, and overall and cause-specific mortality among older U.S.adults. Research on Aging 26(1):82–107.

Obesity and its Relation to Mortality and Morbidity Costs 71
Kulminski, A. M., K. G. Arbeev, I. V. Kulminskaya, S. V. Ukraintseva, K. Land, I. Aku-shevich, and A. I. Yashin. 2008. Body mass index and nine-year mortality in disabledand nondisabled older U.S. individuals. Journal of the American Geriatrics Society56(1):105–110.
Lancet, The. 2008. The global challenge of diabetes. Editorial. The Lancet 371:1723.
Larsson, S. C., and A. Wolk. 2007. Obesity and the risk of gallbladder cancer: a meta-analysis. British Journal of Cancer 96(9):1457–1461.
Larsson, Susanna C., and Alicja Wolk. 2008. Excess body fatness: an important causeof most cancers. The Lancet 371:536–537.
Lee, Crystal Man Ying, Alexandra Lynda Conboy Martiniuk, Mark Woodward, ValeryFeigin, Dong Feng Gu, Konrad Jamrozik, Tai Hing Lam, Cliona Ni Mhurchu, Wen-Harn Pan, Il Suh, Hirotsugu Ueshema, Jean Woo, and Rachel Huxley. 2007. Theburden of overweight and obesity in the Asia-Pacific region. Obesity Reviews 8(3):191–196.
Louisiana. 2004. The Council for Obesity Prevention and Management report to theLouisiana governor and legislature 2004. Tech. Rep., Louisiana Council for ObesityPrevention and Management.
Luder, E., R. I. Ehrlich, W. Y. W. Lou, T. A. Melnik, and M. Kattan. 2004. Body massindex and the risk of asthma in adults. Respiratory Medicine 98(1):29–37.
Malnick, S.D.H., and H. Knobler. 2006. The medical complications of obesity. QuarterlyJournal of Medicine 99:565–579.
Manninen, P., H. Riihimaki, M. Heliovaara, and P. Makela. 1996. Overweight, genderand knee osteoarthritis. International Journal of Obesity 20(6):595–597.
Manson, JoAnn E., Shari S. Bassuk, Frank B. Hu, Meir J. Stampfer, Graham A. Colditz,and Walter C. Willett. 2007. Estimating the number of deaths due to obesity: Canthe divergent findings be reconciled? Journal Women’s Health 16(2):168–170.
Mansson, N. O., K. F. Eriksson, B. Israelsson, J. Ranstam, A. Melander, and L. Ras-tam. 1996. Body mass index and disability pension in middle-aged men: non-linearrelations. International Journal of Epidemiology 25(1):80–85.
Marmot, Michael. 2007. Food, nutrition, physical activity, and the prevention of cancer:a global perspective. Tech. Rep., World Cancer Research Fund/American Institutefor Cancer Research.
McCusker, Margaret E., Eduardo J. Sanchez, Steven H. Murdock, Nazrul Hoque, andPhilip P. Huang. 2004. The burden of overweight and obesity in Texas, 2000-2040.Tech. Rep., Texas Department of Health.

72 Obesity and its Relation to Mortality and Morbidity Costs
McGinnis, J. Michael, and William H. Foege. 2004. The immediate vs the important.Journal of the American Medical Association 291(10):1263–1264.
Mehrotra, C., M. Serdula, T. S. Naimi, L. K. Khan, J. Miller, and W. Dietz. 2005.Population-based study of trends, costs, and complications of weight loss surgeriesfrom 1990 to 2002. Obesity Research 13(11):2029–2034.
Millimeta, Daniel L., Michael Nieswiadomy, Hang Ryu, and Daniel Slottje. 2003. Esti-mating worklife expectancy: an econometric approach. Journal of Econometrics 113:83–113.
Mitchell, R. S., R. S. Padwal, A. W. Chuck, and S. W. Klarenbach. 2008. Cancerscreening among the overweight and obese in Canada. American Journal of PreventiveMedicine 35(2):127–132.
Mokdad, Ali H., James S. Marks, and Donna F. Stroup. 2005. Correction: Actual causesof death in the United States, 2000. Journal of the American Medical Association293(3):293–294.
Mokdad, Ali H., James S. Marks, Donna F. Stroup, and Julie L. Gerberding. 2004.Actual causes of death in the United States, 2000. Journal of the American MedicalAssociation 291(10):1238–1245.
Moore, Cleveland. 2005. Obesity and asthma. US Respriatory Care 1–5.
NCHS. 2009. Health, United States. Hyattsville, MD: National Center for Health Statis-tics at http://www.cdc.gov/nchs/hus.htm.
Niverthi, M., and B. Ivanovic. 2001. Body mass index and mortality in an insuredpopulation. Journal of Insurance Medicine 33(4):321–328.
Noskova, A. S., I. G. Krasivina, L. N. Dolgova, and A. A. Lavrukhina. 2007. [Abdomi-nal obesity–factor contributing to osteoarthrosis of the knee joints]. Terapevticheskiiarkhiv 79(5):29–31.
Ogden, Cynthia L., Margaret D. Carroll, Margaret A. McDowell, and Katherine M.Flegal. 2007a. Obesity among adults in the United States – no statistically significantchange since 2003-2004. Tech. Rep., National Center for Health Statistics.
Ogden, Cynthia L., Susan Z. Yanovski, Margaret D. Carroll, and Katherine M. Flegal.2007b. The epidemiology of obesity. Gastroenterology 132(6):2087–2102.
Olshansky, S. Jay, Douglas J. Passaro, Ronald C. Hershow, Jennifer Layden, Bruce A.Carnes, Jacob Brody, Leonard Hayflick, Robert N. Butler, David B. Allison, andDavid S. Ludwig. 2005. A potential decline in life expectancy in the United States inthe 21st century. New England Journal of Medicine 352(11):1138–1145.
Østbye, T., J. M. Dement, and K. M. Krause. 2007. Obesity and workers’ compensation:results from the Duke Health and Safety Surveillance System. Archives of InternalMedicine 167(8):766–773.
Obesity and its Relation to Mortality and Morbidity Costs 73
Oster, G., J. Edelsberg, A. K. O’Sullivan, and D. Thompson. 2000. The clinical andeconomic burden of obesity in a managed care setting. American Journal of ManagedCare 6(6):681–689.
Pednekar, M. S., M. Hakama, J. R. Hebert, and P. C. Gupta. 2008. Association of bodymass index with all-cause and cause-specific mortality: findings from a prospectivecohort study in Mumbai (Bombay), India. International Journal of Epidemiology.
Pi-Sunyer, F. Xavier. 1998. Clinical guidelines on the identification, evaluation, andtreatment of overweight and obesity in adults: Executive summary. American Journalof Clinical Nutrition 68:899–917.
———. 2000. The practical guide identification, evaluation, and treatment of overweightand obesity in adults. Tech. Rep., National Institutes of Health.
Pietrow, Paul K., and Michael E. Karellas. 2006. Medical management of commonurinary calculi. American Family Physician 74(1):86–94.
Powell, Ginny. 2007. Childhood obesity affects millions of children in the U.S. SenateResearch Office: At Issue 2(1):1–6.
Puhl, Rebecca M., and Chelsea A. Heuer. 2009. The stigma of obesity: A review andupdate. Obesity 17(5):941–964.
Raine, Kim D. 2005. Overweight and obesity in Canada: A population health perspec-tive. Tech. Rep., Centre for Health Promotion Studies, University of Alberta.
Renehan, A. G., D. L. Roberts, and C. Dive. 2008a. Obesity and cancer: Pathophysi-ological and biological mechanisms. Archives of Physiology and Biochemistry 114(1):71–83.
Renehan, Andrew G., Margaret Tyson, Matthias Egger, Richard F. Heller, and MarcelZwahlen. 2008b. Body-mass index and incidence of cancer: a systematic review andmeta-analysis of prospective observational studies. The Lancet 371:569–578.
Reuser, M., L. Bonneux, and F. Willekens. 2008. The burden of mortality of obesity atmiddle and old age is small. A life table analysis of the US Health and RetirementSurvey. European Journal of Epidemiology.
Rogers, R. G., R. A. Hummer, and P. M. Krueger. 2003. The effect of obesity on overall,circulatory disease- and diabetes-specific mortality. Journal of Biosocial Science 35(1):107–129.
Romero-Corral, A., V. K. Somers, J. Sierra-Johnson, R. J. Thomas, M. L. Collazo-Clavell, J. Korinek, T. G. Allison, J. A. Batsis, F. H. Sert-Kuniyoshi, and F. Lopez-Jimenez. 2008. Accuracy of body mass index in diagnosing obesity in the adult generalpopulation. International Journal of Obesity.

74 Obesity and its Relation to Mortality and Morbidity Costs
Rosamond, W., K. Flegal, K. Furie, A. Go, K. Greenlund, N. Haase, S. M. Hailpern,M. Ho, V. Howard, B. Kissela, S. Kittner, D. Lloyd-Jones, M. McDermott, J. Meigs,C. Moy, G. Nichol, C. O’Donnell, V. Roger, P. Sorlie, J. Steinberger, T. Thom, M. Wil-son, and Y. Hong. 2008. Heart disease and stroke statistics – 2008 update: a reportfrom the American Heart Association Statistics Committee and Stroke Statistics Sub-committee. Circulation 117(4):e25–146.
Rosemann, T., R. Grol, K. Herman, M. Wensing, and J. Szecsenyi. 2008. Associationbetween obesity, quality of life, physical activity and health service utilization in pri-mary care patients with osteoarthritis. International Journal of Behavioral Nutritionand Physical Activity 5:4.
Rosin, B. L. 2007. The progression of cardiovascular risk to cardiovascular disease.Reviews in Cardiovascular Medicine 8(4):S3–8.
Ross, Robert, Damon Dagnone, Peter J. H. Jones, Heidi Smith, Anne Paddags, RobertHudson, and Ian Janssen. 2000. Reduction in obesity and related comorbid condi-tions after diet-induced weight loss or exercise-induced weight loss in men. Annals ofInternal Medicine 133(2):92–103.
Roudebush, B., T. Ashley, and C. P. Titcomb Jr. 2006. Mortality and Morbidity LiaisonCommittee – ISCS body mass index study. Journal of Insurance Medicine 38(3):167–180.
Roux, L., and C. Donaldson. 2004. Economics and obesity: costing the problem orevaluating solutions? Obesity Research 12(2):173–179.
Ruhm, Christopher J. 2007. Current and future prevalence of obesity and severe obesityin the United States. Forum for Health Economics and Policy 10(2).
Runge, C. F. 2007. Economic consequences of the obese. Diabetes 56(11):2668–2672.
Ryan, M. C., H. M. Fenster Farin, F. Abbasi, and G. M. Reaven. 2008. Comparison ofwaist circumference versus body mass index in diagnosing metabolic syndrome andidentifying apparently healthy subjects at increased risk of cardiovascular disease.American Journal of Cardiology 102(1):40–46.
Satcher, David. 2001. The surgeon general’s call to action to prevent and decreaseoverweight and obesity. Tech. Rep., U.S. Department of Health and Human Services.
Schmid, A., H. Schneider, A. Golay, and U. Keller. 2005. Economic burden of obesity andits comorbidities in Switzerland. Sozial- und Praventivmedizin/Social and PreventiveMedicine 50(2):87–94.
Schmier, J. K., M. L. Jones, and M. T. Halpern. 2006. Cost of obesity in the workplace.Scandinavian Journal of Work, Environment and Health 32(1):5–11.

Obesity and its Relation to Mortality and Morbidity Costs 75
Schottenfeld, D., and J. L. Beebe-Dimmer. 2005. Advances in cancer epidemiology:understanding causal mechanisms and the evidence for implementing interventions.Annual Review of Public Health 26:37–60.
Seidell, J. C., and I. Deerenberg. 1994. Obesity in europe: prevalence and consequencesfor use of medical care. Pharmacoeconomics 5(Suppl 1):38–44.
Silva, M. Carolina Pardo, Chris De Laet, Wilma J. Nusselder, Abdulah A. Mamun,and Anna Peeters. 2006. Adult obesity and number of years lived with and withoutcardiovascular disease. Obesity 14(7):1264–1273.
Smith, R. L., T. W. Chong, T. L. Hedrick, M. G. Hughes, H. L. Evans, S. T. McElearney,T. L. Pruett, and R. G. Sawyer. 2007. Does body mass index affect infection-relatedoutcomes in the intensive care unit? Surgical Infection 8(6):581–588.
Song, Y. M., M. Ha, and J. Sung. 2007. Body mass index and mortality in middle-agedKorean women. Annals of Epidemiology 17(7):556–563.
Spence-Jones, G. 2003. Overview of obesity. Critical Care Nursing Quarterly 26(2):83–88.
Stamatakis, E., P. Primatesta, S. Chinn, R. Rona, and E. Falascheti. 2005. Overweightand obesity trends from 1974 to 2003 in English children: What is the role of socioe-conomic factors? Archives of Disease in Childhood 90(10):999–1004.
Stevens, J., J. Cai, E. R. Pamuk, D. F. Williamson, M. J. Thun, and J. L. Wood. 1998.The effect of age on the association between body-mass index and mortality. NewEngland Journal of Medicine 338(1):1–7.
Sturm, R. 2002. The effects of obesity, smoking, and drinking on medical problems andcosts. Health Affairs 21(2):245–253.
Takata, Y., T. Ansai, I. Soh, S. Akifusa, K. Sonoki, K. Fujisawa, S. Awano, S. Kagiyama,T. Hamasaki, I. Nakamichi, A. Yoshida, and T. Takehara. 2007. Association betweenbody mass index and mortality in an 80-year-old population. Journal of the AmericanGeriatrics Society 55(6):913–917.
Taylor, E. N., M. J. Stampfer, and G. C. Curhan. 2005. Obesity, weight gain, and therisk of kidney stones. Journal of the American Medical Association 293(4):455–462.
Taylor, Thomas N., Patricia H. Davis, James C. Torner, Julia Holmes, Jay W. Meyer,and Mark F. Jacobson. 1996. Lifetime cost of stroke in the United States. Stroke27(9):1459–1466.
Thompson, D., J. Edelsberg, K. L. Kinsey, and G. Oster. 1998. Estimated economic costsof obesity to US business. American Journal of Health Promotion 13(2):120–127.
Tjepkema, Michael. 2005. Adult obesity in Canada: Measured height and weight. Tech.Rep. Component of Statistics Canada Catalogue no. 82-620-MWE2005001, StatisticsCanada.

76 Obesity and its Relation to Mortality and Morbidity Costs
———. 2006. Adult obesity. Health Reports of Statistics Canada 17(3):9–25.
Torrance, G. M., M. D. Hooper, and B. R. Reeder. 2002. Trends in overweight andobesity among adults in Canada (1970–1992): Evidence from national surveys usingmeasured height and weight. International Journal of Obesity 26(6):797–804.
Tsai, S. P., R. P. Donnelly, and J. K. Wendt. 2006. Obesity and mortality in a prospectivestudy of a middle-aged industrial population. Journal of Occupational & Environmen-tal Medicine 48(1):22–27.
Tsai, W. L., C. Y. Yang, S. F. Lin, and F. M. Fang. 2004. Impact of obesity on medicalproblems and quality of life in Taiwan. American Journal of Epidemiology 160(6):557–565.
Unum. 2004. Unum Provident report shows tenfold increase in obesity-related disabilityclaims. Press release.
Urbanski, P., A. Wolf, and W. H. Herman. 2008. Cost-effectiveness of diabetes education.Journal of the American Dietetic Association 108(4 Suppl 1):S6–11.
Vargas, Perla A., Tamara T. Perry, Elias Robles, Chan-Hee Jo, Pippa M. Simpson,James M. Magee, Charles R. Feild, Reza Hakkak, Polly A. Carroll, and Stacie M.Jones. 2007. Relationship of body mass index with asthma indicators in Head Startchildren. Annals of Allergy, Asthma and Immunology 99(1):22–28.
Visscher, T. L., and J. C. Seidell. 2001. The public health impact of obesity. AnnualReview of Public Health 22:355–375.
Visscher, T. L., A. L. Viet, I. H. Kroesbergen, and J. C. Seidell. 2006. Underreportingof BMI in adults and its effect on obesity prevalence estimations in the period 1998to 2001. Obesity 14(11):2054–2063.
Visscher, Tommy L. S., Aila Rissanen, Jacob C. Seidell, Markku Heliovaara, Paul Knekt,Antti Reunanen, and Arpo Aromaa. 2004. Obesity and unhealthy life-years in adultFinns: an empirical approach. Archives of Internal Medicine 164(13):1413–1420.
Wang, F., T. McDonald, L. J. Champagne, and D. W. Edington. 2004. Relationship ofbody mass index and physical activity to health care costs among employees. Journalof Occupational & Environmental Medicine 46(5):428–436.
Wang, F., T. McDonald, B. Reffitt, and D. W. Edington. 2005. BMI, physical activity,and health care utilization/costs among medicare retirees. Obesity Research 13(8):1450–1457.
Wang, F. F., A. B. Schultz, S. Musich, T. McDonald, D. Hirschland, and D. W. Eding-ton. 2003. The relationship between national heart, lung, and blood institute weightguidelines and concurrent medical costs in a manufacturing population. AmericanJournal of Health Promotion 17(3):183–189.

Obesity and its Relation to Mortality and Morbidity Costs 77
Washington. 2007. The health of Washington State, 2007, obesity and overweight. Tech.Rep., Washington State Department of Health.
Weitoft, Gunilla Ringback, Mats Eliasson, and Mans Rosen. 2008. Underweight, over-weight and obesity as risk factors for mortality and hospitalization. ScandinavianJournal of Public Health 36(2):169–176.
Whitlock, Gary, Sarah Lewington, Paul Sherliker, Robert Clarke, Jonathan Emberson,Jim Halsey, Nawab Qizilbash, Rory Collins, and Richard Peto. 2009. Body-massindex and cause-specific mortality in 900,000 adults: Collaborative analyses of 57prospective studies. The Lancet 373:1083–1096.
Willett, E. V., L. M. Morton, P. Hartge, N. Becker, L. Bernstein, P. Boffetta, P. Bracci,J. Cerhan, B. C. Chiu, P. Cocco, L. Dal Maso, S. Davis, S. De Sanjose, K. E. Smedby,M. G. Ennas, L. Foretova, E. A. Holly, C. La Vecchia, K. Matsuo, M. Maynadie,M. Melbye, E. Negri, A. Nieters, R. Severson, S. L. Slager, J. J. Spinelli, A. Staines,R. Talamini, M. Vornanen, D. D. Weisenburger, and E. Roman. 2008. Non-Hodgkinlymphoma and obesity: a pooled analysis from the InterLymph Consortium. Inter-national Journal of Cancer 122(9):2062–2070.
Wolf, A. M., and G. A. Colditz. 1998. Current estimates of the economic cost of obesityin the United States. Obesity Research 6(2):173–175.
Wray, Linda A., Caroline S. Blaum, Mary Beth Ofstedal, and Regula Herzog. 2004.Diabetes diagnosis and weight loss in middle-aged adults. Research on Aging 26(1):62–81.
Yan, L. L., M. L. Daviglus, K. Liu, J. Stamler, R. Wang, A. Pirzada, D. B. Garside,A. R. Dyer, L. Van Horn, Y. Liao, J. F. Fries, and P. Greenland. 2006. Midlife bodymass index and hospitalization and mortality in older age. Journal of the AmericanMedical Association 295(2):190–198.
Yang, X. Q., P. Cote, J. D. Cassidy, and L. Carroll. 2007. Association between bodymass index and recovery from whiplash injuries: A cohort study. American Journalof Epidemiology 165(9):1063–1069.
Yusuf, Salim, Steven Hawken, Stephanie Ounpuu, Leonelo Bautista, Maria Grazia Fran-zosi, Patrick Commerford, Chim C. Lang, Zvonko Rumboldt, Churchill L. Onen,Lisheng Liu, Supachai Tanomsup, Paul Wangai Jr., Fahad Razak, Arya M. Sharma,and Sonia S. Anand. 2005. Obesity and the risk of myocardial infarction in 27,000participants from 52 countries: a case-control study. The Lancet 366:1640–1649.
Zablotsky, Diane, and Karin Mack. 2004. Changes in obesity prevalence among womenaged 50 years and older. Research on Aging 26(1):13–30.
Zhang, Cuilin, Kathryn M. Rexrode, Rob M. van Dam, Tricia Y. Li, and Frank B.Hu. 2008. Abdominal obesity and the risk of all-cause, cardiovascular, and cancermortality: sixteen years of follow-up in US women. Circulation 117(13):1658–1667.

78 Obesity and its Relation to Mortality and Morbidity Costs
Zhang, X., X. O. Shu, G. Yang, H. Li, H. Cai, Y. T. Gao, and W. Zheng. 2007. Abdom-inal adiposity and mortality in Chinese women. Archives of Internal Medicine 167(9):886–892.
Zhou, M., A. Offer, G. Yang, M. Smith, G. Hui, G. Whitlock, R. Collins, Z. Huang,R. Peto, and Z. Chen. 2008. Body mass index, blood pressure, and mortality fromstroke: a nationally representative prospective study of 212,000 Chinese men. Stroke39(3):753–759.