Embed Size (px)
Citation preview

..the energy to inspire
Oando Plc
Company Profile
August, 2015
www.oandoplc.com
Important Notice
2
This presentation does not constitute an invitation to underwrite, subscribe for, or otherwise acquire or dispose of any Oando Plc (the “Company”) shares or other securities. This presentation includes certain forward looking statements with respect to certain development projects, potential collaborative partnerships, results of operations and certain plans and objectives of the Company including, in particular and without limitation, the statements regarding potential sales revenues from projects, both current and under development, possible launch dates for new projects, and any revenue and profit guidance. By their very nature forward looking statements involve risk and uncertainty that could cause actual results and developments to differ materially from those expressed or implied. The significant risks related to the Company’s business which could cause the Company’s actual results and developments to differ materially from those forward looking statements are discussed in the Company’s annual report and other filings. All forward looking statements in this presentation are based on information known to the Company on the date hereof. The Company will not publicly update or revise any forward looking statements, whether as a result of new information, future events or otherwise.
Past performance is no guide to future performance and persons needing advice should consult an independent financial adviser.
All estimates of reserves and resources are classified in line with NI 51-1-1 regulations and Canadian Oil & Gas Evaluation Handbook standards. All estimates are from An Independent Valuation Report dated 31st December 2014 BOEs [or McfGEs, or other applicable units of equivalency] may be misleading, particularly if used in isolation. A BOE conversion ratio of 6 Mcf: 1 bbl [or an McfGE conversion ratio of 1 bbl: 6 Mcf‟] is based on an energy equivalency conversion method primarily applicable at the burner tip and does not represent a value equivalency at the wellhead. The estimates of reserves and future net revenue for individual properties may not reflect the same confidence level as estimates of reserves and future net revenue for all properties, due to the effects of aggregation.
The estimates of reserves and future net revenue for individual properties may not reflect the same confidence level as estimates of reserves and future net revenue for all properties, due to the effects of aggregation. Reserves: Reserves are volumes of hydrocarbons and associated substances estimated to be commercially recoverable from known accumulations from a given date forward by established technology under specified economic conditions and government regulations. Specified economic conditions may be current economic conditions in the case of constant price and un-inflated cost forecasts (as required by many financial regulatory authorities) or they may be reasonably anticipated economic conditions in the case of escalated price and inflated cost forecasts
Possible Reserves: Possible reserves are quantities of recoverable hydrocarbons estimated on the basis of engineering and geological data that are less complete and less conclusive than the data used in estimates of probable reserves. Possible reserves are less certain to be recovered than proved or probable reserves which means for purposes of reserves classification there is a 10% probability that more than these reserves will be recovered, i.e. there is a 90% probability that less than these reserves will be recovered. This category includes those reserves that may be recovered by an enhanced recovery scheme that is not in operation and where there is reasonable doubt as to its chance of success.
Proved Reserves: Proved reserves are those reserves that can be estimated with a high degree of certainty on the basis of an analysis of drilling, geological, geophysical and engineering data. A high degree of certainty generally means, for the purposes of reserve classification, that it is likely that the actual remaining quantities recovered will exceed the estimated proved reserves and there is a 90% confidence that at least these reserves will be produced, i.e. there is only a 10% probability that less than these reserves will be recovered. In general reserves are considered proved only if supported by actual production or formation testing. In certain instances proved reserves may be assigned on the basis of log and/or core analysis if analogous reservoirs are known to be economically productive. Proved reserves are also assigned for enhanced recovery processes which have been demonstrated to be economically and technically successful in the reservoir either by pilot testing or by analogy to installed projects in analogous reservoirs. Probable Reserves: Probable reserves are quantities of recoverable hydrocarbons estimated on the basis of engineering and geological data that are similar to those used for proved reserves but that lack, for various reasons, the certainty required to classify the reserves are proved. Probable reserves are less certain to be recovered than proved reserves; which means, for purposes of reserves classification, that there is 50% probability that more than the Proved plus Probable Additional reserves will actually be recovered. These include reserves that would be recoverable if a more efficient recovery mechanism develops than was assumed in estimating proved reserves; reserves that depend on successful work-over or mechanical changes for recovery; reserves that require infill drilling and reserves from an enhanced recovery process which has yet to be established and pilot tested but appears to have favorable conditions

Contents
> About Oando Plc
> Appendix
> Strategic Highlights
04 08
12
> Investment Story
09
3

About Oando Plc
www.oandoplc.com..the energy to inspire
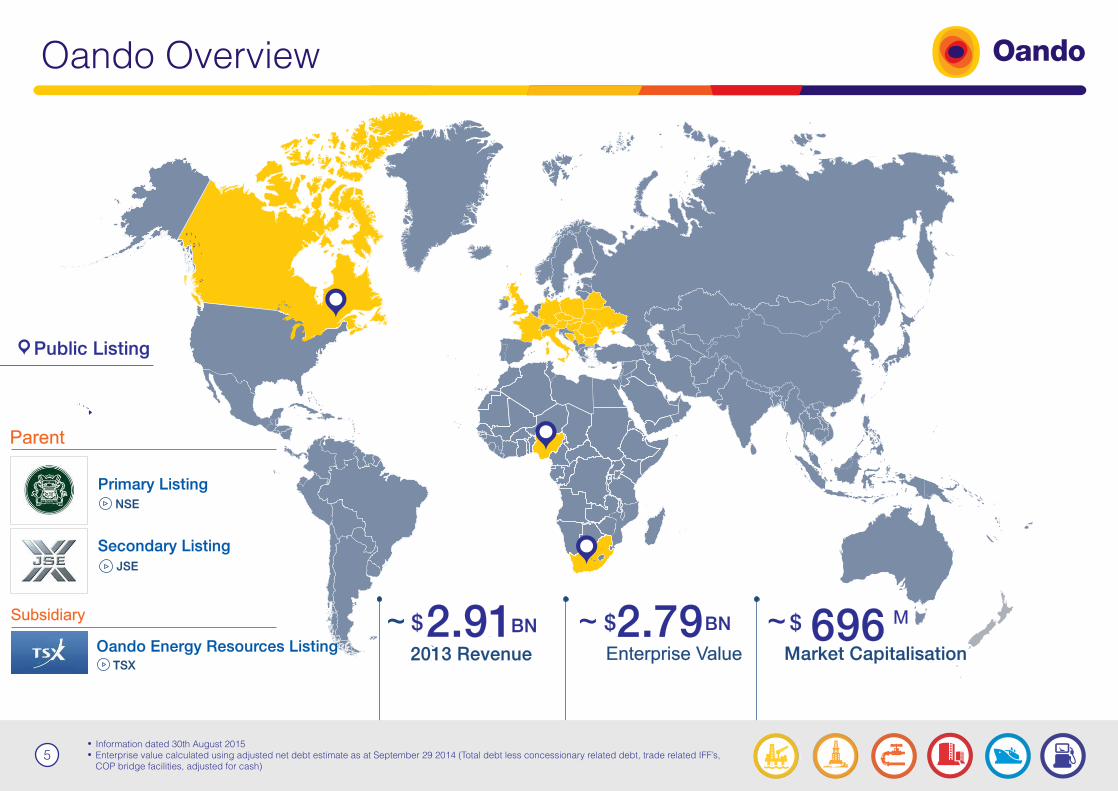
Public Listing
2.912013 Revenue
BN 2.79Enterprise Value
BN
Primary Listing
Secondary Listing
NSE
JSE
TSX
Oando Overview
$~~ $ 696 M
Market Capitalisation
~ $
Parent
Subsidiary
Oando Energy Resources Listing
Information dated 30th August 2015Enterprise value calculated using adjusted net debt estimate as at September 29 2014 (Total debt less concessionary related debt, trade related IFF’s, COP bridge facilities, adjusted for cash)
5
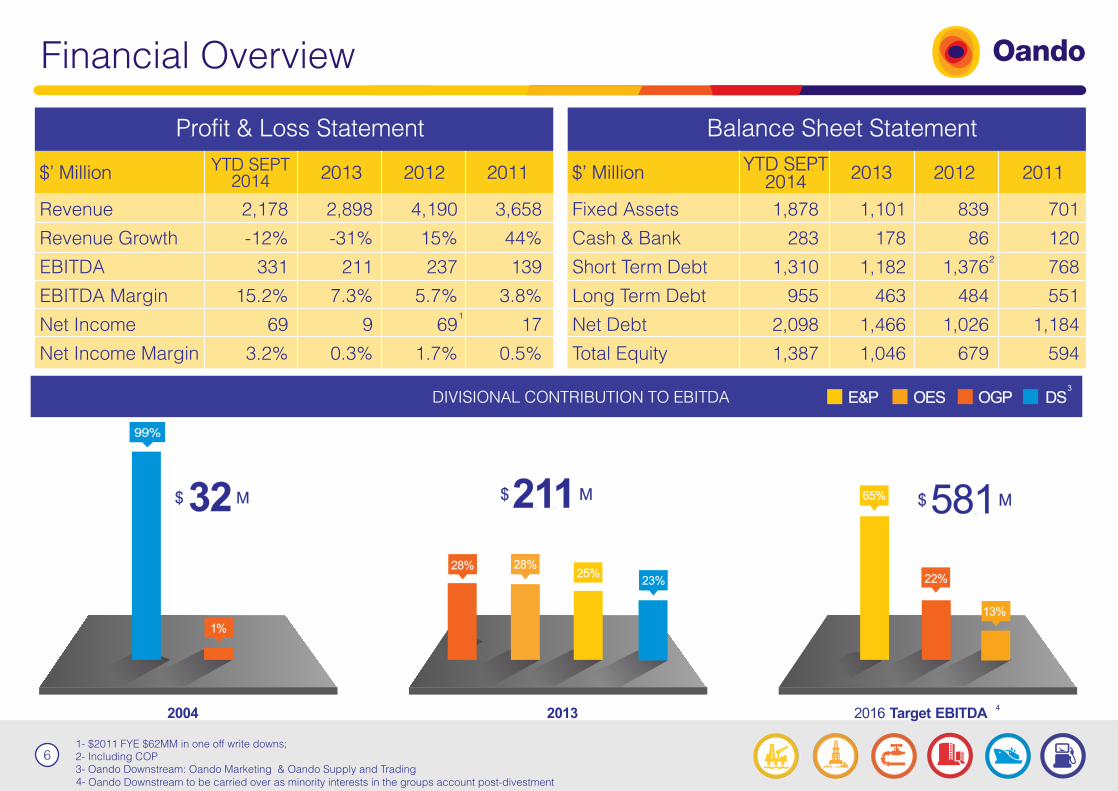
Financial Overview
$2011 FYE $62MM in one off write downs; Including COPOando Downstream: Oando Marketing & Oando Supply and Trading
Revenue
Revenue Growth
EBITDA
EBITDA Margin
Net Income
Net Income Margin
2,178
-12%
331
15.2%
69
3.2%
2,898
-31%
211
7.3%
9
0.3%
4,190
15%
237
5.7%
69
1.7%
3,658
44%
139
3.8%
17
0.5%
YTD SEPT 2014 2013 2012 2011$’ Million
Fixed Assets
Cash & Bank
Short Term Debt
Long Term Debt
Net Debt
Total Equity
1,101
178
1,182
463
1,466
1,046
839
86
1,376
484
1,026
679
701
120
768
551
1,184
594
2013 2012 2011$’ Million
Profit & Loss Statement Balance Sheet Statement
CONTRIBUTION
1
1-2-3-
2
1,878
283
1,310
955
2,098
1,387
YTD SEPT 2014
6
581$ M21132 $$ MM
99%
1%
2016 Target EBITDA20132004
28% 28%25%
23%
65%
22%
13%
4
DIVISIONAL CONTRIBUTION TO EBITDA E&P OES OGP DS3
Oando Downstream to be carried over as minority interests in the groups account post-divestment4-
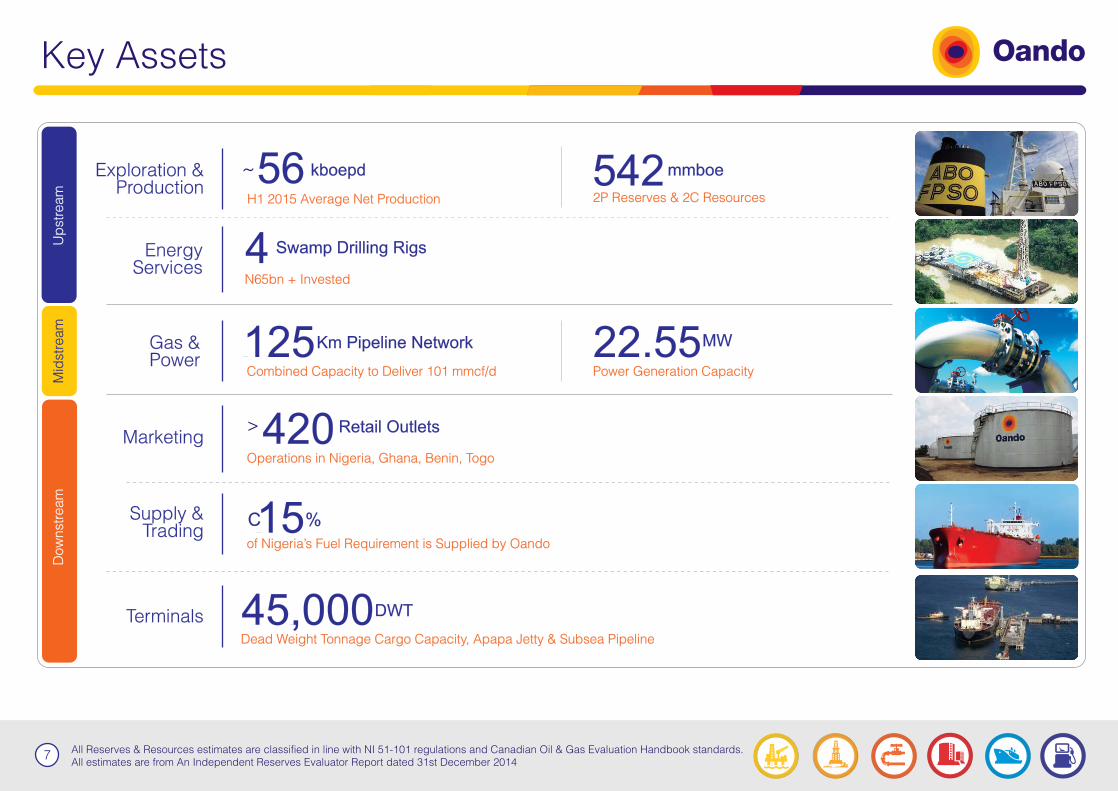
All Reserves & Resources estimates are classified in line with NI 51-101 regulations and Canadian Oil & Gas Evaluation Handbook standards. All estimates are from An Independent Reserves Evaluator Report dated 31st December 2014
Key Assets
7
Exploration & Production
EnergyServices
Marketing
Gas &Power
Supply &Trading
Terminals
54256 mmboekboepd~
H1 2015 Average Net Production
4 Swamp Drilling Rigs
125Km Pipeline Network
Combined Capacity to Deliver 101 mmcf/d
420 Retail Outlets
Operations in Nigeria, Ghana, Benin, Togo
>
15 %of Nigeria’s Fuel Requirement is Supplied by Oando
C
45,000Dead Weight Tonnage Cargo Capacity, Apapa Jetty & Subsea Pipeline
DWT
Up
str
eam
Mid
stre
am
Dow
nst
ream
22.55MW
Power Generation Capacity
N65bn + Invested
2P Reserves & 2C Resources

8
Strategic Highlights
Exploration & Production
Energy Services
Marketing
Gas & Power
Current: 2015 Midterm: 2017 Long Term: 2019
DO
WN
ST
RE
AM
MID
ST
RE
AM
UP
ST
RE
AM
Production of ~56kboepd (H1 2015 Average)2P Reserves of 420mmboeMaintain production on OMLs 60 - 63 (Production Optimisation)Maintain production levels on Abo field (OML 125) through drilling and completion as well as FPSO life extensionMaintain production levels from Ebendo (OML 56) through facility & pipeline enhancements Complete facility enhancements to maintain production on Qua Ibo (OML13)
Terminals
››››
›
›
Actively engage swamp rig fleet activeExpand product offering in drilling & completion businessExecute a substantive MOU with an established international drilling company and jointly deploy additional drilling rigs
›››
Achieve mandates for the development of embedded power generation for Distribution CompaniesComplete construction of Greater Lagos Pipeline (GL4) and Port Harcourt Pipeline Expansion projectsGrow aggregate gas pipeline utilization to average 75mmscf/dFinalize feasibility for the ELPS-Ibadan-Ilorin-Jebba (EIIJ) gas transmission pipelineInvest in acquisition of NIPP/Grid connected power utilities
›
››››
›
Completion of construction & commencement of operations of the Apapa Jetty and subsea pipelines in the Lagos PortCommission 3rd party commercial & technical feasibility for the Eastern 4KT LPG Tank farm constructionCommencement of first phase for the Apapa Terminal upgrade
›
›
›
Focus on increasing market share in existing markets and achievingeconomies of scale
›
Conclude on process of Groups partial divestmentMaintain a minimum (25%) current white products market share of MOMANPosition for a partial/fully deregulated gasoline marketMaintain LPG leadership strategy amongst MOMAN whilst growing national share from 17% to 20%
››
››
Production Target: > 80kboepdReserves Replacement Ratio Target of 1:1Organic Growth: Accelerated development programme on OMLs 60 - 63Inorganic Growth: Take advantage of indigenousstatus by participating in FGN bid rounds and IOC divestment programmes
›››
›
Deploy first offshore rig through JV companyEnter into additional partnerships and jointly deploy drilling rigsGrow Drilling & Completion business market shareDivestment of up to 51% or potential listing
››
›
Complete development and commence operation of 150MW embedded/grid power generationComplete development and commence operation of at least 20mmscfd Mini LNG businessGrow aggregate gas pipeline utilization portfolio to an average of 100mmscf/dayCommence phased development of EIIJ gas pipelineCommence execution of at least 300mmscfd Gas Processing Facility
›
›
›
››
Commencement of commercial & technical feasibility for 360kt ONNE Energy QuadrantCompletion of 2nd phase and commencement of 3rd phase for the Apapa Terminal UpgradeCommencement of FEED on Badagry Terminal facility
›
›
›
Diversifying markets, increasing West-African presence›
Business expansion and increased efficienciesExpand white market share of the Majors to 30%
non-fuel revenueGrow
›››
Production Target: >100kboepd2P Reserves Target: >500mmboe
››
Enter into partnerships and jointly deploy deep-water drilling rigsDivestment of an additional 25%
›
›
Complete development & commence operation of 80MW embedded/grid power generationGrow aggregate gas pipeline utilization/contracts to an average of 200mmscf/dayCommence phased development of gas distribution system in Tema industrial area (Ghana)
›
›
›
Commence JV partnerships in operational areasComplete Apapa Terminal 1 upgradeConstruction of 360kt ONNE Energy QuadrantConstruction of Badagry Terminal facility
›
›
›
Expansion into other African markets›
Explore further divestment (Group)›
›
›
Supply & Trading
Investment Story
www.oandoplc.com..the energy to inspire

Why Invest in Oando Plc?
Its indigenous status positions the Company in the forefront to benefit from planned and on-going Oil & Gas sector reforms.
Oando also owns the biggest fuel retail network in Nigeria which is a key driver of volume sales.
LeadingCompetitive Position
1
OER has transformed company into the largest indigenous producer of oil in Nigeria with a first half 2015 average production of 56 kboepd and 2P Reserves of 420 MMboe.
Highly skilled and experienced management team and labour force with a successful track record and a wealth of cognate and relevant Oil & Gas experience across the full spectrum of the industry.
LargestIndigenous E&P Player
CompetentManagement Team
2 3
Strategic Rig Fleet
500mmboe/100kboedMid-cap company based on marketcapitalisation
Largest indigenous independent in Nigeria
Exploration &Production
EnergyServices
Upstream
600km + pipeline networkInfrastructure to support growing gas requirements.
Modular gas processing & mini LNG projects
Commercial, industrial and domesticcustomers
Gas & Power
Midstream
c.40% LPG Market share
Larger import volumes & improved efficiency
Marketing
Supply &Trading
Terminals
c.27% + Market share
210,000MT Terminal Facility
Operations in Nigeria, Ghana, Benin, Togo and Liberia
Leader in product export and import
Downstream
..the energy to inspire
2019& BEYOND
Enter into partnerships & jointly deploy deep-water drilling rigs
10

GROWTHSTRATEGY
Competitive Advantage
Indigenous status and capacityCapital raising capabilities, through TSX listingPresence in local communities, local partnerships and relationships
Value Drivers
Acquisition of proven reservesAcquisition of near term producing assetsDe-risk existing resources portfolio and bring both existing and new assets on-stream.
Identication, access & acquisition of opportunities in the O&G Industry
IOCs divestment plansMarginal eld programmesGovernment Bid RoundsM&A activity
Disciplined approach to capitalstructure & valuation
Financial discipline
Growing Reserves & Resources
Exploration & Production Growth Strategy ..the energy to inspire
11

Appendix
www.oandoplc.com..the energy to inspire

Oando Energy Resources (TSX:OER) - Overview
56,163 boepd 420.3Mmboe
2P Reserves
121.92C Resources
Mmboe7ProducingAssetsTSXListing
93.8% owned by PLC OMLs 60-63, Abo, Ebendo & Qua Ibo
EbendoRigAbo FPSOAkepo
Figures in US$ unless otherwise stated
All Reserves & Resources estimates are classified in line with NI 51-101 regulations and Canadian Oil & Gas
Evaluation Handbook standards. All estimates are from an Independent Reserves Valuation Report dated 31st December 2014
1
Revenue
Revenue Growth
EBITDA
EBITDA Margin
Net Income
Net Income Margin
Oil Produced (mboe)
223
256%
71
32%
(50)
(22%)
10,165
$Million H1 2015
127
(6%)
89
70%
(38)
(30%)
1,460
2013
135
(15%)
91
68%
16
12%
1,483
20121
H12015 Average Net Production
13
Average daily production rates above are reported as at June 31, 2015
421
231%
199
47%
(320)
(49%)
9,105
2014
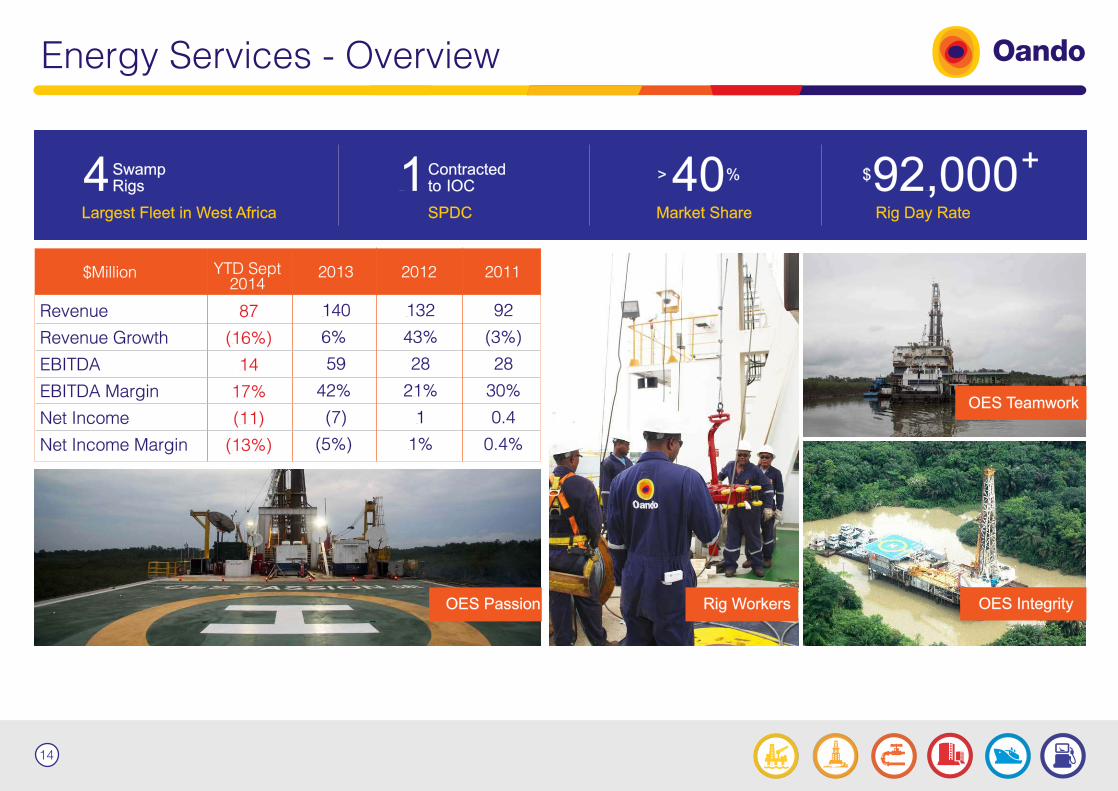
Energy Services - Overview
4SwampRigs
Largest Fleet in West Africa
1Contractedto IOC
SPDC
40%
Market Share
> 92,000Rig Day Rate
$
Revenue
Revenue Growth
EBITDA
EBITDA Margin
Net Income
Net Income Margin
$Million 2013 2012 2011
Rig Workers OES Integrity
OES Teamwork
OES Passion
87
(16%)
14
17%
(11)
(13%)
140
6%
59
42%
(7)
(5%)
132
43%
28
21%
1
1%
92
(3%)
28
30%
0.4
0.4%
14
YTD Sept 2014
+

Gas & Power - Overview
125 km pipeline Network:
Networks in Lagos & South East
IPPsOff-takers are Lagos State parastatals
CPFAwarded contract to build Central Processing Facility
Revenue
Revenue Growth
EBITDA
EBITDA Margin
Net Income
Net Income Margin
136
7%
23
17%
22
16%
$Million
160
(53%)
60
37%
11
7%
2013
343
191%
97
28%
76
22%
2012
118
3%
22
19%
21
18%
2011
GasLinkCNG Station ConstructionAkute Power
(22.55MW of capacity) (Central Processing Facility)
15
YTD Sept 2014
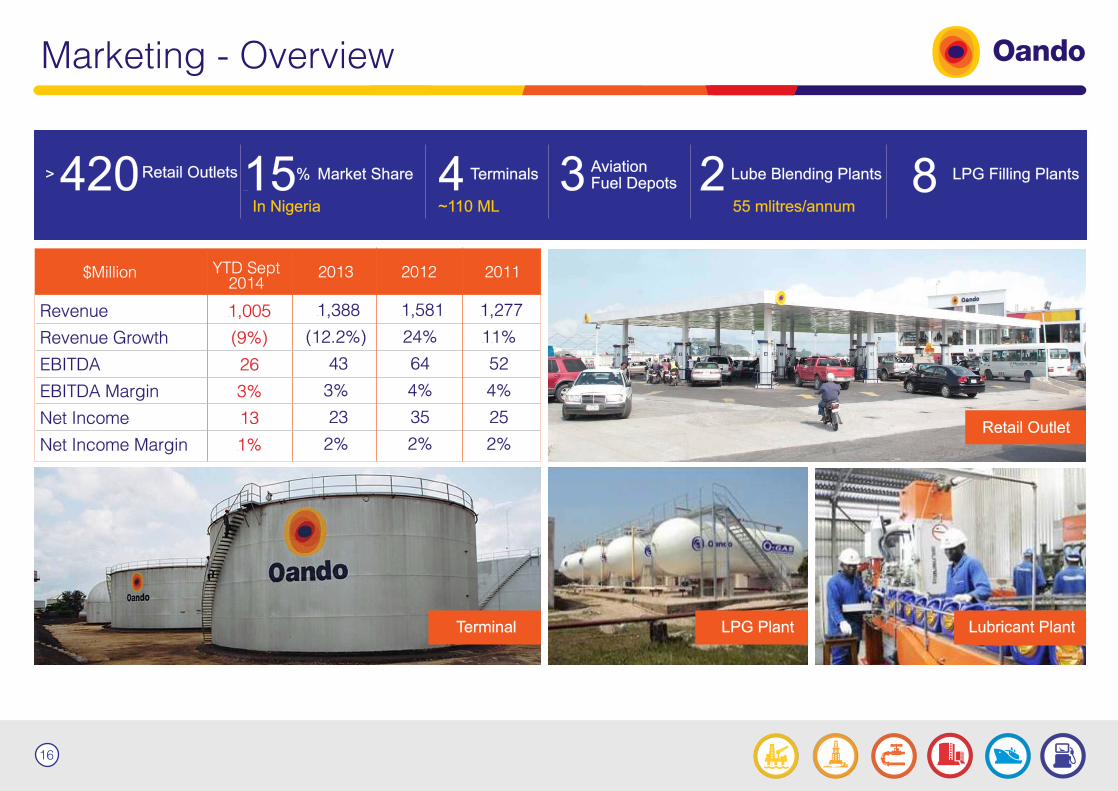
Marketing - Overview
420Retail Outlets
Revenue
Revenue Growth
EBITDA
EBITDA Margin
Net Income
Net Income Margin
1,005
(9%)
26
3%
13
1%
$Million
1,388
(12.2%)
43
3%
23
2%
2013
1,581
24%
64
4%
35
2%
2012
1,277
11%
52
4%
25
2%
2011
Retail Outlet
Terminal GasLinkLPG Plant Lubricant Plant
> 15 Market Share%
In Nigeria
4 Terminals
~110 ML
3 AviationFuel Depots 2 Lube Blending Plants
55 mlitres/annum8 LPG Filling Plants
16
YTD Sept 2014

Supply & Trading - Overview
15 %
Revenue
Revenue Growth
EBITDA
EBITDA Margin
Net Income
Net Income Margin
1,258
(31%)
26
2%
21
2%
$Million
1,079
(72%)
28
3%
23
2%
3,801
(4%)
13
0.3%
4
0.1%
3,971
275%
18
0.5%
13
0.3%
Vessels with refined products
c 4.2 BN Litres
of refined products imported from 2008 to 2013of Nigeriaʼs fuel requirement supplied
> 1.1 BN>
2013 Revenues
$
2013 2012 2011
17
YTD Sept 2014
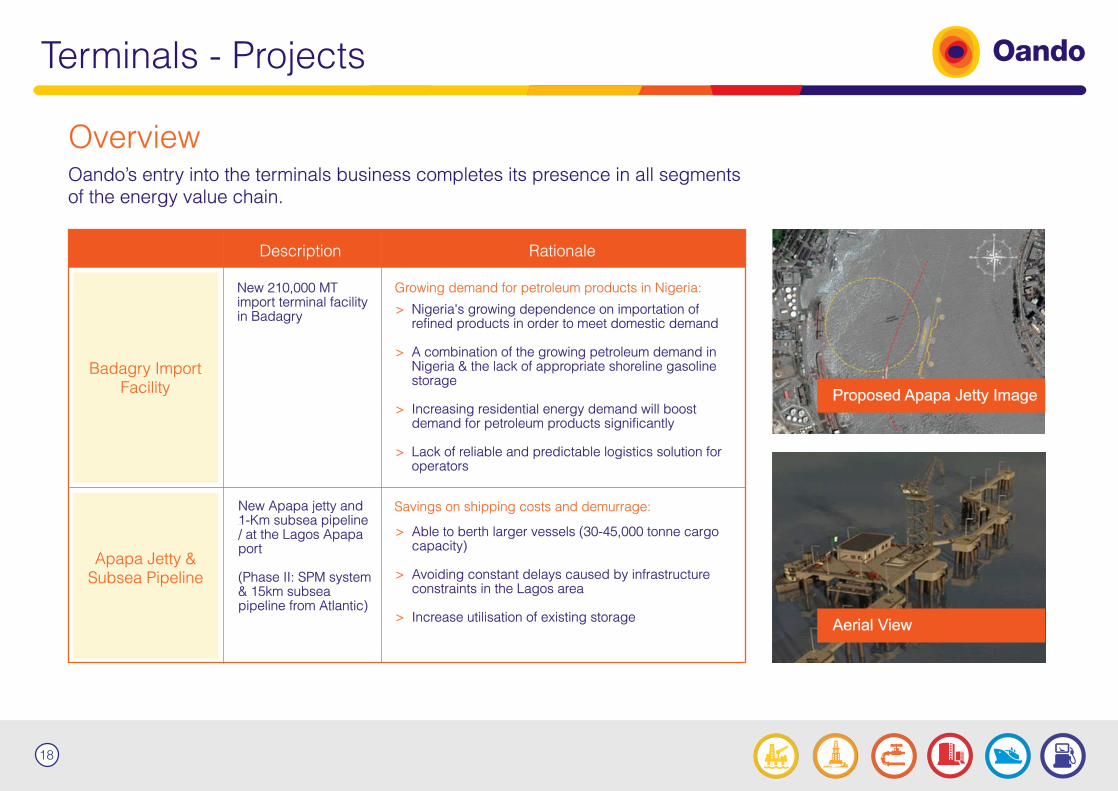
Terminals - Projects
Oando’s entry into the terminals business completes its presence in all segments of the energy value chain.
Overview
Badagry Import Facility
New 210,000 MT import terminal facility in Badagry
Description Rationale
Nigeria's growing dependence on importation of refined products in order to meet domestic demand
A combination of the growing petroleum demand in Nigeria & the lack of appropriate shoreline gasoline storage
Increasing residential energy demand will boost demand for petroleum products significantly
Lack of reliable and predictable logistics solution for operators
>
>
>
>
Apapa Jetty & Subsea Pipeline
New Apapa jetty and 1-Km subsea pipeline / at the Lagos Apapa port
(Phase II: SPM system & 15km subsea pipeline from Atlantic)
Able to berth larger vessels (30-45,000 tonne cargo capacity)
Avoiding constant delays caused by infrastructure constraints in the Lagos area
Increase utilisation of existing storage
Proposed Apapa Jetty Image
Aerial View
Savings on shipping costs and demurrage:
Growing demand for petroleum products in Nigeria:
>
>
>
18

www.oandoplc.com
19