Embed Size (px)
Citation preview

Oakland Unified School DistrictNew Small Schools Initiative
Evaluation
Ash Vasudeva, Linda Darling-Hammond, Stephen Newton & Kenneth Montgomery
The School Redesign Network at Stanford University

This report can be downloaded from http://www.srnleads.org/resources/publications/ousd/ousd.html. Individual case studies conducted for this study of seven Oakland schools can
also be downloaded at the above URL.
This study was conducted by the School Redesign Network at Stanford University.
© 2009 School Redesign Network. All rights reserved.
Citation: Vasudeva, A., Darling-Hammond, L., Newton, S., & Montgomery, K. (2009). Oakland Unified School District new small schools initiative evaluation. Stanford, CA: School Redesign Network at Stanford University.
Cover photo: Students at Bridges Academy. Mindy Pines, courtesy of Oakland Unified School District.
The School Redesign Network at Stanford University engages in research and development to support districts and schools that are equitable and enable all students to master the knowledge and skills needed for success in college, careers, and citizenship.
Linda Darling-Hammond, Founding DirectorRaymond Pecheone, Co-Executive DirectorAsh Vasudeva, Co-Executive Director505 Lasuen Mall Stanford, CA 94305-3084650.725.0703 srnleads.org
SRN LEADSS T A N F O R D U N I V E R S I T Y
Oakland Unified School Districtoperates with the goals of universal college and workplace readiness, quality public schools in every neighborhood, clean and safe learning environments, service excellence across the district, and equitable outcomes for all students.
Roberta Mayor, Interim Superintendent1025 Second AvenueOakland, CA 94606-2212www.ousd.k12.ca.us510.879.8242
expect Success
OAKLAND UNIF IED SCHOOL D I S TR ICT

School level is indicated by shape: = elementary school, = middle school, = high school, = other
Overall tier is indicated by outer color: From highest to lowest = blue, green, orange, yellow, red.
2007-08 productivity in English language arts and mathematics is indicated by the inner circle: From highest to lowest = black, gray, white.
A larger and easy-to-read version of this map can be accessed at http://www.srnleads.org/resources/publications/ousd/art/ousd_map_web.jpg (click on url to navigate to the online map).
Oakland Unified School District 2008 Productivity and Tiering

AcknowledgementsThe authors would like to gratefully acknowledge the many people who made this study possible. From the Oakland Unified School District (OUSD) we would like to thank State Administrator Vincent Matthews, Board President David Kakishiba, Vice President Alice Spearman, and Directors Kerry Hamill, Gregory Hodge, Gary Yee, Noel Gallo, and Christopher Dobbins for their comments and feedback at the October 2008 Board of Education meeting. We would also like to thank Interim Superintendent Ro-berta Mayor and Brad Stam, Laura Moran, Kirsten Vital, Matt Hill, and Lisa Spielman for their guidance and critical contributions throughout the course of the study.
OUSD’s Department of Research and Assessment staff were incredibly generous with their time and expertise, and we would like to thank Director Amy Malen, Kevin Smith, Phoumy Sayavong, and consultant Nathan Pelligren for their advice and support. We are particularly indebted to Jean Wing, OUSD’s key lead and contact on this study, whose knowledge and insight improved the research tremendously. We would also like to thank the principals and teachers at the seven case study schools for welcoming us into their offices and classrooms and helping us understand how OUSD’s New Small School Initiative has helped shape the lives of educators, parents, and students in the district.
At Stanford University, we would like to thank Maria Perez for her early work to as-semble the database and Susanna Loeb for her advice about the research methodology. We would also like to thank Diane Friedlaender for her major contributions to the study design, project management, and case development and Barbara McKenna for the vi-sual design and layout of this report.
If we inadvertently omitted a valuable contributor, we apologize. While many people have helped strengthen this report, the authors are solely responsible for any errors.

Table of Contents
Executive Summary ...................................................................................................... i
Section 1: Introduction ................................................................................................. 1
Section 2: Brief history of OUSD’s New Small Schools Initiative ............................... 3
Section 3: Analyses of school productivity ................................................................. 9
Section 4: Case study summaries ................................................................................. 22
Section 5: Policy lessons from cross-case analyses ................................................... 37
Section 6: Policy observations and considerations, and study conclusions ............... 49
Appendix A: Regression model .................................................................................. 55
Appendix B: School ratings, OUSD 2006-07 tiering, and one-step productivity analysis ....................................................................................................................... 60
Appendix C: School ratings, two-step productivity analysis .................................... 69
Appendix D: ELA productivity associated with high school characteristics .......... 75
Appendix E: School selection process and case study methods ................................. 76
Bibliography ................................................................................................................ 78
The following individual case studies can be accessed at http://www.srnleads.org/re-sources/publications/ousd/ousd.html
ACORN Woodland ElementaryASCENDBEST High SchoolElmhurst Community Prep (ECP)EnCompass AcademyEXCEL High SchoolOakland International High School

Leadership Prep Graduates. Photo: Courtesy of Expect Success! Oakland Unified School District

OUSD New Small Schools Initiative Evaluation i
his final report by the School Redesign Network at Stanford University (SRN) completes a Phase II evaluation study of Oakland Unified School District’s (OUSD) New Small Schools Initiative1 from 2000 to present. The Phase II evaluation study follows a Phase I study completed in September 2007 by Strategic Measurement and
Evaluation, Inc. The Phase II study takes a deeper, longitudinal look at the 45 new small schools in operation during the 2007-08 school year and addresses questions raised by the Board of Education; district administrative leadership; community partners; and school principals, teachers, and parents based on the findings of the Phase I evaluation. These questions were incorporated into and informed three overarching research goals for this study:
Research Goal #1To understand how well new small schools and existing schools in OUSD are perform-ing over time, taking into account the stu-dents they serve and their process of start-up and development.
Research Goal #2To understand what factors influence schools’ achievement and their improve-ment trajectories over time.
Research Goal #3To recommend policy strategies that can build on current successes and address iden-tified needs and issues.
SRN conducted quantitative and qualitative analyses to address these research goals. Quantitative analyses of student achieve-ment on California Standards Tests (CST) were used to understand school perfor-mance on key measures of success while controlling for student characteristics, stage of school development, and grade levels. Through statistical modeling, SRN developed estimates of academic produc-tivity, a value-added measure of student performance that controls for students’ demographic variables and prior achieve-ment. SRN estimated the productivity of
Executive Summary
all OUSD schools and compared the pro-ductivity of new small schools with other schools.
Qualitative methods were used to develop case studies of seven new small schools that had shown strong value-added growth for students. We examined the schools’ design features, developmental history, instructional characteristics, and capacity. The seven schools were purposely selected to address issues of policy interest and to provide a cross-section of new small schools by type (e.g., elementary, middle, high), years of operation, and neighborhood. Individually, the cases provide valuable lessons; collectively they form the basis of a cross-case analysis used to provide district policy considerations. The seven case study schools are shown on the following page. (Two schools, EXCEL and BEST, are covered in one case study, as they were converted from a comprehensive high school into two small schools that share a campus.)
Based on the quantitative and qualitative research conducted and on interviews with OUSD school and district leaders, the fol-lowing key findings, policy considerations, observations, and extensions of positive ex-
T

School Redesign Network at Stanford Universityii
isting teacher development policies emerge from the Phase II evaluation.
Evaluation KEy Findings
• Over the period 2003-04 to 2007-08, new small schools have been, on average, more productive than older schools at the elementary and high school levels.
• Over the period 2003-04 to 2007-08, new small middle schools have been, on average, about equally productive as older middle schools in English language arts (ELA), and less productive in mathe-matics. However, two-thirds of new small middle schools had only 2 years of data at the time of this study, suggesting that these schools were in the early stages of becoming more academically productive.
• New schools become more effective and productive as they mature.
• New schools are helping increase student achievement and contributing to the dis-trict’s overall academic productivity.
• At the high school level, particular school design features are positively associated
Case Study School Level Year Opened Neighborhood
ACORN Woodland Elementary 2000 East Oakland
EnCompass Academy Elementary 2004 East Oakland
ASCEND K-8 2001 Fruitvale Community
Elmhurst Community Prep Middle School 2006 East Oakland
BEST High School 2005 West Oakland
EXCEL High School 2005 West Oakland
Oakland International High School 2007 North Oakland
with academic productivity. These fea-tures include:
~ Project-based learning~ Interdisciplinary courses~ Block scheduling~ Career/technical education~ Advisory
• Across school levels, school staffing strongly influences academic produc-tivity. On average, having a greater proportion of less experienced teachers (i.e., those in the first or second year of teaching) significantly reduces schools’ academic productivity.
• A cross-site analysis of case study schools suggests key characteristics that may contribute to effective school func-tioning and productivity. These school characteristics are:
~ Mission-driven principals who are proactively recruited and/or mentored to serve at their schools;
~ Faculties that are “balanced” with experienced and new teach-

OUSD New Small Schools Initiative Evaluation iii
ers who are committed to the school’s mission;
~ Extensive use of personalization strategies;
~ Clear, coherent instructional pro-grams that are focused on authen-tic, hands-on instruction;
~ Analyses of student learning that are used to promote an academic culture, improve the instructional program, and inform teacher pro-fessional development;
~ Commitment to parent and com-munity outreach and engagement.
Policy obsErvations OUSD has developed policies and practices that benefit new and existing schools, and SRN suggests that the district continue to:
• Encourage district administrators and coaches to serve as thought partners and problem solvers.
Teachers and leaders of small schools highly valued administrators and coaches that help them solve problems rather than focus on managing mandates. Principals praised their key administrative super-visors, the network executive officers, when they helped strategize solutions to challenges rather than catalog compli-ance with regulations. Similarly, elemen-tary principals and teachers appreciated coaches who went beyond monitoring implementation of the district’s literacy curriculum and helped faculties develop a broad set of effective literacy practices to improve student learning. Small school faculties also benefitted from district ef-
forts to develop Professional Learning Communities (PLCs) to support in-structional improvement.
• Continue the supports that were provided to new schools and leaders through the OUSD incubator.
The successful OUSD incubator — in existence from 2004 to 20072 — provided a process for design teams to clarify their school vision and explore best practices. The district may wish to consider keeping in place many of the structures that helped teachers and administrators develop school visions and coherent instructional programs. This is particularly important for the most recent cohort of new small schools, as they often struggle with staff turnover and need to redevelop a strong vision and mission with their faculties.
• Look to small schools as sources of innovation and effective practices.
The new small schools have not only raised district productivity, they have also helped spur the development and implementation of innovations such as Expect Success,3 Results-Based Budget-ing, and curricular flexibility policies. The autonomy granted to the new small schools, combined with the entrepre-neurial ethos of many of the small school principals, can continue to be an important source of inspiration for in-novation across OUSD as it develops its portfolio of schools.
Policy considErations
As OUSD develops and adjusts its school portfolio, district leaders should consider the following:

School Redesign Network at Stanford Universityiv
• School productivity and achievement change over time and, thus, school development should be considered when deciding whether to expand, merge, or phase out schools.
New schools generally grow more pro-ductive over the first few years. District officials should consider the current and potential trajectory of the school when considering continuation or phase-out.
• Consider academic returns on investments and costs of student failure as well as immediate fiscal costs.
Although the current balance sheet de-
mands attention, and closing or merging schools may result in a quick reduction of operating costs, school officials must also consider possible increases in other costs in the near future, which may more than offset any immediate savings. Closing a successful school can increase remediation
and dropout-prevention costs, and result in students choosing other schooling op-tions outside the district.
• Consider expanding successful school models that are too small by proactively recruiting more students to these campuses.
In many cases the district has developed schools that are considerable improve-ments over the previous school options. Although some new schools are near capacity, other successful schools are un-dersized and could serve more students if district officials mounted concerted efforts to recruit students to these campuses. In expanding enrollment in successful OUSD schools, consideration should be given to the benefits generated when larger schools became small schools. Current policy should seek to preserve recent advances without recreating the large unproductive schools that preceded the small school reform strategy.
Roots International Academy. Photo: Mindy Pines, courtesy of Oakland Unified School District

OUSD New Small Schools Initiative Evaluation v
• Beware of undefined mergers that merely combine campuses.
Combining two small schools into a larger school forces the combined school to develop a new identity. Undefined mergers that merely join campuses risk creating a dysfunctional, less productive school. Where a successful school model exists, it should provide the template for the expanded school that results from a merger. District leaders should enable strong, focused school leadership and design as part of any campus merger. Some important supports for many of the new small schools included a year-long incubation process to clarify designs, a network for newly opened schools, a process to carefully match leaders to start-up designs, and a commitment to allow teacher staffing autonomy for the first year. Providing similar supports and autonomy would increase the likelihood for successful school mergers.
Policy ExtEnsions
OUSD has worked to develop policies that support teacher workforce development. We suggest building on and extending these supports in the following ways:
• Continue to build local pipelines into teaching.
The district has been developing a “grow your own” program for bringing lo-cal young people and paraprofessionals into teaching and has been strengthening its relationships with local universities as well as its capacity to hire promis-ing student teachers trained in Oakland. These initiatives should be continued and strengthened to build the teaching pipe-line in OUSD.
• Continue to move up hiring to earlier in the spring.
OUSD has made important strides in fill-ing teacher vacancies earlier in the year. However, many schools report that they are unable to offer teachers contracts until August, losing promising candidates and leaving little time for effective induc-tion. Steps taken to ensure that vacancies are filled early in the year would improve the quality of hires and the support given to teachers new to the school site.
• Refine the Beginning Teacher Support and Assessment (BTSA) induction model.
Some teachers report a very positive BTSA experience and others feel the BTSA process was not particularly helpful. Steps should be taken to improve the consisten-cy of the BTSA model and to select BTSA mentors from within the school to as-sist new teachers in sustaining coherence with the school’s vision and instructional practice.
• Continue working with the teachers association to reduce teacher turnover.
Some schools struggle more with teacher retention than others, and it is important that all stakeholders work together in developing a strategy for targeting schools with low retention. This means working together to undergo a close examination of the leadership, working conditions, and mentoring practices, beginning with the neediest schools. District officials should continue to work with the teachers association to evaluate areas for improving the collective bargaining agreement to help streamline the hiring process.

School Redesign Network at Stanford Universityvi
1. References to “new” schools refer to the schools started in OUSD since 2000 as part of the district’s New Small Schools Initiative, and “old” schools are all other schools. Charter schools are not included in this evaluation.
2. The OUSD incubator was in existence from 2004-07. A more limited set of supports were provided by OUSD instructional services coaches from 2007-2008; currently there is no incubator.
3. Expect Success refers to the broad district reform strategy launched in fall 2005. Expect Success contained six initiatives: 1) Create two organizations within one district – one focusing on the educational side of accelerating student achievement, and another organized around providing the support schools need to realize academic goals. 2) Empower schools with more flexibility and an increasing share of funding.
3) Create small, personalized learning communities. 4) Provide at least two quality school options in every neighborhood. 5) Support the skills and talents of employees and hold them accountable for meeting high standards. 6) Invest in technology and build smart business practices. Statham, K. (2007). Expect Success: Making Education Work for Every Oakland Student. Oakland, CA: Oakland Unified School District. Retrieved from http://webportal.ousd.k12.ca.us/docs%5CES%20Making%20Education%20Work%205.07.pdf.
• Continue efforts to project teacher demand and avoid unnecessary layoffs.
Part of the district’s current retention plan is to take measures not to lay off teachers in the spring based on preliminary budget estimates. In the past, OUSD lost many teachers to other districts due to this process, but the district has taken measures to project its actual hiring needs and retain more teachers.
SRN’s key findings and policy observations, considerations and extensions — and the
final report and school case studies from which they are drawn — are designed to facilitate an ongoing, results-based inquiry process for all district stakeholders, including teachers, parents, OUSD administrative leadership, and the OUSD Board of Education. This study is designed to contribute longitudinal research on the district’s small schools initiative, provide an informative, research-based framework for examining district policy, and communicate empirical findings that are accessible to a broad audience of educators and laypersons.

OUSD New Small Schools Initiative Evaluation 1
Manzanita Community School. Photo: Mindy Pines, courtesy of Oakland Unified School District
he School Redesign Network at Stanford University (SRN) submits this final re-port to complete the Phase II evaluation study of Oakland Unified School District’s (OUSD) New Small Schools Initiative from 2000 to present.1 This study builds on and extends the Phase I study completed in 2007 by Strategic Measurement and
Evaluation, Inc. (SME) by taking a deeper, longitudinal examination of the 45 new small schools, existing schools and district supports in the 2007-08 school year. This Phase II evaluation addresses questions raised by the Board of Education; district administrative leadership; community partners; and school principals, teachers, and parents based on the findings of the Phase I evaluation. These questions were incorporated into and informed three overarching research goals for SRN’s Phase II evaluation:
Research Goal #1To understand how well new small schools and existing schools in OUSD are perform-ing over time, taking into account the stu-dents they serve and their process of start-up and development.
Research Goal #2To understand what factors influence
Introduction
Tschools’ achievement and their improve-ment trajectories over time.
Research Goal #3To recommend policy strategies that can build on current successes and address iden-tified needs and issues.
SRN conducted quantitative and qualitative

School Redesign Network at Stanford University2
Individually, the cases provide valuable lessons; collectively, they form the basis of a cross-case analysis used to provide district policy recommendations. This re-port provides a brief history of Oakland’s small schools initiative; analyzes the value-added productivity of these and other OUSD schools, as well as other factors influencing schools’ ability to add value to student learning; and examines cases of high-performing schools that offer insights about policies and practices that can sup-port continued progress for schools and students.
analyses to address these research goals. Quantitative analyses of student achieve-ment on the California Standards Tests (CST) were used to develop estimates of academic productivity, a value-added mea-sure of student performance that controls for students’ demographic variables and prior achievement.2 Qualitative analyses were used to develop case studies that care-fully examined seven new small schools’ design features, developmental history, instructional characteristics, and capacity as well as the ways that those schools inter-faced with district policies and supports.
1. Throughout the report all references to “new” schools refer to the schools started in OUSD since 2000 as part of the district’s New Small Schools Initiative, and “old” schools are all other schools. Charter schools are not included in this evaluation.
2. The case study school selection process and methods are described in Appendix E.
Section Notes

OUSD New Small Schools Initiative Evaluation 3
Esperanza Elementary School. Photo: Mindy Pines, courtesy of Oakland Unified School District.
revious evaluations have provided in-depth analysis of the history of new small schools in OUSD. The following brief history of OUSD’s small school reform move-ment provides an overview of the district’s theory of action and systems context for the remainder of the report. By theory of action, we refer to the policy features
of OUSD’s Expect Success reform initiative, which commits to developing a portfo-lio of schools that will provide every family with at least two quality school options in their neighborhood and the ability to select from a diverse range of educational options throughout Oakland.1 One of the key underpinnings of this model is that schools will be given the autonomy to innovate and be responsive to the needs of their communities while the district concurrently adopts a “service” economy orientation that allows schools to purchase services from the district or other providers based on local needs.
Brief History of OUSD’s New Small Schools
The Expect Success reform initiative emerged from and reflects earlier, community-based efforts to reform Oakland’s schools. In 1997, Oakland Community Organizations began organizing for smaller and better schools for the children of Oakland.2 Much of the initial focus was centered on reducing the disparities between schools in the Oakland hills and more crowded campuses in the city’s lower-income “flatlands” neighborhoods. For example, some flatlands elementary schools had as many as 1,400 students crowded into school buildings built for 500.3 In 1999, the median enrollment in the elementary schools in the flatlands was 815, compared to just 315 in the more affluent Oakland hills. Student achievement tracked school size as well, with the smaller hills schools scoring well above the schools in the flatlands. The median school Academic Performance Index (API)4 ranking5 for elementary schools in the hills was 10, the highest score possible on a scale of 1 to 10,
Pcompared to 2.5 for elementary schools in the flatlands. In addition to being more overcrowded and lower performing than schools in the hills, many also described flatlands schools as less safe.
After a group of parents, teachers, community members, and district officials visited some innovative small schools in New York, these organizers began to push for small schools in Oakland. The Bay Area Coalition for Equitable Schools (BayCES) and Oakland Community
Organizations would soon become official district partners, and under Superintendent Dennis Chaconas, in May 2000, the OUSD Board of Education unanimously passed the New Small Autonomous Schools District Policy. Autonomous in this context refers to policies that give the school control over curriculum, instruction, and assessment decisions consistent with California state and district standards. Schools also were given increased authority over their budgets to reallocate funds based on local needs

School Redesign Network at Stanford University4
and priorities. Autonomy also included hiring of teachers and staff who fit the vision of the new school. OUSD has shifted away from the specific autonomies in the original new small schools policy in favor of polices that offer flexibility and room to innovate in exchange for accountability for student learning outcomes, many of which are outlined in the current Expect Success strategy. For example, new small schools now must apply for curricular flexibility after their first year, and they have full teacher hiring autonomy only in year one, per the collective bargaining agreement.
The New Small Autonomous Schools Dis-trict Policy created the framework for the district’s small school reform strategy and inspired the creation of the Office of School Reform, which began developing a propos-al to transform OUSD’s central office into a Local Education Support Network (LESN) by 2010. The vision was for the LESN, as a strategic leadership group, to support all schools with a lean central office staff while also giving schools the option to contract out for support services.6 In the 3 years af-ter passage of the new small schools policy, the district opened its first eight new small schools.7 ACORN Woodland Elementary also opened in the fall of 2000, a full year before the first schools designed under the district’s New Small Autonomous Schools Policy. It was created as Superintendent Chaconas’s pilot small school, and it was the first new non-charter school created in Oakland in 30 years.
In 2003, the three new small schools part-ners — OUSD, BayCES, and Oakland Community Organizations — commis-sioned an evaluation of district’s new small schools policy implementation.8 At the same time, OUSD was faced with district bankruptcy and a state takeover. Superin-
tendent Chaconas was replaced by state-ap-pointed administrator, Dr. Randolph Ward, who assumed leadership just as the evalu-ation was being completed. The evaluation results were largely positive, and in 2003, Ward moved the district to full implemen-tation of the New Small Schools Initiative. Since that time OUSD has opened 40 more new small schools.
Also in 2003, OUSD began experimenting with changes in its budget system, which resulted in the implementation of the Results-Based Budgeting (RBB) program, for the 2005-06 school year.9 This budgeting process was consistent with the Expect Success philosophy of empowering schools with more flexibility and maximizing resources at the schools. RBB provided an alternative to having teaching staff allocated from the central office based on a per-pupil staffing model that created great inequities because flatland schools tended to have more beginning teachers at the low end of the salary scale, but they could not use the cost savings to provide extra support for those teachers. The basic premise behind RBB is that each school receives money based on its student enrollment and attendance, so that the funding follows the students. Each school can then allocate the dollars as it chooses. Most importantly, the district uses a formula for RBB that is based on actual teacher’s salaries, so a principal with less experienced, less expensive teachers potentially can use the money saved from teacher salaries to purchase supports such as coaching, additional teachers, or other materials. RBB has since been rolled out to the entire district.
In 2004, as the new small schools initia-tive expanded districtwide, Ward brought the new school incubation process inside

OUSD New Small Schools Initiative Evaluation 5
the district and established the OUSD New School Development Group incubator. This district incubator helped community-based design teams clarify their visions and ex-plore best instructional practices. While it evolved over the years, incubation provided time, structure, and support to design teams engaged in new school creation.
Prior to the OUSD incubator, the new school incubation process was led by BayCES and was largely a voluntary process for coaching the writing of proposals for new small schools under the district’s New Small Autonomous Schools policy. The BayCES-led incubator later developed a formal curriculum and more defined design team process, including a process for converting large high schools and existing staffs and students into small high schools sharing a campus. BayCES led the incubation of 20 new small schools in Oakland from 2000-05, and from 2004-08 the district incubator launched 26 new small schools. Three schools (KIPP Bridge, MetWest High
School, and Oakland International High School) did not go through either BayCES or the district incubation because they were national models with their own principal leadership training and orientation.
By 2007-08, the district had opened 49 new small schools and closed three because of low enrollment and other problems (School of Social Justice and Community Empower-ment, Kizmet Academy, and East Oakland Community High School). In addition, one new small school (KIPP Bridge) became a charter school after its fifth year in the district, leaving 45 new small schools being operated by OUSD during the 2007-08 school year. The list of schools appears in Table 1 on pages 6-7.
While declining enrollment in OUSD has reduced the need for small schools as a remedy for overcrowding, creating or re-visioning new small schools remains a strategic option for academically struggling schools and for improving and increasing
MetWest High School student in fashion design internship. Photo: Greg Cluster, courtesy MetWest High School.

School Redesign Network at Stanford University6
School Year Opened Grades Served Incubation
ACORN Woodland Elementary 2000-01 K-5 None
Melrose Leadership Academy 2001-02 6-8 BayCES
International Commmunity School (ICS) 2001-02 K-5 BayCES
Life Academy 2001-02 9-12 BayCES
Urban Promise Academy 2001-02 6-8 BayCES
ASCEND 2001-02 K-8 BayCES
KIPP:Bridge 2002-03(Charter in 2007-08)
5-8 National Model
MetWest High School 2002-03 9-12 National Model
School of Social Justice and Community Empowerment
2002-03(Closed in 2004)
9-12 BayCES
Think College Now (TCN) 2003-04 K-5 BayCES
Mandela High School 2003-04 9-12 BayCES
Robeson School of Visual and Performing Arts
2003-04 9-12 BayCES
College Prep and Architecture Academy 2003-04 9-12 BayCES
Youth Empowerment School (YES) 2003-04 9-12 BayCES
Media and College Prep 2003-04 9-12 BayCES
East Oakland School of the Arts 2004-05 9-12 BayCES
Leadership Prep 2004-05 9-12 BayCES
Castlemont Business and Information Technology (CBIT)
2004-05 9-12 BayCES
EnCompass Academy 2004-05 K-5 BayCES
East Oakland Community High School 2004-05(Closed in 2007)
9-12 BayCES
Explore College Prep Middle School 2004-05 6-8 OUSD(after opening)
Manzanita SEED 2005-06 K-5 OUSD
RISE Community School 2005-06 K-5 OUSD
Sankofa Academy 2005-06 K-8 (changed to K-5 in 2007-08)
OUSD
Table 1: New Small Schools in OUSD*
Table continues on next page*Source: OUSD New School Development Group internal document

OUSD New Small Schools Initiative Evaluation 7
School Year Opened Grades Served Incubation
Reach Academy 2005-06 K-5 OUSD
Kizmet Academy 2005-06(Closed in 2007)
6-8 OUSD
EXCEL High School 2005-06 9-12 BayCES
BEST High School 2005-06(phasing out)
9-12 BayCES
Esperanza Elementary School 2006-07 K-5 OUSD
Fred T. Korematsu Discovery Academy (KDA)
2006-07 K-5 OUSD
New Highland Academy 2006-07 K-5 OUSD
Bridges at Melrose 2006-07 K-5 OUSD
Manzanita Community School 2006-07 K-5 OUSD
PLACE @ Prescott 2006-07 K-5 OUSD
Elmhurst Community Prep 2006-07 6-8 OUSD
Alliance Academy 2006-07 6-8 OUSD
Coliseum College Prep Academy 2006-07 6-12 OUSD
Roots International Academy 2006-07 6-8 OUSD
Peralta Creek Middle School 2006-07(phasing out)
6-8 OUSD
United for Success Academy 2006-07 6-8 OUSD
Futures Elementary 2007-08 K-5 OUSD
Community United Elementary 2007-08 K-5 OUSD(after opening)
Learning Without Limits 2007-08 K-5 OUSD
Global Family School 2007-08 K-5 OUSD
East Oakland PRIDE Elementary 2007-08 K-5 OUSD
Greenleaf Elementary 2007-08 K-5 OUSD
West Oakland Middle School 2007-08 6-8 OUSD
Oakland International High School 2007-08 9-12 National Model
Maxwell Park International Academy 2008-09 K-5 OUSD
Table 1: New Small Schools in OUSD (cont’d)

School Redesign Network at Stanford University8
school options in low enrollment areas such as North and West Oakland. SRN’s evaluation of the New Small Schools Initiative, along with previous evaluation studies, reflects a commitment to learning from ongoing reform efforts and using research to develop and refine district policy.
*Three new small schools were closed and one became a charter school. These schools are included in this summary table because they were a part of the New Small Schools Initiative for the time they were in existence.
**Two new small schools changed from one type of school level to another: Sankofa Academy changed from K-8 to K-5 in 2007-08, but was initially designed and opened as a K-8 school. Coliseum College Prep Academy was designed as a 6-12 secondary school, but was approved to open as a middle school and later received approval to expand to a 6-12 school over time, adding a 9th grade in 2008-09. This chart classifies both schools as “Other” grade configuration, based upon their original designs.
Table 2: Aggregated New Small School Starting Years*
School Level**
Number of schools started per year
TotalPre-2002
2002-03
2003-04
2004-05
2005-06
2006-07
2007-08
2008-09
Elementary 2 0 1 1 3 6 6 1 20
Middle 2 1 0 1 1 5 1 0 11
High 1 2 5 4 2 0 1 0 15
Other 1 0 0 0 1 1 0 0 3
Total 6 3 6 6 7 12 8 1 49
Aggregating the information in Table 2, below, in order to focus on when schools started, demonstrates that many of the new OUSD schools opened in 2005-06 or later: 80% (16/20) of new elemen-tary schools; 64% (7/11) of new middle schools; 25% (4/16) of new high schools; and 50% (1/2) of new other schools.
1. Expect Success school portfolio management flier.2. In addition, the Association of Community Organizations for Reform Now (ACORN), organized in one
community for the creation of one school, ACORN Woodland Elementary.3. ACORN Woodland Elementary home page. Author unknown. http://awe.ousd.k12.ca.us/about/small.
html4. The API is a single number, ranging from a low of 200 to a high of 1,000 that reflects a school’s
performance level based on the results of statewide testing. http://www.cde.ca.gov/ta/ac/ap/5. API ranks are established by deciles. Deciles are 10 categories of equal size from 10 (highest) to 1
(lowest), based on student test scores on state standardized tests. Two types of API ranks are reported, a statewide rank and a similar schools rank. California Department of Education, 2008. http://www.cde.ca.gov/ta/ac/ap/index.asp
6. Little, J. W. & Wing, J. (2003). An evaluation of the effectiveness of the Oakland Unified’s New Small Autonomous Schools (NSAS) policy. Oakland, CA. Oakland Unified School District.
7. Wing, J. OUSD timeline.8. Little & Wing, 2003.9. Murphy, K. (2007, March 3). MBA students try to fix Oakland schools’ budget. Oakland Tribune.
Section Notes

OUSD New Small Schools Initiative Evaluation 9
Analyses of School Productivityo understand student achievement in OUSD’s new small schools,1 SRN conducted a value-added productivity analysis2 to assess the effectiveness of particular schools and policies. By productivity, we mean a school’s capacity to add value to students’ learning in ways that disrupt the traditional relationship between school outcomes
and numerous variables and prior achievement. Because student achievement is influenced by student background characteristics, it is important to take into account factors such as prior achievement, socioeconomic status, ethnicity, and English language learner sta-tus. We included these factors in our value-added model, which compares achievement for each student with the achievement of similar students in OUSD throughout the time period studied (2002-03 through 2007-08).
The value-added model evaluates what each student’s achievement would have been in a given year, based on the factors described above, and then compares the students’ actual achievement with this estimate to get a measure of value added that can be attrib-utable to a school or a policy. Productivity is evaluated by looking at how a school’s students achieve on the CST in comparison to those in schools serving similar students. A productive school produces achievement that is significantly higher than this bench-mark. Based on statistical models (de-scribed further below), we classified schools as achieving at, above, or below this bench-mark.
We distinguish value-added models from a growth model because growth implies change in a single factor that is consistent over time. Given that the CSTs measure slightly different constructs at each grade level, it is impossible to measure year-to-year growth per se for individual students. Therefore, it is more precise to say that value-added, or productivity, is the differ-ence in projected versus actual achievement associated with a factor such as a school or policy.
In examining the effectiveness of the new small schools initiative, it is also important
to consider productivity, because the “new” schools differ from “old” schools in their student demographics. This is not surprising because the “new” schools typically replaced lower-performing “old” schools in lower-income flatland communities. As can be seen in Table 3 (page 10), demographic differences between new schools and old schools suggest that new schools are more likely to have lower overall achievement (i.e., API scores), whether or not they are moving students ahead at a faster rate than old schools. Thus, it is important to not only know a school’s average level of achievement at a given time, reflected in API, but also its ability to accelerate student progress in achievement from year to year, which is reflected in productivity.
SRN’s quantitative analyses for this evaluation should be considered in light of the strengths and limitations of any research method. Because no single measure can fully capture a school’s effectiveness, it is important to incorporate multiple measures into any assessment of school quality. For example, OUSD’s tiering system3 is one important measure that incorporates a school’s program improvement status,4 its rate of growth in academic performance, and the presence of
T
School Redesign Network at Stanford University10
achievement gaps5 between subgroups of students. The productivity measures used here and in the Phase I evaluation, provide a complementary way of looking at school performance.
We conducted value-added analyses based on data on all OUSD schools included in the OUSD data warehouse from 2002-03 through 2007-08. These data did not include charter schools. Our productivity measures are aggregated to school-level averages for all of those years. We found that student-level background factors explained about two-thirds of the variability in achievement, leaving about one-third to be explained by other factors such as school quality, school policies, teacher characteristics, etc. This is summarized in Figure 1 (page 11).
We computed average productivity for OUSD schools in both English language arts (ELA) and math. Because such values can vary somewhat from year to year, we consider average productivity across multiple years to be a better estimate of a school’s effectiveness than productivity ratings in just 1 year. In order to reflect this, we assessed the average productivity for schools across 3 years (or 2 years for those started most recently),6 as well as rating schools for each year.
All OUSD schools are depicted in Appendix B, which shows 2- or 3-year average pro-ductivity (depending on years of operation) for both ELA and math. This table also shows the results of the OUSD tiering sys-tem for each school, so that these different ways of evaluating school performance can
Student Characteristics 2008Percent of Students
Difference
New Old
Latino 58.2% 24.3% 33.9%
English Language Learner 43.5% 22.6% 20.9%
Free or Reduced-Price Lunch 76.3% 57.9% 18.5%
Parent Ed Not a HS Graduate 24.8% 14.9% 10.0%
Parent Ed Unknown or Missing 46.0% 41.8% 4.2%
Male 50.9% 51.6% -0.6%
Parent Ed HS Graduate 16.2% 16.9% -0.7%
Other Ethnicity 4.3% 5.4% -1.1%
Parent Ed Some College 7.0% 11.0% -4.0%
Parent Ed Graduate School 1.2% 5.6% -4.5%
Parent Ed College Degree 4.9% 9.9% -5.0%
Other Asian 4.6% 10.8% -6.2%
African American 31.5% 39.9% -8.5%
White 0.8% 9.3% -8.5%
Chinese 0.7% 10.3% -9.6%
Table 3: School Placements for Different Demographic Groups, New vs. Old Schools

OUSD New Small Schools Initiative Evaluation 11
be compared.7 This table is the most com-plete depiction of the productivity ratings, and thus is a good resource for examining the results for particular schools.
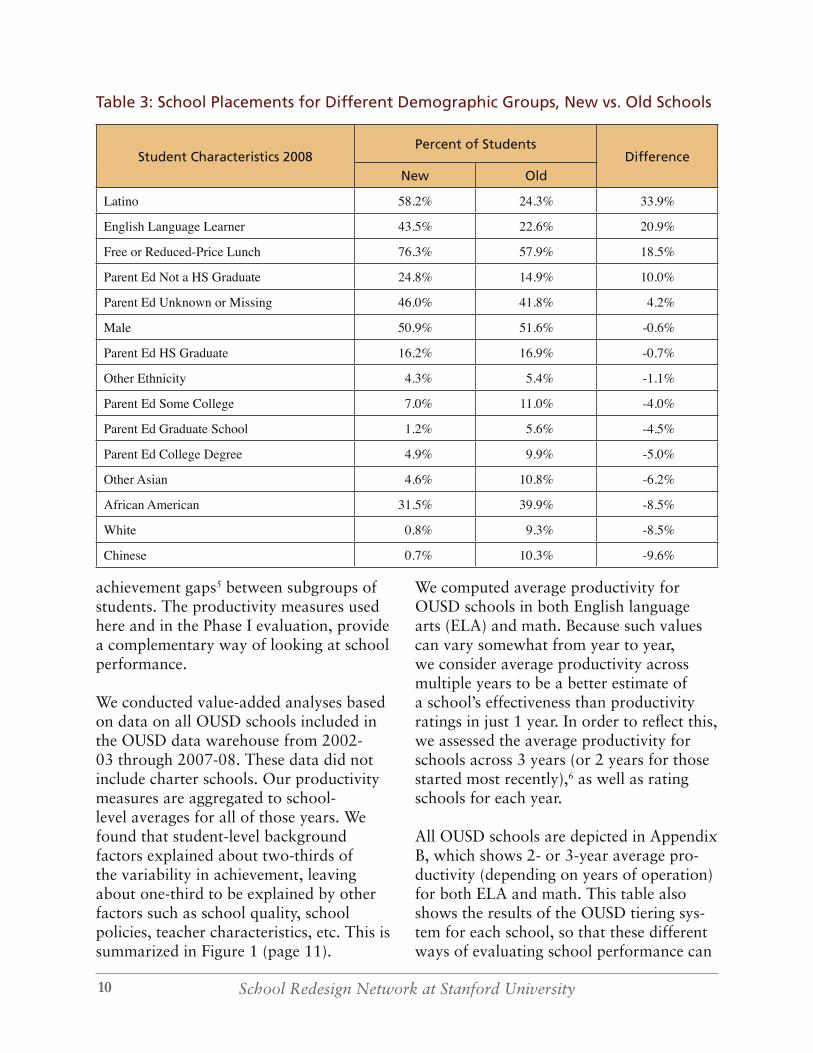
In order to provide a visual representation of the productivity of new and old schools, we created figures that depict “new” schools (red dots) and “old” schools (blue dots). On these figures, the vertical axis reflects the school’s API, and the horizontal axis reflects the school’s standard score points, or standard deviations. While there is no simple conversion of standard deviation to more familiar assessment scores, rough approximations can be made. For example, for students in the middle of the range, a difference of 0.2 standard deviations translates into about 8 percentile ranks (i.e., from 50th percentile to 58th percentile). The difference is slightly less for students further away from the middle of the distribution.
By schooling level (elementary, middle, high) the figures on the following pages (Figures 2a & 2b, Figures 3a & 3b, and Figure 4) depict each school’s 3-year aver-age productivity8 (for the years 2005-06, 2006-07, and 2007-08) on the horizontal axis. Schools to the right of the middle line were more productive than the average for all OUSD schools over this time period, and schools to the left of the middle line were less productive than average. Schools in the middle were about average.
When examining these figures, it is helpful to divide them into four quadrants. Schools (dots) in each of the four quadrants have different achievement profiles. Schools in the upper left quadrant have relatively strong overall achievement, but students are progressing at a slow rate. These schools would tend to be overrated by just lookingat overall achievement (i.e., API scores) and not looking at productivity, or value added by the school. Schools in the upper right quadrant demonstrate above-average performance and productivity, as is desirable. Students are progressing at a higher rate than similar OUSD students and also have
higher-than-average achievement levels. Schools in the lower left have below-average performance and productivity, indicating that students are not as successful on average as similar students in other OUSD schools, and also show slower progress. Finally, schools in the lower right quadrant show lower average levels of performance, but are gaining more rapidly than other schools. If they continue, they would be expected
to move to stronger average performance. As a general rule, new schools tend to be better in productivity than they are in overall achievement (API), and thus would tend to be underrated if one only uses the API to evaluate their performance without also looking at productivity.
The results for new and old schools mostly overlap, but some differences can also be discerned. With regard to productivity, new
*Student-level predictors: Prior year’s CST score, EL status, SES, ethnicity, parent education, gender, retained in grade, correction for test di�culty by grade.
69.6%
30.4%
student-level
factors
school-level
factors
Figure1. Percent of ELA Variance Explained*
School Redesign Network at Stanford University12
Three Year Average Productivity - ELA0.4000.2000.000-0.200-0.400
API
Gro
wth
200
8
1000
800
600
400
200
New Schools"Old" Schools
schools were higher than old schools at the elementary level and substantially higher at the high school level than old schools. At the middle school level, new and old schools were about equally productive in
ELA, and old schools were more productive than new schools in mathematics. However, two-thirds of the new small middle schools had only 2 years of data at the time of this study, suggesting that these schools were in
Figure 2a. API and Three-Year Average* Productivity: Elementary ELA
Old Schools Mean = -.01 New Schools Mean = .03
Three Year Average Productivity - Math
0.400.200.00-0.20-0.40
API
Gro
wth
200
8
1000
800
600
400
200
New Schools"Old" Schools
Old Schools Mean = -.01 New Schools Mean = .03
Figure 2b. API and Three-Year Average* Productivity: Elementary Math
*Six new schools have only two years of data.
*Six new schools have only two years of data.

OUSD New Small Schools Initiative Evaluation 13
Three Year Average Productivity - Math
0.400.200.00-0.20-0.40
API
Gro
wth
200
8
1000
800
600
400
200
New Schools"Old" Schools
Three Year Average Productivity - ELA0.4000.2000.000-0.200-0.400
API
Gro
wth
200
8
1000
800
600
400
200
New Schools"Old" Schools
Figure 3a. API and Three-Year* Average Productivity: Middle School ELA
the early stages of becoming more academi-cally productive.
We did not analyze math productivity at eighth grade and higher because the CST
math tests are aligned with specific courses (i.e., Algebra 1, Geometry, etc.). Given the variation in students’ course-taking (and the various assessments linked to particular courses), it is difficult to develop a single
Old Schools Mean =.00New Schools Mean = -.01
Old Schools Mean =.04New Schools Mean = .00
Figure 3b. API and Three-Year* Average Productivity: Middle School Math
*Six new schools have only two years of data.
*Six new schools have only two years of data.

School Redesign Network at Stanford University14
productivity function at the school level that encompasses secondary mathemat-ics beyond seventh grade. As a result, our secondary school productivity analyses (e.g., for eighth grade and above) focused on ELA only, and productivity analyses for middle school math only included sixth and seventh grades.
school lEvEl EFFEcts
As described above, we developed a productivity analysis to predict student achievement in ELA and math based on student-level factors, which gave us a measure of whether students at a given school were performing below, at, or above what would be expected for similar students in OUSD. As we describe in greater detail in Appendix A, we were able to assess the effects of policies by creating a school-level dataset and seeing which policies and features of schools were associated with different productivity.
Figure 4. API and Three-Year Average Productivity: High School ELA
Comparing new small schools with exist-ing district schools, we found that the new schools are slightly more productive than existing schools, and they tend to become more productive over time. Using the school-level data file, we explored the effects of school characteristics. In order to explore whether “new” schools improved over time, we predicted a school’s aver-age residual (which reflects the difference between actual performance and projected performance at the student level) by the number of years of a school’s operation. We found that for both ELA and math, additional years of operation predicted higher productivity, and at very similar rates. Specifically, for ELA, each year of operation was associated with an increase of .024 standard score units, and for math, each additional year was associated with an average of .022 standard score units. These amounts (.024 standard score units) roughly correspond to one percentile point per year. So, after 5 years of operation, the average student in a new school would be
“Old” Schools Mean = -.054 “New” Schools Mean = .008

OUSD New Small Schools Initiative Evaluation 15
education (e.g., workplace internships), advisory,10 and interdisciplinary coursework were all associated with positive productivity. While these features are more likely to be associated with the new small high schools on a schoolwide basis, certain features such as career/technical education were noted as being present in some existing high schools as well. We cannot say that these policies caused the higher productivity, but schools using them were able to raise achievement in ELA at a faster rate than other schools with similar students. The size of the productivity effects would be associated with a difference in about 4 percentile points of growth per year for many students. We re-ran this analysis for 2007-08 and found results that were very similar to those for 2006-07, and these results can be found in Appendix D.
In addition to school design features, we also examined the relationship between school staff characteristics and produc-tivity. Figure 6 shows the differences in productivity associated with average years of experience for teachers, percentage of first- and second-year teachers, and new versus old schools. These estimates should be interpreted by recognizing that they reflect the difference in productivity while holding the other factors constant. For example, a new school would have, on average, a .049 higher productivity (in standard score units) than an old school when they have the same average teacher experience and the same percentage of first- and second-year teachers.
The meaning of the effects for years of teaching experience and percent of new teachers warrants additional explanation. Although productivity varies across years of teaching experience, the overall aver-
gaining 5 percentile points per year beyond what they would have gained in an older school. While these amounts represent a small difference in any single year, over the course of several years they would represent a substantial increase in productivity. Table 4 below summarizes the average produc-tivity by years of operation in both ELA and math in OUSD’s new small schools. After the first 2 years, average productivity growth varies by year and subject area, but is consistently positive over time.
Table 4: Average New Small School Productivity by Years of Operation
Years of Operation
Average Productivity
ELA Math
1 0.00 0.01
2 0.01 0.00
3 0.03 0.12
4 0.05 0.07
5 0.02 0.07
6+ 0.12 0.11
The school-level productivity analysis helped us examine the relationship between school-design features, teacher character-istics, and productivity. SRN surveyed the district’s high school network executive officers, who serve as administrative su-pervisors that oversee multiple schools, to understand which school design features were prominent in each of OUSD’s new and existing high schools. We then assessed the relationship between these features and school productivity. Figure 5 (page 16) shows the high school design features that had a statistically significant effect on school productivity.
As can be seen, project-based learning, block scheduling,9 career/technical

School Redesign Network at Stanford University16
with two-thirds of this group being in their first year.
Furthermore, as is shown in Figures 8 and 9 (page 18), schools with large concentrations of African American and Latino students were especially likely to have the greatest proportion of first- and second- year teach-ers, as are schools performing in the lowest tiers of OUSD’s tiering system. (Figure 8 depicts this trend.) For example, schools with 60% to 80% African American and/or Latino students had an average of 21% of their teachers in either their first or second year. Schools with 20% or fewer African American and/or Latino students had an average of only 5% of their teachers in their first or second year.
We also conducted an analysis of the rate of new teacher turnover in new schools in OUSD using data from a random sample of new small elementary, middle, and high schools that was provided by the OUSD Beginning Teacher Support and Assessment
age years of experience is associated with positive productivity. However, as shown in Figure 6 (page 17), average productivity is negative with respect to teachers in their first and second years of teaching. When taking into account the units for each of these measures, each of the three factors (new versus old school, average years of experience, and percent first- and second-year teachers) would typically have similar effect sizes on a school’s productivity. The effects, when compounded over time, can have a profound impact on student achieve-ment. The same analyses conducted with data from 2007-08 returned similar results, and can be found in Appendix A.
The low productivity associated with first- and second-year teachers is of particular concern because their presence in OUSD has increased consistently over the past few years, as can be seen in Figure 7 (page 17). The proportion of novice teachers grew from 10% in 2004 to 24% by 2008, more than doubling in proportion over this time,
0.00
0.05
0.10
0.15
0.20
0.25
0.30
Interdisciplinary Courses
AdvisoryCareer/Technical Education
Block Schedule
Project-Based Learning
0.130.10 0.10
0.120.09
*Achievement versus expectation, holding constant prior test scores and student demographic characteristics
Figure 5: 2007 ELA Productivity* Associated with High School Characteristics

OUSD New Small Schools Initiative Evaluation 17
0.049
0.013-0.001 -0.217
-0.250
-0.200
-0.150
-0.100
-0.050
0.000
0.050
0.100
New School vs. Existing School
Average Years Teaching
Average Years Teaching Squared
Percent 1st and 2ndYear Teachers
Di�
eren
ce in
sch
oo
l-le
vel C
ST s
core
s p
eru
nit
di�
eren
ce in
pre
dic
tor
(sta
nd
ard
sco
res)
*Achievement versus expectation, holding constant prior test scores and student demographic characteristics.
All schools
0.0
0.1
0.2
0.3
0.4
0.5Total
2nd Year
1st Year
0.0
0.1
0.2
0.3
0.4
0.5
Perc
ent
of O
USD
Tea
cher
s
Proportion 2nd Year Teachers
Proportion 1st Year Teachers
2004
Year End
2005 2006 2007 2008
0.06
0.04
0.05
0.090.12
0.07
0.130.16
0.090.08
Figure 6. ELA Productivity Associated with Teacher and School Characteristics (2003-07)
Figure 7. Proportion of First and Second Year Teachers in OUSD

School Redesign Network at Stanford University18
2%
3%
5%
7%
Perc
ent
of O
USD
Tea
cher
s
Percent of African American and Latino Students(2002-03 to 2007-08)
0%
5%
10%
15%
20%
25%
2nd Year Teacher
1st Year Teacher
<20% 20%-40% 40%-60% 60%-80% 80%-100%
2%
4%
6%
7%
14%
9%
5%
6% 5%
<1%
Perc
ent
of O
USD
Tea
cher
s
0%
5%
10%
15%
20%
25% 2nd Year Teachers
1st Year Teachers
Blue/Green Yellow Orange Red
7%
8%
9%
12%
*Schools in operation fewer than three years not included.
Figure 8. Proportion of First and Second Year Teachers is Highest in Schools with More African American and
Latino Students
Figure 9. Proportion of First and Second Year Teachers in Schools by OUSD Tiering* (2006-07)

OUSD New Small Schools Initiative Evaluation 19
(BTSA) office. Higher teacher retention rates slow the flow of new teachers coming into classrooms, a policy goal supported by a large number of studies that find that new teachers tend to be less effective than veteran teachers.11
These data underscore the importance of improving teacher retention rates, which has been an important area of policy focus for the district. In fact, Figure 10, below, shows that most of this sample of new schools had higher rates of new teacher retention and a lower rate of new teacher turnover than the OUSD average for new teachers. This finding suggests that a key
element of the district’s theory of action — that small schools would increase teachers’ satisfaction and reduce turnover — is gen-erally proving to be accurate. While we did not have data to explore the district- and school-level practices that support teacher effectiveness, retention of new and experi-enced teachers, and teacher pathways into and through the district, we recommend this as an important area for further study.
summary
Productivity analyses help illuminate the effectiveness of individual schools and poli-cies by giving an estimate of how various
0%
10%
20%
30%
40%
50%
60%
70%
80%
Reac
h Aca
demy
EnCom
pass A
cadem
y
EXCEL
Hig
h School
ACORN W
oodland
Man
zanita
SEE
D
Thin
k Colle
ge Now
Robes
on School V
is. &
Perf.
Arts
Urban
Prom
ise A
cadem
yASC
END
Man
dela H
igh Sc
hool
CBIT
College P
rep &
Arc
hitect
ure
Med
ia an
d Colle
ge Pre
p
Explo
re M
iddle
School
OUSD 3
Year
New
Teac
her A
vg.
Lead
ersh
ip Pr
ep
East
Oaklan
d School o
f the A
rts
Youth
Empow
erm
ent S
chool
Percentage of teachers hired in 2004-05, 2005-06, or 2006-07 no longer teaching in OUSD at the start of 2008-09
Figure 10. Three-Year New Teacher Turnover: New Schools versus District Average

School Redesign Network at Stanford University20
factors add value to student achievement while factoring in the influence of student-level demographics and prior achievement. By focusing on value added at the student level, the results provide a measure of whether students are progressing at a faster or slower rate than similar OUSD students. The productivity ratings provide a comple-mentary way to assess school effectiveness, along with other perspectives such as such as California’s API, OUSD’s multi-dimensional tiering formula, and a local contextual un-derstanding of a school’s particular strengths and challenges.
We used the 3-year average school-level ratings as a lens for evaluating individual school effectiveness, and found that new small schools have, on average, higher productivity than old schools and tend to improve over time. We found that a higher percent of first- and second-year teachers at a school was associated with lower productivity. The negative influence of first- and second-year teachers was especially noteworthy because OUSD has had an increasing proportion of such teachers in recent years, and they are especially concentrated in schools that have a large proportion of African-American and Latino students, and schools that are in OUSD’s lowest tiers. These findings suggest the importance of scaffolding new teachers in
Preparatory Literary Academy Of Cultural Excellence (PLACE @ Prescott). Photo: Mindy Pines, courtesy of Oakland Unified School District
the context of experience-balanced teaching faculties that can help provide support and development during new teachers’ formative years in the profession.
We also identified several practices that were associated with positive productivity at the high school level, including project-based learning, interdisciplinary courses, block scheduling, career/technical educa-tion, and advisory. This finding suggests the academic contribution of school design fea-tures associated with small school reform at the secondary school level.12
Although productivity analyses offer im-portant insights, they also have limita-tions. For example, because productivity describes whether students are, on average, progressing at a faster rate or slower rate than similar OUSD students throughout the time period studied, it represents rela-tive advancement in achievement. Positive productivity indicates students are progress-ing faster, on average, than similar OUSD students, but it does not necessarily mean that their progress is ideal or comparable to student progress in other districts.
It should also be noted that schools do not all face equal challenges, and so differences in productivity reflect not only the quality of a school’s practices but also its particular

OUSD New Small Schools Initiative Evaluation 21
challenges. For example, it has generally been found that schools with high concen-trations of students with low parent edu-cation levels or large numbers of English language learners may face greater chal-lenges in raising achievement. Therefore,
1. Throughout the report, all references to “new” schools refer to the schools started in OUSD since 2000 as part of the district’s new small schools initiative, and “old” schools are all other schools. Charter schools are not included in this evaluation.
2. An expanded description of the statistical method used can be found in Appendix A.3. OUSD places schools in five tiers (from high to low: blue, green, yellow, orange, and red) based on three
criteria: absolute performance, accelerated student level growth, and closing the achievement gap between different groups of students based upon state test scores. http://webportal.ousd.k12.ca.us/Default.aspx
4. Program Improvement is California’s designation for Title I-funded schools (schools serving students from low-income families) and Local Education Agencies that fail to make Adequate Yearly Progress on state standardized test scores for 2 consecutive years as mandated by the Federal No Child Left Behind Act (NCLB). http://www.cde.ca.gov/ta/ac/ti/programimprov.asp
5. By “achievement gap” we mean the difference in academic performance between different subgroups of students (e.g., African American, Hispanic, White, economically disadvantaged, special education, and limited English proficiency students). NCLB requires schools, districts, and state educational systems to meet annual targets for improvement in identified academic areas, including ELA and mathematics, as measured by state test scores—not only for their student populations as a whole, but for each of these identified subgroups. http://www.sedl.org/gap/gap.html
6. In addition to new schools open for 3 or more years, the averages include 12 new schools (6 elementary and 6 middle schools, one of which was subsequently approved to grow into a 6-12 secondary school) open for only 2 years. Given their earlier stage of development compared to the more established new schools, the 2-year schools may be in process of becoming more academically productive. The 8 schools in existence for only one year were not included.
7. OUSD’s tiering system in 2006-07 involved a two-step process for categorizing schools into one of five levels identified by color. In the first step, schools were categorized by program improvement status, and in the second step, this category could be shifted up or down one level according to its achievement growth and achievement gap.
8. Two-year productivity for six new elementary schools and six new middle schools with only 2 years of data9. Block schedules structure the school day so that students take fewer classes for longer periods of time.10. Advisory classes provide time for teachers to meet regularly with a small group of students to discuss
academic issues, career and college guidance, or other issues that may be beyond the traditional curriculum. Typically, the advisory teacher gets to know these students very well, and provides a strong element of personalization for secondary students who have multiple teachers throughout the day.
11. Darling-Hammond, L. (2000). Teacher Quality and Student Achievement. Educational Policy Analysis Archives, Vol. 8, No. 1 http://epaa.asu.edu/epaa/v8n1. For a recent example of a study showing low achievement for students of first-year teachers, see Hanushek, E., Kain, J, O’Brien, D, and Rivkin, S. (2005). The market for teacher quality. Cambridge, MA. (NBER Working Paper No. 11154). http://www.nber.org/papers/w11154
12. See, for example: Darling-Hammond, L., Ross, P., & Milliken, M. (2007). High School Size, Structure, and Content: What Matters for Student Success? In F. Hess & T. Loveless (Eds.), Brookings Papers on Education Policy 2006/2007. Washington, DC: Brookings Institution; Darling-Hammond, L. (2002). Redesigning Schools: What matters and what works (Stanford, CA: School Redesign Network); and Lee, V., & Ready, D. (2007). Schools-within-schools: Possibilities and Pitfalls of High School Reform. New York, NY: Teachers College Press.
Section Notes
while productivity is one way of examin-ing school effects on student outcomes, it does not account for all of the school-level challenges or advantages that may hinder or help efforts to achieve positive academic results.

School Redesign Network at Stanford University22
Case Study Summaries ase studies of six new small schools were developed to help inform the evaluation with a more nuanced understanding of school design features, instructional prac-tices, and the contribution of district-level policy supports. An additional case study of a seventh new small school, Oakland International High School (OIHS), was
developed for a separate research study, and is included here as an additional and comple-mentary window into the OUSD’s efforts to develop and support new small schools. The seven new small schools and their demographic data for 2007-08 are listed in Table 5 (page 24), followed by case summaries of each school. Policy lessons from a cross-case analysis are presented in this section of this report.
CASCEND. Photo: Copyright 2009 Hasain Rasheed Photography
Policy rationalE and KEy thEmEs For casE study schools
In addition to conducting quantitative analyses, SRN used qualitative methods to develop case studies that carefully exam-ined the school design features, develop-mental history, and instructional character-
istics and capacity of a sample of seven new small schools. The school selection process and case study methods are explained in Appendix E. The seven schools were pur-posely selected to address issues of policy interest and to provide a cross-section of new small schools by type (e.g., elementary, middle, high), type of incubation (BayCES,

OUSD New Small Schools Initiative Evaluation 23
when examined collectively they offer insight into district policies that may support schools more broadly. These cross-case policy findings are summarized in this report, and the individual cases are available at this link: http://www.srnleads.org/resources/publications/ousd/ousd.html (see links to specific cases at the end of each case summary, following). See Table 5 (page 24) for an overview of case study schools.
Although sites were selected in advance of the productivity analyses, Figure 11 (below) shows that during the 2006-07 academic year (the most recent data avail-able at the time of site selection), each of the case study schools had positive pro-ductivity for ELA.
OUSD, national model), years of operation (from 2 to 8), and neighborhood (north, west, east, central Oakland) (see Table 5, page 24).
The case studies use a common analytic framework that explores the following areas of school performance and functioning: (1) academic trajectory, (2) development story, (3) school learning climate, (4) instructional program, (5) professional capacity, (6) parent and community relations. This framework helps provide an understanding of how each school has been able to influence student outcomes and facilitates the development of cross-case themes. Thus, while each stand-alone case provides valuable lessons about school development and improvement,
Figure 11: Productivity of Case Study Schools
EXCEL
EnCompass Academy
ACORN Woodland
ElmhurstCommunity Prep
BEST
ASCEND
Old Schools
New Schools

School Redesign Network at Stanford University24
Table 5: Demographic Characteristics of Case Study Schools (2007-08)
School and grade levels
served in 2007-08
Year opened
Neighbor-hood
School size
% African American
% Latino % English language learners
% Free and
reduced lunch
ACORN Woodland Elementary
K-5
2000 East Oakland
246 19% 75% 70% 91%
EnCompass Academy
K-5
2004 East Oakland
236 30% 65% 56% 91%
ASCENDK-8
2001 Fruitvale Commu-
nity
332 10% 75% 53% 87%
Elmhurst Community
Prep6-8
2006 East Oakland
353 36% 59% 37% 82%
BEST(9-12)
2005 West Oakland
203 81% 8% 3% 64%
EXCEL (9-12)
2005 West Oakland
292 83% 7% 10% 55%
Oakland International High School
(9-11)
2007 North Oakland
93 8% 54% 100% 90%
Source: http://data1.cde.ca.gov/dataquest/

OUSD New Small Schools Initiative Evaluation 25
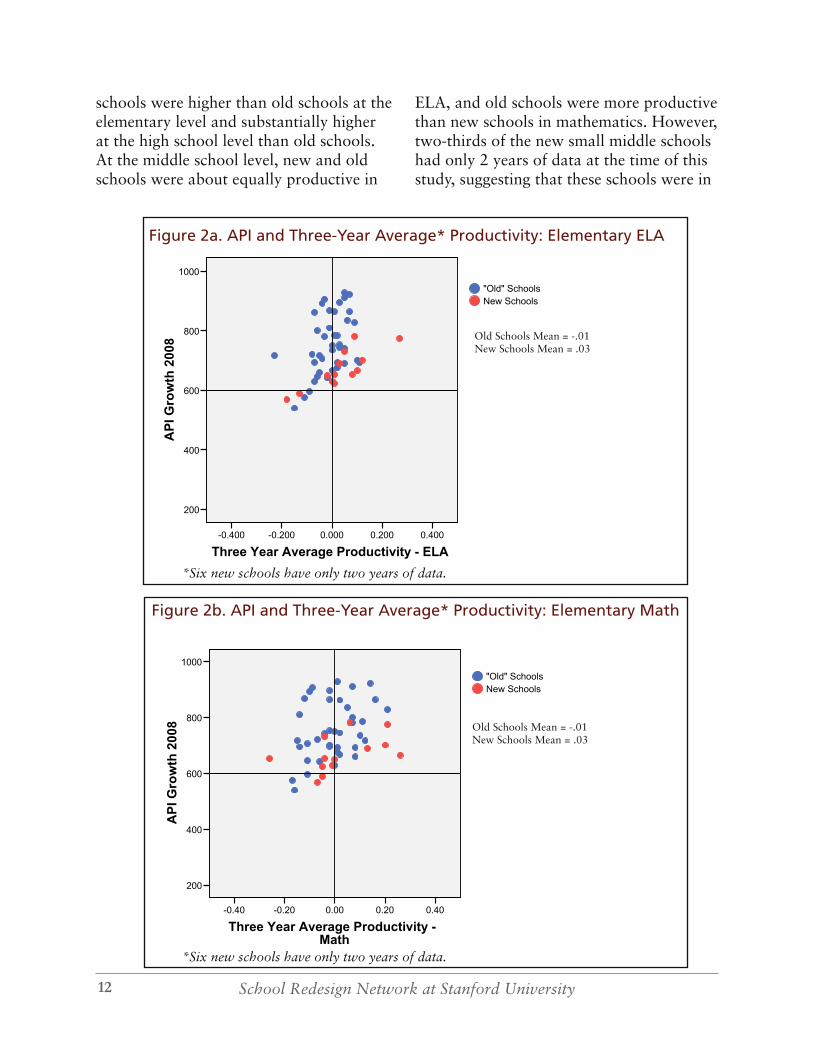
ACORN Woodland Elementary (ElEmEntary, oPEnEd 2000, East oaKland)
n 2000, ACORN Woodland Elementary (AWE) opened its doors to 206 students, grades K-5, in the East Oakland community. Launched in portable classroom buildings as Superintendent Chaconas’s pilot small school, the school was grandfathered into the first cohort of new small schools because it was the first new school opened in Oakland
in 30 years. Although AWE opened before the district had developed its small school incubator, AWE entered the OUSD incubator in 2004-05 with the goal of remaking itself to dramatically improve results for students.
ACORN Woodland Elementary. Photo courtesy of Oakland Unified School District
During the 12-month incubation process, AWE assembled a school- and community-based design team to articulate the school’s vision, culture, and theory of action. The design team then developed an aligned instructional program and implementation plan, including developing a budget, outlining a process for hiring teachers, designing curriculum and instruction, and engaging families and parents. AWE emerged from its “re-incubation” with a vision for a school in which students are active learners as they and their families begin preparing for
post-secondary education while they are in elementary school.
After going through the district incubation process, AWE began to realize student achievement gains, and today the school represents one of the sharpest academic turnarounds of any new small school. Its API scores have increased from 345 in 2001 to 774 in 2008, while enrollment has increased to 246 students. The AWE case demonstrates the success of “re-incubating” an existing school as a strategy
I

School Redesign Network at Stanford University26
for establishing a coherent instructional program and school culture.
The AWE case also highlights the dynamic nature of developing an effective school-wide literacy curriculum. Although the school was launched as an Open Court pi-lot school, implementation during the first few years was limited by a lack of teacher professional development. While improve-ments in implementation fidelity over time led to modest achievement gains, a plateau in student achievement inspired faculty to supplement the school’s literacy curriculum with strategies to improve their success with diverse learners, particularly English language learners, who make up a large portion of the AWE student body. AWE has modified and supplemented its literacy program to incorporate direct instruction aligned with peer assessments, reading workshops that tailor small group instruc-tion to students’ needs, and reciprocal teaching that encourages students to take turns summarizing, generating questions, clarifying, and making predictions based on specific segments of text.
In addition to strengthening the school’s literacy curriculum, AWE also focused
on improving student assessments and building instructional capacity through coaching and teacher-led professional development. In order to better align to the California state standards on what students should know and be able to do at each grade level, AWE developed its own assessment system. This system, based on a design used by New Leaders for New Schools, is aligned to state standards, administered four times per year, and provides more frequent and fine-grained data than the end-of-year CST. Attention to student assessments was complemented by instructional capacity-building through coaching and teacher-led professional development. Following its re-incubation, AWE invested heavily in coaches for teachers and school leaders. Over time, as the staff has become more experienced, the school has gradually decreased its investment in coaches and teachers have become increasingly responsible for leading professional development at the school site. The principal has facilitated this by building collaboration time into the school day and planning instructionally focused staff meetings that are often teacher led.
The complete case study can be downloaded at http://www.srnleads.org/resources/publications/ousd/cases/awe.pdf

OUSD New Small Schools Initiative Evaluation 27
EnCompass Academy (ElEmEntary, oPEnEd 2004, East oaKland)
nCompass Academy was designed to provide a positive educational experience for children in a high-need community. EnCompass was not designed to implement a predetermined model, but instead developed its program after conducting a community needs assessment. The founding principal organized a door-knocking
campaign in East Oakland to assess community needs and recruit parents for a design team. Once formed, the design team focused on a location in deep East Oakland for several reasons: 1) It was a very high-need area with several schools that were overcrowded and had chronic underachievement; 2) Opening a new small school in the area would reduce the size of one of the schools and give it a chance for making changes; 3) Compared to other Oakland neighborhoods, East Oakland also had underutilized land that could be developed for the school.
EnCompass opened by using a phase-in approach, starting with grades K-2 and growing each year by adding a grade level. EnCompass now serves 236 students in
Egrades K-5 and has experienced considerable success in raising the outcomes of its lowest performing students, even as it has addressed new challenges each year as it has grown.
A father works with his child at EnCompass Academy. Photo: Minh-Tram Nguyen, courtesy of EnCompass Academy

School Redesign Network at Stanford University28
EnCompass demonstrates that a school can effectively implement an instructional program designed to meet the needs of the whole child and achieve positive results on standards-based tests. EnCompass implemented a unique approach to education grounded in “the four life spirals”: the cultivation of self, the guidance and support of family, the engagement with communities, and the rootedness in ancestors and ancestral heritage. These four elements have helped foster a positive school climate and an effective instructional program that has improved the academic outcomes of its students.
EnCompass’ instructional program uses
a “responsive classroom” approach that emphasizes attention to students’ social, emotional, and academic growth as part of a strong and safe school community. School staff use this approach to help students link their actions to consequences, and understand that all members of the community have responsibilities to one another. The school’s investment in the whole child has returned dividends in achievement. EnCompass’ API has been above 700 for 2 of the past 3 years, and these gains reflect the school’s broad commitment to addressing the behavioral, emotional, and academic needs of its students rather than a narrow focus on raising test scores.
The complete case study can be downloaded at http://www.srnleads.org/resources/publications/ousd/cases/encompass.pdf

OUSD New Small Schools Initiative Evaluation 29
ASCEND (K-8, oPEnEd 2001, FruitvalE community)
SCEND opened in August 2001 with 171 students in the former Dewey Alterna-tive School building in the Fruitvale neighborhood. ASCEND was originally located beneath an elevated railway that forced teachers to frequently pause in their in-struction as local Bay Area Rapid Transit trains passed overhead. The school now
occupies a new district-built facility that opened in 2005. Using a phase-in approach to growth, the school began with grades K, 2, 4, 6 and is now a K-8 school enrolling 332 students. ASCEND was formed by parents who mobilized around the concept of a small, community-based school where teachers would welcome and respect their engagement and have high expectations for their children. The parents partnered with a group of OUSD teachers to draft the proposal for ASCEND, and have continued to work closely with the school and support the initial vision. The ASCEND case study highlights a highly productive “mature” small school serving a high-minority population that was “co-creat-ed and co-owned” by the local community and school district.
The ASCEND case study illustrates the development of a coherent instructional program focused on project- and commu-nity-based learning. ASCEND’s curriculum was inspired by the Expeditionary Learn-ing/Outward Bound school model that pro-motes rigorous and engaging curricula and active, inquiry-based pedagogy. Over time, staff have adapted and customized this approach to fit the local context and meet student needs. For example, in contrast to the model’s semester-long, interdisciplinary, project-based “learning expeditions” for students, ASCEND has switched to shorter
ASCEND students. Photos: Courtesy of Oakland Unified School District
“mini-expeditions” in grades 4 through 8. This adaptation retains the active-learning orientation of expeditions while allowing teachers to address multiple standards that were often missed during the semester-long assignments. Similarly, rather than blending mathematics as part of larger expeditions, teachers focus on content-specific lessons to ensure that students have ample opportuni-ties to learn critical topics and concepts.
ASCEND has built instructional capacity and community support for its interdisci-plinary and arts-infused curricula by invest-
A

School Redesign Network at Stanford University30
they are supported by an active Family Re-source Center that serves as a communica-tion and distribution hub for multiple social and educational services.
ASCEND’s instructional program has improved student performance. Between 2003-2007, ASCEND’s students out-performed similar students at other district schools on the mathematics and ELA portions of the CST. ASCEND’s similar school ranking has also improved over time, moving from a “2” in 2005 to a “5” in 2007.
ing in teachers and developing strong re-lationships among students, teachers, and parents. The school has used the districts Results-Based Budgeting policy to keep class sizes small and has fostered person-alization by having teachers “loop” with students so that they teach the same class or group of students for 2 or more years. Teachers also collaborate with one an-other to develop curriculum that orients students as problem-solvers and integrates the arts (visual arts, music, drama, poetry, etc.) into the learning process. Parents are an everyday presence at the school, and
The complete case study can be downloaded at http://www.srnleads.org/resources/publications/ousd/cases/ascend.pdf
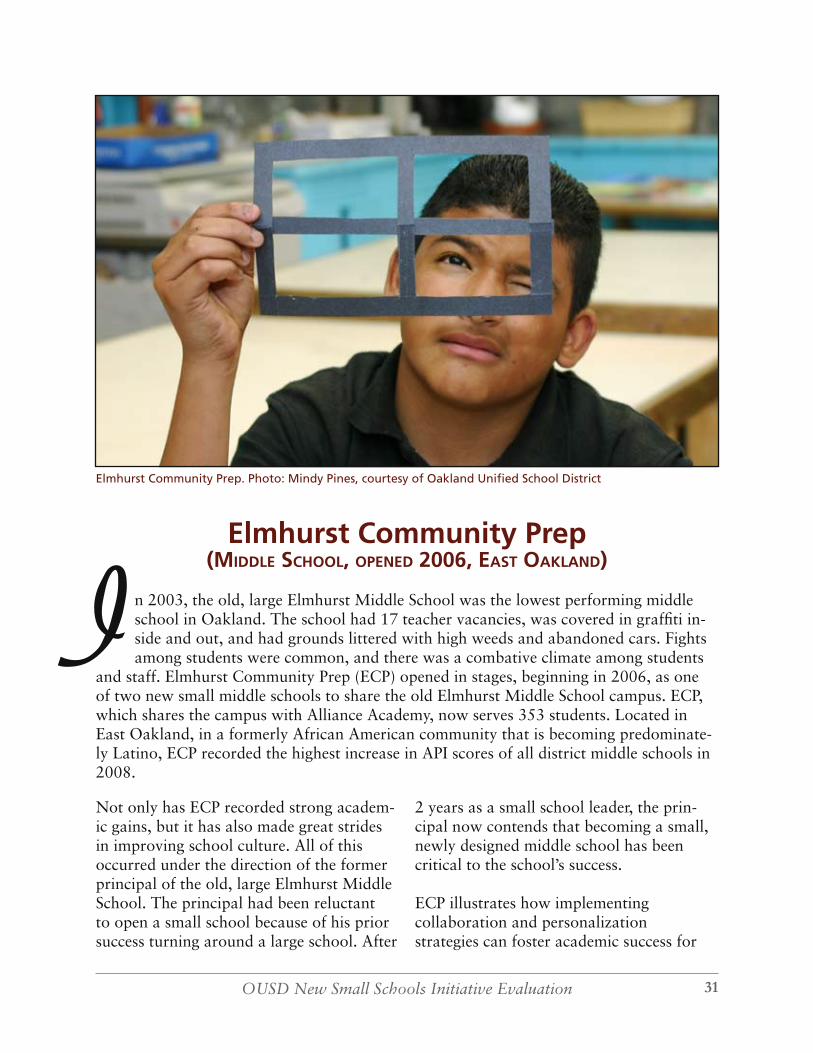
OUSD New Small Schools Initiative Evaluation 31
Elmhurst Community Prep (middlE school, oPEnEd 2006, East oaKland)
n 2003, the old, large Elmhurst Middle School was the lowest performing middle school in Oakland. The school had 17 teacher vacancies, was covered in graffiti in-side and out, and had grounds littered with high weeds and abandoned cars. Fights among students were common, and there was a combative climate among students
and staff. Elmhurst Community Prep (ECP) opened in stages, beginning in 2006, as one of two new small middle schools to share the old Elmhurst Middle School campus. ECP, which shares the campus with Alliance Academy, now serves 353 students. Located in East Oakland, in a formerly African American community that is becoming predominate-ly Latino, ECP recorded the highest increase in API scores of all district middle schools in 2008.
IElmhurst Community Prep. Photo: Mindy Pines, courtesy of Oakland Unified School District
Not only has ECP recorded strong academ-ic gains, but it has also made great strides in improving school culture. All of this occurred under the direction of the former principal of the old, large Elmhurst Middle School. The principal had been reluctant to open a small school because of his prior success turning around a large school. After
2 years as a small school leader, the prin-cipal now contends that becoming a small, newly designed middle school has been critical to the school’s success.
ECP illustrates how implementing collaboration and personalization strategies can foster academic success for

School Redesign Network at Stanford University32
students. ECP uses grade-level teams as the foundation for setting high behavioral and academic expectations for students. At each grade-level, teachers collaborate on curriculum, instruction, and assessment development. Teachers have worked together to supplement and enrich district curricula, create benchmark assessments aligned to the school’s curriculum, and develop project-based end-of-year exhibitions of student work in each class. In addition, cohorts of students who travel from class to class within a grade level are given college names to develop bonds with each other, the school, and a college — all in a community that has historically sent few students to college.
ECP has also created an advisory program to support student personalization and family collaboration. Students meet in advisory 4 days a week for 40 minutes, with a grade-level teacher/advisor. Advisors are the key link between students and their families, and act as a point of contact for parents. Advisors also help students prepare to lead parent conferences that
take place three times per year. Students exhibit portfolios of their work at these conferences, each of which enjoys 90+% family participation. By personalizing the academic experience for students, providing opportunities for teachers to collaborate, and engaging parents on a regular basis, ECP has developed an instructional program that has demonstrated sustained growth in academic achievement.
ECP also illustrates how a co-incubation strategy for school leaders sharing a site builds a collaborative relationship that benefits both schools. Concurrent entry in OUSD’s new school incubator helped the principals of ECP and Alliance Academy establish a strong collaborative relationship that enhances their ability to cooperate and share resources within the same facility. The two schools share the library and gym, a strong instrumental music program, a newcomers program for newly arrived immigrant students, and several staff members. Co-incubation helped develop the basis for a very positive and mutually supportive relationship.
The complete case study can be downloaded at http://www.srnleads.org/resources/publications/ousd/cases/elmhurst.pdf

OUSD New Small Schools Initiative Evaluation 33
TMcClymonds Educational Complex:
BEST and EXCEL(high schools, oPEnEd 2005, WEst oaKland)
he McClymonds Educational Complex case studies help illustrate the strengths and challenges of converting comprehensive high schools into small schools that share an existing campus. McClymonds High School was converted to two small schools, Business Entrepreneurial School of Technology (BEST) and Experience eXcellence
Community Empowerment Leadership (EXCEL), in 2005. The conversion of the com-prehensive high school into two small schools was designed to provide students in West Oakland and across the district a choice between two high-quality schools, each with a distinct vision.
BEST and EXCEL have achieved positive academic trajectories that vastly improve upon the old McClymonds High School. Both schools have demonstrated positive API growth and improved graduation rates, with EXCEL showing the most improve-ment. EXCEL also substantially increased
the number of students completing A-G eligible courses that fulfill admissions re-quirements for the University of California and California State University. The per-formance advantage of EXCEL compared to BEST and the overall trend of declining student enrollment prompted the district to
EXCEL High School. Photo: 510 Media

School Redesign Network at Stanford University34
begin enrolling all incoming ninth graders in EXCEL in Fall 2008, leaving BEST as a grade 10-12 school for 2008-09.
EXCEL’s academic success reflects a comprehensive approach to raising expectations for students and improving instructional quality. Key instructional design features include career-themed academies in law and media studies that connect students to community-based projects. For example, students in the law academy have examined environmental issues in their neighborhood and traveled to Sacramento to advocate for change. EXCEL has also raised expectations for students by cultivating a college-going culture. The school does this by integrating the college application and financial aid process as part of the school’s advisory curriculum, encouraging and celebrating college admissions and supporting campus visits and ongoing communication with graduates currently attending college. Academic improvements at BEST share some similarities with EXCEL, such as the school’s focus on career-themed courses
in small business management, culinary arts and hospitality management, and construction and engineering. The school also shares a strong community focus, and requires students to perform at least 100 hours of community service before graduation.
The different rate of progress at the two schools — with EXCEL improving at a faster rate — partly reflects differences in leadership stability. EXCEL’s principal has remained constant from the school’s initial design process to the 2008-09 school year, whereas four different administrators have led BEST during the same time period. Discontinuous leadership hampered BEST’s ability to develop a new identity and vi-sion separate from the old McClymonds campus, while declining enrollment re-stricted the school’s ability to offer students a variety of curricular options. The case illustrates how EXCEL’s stable leadership, commitment to an ambitious educational vision for students, and instructional design features have helped transform school cul-ture and improve academic outcomes.
The complete case study can be downloaded at http://www.srnleads.org/resources/publications/ousd/cases/mcclymonds.pdf

OUSD New Small Schools Initiative Evaluation 35
Oakland International High School (high school, oPEnEd 2007, north oaKland “magnEt”)
akland International High School (OIHS) is part of the Internationals Network for Public Schools (INPS), a nonprofit organization that helps establish schools serving recent immigrant English language learners at the high school level.1 OIHS is the first school in the network outside of New York City, with another planned to open
in California for the 2009-10 academic year.
These schools have a strong track record of success in graduating students fluent in English and not only in sending most of their graduates to college but sending them college-ready. OIHS students come from 22 different countries and speak more than two dozen languages. The student popula-tion is roughly 50% Latino, 30% Asian, 10% African, and 10% other ethnicities. Twenty percent of the students are refugees from their home countries. The typical student entering OIHS has likely been in the U.S. for about 6 months, speaks a small
amount of English, lives in another area of Oakland, and has been separated from one or both parents for at least a year. Ninety percent of students qualify for free or reduced-price lunch. Many of the students have interrupted formal education and may have missed several years of schooling.
OIHS is a recent successful start-up that reflects current OUSD supports. The OIHS case shows how district policies that offer flexibility in budget, staffing, and curriculum support a school’s ability
OOakland International High School. Photo: Liliana Vargas, courtesy of Oakland International High School

School Redesign Network at Stanford University36
to meet unique student needs. It also demonstrates how the district can support school operations by providing facilities, and support instructional needs through coaching. The design of OIHS shows the extensive professional collaboration and development needed to support strong content and language instruction along with alternative assessments matched to student needs.
The instructional design of OIHS follows the educational model of the Internationals Network schools. It is based on project-based learning and heterogeneous student groupings, both by English language and academic ability levels. This mixed-level grouping helps facilitate students’ language acquisition in their subject area and ELA classes. There are no strictly English as a Second Language classes at OIHS, even though the entire student body is made up of English language learners. Instead, language development is integrated into every aspect of the program.
The teachers at OIHS also collaborate on creating common practices across the school — practices such as having a Word Wall posted in each room and sharing curriculum among teachers to ensure that students have consistency in all of their classes. The teachers meet weekly to talk about students and share curriculum. At every other meeting, teachers take turns sharing a project that they are working on to get feedback on how they
might improve it and how to add better scaffolding for struggling students.
The Internationals educational model relies on alternative forms of assessment that are appropriate for English language learners. OIHS has been given the autonomy to use the assessment systems that teachers find useful, and teachers have been granted a waiver from using the standard OUSD benchmark assessments in favor of using the math, literacy, and English writing assessments developed by the Internationals Network. For example, OIHS’s math teacher created a math benchmark that uses no English words in order to authentically test students’ math abilities, from basic arithmetic to the beginning of algebra, rather than requiring English proficiency to read the math problems.
Perhaps the largest portion of the school’s assessment program this year was the portfolio review process that all of its students completed at the end of the year. For their portfolio, each student is asked to write a reflection on him/herself as a member of the school community, as a student, and as an English language learner. Students orally present this statement, along with projects from two of their classes. They explain the project, the work that they did, and what they felt they learned. Students present to a panel of teachers and students who collectively grade the presentation using a common rubric.
The complete case study can be downloaded at http://www.srnleads.org/resources/publications/ousd/cases/oihs.pdf

OUSD New Small Schools Initiative Evaluation 37
Policy Lessons from Cross-Case Analyses ach school illustrates important themes unique to its specific context within OUSD. Collectively, key issues emerge from the cases that can help form the devel-opment of district policy. The cross-case analysis of case study schools suggests the following key characteristics that may contribute to effective school functioning
and productivity:
• Mission-driven principals who are proactively recruited and/or mentored to serve at their
schools.
• Faculties that are “balanced” with experienced and new teachers who are committed to their school’s mission.
• Extensive use of personalization strategies.
• Clear, coherent instructional programs focused on authentic, hands-on instruction.
• Analyses of student learning that are used to promote an academic culture, improve the instructional program, and inform teacher professional development.
• Commitment to parent and commu-nity outreach and engagement.
EColiseum College Prep Academy. Photo: Mindy Pines, courtesy of Oakland Unified School District

School Redesign Network at Stanford University38
Mission-driven principals who are proactively recruited and/or mentored to serve at their schools.
A key theme that emerged from our dis-trict- and school-level data collection was the critical role played by school principals. Several district leaders commented that principals drive school improvement in all schools, and that their effects on student outcomes are amplified in small schools. In small schools with committed and effective leaders, much of the leadership stability can be attributed to a succession planning process that cultivated future principals and gave them opportunities to develop critical competencies. In all but two case study schools, the current principals were either mentored by the previous principal as part of a succession plan (ASCEND, ACORN Woodland Elementary (AWE), EXCEL) and/or led the design team process (Elmhurst Community Prep (ECP), EnCom-pass Academy, EXCEL).
The principals at AWE and ASCEND obtained their positions as part of a school-site succession plan in which a previous principal mentored the future principal who took over the school at an agreed-upon time. Similarly, the principal at McClymonds High School mentored EXCEL’s principal in advance of launching the new small school. At one of OUSD’s new schools, Oakland International, the founding principal is a former Oakland Teacher of the Year winner, was on the founding faculty of another new small high school in the district, and was familiar with both the Internationals model and the process of starting a new school in OUSD. Her work in OUSD helped prepare her for the challenges of opening a new school, and provided a set of supportive contacts and relationships within the district.
Having a succession plan — rather than having outside principals assigned by the district — benefitted schools by building the skills of future leaders through school service and additional professional develop-ment. For example, at AWE the principal not only served as coach for teachers at AWE, but also received principal leadership coaching and training through New Lead-ers for New Schools. At ECP and 25 other new small schools, OUSD helped prepare principals through the district’s incubator and its first-year schools network and, in some cases, through coaching offered by the district or BayCES.
In addition to succession planning and mentoring, principals of case study schools are driven by a mission to serve historically underserved communities. They set high expectations for all students and display a strong commitment to their school commu-nities. Either through prior experience or concerted efforts to build ties to the com-munity, principals understand the challeng-es of working in underserved areas. They infuse their work with meaning and convey that same sense of purpose to their staff.
At EnCompass, prospective teachers must write an essay about why they want to teach in East Oakland as part of their appli-cation process. EnCompass’ principal rec-ognizes that to work effectively in a high-needs school, staff members must be aware of the community needs and acknowledge that their work extends beyond the class-room and academic content areas. The principal at AWE pays staff for doing home visits, which helps teachers understand their students’ lives, develop close relationships with families, and connects them to the school’s goal of providing opportunities for children living in poverty. ASCEND and EXCEL have used project- and community-
OUSD New Small Schools Initiative Evaluation 39
based learning to help students learn con-tent and empower them as change agents to improve their communities. At these and other case-study schools, principals have taken measures to help their teachers understand their communities and extend their schools’ educational charge well be-yond the walls of the classroom.
Faculties that are “balanced” with both experienced and new teachers who are committed to their school’s mission.
Being able to build a staff with diverse and complementary strengths reinforces the case study schools’ instructional programs in important ways. Blended staffs (i.e., those with a range of veteran and novice teachers) allow for powerful professional collaboration and are resource-efficient under the district’s Results-Based Budgeting system.
Case study school principals described their deliberate efforts to fill their found-ing staffs with experienced teachers. At ASCEND for example, the principal as-sembled a staff of founding teachers that ranged in experience from 3-23 years. School leaders suggested that it is important to have veteran teachers on staff to mentor younger teachers and provide stability, par-ticularly during the start-up phase. Veteran teachers were also helpful to schools as they implemented their professional learning communities (PLCs). The goal of the PLC model is to transform individual expertise into collective knowledge, a process facili-tated by bringing together teachers with dif-ferent levels of experience and expertise.
Even as school principals touted the ben-efits of veteran teachers, they also noted the important contributions made by novice teachers, particularly those whose knowl-
edge, skills, and interests are well aligned with their school’s mission and program. Early-career teachers can also help establish a new school’s norms and identity. As one school coach noted, new teachers are less likely to challenge a set of new instructional practices by stating, “This is how we did it at the old school.” While it is important to note that not all veteran teachers contribute instructional expertise and not all novice teachers help build a strong school culture, the case study schools suggest that having a blended teaching staff can be effective when there are enough new teachers to support change and enough strong veteran teachers to mentor the newer ones.
A blended staff also gives principals re-source flexibility under the districts Results-Based Budgeting system. Since Results-Based Budgeting uses actual (rather than average) salaries for school personnel, small schools that are staffed largely by veteran teachers face greater resource constraints than schools with balanced faculties. Such schools may encounter the prospect of larger class sizes, fewer course offerings, and reduced infrastructure investments. These effects are particularly strong at the high school level, given the costs of college counselors, paraprofessionals, and clerical staff that often support the core teaching and administrative staff.
An example of the resource constraints faced by small schools with mostly veteran teachers is BEST High School in the Mc-Clymonds Educational Complex. In 2007-08, almost half of the BEST staff had 25 or more years of teaching experience, with an average teacher salary of $64,755. By comparison, EXCEL High School on the same campus had a younger staff, with an average teacher salary of $45,093.1 Re-source constraints at BEST reduced overall

School Redesign Network at Stanford University40
staff support and put pressure on its faculty to limit course offerings and teach multiple preps (i.e., teach three to four different courses per day). The BEST principal esti-mated that a more balanced mix of novice and veteran faculty would free up resources for two additional teachers and a clerical position. BEST’s principal noted the dilem-ma he and other small school leaders face when attempting to hire quality instructors who are also experienced: a veteran faculty limits the overall funds available to hire support staff or pay for the programming options available to students.
Given the challenges faced by schools with a preponderance of either early-career or veteran teachers, having a balanced faculty appeared to help principals strike a com-promise between the financial incentives of hiring new teachers and the financial disin-centives of having a veteran-heavy faculty. Balanced faculties also appeared to pro-mote the complementary strengths of teach-ers at different points in their career paths, and allowed these strengths to be shared through the PLC at each site.
Extensive use of personalization strategies.
Consistent with national research on small schools,2 OUSD’s case-study sites made ex-tensive use of personalization strategies to improve student outcomes.3 Personalization strategies tended to vary by school level. Looping, where a teacher remains with the same students for multiple years, and home visits are more common at the elementary-level case study schools, whereas advisory programs, which facilitate relationship-building between adults and students and inform students’ academic decisions, are more common at the secondary (middle and high school) levels.
At two secondary case-study schools, EX-CEL and BEST, advisory periods are used to monitor academic outcomes and ensure that students are preparing themselves for college. At EXCEL, filling out college ap-plications, applying for scholarships, and applying for financial aid are all interwoven into the advisory curriculum to ensure that all students take these important steps. Ad-visory period is also used to check student transcripts and ensure they are meeting the A-G requirements as well.
ASCEND, a K-8 school, uses looping and adds an advisory period in the middle school grades. Advisory at ASCEND is called Town Hall, and meets once a week by grade level. The whole grade level (44-48 students) meets together to do com-munity-building activities, discuss current events, and convey school information. An eighth grader explains, “We get more atten-tion” at ASCEND. The student added that while it sometimes feels like their teachers “know too much about them,” she and her classmates would be doing far worse in school if they did not go to ASCEND.
At OIHS, a high school for recent immi-grants, teachers use multiple personaliza-tion strategies to help students acclimate to a new culture and build a foundation for academic success. OIHS staff recounted a particularly memorable case of a student who was repeating ninth grade after fail-ing all his classes at a comprehensive high school the year before. Early in the academ-ic year, the student spoke very little English, struggled academically, and was suspended for fighting. Through multiple home visits and discussions during advisory, the stu-dent’s teachers realized that he was in the U.S. without his family, renting a room and working in a pizza parlor at night. In re-sponse, they helped the student find a foster

OUSD New Small Schools Initiative Evaluation 41
care family and the personal and academic supports he needed to refrain from fighting and pass all of his courses.
Clear, coherent instructional programs that are focused on authentic, hands-on instruction.
The majority of case-study sites have developed rigorous, coherent instructional programs that connect to and extend the guidelines set forth by district and state accountability programs.4 The schools have demonstrated improvements on the CST, are more productive than the old schools they replace, and have for the most part done so by providing students with active learning opportunities such as project-based learning.5 Rather than relying on test preparation to achieve their academic goals, most school leaders in our case-study schools have developed clear visions of what academic success looks like at their school and aligned their instructional programs to offer rigorous and engaging curricula to achieve that vision.
At AWE, faculty reached consensus that students must be active workers in class and engaged with the world around them — not just passive recipi-ents of information. Committed to help-
ing all students reach academic proficiency, the school’s principal remarked: “We want to acknowledge improvement, but we don’t want to confuse improvement with profi-cient. The bar is set for students, and we do them a disservice if we don’t get them over that bar.”
AWE’s curriculum and instructional strate-gies are aligned to helping students realize its academic vision. The students improve their literacy through a workshop ap-proach, and math is taught through Si Swun, a math program developed by a Long Beach teacher that uses coopera-tive learning and asks students to present their math work and math reasoning to their classmates. AWE also offers a leader-ship class for fourth and fifth graders, and
students run much of the weekly assemblies, providing another op-portunity for them to be in control of their learning.
A coherent instruction-al vision is also evident at ASCEND, which is grounded in the Expeditionary Learn-ing/Outward Bound model and arts inte-gration.6 The school uses mini-expeditions to teach language arts and history standards or language arts and science standards. For example, in 2008 the seventh-grade humani-ties class did a mini-exhibition consisting of a digital portfolio on the abolitionist
EXCEL High School. Photo: 510 Media, courtesy of Oakland Unified School District

School Redesign Network at Stanford University42
movement, which included a biographi-cal sketch of an abolitionist. Similarly in eighth-grade science, the students studied the planets, turned the art room into a scale model of the solar system, and conducted tours of the room for other classes. Accord-ing to one teacher, “The test scores went up on the solar system. [Students] would walk you through, you would ask lots of questions, [and] the tour guide was so in-formed.”
In addition to Expeditionary Learning, ASCEND integrates the arts into the core content areas to facilitate and demonstrate student learning. ASCEND has made a commitment to the arts since its first year by funding one to three art teachers, includ-ing specialists in visual arts and music. Art teachers work with classroom teachers to co-design and co-teach integrated expedi-tions (units) that help students master core content and develop their skills in the arts. For example, in one seventh grade exhibi-tion on life cycles, the students built cages for Monarch butterflies and sketched the stages of the Monarch’s growth from larva to butterfly. ASCEND merges the arts and Expeditionary Learning/Outward Bound approaches through expeditions and mini-expeditions, and by ensuring that the two public Expositions of Student Learning (Expos) each year have an arts component.
At ECP, the school’s instructional vision centered around creating a student-centered learning environment, where, according to the principal, “We [adults] are hearing from [students], we listen to them, we are looking at their work. The conversations are centered on them rather than the teach-ers.” One way that adults listen to students is through the school’s advisory program, which provides a venue for sharing perspec-tives on the school’s instructional program
and a feedback loop that helps staff make adjustments where needed.
ECP leverages its instructional vision to es-tablish and create shared accountability for having high expectations for students. For example, one teacher described a profes-sional expectation to give homework every night and avoid instructional crutches, such as showing movies in class on the cusp of winter break. Student-centered accountabil-ity is also evident in the student-led confer-ences that ECP holds twice a year and that typically enjoy 90% parent-participation rates. Students use these sessions to present and describe their work to their parents and then set subsequent academic goals.
OIHS’s instructional vision is for teachers to collaborate on creating common prac-tices across the school — practices such as incorporating reflection into the end of each class and keeping vocabulary and strategy toolkits in students binders to ensure that students are hearing the same message in all of their classes. As a school serving an en-tirely English language learner population, the staff also focuses professional develop-ment time to make sure that the strategies teachers are using across classes are helping to support their students’ English growth. One teacher said:
The whole school is all ELLs, so the kids aren’t really isolated from the rest of the student population, they are the student population. So they get support everywhere, not just from one teacher.
In addition to creating common curricula, teachers meet every other Wednesday to share projects that they are working on to get feedback for improvement. These ses-sions, combined with weekly meetings to discuss student needs and curricula, help

OUSD New Small Schools Initiative Evaluation 43
teachers stay connected to the school’s in-structional vision.
Analyses of student learning that are used to promote an academic culture, improve the instructional program, and inform teacher professional development.
Across our case study schools, teachers and administrators use analyses of student learning (i.e., student work, assessment data) to promote an academic culture, improve the instructional program, and inform teacher professional development. At the elementary and middle school levels, AWE, ECP, and EnCompass all hold regu-lar school assemblies to publicly celebrate student academic success on the CSTs and/or the district’s formative benchmark as-sessments. ECP’s principal described the process by which celebrations became a strategy to promote academic culture: “We started doing elaborate award ceremonies, so kids got fired up; they were walking out of here with trophies, medals, and cer-tificates. You start to celebrate, and then people [staff] start to see that we are doing something here.” In fact, visitors to AWE and EnCompass after the weekly assembly are likely to find students walking around campus like Olympians, with medals draped around their necks for scoring pro-ficient or above on the district’s standards-based benchmark assessments.
At the high school level, EXCEL celebrates student success on CST and the California High School Exit Exam (CAHSEE),7 with additional and specific emphasis on college acceptance. EXCEL dedicates a wall in its main hallway to posting the college acceptance letters of its seniors, along with giving rewards for academic success that include hooded sweatshirts, iPods and
opportunities to visit colleges. All of these efforts combine to create a positive culture of academic measures of success and cultivate a climate where students value scholastic achievement.
All case study schools also analyze student-learning data to make important decisions about their instructional programs. For example, in 2007-08, 11 new small schools (7 elementary schools, including AWE, ASCEND, and EnCompass, and 4 secondary schools) applied for and received curricular flexibility. These schools’ decisions to apply for curricular flexibility largely reflected analyses of student achievement data that revealed challenges to increasing the academic achievement of diverse learners, particularly in ELA at the elementary level. These analyses spurred changes in the instructional program geared to supplementing the district’s elementary literacy program with a broader set of literacy practices.
At AWE, staff supplemented its literacy cur-riculum with a variety of literacy practices, including a workshop format, guided read-ing, and reciprocal teaching. The school also started a “reading buddy” program in which the older students read to the younger students each week. This program is, accord-ing to several younger students, their favor-ite part of school. These changes were all spurred by looking closely at student data. As AWE’s literacy coach explained:
We flattened out in our reading scores; it’s like 20% of kids were proficient. We weren’t seeing a lot of growth; it was pretty dismal. We needed to re-think things instructionally. When you walk into a classroom it is the teacher who is doing the reading, who is do-ing the thinking, not the student.

School Redesign Network at Stanford University44
Teachers have to work so hard to make meaning of the text for the student. So that translates to when you sit a kid in front of a test once a year and it’s the first time all year they’ve actually read on their own and been asked to make meaning of text, they aren’t going to do well. To ensure that students are making meaning of text; we have to release that responsibility to them. I created a schedule that allowed for using Open Court curriculum as the base and would fold in instruction to meet the students where they are.
Other school leaders feel similarly enthusi-astic about the new approach to literacy:
I hope more schools can start making this move toward having more of a standards-based approach, having expectations of kids to be the ones who are the thinkers and the learners and the readers. It’s been really exciting the shift we’ve seen here at [AWE], where kids are sitting in groups, they’re crying about books, they’re talking about books, they’re laughing about books, that just doesn’t happen usually. For whatever reason, there has been a loss of trust in students’ ability to do that.
Like AWE, EnCompass’ teachers are incorporating new literacy practices in response to stagnant language arts scores. Teachers suggested that the school, having established a strong base with Open Court, is focused on the Comprehensive Early Literacy Learning approach to supplementing language arts instruction. In 2005-06, school staff underwent Comprehensive Early Literacy Learning
training, which uses balanced literacy approaches emphasizing shared reading and teaching writing throughout the day.
In addition to using curriculum flexibil-ity to supplement its literacy program, EnCompass staff noted the importance of developing new standards-based assess-ments. One teacher said:
Even though we had some curricu-lar autonomy we had to use [exist-ing curriculum-based] assessments, so when we were planning, it felt like we were teaching to the test.
In 2007-08, EnCompass piloted stan-dards-based formative assessments de-veloped by Edison Schools8 and is in the process of refining its overall assessment system. These computer-based assess-ments are given monthly to students in math and reading, and consist of 20 multiple-choice questions designed to be given over a 40-minute time period.
One teacher described the school’s shift from curriculum-based to standards-based assessments by saying:
I like standards-based assessments. Last year I did [curriculum-embedded] assessments, and if you can’t read, you can pass the test because of all the other projects we do around the story. When it came to CST time, the students didn’t have experience doing it on their own. Standards-based assessment has shown me where the kids are on the standards. The test actually tests what the kids can do on their own, rather than remembering everything we did all week.

OUSD New Small Schools Initiative Evaluation 45
At ASCEND, analyses of student achieve-ment data prompted the staff to balance its commitment to expeditionary learning (a core component of the school’s Expedition-ary Learning/Outward Bound model) with the need to meet standards-based instruc-tional requirements demanded by the state accountability system.
Rather than continue with the semester-long, in-depth interdisciplinary expeditions that were the core component of ASCEND’s Expeditionary Learning/Outward Bound curriculum in its first few years, ASCEND switched to shorter, less interdisciplinary mini-expeditions. These shorter units better cover the numerous standards for grades 4-8 that were difficult to address comprehensively through semester-long expeditions. According to one of the school’s coaches:
From the beginning, the standards were not so important. The promi-nence of the standards and bringing up the CST has put a pressure on everybody, but has put a pressure on the middle school because there are so many standards they have to cover. That exacerbated the stress. It impacted the expectations. The kind of expeditions they did in the begin-ning, they can’t do now because there are so many standards to cover.
A third way that case-study schools use student achievement data is to inform deci-sions about teacher professional develop-ment. At several of our case study schools, teachers collectively analyze CST and/or benchmark assessment data and then collaborate on professional development designed to bolster instructional practices in the areas where student performance is lagging.
At ECP, for example, teachers examine student data at 6-week intervals connected to their curricular units and benchmark as-sessments. Every 6 weeks teachers present their units, assessments, and student data to their departments or grade-level teams, while working closely with administrators who provide instructional guidance. This process nests accountability as part of a larger system of professional collaboration and feedback.
ECP’s administrators use specific proto-cols to help create a positive culture of critique and reflection at the school. For example, teachers may share their work or a student’s work, and then the observers will share their critique, not to the teacher but to a third person, while the presenting teacher listens. According to one school administrator, this helps teachers more will-ingly engage in the critique process. “I’ve seen teachers use the protocols to push each other; it is done through the structure of a protocol,” the administrator said.
A similar view was proffered by ECP’s network executive officer, who praised the principal’s leadership in professional development: “He fosters an environment where all the adults challenge each other to do better and stretch and grow,” the network executive officer said. “They are always talking about how they are doing in the classroom, they are always looking at student data.”
Teacher data collected at ECP suggests the efficacy of the professional development model. According to data collected by the district, 100% of teacher respondents stated that PLC at ECP enabled them to discuss instructional strategies or best practices at least five times, and 81% of teachers stated that PLCs enabled them to

School Redesign Network at Stanford University46
tune or discuss lesson plans at least three times.9
At ECP and other successful small schools, professional development is an organiza-tional strategy grounded in the tenets and principles of PLCs, where all adults in the system display a strong commitment to building their capacity to help students learn.10 Student achievement data drives the professional development and curricu-lar innovations at these schools; academic programs are revised in response to gaps identified in the data. Some sites use money available through Results-Based Budgeting to purchase additional planning time for teachers. The extra time allows for com-mon grade-level or subject-area planning among teachers. Other schools bank time to allow for weekly collaborative profes-sional development, either in grade-level teams or as a whole staff. Although specific
structures may vary, small school lead-ers build teacher collaboration into the school day to supplement time provided after school and during dedicated staff development days.
Commitment to parent and community outreach and engagement.
A notable feature of several case study schools is their commitment to parent and community outreach and engagement. At two sites, AWE and ASCEND, community members in traditionally underserved areas were engaged in co-designing and helping launch the schools. At these and other case study schools such as EnCompass and ECP, there is specific ongoing attention to embracing families as critical contributors to student learning and well-being. As a result, many of our case study schools possess a strong
Alliance Academy. Photo: Mindy Pines, courtesy of Oakland Unified School District

OUSD New Small Schools Initiative Evaluation 47
engagement, such as home visits, telephone calls, and extensive school visitation opportunities were prominent at case study schools. At AWE and EnCompass, for example, teachers connect to families through home visits and open door policies for their classrooms. AWE received a grant to support teachers conducting two home visits per year, and at EnCompass, the principal often accompanies teachers on these visits. At both schools, parents are welcome to drop in and observe a class at any time. As students progress through the grade levels, multiple home visits help make parents feel like an integral part of the school, as evidenced by attendance rates that are higher than 90% at parent-teacher conferences.
ECP and EXCEL also actively engage and communicate with their parent communities. ECP employs a family coordinator to set up services for families, and all teachers call at least five homes per week with both negative and positive feedback. The school expects 100% attendance at its parent-teacher conferences, which, as noted earlier, are led by students. EXCEL held an extended “Open House” during which some 60 parents, guardians, and district staff sat in classes with students and later debriefed what they observed with the students, teachers, and the school principal.
Through multiple strategies, the case study schools have maintained their commitment to the communities they serve by embed-ding inclusive, family-friendly practices into their normal school structures. These prac-tices appear to help empower the parents and school communities to support positive academic outcomes for their children.
undercurrent of community pride and ownership.
At ASCEND, a Family Resource Center serves as a beacon and “home base” for parents. Locating the Family Resource Center in the heart of the school building also helps bring families into the school and helps them feel comfortable. It is not uncommon to see parents and their young children in the halls in the early morning, talking with each other and using the space.
The Family Resource Center is funded by Title I resources as well as Oakland Leaf, a community organization that receives fund-ing from a federal 21st Century grant and the Oakland Small Schools Foundation. Three family coordinators staff the center, each intentionally representative of the major ethnic groups on campus — Latino, African American, and Mien — in addition to a director of after-school programs.
ASCEND’s Family Resource Center pro-vides many valuable supports and resources to ASCEND families, many of whom face substantial financial struggles. For example, once a month, in partnership with a local social service agency, the center accepts clothes donations; weekly, in partnership with a local church, it hosts a food bank that serves about 62 families; each family can pick six items a week, including veg-etables, juice, milk, bread, and meat. The center also refers students and families to the neighborhood’s La Clinica la Raza for mental and physical health services. In ad-dition, the resource center offers classes to parents.
A variety of other strategies for improving parent and community outreach and

School Redesign Network at Stanford University48
1. School Accountability Report Card http://webportal.ousd.k12.ca.us/sarc/2. See, for example: Darling-Hammond, L., Ross, P., & Milliken, M. (2007). High School Size, Structure,
and Content: What Matters for Student Success? In F. Hess & T. Loveless (Eds.), Brookings Papers on Education Policy 2006/2007. Washington, DC: Brookings Institution; Darling-Hammond, L. (2002). Redesigning schools: What matters and what works. Stanford, CA: School Redesign Network; and Lee, V., & Ready, D. (2007). Schools-within-schools: Possibilities and pitfalls of high school reform. New York, NY: Teachers College Press
3. Darling-Hammond, L., Ross, P., Miliken, M. (2007) High School Size, Organization, and Content: What Matters for Student Success? Brookings Papers on Education Policy: 2006-2007. Washington, DC: Brookings Institution Press.
4. Coherent programs centered on high quality instructional practices have been consistently linked to improved student outcomes. See, for example, Elmore, R.F., (2006). Leadership as the practice of improvement: OECD. Coherent programs centered on high-quality instructional practices have also been linked to improved student outcomes. See Newmann, F. M., Smith, B., Allensworth, E., & Bryk, A. S. (2001). School instructional program coherence: Benefits and challenges. Chicago: Consortium on Chicago School Research.
5. It should be noted that while all case study schools have shown growth in raw scores and productivity, the biggest gains in test scores have been at the elementary level, and none of the case study schools have yet realized their achievement goals with regard to test scores (e.g., API).
6. Expeditionary Learning/Outward Bound (ELOB) is an approach to education that centers on learning expeditions: interdisciplinary units aligned with state and district standards. It is experiential and project-based, involving students in original research — with experts — to create high-quality products for audiences beyond the classroom. http://www.elschools.org/
7. The California High School Exit Exam (CAHSEE), is a test administered by the state to all 10th graders to determine if they possess the necessary skills in reading, writing, and math to qualify for high school graduation. Students may take the test multiple times. To earn a high school diploma, students must both pass the CAHSEE and satisfy local graduation requirements.
8. Edison Schools, Inc., is a for-profit agency that opened its first schools in 1995. It is now a part of Edisonlearning. (Edisonlearning.com)
9. Survey data collected at Elmhurst Community Prep by OUSD High School Administrator Susan Ryan, 2008.
10. DuFour, R. (2003). Building a professional learning community. The School Administrator, 60(5), 13–18.
Section Notes

OUSD New Small Schools Initiative Evaluation 49
Policy Observations and Considerations, and Study Conclusions
onsistent with OUSD’s efforts to provide high-quality schools in all neighborhoods, SRN suggests building on and extending existing policies that are helping to achieve this goal. The observations and considerations are clustered in three themes:
• Building and extending district policy supports for schools.
• Shaping the district portfolio of schools.
• Building on and extending district policy supports for teaching force development.
building and ExtEnding district Policy suPPorts For schools
OUSD has improved its districtwide API score by 73 points since 2004, the largest gain of any urban district in California serv-ing 20,000 students or more,1 and the new
Csmall schools have been a powerful engine driving that improvement. The district has put in place policies and practices that ben-efit small — and all — OUSD schools and have helped contribute to these gains. SRN suggests that the district continue to:
• Encourage district administrators and coaches to serve as thought partners and problem solvers.
Policies that promote a problem-solving orientation among district administra-tors and school coaches are highly valued by small school principals and teachers.
United for Success Academy. Photo: Mindy Pines, courtesy of Oakland Unified School District

School Redesign Network at Stanford University50
These leaders value their autonomy and are generally open to coaching, but resistant to bureaucratic mandates. As such, they tend to express a clear preference for district ad-ministrators and school coaches who serve as thought partners rather than compliance officers focused on adherence to district mandates. One way the district promotes a thought-partner approach is through its support for PLCs. These communities bring together teachers, administrators, and coaches to develop collaborative solutions to common challenges.
A similar preference for thought partners influenced attitudes toward schools’ dis-trict supervisors and coaches. For example, small school principals were much more likely to value the contribution of their pri-mary district administrative supervisor, the network executive officer, when the supervi-sor worked closely with school leaders to solve local problems rather than catalog ar-eas of compliance and non-compliance with district policy. Teachers, particularly at the elementary level, also positively responded to school coaches who worked closely with them to address instructional challenges. For example, teachers and principals in the elementary case study schools advocated for coaches who went beyond monitoring their level of curriculum implementation to supporting the use of a broad set of effec-tive literacy practices.
• Continue the supports that were provided to new schools and leaders through the OUSD incubator.
Among our case study schools, principals and teachers who participated in the dis-trict’s incubation process suggested the ex-perience was highly valuable in developing their school programs and focusing on rich and rigorous school designs. At one site,
AWE, a year-long “re-incubation” cam-paign, which took place during the school’s fifth year of operation, helped put the school on an achievement trajectory after a period of low academic performance. As the district moves away from creating more new small schools, it may wish to consider keeping in place many of the structures that helped teachers and administrators develop compelling school visions and coherent instructional programs. This is particularly important for schools that have high per-centages of new teachers and struggle with staff turnover, and as AWE’s experience suggests, re-incubating underperforming schools may be a productive alternative to closure.
• Look to small schools as sources of innovation and effective practices.
OUSD’s new small schools have helped boost the district’s overall academic pro-ductivity and have helped spur innovations such as Expect Success, which includes Results-Based Budgeting and curricular flexibility policies. While these policies have been enacted OUSD-wide, many district and school leaders suggested that they were developed in ways that reflect and sup-port the innovation taking place in the new small schools. District leaders should con-tinue to look toward many of these small schools for innovations and instructional practices that may benefit all schools if ad-opted and used throughout the system.
shaPing thE district PortFolio oF schools
Recent declines in student enrollment present difficult choices for OUSD leaders about where to allocate scarce resources and how best to shape the district’s portfo-

OUSD New Small Schools Initiative Evaluation 51
lio of schools. As OUSD balances its school portfolio, SRN suggests that district leaders consider the following:
• School productivity and achievement change over time and, thus, school development should be considered when deciding whether to expand, merge, or phase out schools.
As district administrators shape the overall portfolio of schools, they may wish to con-sider school productivity and achievement trajectory over time when deciding whether to expand, merge, or phase out schools. While performance measures such as the API and OUSD tiering system are impor-tant ways of evaluating schools, productiv-ity provides a complementary perspective focused on student gains compared to similar students in the district. Productivity analyses can help identify schools that are accelerating achievement and likely presage growth in other key academic measures. Achievement trajectory is also an important consideration. While schools with improv-ing trajectories merit particular attention, other schools (such as AWE) may be able to dramatically change their achievement trajectory through key leadership supports and re-incubation by the district.
• Consider academic returns on investments and costs of student failure as well as immediate fiscal costs.
In addition to schools’ immediate fiscal costs, another consideration for OUSD administrators is the academic return on investments and recurring costs of student failure, such as remediation and dropout prevention efforts. Although the current balance sheet warrants close attention, and closing or merging productive schools may result in a quick reduction of operating
costs, the prospect of higher future costs may more than offset any immediate sav-ings. Academic return on investments also includes analyzing schools’ cost per gradu-ate — a metric that rewards schools that re-tain students and help them stay on track to graduation. The long-term costs of student failure should also be accounted for with respect to decreases in lifetime earning (and thus tax revenues) associated with dropping out of high school.2
Possible alternatives to school closure include rethinking the administrative structure of small schools and looking at other programs for cost savings. For example, some districts have successfully implemented teacher cooperatives that decrease administrative costs and allow highly productive schools to remain open.3 Closing or merging a productive school may be the district’s final option, after other alternative cost savings measures have been exhausted.
• Consider expanding successful school models that are too small by proactively recruiting more students to these campuses.
OUSD may also wish to consider policies that expand successful school models by proactively recruiting students for success-ful small schools that may be underen-rolled, and by replicating models that are successful and oversubscribed. Given that the small school reform movement originat-ed in the district as a grassroots, communi-ty-based effort, it is desirable to maintain high levels of community engagement as the district shapes its portfolio of schools.
There are many examples of new and exist-ing schools with improving achievement

School Redesign Network at Stanford University52
trajectories throughout the district that leaders may use as exemplars for building its portfolio in conjunction with parents and community leaders.
• Beware of undefined mergers that merely combine campuses.
As OUSD’s portfolio of schools is devel-oped, it is advisable for district leaders to beware of undefined mergers that merely combine campuses. The case study schools illustrate that small schools have unique identities and diverse designs. Undefined mergers that merely join campuses or schools sharing a single campus out of convenience risk eroding strong school cultures and identities, and risk creating a dysfunctional, less productive school. This suggests that issues of school design and leadership be considered alongside location or convenience when considering a school or campus merger. And, just as many new small schools benefitted from an incuba-tion process that provided resources and autonomy to develop their instructional programs, similar supports are likely to facilitate successful school mergers.
building on and ExtEnding district Policy suPPorts For tEachEr
WorKForcE dEvEloPmEnt
OUSD has made important progress in developing policies that support teacher workforce development. SRN recognizes this accomplishment and suggests building on and extending these supports in the fol-lowing ways:
• Continue to build local pipelines into teaching.
The district has been developing a “grow-your-own” program for bringing local
young people and paraprofessionals into teaching and has been strengthening its relationships with local universities as well as its capacity to hire promising student teachers trained in Oakland. These initia-tives should be continued and strengthened to build the teaching pipeline in OUSD.
Additionally, the district has a vested interest in examining and developing a principal pipeline to supply the next generation of principals. While New Leaders for New Schools5 has emerged as an important resource for recruiting and training future school leaders, it fills a minority of the principal positions in OUSD. Additional strategies are needed, such as having current principals identify and mentor high-potential individuals at their respective school sites as possible successors or leaders of other campuses. As is evident in the case study schools, proactively recruiting and mentoring principals can make an invaluable contribution in developing the next generation of school leaders. While many principals may already be cultivating successors informally, the district may benefit from coordinated succession management efforts.
• Continue to move up hiring to earlier in the spring.
The district has already made important strides in filling teacher vacancies earlier in the year. However many schools report that they are unable to offer teachers contracts until August, losing promising candidates and leaving them little time for effective induction. District leaders could continue to move up the hiring window to more effectively recruit top-quality candidates. Complementing these steps would be to pri-oritize hiring experienced, qualified teachers

OUSD New Small Schools Initiative Evaluation 53
wherever possible — particularly given the growing inexperience of the OUSD teaching force as a whole. Evaluating dif-ferences in retention and effectiveness of teachers based on their pathways into the profession would help inform the district about promising pipelines for bringing talented professionals into OUSD.
• Refine the Beginning Teacher Sup-port and Assessment induction model.
One vital strategy for addressing teacher turnover issues is to refine the Beginning Teacher Support and Assessment (BTSA) induction model. Steps should be taken to improve the consistency of the BTSA model and to select BTSA mentors from within the school to assist new teachers in sustaining coherence to the school’s vision and instructional practice. Strengthening the existing Beginning Teacher Support and Assessment model may entail investing in coaches and their training (through Title I funding for highly qualified teachers), recruiting coaches to serve at sites where they teach, and using parcel tax revenues to develop incentives for developing strong teachers and attracting them to high-priority schools. These incentives may include, for example, monetary awards or mentoring support for completing certification through the National Board for Professional Teaching Standards.
• Continue working with the teachers association to reduce teacher turnover.
OUSD has put in place a strong strategic plan focused on recruitment and retention of effective teachers and school leaders, and should continue to work with the teachers association to reduce teacher
turnover, particularly in high-needs schools. This effort entails a careful examination of the factors that affect teacher retention in schools that continually struggle with high turnover, including leadership capacity, working conditions, hiring practices, and mentoring approaches.
• Continue efforts to project teacher demand and avoid unnecessary layoffs.
Part of the district’s current retention plan is to take measures not to lay off teachers in the spring based on preliminary budget estimates. In the past, OUSD lost many teachers to other districts due to this process, but the district has taken measures to project its actual hiring needs and retain more teachers.
conclusions
OUSD’s New Small Schools Initiative has made important progress in improving the educational opportunities for students in Oakland. Specifically:
• Over the period 2003-04 to 2007-08, new small middle schools have been, on average, about equally productive as older middle schools in English language arts (ELA), and less productive in math-ematics. However, two-thirds of the new small middle schools had only 2 years of data at the time of this study, suggesting that these schools were in the early stages of becoming more academically produc-tive.
• New schools become more effective and productive as they mature.
• New schools are helping increase student achievement and contributing to the dis-trict’s overall academic productivity.

School Redesign Network at Stanford University54
• At the high school level, particular school design features are positively associated with academic productivity. These fea-tures include:
~ Project-based learning~ Interdisciplinary courses~ Block scheduling~ Career/technical education~ Advisory
• Across school levels, school staffing strongly influences academic productivity. On average, having a greater proportion of less experienced teachers (i.e., those in the first or second year of teaching) significantly reduces schools’ academic productivity.
• A cross-site analysis of case study schools suggests key characteristics that may contribute to effective school functioning and productivity. These school character-istics are:
~ Mission-driven principals who are proactively recruited and/or mentored to serve at their schools;
~ Faculties that are “balanced” with experienced and new teachers who are committed to the school’s mis-sion;
1. OUSD press advisory, 2008.2. See, for example, Belfield, C. & Levin, H. (2007). The economic losses from high school dropouts in
California. (Research Report #1). Santa Barbara, CA: University of California, Santa Barbara, The California Dropout Research Project. http://cdrp.ucsb.edu//researchreport1.pdf
3. Milwaukee Public Schools, a district using a portfolio approach, supports teacher cooperatives, which are teacher-led schools, as a strategy to keep small schools open. The schools are small (100-200 students) and employ teacher-leaders rather than principals, providing substantial cost savings.
4. “Pink slipping” refers to notifying teachers that they may not have a job in the subsequent academic year due to low (and often underestimated) student enrollment projections.
5. “New Leaders for New Schools” (NLNS) is a non-profit organization that serves as an alternative program for administrative credentialing for those seeking positions in selected partner urban school districts, including Oakland.
~ Extensive use of personaliza-tion strategies;
~ Clear, coherent instructional programs that are focused on authentic, hands-on instruc-tion;
~ Analyses of student learning that are used to promote an academic culture, improve the instructional program, and inform teacher professional development;
~ Commitment to parent and community outreach and en-gagement.
As OUSD balances its portfolio of schools, it is important to maintain schools that demonstrate these features, and strive to cultivate such characteris-tics in schools throughout the district. Doing so will require close attention to policy supports (e.g., incubation) that helped many new schools develop their vision and create coherent instructional programs. Local communities were tremendous contributors to the earliest small schools and they are likely to re-main valuable partners in continuing to shape the district’s portfolio of schools.
Section Notes

OUSD New Small Schools Initiative Evaluation 55
PAppendix A: Regression Model
roductivity was estimated using data from 2002-03 through 2007-08 for schools in the OUSD data warehouse, and thus estimates compare student performance with OUSD students throughout that range of time (with 2002-03 as a baseline for productivity estimates of 2003-04). A similar regression model was used for both
ELA and math, with the primary difference being that ELA included grades 2-11, where-as math included grades 2-7. Above grade 7, CST math assessments are done according to the course taken, and so this element of student selection of course adds another fac-tor that would need to be modeled separately. We transformed CST scores from scale-score units into standard (Z-score) units so that they would be comparable across grades. Student-level variables included the prior year’s score in the same subject (ELA or math), and indicator variables for: English language learner status, student eligibility for free or reduced-price lunch, various ethnicities, parent education, gender, whether the student was retained, and grade level of the test. We included test level because CSTs have differ-ent difficulty at different grade levels. This regression model estimating student achieve-ment formed the basis for our productivity models for schools and various policies, as will be described later.
In the following tables, the coefficients represent the average difference in student achievement measured in Z-scores associated with a one-unit difference in each variable, holding all other variables constant. For indicator variables, a one-
unit difference means the presence of the indicator. For variables such as ethnicity, parent education, and grade that have multiple indicators, it is necessary to exclude one of the possible variables and use it as a reference group. In these cases,
Fred T. Korematsu Discovery Academy. Photo: Mindy Pines, courtesy of Oakland Unified School District

School Redesign Network at Stanford University56
coefficients for other variables in the group show the average difference for students in that group as compared with the reference group: Latinos for ethnicity, high school graduates for parental education, and grade 3 for test level. Productivity analyses are important for creating fairer comparisons of schools and the effects of school policies.
Table A-1: Model for ELA (standardized)
Variable Coefficient Std Error t P>t
Z-score ELA Prior .7247 .0021 337.95 0.000
English Learner -.2019 .0052 -38.55 0.000
Free or Reduced Lunch -.0529 .0040 -12.75 0.000
African-American -.1843 .0049 -37.93 0.000
Chinese .1635 .0069 23.76 0.000
White .1453 .0086 16.90 0.000
Other Asian .0659 .0060 10.96 0.000
Other Ethnicity -.0526 .0095 -5.51 0.000
Parent Grad School .1789 .0090 19.81 0.000
Parent College Grad .0770 .0063 12.16 0.000
Parent Some College .0421 .0061 6.92 0.000
Parent Not HS Grad -.0229 .0052 -4.38 0.000
Parent Unknown Ed -.0379 .0048 -7.96 0.000
Male -.0710 .0033 -21.22 0.000
Retained -.0190 .0093 -2.04 0.042
ELA grade 4 -.0141 .0064 -2.19 0.029
ELA grade 5 -.0300 .0065 -4.63 0.000
ELA grade 6 .0696 .0067 10.31 0.000
ELA grade 7 -.0132 .0067 -1.95 0.051
ELA grade 8 -.0344 .0068 -5.07 0.000
ELA grade 9 .0581 .0071 8.24 0.000
ELA grade 10 -.0829 .0071 -11.60 0.000
ELA grade 11 -.1560 .0076 -20.40 0.000
Constant .1938 .0078 24.96 0.000Adjusted R-squared = 0.6956
We estimated school productivity by including the elements shown in Table A-1 and also indicator variables describing whether a student was in a given school, clustering the standard errors for each school for a more appropriate estimate. The productivity estimated by this model provides an estimate of how much, on average, students at a given school differ in

OUSD New Small Schools Initiative Evaluation 57
achievement as compared to similar OUSD students throughout the period for which we have data. We ran separate models for ELA and math. Positive productivity values reflect schools where students are, on average, exceeding the projected performance as estimated for similar OUSD students, and the reverse is true for schools with negative productivity values.
Table A-2: Predictors of Math (standardized)
Predictor Coefficient Std Error t P>t
Z-score Math Prior .6975 .0028 247.74 0.000
English Learner -.1850 .0068 -27.37 0.000
Free or Reduced Lunch .0059 -.0708 -12.08 0.000
African-American -.1876 .0067 -28.03 0.000
Chinese .3100 .0100 30.92 0.000
White .1500 .0113 13.20 0.000
Other Asian .1480 .0087 17.02 0.000
Other Ethnicity -.0349 .0128 -2.72 0.007
Parent Grad School .1600 .0123 13.05 0.000
Parent College Grad .0756 .0091 8.30 0.000
Parent Some College .0397 .0084 4.75 0.000
Parent Not HS Grad -.0057 .0071 -0.81 0.418
Parent Unknown Ed -.0514 .0065 -7.94 0.000
Male -.0136 .0045 -3.00 0.003
Retained .1195553 .0149 8.04 0.000
Math grade 4 -.009317 .0069 -1.34 0.179
Math grade 5 -.040214 .0070 -5.76 0.000
Math grade 6 .0478239 .0073 6.56 0.000
Math grade 7 .0242381 .0074 3.29 0.001
Constant .1522562 .0099 15.33 0.000Adjusted R-squared = 0.6504
We did not include school-level variables because we thought it was more important to compare whether similar students were achieving at higher levels rather than whether schools were outperforming similar schools. We also ran another model for school productivity to check the results of this one by using the same regression but without indicator variables. Rather,

School Redesign Network at Stanford University58
we just compared whether the student-level residuals for each school differed significantly from zero. This second model resulted in very similar estimates of the magnitudes of school effectiveness, but was less likely to categorize schools as different from average in either the positive or negative direction. The results from the main model for school productivity are summarized in tabular form in Appendix B, and the results from the two-step residual-based model (which is less preferred in our view) in Appendix C.
In order to analyze the ef-fects of policies such as new schools versus older schools, the effects of teacher experience, etc., we again used the difference between projected scores and actual scores for individual students de-rived from the regression model described earlier. In this case, we created a school-level dataset based on averages of student characteristics. We ran a regression model with the average residual score for ELA as the dependent variable by including an indicator for “new” schools and teacher experience variables (percent first- and second-year teachers, average years teach-
ing, and average years teaching squared). We ran this model for both 2006-07 and 2007-08 and found very similar results for both years, with new schools and average years of teaching experience associated with positive productivity, and percent first and second-year teachers and average years of teaching squared associated with
negative pro-ductivity. The coefficients for teaching experience and teaching expe-rience squared indicate that teaching ex-perience is a positive factor up to a certain number of average years of experience at which point it begins to become less positive and at higher levels even becomes associated
with negative productivity. The exact num-bers for this trend vary in the two studies and are also conditioned by the percent-age of first- and second-year teachers, so it is more important to recognize the trend than to look at particular values at which teaching experience becomes associated with negative productivity. These coef-ficients can be interpreted as the average difference in productivity for a school when that factor is present, holding the others constant.
0.037
0.006-0.001 -0.234
-0.250
-0.200
-0.150
-0.100
-0.050
0.000
0.050
0.100-0.250
-0.200
-0.150
-0.100
-0.050
0.000
0.050
0.100
New School vs. Existing School
Average Years Teaching
Average Years Teaching Squared
Percent 1st and 2ndYear Teachers
Di�
eren
ce in
sch
ool-l
evel
CST
sco
res
per
unit
di�e
renc
e in
pre
dict
or(s
tand
ard
scor
es)
*Achievement versus expectation, holding constant prior test scores and student demographic characteristics.
All schools
Figure A-1. ELA Productivity* Associated with High School Characteristics (2003-08)

OUSD New Small Schools Initiative Evaluation 59
Perc
ent
of T
each
ers
Past six years 2007-08
2nd Year Teachers
1st Year Teachers
<20%
20%
-<40
%
40%
-<60
%
60%
-<80
%
80%
-100
%
<20%
20%
-<40
%
40%
-<60
%
60%
-<80
%
80%
-100
%
0
5
10
15
20
25
30
35
n=4A
n=25n=86
n=237 n=183
n=7
n=6 n=17
n=46
n=27
Percent of students receiving free and reduced-price lunch
School Program Improvement Status
Perc
ent o
f Tea
cher
s
2nd Year Teachers
1st Year Teachers
0%
5%
10%
15%
20%
25%
30%
35%
PI 4 or 5PI 3PI 1 or 2Not PI
n=14
n=36 n=14
n=13
Figure A-2. Proportion of First and Second Year Teachers in Schools by Percent of Students Receiving Free
or Reduced-Price Lunch
Figure A-3. Proportion of First and Second Year Teachers in Schools by School Program Improvement Status
(2006-07)

School Redesign Network at Stanford University60
Appendix B: School Ratings, OUSD 2006-07 Tiering and One-Step Productivity Analysis
s described in the text and in Appendix A, we computed productivity ratings for each OUSD school using data from the OUSD data warehouse in the years 2003-04 (2002-03 baseline) through 2007-08. We did this using a “one-step” procedure in which each school was included in the regression model as a dummy code, so
that students in it were compared with the average achievement of similar OUSD stu-dents throughout the time period studied. This numerical rating, if positive, indicates that students, on average, exceeded the projected achievement for similar students and, if negative, fell below the projected achievement of similar students. The quantity reflected indicates the average number of standard score units that students differed from similar students. For ease of reading, we coded the productivity ratings in a similar fashion to OUSD’s tiering colors. OUSD places schools in five tiers (from most productive to least: blue, green, yellow, orange, and red) based on three criteria: absolute performance, accel-erated student level growth, and closing the achievement gap.
The 3-year average was only computed if a school had 2 or more years of data, one year of which was 2007-08. The number of years of data for each school can be identified under the productivity column, with blank gray cells indicating that we did not have data for the given year. Schools are listed alphabetically and grouped by whether the school is “new” or “old” and by schooling level (elementary, middle, high, other). Data are shown on the following pages.
AThink College Now. Photo: Benj Vardigan, Oakland Small Schools Foundation

OUSD New Small Schools Initiative Evaluation 61
Productivity = Average difference in achievement compared with similar OUSD students (positive = good, negative = bad), measured in Z-scores.
Highly Positive ProductivityModerately Positive ProductivityAverage ProductivityModerately Negative ProductivityHighly Negative ProductivityN/A (fewer than 20 tested)
Overall TieringStep 1: School is categorized by PI Blue: (no PI status) Green: No PI Status Yellow: PI 0,1,2 Orange: PI 3 Red: PI 4,5Step 2: School can move UP or DOWN one tier based on Growth and/or Gap
2007:08 Growth Tiering Green: 3-4 points Yellow: 2 points Red: 0-1 points

School Redesign Network at Stanford University62
OUSD Tier
2007-08
OUSD Growth
Tier2007-08
Subject Productivity
Elementary School (New) 3- Year Average 2005-06 2006-07 2007-08
ACORN Woodland Elementary YELLOW GREENELA 0.27 0.14 0.2 0.48Math 0.21 -0.12 0.43 0.36
ASCEND (K-8) GREEN GREENELA 0.15 0 0.16 0.27Math 0.15 0.05 0 0.45
Bridges at Melrose ORANGE GREENELA 0.12 0.04 0.19Math 0.2 0.14 0.26
Community United Elementary New: Yr 2 (08-09) N/A
ELA -0.14Math 0.07
East Oakland Pride Elementary New: Yr 2 (‘08-09) N/A
ELA -0.21Math -0.17
EnCompass Academy YELLOW REDELA -0.02 0.14 0.12 -0.15Math 0 0.23 0.25 -0.22
Esperanza Elementary ORANGE GREENELA 0.1 0.01 0.19Math 0.26 0.3 0.22
Fred T. Korematsu Discovery Academy YELLOW YELLOWELA -0.13 -0.18 -0.09Math -0.05 0 -0.09
Futures Elementary New: Yr 2 (08-09) N/A
ELA -0.14Math -0.15
Global Family School New: Yr 2 (08-09) N/A
ELA -0.12Math -0.31
Greenleaf Elementary New: Yr 2 (08-09) N/A
ELA 0.13Math 0.13
International Community School YELLOW GREENELA 0.05 -0.03 0.03 0.14Math -0.04 -0.1 -0.09 0.06
Learning Without Limits New: Yr 2 (08-09) N/A
ELA -0.27Math -0.28
Manzanita Community School ORANGE GREENELA 0.03 0 0.06Math 0.13 0.14 0.13
Manzanita SEED YELLOW REDELA 0.01 0.05 -0.02Math -0.26 -0.18 -0.33
New Highland Academy ORANGE YELLOWELA 0 0 0.01Math -0.01 -0.06 0.03
PLACE at Prescott ORANGE REDELA 0.01 0.07 -0.06Math -0.05 0.02 -0.12
Reach Academy YELLOW YELLOWELA -0.18 -0.13 -0.19Math -0.07 -0.17 -0.04
RISE Community School YELLOW REDELA 0.08 -0.22 0.09 0.13Math -0.04 0.3 -0.11 -0.05
Sankofa Academy (K-8, K-5 in 2007-08) YELLOW GREENELA -0.13 -0.14 -0.22 0.09Math -0.12 -0.15 -0.22 0.08
Think College Now BLUE REDELA 0.09 0.06 0.3 -0.1Math 0.06 0.11 0.11 -0.02

OUSD New Small Schools Initiative Evaluation 63
Elementary School (Old)
OUSD Tier
2007-08
OUSD Growth
Tier2007-08
Subject Productivity
3- Year Avg 2005-06 2006-07 2007-08
Allendale YELLOW GREENELA 0.05 0.03 0.02 0.09Math -0.04 -0.27 0.01 0.08
Bella Vista GREEN GREENELA -0.06 -0.13 0.08 -0.13Math 0.07 -0.04 0.25 0.03
Brookfield RED GREENELA 0.11 0.08 0.13 0.12Math 0.08 0.05 -0.03 0.24
Burckhalter YELLOW YELLOWELA -0.01 0.04 -0.14 0.06Math -0.02 -0.14 0.04 0.02
Carl Munck BLUE GREENELA 0.01 -0.2 0.18 0.06Math 0.11 -0.05 0.16 0.23
Chabot BLUE GREENELA 0.05 -0.04 0.09 0.11Math 0.07 0.12 0 0.1
Cleveland GREEN GREENELA -0.07 -0.17 -0.09 0.07Math 0.02 -0.1 0.02 0.14
Crocker Highlands GREEN GREENELA -0.01 -0.07 0 0.04Math -0.12 -0.13 -0.11 -0.13
Emerson GREEN YELLOWELA -0.07 -0.11 -0.06 -0.05Math -0.14 -0.14 -0.18 -0.1
Franklin BLUE GREENELA 0.06 0.03 -0.09 0.24Math 0.05 0.1 -0.03 0.07
Fruitvale YELLOW GREENELA 0.03 0.07 -0.03 0.04Math 0.02 0.12 -0.06 -0.01
Garfield RED REDELA -0.04 -0.01 -0.04 -0.06Math -0.11 -0.11 -0.09 -0.13
Glenview GREEN GREENELA -0.05 -0.06 -0.04 -0.05Math 0.05 0.2 -0.02 -0.01
Grass Valley GREEN YELLOWELA -0.01 -0.17 0.21 -0.08Math -0.14 -0.36 0.04 -0.12
Henry J. Kaiser GREEN GREENELA 0.01 -0.05 0.05 0.02Math -0.02 0.04 0.19 -0.28
Hillcrest (K-8) BLUE GREENELA 0.17 0.24 0.17 0.11Math 0.1 0.24 -0.03 0.09
Hoover ORANGE GREENELA -0.05 -0.03 -0.07 -0.04Math 0.08 0 0.07 0.18
Horace Mann RED YELLOWELA -0.05 -0.1 0.11 -0.13Math 0.12 0.07 0.17 0.12
Howard YELLOW REDELA -0.23 -0.27 -0.23 -0.19Math -0.15 -0.04 -0.32 -0.07
Jefferson Phasing Out YELLOW
ELA -0.02 0.02 -0.07 0Math -0.06 0.03 -0.15 -0.05
Joaquin Miller BLUE GREENELA -0.04 -0.14 -0.02 0.03Math -0.1 -0.11 0.02 -0.23
La Escuelita BLUE GREENELA 0.09 0.08 0.06 0.13Math 0.21 0.22 0.19 0.21

School Redesign Network at Stanford University64
Elementary School (Old)
OUSD Tier
2007-08
OUSD Growth
Tier2007-08
Subject Productivity
3- Year Avg 2005-06 2006-07 2007-08
Lafayette RED YELLOWELA -0.07 -0.12 0.08 -0.19Math 0 -0.17 0.1 0.11
Lakeview YELLOW YELLOWELA -0.08 -0.19 0.06 -0.1Math -0.07 -0.33 0.11 0.03
Laurel YELLOW GREENELA -0.03 -0.09 0.01 -0.01Math 0.07 -0.02 0.08 0.14
Lazear YELLOW GREENELA 0 0 -0.06 0.06Math 0.02 0 -0.01 0.06
Lincoln BLUE GREENELA -0.03 0.04 -0.02 -0.11Math -0.09 -0.08 -0.09 -0.11
Lockwood Phasing Out RED
ELA -0.15 -0.2 -0.08 -0.19Math -0.16 -0.19 -0.04 -0.31
Markham GREEN GREENELA 0.1 0.05 -0.11 0.37Math -0.02 -0.05 -0.16 0.15
Marshall BLUE REDELA 0 0.15 -0.03 -0.13Math 0.1 0.2 0.1 -0.03
Martin Luther King Jr RED REDELA -0.06 -0.07 0.01 -0.13Math -0.11 -0.2 0.1 -0.24
Maxwell Park Phasing Out RED
ELA -0.09 -0.16 0.02 -0.1Math -0.11 -0.14 -0.07 -0.12
Montclair GREEN GREENELA 0.07 0.06 0.09 0.06Math 0.14 0.19 0.22 0.02
Parker GREEN REDELA 0.03 0.08 -0.04 0.04Math -0.02 0.09 -0.04 -0.1
Peralta GREEN GREENELA 0.07 -0.07 0.04 0.22Math 0.16 0 0.1 0.39
Piedmont Avenue GREEN GREENELA 0 -0.09 -0.02 0.1Math 0 -0.03 -0.1 0.12
Redwood Heights GREEN GREENELA 0.03 -0.01 -0.02 0.12Math -0.02 -0.05 -0.09 0.07
Santa Fe YELLOW GREENELA 0.05 -0.05 0.13 0.08Math 0.11 0.23 0.04 0.06
Sequoia GREEN GREENELA 0.02 -0.1 0.2 -0.03Math 0.05 -0.07 0.17 0.05
Sherman Closed N/AELA -0.19 -0.02 Math -0.23 0.04
Sobrante Park BLUE GREENELA 0.02 0.05 -0.18 0.16Math 0.01 0.14 -0.17 0.06
Thornhill GREEN GREENELA 0.05 0.12 0.06 -0.01Math 0.01 0.14 -0.02 -0.1
Webster Academy Phasing Out YELLOW
ELA -0.11 -0.09 -0.1 -0.17Math -0.17 -0.19 -0.2 -0.11
Whittier Phasing Out GREEN
ELA 0.02 -0.05 -0.02 0.2Math 0.01 0 -0.04 0.12

OUSD New Small Schools Initiative Evaluation 65
Middle School (New)
OUSD Tier
2007-08
OUSD Growth
Tier2007-08
Subject Productivity
3- Year Avg 2005-06 2006-07 2007-08
Alliance Academy YELLOW GREENELA 0.03 0.01 0.04Math 0.06 0.11 0
Coliseum College Prep ORANGE REDELA -0.04 -0.11 0Math -0.05 -0.09 0
Elmhurst Community Prep YELLOW GREENELA 0.12 0.04 0.19Math 0.2 0.29 0.08
EXPLORE ORANGE REDELA -0.09 -0.14 -0.07 -0.08Math 0 -0.12 0.05 0.1
KIPP Bridge College Prep Charter as of 2007-08 N/A
ELA 0.01 0.2 Math 0.26 0.28
Kizmet Academy Closed N/AELA -0.16 -0.16 Math -0.18 -0.21
Melrose Leadership Academy ORANGE YELLOWELA 0 0.03 -0.04 0Math 0.1 0.07 0.09 0.14
Peralta Creek (phasing out) ORANGE REDELA -0.17 -0.25 -0.08Math -0.2 -0.29 -0.02
Roots International Academy ORANGE REDELA -0.03 -0.02 -0.04Math -0.08 -0.02 -0.13
United For Success YELLOW YELLOWELA -0.01 -0.07 0.02Math -0.17 -0.26 -0.11
Urban Promise Academy RED YELLOWELA 0.09 0.16 0.1 0.02Math 0.03 0.03 0 0.07
West Oakland Middle New Yr 2 (‘08-09) N/A
ELA -0.08Math 0.08

School Redesign Network at Stanford University66
Middle School (Old)OUSD
Tier2007-08
OUSD Growth
Tier2007-08
Subject Productivity
3- Year Avg 2005-06 2006-07 2007-08
Bret Harte ORANGE GREENELA -0.01 -0.09 0.05 0.01Math -0.08 -0.18 0 -0.06
Calvin Simmons Phasing Out N/A
ELA -0.1 -0.13 Math -0.1
Claremont RED REDELA 0.02 0.07 0.01 -0.02Math -0.02 0.05 0 -0.12
Cole Phasing Out RED
ELA -0.11 -0.09 -0.15 -0.1Math -0.13 -0.12 -0.11 -0.19
Edna Brewer YELLOW GREENELA 0.04 0.02 0.02 0.08Math 0.05 0.02 0.04 0.1
Elmhurst Phasing Out N/A
ELA -0.06 0.07 Math -0.06
Frick RED REDELA -0.03 0.02 -0.09 -0.01Math 0.08 0.09 0.16 -0.02
Havenscourt Phasing Out N/A
ELA -0.03 -0.21 Math -0.13
James Madison RED YELLOWELA 0 0.05 0.02 -0.06Math 0.07 -0.06 0.01 0.31
Merritt Middle College HS N/A N/AELA -0.35 -0.11 Math
Montera YELLOW GREENELA 0.03 0 0.02 0.07Math 0.07 0 0.07 0.13
Roosevelt RED GREENELA -0.06 -0.03 -0.11 -0.04Math 0.05 0.01 0.02 0.14
Westlake RED GREENELA 0.02 -0.06 0.07 0.04Math 0.09 0.11 0.06 0.1

OUSD New Small Schools Initiative Evaluation 67
High School (New)
OUSD Tier
2007-08
OUSD Growth
Tier2007-08
Subject Productivity
3- Year Avg 2005-06 2006-07 2007-08
BEST ORANGE REDELA -0.02 0.01 0.03 -0.09Math
Business & Information Technology RED YELLOWELA -0.03 -0.09 -0.09 0.12Math
College Prep & Architecture Academy GREEN YELLOWELA 0.07 -0.03 0.15 0.07Math
East Oakland Community HS Closed N/AELA -0.26 0.13 Math
East Oakland School of the Arts RED REDELA -0.03 -0.03 -0.07 -0.01Math
EXCEL ORANGE YELLOWELA 0.18 0.2 0.17 0.15Math
Leadership Preparatory HS RED REDELA -0.02 -0.01 -0.04 0Math
Life Academy YELLOW YELLOWELA 0.09 -0.08 0.15 0.19Math
Mandela HS ORANGE REDELA 0.03 0.13 0 -0.02Math
Media & College Prep RED REDELA 0.01 0.04 0 -0.01Math
MetWest HS ORANGE REDELA -0.04 -0.01 -0.1 0Math
Robeson School Visual & Performing Arts RED REDELA -0.08 -0.14 -0.02 -0.08Math
Youth Empowerment School (YES) RED REDELA -0.07 -0.18 0.02 -0.01Math
High School (Old)OUSD
Tier
2007-08
OUSD Growth
Tier
2007-08
Subject
Productivity
3-Year Average 2005-06 2006-07 2007-08
Oakland HS RED REDELA -0.04 -0.08 -0.01 -0.03Math
Oakland Technical HS RED REDELA -0.06 -0.04 -0.07 -0.07Math
Skyline RED YELLOWELA 0.05 0.08 0 0.07Math

School Redesign Network at Stanford University68
Alternative Schools
OUSD Tier
2007-08
OUSD Growth
Tier2007-08
Subject Productivity
3-Year Average 2005-06 2006-07 2007-08
Alternative Learning Community (New) New: Yr 2 (‘08-09) N/A ELA
Math-0.13-0.32
Bunche Academy (Old) ALT N/AELA -0.16 -0.17 -0.15 -0.17Math
Dewey Academy (Old) ALT N/AELA -0.24 -0.2 -0.29 -0.23Math
Far West (Old) ORANGE REDELA -0.06 -0.24 0.08 0.02Math -0.28 -0.42 -0.03
Rubicon (Old) N/A N/AELA -0.62Math
Rudsdale Continuation (Old) ALT N/AELA -0.09 -0.22 0.02 -0.07Math
Sojourner Truth Independent Study (Old) ALT N/AELA -0.12 -0.09 -0.13 -0.13Math
Street Academy (Old) AltN/A ELA 0.02 -0.2 0.18 0.04
Math

OUSD New Small Schools Initiative Evaluation 69
Appendix C: School Ratings Using Two-Step Productivity Analysis
imilar to the above one-step productivity analysis, we also ran the same student-level model as described in Appendix A, but then computed productivity using a different two-step model. In this model, we computed the average residuals (differences between actual and expected student achievement), and then used independent sample t-tests to determine whether these averages for
each school differed from 0. They have the same meaning, and almost always the same value as used in the one-step model. We found that we were more likely to categorize the results as in the average range than in the positive or negative ranges, but otherwise found similar results.
Subject
Productivity — Two-Step
School 3-Year Average 2007-08
ACORN WoodlandELA 0.27 0.47Math 0.22 0.36
AllendaleELA 0.05 0.08Math -0.04 0.08
Alliance AcademyELA *0.03 0.04Math *0.05 -0.01
**Alternative Learning CommunityELA -0.13Math -0.33
ASCENDELA 0.15 0.26Math 0.15 0.44
Bella VistaELA -0.06 -0.13Math 0.08 0.03
BESTELA -0.02 -0.09Math
Bret HarteELA -0.01 0.01Math -0.08 -0.06
Bridges at MelroseELA *0.12 0.18Math *0.20 0.25
BrookfieldELA 0.11 0.12Math 0.09 0.23
Bunche AcademyELA -0.16 -0.17Math
BurckhalterELA -0.01 0.06Math -0.02 0.02
Business & Information TechnologyELA -0.02 0.12Math
Calvin SimmonsELAMath
Carl MunckELA 0.01 0.06Math 0.11 0.23
ChabotELA 0.05 0.10Math 0.07 0.10
ClaremontELA 0.02 -0.02Math -0.02 -0.13
S
*School has only two years of data or was too small. ** School only has one year of data.

School Redesign Network at Stanford University70
Subject
Productivity — Two-Step
School 3-Year Average 2007-08
ClevelandELA -0.07 0.07Math 0.02 0.14
ColeELA -0.11 -0.10Math -0.13 -0.20
Coliseum College PrepELA *-0.05 -0.01Math *-0.05 -0.01
College Prep & Architecture AcademyELA 0.07 0.07Math
**Community United ElementaryELA -0.14Math 0.07
Crocker HighlandsELA -0.01 0.03Math -0.13 -0.13
Dewey AcademyELA -0.24 -0.23Math
Douglas TildenELAMath
East Oakland Community HSELAMath
**East Oakland Pride ElementaryELA -0.21Math -0.18
East Oakland School of the ArtsELA -0.03 -0.01Math
Edna BrewerELA 0.04 0.08Math 0.05 0.09
ElmhurstELAMath
Elmhurst Community PrepELA *0.12 0.18Math *0.20 0.17
EmersonELA -0.07 -0.05Math -0.14 -0.11
EnCompass AcademyELA -0.02 -0.15Math 0.00 -0.22
EsperanzaELA 0.10 0.18Math 0.26 0.22
EXCELELA 0.18 0.15Math
EXPLOREELA -0.09 -0.09Math 0.00 0.09
Far WestELA -0.06 0.02Math -0.28
FranklinELA 0.06 0.24Math 0.05 0.06
Fred T. KorematsuELA -0.14 -0.09Math -0.05 -0.10
FrickELA -0.02 -0.01Math 0.08 -0.03
FruitvaleELA 0.03 0.04Math 0.02 -0.02
*School has only two years of data or was too small. ** School only has one year of data.

OUSD New Small Schools Initiative Evaluation 71
Subject
Productivity — Two-Step
School 3-Year Average 2007-08
**Futures ElementaryELA -0.14Math -0.15
GarfieldELA -0.04 -0.07Math -0.11 -0.14
GlenviewELA -0.05 -0.05Math 0.05 -0.02
**Global FamilyELA -0.13Math -0.32
Grass ValleyELA -0.01 -0.08Math -0.14 -0.12
**GreenleafELA 0.12Math 0.13
HavenscourtELAMath
Henry J. KaiserELA 0.01 0.01Math -0.02 -0.28
HillcrestELA 0.17 0.10Math 0.09 0.09
HooverELA -0.04 -0.04Math 0.08 0.18
Horace MannELA -0.05 -0.14Math 0.12 0.12
HowardELA -0.23 -0.19Math -0.15 -0.08
International Community SchoolELA 0.05 0.13Math -0.04 0.05
James MadisonELA 0.00 -0.07Math 0.07 0.30
JeffersonELA -0.02 -0.01Math -0.06 -0.06
Joaquin MillerELA -0.05 0.02Math -0.11 -0.23
KIPP Bridge College PrepELAMath
Kizmet AcademyELAMath
La EscuelitaELA 0.09 0.12Math 0.21 0.20
LafayetteELA -0.07 -0.19Math 0.00 0.11
LakeviewELA -0.08 -0.10Math -0.07 0.03
LaurelELA -0.03 -0.01Math 0.07 0.14
LazearELA 0.00 0.05Math 0.02 0.06
Leadership Preparatory HSELA -0.01 0.01Math
*School has only two years of data or was too small. ** School only has one year of data.

School Redesign Network at Stanford University72
Subject
Productivity — Two-Step
School 3-Year Average 2007-08
**Learning Without LimitsELA -0.27Math -0.28
Life AcademyELA 0.09 0.19Math
Lincoln ElementaryELA -0.03 -0.11Math -0.09 -0.11
Lockwood ElementaryELA -0.15 -0.20Math -0.16 -0.31
Mandela HSELA 0.04 -0.02Math
Manzanita Community SchoolELA *0.03 0.05Math *0.13 0.12
Manzanita SEEDELA *0.01 -0.03Math *-0.26 -0.33
Markham ElementaryELA 0.10 0.37Math -0.02 0.15
Marshall ElementaryELA 0.00 -0.14Math 0.10 -0.03
Martin Luther King JrELA -0.06 -0.14Math -0.11 -0.24
Maxwell Park ElementaryELA -0.09 -0.10Math -0.11 -0.12
Media College PrepELA 0.01 -0.01Math
Melrose Leadership AcademyELA 0.00 0.00Math 0.10 0.13
Merritt Middle College HSELAMath
MetWest HSELA -0.04 0.00Math
Montclair ElementaryELA 0.07 0.05Math 0.14 0.02
Montera Middle SchoolELA 0.03 0.07Math 0.06 0.12
New Highland AcademyELA *0.00 0.00Math *-0.01 0.03
Oakland Community Day HSELAMath
Oakland HSELA -0.03 -0.03Math
Oakland Technical HSELA -0.06 -0.07Math
Parker ElementaryELA 0.03 0.04Math -0.01 -0.10
Peralta ElementaryELA 0.07 0.22Math 0.16 0.38
Peralta Creek Middle SchoolELA *-0.17 -0.08Math *-0.21 -0.03
*School has only two years of data or was too small. ** School only has one year of data.

OUSD New Small Schools Initiative Evaluation 73
Subject
Productivity — Two-Step
School 3-Year Average 2007-08
Piedmont Avenue ElementaryELA 0.00 0.10Math 0.00 0.12
PLACE @ PrescottELA *0.00 -0.07Math *-0.05 -0.12
Reach AcademyELA *-0.18 -0.19Math *-0.07 -0.04
Redwood Heights ElementaryELA 0.03 0.11Math -0.02 0.07
RISE Community SchoolELA 0.08 0.12Math -0.04 -0.05
Robeson School of Visual & Performing Arts
ELA -0.08 -0.08Math
Roosevelt Middle SchoolELA -0.06 -0.04Math 0.05 0.13
Roots International AcademyELA *-0.03 -0.04Math *-0.08 -0.14
RubiconELAMath
Rudsdale ContinuationELA -0.08 -0.07Math
Sankofa AcademyELA -0.13 0.09Math -0.12 0.08
Santa Fe ElementaryELA 0.06 0.07Math 0.11 0.06
Sequoia ElementaryELA 0.02 -0.03Math 0.05 0.05
Sherman ElementaryELAMath
Skyline High SchoolELA 0.05 0.07Math
Sobrante Park ElementaryELA 0.02 0.16Math 0.01 0.05
Sojourer Truth Independent StudyELA -0.11 -0.13Math
Street Academy High SchoolELA 0.02 0.04Math
Think College NowELA 0.09 -0.11Math 0.06 -0.03
Thornhill ElementaryELA 0.05 -0.02Math 0.00 -0.10
United For Success ElementaryELA *-0.01 0.02Math *-0.18 -0.12
Urban Promise AcademyELA 0.09 0.02Math 0.03 0.06
Webster AcademyELA -0.11 -0.17Math -0.17 -0.11
**West Oakland Middle SchoolELA -0.08Math 0.07
*School has only two years of data or was too small. ** School only has one year of data. *School has only two years of data or was too small. ** School only has one year of data.

School Redesign Network at Stanford University74
Subject
Productivity — Two-Step
School 3-Year Average 2007-08
Westlake Middle SchoolELA 0.02 0.04Math 0.09 0.09
Whittier ElementaryELA 0.02 0.19Math 0.01 0.12
Youth Empowerment SchoolELA -0.06 -0.01Math

OUSD New Small Schools Initiative Evaluation 75
Appendix D: ELA Productivity Associated with High School Characteristics
This figure shows the results of replicating the analysis shown in Figure 5 (page 16). As can be seen, the results were very similar, with each design element associated with very similar difference in productivity.
0.00
0.05
0.10
0.15
0.20
0.25
0.30
Project-Based Learning
Partnership-Higher Ed
Interdisciplinary Courses
Career/TechnicalEducation
Block Schedule
Advisory
0.080.10 0.09 0.08
0.120.09
*Achievement versus expectation
Figure D-1. ELA Productivity* Associated with High School Characteristics (Year End 2007 and 2008)

School Redesign Network at Stanford University76
Appendix E: Case Study School Selection Process and Methods
e coupled a quantitative analysis of demographics and achievement data with a qualitative screening of possible schools to select the case study schools for this study. We began with a multi-pronged approach of identifying schools through three strategies: 1) An analysis of API scores and school demographics. We want-
ed to focus on schools that improved academic outcomes while serving primarily the same students. We also wanted to ensure that the schools studied represented the diversity of OUSD in terms of demographics, geographical diversity, incubation experiences, and years founded, as well as grade levels served. 2) Expert nominations from OUSD personnel on schools meeting our criteria. 3) Exploratory investigations of schools to determine the possible policy lessons that might be generated through the case studies. It was decided to focus primarily on schools that had been in existence for multiple years (the newest school was in its second year at the time of the study and was the only school to go through the OUSD new schools incubator) and had demonstrated success in improving student out-comes. This would help OUSD leaders better understand the mechanisms for a success-ful small school and the specific challenges experienced by even the relatively successful schools.
W
At this point in the selection process, we collected some additional data to obtain a more comprehensive view of each school. We collected grade-level enrollment data as well as the percentage of special education students and English language learners. At the high school level, we also looked at graduation rates computed as a percentage of the number of 9th graders who graduated 4 years later in 12th grade, and, where possible, we looked at the percent of graduates who had completed A-G qualifying coursework. In addition, we recognized that although we were targeting schools with high percentages of low-income students, enrollment percentages in the free and reduced-price lunch program did not accurately reflect the poverty levels of the students. The free and reduced-price lunch program may be under-enrolled by undocumented families fearful of identifying themselves to the federal government. The program is also often
under-enrolled by high school students seeking to avoid the stigma of poverty.
Using this process and in collaboration with OUSD personnel, we identified BEST and EXCEL (the two small high schools on the McClymonds Educational Complex), ASCEND, ACORN Woodland Elementary, Elmhurst Community Prep, and EnCom-pass as case study sites. OIHS, a first-year school in 2007-08, was the subject of another study conducted by SRN staff, and is included in the report for additional information, but was not selected through the same process nor considered as compre-hensively in the cross-case analysis.
The study was conducted in the 2007-2008 school year. We began by contacting each school’s principal and identifying the school’s strengths and challenges. From this discussion, the researcher and the princi-pal collaboratively developed a site visit

OUSD New Small Schools Initiative Evaluation 77
Table E-1: Interviews and Observations Conducted for the Study*
Type of data collection
Subject Number
Interviews Teachers and instructional coaches individually or in focus groups 12
Administrators (each administrator was interviewed 2-3 times) 6
Student groups 5
Parent groups and family coordinators 6
District officials (including Network Executive Officers) 15
External support providers and community members 6
Total Interviews 50
Observations Classroom instruction 17
Collaborative planning and professional learning with staff (professional development, teacher collaboration, and leadership teams)
8
School assemblies and after-school programs 3
District meetings (PLC conference and West Oakland Educational Taskforce meeting)
2
Total Observations 30
*Table does not include Oakland International High School
schedule that would enable the research-ers to get a broad overview of the school as well as examine in-depth areas of the school’s strength. Between April and June, we conducted several site visits to each school for a total of about 3 days at each site. We collected pertinent documents, and interviewed district officials, school admin-istrators, teachers, support staff, students, parents, and community members. Table E-1 below summarizes the types and num-bers of interviews and observations we con-ducted for the study (not including OIHS).
At each school, we interviewed the admin-istrator at least two times. We interviewed teachers whose instruction we observed, as well as a mix of teachers who were newer and more veteran to the school and who
taught a range of subjects and grade lev-els. We also interviewed an intentionally diverse group of students in terms of their racial backgrounds and academic perfor-mance, and we interviewed a diverse group of parents. Beyond the school, we inter-viewed persons who provided support to the schools, primarily staff at BayCES and district personnel. Following our site vis-its, we wrote in-depth case studies of each school. At an interim point in writing the case studies, we conducted follow-up inter-views with several staff at each school to fill in gaps in our data and met with district officials to determine lines of inquiry that would be useful to them from a policy per-spective. The case studies were then used to conduct a cross-case analysis of data across all schools.

School Redesign Network at Stanford University78
Bibliography
1. Belfield, C. & Levin, H. (2007). The economic losses from high school dropouts in California. (Research Report #1). Santa Barbara, CA: University of California, Santa Barbara, The California Dropout Research Project. http://cdrp.ucsb.edu//researchreport1.pdf
2. Darling-Hammond, L. (1999). Teacher quality and student achievement: A review of state policy evidence. Seattle, WA: University of Washington, Center for the Study of Teaching and Policy.
3. Darling-Hammond, L. (2002). Redesigning Schools: What matters and what works. Stanford, CA: Stan-ford University, School Redesign Network.
4. Darling-Hammond, L., Ross, P., & Milliken, M. (2007). High school size, organization, and content: What matters for student success? In F. Hess & T. Loveless (Eds.), Brookings Papers on Education Policy 2006/2007 (pp. 163-203). Washington, DC: Brookings Institute.
5. DuFour, R. (2003). Building a professional learning community. The School Administrator, 60(5), 13-18.
6. Elmore, R. F., (2006, July). Leadership as the practice of improvement. Paper presented at International Perspectives on School Leadership for Systemic Improvement Conference, London, England.
7. Hanushek, E., Kain, J., O’Brien, D., and Rivkin, S. (2005, January). The market for teacher quality. Paper prepared for American Economic Association Meetings, Philadelphia, PA.
8. Lee, V., & Ready, D. (2007). Schools-within-schools: Possibilities and pitfalls of high school reform. New York: Teachers College Press.
9. Little, V., & Wing, J. Y. (2003, October). An evaluation of the effectiveness of Oakland Unified School District’s New Small Autonomous Schools (NSAS) Policy (2000-2003). Oakland, CA: Oakland Unified School District.
10. Murphy, K. (2007, March 3) MBA Students try to fix OUSD finances. Oakland Tribune. Retrieved from http://www.insidebayarea.com/ci_5349352.
11. Newmann, F. M., Smith, B., Allensworth, E., & Bryk, A. S. (2001). School instructional program coher-ence: Benefits and challenges. Chicago, IL: Consortium on Chicago School Research.


School Redesign Network
505 Lasuen Mall
Stanford, CA 94305-3084
650-725-0703
srnleads.org
SRN LEADSS T A N F O R D U N I V E R S I T Y