Embed Size (px)
Citation preview

OAHU’S MARINE PROTECTED AREAS HAVE LIMITED SUCCESS IN PROTECTING
CORAL REEF HERBIVORE FUNCTIONAL ASSEMBLAGES
A THESIS SUBMITTED TO THE GRADUATE DIVISION OF THE
UNIVERSITY OF HAWAIʻI AT MĀNOA IN PARTIAL FULFILLMENT
OF THE REQUIREMENTS FOR THE DEGREE OF
MASTER OF SCIENCE
IN
MARINE BIOLOGY
DECEMBER 2019
By
Noam Altman-Kurosaki
Thesis Committee:
Erik C. Franklin, Chairperson
Celia M. Smith
Mark A. Hixon
Keywords: herbivory, marine protected areas, algal turfs, coral reefs, Hawai‘i, O‘ahu

ii
Acknowledgements
I would like to thank my advisor, Erik Franklin, and my committee members, Celia Smith and
Mark Hixon, for their guidance and support throughout this process. I would like to thank the
University of Hawai‘i Graduate Student Organization Grants and Awards Program (Award # 18-
10-11), the Colonel Willys E. Lord, DVM, and Sadina L. Lord Scholarship Fund, and the East-
West Center Graduate Degree Fellowship for graciously providing financial support for this
study and my time at UH. I would also like to thank Richard Chen, Jeffrey Kuwabara, Eric
Dilley, Erik Brush, Nic Ulm, Patrick Nichols, Hoaka Thomas, Mariana Rocha de Souza, Brittany
Evans, and Mitch Logan for their invaluable help in the field, Zack Oyafuso for his assistance
with GIS, and the entire Limu Lab in Botany for their help throughout the turf identification
process. Finally, I’d like to thank my family and my friends for supporting me in all of my
endeavors.

iii
Abstract
Herbivorous fishes and urchins improve reef resilience by removing algae that might otherwise
smother corals, yet herbivores are frequently targeted by fishers. The deleterious effects of
fishing on herbivore populations can be limited through the establishment of no-take marine
protected areas (MPAs). In Hawai‘i, the state government is planning to effectively manage 30%
of its nearshore waters by 2030, which may include the expansion of an existing MPA network.
During 2018-19, I conducted visual diver surveys to compare the biomass, density, and size
structure of reef fish and urchin populations inside and outside of four of O‘ahu’s current MPAs
to determine if they are effectively protecting herbivore functional assemblages. Using photo-
quadrats, I also characterized the benthos, including post-dive, microscopic identification of
common taxa in algal turfs that were collected, to evaluate possible secondary effects of
differential herbivory on benthic algal communities at multiple sites within each region. While
protected areas had a higher total biomass of herbivore populations, the magnitude of the effect
varied depending on region (e.g. Hanauma Bay, Kāneʻohe, Pūpūkea, and Waikīkī) and
functional guild (e.g. grazer, scraper, browser, and urchin). While the biomass of individual
functional guilds often differed between protected and unprotected sites, Hanauma Bay was the
only MPA with a significant difference in the herbivore assemblage between protected and
unprotected sites. Herbivore populations were also associated with benthic assemblages, and
differences in the turf community were correlated with differences in the herbivore community,
consistent with previous findings that herbivore and benthic assemblages reciprocally structure
each other’s communities. Urchins and grazing fishes accounted for the majority of herbivore
biomass across regions, and the dominance of urchins suggests that they should be included in
future evaluations of herbivory. Additionally, functional diversity and redundancy was low

iv
across site and region, suggesting ecological processes are dominated by a single or few species.
The small size structure of herbivorous fishes in MPAs across all regions also likely limits their
population-level functional impact and fecundity. These results suggest that while the MPAs of
O‘ahu benefit herbivore assemblages, their positive effect is limited and likely confounded by
differences in habitat between protected and unprotected sites.

v
Table of Contents Acknowledgments ………………………………………………………………………… ii
Abstract …………………………………………………………………………………… iii
Table of Contents …………………………………………………………………………. v
List of tables ………………………………………………………………………………. vi
List of figures ……………………………………………………………………………… vii
Introduction ………………………………………………………………………………... 1
Methods
Study site …………………………………………………………………………… 8
Survey methods …………………………………………………………………….. 9
Data analysis ………………………………………………………………………… 11
Results ………………………………………………………………………………………. 14
Discussion …………………………………………………………………………………… 19
Appendices …………………………………………………………………………………... 43
References ……………………………………………………………………………………. 53

vi
List of tables
Table 1: Herbivore species list and functional guild classifications ……………………….. 26
Table 2: Average herbivore biomass in each region and site ………………………………. 28
Table 3: Herbivore biomass ratios of protected:unprotected sites for relevant functional
guilds in each region ………………………………………………………………. 29
Appendix 1: Test statistics from comparisons of herbivore functional diversity …………… 43
Appendix 2: Summary statistics of measurements of herbivore functional diversity ………. 45
Appendix 3: Turf species list ………………………………………………………………... 46

vii
List of figures Figure 1: Map of O‘ahu …………………………………………………………………. 30
Figure 2: Detailed maps of the study regions …………………………………………… 31
Figure 3: Biomass comparisons of herbivore functional guilds ………………………… 32
Figure 4: Multivariate comparison of herbivore assemblages …………………………... 33
Figure 5: Constrained ordination with regions pooled …………………………………... 34
Figure 6: Constrained ordination with regions separated ………………………………... 35
Figure 7: Size structure of herbivorous fish with regions pooled ………………………... 36
Figure 8: Grazer size structure with regions separated …………………………………… 37
Figure 9: Browser size structure with regions separated ………………………………….. 38
Figure 10: Scraper size structure with regions separated …………………………………. 39
Figure 11: Relationship between reserve capacity and diversity …………………………. 40
Figure 12: Relationship between herbivore evenness and species richness ………………. 41
Figure 13: Multivariate comparison of turf assemblages ………………………………….. 42

1
Introduction
Coral reefs are among the most diverse ecosystems in the world, and provide livelihoods for
millions of people (Moberg and Folke 1999; Newton et al. 2007; Cinner et al. 2009; Darling and
D'agata 2017). A recent assessment indicates that coral reefs in the main Hawaiian Islands may
be worth up to $33.57 billion/year (Bishop et al. 2011). However, reefs are increasingly
threatened by anthropogenic stressors, such as overfishing, land-based sources of pollution
(LBSP), and climate change (Pauly et al. 2005; Newton et al. 2007; Carpenter et al. 2008; Mora
et al. 2018). The State of Hawaiʻi recently launched the “30 by 30” initiative with the goal of
effectively managing 30% of its nearshore waters by 2030 with the intention of mitigating the
effects of these stressors and maintaining the productivity and value of the reefs (DAR 2016).
With these goals in mind, it is important to re-examine Hawai‘i’s protected areas, and assess
their success in promoting reef health and resilience.
A recent survey by Chung et al. (2018) found the three most effective management
interventions for promoting reef resilience in Hawai’i are establishing a network of herbivore
fisheries management areas, banning parrotfish fishing, and establishing no-take MPAs – all
actions that would bolster herbivore populations through some measure of protection. Herbivory
is frequently cited as among the most important factors contributing to coral reef resilience by
preventing algal dominance and overgrowth (Carpenter 1986; Tanner 1995; Bruggemann et al.
1996; Mumby et al. 2006b; Hughes et al. 2007; Bonaldo and Bellwood 2008; Rasher and Hay
2010; Hixon 2015; Chung et al. 2018). Herbivores consume algae that would otherwise compete
with corals for space and limit coral settlement and recruitment, thus maintaining coral
dominance (Carpenter 1986; Hughes et al. 2007). The role of herbivory in promoting reef

2
resilience is likely to become more important, as reefs are predicted to become more susceptible
to incursion from at least one invasive alga under future warming scenarios (Veazey et al. 2019).
Coral recovery is further promoted by herbivore populations with complementary feeding
modes that can target and remove different groups of algae (Burkepile and Hay 2008). The loss
of functional herbivore guilds can trigger a regime shift (Folke et al. 2004). For example, the loss
of grazing by the urchin Diadema antillarum triggered a coral-algal phase-shift on Caribbean
reefs (Carpenter 1986; Mumby et al. 2006b, 2007), although this was predicated by substantial
reduction in fish grazing arising from overfishing of herbivorous fishes (Bellwood et al. 2004;
Nystrom et al. 2008) and nutrient enrichment from sub-marine groundwater discharge bringing
in land-based sources of pollution (D’Elia et al. 1981). The risk of phase shifts can be mitigated
if multiple species fulfill the same functional role and can compensate for the loss or reduction of
another species (Bellwood et al. 2004; Nystrom et al. 2008). Therefore, reef resilience is
dependent in part on herbivore populations with both high functional diversity and redundancy
(Bellwood et al. 2003; Folke et al. 2004; Burkepile and Hay 2008; Hoey and Bellwood 2009;
Johansson et al. 2013; Kelly et al. 2016).
Coral reefs were originally thought to promote high functional redundancy of
herbivorous fishes (Odum and Odum 1955), which was supported by in situ observations
suggesting that the vast majority of herbivores feed on turf algae (Hay and Taylor 1985; Kelly et
al. 2016). However, there has been a recent movement for more detailed assessments of these
functional roles (e.g. Brandl and Bellwood 2014; Adam et al. 2015). The functional role and
ecological effect (e.g. grazing rate, bioerosion rate) of a fish can broadly be determined by
combinations of unique traits (Mouillot et al. 2014), such as general diet (Edwards et al. 2014),
body size (Bellwood and Choat 1990; Ong and Holland 2010), mobility (Norman and Jones

3
1984; Meyer and Schultz 1985; Nagelkerken et al. 2000), the period of the day in which they are
active (Bellwood et al. 2006), their position in the water column (Gido 2003), and their schooling
behavior (Meyer and Schultz 1985; Michael et al. 2013; Basford et al. 2016). Mouillot et al.
(2014) termed these combinations “functional entities,” and found that while diverse fish
assemblages may have more unique functional entities, a disproportionate number of species are
packed into relatively few functional entities. Furthermore, 38% of the functional entities in the
most speciose region had no functional redundancy (i.e. there was only one species of fish in that
functional entity). Additionally, while Mouillot et al. (2014) treated herbivores as a single group,
gut content analysis of herbivorous coral reef fishes suggests that there is complementarity
between species in the taxa of algae consumed (Kelly et al. 2016). Thus, there is likely even less
functional redundancy than previous observations and analyses suggest, and overfishing can
result in removing a species with no functional equivalent (Brandl and Bellwood 2016; D’agata
et al. 2016; Thiault et al. 2017). Given that the species composition of turf is influenced by both
bottom-up factors such as nutrient enrichment and top-down factors such as grazing (Smith et al.
2001, 2010a; Stuercke and McDermid 2004), and that there is complementarity in the taxa of turf
that herbivores consume (Kelly et al. 2016), it is likely that changes in herbivore assemblages
drive changes in turf communities and vice versa, and altering either species assemblage can
have cascading effects.
Despite recent developments in determining the exact functional roles of coral reef fishes,
there is still benefit in using broader functional classifications as a framework for describing
herbivore interactions with the benthos (Edwards et al. 2014). Herbivorous fishes are commonly
split into three primary functional guilds based on their method of feeding: scrapers/excavators,
grazers/detritivores, and browsers (Carpenter 1986; Green and Bellwood 2009). Scrapers (e.g.

4
Scarus rubroviolaceus) produce bite scars that promote crustose coralline algae (CCA) and coral
recruitment (Bellwood 1995; Ong and Holland 2010; Smith et al. 2010), but large parrotfish bites
can gouge/excavate substrate and lead to bioerosion (Bellwood and Choat 1990; Green and
Bellwood 2009). Smaller grazers/detritivores (e.g. Zebrasoma flavescens) remove only
individual filaments and partially graze on turfs, cropping the turf but allowing for rapid
regrowth that can hinder CCA recruitment (Carpenter 1986). Additionally, while detritivores
(e.g. Ctenochaetus strigosus) were previously treated as a separate functional guild, they have
been shown to consume a substantial amount of algal turf along with detritus and are often
grouped together with grazers in broader functional analyses (Green and Bellwood 2009;
Marshell and Mumby 2012). Browsers (e.g. Naso unicornis) selectively feed on fronds of
macroalgae (Green and Bellwood 2009; Kelly et al. 2016).
Jouffray et al. (2015) found that the functional makeup of herbivorous fish populations
was among the most important factors dictating reef state across the Hawaiian archipelago, and
that there are three primary regimes that exist throughout both the main Hawaiian Islands (MHI)
and the northwestern Hawaiian Islands (NWHI): a calcifying regime with coral and CCA cover,
a low complexity regime dominated by macroalgae and/or sand, and a turf regime. While all
three herbivore functional guilds had a negative relationship with the macroalgae/sand regime,
different functional compositions of reef fish were associated with the calcifying regime and the
turf regime. In particular, grazer biomass had a positive relationship with the turf regime,
whereas scraper biomass had a positive relationship with the calcifying regime. Therefore, while
herbivores are important in managing macroalgal dominance, the functional makeup of those
herbivores can lead to either calcifying or turf regimes.

5
While the functional composition of herbivorous fishes is important to the condition of a
reef (Jouffray et al. 2015), healthy herbivore populations – and by extension, reef resilience – are
threatened by unsustainable fishing practices (Newton et al. 2007; Williams et al. 2008; Houk et
al. 2018a). Coral reef fisheries are historically difficult to manage being characterized by a wide
diversity of captured species, fishing activities, and gear types (Graham et al. 2017), but reliable
catch data are rare and life history information necessary for effective management is known for
only about 1,200 out of 7,000 commonly exploited species (Froese and Pauly 2017). Roughly
55% of coral reef fisheries in the tropical Pacific are now overfished (Newton et al. 2007).
Parrotfishes in particular are heavily targeted in coral reef fisheries (Williams et al. 2008; Houk
et al. 2018b) and are highly sensitive to fishing pressure (Houk et al. 2018b). Given that larger
parrotfish have higher grazing rates and bioerosion rates (Bellwood and Choat 1990; Bellwood
1995; Ong and Holland 2010; Smith et al. 2010), altering the size structure of parrotfish
populations through fishing can affect their relative impact on the surrounding environment.
Conversely, surgeonfishes are relatively resilient to fishing pressure (Houk et al. 2018b).
Because grazers like surgeonfishes promote turf dominated environments (Jouffray et al. 2015),
fishing potentially reduces the functional impact of parrotfishes by selecting for smaller grazing
fishes (Houk et al. 2018b) which would promote turf or macroalgae regimes (Jouffray et al.
2015).
Unsustainable fishing practices are already threatening Hawaiian reefs (Williams et al.
2008; Gorospe et al. 2018). Of roughly two million reported commercial and non-commercial
fishing trips a year in MHI, 1.7 million are reef fishing trips, and about half of those occur on
O‘ahu alone (McCoy et al. 2018). O‘ahu’s herbivorous fish populations are severely depleted,
with < 4% of parrotfish biomass than remote areas (Williams et al. 2008). Additionally, fishers

6
tend to target larger fishes, which are exponentially more fecund and produce larvae with greater
survivorship than smaller fish (Birkeland and Dayton 2005). Williams et al. (2008) termed these
large individuals in target species of fish “prime spawners,” and found that O‘ahu had < 3%
prime spawner biomass than what was found in remote areas, and that only three mid-sized
surgeonfish species contributed to O‘ahu’s total prime spawner biomass. However, fish biomass
can increase up to 280% if human impacts are minimized (Gorospe et al. 2018), emphasizing the
importance of protection and effective management.
Here, I assessed the effectiveness of O‘ahu’s protected areas in protecting herbivore
assemblages. While previous studies suggested that the protected areas have greater herbivore
biomass than the surrounding fished areas (e.g. Friedlander et al. 2007), few have assessed the
role of protection on herbivore functional guilds and their size structure (Nash et al. 2016).
Additionally, while urchins have a well-documented role in promoting reef resilience in the
Caribbean (Carpenter 1986; Klumpp and Pulfrich 1989; Russ 2003), almost no studies have
included urchins in their analyses of herbivore assemblages in Hawai‘i. Urchins can fulfill
similar ecological roles as many herbivorous fish, such as by scraping algal turfs and consuming
macroalgal growth (e.g. Mumby et al. 2007; Stimson et al. 2007; Sangil and Guzman 2016), and
the mechanisms by which they feed can contribute to bioerosion (Carriero-Silva and
McClanahan 2001; Griffin et al. 2003; Sangil and Guzman 2016). As such, I assessed herbivore
community response by comparing the biomass, density, and size structure of grazers, scrapers,
browsers, and urchins inside and outside four marine protected areas of O‘ahu. Additionally, I
assessed indirect effects of protection on benthic communities, including taxonomic differences
in the algal turf community, and tested the association between habitat factors and herbivore
assemblages. Turfs were included in analyses because they are historically understudied in larger

7
ecological surveys and are often miscategorized as the term turf is inconsistently used (Connell
et al. 2014), yet turf are a key component in the diet of most herbivorous fish (Hay and Taylor
1985; Kelly et al. 2016) and may be as competitive with coral as larger macroalgae (Birrell et al.
2008; Vermeij et al. 2008; Smith et al. 2010). Thus, the study sought to determine whether the
current protected areas are in fact effectively managing O‘ahu’s herbivore resources, thereby
providing a scientific foundation for the evaluation of these management areas.

8
Methods
Study site
Surveys were conducted from late June 2018 to June 2019 across four regions around O‘ahu
(Figure 1): the north shore (Figure 2a, Pūpūkea Marine Life Conservation District, hereafter
MLCD), Kāneʻohe Bay on the windward east shore (Figure 2b, Moku o Loʻe Marine Laboratory
Refuge), Hanauma Bay in the southeast (Figure 2c, Hanauma Bay MLCD), and Waikīkī on the
south shore (Figure 2d, Waikīkī MLCD). Surveys of each region were started and completed
within a month with the exception of surveys along the north shore, which were split between
November 2018 and June 2019 because of poor field conditions during persistent large winter
swells.
Surveys were conducted with a stratified random sampling schema across two levels of
strata: management (protected or unprotected) and habitat (i.e., colonized or uncolonized
hardbottom). Habitat strata were included to account for variation in fish assemblages associated
with habitat features (e.g. Friedlander et al. 2007b). Surveys in unprotected areas were delineated
by a 1.5 km buffer extending beyond the bounds of the protected areas, although this buffer was
extended to 2 km for Hanauma Bay because there was no suitable habitat within the original 1.5
km buffer and the need to maintain depth parity with surveys conducted within the MLCD.
Colonized and uncolonized hardbottom were determined using a benthic map data in a GIS,
where colonized hardbottom was designated as >10% coral cover (Coyne et al. 2003; Friedlander
et al. 2006). Ten surveys were randomly located within each management x habitat stratum for a
total of n = 40 surveys in each region, following methods for sample optimization using these
maps outlined by Friedlander et al. (2006). There were no colonized hardbottom polygons from
the NOAA benthic habitat map within the Waikīkī MLCD. Surveys that were not at least 25 m

9
away from another survey location were discarded and replaced with another randomly selected
survey coordinate to avoid pseudo-replication in fish surveys. Surveys were not conducted
within the Waikīkī Fisheries Management Area (FMA) along the south shore of O‘ahu because
of potential confounding effects of fishing because this FMA allows fishing in even numbered
years while all the other MPAs in the study had permanent management restrictions on fishing.
Survey methods
Reef fish visual diver surveys were conducted at each assessment site on 5 x 25 m transects at ≤
12 m depth. All fish (not just herbivores) were sized (cm total length) and identified to species by
a diver swimming at constant speed (~15 min each transect). Urchins were also counted and
identified to species within a 2 x 25 m transect using the same center line as the fish surveys. The
first 25 urchins of each species were sized by measuring test diameter (to nearest cm) to provide
an estimate of overall size structure. While previous studies assessing urchin herbivory have
focused exclusively on diadematids (e.g. Tootell and Steele 2016), echinometrid urchins have
been found to be sources of both grazing and bioerosion (Sangil and Guzman 2016), and so were
included in these surveys. Herbivores were later stratified into general feeding guild
(scraper/excavator, browser, grazer, and urchin) based on descriptions in the literature (Table 1;
Green and Bellwood 2009; Randall 2010; Froese and Pauly 2017). Detritivores, such as
Ctenochaetus strigosus, were grouped together with grazers as previous studies indicate that they
consume a substantial amount of turf (Marshell and Mumby 2012). Finally, scrapers and
excavators were grouped together, as only two Chlorurus spp. exceeded the 35 cm threshold
associated with excavating substrate while feeding (Green and Bellwood 2009). Fish length was
converted to biomass using" = $%&, where W is fish biomass (g), L is total fish length (TL in

10
cm), and a and b are species-specific allometric scaling constants from publicly available sources
(e.g. Kulbicki et al. 2005; Froese and Pauly 2017). Total length (TL) was converted to standard
length (SL) or fork length (FL) as necessary based on available linear scaling data (e.g. Froese
and Pauly 2017). Hawai‘i specific constants were used when possible. Urchin test diameter was
converted biomass using the same formula, where L is test diameter and a and b are allometric
scaling constants from previously published data (McClanahan 1988; Regalado et al. 2011). The
biomass conversion for Diadema sauvigni was generalized across all diadematids and
Heterocentrotus mamillatus, and the biomass conversion for Echinometra mathaei was
generalized across all remaining echinometrids and Eucidaris metularia due to a lack of species-
specific scaling constants.
Benthic measurements were taken concurrent with the fish and urchin surveys. Benthic
photo quadrats were taken every other meter using a monopod 0.6 m off the substrate. Images
were analyzed using CoralNet (Beijbom et al. 2012, 2015) by identifying the substrate under
each of 100 randomly points per image down to the lowest taxonomic level for a total of 1,300
points per transect. The optimum number of points per image was determined by a power
analysis conducted by Brown et al. (2004). Species identifications were later grouped into
broader functional categorizations (coral, CCA, turf, sediment-laden turf, sponge, green
macroalgae, red macroalgae, brown macroalgae, large filamentous cyanobacteria, and other
mobile/sessile invertebrate) to simplify analysis and data visualization. However, non-aggregated
data were tested prior to grouping the benthic data, and it was determined that simplifying the
data did not obscure overall trends in the data.
Additionally, rugosity was measured by carefully laying a 1.3 cm link chain across the
first 10 m of the centerline of each transect (Risk 1972; Mccormick 1994). A rugosity index was

11
calculated by taking the ratio of horizontal reef distance to the distance along the reef surface
contour (i.e. the length of the chain laid out), with an index value of 1 indicating no reef
complexity. Finally, two 1 cm2 turf samples were collected as close to the centerline as possible
from each transect with forceps for a total of n = 80 samples in each region. Turf samples were
collected from opposite ends of each transect to account for as much within-transect spatial
variability in the turf assemblage as possible. Samples were preserved in 3–4% formalin for at
least 48 hrs until further analysis.
Turf samples were prepared for analysis by first isolating filaments from as much of the
sediment/detritus as possible. Turfs were then placed on a slide and decalcified with 1–5% HCl
solution and stained with 1% Aniline blue in filtered sea water. Slides were then preserved with a
distilled water solution of 25% Karo 2% Phenol solution under a cover slip following Tsuda and
abbott (1985). Turfs were then identified to the lowest taxonomic level under microscope in the
lab with the assistance and use of available identification keys (Price and Scott 1992; Abbott
1999; Abbott and Huisman 2004; Guiry and Guiry 2019). Algal processing time (45 min–3 hrs
per sample) was not sustainable, thus turf analysis was reduced to one sample from each transect
following the complete analysis of samples from Kāneʻohe Bay and the Waikīkī protected site.
Data analysis
Total biomass (g m-2), herbivore biomass, and the biomass of each herbivore functional guild in
protected and unprotected sites across O‘ahu and in each region was log(biomass + 1)
transformed as raw data were positively skewed and non-normal. Data were compared between
protected and unprotected sites in each guild and region using generalized linear models
(GLMs). The log(biomass + 1) transformed data were then used to characterize herbivore

12
functional assemblages (scraper/excavator, browser, grazer, and urchin biomass) among regions
and protection status using non-metric multidimensional scaling (nMDS) with environmental
vectors drawn representing rugosity and depth using the vegan package in R (Oksanen 2011; R
Development Core Team 2011). Territorial damselfish were excluded from analyses because
they are not targeted in fisheries (Edwards et al. 2014) and were absent from the majority of
transects. Piscivore biomass between protected and unprotected sites was also compared using
GLMs to test for any possible effects on herbivore biomass due to predation. Herbivore
communities from protected sites were then compared with communities from outside the
protected sites using PERMANOVA in each region, with rugosity and depth as additional
factors. Pairwise-permutation tests were used to determine which communities were distinct
from each other in the case of a significant result. PERMANOVA was used to assess the
multivariate community response in addition to repeated GLMs for each functional guild to
assess whole community response to protection in addition to individual guild response. Size
structure of the fish functional guild were compared between protected and unprotected sites
using Kolmigorov-Smirnov tests (e.g. Clements and Hay 2018) and were visualized using
probability density histograms.
Species richness, inverse-Simpson’s diversity, evenness, and reserve capacity were used
as metrics of within-guild species and functional diversity and redundancy (Magurran 1988).
Reserve capacity represents the collective ability for all other species to fulfill a similar
ecological function as the dominant species in a functional guild and is defined as follows:
'( = ∑ (+, − .,)0,12∑ +,0,12

13
Where RC is the reserve capacity, A is the total fish abundance in a functional guild on transect i,
and D is the abundance of the numerically dominant species in a functional guild on transect i
(Johansson et al. 2013). Reserve capacity, species richness, inverse-Simpson’s diversity and
evenness were compared among regions and protection status using GLM Two-Way ANOVAs.
Reserve capacity was plotted against diversity and evenness was plotted against species richness
for visualizing relationships between diversity measures. Test statistics and summary statistics
are available in the supplementary materials (Appendix 1, Appendix 2).
Associations between herbivore functional assemblages and benthic community data
across O‘ahu and at individual regions were assessed using canonical analysis of principal
components (CAP) in R (Oksanen 2011; R Development Core Team 2011). CAP was used to
allow for correlation between predictors (i.e. protection status and the different benthic
categories). Benthic data were arcsine square root transformed prior to analysis. The significance
of the benthic predictors was assessed using a permutation test for CAP in R (Oksanen 2011; R
Development Core Team 2011) .
Differences in turf communities across regions and sites were visualized using nMDS and
tested using PERMANOVA. Pairwise-permutation tests determined which communities were
distinct from each other in the case of a significant result. A complete list of turf species is in the
supplementary materials (Appendix 3).

14
Results
11,911 fish in 114 species and 14,643 urchins were observed throughout the surveys. 16 species
of grazer were observed from six genera, four species of scraper were observed from two genera,
five species of browser were observed from three genera, and 10 species of urchin were observed
from seven genera. Herbivores accounted for the majority of the biomass of reef fishes and
urchins inside and outside the protected sites across all regions (Table 2). Kāne‘ohe sites had
lower total herbivore biomass than all other regions, driven by low urchin density and biomass;
herbivores accounted for 61% and 67% of the total biomass at the protected and unprotected
sites in this region, respectively (Table 2). Herbivores accounted for 83 – 98% of the biomass at
all other sites. Urchins accounted for the greatest biomass of all herbivores in all sites (51 – 93%
of herbivore biomass) except for the Kāne‘ohe Bay and Waikīkī protected sites, where they
accounted for 5% and 33% of total herbivore biomass, respectively. Grazers were the most
abundant herbivores at these sites, accounting for 74% of herbivore biomass in the Kāne‘ohe
Bay protected site and 48% in the Waikīkī protected site. Grazers accounted for 19 – 32% of
total herbivore biomass in all other sites. While there was no significant difference in total (fish
and urchin) biomass inside and outside the protected sites when regions were pooled (GLM, χ2 =
1.08, P = 0.29), there was significantly greater herbivore biomass inside protected sites (GLM, χ2
= 1.08, P = 0.29), driven by higher grazer (χ2 = 37.3, P = 1.0e-09), scraper (χ2 = 10.2, P = 0.001),
and browser (χ2 = 20.9, P = 4.7e-06) biomass inside the protected sites (Figure 3a). This trend
was largely influenced by Hanauma Bay, which had higher total biomass inside the protected site
(Figure 3d, GLM, χ2 = 5.1, P = 0.02), as well as higher herbivore biomass (χ2 = 28.1, P = 1.1e-
07) driven by higher grazer biomass (χ2 = 63.4, P = 1.66e-15), scraper biomass (χ2 = 22.8, P =
1.8e-06), and browser biomass (χ2 = 43.9, P = 3.43). Additionally, while grazer, scraper, and

15
browser biomass was 1.8–2.2 times greater inside protected sites when all regions were pooled,
biomass for these functional guilds was 5–17 times greater inside the protected site in Hanauma
Bay (Table 3). These trends were less pronounced at other regions; only grazer (Figure 3b, GLM,
χ2 = 4.41, P = 0.04) and urchin biomass (χ2 = 5.19, P = 0.02) were greater inside the north shore
protected area than outside, but there was no significant difference in total biomass (χ2 = 2.11, P
= 0.15) or in any of the other herbivore functional guilds. Kāne‘ohe Bay had greater grazer
biomass inside the protected area (Figure 3c, GLM, χ2 = 8.82, P = 0.03), but there was no
significant difference in total biomass (χ2 = 0.002, P = 0.96) or in the biomass of any of the other
herbivore functional guilds. Total biomass was 1.1 times higher in the unprotected site at
Waikīkī (Table 3), but this difference was not significant (Figure 3e, χ2 = 0.005, P = 0.95).
Browser biomass was 14.4 times greater inside the Waikīkī protected site (χ2 = 14.4, P = 1.3e-
04), but there was no significant difference in biomass for any other functional guild. Piscivores
accounted for the greatest proportion of total biomass in the Kāne‘ohe Bay unprotected site,
where they made up 10% of the total biomass. However, they only accounted for only 0.9% –
7% of the total biomass at all other sites. Hanauma Bay was the only region in which there was a
significant difference in piscivore biomass between protected and unprotected sites (GLM, χ2 =
13.7, P = 2.0e-04), where biomass was 5.3 times greater inside the protected area than outside
(Table 3).
Ordination of the herbivore communities suggested that Kāne‘ohe Bay had unique
herbivore assemblages, likely driven by low browser and urchin biomass, with scrapers
proportionally accounting for most of the biomass (Figure 4). This pattern was confirmed by
results from a PERMANOVA test, which showed differences in regions accounted for much of
the variation in the herbivore functional assemblages (Pseudo-F = 24.8, R2 = 0.30, P = 0.001).

16
Additionally, the communities in the unprotected site outside of Hanauma Bay were distinct
from other herbivore communities, likely driven by low biomass across all functional guilds.
Surveys with higher urchin biomass seemed to be distinct from those with more herbivorous fish,
and oriented away from other surveys in the ordination space. There was substantial overlap
between herbivore communities in protected sites at Hanauma Bay, the north shore, and Waikīkī,
and pairwise-permutation tests suggested there was no significant difference between herbivore
functional assemblages in these regions (Hanauma protected vs. Waikīkī protected: Pseudo-F =
2.80, R2 = 0.09, P-adj = 1.00; Waikīkī protected vs. north shore protected: Pseudo-F = 2.07, R2
– 0.07, P-adj = 1.00, Hanauma protected vs. north shore protected: Pseudo-F = 4.72, R2 = 0.11,
P-adj = 0.08). Protected sites had different herbivore functional assemblages from unprotected
sites (PERMANOVA, Pseudo- F = 17.86, R2 = 0.07, P = 0.001), although this pattern was solely
driven by Hanauma Bay, the only region with a significant difference in herbivore functional
assemblages between protected and unprotected sites (pairwise permutation test, Pseudo-F =
21.9, R2 = 0.39, P-adj = 0.03). There was a significant interaction effect between region and
protection (PERMANOVA, Pseudo- F = 2.22, R2 = 0.03, P = 0.02), driven by unique
communities in Kāne‘ohe Bay and in the unprotected site outside Hanauma Bay. Rugosity
(PERMANOVA, Pseudo- F = 4.99, R2 = 0.02, P = 0.007) and depth (PERMANOVA, Pseudo-F
= 5.33, R2 = 0.02, P = 0.003) were both significant predictors of herbivore assemblages.
Constrained axes from a canonical analysis of principal coordinates with protection and
benthic communities as predictors for herbivore assemblages explained 11.7% of the variation in
the herbivore functional assemblages around O‘ahu (Figure 5). The first constrained axis
explained 7.6% of the constrained variation, and the second constrained axis explained 2.3%
further. Coral cover was aligned strongly with the second constrained axis towards herbivore

17
communities at protected sites. Urchins appeared to be more associated with turf, sediment-laden
turf, red macroalgae, and sand. The constrained axes were significant predictors of herbivore
functional assemblages (Permutation test, Pseudo-F(9, 140) = 2.07, P = 0.001). These trends held
true at the regional scale, and the north shore was the only region where the total variation
explained by the constrained axes was not significant (Figure 6a, Permutation test for capscale,
SSQ(9.2, 36.2), pseudo-F(8,31) = 0.99, P = 0.49). Coral cover was strongly associated with
herbivore communities in Hanauma Bay (Figure 6c).
There was a significant difference in grazer and scraper size distributions between
protected and unprotected sites when all regions were combined (Grazers: Kolmigorov-Smirnov
test, D = 0.06, p = 0.002; Scrapers: D = 0.09, P = 0.008), with some evidence of size truncation
at unprotected sites (Figure 7). However, these trends were not uniform across all regions. There
was no significant difference in grazer size distributions at the north shore (Figure 8a;
Kolmigorov-Smirnov test, D = 0.07, P = 0.06), with no apparent size truncation in unprotected
sites. Additionally, while there was no significant difference in browser size distribution when all
regions were combined (Figure 7b, Kolmigorov-Smirnov test, D = 0.09, P = 0.32), there was a
significant difference in browser size distributions at each individual region (Figure 9a, North
Shore: D = 0.53, P = 2.8e-14; Figure 9b, Hanauma: D = 0.59, P = 2.9e-06; Figure 9c, Waikīkī: D
= 0.63, P = 1.7e-10). There was apparent size truncation at Waikīkī and Hanauma Bay, but
browsers in the north shore unprotected sites had larger size ranges than those in protected sites.
There was evidence for scraper size truncation in Kāne‘ohe Bay (Figure 10b, Kolmigorov-
Smirnov test, D = 0.09, P = 0.01) and in Hanauma Bay (Figure 9c, D = 0.49, P = 1.1e-05).
However, the fish in those regions had larger size ranges than in Waikīkī’s unprotected site
18
(Figure 10d, D = 0.55, P = 0.007) and were scarcely observed throughout the north shore or in
Waikīkī’s protected site, resulting in patchy size distributions.
Measurements of functional diversity and redundancy were highly correlated with each
other; reserve capacity increased mostly linearly with diversity, and protected sites tended to
have higher diversity and reserve capacity than unprotected sites for grazers (Figure 11a),
scrapers (Figure 11b), and browsers (Figure 11c). However, this pattern was obscured for urchins
(Figure 11d), which had low diversity and reserve capacity in Kāne‘ohe Bay but otherwise had
similar reserve capacity and diversity across all regions and sites. Additionally, scraper diversity
and reserve capacity were higher in Kāne‘ohe Bay than all other regions, and protected sites in
Kāne‘ohe Bay still had greater diversity and reserve capacity than unprotected sites (Figure 10b).
Reserve capacity was low across regions and sites, as no region or site had a functional guild
with a reserve capacity greater than 0.5. Evenness and richness followed similar trends as
diversity and reserve capacity (Figure 12), and grazers in Hanauma Bay and north shore regions
were the only guild to have more than four species per functional guild on average (Figure 11a).
There was a significant difference in turf communities between regions, driven largely by
the distinct turf communities in Kāne‘ohe Bay (Figure 13; PERMANOVA, Pseudo-F = 13.9, R2
= 0.17, P = 0.001). Turf in Kāne‘ohe Bay had fewer members of the order Gelidiales,
Rhodophyta, present than other regions, and no species from the order Corallinales (Appendix
1). While there was substantial overlap between turf communities in protected and unprotected
sites at each region, Hanauma Bay was the only region in which there was no significant
difference in turf communities between protected and unprotected sites (Pair-wise Permutation
Test, Pseudo-F = 1.13, R2 - 0.02, P-adj = 0.99).
19
Discussion Coral reefs are highly valuable coastal regions but are increasingly threatened by human impacts
(Pauly et al. 2005; Newton et al. 2007; Bishop et al. 2011). However, these threats can be
mitigated in part through the effective management of critical functional groups, such as
herbivores (e.g. Pandolfi et al. 2011; Chung et al. 2018), which promote reef resilience and
prevent algal dominance post-disturbance (Mumby et al. 2006a; Hughes et al. 2007; Rasher and
Hay 2010). Here, I assessed O‘ahu’s current marine protected areas to determine whether they
are effectively managing herbivore populations.
Fish and urchin biomass in field sites across O‘ahu was higher inside protected sites than
outside, had higher browser, grazer, and scraper biomass, and had distinct herbivore
assemblages. Additionally, protected sites had higher measures of functional diversity and
redundancy for grazers, scrapers, and browsers. These findings are consistent with previous
reports from Hawaiʻi and elsewhere (Polunin and Roberts 1993; Russ and Alcala 1996;
Friedlander et al. 2007a; Topor et al. 2019), and suggest that MPAs offer some measure of
protection for O‘ahu’s herbivorous fish populations. However, much of these general trends were
driven by observations from Hanauma Bay, which was the only region that had significantly
greater biomass (herbivore or otherwise) inside the protected site and is also the only protected
site that had a distinct herbivore assemblage when compared with its nearby unprotected sites.
Differences in herbivore population are likely not due to predation; Hanauma Bay was
the only region with a significant difference in piscivore biomass between protected and
unprotected sites. Additionally, grazers had higher biomass in protected sites in all regions, but
scraper biomass was higher in unprotected sites in the Waikīkī and north shore regions.
Protection had a substantial effect on browser biomass in the Hanauma Bay and Waikīkī regions,

20
where biomass was 17 and 14 times greater inside their respective protected sites. However,
browser biomass was lower in the north shore protected site than the unprotected site, and
browsers were scarcely observed at all in Kāne‘ohe Bay. These results suggest that not all
herbivore functional guilds have responded positively to protection, the magnitude of guild
response depends on the region of the protected area. Protected sites in Kāne’ohe Bay, Waikīkī,
and the north shore are overall not as effectively managing herbivore populations as the
Hanauma Bay MLCD.
Scraper and browsers had the lowest biomass of all herbivore functional guilds in all
sites, and browsers were completely absent from all but one transect in Kāne‘ohe Bay.
Additionally, while parrotfishes in the genus Chlorurus can excavate substratum when they
reach a certain size (Green and Bellwood 2009), only two individuals larger than the 35cm
threshold were observed during the surveys, indicating that there is limited ability for this
functional guild to carry out its role. Fish in all functional guilds were small, and only 32
herbivorous fish larger than 40 cm were observed across all functional guilds, more than a third
of which were observed in the Hanauma Bay protected site. Given that larger fish have a larger
impact on the benthos (Bellwood and Choat 1990; Bellwood 1995; Ong and Holland 2010;
Smith et al. 2010; Mouillot et al. 2014), it is likely that the functional impact of herbivores is
limited by their smaller size structure throughout O‘ahu. This outcome can also impact further
recruitment, as larger fish have higher fecundity and reproductive success (Berkeley et al. 2004;
Birkeland and Dayton 2005; Hixon et al. 2014). Williams et al. (2008) suggested that O‘ahu has
less than 3% prime spawner biomass observed in remote regions, defined as targeted species of
fish greater than 70% of their maximum observed size, and thus has low population fecundity.

21
Therefore, small sized structure of herbivorous fishes of all functional guilds on O‘ahu may limit
their ability to repopulate the reef, contributing to their low biomass across all regions and sites.
Functional redundancy for herbivorous fish functional guilds was also higher inside the
protected sites, but was typically low all around O‘ahu. Reserve capacity was never greater than
0.5 across all regions and sites, suggesting that the key functional roles of herbivores are
dominated by a single species (Johansson et al. 2013). While it is possible that the remaining
species in each functional guilds are exploiting different functional niches than broad functional
role classifications can capture (e.g. Bellwood et al. 2006; Kelly et al. 2016), low species
richness and diversity in each functional guild limits the more cryptic functional diversity that
these ecosystems might contain. By extension, the loss of further species on O‘ahu’s reefs could
result in the loss of an already limited pool of ecosystem processes (Brandl and Bellwood 2016;
D’agata et al. 2016; Thiault et al. 2017).
Urchins accounted for the most biomass in all regions but Kāne‘ohe Bay, although there
was no clear relationship between protection and urchin biomass. Urchins are potential
competitors for herbivorous fishes (e.g. Hay and Taylor 1985; Tootell and Steele 2016), so
urchin biomass was expected to be relatively higher where herbivorous fish biomass was low
(i.e. outside of the protected sites). However, this trend held true only in Waikīkī and Kāne‘ohe
Bay, and while urchin functional diversity and redundancy was lower inside the protected sites at
the north shore, Kāne‘ohe Bay, and Waikīkī, this was not the case for Hanauma Bay – the region
with the greatest difference in herbivore assemblages inside and outside the protected site. It is
possible that urchins did not respond to changes in herbivorous fish biomass because biomass is
already low throughout O‘ahu; if competitor biomass is already low and differs only between
protected and unprotected sites in certain cases, then responses to further reduced competition

22
may not be as apparent. Additionally, while urchin biomass and functional redundancy were
higher in the Hanauma Bay protected site than the unprotected site, urchins still accounted for
93% of the total herbivore biomass in the unprotected site in this region.
It is also possible that urchin distributions were more influenced by habitat, as urchins
tended to orient with different habitat types than the herbivorous fishes functional guilds in the
ordination space. Herbivorous fishes tend to be associated with coral cover and habitat
complexity (Coker et al. 2014; Jouffray et al. 2015; Yeager et al. 2017), and herbivorous fish
biomass tends to be associated with more productive algal turfs (Russ 2003; Yeager et al. 2017).
While urchin biomass is not associated with turf productivity (Yeager et al. 2017), and their
distribution is likely influenced by settlement cues, such as the presence of certain macroalgae
and biofilms (Dworjanyn and Pirozzi 2008; Mos et al. 2011), as well as post-settlement mortality
(Mos et al. 2011). Habitat cues could also explain the low urchin biomass in Kāne‘ohe Bay, a
unique ecosystem comprised of a network of patch reefs, including O‘ahu’s only barrier reef. It
is possible that the reefs surveyed in Kāne‘ohe Bay are simply less favorable habitats for urchins
than the other regions. Regardless, the numerical dominance of urchins on O‘ahu’s reefs
suggests that they are likely key sources of both grazing (Hay and Taylor 1985; Mumby et al.
2006b, 2007; Sangil and Guzman 2016) and bioerosion (Carriero-Silva and McClanahan 2001;
Griffin et al. 2003), and future studies should further investigate their distribution and role on
Hawaiʻi’s reefs.
While previous studies have variously emphasized the role of turf as a major source of
primary productivity on coral reefs (Adey and Goertemiller 1987), as a possible threat to coral
health (e.g. Carpenter 1986; Birrell et al. 2008; Vermeij et al. 2008), and as food for most
herbivorous fishes (Hay and Taylor 1985; Kelly et al. 2016), this study includes a comprehensive

23
survey of fine-scale turf species composition on O‘ahu. Both turf and herbivore communities
displayed similar trends across regions. Both turf and herbivore communities in Kāne‘ohe Bay
were distinct from other regions, and there was overlap in turf and herbivore communities at all
other regions. These results suggest that herbivore and turf communities are correlated with each
other (Russ 2003; Yeager et al. 2017), which is consistent with previous studies indicating that
fish and benthic communities reciprocally structure each other (Hixon 1986; Coker et al. 2014).
However, turf communities appeared more distinct across site and region than herbivore
communities, and while Hanauma Bay was the only region that had a significant difference in
herbivore assemblage between its protected and unprotected site, it was also the only region that
did not have a significant difference in turf assemblages. Thus, it is unclear from these results
how changes in herbivore and turf community structure influence each other. Stuercke and
McDermid (2004) found that turf communities are affected by physical factors such as wave
exposure, and Smith et al. (2010) found that turf community composition is further altered by the
interactions of time, grazing and bottom-up factors such as nutrient enrichment. By extension,
differences in herbivore community may interact with the structuring impact of physical factors
to drive turf community species composition. Given that herbivorous fishes are likely selective in
the taxa of turf that they consume (Kelly et al. 2016) and turfs can have deleterious effects on
coral reefs in the absence of grazing (Carpenter 1986; Hughes et al. 2007), it is important to
understand how turfs respond to changes in herbivore assemblages. Further research should be
conducted to quantify the interaction between herbivory and turf communities.
While the protected site in Hanauma Bay had healthier fish and urchin populations than
the unprotected site, it is important to acknowledge the differences in habitat quality between the
protected and unprotected sites. The unprotected site was in/near Maunalua Bay, which has been

24
impacted by years of coastal development, invasive algal dominance, and experiences large
seasonal swells. Development has led to increased polluted water runoff, sedimentation, coastal
erosion, and eutrophication (Wolanski et al. 2009). The protected site is in Hanauma Bay proper,
which is comparatively pristine, has no substantial invasive algal growth, and experiences less
runoff, sedimentation, and swell. Given that herbivore populations have been tied to habitat
characteristics in this and other studies (e.g. Jouffray et al. 2015; Yeager et al. 2017), it is likely
that the differences observed in these herbivore assemblages arise in part to the vast difference in
habitats. This caveat is not unique to the Hanauma Bay region. The unique nature of the
Kāne‘ohe Bay has already been discussed, and the unprotected site in this region encompassed
both the fringing reef and patch reefs spatially separated from the protected site. The Waikīkī
protected site is a coastal and shallow area subject to seasonal swell and intense coastal
development, whereas the unprotected colonized site is deeper and further off-shore. The north
shore region had the fewest physical differences between the protected and unprotected sites, and
this was the region with the smallest effect size of protection for all herbivorous fish functional
guilds. These differences suggest that the efficacy of a MPA on O‘ahu should not be evaluated
solely on comparisons between neighboring sites. Evaluation of future MPAs should be based on
extensive survey work prior to the establishment of an MPA to allow for proper Before-After
Control-Impact design as opposed to comparing neighboring sites, such as the methods used to
evaluate the effectiveness of the Kahekili Herbivore Fisheries Management Area on Maui
(Williams et al. 2016).
As Hawaiʻi proceeds with its goal to effectively manage 30% of its coastal zone by 2030,
it is important to assess the efficacy of the current MPAs in protecting critical ecosystem
processes. While herbivore biomass and functional redundancy were higher inside O‘ahu’s

25
protected areas, they were still low, with scrapers and browsers particularly poorly represented.
These patterns indicate that O‘ahu’s current MPAs have limited effectiveness in protecting
herbivore populations. While troubling, this result is consistent with previous findings that reef
fishes in O‘ahu have low biomass, richness, and spawning potential (Williams et al. 2008;
Gorospe et al. 2018). Additionally, evidence of poaching within the protected areas, such as the
presence of line, fish with spearfishing wounds, and presence of fishermen, were observed in all
regions except Hanauma Bay, suggesting limited enforcement within the MPAs. Furthermore,
prior studies have found that coastal development limits MPA effectiveness (Cicin-Sain and
Belfiore 2005; Suchley and Alvarez-Filip 2018), which is likely the case on O‘ahu. However,
Goropse et al. (2018) suggested that O‘ahu has a high recovery potential, and could see up to a
280% increase in fish biomass if human impacts can be managed or minimized. This emphasizes
the importance of proper management, such as by increasing enforcement (e.g. Chung et al.
2018) and incorporating better land-use practices in management plans and future MPA planning
(Cicin-Sain and Belfiore 2005; Suchley and Alvarez-Filip 2018). Further effort should be placed
on bolstering the ecosystem function provided by these populations in O‘ahu’s current MPA
network in addition to future MPAs. As the oceans continue to warm and acidify, the resilience
of coral reefs will be dependent on healthy and diverse herbivore assemblages.

26
Tables Table 1 Functional guild classifications for all herbivore/omnivore species observed during the
study.
Family Species Functional guild Source Acanthuridae Naso lituratus Browser Green and Bellwood 2009
Acanthuridae Naso unicornis Browser Green and Bellwood 2009
Kyphosidae Kyphosus vaigiensis Browser Green and Bellwood 2009
Scaridae Calotomus carolinus Browser Green and Bellwood 2009
Acanthuridae Acanthurus achilles Grazer Green and Bellwood 2009
Acanthuridae Acanthurus blochii Grazer Green and Bellwood 2009
Acanthuridae Acanthurus dussumieri Grazer Green and Bellwood 2009
Acanthuridae Acanthurus leucopareius Grazer Green and Bellwood 2009
Acanthuridae Acanthurus nigrofuscus Grazer Green and Bellwood 2009
Acanthuridae Acanthurus nigroris Grazer Green and Bellwood 2009
Acanthuridae Acanthurus olivaceus Grazer Green and Bellwood 2009
Acanthuridae Acanthurus triostegus Grazer Green and Bellwood 2009
Acanthuridae Acanthurus xanthopterus Grazer Green and Bellwood 2009
Acanthuridae Ctenochaetus strigosus Grazer Froese and Pauly 2017;
Randall 2010
Acanthuridae Zebrasoma flavescens Grazer Green and Bellwood 2009
Acanthuridae Zebrasoma veliferum Grazer Green and Bellwood 2009
Blenniidae Cirripectes venderbilti Grazer Froese and Pauly 2017
Pomacanthidae Centropyge loriculus Grazer Green and Bellwood 2009;
Froese and Pauly 2017
Pomacanthidae Centropyge potteri Grazer Green and Bellwood 2009;
Froese and Pauly 2017
Tetradontidae Canthigaster amboinensis Grazer Froese and Pauly 2017
Scaridae Chlorurus perspicillatus Scraper/excavator Green and Bellwood 2009;
Froese and Pauly 2017
Scaridae Chlorurus spilurus Scraper/excavator Green and Bellwood 2009
Scaridae Scarus psittacus Scraper/excavator Green and Bellwood 2009
Scaridae Scarus rubroviolaceus Scraper/excavator Green and Bellwood 2009

27
Table 1 (cont.) Family Species Functional guild Source Cidaridae Eucidaris metularia Urchin N/A
Diadematidae Diadema paucispinum Urchin N/A
Diadematidae Didadema savignyi Urchin N/A
Diadematidae Echinothrix calamaris Urchin N/A
Diadematidae Echinothrix diadema Urchin N/A
Echinometridae Echinometra mathaei Urchin N/A
Echinometridae Echinometra oblonga Urchin N/A
Echinometridae Echinostrephus aciculatus Urchin N/A
Echinometridae Heterocentrotus mammillatus Urchin N/A
Toxopneustidae Tripneustes gratilla Urchin N/A

28
Table 2: Mean biomass (g/m2 ± SE) for total fish and urchin biomass and each functional guild inside and outside protected sites in each region.
Region Status Total Piscivore Invertivore Corallivore Planktivore Grazer Scraper Browser Urchin O‘ahu
Average Protected 116. ± 17.5 4.83 ± 0.89 7.58 ± 1.02 0.544 ± 0.14 1.68 ± 0.39 30.1 ± 3.19 7.62 ± 1.56 7.87 ± 1.95 58.9 ± 15.4
Unprotected 98.1 ± 10.4 2.71 ± 0.73 6.43 ± 0.97 0.488 ± 0.13 1.49 ± 0.63 16.7 ± 3.89 3.47 ± 0.96 3.82 ± 1.53 63.6 ± 9.01 Hanauma
Bay Protected 195. ± 50.5 6.99 ± 2.45 7.54 ± 0.97 0.52 ± 0.23 0.29 ± 0.14 34.8 ± 2.76 15.9 ± 4.44 7.64 ± 1.59 121. ± 48.9
Unprotected 121. ± 25.6 1.33 ± 1.17 2.75 ± 0.97 0.16 ± 0.13 2.31 ± 2.29 6.69 ± 2.98 1.03 ± 0.52 0.45 ± 0.32 106.9 ± 22.8 Kāne‘ohe
Bay Protected 28.8 ± 6.28 2.47 ± 0.76 8.5 ± 2.24 0.8 ± 0.39 4.51 ± 1.09 15.6 ± 2.77 4.26 ± 0.98 0.06 ± 0.06 1.07 ± 0.78
Unprotected 29.4 ± 8.25 3.02 ± 1.18 6.5 ± 2.08 0.9 ± 0.33 1.31 ± 0.47 6.12 ± 1.66 3.76 ± 1.39 0 ± 0 11.4 ± 7.21 North Shore
Protected 112. ± 18.0 3.38 ± 0.85 5.98 ± 0.61 0.56 ± 0.21 0.56 ± 0.18 24.8 ± 2.52 5.00 ± 2.1 8.93 ± 3.54 62.4 ± 15.0 Unprotected 87.5 ± 15.1 5.11 ± 2.25 11.8 ± 2.79 0.71 ± 0.34 2.18 ± 1.01 20.9 ± 4.85 5.84 ± 3.17 13.3 ± 5.69 27.6 ± 5.81
Waikīkī
Protected 144. ± 32.3 8.14 ± 2.79 9.05 ± 5.27 0.04 ± 0.04 1.02 ± 0.6 60.5 ± 17.2 2.91 ± 1.48 21.8 ± 10.2 42.9 ± 6.87 Unprotected 154. ± 20.6 1.39 ± 0.81 4.68 ± 0.55 0.18 ± 0.1 0.17 ± 0.09 32.9 ± 13.8 3.24 ± 1.58 1.51 ± 0.35 108.5 ± 18.1

29
Table 3: Ratio of the biomass inside protected sites to outside protected sites in each region for total biomass (fishes and urchins), combined herbivores, piscivores, and the individual herbivore functional guilds.
Total (Fish and
urchins) Piscivores Herbivores Grazer Scraper Browser Urchin Oahu
Average 1.2 1.8 1.2 1.8 2.2 2.1 0.9
Hanauma 1.6 5.3 1.6 5.2 15.4 17.0 1.1
Kāne‘ohe 1.2 0.8 1.0 2.5 1.1 NA 0.1
North shore 1.3 0.7 1.5 1.2 0.9 0.7 2.3
Waikīkī 0.9 5.9 0.9 1.8 0.9 14.4 0.4

30
Figures
Figure 1 Map of a) O‘ahu in b) the Main Hawaiian Islands, where study regions are bounded by bold lines
31
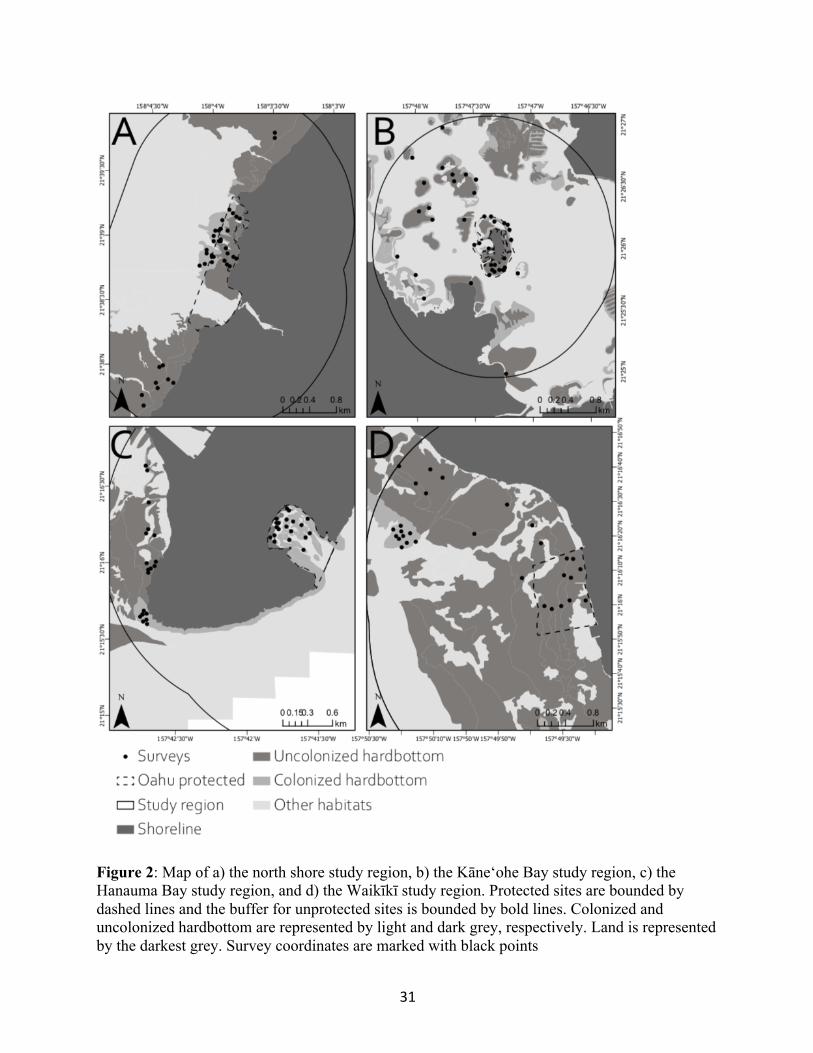
Figure 2: Map of a) the north shore study region, b) the Kāne‘ohe Bay study region, c) the Hanauma Bay study region, and d) the Waikīkī study region. Protected sites are bounded by dashed lines and the buffer for unprotected sites is bounded by bold lines. Colonized and uncolonized hardbottom are represented by light and dark grey, respectively. Land is represented by the darkest grey. Survey coordinates are marked with black points

32
Figure 3: Mean biomass (± SE) of herbivore functional guilds, mean total herbivore biomass (± SE), and mean total biomass (± SE) including non-herbivores inside and outside protected areas (a) across all regions in O‘ahu, (b) off the north shore, (c) in Kāne‘ohe Bay, (d) in Hanauma Bay, and (e) off Waikīkī. * indicates statistical significance ( * P < 0.05, ** P < 0.01, *** P < 0.001).

33
Figure 4: Multivariate comparison of biomass with an nMDS plot of herbivore communities around O‘ahu based on log(biomass + 1). Color indicates region (blue = Hanauma Bay, red = Kāne‘ohe Bay, yellow = north shore, green = Waikīkī) and shape indicates site (solid = protected sites, open = unprotected sites). Bold ellipses bound protected sites and dashed ellipses bound unprotected sites.

34
Figure 5: Constrained ordination using a canonical analysis of principal components of herbivore communities around O‘ahu with protection status and benthic community as predictors. Color indicates the region (blue = Hanauma Bay, red = Kāne‘ohe Bay, yellow = north shore, green = Waikīkī) and shape indicates site (solid = protected sites, open = unprotected sites). Length of the loadings is proportional to the amount of variation explained in the constrained axes.

35
Figure 6: Constrained ordination using a canonical analysis of principal components (CAP) of (a) north shore, (b) Kāne‘ohe Bay, (c) Hanauma Bay, and (d) Waikīkī herbivore communities with protection status and benthic community as predictors. Shape indicates site (solid = protected sites, open = unprotected sites). Text color indicates community data (Red = herbivore community, blue = benthic community). Length of the loadings is proportional to the amount of variation explained in the constrained axes.

36
Figure 7: Size distributions of (a) grazers, (b) browsers, and (c) scraper herbivorous fishes across all regions around O‘ahu. Darker histograms in the top row represent size distributions in protected sites and lighter histograms in the bottom row represent size distributions in unprotected sites. Bold lines represent median size in protected sites and dashed lines represent median size in unprotected sites.

37
Figure 8: Grazer size distributions at (a) the north shore, (b) Kāne‘ohe Bay, (c) Hanauma Bay, and (d) Waikīkī regions. Darker histograms in the top row represent size distributions in protected sites and lighter histograms in the bottom row represent size distributions in unprotected sites. Bold lines represent median size in protected sites and dashed lines represent median size in unprotected sites.

38
Figure 9: Browser size distributions at (a) the north shore, (b) Kāne‘ohe Bay, (c) Hanauma Bay, and (d) Waikīkī regions. Darker histograms in the top row represent size distributions in protected sites and lighter histograms in the bottom row represent size distributions in unprotected sites. Bold lines represent median size in protected sites and dashed lines represent median size in unprotected sites.
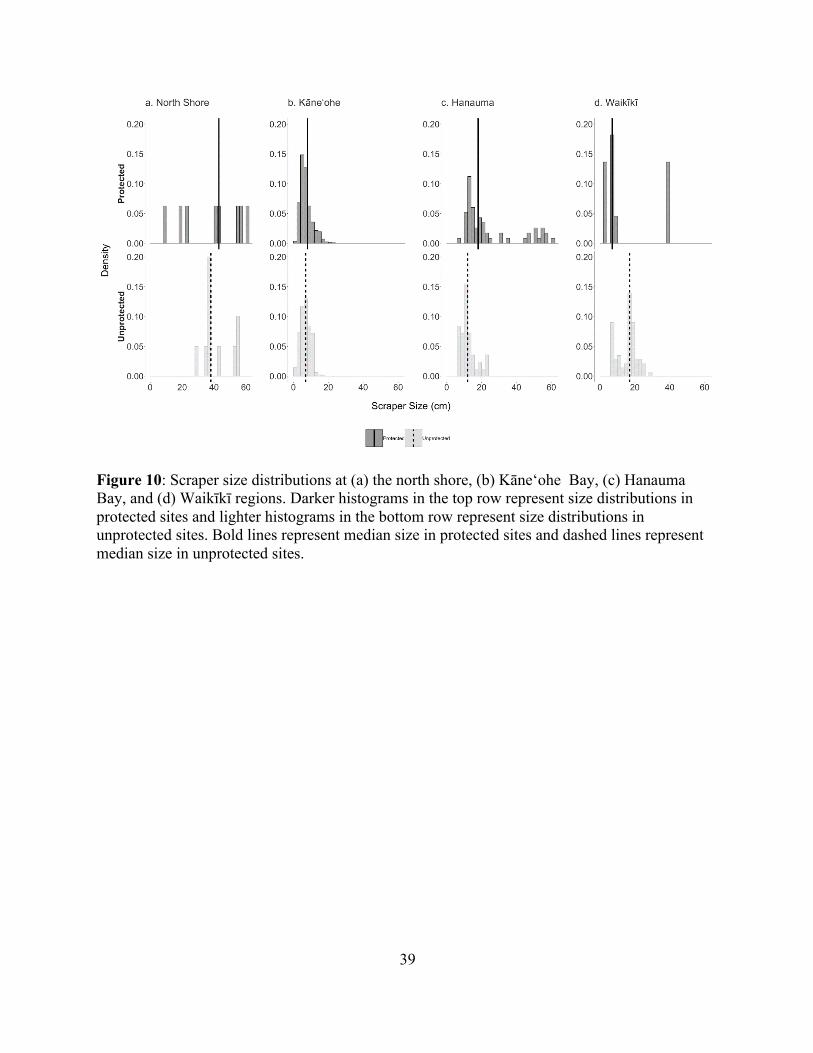
39
Figure 10: Scraper size distributions at (a) the north shore, (b) Kāne‘ohe Bay, (c) Hanauma Bay, and (d) Waikīkī regions. Darker histograms in the top row represent size distributions in protected sites and lighter histograms in the bottom row represent size distributions in unprotected sites. Bold lines represent median size in protected sites and dashed lines represent median size in unprotected sites.

40
Figure 11: Mean Reserve Capacity and diversity (invSimpsons) (± SE) for four functional guilds of herbivores: (a) grazers, (b) scrapers, (c) browsers, and (d) urchins across protected/unprotected sites in the four study regions. Color indicates region (blue = Hanauma Bay, red = Kāne‘ohe Bay, yellow = north shore, green = Waikīkī) and shape indicates site (solid = protected sites, open = unprotected sites).The dashed line represents reserve capacity < 0.5, indicating low functional redundancy, and the shaded area of the graph represents below average diversity.

41
Figure 12: Mean evenness and species richness (± SE) for four functional guilds of herbivores: (a) grazers, (b) scrapers, (c) browsers, and (d) urchins across protected/unprotected regions in the four study regions. Color indicates region (blue = Hanauma Bay, red = Kāne‘ohe Bay, yellow = north shore, green = Waikīkī) and shape indicates site (solid = protected sites, open = unprotected sites). The shaded area of the graph represents below average evenness and richness.

42
Figure 13: nMDS plot of turf communities around O‘ahu. Color indicates region (blue = Hanauma Bay, red = Kāne‘ohe Bay, yellow = north shore, green = Waikīkī) and shape indicates site (solid = protected sites, open = unprotected sites). Bold ellipses bound protected sites and dashed ellipses bound unprotected sites.

43
Appendices Appendix 1: Test statistics from GLM Two-Way ANOVAs assessing differences in Reserve Capacity, Diversity, Evenness, and Richness between regions and protected sites around O‘ahu. Measure Guild Source χ2 df P
Reserve Capacity
Grazer
Protection 14.7 1 0.0001 Region 16.8 3 0.0007 Interaction 1.9 3 0.59
Scraper
Protection 1.9 1 0.16 Region 50.9 3 4.90E-05 Interaction 1.88 3 0.59
Browser
Protection 14.4 1 1.50E-04 Region 0.5 2 0.8 Interaction 2.14 2 0.34
Urchin
Protection 0.9 1 0.34 Region 17.8 3 4.70E-04 Interaction 25.7 3 1.10E-05
Diversity
Grazer
Protection 16.4 1 5.10E-05 Region 15.8 3 0.001 Interaction 3.4 3 0.35
Scraper
Protection 4.9 1 3.00E-02 Region 61.8 3 4.25E-13 Interaction 3.21 3 0.36
Browser
Protection 20.6 1 6.77E-06 Region 3.55 2 0.17 Interaction 3.74 2 0.15
Urchin
Protection 0.08 1 0.77 Region 136 3 2.22E-16 Interaction 19.2 3 2.50E-04
Evenness
Grazer
Protection 12.8 1 3.30E-04 Region 15.8 3 0.001 Interaction 4.55 3 0.21
Scraper
Protection 1.34 1 0.25 Region 63.4 3 1.10E-13 Interaction 1.98 3 0.58
Browser
Protection 16 1 6.30E-05 Region 0.87 2 0.65 Interaction 0.59 2 0.74
Urchin
Protection 0.69 1 0.4 Region 29.2 3 1.90E-06 Interaction 21.1 3 9.90E-05

44
Appendix 1 (cont.)
Richness
Grazer
Protection 35.9 1 2.08E-09 Region 8.69 3 0.03 Interaction 15.3 3 0.001
Scraper
Protection 4.65 1 0.03 Region 65.9 3 5.19E-14 Interaction 3.88 3 0.27
Browser
Protection 18.8 1 1.44E-05 Region 4.75 2 0.09 Interaction 2.51 2 0.29
Urchin
Protection 0.25 1 0.61 Region 92.6 3 2.20E-16 Interaction 12 3 0.007

45
Appendix 2: Mean reserve capacity (RC), diversity (invSimpsons), species richness, and evenness across regions and sites for each functional guild (±SE).
RC Diversity Richness Evenness Hanauma Protected 0.33±0.03 2.05±0.15 4.7±0.38 0.61±0.04 Hanauma Unprotected 0.13±0.05 0.98±0.25 1.35±0.36 0.27±0.09 Kaneohe Protected 0.39±0.04 2.27±0.2 3.65±0.34 0.69±0.06 Grazers Kaneohe Unprotected 0.32±0.05 1.91±0.23 2.8±0.38 0.63±0.08 North Shore Protected 0.44±0.03 2.56±0.19 4.8±0.37 0.72±0.04 North Shore Unprotected 0.32±0.05 2.03±0.21 3.25±0.35 0.59±0.08 Waikiki Protected 0.29±0.07 2.01±0.32 3.2±0.61 0.58±0.11 Waikiki Unprotected 0.19±0.05 1.51±0.22 2.65±0.42 0.4±0.07 Hanauma Protected 0.15±0.05 1.29±0.16 1.4±0.18 0.36±0.1 Hanauma Unprotected 0.03±0.03 0.37±0.14 0.4±0.15 0.08±0.06 Browsers North Shore Protected 0.14±0.04 1.2±0.15 1.45±0.2 0.39±0.09 North Shore Unprotected 0.07±0.03 0.87±0.18 1.05±0.26 0.16±0.07 Waikiki Protected 0.22±0.07 1.39±0.28 1.8±0.39 0.49±0.14 Waikiki Unprotected 0.04±0.02 0.84±0.12 0.9±0.14 0.12±0.07 Hanauma Protected 0.08±0.04 0.92±0.14 1.05±0.18 0.19±0.08 Hanauma Unprotected 0±0 0.41±0.12 0.45±0.14 0.02±0.02 Kaneohe Protected 0.22±0.04 1.4±0.14 1.6±0.15 0.59±0.1 Scrapers Kaneohe Unprotected 0.19±0.04 1.28±0.15 1.45±0.17 0.51±0.1 North Shore Protected 0.03±0.03 0.4±0.13 0.4±0.13 0.05±0.05 North Shore Unprotected 0.02±0.02 0.24±0.12 0.25±0.12 0.05±0.05 Waikiki Protected 0.03±0.03 0.58±0.21 0.6±0.22 0.09±0.09 Waikiki Unprotected 0.04±0.02 0.54±0.14 0.6±0.17 0.12±0.07 Hanauma Protected 0.16±0.04 1.4±0.09 3.15±0.36 0.37±0.05 Hanauma Unprotected 0.03±0.01 0.92±0.09 2±0.32 0.11±0.04 Kaneohe Protected 0.01±0.01 0.13±0.1 0.2±0.16 0.03±0.03 Urchins Kaneohe Unprotected 0.03±0.01 0.42±0.13 0.8±0.27 0.11±0.04 North Shore Protected 0.06±0.01 1.09±0.06 2.5±0.22 0.23±0.03 North Shore Unprotected 0.11±0.03 1.17±0.11 2.45±0.26 0.32±0.06 Waikiki Protected 0.06±0.01 1.14±0.02 2.6±0.31 0.26±0.03 Waikiki Unprotected 0.08±0.02 1.2±0.04 2.95±0.28 0.26±0.04

46
Appendix 3: Turf species identified inside and outside the protected areas.
North Shore Protected
North Shore Unprotected
Kāneʻohe Protected
Kāneʻohe Unprotected
Hanauma Protected
Hanauma Unprotected
Waikīkī Protected
Waikīkī Unprotected
Cyanobacteria Anabaena sp. X X Calothrix sp. X X X X X X Lyngbya sp. X X X X X X X X Oscillatoria sp. X X X X X X Cyanobacteria with polar heterocyst X X X X X
Brown Algae Asteronema rhodochortonoides X Dictyota sp. X X X X X X Feldmannia indica X X X X Feldmannia lebelii X X X X Feldmannia mitchelliae X Feldmannia sp. X X X X X X Kuetzingiella elachistaeformis X Padina sp. X X X X X X Sphacelaria novae-hollandiniae X X X X X X Sphacelaria rigidula X X X X X Sphacelaria tribuloides X Sphacelaria sp. X X X X X X X X Asteronema sp X X Ectocarpales with unilocular structures X Uniseriate brown with anomalously swollen sides to cells that alternate from one side of the cell to the other X X

47
Phaeophyte unknown possible Ectocarpales
Green Algae
Chaetomorpha sp. X X Chlorodesmis caespitosa X X X Cladophora fuliginosa X X Cladophora sericea X X X X Cladophora sp A X X Cladophora sp B X X Cladophora sp D X X Cladophora sp. C X X X X X Cladophoropsis membranacea X Cladophoropsis sp. X Derbesia fastigiata X X Derbesia sp. X X X X X X X X Rhipidosiphon sp. X X X X Siphonogramen abbreviatum X X X Siphonogramen parva X X X X Ulva clathrata X Ulva flexuosa X X Ulva paradoxa X X X X X Ulvella sp. X Uronema marinum X X X X X X X X Unidentified Bryopsidaceae X Laterally branching siphonous Bryopsidales X Uniseriate unbranched Cladophorales sp. A X X X X Uniseriate unbranched Cladophorales sp. B X X X X X X X Uniseriate unbranched Cladophorales sp. C X X

48
Uniseriate unbranched Cladophorales sp. D X X X X
Red Algae Aglaothamnion boergesenii X Amansia glomerata X Anotrichium tenue X X X X X X Anotrichium sp X Antithamnion percurrens X Asparagopsis taxiformis X X X X X X Caulacanthus ustulatus X X X Centroceras sp X X X X X X X Ceramium aduncum X Ceramium cingulum X X Ceramium clarionensis X X Ceramium codii X X X X X X Ceramium diaphanum X X X Ceramium dumosertum X X X Ceramium macilentum X X X X Ceramium paniculatum X Ceramium punctiforme X Ceramium serpens X X X X X X Ceramium vagans X X Ceramium womersleyi X Ceramium sp. A X X X X Ceramium sp. B X Ceramium sp. C X Ceratodictyon intricatum X X Ceratodictyon variabile X X X X Ceratodictyon sp. X X X X X Champia parvula X X X Chondria polyrhiza X X X X X Chondria simpliciuscula X X X X X X Chondria sp. A X Chondria sp. B X X X X X

49
Chondria-like Rhodomelaceae X Corallophila sp. X X X Dasya sp. X X Digenea cymatophila X X X Exophyllum wentii X Gayliella fimbriata X X X X X Gayliella flaccida X X X X X X Gelidiella acerosa X Gelidiella sp. X X X X X Gelidium pusillum X X X X X X Griffithsia heteromorpha X X X X X X X X Gymnothamnion elegans X Herposiphonia arcuata X Herposiphonia crassa X X X Herposiphonia delicatula X X X X X Herposiphonia nuda X X X X X X Herposiphonia obscura X X Herposiphonia pacifica X X X X Herposiphonia parca X X Herposiphonia secunda X X X X Herposiphonia variabilis X X X X X Herposiphonia sp. A X Herposiphonia sp. B X Herposiphonia sp. C X Heterosiphonia crispella X Hypnea sp. X X X X X X Hypoglossum minimum X Jania adhaerens X X X X X X Jania micrarthrodia X X X X X X Jania pumila X X X X X X

50
Jania sp. X Kapraunia pentamera X X Lejolisia pacifica X X X X X X Lejolisia sp. X X Lomentaria hakodatensis X Lophosiphonia cristata X X X X Melanothamnus apiculatus X X X X Melanothamnus delicatulus X X X X Melanothamnus pseudovillum X Melanothamnus savatieri X Melanothamnus sparsus X X X X X X Melanothamnus sphaerocarpus X X X X X Melanothamnus upolensis X X X Millerella myrioclada X X X X X X Neosiphonia sertularioides X X X Palisada crustiformans X Polysiphonia anomala X X X X X Polysiphonia exilis X X Polysiphonia homoia X Polysiphonia howei X X X X Polysiphonia profunda X X Polysiphonia rubrorhiza X Polysiphonia scopulorum X X X X Polysiphonia subtilissima X X X X X X Polysiphonia triton X X X X X X

51
Polysiphonia tsudana X X X Polysiphonia tuberosa X Polysiphonia sp. A X Polysiphonia sp. B X Polyisphonia sp. C X Polysiphonia sp. D X X Polysiphonia sp. E X Polysiphonia sp. F X Polysiphonia sp. G X Polysiphonia sp. H X Polysiphonia sp. I X X Polysiphonia sp. J X Polysiphonia sp. K X X X Polysiphonia sp. L X X Polysiphonia sp. M X Polysiphonia sp. N X Polysiphonia sp. O X Polysiphonia sp. P X Polysiphonia sp. Q X X Polysiphonia sp. R X Polysiphonia-like Rhodomelaceae X Stylonema sp. X X X X X X X X Taenioma perpusillum X X X X Tiffaniella saccorhiza X X X Tolypiocladia glomerulata X X X Womersleyella herpa X X X Womersleyella setacea X X X X X Vertebrata foetidissima X Vertebrata sp. X X X

52
Unidentified multiaxial Gigartinales X Unidentified Rhodomelaceae X Laterally branching acrochaetiod X X X Multiaxial anastomosing red X Uniseriate dichotomous red X X X X

53
References
Abbott IA (1999) Marine red algae of the Hawaiian islands. Bishop Museum, Honolulu, HI
Abbott IA, Huisman JM (2004) Marine green and brown algae of the Hawaiian islands. Bishop
Museum, Honolulu, HI
Adam TC, Kelley M, Ruttenberg BI, Burkepile DE (2015) Resource partitioning along multiple
niche axes drives functional diversity in parrotfishes on Caribbean coral reefs. Oecologia
179:1173–1185
Adey WH, Goertemiller T (1987) Coral reef algal turfs: master producers in nutrient poor seas.
Phycologia 26:374–386
Basford AJ, Feary DA, Truong G, Steinberg PD, Marzinelli EM, Vergés A (2016) Feeding
habits of range-shifting herbivores: Tropical surgeonfishes in a temperate environment. Mar
Freshw Res 67:75–83
Beijbom O, Edmunds PJ, Kline DI, Mitchell BG, Kriegman D (2012) Automated annotation of
coral reef survey images. Proc IEEE Comput Soc Conf Comput Vis Pattern Recognit 1170–
1177
Beijbom O, Edmunds PJ, Roelfsema C, Smith J, Kline DI, Neal BP, Dunlap MJ, Moriarty V, Fan
TY, Tan CJ, Chan S, Treibitz T, Gamst A, Mitchell BG, Kriegman D (2015) Towards
automated annotation of benthic survey images: Variability of human experts and
operational modes of automation. PLoS One 10:1–22
Bellwood DR (1995) Direct estimate of bioerosion by two parrotfish species, Chlorurus gibbus
and C. sordidus, on the Great Barrier Reef, Australia. Mar Biol 121:419–429
Bellwood DR, Choat JH (1990) A functional analysis of grazing in parrotfishes (family
Scaridae): the ecological implications. Environ Biol Fishes 28:189–214

54
Bellwood DR, Hoey AS, Choat JH (2003) Limited functional redundancy in high diversity
systems: Resilience and ecosystem function on coral reefs. Ecol Lett 6:281–285
Bellwood DR, Hughes TP, Folke C, Nystrom M (2004) Confronting the coral reef crisis. Nature
429:827–833
Bellwood DR, Wainwright PC, Fulton CJ, Hoey AS (2006) Functional versatility supports coral
reef biodiversity. Proc R Soc B 273:101–107
Berkeley SA, Hixon MA, Larson RJ, Love MS (2004) Fisheries sustainability via protection of
age structure and spatial distribution of fish populations. Fisheries 29:23–32
Birkeland C, Dayton PK (2005) The importance in fishery management of leaving the big ones.
Trends Ecol Evol 20:356–358
Birrell CL, Mccook LJ, Willis BL, Diaz-Pulido GA (2008) Effects of benthic algae on the
replenishment of corals and the implications for the resilience of coral reefs. Oceanogr Mar
Biol An Annu Rev 46:25–63
Bishop RC, Chapman DJ, Kannien BJ, Krosnick JA, Leeworthy B, Meade NF (2011) Total
economic value for protecting and restoring Hawaiian coral reef ecosystems: final report.
Silver Spring, MD: NOAA Office of National Marine Sanctuaries, Office of Response and
Restoration, and Coral Reef Conservation Program. NOAA Technical Memorandum CRCP
16. 406 pp
Bonaldo RM, Bellwood DR (2008) Size-dependent variation in the functional role of the
parrotfish Scarus rivulatus on the Great Barrier Reef, Australia. Mar Ecol Prog Ser
360:237–244
Brandl SJ, Bellwood DR (2014) Individual-based analyses reveal limited functional overlap in a
coral reef fish community. J Anim Ecol 83:661–670

55
Brandl SJ, Bellwood DR (2016) Microtopographic refuges shape consumer-producer dynamics
by mediating consumer functional diversity. Oecologia 182:203–217
Brown E, Cox E, Jokiel P, Rodgers KS, Smith W, Tissot B, Coles S, Hultquist J (2004)
Evaluation of benthic sampling methods considered for the Coral Reef Assessment and
Monitoring Program (CRAMP) in Hawai‘i. Pacific Sci 58:145–158
Bruggemann JH, Van Kessel AM, Van Rooij JM, Breeman AM (1996) Bioerosion and sediment
ingestion by the caribbean parrotfish Scarus vetula and Sparisoma viride: Implications of
fish size, feeding mode and habitat use. Mar Ecol Prog Ser 134:59–71
Burkepile DE, Hay ME (2008) Herbivore species richness and feeding complementarity affect
community structure and function on a coral reef. Proc Natl Acad Sci 105:16201–16206
Carpenter KE, Arbrar M, Aeby G, Aronson RB, Banks S, Bruckner A, Chirriboga A, Cortés J,
Delbeel JC, DeVantier L, Edgar GJ, Edwards AJ, Fenner D, Guzman HM, Hoeksema BW,
Hodgson G, Johan O, Licuanan WY, Livingstone SR, Lovell ER, Moore JA, Obura DO,
Ochavillo D, Polidoro BA, Precht WF, Quibilan MC, Reboton C, Richards ZT, Rogers AD,
Sanciangco J, Sheppard A, Sheppard C, Smith J, Stuart S, Turak E, Veron JEN, Wallace C,
Weil E, Wood E (2008) One-third of reef-building corals face elevated extinction risk from
climate change and local impacts. Sciencexpress 321:560–563
Carpenter RC (1986) Partitioning herbivory and its effects on coral reef algal communities. Ecol
Monogr 56:345–364
Carriero-Silva M, McClanahan TR (2001) Echinoid bioerosion and herbivory on Kenyan coral
reefs: the role of protection from fishing. J Exp Mar Bio Ecol 262:133–153
Chung A, Oliver T, Gove J, Gorospe K, White D, Davidson K, Walsh W (2018) Translating
resilience-based management theory to practice for coral bleaching recovery in Hawai‘i.

56
Mar Policy 99:58–68
Cicin-Sain B, Belfiore S (2005) Linking marine protected areas to integrated coastal and ocean
management: A review of theory and practice. Ocean Coast Manag 48:847–868
Cinner JE, McClanahan TR, Daw TM, Graham NAJ, Maina J, Wilson SK, Hughes TP (2009)
Linking social and ecological systems to sustain coral reef fisheries. Curr Biol 19:206–212
Clements CS, Hay ME (2018) Overlooked coral predators suppress foundation species as reefs
degrade. Ecol Appl 0:1–10
Coker DJ, Wilson SK, Pratchett MS (2014) Importance of live coral habitat for reef fishes. Rev
Fish Biol Fish 24:89–126
Connell SD, Foster MS, Airoldi L (2014) What are algal turfs? Towards a better description of
turfs. Mar Ecol Prog Ser 495:299–307
Coyne M, Battista T, Anderson M, Waddell J, Smith W, P J, Kenall M, Monaco M (2003)
Benthic habitats of the Main Hawaiian Islands. Silver Spring, MD: National Oceanic and
Atmospheric Administration. NOAA Technical Memorandum. 49 pp
D’agata S, Vigliola L, Graham NAJ, Wantiez L, Parravicini V, Mou-tham G, Frolla P,
Friedlander AM, Kulbicki M, Mouillot D (2016) Unexpected high vulnerability of functions
in wilderness areas: evidence from coral reef fishes. Proc R Soc B 283:20160128
D’Elia CF, Webb KL, Porter JW (1981) Nitrate-rich groundwater inputs to Discovery Bay,
Jamaica: a significant source of N to local coral reefs? Bull Mar Sci 31:903–910
Darling ES, Stephanie D (2017) Coral reefs: fishing for sustainability. Curr Biol 27:R65–R68
Division of Aquatic Resources (DAR) (2016) World Conservation Congress Legacy
Commitment : “ Hawai‘i 30 by 30 Oceans Target.”
https://dlnr.hawaii.gov/dar/announcements/hawaii-30-by-30-oceans-target/

57
Dworjanyn SA, Pirozzi I (2008) Induction of settlement in the sea urchin Tripneustes gratilla by
macroalgae, biofilms and conspecifics: A role for bacteria? Aquaculture 274:268–274
Edwards CB, Friedlander AM, Green AL, Hardt MJ, Sala E, Sweatman HP, Williams ID,
Zgliczynski B, Sandin SA, Smith JE (2014) Global assessment of the status of coral reef
herbivorous fishes : evidence for fishing effects. Proc R Soc B 281:7–11
Folke C, Carpenter S, Walker B, Scheffer M, Elmqvist T, Gunderson L, Holling CS (2004)
Regime shifts, resilience, and biodiversity in ecosystem management. Annu Rev Ecol Evol
Syst 35:557–581
Friedlander AM, Brown E, Monaco ME (2007a) Defining reef fish habitat utilization patterns in
Hawaii : comparisons between marine protected areas and areas open to fishing. Mar Ecol
Prog Ser 351:221–233
Friedlander AM, Brown E, Monaco ME, Clark A (2006) Fish habitat utilization patterns and
evaluation of the efficacy of Marine Protected Areas in Hawaii: integration of NOAA
digital benthic habitat mapping and coral reef ecological studies. NOAA Tech Memo NOS
NCCOS 23. 213 pp
Friedlander AM, Brown EK, Monaco ME (2007b) Coupling ecology and GIS to evaluate
efficacy of marine protected areas in Hawaii. Ecol Appl 17:715–730
Froese R, Pauly D (2017) Fishbase. World Wide Web electronic publication. www.fishbase.org
Gido KB (2003) Effects of gizzard shad on benthic communities in reservoirs. J Fish Biol
62:1392–1404
Gorospe KD, Donahue MJ, Heenan A, Gove JM, Williams ID, Brainard RE (2018) Local
biomass baselines and the recovery potential for Hawaiian coral reef fish communities.

58
Front Mar Sci 5:1–13
Graham NAJ, McClanahan TR, MacNeil MA, Wilson SK, Cinner JE, Huchery C, Holmes TH
(2017) Human disruption of coral reef trophic structure report human disruption of coral
reef trophic structure. Curr Biol 27:231–236
Green AL, Bellwood DR (2009) Monitoring functional groups of herbivorous reef fishes as
indicators of coral reef resilience a practical guide for coral reef managers in the Asia
Pacific region. IUCN working group on Climate Change and Coral Reefs. IUCN, Gland,
Switzerland. 70 pp
Griffin SP, Bahgooli R, Weil E (2003) Bioerosion in coral reef communities in southwest Puerto
Rico by the sea urchin Echinometra viridis. Mar Biol 143:79–84
Guiry M, Guiry G (2019) Algaebase. World-wide electronic publication. www.algaebase.org
Hay ME, Taylor PR (1985) Competition between herbivorous fishes and urchins on Caribbean
reefs. Oecologia 65:591–598
Hixon MA (1986) Fish predation and local prey diversity. Contemporary studies on fish feeding:
the proceedings of GUTSHOP’84. Dordrecht pp 235–257
Hixon MA (2015) Reef fishes, seaweeds, and corals: a complex triangle. In: Birkeland C. (eds)
Coral Reefs in the Anthropocene. Springer Science, New York, NY, pp 195–215
Hixon MA, Johnson DW, Sogard SM (2014) Structure in fishery populations. ICES J Mar Sci
71:2171–2185
Hoey AS, Bellwood DR (2009) Limited functional redundancy in a high diversity system: Single
species dominates key ecological process on coral reefs. Ecosystems 12:1316–1328
Houk P, Cuetos-Bueno J, Kerr AM, McCann K (2018a) Linking fishing pressure with ecosystem
thresholds and food web stability on coral reefs. 88:109–119

59
Houk P, Cuetos-Bueno J, Tibbatts B, Gutierrez J (2018b) Variable density dependence and the
restructuring of coral-reef fisheries across 25 years of exploitation. Sci Rep 8:1–14
Hughes TP, Rodrigues MJ, Bellwood DR, Ceccarelli D, Hoegh-Guldberg O, McCook L,
Moltschaniwskyj N, Pratchett MS, Steneck RS, Willis B (2007) Phase shifts, herbivory, and
the resilience of coral reefs to climate change. Curr Biol 17:360–365
Johansson CL, van de Leemput IA, Depczynski M, Hoey AS, Bellwood DR (2013) Key
herbivores reveal limited functional redundancy on inshore coral reefs. Coral Reefs 32:963–
972
Jouffray J, Nystrom M, Norstrom A V, Williams ID, Wedding LM, Kittinger JN, Williams GJ
(2015) Identifying multiple coral reef regimes and their drivers across the Hawaiian
archipelago. Philos Trans R Soc B Biol Sci 370:20130268
Kelly ELA, Eynaud Y, Clements SM, Gleason M, Sparks RT, Williams ID, Smith JE (2016)
Investigating functional redundancy versus complementarity in Hawaiian herbivorous coral
reef fishes. Oecologia 182:1151–1163
Klumpp DW, Pulfrich A (1989) Trophic significance of herbivorous macroinvertebrates on the
central Great Barrier Reef. Coral Reefs 8:135–144
Kulbicki M, Guillemot N, Amand M (2005) A general approach to length-weight relationships
for New Caledonian lagoon fishes. Cybium 29:235–252
Magurran AL (1988) Ecological diversity and its measurements. Princeton University Press,
Princeton, NJ
Marshell A, Mumby PJ (2012) Revisiting the functional roles of the surgeonfish Acanthurus
nigrofuscus and Ctenochaetus striatus. Coral Reefs 31:1093–1101
60
McClanahan TR (1988) Coexistence in a sea urchin guild and its implications to coral reef
diversity and degradation. Oecologia 77:210–218
Mccormick MI (1994) Comparison of field methods for measuring surface topography and their
associations with a tropical reef fish assemblage. Mar Ecol Prog Ser 112:87–96
McCoy KS, Williams ID, Friedlander AM, Ma H, Teneva L, Kittinger JN (2018) Estimating
nearshore coral reef-associated fisheries production from the main Hawaiian Islands. PLoS
One 13:1–13
Meyer JL, Schultz ET (1985) Migrating haemulid fishes as a source of organic matter on coral
reefs. Limnol Oceanogr 30:146–156
Michael PJ, Hyndes GA, Vanderklift MA, Vergés A (2013) Identity and behaviour of
herbivorous fish influence large-scale spatial patterns of macroalgal herbivory in a coral
reef. Mar Ecol Prog Ser 482:227–240
Moberg F, Folke C (1999) Ecological goods and services of coral reef ecosystems. Ecol Econ
29:215–233
Mora C, Spirandelli D, Franklin EC, Lynham J, Kantar MB, Miles W, Smith CZ, Freel K, Moy
J, Louis L V, Barba EW, Bettinger K, Frazier AG, Colburn IX JF, Hanasaki N, Hawkins E,
Hirabayashi Y, Knorr W, Little CM, Emanuel K, Sheffield J, Patz JA, Hunter CL (2018)
Broad threat to humanity from cumulative climate hazards intensified by greenhouse gas
emissions. Nat Clim Chang 8:1062–1071
Mos B, Cowden KL, Nielsen SJ, Dworjanyn SA (2011) Do cues matter? Highly inductive
settlement cues don’t ensure high post-settlement survival in sea urchin aquaculture. PLoS
One 6:e28054
Mouillot D, Villéger S, Parravicini V, Kulbicki M, Arias-gonzález JE, Bender M, Chabanet P,

61
Floeter SR, Friedlander A, Vigliola L, Bellwood DR (2014) Functional over-redundancy
and high functional vulnerability in global fish faunas on tropical reefs. Proc Natl Acad Sci
111:13757–13762
Mumby PJ, Dahlgren CP, Harborne AR, Kappel C V, Micheli F, Brumbaugh DR, Holmes KE,
Mendes JM, Broad K, Sanchirico JN, Buch K, Box S, Stoffle RW, Gill AB (2006a) Fishing,
trophic cascades, and the process of grazing on coral reefs. Science 311:98–101
Mumby PJ, Hastings A, Edwards HJ (2007) Thresholds and the resilience of Caribbean coral
reefs. Nature 450:98–101
Mumby PJ, Hedley JD, Zychaluk K, Harborne AR, Blackwell PG (2006b) Revisiting the
catastrophic die-off of the urchin Diadema antillarum on Caribbean coral reefs : Fresh
insights on resilience from a simulation model. Ecol Modell 196:131–148
Nagelkerken I, Dorenbosch M, Verberk WCEP, Cocheret de la Moriniere E, van der Velde G
(2000) Day-night shifts of fishes between shallow-water biotopes of a Caribbean bay, with
emphasis on the nocturnal feeding of Haemulidae and Lutjanidae. Mar Ecol Prog Ser
194:55–64
Nash KL, Bijoux J, Robinson J, Wilson SK, Graham NAJ (2016) Harnessing fishery-
independent indicators to aid management of data-poor fisheries: weighing habitat and
fishing effects. Ecosphere 7:1–18
Newton K, Côté IM, Pilling GM, Jennings S, Dulvy NK (2007) Current and future sustainability
of island coral reef fisheries. Curr Biol 17:655–658
Norman MD, Jones GP (1984) Determinants of territory size in the pomacentrid reef fish , Parma
victoriae. Oecologia 61:60–69
Nystrom M, Graham NAJ, Lonkrantz J, Nortstrom A V (2008) Capturing the cornerstones of

62
coral reef resilience : linking theory to practice. Coral Reefs 27:795–809
Odum HT, Odum EP (1955) Trophic structure and productivity of a windward coral reef
community on Eniwetok Atoll. Ecol Monogr 25:291–320
Oksanen J (2011) Multivariate Analysis of ecological communities in R: vegan tutorial.
Ong L, Holland KN (2010) Bioerosion of coral reefs by two Hawaiian parrotfishes: Species, size
differences and fishery implications. Mar Biol 157:1313–1323
Pandolfi JM, Connolly SR, Marshall DJ, Cohen AL (2011) Projecting coral reef futures under
global warming and ocean acidification. Science 333:418–422
Pauly D, Watson R, Alder J (2005) Global trends in world fisheries: impacts on marine
ecosystems and food security. Philos Trans R Soc B Biol Sci 360:5–12
Polunin NVC, Roberts CM (1993) Greater biomass and value of target coral-reef fishes in two
small Caribbean marine reserves. Mar Ecol Prog Ser 100:167–176
Price IR, Scott FJ (1992) The turf algal flora of the Great Barrier Reef, Part I: Rhodophyta.
James Cook University of North Queensland, Queensland, AU
Randall JE (2010) Shore fishes of Hawai’i - Revised Edition. Latitude 20 University of Hawaii
Press Honolulu, HI
Rasher DB, Hay ME (2010) Chemically rich seaweeds poison corals when not controlled by
herbivores. Proc Natl Acad Sci 107:9683–9688
Regalado JM, Campos WL, Santillan AS (2011) Population biology of Tripneustes gratilla
(Linnaeus) (Echinodermata) in seagrass beds of Southern Guimaras, Philippines. Sci
Diliman 22:41–49
Risk MJ (1972) Fish diversity on a coral reef in the Virgin Islands. Atoll Res Bull 153:
Russ GR (2003) Grazer biomass correlates more strongly with production than with biomass of

63
algal turfs on a coral reef. Coral Reefs 22:63–67
Russ GR, Alcala AC (1996) Marine reserves: rates and patterns of recovery and decline of large
predatory fish. Ecol Appl 6:947–961
Sangil C, Guzman HM (2016) Assessing the herbivore role of the sea-urchin Echinometra
viridis: Keys to determine the structure of communities in disturbed coral reefs. Mar
Environ Res 120:202–213
Smith JE, Hunter CL, Smith CM (2010) The effects of top-down versus bottom-up control on
benthic coral reef community structure. Oecologia 132:497–507
Smith JE, Smith CM, Hunter CL (2001) An experimental analysis of the effects of herbivory and
nutrient enrichment on benthic community dynamics on a Hawaiian reef. Coral Reefs
19:332–342
Stimson J, Cunha T, Philippoff J (2007) Food preferences and related behavior of the browsing
sea urchin Tripneustes gratilla (Linnaeus) and its potential for use as a biological control
agent. Mar Biol 151:1761–1772
Stuercke B, McDermid KJ (2004) Variation in algal turf species composition and abundance on
two Hawaiian shallow subtidal reefs. Cryptogam Algol 24:353–365
Suchley A, Alvarez-Filip L (2018) Local human activities limit marine protection efficacy on
Caribbean coral reefs. Conserv Lett 11:e12571
Tanner JE (1995) Competition between scleractinian corals and macroalgae: An experimental
investigation of coral growth, survival and reproduction. J Exp Mar Bio Ecol 190:151–168
Thiault L, Collin A, Chlous F, Gelcich S, Claudet J (2017) Combining participatory and
socioeconomic approaches to map fishing effort in smallscale fisheries. PLoS One 12:
Tootell JS, Steele MA (2016) Distribution , behavior , and condition of herbivorous fishes on

64
coral reefs track algal resources. Oecologia 181:13–24
Topor ZM, Rasher DB, Duffy JE, Brandl SJ (2019) Marine protected areas enhance coral reef
functioning by promoting fish biodiversity. Conserv Lett e12638
Tsuda RT, Abbott IA (1985) Collecting, handling, preservation and logistics. In: Littler MM,
Littler DS. (eds) Ecological Field Methods: Macroalgae. Handbook of Phycological
Methods. Cambridge Univ. Press, New York, NY, pp 67–68
Veazey L, Williams O, Wade R, Toonen R, Spalding HL (2019) Present-day distribution and
potential spread of the invasive green alga Avrainvillea amadelpha around the Main
Hawaiian Islands. Front Mar Sci 6:1–12
Vermeij MJA, Sandin S, Diego S (2008) Density-dependent settlement and mortality structure
the earliest life phases of a coral population. Ecology 89:1994–2004
Williams ID, Walsh WJ, Schroeder RE, Friedlander AM, Richards BL, Stamoulis KA (2008)
Assessing the importance of fishing impacts on Hawaiian coral reef fish assemblages along
regional-scale human population gradients. Environ Conserv 35:261–272
Williams ID, White DJ, Sparks RT, Lino KC, Zamzow JP, Kelly ELA, Ramey HL (2016)
Responses of herbivorous fishes and benthos to 6 years of protection at the Kahekili
Herbivore Fisheries Management Area, Maui. PLoS One 11:e0159100
Wolanski E, Martinez JA, Richmond RH (2009) Quantifying the impact of watershed
urbanization on a coral reef: Maunalua Bay, Hawaii. Estuar Coast Shelf Sci 84:259–268
Yeager LA, Deith MCM, McPherson JM, Williams ID, Baum JK (2017) Scale dependence of
65
environmental controls on the functional diversity of coral reef fish communities. Glob Ecol
Biogeogr 26:1177–1189


![appraisal marine fisheries gujarat - [email protected] - Central Marine](https://img.dokumen.tips/doc/110x75/620624468c2f7b173004d426/appraisal-marine-fisheries-gujarat-emailprotected-central-marine.jpg)