Embed Size (px)
Citation preview

O Transaksi dasar bisnis terjadi dalam beberapa siklus. Apa saja?
O Apakah siklus tersebut saling terkait? Berikan contohnya!
O Apa saja langkah-langkah mengubah data menjadi informasi?

DOCUMENTATION &
REVENUE CYCLE

© 2008 Prentice Hall Business Publishing Accounting Information Systems, 11/e Romney/Steinbart 3 of 119
• The data processing cycle consists of four steps:– Data input– Data storage– Data processing– Information output
TRANSACTION PROCESSING:THE DATA PROCESSING CYCLE

© 2008 Prentice Hall Business Publishing Accounting Information Systems, 11/e Romney/Steinbart 4 of 119
• Documentation includes the following types of tools:– Narratives (written descriptions)– Flowcharts– Diagrams– Other written material
Documentation

© 2008 Prentice Hall Business Publishing Accounting Information Systems, 11/e Romney/Steinbart 5 of 119
• In this chapter, we discuss two of the most common documentation tools:– Data flow diagrams
• Graphical descriptions of the sources and destinations of data. They show:– Where data comes from– How it flows– The processes performed on it– Where it goes
Documentation

© 2008 Prentice Hall Business Publishing Accounting Information Systems, 11/e Romney/Steinbart 6 of 119
• In this chapter, we discuss two of the most common documentation tools:– Data flow diagrams– Flowcharts
• Include three types:– Document flowcharts describe the flow of documents and
information between departments or units.– System flowcharts describe the relationship between inputs,
processing, and outputs for a system.– Program flowcharts describe the sequence of logical
operations performed in a computer program.
Documentation
© 2008 Prentice Hall Business Publishing Accounting Information Systems, 11/e Romney/Steinbart 7 of 119
• Documentation tools support organization in:– Organizing very complicated systems into a
form that can be more readily understood.– Helping new team members understand a
pre-existing system.
Documentation

© 2008 Prentice Hall Business Publishing Accounting Information Systems, 11/e Romney/Steinbart 8 of 119
INTRODUCTION TO DFD AND FLOWCHART
• Which method should you use—flowcharts or DVDs?– 62.5% of IS professionals use DFDs– 97.6% use flowcharts

© 2008 Prentice Hall Business Publishing Accounting Information Systems, 11/e Romney/Steinbart 9 of 119
DATA FLOW DIAGRAMS
• A data flow diagram (DFD) graphically describes the flow of data within an organization. It is used to:– Document existing systems– Plan and design new systems
• There is no black-and-white approach to developing a DFD.

© 2008 Prentice Hall Business Publishing Accounting Information Systems, 11/e Romney/Steinbart10 of
119
DFD Symbol
Menggambarkan agent/subyek
Menggambarkan proses yang terjadi
Menggambarkan data/informasi
Menggambarkan alur

© 2008 Prentice Hall Business Publishing Accounting Information Systems, 11/e Romney/Steinbart11 of
119
DATA FLOW DIAGRAMS
Customer1.0
ProcessPayment
2.0Update
A/R
CreditManager
Bank
AccountsReceivable
Customerpayment
Remittancedata
ReceivablesInformation
Deposit
• Example of a data flow diagram of the customer payment process from Figure 3-3 in your textbook.

© 2008 Prentice Hall Business Publishing Accounting Information Systems, 11/e Romney/Steinbart12 of
119
FLOWCHARTS
• A flowchart is an analytical technique that describes some aspect of an information system in a clear, concise, and logical manner.
• Flowcharts use a set of standard symbols to depict processing procedures and the flow of data.
• Flowcharting History:– Introduced in 1950s by industrial engineers to document
business processes and document flows for process improvement.
– Sarbanes-Oxley 2002 increased importance by requiring companies to document business processes and internal controls procedures.
© 2008 Prentice Hall Business Publishing Accounting Information Systems, 11/e Romney/Steinbart13 of
119
FLOWCHARTS
• Every shape on a flowchart depicts a unique operation, input, processing activity, or storage medium.
• In the days of yore, flowcharts were manually created using plastic templates.
• Most flowcharts are now drawn using a software program such as Visio.– Microsoft and Power Point are also used.– The software uses pre-drawn shapes, and the
developer drags the shapes into the drawing.

© 2008 Prentice Hall Business Publishing Accounting Information Systems, 11/e Romney/Steinbart14 of
119
FLOWCHARTS
• There are four types of flowcharting symbols:– Input/output symbols
Input/output symbols indicate the type of device or media that provides input to or records output from a process.

© 2008 Prentice Hall Business Publishing Accounting Information Systems, 11/e Romney/Steinbart15 of
119
FLOWCHARTS
• There are four types of flowcharting symbols:– Input/output symbols– Processing symbols
Processing symbols indicate the type of device used to process the data or whether the data is processed manually.

© 2008 Prentice Hall Business Publishing Accounting Information Systems, 11/e Romney/Steinbart16 of
119
FLOWCHARTS
• There are four types of flowcharting symbols:– Input/output symbols– Processing symbols– Storage symbols
Storage symbols indicate the type of device used to store data while the system is not using it.

© 2008 Prentice Hall Business Publishing Accounting Information Systems, 11/e Romney/Steinbart17 of
119
FLOWCHARTS
• There are four types of flowcharting symbols:– Input/output symbols– Processing symbols– Storage symbols– Flow and miscellaneous symbols
• Flow and miscellaneous symbols may indicate:– The flow of data and goods– The beginning or end of the flowchart– The location of a decision– An explanatory note

© 2008 Prentice Hall Business Publishing Accounting Information Systems, 11/e Romney/Steinbart18 of
119
FLOWCHARTS
• Click on buttons below if you wish to review symbols in the various categories.
Input/OutputSymbols
ProcessingSymbols
StorageSymbols
Flow & Misc.Symbols

© 2008 Prentice Hall Business Publishing Accounting Information Systems, 11/e Romney/Steinbart19 of
119
INPUT/OUTPUT SYMBOLS
• Document Symbol– Represents a document or report that is
prepared by hand or printed by a computer.

© 2008 Prentice Hall Business Publishing Accounting Information Systems, 11/e Romney/Steinbart20 of
119
INPUT/OUTPUT SYMBOLS
• Multiple Copies of One Document– Indicates multiple copies of a paper document
or report.– The document copies should be numbered in
the upper, right-hand corner.
23
1

© 2008 Prentice Hall Business Publishing Accounting Information Systems, 11/e Romney/Steinbart21 of
119
INPUT/OUTPUT SYMBOLS
• Input/Output; Journal/Ledger– Can represent any input or output on a
program flowchart.– Also represents accounting journals or
ledgers in a document flowchart.

© 2008 Prentice Hall Business Publishing Accounting Information Systems, 11/e Romney/Steinbart22 of
119
INPUT/OUTPUT SYMBOLS
• Display– Represents information displayed by an
online output device such as a terminal, monitor, or screen.

© 2008 Prentice Hall Business Publishing Accounting Information Systems, 11/e Romney/Steinbart23 of
119
INPUT/OUTPUT SYMBOLS
• Online Keying– Represents data entry by an online device
such as a terminal or personal computer.

© 2008 Prentice Hall Business Publishing Accounting Information Systems, 11/e Romney/Steinbart24 of
119
INPUT/OUTPUT SYMBOLS
• Terminal or Personal Computer– Combines the display and online keying
symbols to represent terminals and personal computers.
© 2008 Prentice Hall Business Publishing Accounting Information Systems, 11/e Romney/Steinbart25 of
119
INPUT/OUTPUT SYMBOLS
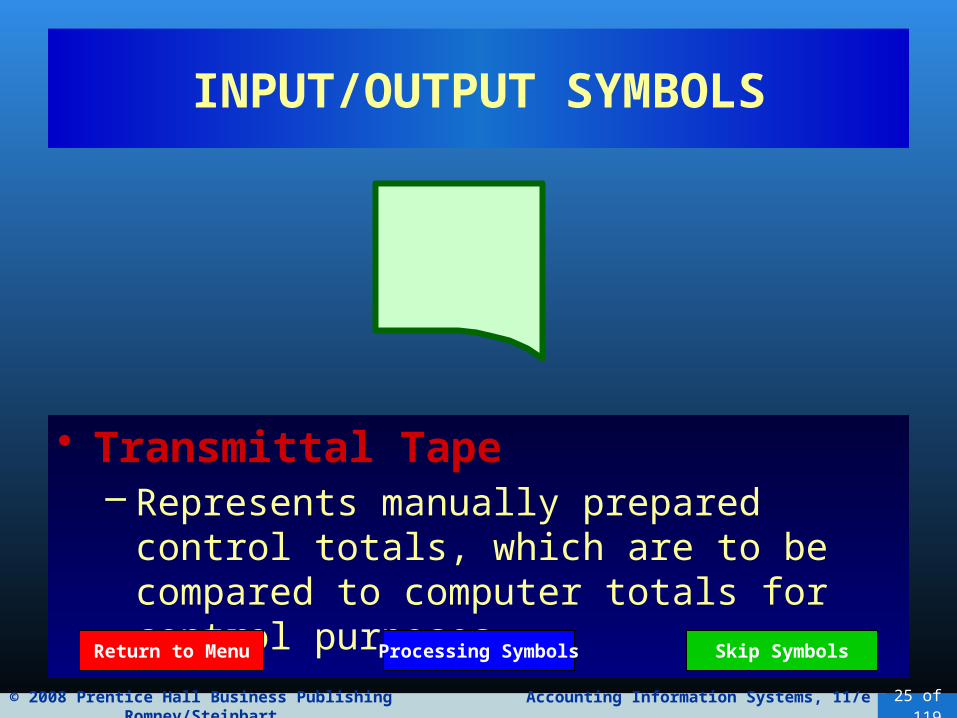
• Transmittal Tape– Represents manually prepared control totals,
which are to be compared to computer totals for control purposes.
Return to Menu Processing Symbols Skip Symbols

© 2008 Prentice Hall Business Publishing Accounting Information Systems, 11/e Romney/Steinbart26 of
119
PROCESSING SYMBOLS
• Computer Processing– Represents a process performed by a
computer, which usually results in a change in data or information.

© 2008 Prentice Hall Business Publishing Accounting Information Systems, 11/e Romney/Steinbart27 of
119
PROCESSING SYMBOLS
• Manual Operation– Represents a processing operation that is
performed manually.

© 2008 Prentice Hall Business Publishing Accounting Information Systems, 11/e Romney/Steinbart28 of
119
PROCESSING SYMBOLS
• Auxiliary Operation– Represents a processing operation carried
out by a device other than a computer, e.g., an optical character scanner.

© 2008 Prentice Hall Business Publishing Accounting Information Systems, 11/e Romney/Steinbart29 of
119
PROCESSING SYMBOLS
• Off-line Keying Operation– Represents an operation that uses an off-line
keying device, such as a cash register or keying to a disk.
Return to Menu Skip SymbolsStorage Symbols
© 2008 Prentice Hall Business Publishing Accounting Information Systems, 11/e Romney/Steinbart30 of
119
STORAGE SYMBOLS
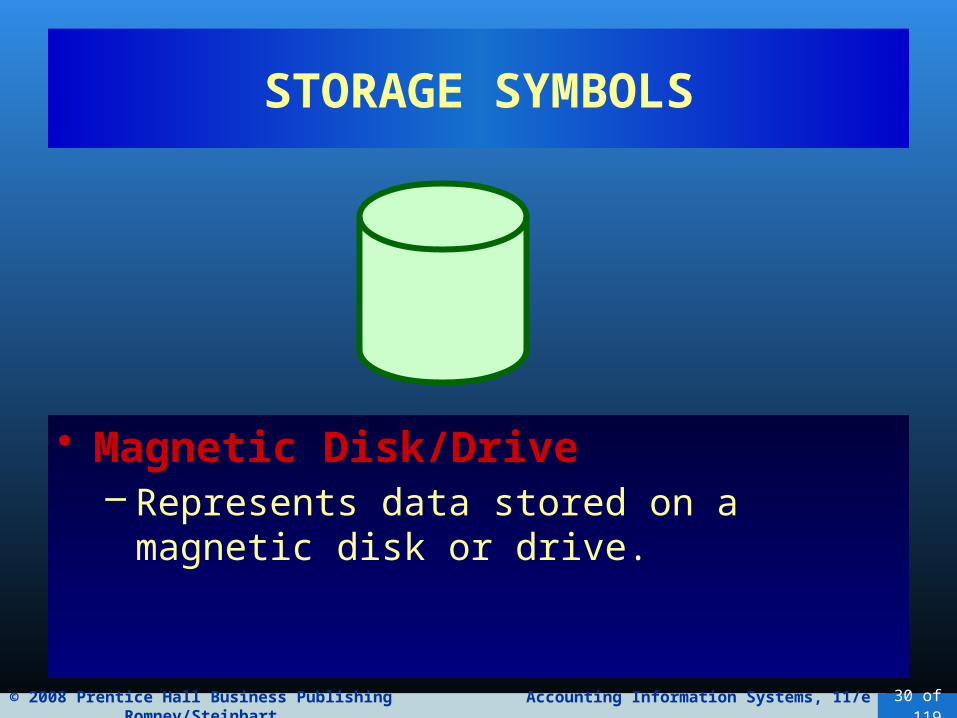
• Magnetic Disk/Drive– Represents data stored on a magnetic disk or
drive.

© 2008 Prentice Hall Business Publishing Accounting Information Systems, 11/e Romney/Steinbart31 of
119
STORAGE SYMBOLS
• Magnetic Tape– Represents data stored on a magnetic tape.– Sometimes represents transaction files.

© 2008 Prentice Hall Business Publishing Accounting Information Systems, 11/e Romney/Steinbart32 of
119
STORAGE SYMBOLS
• File– Represents a file of documents that are manually
stored and retrieved.– Letter indicates the ordering sequence:
• A = Alphabetic order• D = Date order• N = Numeric order
A
Return to Menu Skip SymbolsFlow/Misc. Symbols

© 2008 Prentice Hall Business Publishing Accounting Information Systems, 11/e Romney/Steinbart33 of
119
FLOW AND MISCELLANEOUS SYMBOLS
• Document or Processing Flow– Represents the direction of processing or
document flow.– Normal flow is top to bottom and left to right.

© 2008 Prentice Hall Business Publishing Accounting Information Systems, 11/e Romney/Steinbart34 of
119
FLOW AND MISCELLANEOUS SYMBOLS
• Data/Information Flow– Represents the direction of data/information
flow.– Often used to show data being copied from
one document to another.

© 2008 Prentice Hall Business Publishing Accounting Information Systems, 11/e Romney/Steinbart35 of
119
FLOW AND MISCELLANEOUS SYMBOLS
• Communication Link– Represents the transmission of data from one
location to another via communication lines.

© 2008 Prentice Hall Business Publishing Accounting Information Systems, 11/e Romney/Steinbart36 of
119
FLOW AND MISCELLANEOUS SYMBOLS
• On-page connector– Connects processing from one location to
another on the same page.– Used to avoid crisscrossing lines.

© 2008 Prentice Hall Business Publishing Accounting Information Systems, 11/e Romney/Steinbart37 of
119
FLOW AND MISCELLANEOUS SYMBOLS
• Off-page Connector– Connects the processing flow between two
different pages.– Signals the exit from one page and the
corresponding entrance on another page.
© 2008 Prentice Hall Business Publishing Accounting Information Systems, 11/e Romney/Steinbart38 of
119
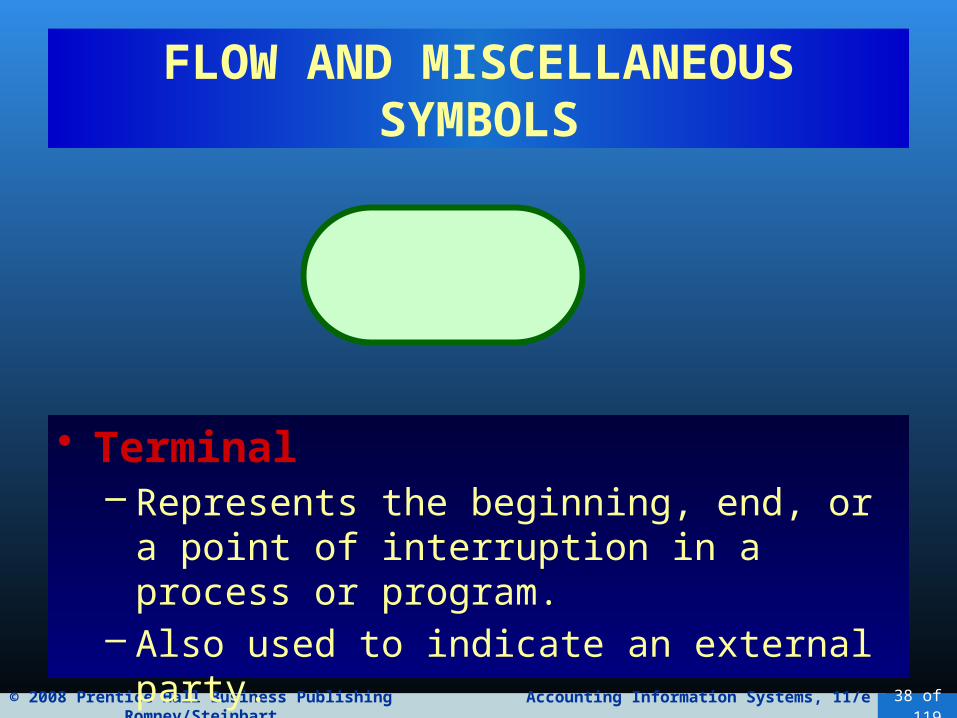
FLOW AND MISCELLANEOUS SYMBOLS
• Terminal– Represents the beginning, end, or a point of
interruption in a process or program.– Also used to indicate an external party.

© 2008 Prentice Hall Business Publishing Accounting Information Systems, 11/e Romney/Steinbart39 of
119
FLOW AND MISCELLANEOUS SYMBOLS
• Decision– Represents a decision-making step.– Used in a program flowchart to show
branching to alternate paths.

© 2008 Prentice Hall Business Publishing Accounting Information Systems, 11/e Romney/Steinbart40 of
119
FLOW AND MISCELLANEOUS SYMBOLS
• Annotation– Provides for the addition of descriptive
comments or explanatory notes as clarification.
Return to Menu Continue

© 2008 Prentice Hall Business Publishing Accounting Information Systems, 11/e Romney/Steinbart41 of
119
TRIVIA 1
• Which man is credited with coining the term 'artificial intelligence' in 1955 and is considered one of the early pioneers in the field?
• Senator Joseph McCarthy

© 2008 Prentice Hall Business Publishing Accounting Information Systems, 11/e Romney/Steinbart42 of
119
DOCUMENT FLOWCHARTS
• A document flowchart shows the flow of documents and information among areas of responsibility in an organization.
• These flowcharts trace a document from cradle to grave and show:– Where a document comes from– Where it’s distributed– How it’s used– It’s ultimate disposition– Everything that happens as it flows through the
system

© 2008 Prentice Hall Business Publishing Accounting Information Systems, 11/e Romney/Steinbart43 of
119
DOCUMENT FLOWCHARTS
• Internal control flowcharts are document flowcharts used to evaluate the adequacy of internal controls, such as segregation of duties or internal checks.
• They can reveal weaknesses or inefficiencies such as:– Inadequate communication flows– Unnecessarily complex document flows– Procedures that cause wasteful delays
• Document flowcharts are also prepared in the system design process.

© 2008 Prentice Hall Business Publishing Accounting Information Systems, 11/e Romney/Steinbart44 of
119
GUIDELINES FOR PREPARING FLOWCHARTS
• Let’s step through some guidelines for preparing flowcharts:– As with DFDs, you can’t effectively prepare a
flowchart if you don’t understand the system, so:• Interview users, developers, auditors, and
management• Administer questionnaires• Read through narratives• Walk through systems transactions

© 2008 Prentice Hall Business Publishing Accounting Information Systems, 11/e Romney/Steinbart45 of
119
GUIDELINES FOR PREPARING FLOWCHARTS
– Identify:• Entities to be flowcharted, e.g., departments,
functions, external parties (the parties who “do” things in the story)
• Documents or information flows• Processes
– As you read through a narrative, you may want to mark the preceding items with different shapes (e.g., drawing a rectangle around entities, circling documents, etc.).

© 2008 Prentice Hall Business Publishing Accounting Information Systems, 11/e Romney/Steinbart46 of
119
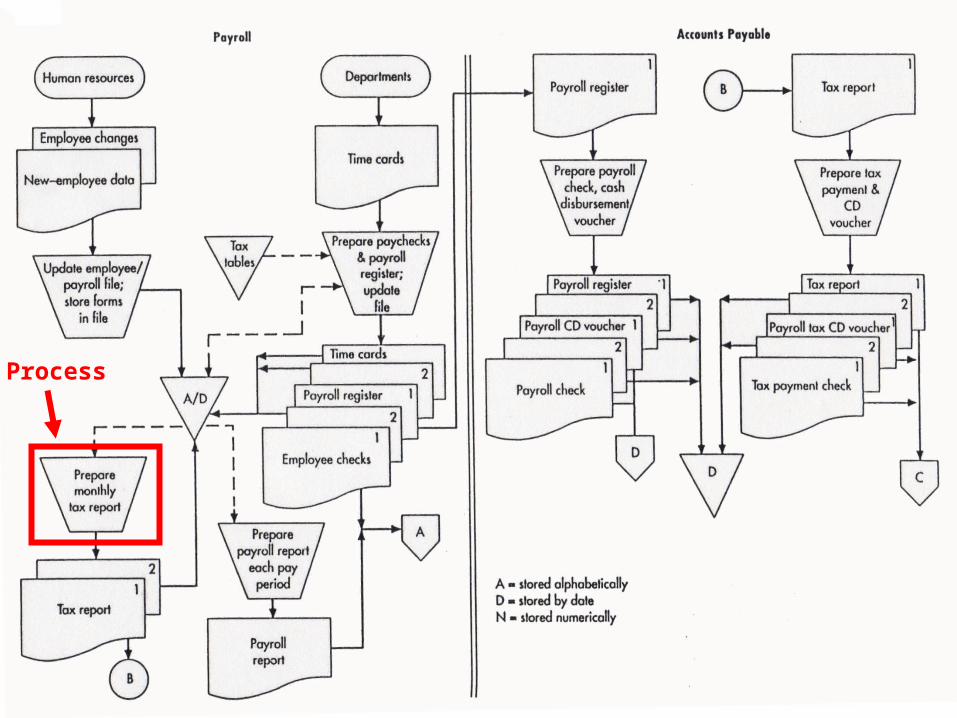
This is part of the document flowchart from Figure 3-9 in your textbook.

© 2008 Prentice Hall Business Publishing Accounting Information Systems, 11/e Romney/Steinbart47 of
119
GUIDELINES FOR PREPARING FLOWCHARTS
–Use separate columns for the activity of each entity.• Example: If there are three different
departments or functions that “do” things in the narrative, there would be three columns on the flowchart.

© 2008 Prentice Hall Business Publishing Accounting Information Systems, 11/e Romney/Steinbart48 of
119
GUIDELINES FOR PREPARING FLOWCHARTS
– Flowchart the normal course of operations, and identify exceptions with annotations.
– As much as possible, the flow should go from top to bottom and left to right.
– Use standard flowcharting symbols, and draw with a template or computer.
– Clearly label all symbols. Use annotations if necessary to provide adequate explanation.

© 2008 Prentice Hall Business Publishing Accounting Information Systems, 11/e Romney/Steinbart49 of
119
GUIDELINES FOR PREPARING FLOWCHARTS
– Give the flowchart a clear beginning and ending.• Show where each document originated and its final
disposition.– One approach you can use is to read through
the narrative and for each step define:• What was (were) the input(s)• What process was carried out• What was (were) the output(s)
– Note on the next slide that the flow sequence is input—process—output.

© 2008 Prentice Hall Business Publishing Accounting Information Systems, 11/e Romney/Steinbart50 of
119
What are the entities in this flowchart?

© 2008 Prentice Hall Business Publishing Accounting Information Systems, 11/e Romney/Steinbart51 of
119
Identifies where input is coming from

© 2008 Prentice Hall Business Publishing Accounting Information Systems, 11/e Romney/Steinbart52 of
119
Inputs

© 2008 Prentice Hall Business Publishing Accounting Information Systems, 11/e Romney/Steinbart53 of
119
Process

© 2008 Prentice Hall Business Publishing Accounting Information Systems, 11/e Romney/Steinbart54 of
119
Output tostorage

© 2008 Prentice Hall Business Publishing Accounting Information Systems, 11/e Romney/Steinbart55 of
119
Input fornext
process
© 2008 Prentice Hall Business Publishing Accounting Information Systems, 11/e Romney/Steinbart56 of
119
Process

© 2008 Prentice Hall Business Publishing Accounting Information Systems, 11/e Romney/Steinbart57 of
119
Output

© 2008 Prentice Hall Business Publishing Accounting Information Systems, 11/e Romney/Steinbart58 of
119
GUIDELINES FOR PREPARING FLOWCHARTS
– Every manual process should have at least one input and at least one output.
– Show all data entered into or retrieved from a computer file as passing through a process first.
– Do not show process symbols for:• Forwarding a document to another entity• Filing a document

© 2008 Prentice Hall Business Publishing Accounting Information Systems, 11/e Romney/Steinbart59 of
119
Forwardinga document

© 2008 Prentice Hall Business Publishing Accounting Information Systems, 11/e Romney/Steinbart60 of
119
Filinga document

© 2008 Prentice Hall Business Publishing Accounting Information Systems, 11/e Romney/Steinbart61 of
119
GUIDELINES FOR PREPARING FLOWCHARTS
–Do not connect two documents except when forwarding to another column.• When a document is forwarded, show it in
both locations.

© 2008 Prentice Hall Business Publishing Accounting Information Systems, 11/e Romney/Steinbart62 of
119
Show forwarded document in both
locations

© 2008 Prentice Hall Business Publishing Accounting Information Systems, 11/e Romney/Steinbart63 of
119
GUIDELINES FOR PREPARING FLOWCHARTS
–When using multiple copies of a document, place document numbers in the upper, right-hand corner.

© 2008 Prentice Hall Business Publishing Accounting Information Systems, 11/e Romney/Steinbart64 of
119
What happens to the document numbers as the documents
move to other locations?

© 2008 Prentice Hall Business Publishing Accounting Information Systems, 11/e Romney/Steinbart65 of
119
GUIDELINES FOR PREPARING FLOWCHARTS
–Show on-page connectors and label them clearly to avoid excess flow lines.
© 2008 Prentice Hall Business Publishing Accounting Information Systems, 11/e Romney/Steinbart66 of
119
© 2008 Prentice Hall Business Publishing Accounting Information Systems, 11/e Romney/Steinbart67 of
119
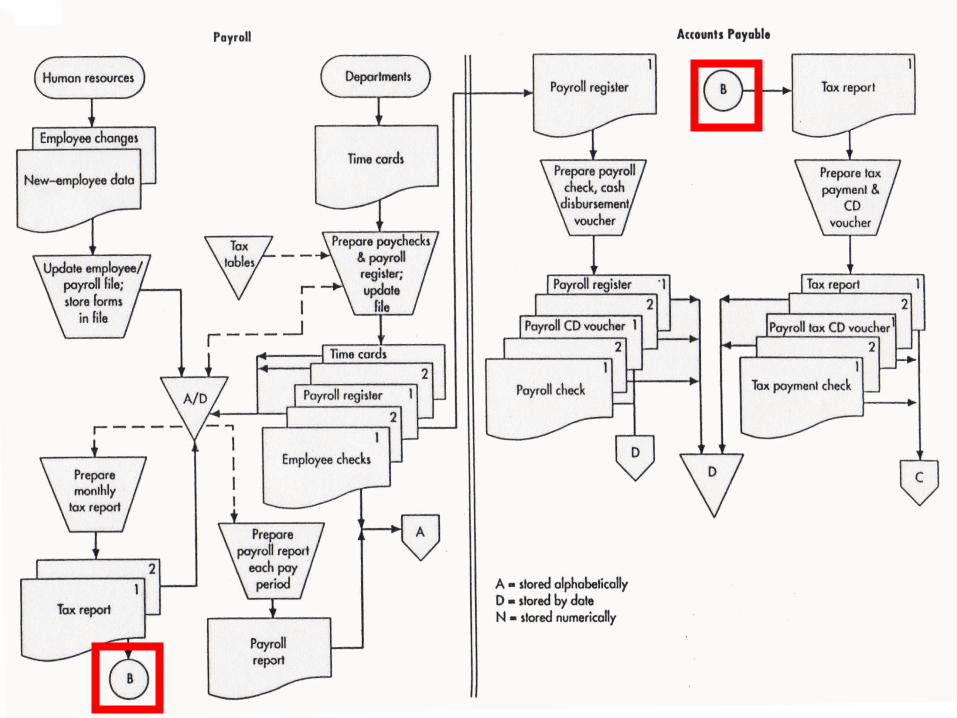
GUIDELINES FOR PREPARING FLOWCHARTS
–Use off-page connectors if the flow goes to another page.

© 2008 Prentice Hall Business Publishing Accounting Information Systems, 11/e Romney/Steinbart68 of
119
Are there other off-page connectors on
this flowchart?

© 2008 Prentice Hall Business Publishing Accounting Information Systems, 11/e Romney/Steinbart69 of
119
GUIDELINES FOR PREPARING FLOWCHARTS
– If a flowchart takes more than one page, label the pages as 1 of 5, 2 of 5, 3 of 5, etc.
– Show documents or reports first in the column where they are created.
– Start with a rough draft; then redesign to avoid clutter and crossed lines.
– Verify the accuracy of your flowchart by reviewing it with users, etc.
– Place the flowchart name, the date, and the preparer’s name on each page of the final copy.
© 2008 Prentice Hall Business Publishing Accounting Information Systems, 11/e Romney/Steinbart70 of
119
TRIVIA
• What was the first computer virus? • Movie :

© 2008 Prentice Hall Business Publishing Accounting Information Systems, 11/e Romney/Steinbart71 of
119

© 2008 Prentice Hall Business Publishing Accounting Information Systems, 11/e Romney/Steinbart 72 of 160
C HAPTER 10
The Revenue Cycle:
Sales to Cash Collections

© 2008 Prentice Hall Business Publishing Accounting Information Systems, 11/e Romney/Steinbart 73 of 161
INTRODUCTION
• In this chapter, we’ll look at:• Capturing and processing data.• Storing and organizing the data for decisions.• Providing controls to safeguard resources
(including data).

© 2008 Prentice Hall Business Publishing Accounting Information Systems, 11/e Romney/Steinbart 74 of 161
• The revenue cycle is a recurring set of business activities and related information processing operations associated with:– Providing goods and services to customers– Collecting their cash payments
• The primary external exchange of information is with customers.

© 2008 Prentice Hall Business Publishing Accounting Information Systems, 11/e Romney/Steinbart 75 of 161
– What are the basic business activities and data processing operations that are performed in the revenue cycle?
– What decisions need to be made in the revenue cycle, and what information is needed to make these decisions?
– What are the major threats in the revenue cycle and the controls related to those threats?

© 2008 Prentice Hall Business Publishing Accounting Information Systems, 11/e Romney/Steinbart 76 of 161
• Information about revenue cycle activities flows to other accounting cycles, e.g.:– The expenditure and production cycles
• Receive information about sales transactions so they’ll know when to initiate the purchase or production of more inventory.
© 2008 Prentice Hall Business Publishing Accounting Information Systems, 11/e Romney/Steinbart 77 of 161
• Information about revenue cycle activities flows to other accounting cycles, e.g.:– The expenditure and production cycles– The human resources/payroll cycle
• Uses information about sales to calculate commissions and bonuses.

© 2008 Prentice Hall Business Publishing Accounting Information Systems, 11/e Romney/Steinbart 78 of 161
• Information about revenue cycle activities flows to other accounting cycles, e.g.:– The expenditure and production cycles– The human resources/payroll cycle– The general ledger and reporting function
• Uses information produced by the revenue cycle in preparing financial statements and performance reports.

© 2008 Prentice Hall Business Publishing Accounting Information Systems, 11/e Romney/Steinbart79 of
119
General Ledgerand Reporting
System
RevenueCycle
ExpenditureCycle
ProductionCycle
Human Res./Payroll Cycle
FinancingCycle
• The Revenue Cycle– Gets finished
goods from the production cycle.
– Provides funds to the financing cycle.
– Provides data to the general ledger and reporting system.
Finished Goods
FundsD
ata

© 2008 Prentice Hall Business Publishing Accounting Information Systems, 11/e Romney/Steinbart 80 of 161
• The primary objective of the revenue cycle:– Provide the right product in the right place at
the right time for the right price.
© 2008 Prentice Hall Business Publishing Accounting Information Systems, 11/e Romney/Steinbart 81 of 161
• Decisions that must be made:– Should we customize products?– How much inventory should we carry and
where?– How should we deliver our product?– How should we price our product?– Should we give customers credit? If so, how
much and on what terms?– How can we process payments to maximize
cash flow?

© 2008 Prentice Hall Business Publishing Accounting Information Systems, 11/e Romney/Steinbart 82 of 161
• Management also has to evaluate the efficiency and effectiveness of revenue cycle processes:– Requires data about:
• Events that occur.• Resources used.• Agents who participate.
– The data needs to be accurate, reliable, and timely.

© 2008 Prentice Hall Business Publishing Accounting Information Systems, 11/e Romney/Steinbart 83 of 161
REVENUE CYCLE BUSINESS ACTIVITIES
• Four basic business activities are performed in the revenue cycle:– Sales order entry– Shipping– Billing– Cash collection

© 2008 Prentice Hall Business Publishing Accounting Information Systems, 11/e Romney/Steinbart 84 of 161
REVENUE CYCLE BUSINESS ACTIVITIES
• Four basic business activities are performed in the revenue cycle:– Sales order entry– Shipping– Billing– Cash collection


