Embed Size (px)
Citation preview

CELLULAR AND INFECTION MICROBIOLOGYMETHODS ARTICLE
published: 11 May 2012doi: 10.3389/fcimb.2012.00061
O-antigen and virulence profiling of Shiga toxin-producingEscherichia coli by a rapid and cost–effective DNAmicroarray colorimetric method
Beatriz Quiñones*, Michelle S. Swimley , Koh-Eun Narm†, Ronak N. Patel , Michael B. Cooley and
Robert E. Mandrell
Produce Safety and Microbiology Research Unit, Western Regional Research Center, U.S. Department of Agriculture/Agricultural Research Service, Albany, CA, USA
Edited by:
Nora Lía Padola, Universidad Nacionaldel Centro de la Provincia de BuenosAires, Argentina
Reviewed by:
Deborah Threadgill, North CarolinaState University, USAAnalía Inés Etcheverría, UniversidadNacional del Centro de la Provincia deBuenos Aires, Argentina
*Correspondence:
Beatriz Quiñones, Produce Safety andMicrobiology Research Unit, WesternRegional Research Center, U.S.Department of Agriculture/AgriculturalResearch Service, 800 BuchananStreet, WAB 214L, Albany, CA 94710,USA.e-mail: [email protected]†Present address:
Koh-Eun Narm, University of Illinois,Department of Microbiology, B212Chemical and Life SciencesLaboratory, Urbana, IL 61801, USA.
Shiga toxin-producing Escherichia coli (STEC) is a leading cause of foodborne illness world-wide. The present study developed the use of DNA microarrays with the ampliPHOXcolorimetric method to rapidly detect and genotype STEC strains. A low-density 30-meroligonucleotide DNA microarray was designed to target O-antigen gene clusters of 11 E. coliserogroups (O26, O45, O91, O103, O104, O111, O113, O121, O128, O145, and O157) thathave been associated with the majority of STEC infections. In addition, the DNA microar-ray targeted 11 virulence genes, encoding adhesins, cytotoxins, proteases, and receptorproteins, which have been implicated in conferring increased ability to cause disease forSTEC. Results from the validation experiments demonstrated that this microarray-basedcolorimetric method allowed for a rapid and accurate genotyping of STEC reference strainsfrom environmental and clinical sources and from distinct geographical locations. Positivehybridization signals were detected only for probes targeting serotype and virulence genesknown to be present in the STEC reference strains. Quantification analysis indicated thatthe mean pixel intensities of the signal for probes targeting O-antigen or virulence geneswere at least three times higher when compared to the background. Furthermore, thismicroarray-based colorimetric method was then employed to genotype a group of E. coliisolates from watershed sediment and animal fecal samples that were collected from animportant region for leafy-vegetable production in the central coast of California.The resultsindicated an accurate identification of O-type and virulence genes in the tested isolatesand confirmed that the ampliPHOX colorimetric method with low-density DNA microarraysenabled a fast assessment of the virulence potential of STEC using low-cost reagents andinstrumentation.
Keywords: DNA microarrays, photopolymerization, Shiga toxin, Escherichia coli, foodborne pathogen, ampliPHOX,
genotyping, STEC
INTRODUCTIONShiga toxin-producing Escherichia coli (STEC) is a food- andwater-borne enteric pathogen known to cause human gastroin-testinal illnesses with diverse clinical manifestations, ranging fromdiarrhea, hemorrhagic colitis, and life-threatening hemolytic ure-mic syndrome (HUS; Rangel et al., 2005; Gyles, 2007). The varyingdisease severity in humans has been associated with more than100 serotypes of STEC (Johnson et al., 1996; Gould et al., 2009;Mathusa et al., 2010). In particular, E. coli O157:H7 is the STECmost-commonly reported in the United States (Brooks et al., 2005;Hoefer et al., 2011), and more than 20 outbreaks due to O157:H7contamination, occurring between 1995 and 2008, were associ-ated with consumption of produce items that were grown in ornear the Salinas Valley of California (Mandrell, 2011). Althoughthe O157 serogroup has been associated frequently with hemor-rhagic colitis and HUS (Karmali, 1989; Karmali et al., 2003), thereporting of non-O157 infections by public health laboratories hasincreased considerably in recent years (Brooks et al., 2005; Gould
et al., 2009; Hoefer et al., 2011; Stigi et al., 2012). Epidemiologicalstudies have indicated that six non-O157 serogroups, O26, O45,O103, O111, O121, and O145, have been associated with outbreaksand severe disease in the United States (Johnson et al., 1996; Brookset al., 2005). Additionally, STECs of serogroups, O91, O104, O113,and O128 have been reported to be significant causes of humaninfections worldwide (Brooks et al., 2005; Bettelheim, 2007; Gyles,2007; Mathusa et al., 2010). These findings have led to the proposalthat certain non-O157 STEC strains are potentially as virulent asO157:H7 strains (Bettelheim, 2007; Coombes et al., 2011).
The onset of life-threatening disease symptoms caused bySTEC has been associated with the production of Shiga tox-ins (Stx), which are considered the primary virulence deter-minant in STEC (Karmali et al., 1983; Karmali, 1989). How-ever, epidemiological studies revealed that not all STEC strainsthat produce Stx are clinically significant. The observed differ-ence in virulence among distinct serotypes has been ascribed togenes encoding virulence factors other than Stx and has been
Frontiers in Cellular and Infection Microbiology www.frontiersin.org May 2012 | Volume 2 | Article 61 | 1

Quiñones et al. Rapid and inexpensive STEC genotyping
linked to genes on pathogenicity islands, such as the locus forenterocyte and effacement (LEE) and the non-LEE (Bettelheim,2007; Bolton, 2011; Coombes et al., 2011). In addition to thesegenomic regions, other chromosomal and plasmid-borne viru-lence genes, encoding adhesins, cytotoxins, proteases, and recep-tor proteins, are proposed to also contribute to STEC patho-genesis by allowing these bacterial pathogens to attach to andcolonize the human epithelium. Screening for these virulencegenes in STEC isolates would facilitate an expanded charac-terization through the identification of risk factors that couldlead potentially to sporadic- and outbreak-related human illness.Thus, the development of rapid and cost–effective genotypingtools is imperative for determining the genetic composition ofSTEC isolates that may pose a threat to food safety and humanhealth.
In contrast to established culturing methods, which only assessa small number of markers, the use of DNA microarrays as agenotyping method enables the examination of multiple gene tar-gets in a single assay (Call, 2005; Uttamchandani et al., 2009).However, development of sensitive and rapid procedures withcost–effective instrumentation has been challenging with currentDNA microarray platforms. Fluorescent microarray methods arecommonly used procedures but can be inconsistent and highlyvariable. These methods also utilize expensive and non-portablescanners for data acquisition and analysis (Call, 2005; Kuck andTaylor, 2008). Thus, improvements in the cost–effectiveness andreliability of procedures are required for routine pathogen sur-veillance. To implement a simpler, rapid, and inexpensive methodfor identifying and characterizing pathogenic STEC strains, thepresent study developed the use of the ampliPHOX colorimet-ric method, based on light-initiated signal amplification throughpolymerization (Kuck and Taylor, 2008; Sikes et al., 2008), witha low-density microarray to simultaneously detect multiple STEC
serotypes and virulence genes. This microarray-based genotypingmethod was employed to characterize a collection of STECs, recov-ered from environmental and clinical sources and from distinctgeographical locations.
MATERIALS AND METHODSBACTERIAL STRAINS AND GROWTH CONDITIONSThe characteristics and sources of the STEC reference strains thatwere used in this study are described in Table 1. For the isolation ofSTEC isolates from environmental sources, cloacal bird swabs or10 g samples of watershed sediment/animal feces were subjected toa non-selective enrichment step in 50 or 90 ml of tryptic soy broth(Beckton Dickinson, Sparks, MD, USA), respectively, at 25˚C for2 h, 42˚C for 8 h with shaking, and 4˚C until the following morning(Cooley et al., submitted). The enrichments were further screenedfor stx1 and stx2 by real-time PCR, as in previous studies (Coo-ley et al., 2007). STEC isolates were obtained after plating sam-ples from positive enrichments on Rainbow O157 agar (Biolog,Inc., Hayward, CA, USA) containing 20 μg/ml novobiocin and0.8 μg/ml potassium tellurite solution (Sigma-Aldrich, St. Louis,MO, USA; NT-Rainbow) or on CHROMagar O157 media (DRGInternational, Mountainside, NJ, USA) after immunomagneticseparation with Dynabeads®anti-E. coli O157 (Invitrogen, Carls-bad, CA, USA) as reported previously (Cooley et al., 2007). Suspectcolonies were selected from NT-Rainbow or CHROMagar platesbased on colony colors and morphologies, as recommended by themanufacturer’s product insert. Bacterial cultures were propagatedon Luria–Bertani (LB) agar (Difco, Detroit, MI, USA).
CONSTRUCTION OF THE DNA MICROARRAYTo simultaneously evaluate multiple virulence determinants andserotypes of STEC strains, a 30-mer DNA oligonucleotidemicroarray was constructed. The serotype-specific probes were
Table 1 | Shiga toxin-producing Escherichia coli reference strains used in this study.
Strain Other strain designations Serotype Source Location Provider or referencea
RM1697 Feedlot strain 42 O157:H7 Cattle United States Kimura et al. (2000)
RM2016 3323-61; DEC 9a O26:H11 Human United States ECRC (Reid et al., 1999)
RM2028 C142-54; DEC 6b O111:H12 Human Germany ECRC (Reid et al., 1999)
RM2048 A9619-c2; DEC 11c O45:H2 Human United States ECRC (Reid et al., 1999)
RM2084 EDL-933; DEC 4f O157:H7 Meat United States ECRC (Reid et al., 1999)
RM3642 CPK175 O121:NM Human Canada CPKDRC
RM3655 CPK117 O113:H21 Human Canada CPKDRC
RM6011 WI_06BC005150 O157:H7 Human United States Tim Monson (Cooley et al., 2007)
RM6765 ATCC 23982; H515b O103:H8 Human Denmark ATCC (Ørskov et al., 1977)
RM7006 B2F1; TW01393 O91:H21 Human Canada The STEC Center (Ito et al., 1990)
RM7007 T4/97; TW09358 O128:H2 Pigeon Germany The STEC Center (Schmidt et al., 2000)
RM7519 F260-H2 O113:H21 Cattle United States Laboratory collection
RM12761 EH1605 O145:H28 Ice cream Belgium Buvens et al. (2011)
RM13368 3024-94 O104:H21 Human United States CDC (1995), Dean-Nystrom et al. (2003)
aContact information of strain providers: ECRC, E. coli Reference Center, College of Agricultural Sciences, The Pennsylvania State University, University Park, PA,
USA; CPKDRC, Canadian Pediatric Kidney Disease Research Centre, Ottawa, Ontario, Canada; Tim Monson, Wisconsin State Laboratory of Hygiene, Madison, WI,
USA; ATCC, American Type Culture Collection, Manassas, VA, USA; The STEC Center, National Food Safety and Toxicology Center, Michigan State University, East
Lansing, MI, USA.
Frontiers in Cellular and Infection Microbiology www.frontiersin.org May 2012 | Volume 2 | Article 61 | 2

Quiñones et al. Rapid and inexpensive STEC genotyping
designed to target either wzx or wzy genes in the O-antigengene clusters of 11 serogroups and to target the flagellin H7antigen (fliC ; Table 2). The virulence-specific probes targetedgenes encoding Stx (stx1 and stx2), intimin (eae), non-enterocyteeffacement effectors (nleA and ent/espL2), extracellular serineprotease (espP), catalase peroxidase (katP), autoagglutinatingadhesin (saa), subtilase cytotoxin (subA), enterohemolysin (ehxA),and perosamine synthetase (per ; Wang et al., 2003; Bettelheim,2007; Bolton, 2011; Quiñones et al., 2011; Table 2). The gadBgene, encoding glutamate decarboxylase (Smith et al., 1992), wasincluded as a positive control to confirm that the DNA testedwas derived from E. coli (Table 2). The probes were designedusing PRIMER3 software (Rozen and Skaletsky, 2000), were pur-chased from Eurofins MWG Operon (Huntsville, AL, USA) witha 5′-amino-C6 modification for covalent binding to the slidesurface, and were spotted in duplicate at a final concentrationof 50 μM on ArrayIt®SuperEpoxy 2 microarray slides (ArrayitCorporation, Sunnyvale, CA, USA). As a positive control forthe ampliPHOX reaction, a synthetic, 24-mer oligonucleotideprobe with a 5′-amino-C6 and 3′-biotin modification (InDevR,Inc., Boulder, CO, USA) was spotted at a final concentration of500 nM; this biotinylated control oligonucleotide does not haveany sequence homology to any E coli genes. The microarrayswere manufactured with an approximate spot diameter size of
200 μm and a center-to-center spacing of 700 μm (Arrayit Cor-poration). After printing, an adhesive microarray well (9 mmdiameter, InDevR, Inc.) was placed in the center of the printedarray, and the microarray slides were stored in a desiccator untilfurther use.
POLYMERASE CHAIN REACTIONThe detection of serotyping and virulence genes was achievedby performing a multiplex PCR amplification of biotinylatedfragments, ranging in size between 154 and 342 base pairs(Table 3). PCR primers were purchased from Eurofins MWGOperon (Huntsville, AL, USA) with a 5′-phosphorylated mod-ification for the forward primers and a 5′-biotin modificationfor the reverse primers. The target screen was divided into fourgroups, and each multiplex PCR reaction amplified six differ-ent targets (Table 3). As template for the PCR reaction, bacterialcultures of the reference strains and environmental isolates weregrown aerobically in LB broth (Difco) for 24 h with constantshaking (200 rpm) at 37˚C, and 100 μl aliquots of the bacte-rial cultures were collected by centrifugation at 2000 × g for5 min. Cell pellets were resuspended in 100 μl of HyPure™ mol-ecular biology-grade water (HyClone Laboratories, Inc., Logan,UT, USA) and incubated at 95˚C for 20 min. The lysates werecentrifuged at 2000 × g for 5 min, and the supernatants were
Table 2 | List of DNA oligonucleotides probes used in this study for microarray construction.
Target genea Probe sequence (5′ → 3′) Accession number Reference
GROUP 1
wzyO26 ATCAAGACTATGAAGCGTATGTTGATATAT AF529080 This study
wzyO45 GTATACCGACATATCATGGGATAGTTAATA AY771223 This study
wzyO103 CTAAGATTCATCGAGGATGAGGGGTTATTT AY532664 This study
wzyO111 CTTTCATTGTTGTAAGTTGTTTGTTACTGT AF078736 This study
wzyO121 CCTTTGTCATACTCTTTTTGATATTATCAC AY208937 This study
wzyO145 GCCTGATTATTCCTCTATTTTCTTATAATA AY647260 This study
GROUP 2
wzyO104 GTTCAAAGTTATTTTGGAGAGAAAGATATT AF361371 This study
wzxO91 GAGAGATTAAACAAGGATATCTGTTTCTTC AY035396 This study
wzyO113 GATGATATGTTTTATTATATGGTTGTTAAG AF172324 This study
wzyO128 TTTATATCAATGTGCTCATTAATTACACTG AY217096 This study
wzyO157 CAGGGAATAAAGCATCAAGACTTATTTTAT AF061251 This study
gadB AGATTATCAATGACGAATTATATCTTGATG M84025.1 This study
GROUP 3
ent TATAATAAACCTGACAGCATATGATTTTCT AAG58110 This study
espP CGGATATAATCAGTCTTTCAATAAAATTGC X97542 This study
katP GGGACTTATTTATGTCAATCCTGAAGGCCC X89017 This study
nleA TACAGATATTCCCTCTGCATGATGAAATAG BAF96541 This study
saa TAAATAAAAATAGAAAACGTTCAGATGCCG AF325200 This study
subA GCAAGATCCTGTGATAAGAGTCGCTGCCCT AF399919 This study
GROUP 4
eae CATTGATCAGGATTTTTCTGGTGATAATAC M58154 This study
ehxA CAAAACAGGCTATGTTTGAGCACGTTGCAG EF204929 This study
fliCH7 ATCTGAAAACCGAAAATACCTTGTTAACTA AF169323 This study
per TAGGCTACAATTATAGGATGACAAATATCT AAG57096 Quiñones et al. (2011)
stx1 GTTCTTATGTAATGACTGCTGAAGATGTTG AAG57228 This study
stx2 GGTTTCCATGACAACGGACAGCAGTTATAC AAG55587 This study
Frontiers in Cellular and Infection Microbiology www.frontiersin.org May 2012 | Volume 2 | Article 61 | 3

Quiñones et al. Rapid and inexpensive STEC genotyping
Table 3 | List of DNA oligonucleotides used in this study for multiplex PCR amplification of biotinylated fragments.
Target genea Primers for PCR Amplicon (bp) Accession number Reference
Forward sequence (5′ → 3′) Reverse sequence (5′ → 3′) Amountb
Group 1
wzyO26 GGTTTATGGATTATTGCATTC CCAATTATGACTTCATGGGT 1.0 221 AF529080 This study
wzyO45 CGTCTGGATGAAATTATGCC GTCTGAAGACCAGCATTTCCC 0.5 289 AY771223 This study
wzyO103 ATACAAATGGCGTGGATTGG GCCAGTAATTGACGTAACTG 0.5 280 AY532664 This study
wzyO111 GGTGTGATAGGAGCATTGGT CAACTCCAACTGTAAGCCCG 0.5 192 AF078736 This study
wzyO121 CCCGATATTCTAGTAGCCGT CTTCAATGAGTGCAGGCAAA 1.0 235 AY208937 This study
wzyO145 GCCCTTTTCAGTGGTGCG GCAGCCCAATATGAAACCAT 0.5 206 AY647260 This study
GROUP 2
wzyO104 GTTCATTAGATCGAGGTT CTTGTCTGATACGGTCAAGTG 0.4 162 AF361371 This study
wzxO91 CAAGCAGGTATTTGGGATGG TCCCCCATAGATACGAATGA 1.0 248 AY035396 This study
wzyO113 TGAGCGTTTCTGACATATGGA GTTTCGCTGGCATATTACTG 0.4 296 AF172324 This study
wzyO128 TGGATTTGATTGGGGGAAT TCTTGCAAAACACCGCATAC 1.0 190 AY217096 This study
wzyO157 CCGACACCAGAGTTAGAAAAG CAGTTCTGCTCCATACGTAG 0.4 156 AF061251 This study
gadB CACGTTTTGGTGCGAAGTCT TTGTGGACATTTTCGTCGTC 0.2 175 M84025.1 This study
GROUP 3
ent CACATCATTAGAAGTTCATT AGTCCTGCTCCCATAGCAAA 0.5 342 AAG58110 This study
espP GCACTGTCTGGCGGTGAATA CGTCCAGATTCCCGTTTATG 0.1 202 X97542 This study
katP GCGGAAGAGAAGATGACTGG GCACCATGTGCTTTACCAAA 1.0 277 X89017 This study
nleA TATGGTGTCCAGCTAAACAT CCAGTCGATGCAATAGTCGA 0.1 185 BAF96541 This study
saa CCAATCAACAGTTTCGTCAA GCAATAGCCTGTTCATCACG 0.1 166 AF325200 This study
subA CGGCTTATCATCCTGTCAGC TATAGCTGTTGCTTCTGACG 0.1 233 AF399919 This study
GROUP 4
eae CGTTACATTGACTCCCGCTT CTCATGCGGAAATAGCCGTT 0.2 188 M58154 This study
ehxA GAGTTCTGTATCTGCGGGAG GCAAGTTCACCGATCTTCTC 0.75 339 EF204929 This study
fliCH7 CAACAAAGCTGCAACGGTAA GCCGCCAACTGTGACTTTAT 0.2 154 AF169323 This study
per GGTGAAGGTGGAATGGTTGTC TCAGCAATTTCACGTTTTCGTG 0.2 206 AAG57096 Quiñones et al.
(2011)
stx1 GGATGCAGATAAATCGCCAT GAGTCTTGTCCATGATAGTC 0.4 274 AAG57228 This study
stx2 GATTTYDCACATATWTCAKTGCC AACTCCATTAAMKCCAGATATGA 0.75 155 AAG55587 This study
aGene targets examined in each multiplex group.bFinal micromolar concentration of primer used for each multiplex group in a 50-μl PCR reaction.
collected and frozen until further use. For each multiplex group(Table 3), the PCR amplification was performed in a 50-μl reac-tion mixture, containing 3 μl of bacterial crude lysate, 25 μl of2× GoTaq®Colorless Master Mix (Promega Corporation, Madi-son, WI, USA), and 5 μl of 10× multiplex group primer mix,as shown in Table 2. The reaction mixtures were placed in aDyad Peltier Thermal Cycler (Bio-Rad Laboratories, Hercules,CA, USA) with the following settings: 5 min at 94˚C, followedby 30 cycles of 45 s at 94˚C, 1 min at 60˚C (group 1) or 1 minat 55˚C (groups 2–4), 1 min at 72˚C, and a final extension timeof 7 min at 72˚C. Identification of serotype and virulence genesin the E. coli isolates was confirmed by a single PCR assay, andeach reaction consisted of 12.5 μl of 2× GoTaq®Green MasterMix (Promega Corporation), 0.5 μM of each primer (Table 3),and 3 μl of the bacterial crude lysate in a total volume of 25 μl.Amplified products were analyzed in 2% agarose gels containing0.04 μl/ml GelRed Nucleic Acid Stain (Phenix Research, Candler,NC, USA).
MICROARRAY HYBRIDIZATIONFor each hybridization reaction, 45 μl of PCR amplicons werepurified by using the MinElute®PCR purification kit (Qiagen,Valencia, CA, USA). To achieve a rapid microarray hybridization(Boissinot et al., 2007), single stranded DNA targets were producedafter a lambda exonuclease digestion of the PCR-amplified targets,consisting of 10 μl of the eluate, 10 U of lambda exonuclease and1× lambda exonuclease reaction buffer (Epicenter Biotechnolo-gies, Madison, WI, USA) in a final volume of 23 μl for 15 min at37˚C, followed by addition of 23 μl of 2× Hybridization Buffer(InDevR, Inc.). The hybridization mixture was applied to eachmicroarray, and the slides were incubated in a humidified chamber(InDevR, Inc.) for 1 h at room temperature. Following hybridiza-tion, the slides were transferred to a slide drying tray (EvergreenScientific, Los Angeles, CA, USA) and were rinsed with MicroarrayWash Buffers A thru D (InDevR, Inc.) in the following order: washBuffer D for 5 s, Wash Buffer A for 1 min, Wash Buffer D for 5 s,Wash Buffer B for 5 min, and Wash Buffer C for 5 min. The slides
Frontiers in Cellular and Infection Microbiology www.frontiersin.org May 2012 | Volume 2 | Article 61 | 4

Quiñones et al. Rapid and inexpensive STEC genotyping
were then dried by centrifugation at 200 × g for 2 min prior tolabeling.
MICROARRAY LABELING, SIGNAL AMPLIFICATION, AND ANALYSISThe hybridized microarrays were labeled after incubation with40 μl of a streptavidin-conjugated ampliTAG™ labeling solution(InDevR, Inc.) for 5 min at room temperature in a dark humiditychamber, and immediately after labeling, microarrays were rinsedwith Wash Buffer D for 5 s, Wash Buffer C for 5 min, distilled waterfor 5 min, and then dried by centrifugation at 200 × g for 2 min.Positive hybridization signals on each microarray were detectedby incubation with 40 μl ampliPHY™ solution (InDevR, Inc.),followed by photoactivation for approximately 1–2 min with theampliPHOX Reader™ and the associated ampliVIEW™ software2.0 (InDevR, Inc.), as recommended by the manufacturer. Polymerformation was visualized after a 1-min staining with ampliRED™solution. Color digital images of the stained arrays were acquiredwith the ampliPHOX Reader, and for each spot, quantificationof signal and background mean pixel intensities were determinedwith the ampliVIEW software.
RESULTSA RAPID AND INEXPENSIVE COLORIMETRIC MICROARRAY METHODFOR GENOTYPING STECTo implement using a rapid and cost–effective method to detect aselected set of genes in STEC isolates, recovered from an impor-tant food production region in the central coast of California, thepresent study explored an alternative procedure for genotypingSTEC using DNA microarrays. This novel and innovative col-orimetric method is based on light-initiated signal amplificationthrough polymerization (Kuck and Taylor, 2008; Sikes et al., 2008).Instead of using a fluorophore, a streptavidin-conjugated pho-toinitiator specifically binds to biotin-labeled amplified targets,hybridized to oligonucleotide probes on the microarray (Figure 1).After a short light exposure, a colorless polymer forms where theprobe and target sequences hybridized exclusively on the microar-ray. Polymer formation is easily visualized after a short stainingstep (Figure 1). The process of photopolymerization, also referredto as ampliPHOX colorimetric detection method, replaces expen-sive dyes and scanners required for fluorescent-based detectionwith microarrays (Kuck and Taylor, 2008; Moulton et al., 2011).
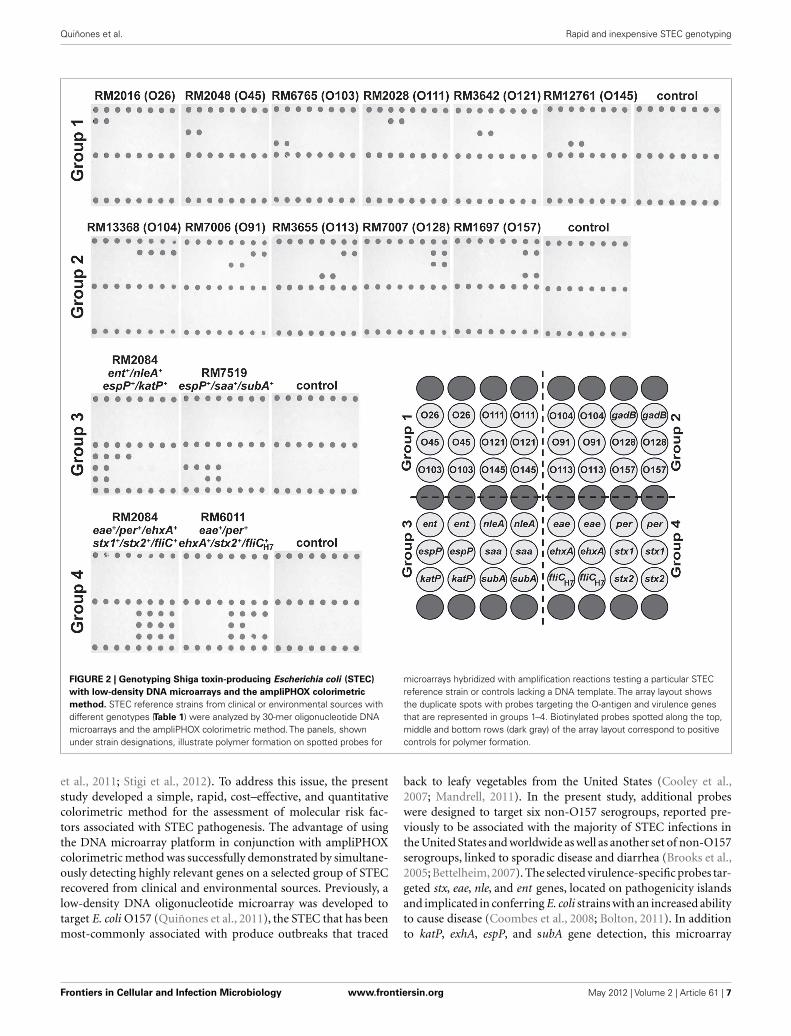
SPECIFICITY OF STEC IDENTIFICATIONAs a proof-of-principle method for routine pathogen surveillance,a low-density microarray was designed to target relevant serotypesand virulence genes, associated with pathogenic STEC. To validatethe specificity of using DNA microarrays with the ampliPHOX col-orimetric method, several STEC reference strains, recovered fromenvironmental and clinical samples with different genotypes, wereexamined (Table 1). The results of the validation experiments ofgroup 1 and group 2 probes indicated this microarray method wasaccurate in detecting the O-antigen types of the STEC referencestrains (Figure 2). Polymer formation was observed exclusivelywhere the probe sequences were spotted on the microarrays, andthe patterns of photopolymerization correlated with the O-typeof the reference strains. For example, analysis of the O26 strainRM2016 resulted in polymer formation exclusively where O26 wzy
gene probes were spotted on the microarray. Moreover, analysis ofgroup 2 probes resulted in the accurate O-antigen identification inthe reference strains as well as the gadB gene, included as a positivecontrol for detecting all E. coli isolates (Figure 2).
Similar results were obtained when assessing the virulence pro-file of the STEC strains. In particular, analysis of O157:H7 strainRM2084 resulted in polymer formation for probes targeting ent,nleA, espP, and katP genes and for probes targeting eae, per, ehxA,stx1, stx2, and fliCH7 when testing the multiplex group 3 or group4, respectively (Figure 2). Further examination of the virulenceprofiles of the O113:H21 strain RM7519 and the O157:H7 strainRM6011 demonstrated that the patterns of polymer formationcorrelated with their genotype that was determined previously byconventional PCR. For reactions lacking a DNA template, polymerformation was observed only with the biotinylated oligonucleotideprobes spotted on the slide as a control for the ampliPHOXpolymerization reaction (Figure 2).
High mean pixel intensities of the signal were obtained for spotswhere polymer formation was detected. Positive signals for O157O-antigen wzy gene spots from analysis of several experiments forO157:H7 strain RM1697 had mean pixel intensity values rang-ing from 84.4 ± 4.8 to 97.5 ± 4.5 with background values rangingfrom 25.2 ± 1.4 to 25.6 ± 1.5. Further, analysis of O157:H7 strainsRM2084 and RM6011 and of O113:H21 strain RM7519 indicatedpositive signal values for all virulence spots ranged from 82.4 ± 2.9to 108.3 ± 2.5 for the group 3 probes, and for the group 4 probes,mean pixel signal intensities ranged from 70.9 ± 6.1 to 112.8 ± 3.4.These results for the positive signals contrasted with backgroundvalues, ranging from 25.2 ± 1.4 to 25.9 ± 1.8. Similar values wereobtained for other arrays used in several experiments for geno-typing reference strains with different O-antigens and virulenceprofiles. These findings indicated a significant difference betweensignal intensities and background noise, facilitating microarraydata analysis, and accurate interpretation of results with this DNAmicroarray-based genotyping method.
GENOTYPING STEC ISOLATES FROM A PRODUCE PRODUCTION REGIONIN CALIFORNIAThe high level of specificity of the microarray colorimetricmethod, obtained in the validation experiments, prompted us toexpand the study to genotype E. coli isolates from produce produc-tion regions in California. Enrichment broths were prepared fromwatershed sediment or from wildlife and livestock fecal samples,and the recovery of E. coli isolates was achieved after plating analiquot of the enrichment broth on selective solid media. A subsetof recovered E coli isolates, identified initially to be positive for var-ious relevant O-types by a conventional PCR assay, were selectedfor analysis with the microarray colorimetric method. As shownin Table 4, the results indicated that this microarray colorimet-ric method accurately determined the O-antigen serogroup of thetested environmental STEC isolates. The formation of polymer onspots targeting a particular O-type correlated with the O-antigenthat was determined previously by a conventional PCR assay(Table 4). Quantification analysis revealed that the mean pixelintensity values of the O-antigen spot signals for all tested isolatesranged from 75.6 ± 6.3 to 110.1 ± 4.8; however, values rangingfrom 25.1 ± 1.6 to 25.9 ± 2.7 were detected for the background.
Frontiers in Cellular and Infection Microbiology www.frontiersin.org May 2012 | Volume 2 | Article 61 | 5

Quiñones et al. Rapid and inexpensive STEC genotyping
FIGURE 1 | Schematic diagram of ampliPHOX colorimetric method
with DNA microarrays. First, DNA microarrays are hybridized with DNAtarget labeled with biotin (red circles). Second, the microarray is labeledwith a photoinitiator (letter P) that is conjugated to streptavidin (blue
polygons). Third, a short light-initiated polymerization reaction results in acolorless polymer localized exclusively where the probe and targetsequences hybridized on the microarray. Polymer formation is visualizedafter a quick staining step.
The virulence profile of the isolates was then analyzed by thismicroarray method. The analysis indicated that more than 50% ofthe tested isolates were positive for the virulence factors eae, ehxA,ent, espP, and stx1, and STEC isolates harboring the same O-typewere also similar in virulence gene profiles (Table 4). Similar tothe O-antigen analysis, the virulence profiles were confirmed by aseparate analysis using conventional PCR assay (data not shown).Further quantification of the detected microarray signals in theanalysis of O45 cattle isolate RM10729 resulted in average signalintensity values of 99.3 ± 4.7, 106.7 ± 6.3, and 78.8 ± 3.8 for spotstargeting espP, saa, and stx1 genes, respectively with a backgroundvalue of 25.3 ± 2.4 for this microarray examined. Moreover, quan-tification of the mean pixel intensity of stx2 spots had a signal value
of 103.1 ± 3.8 and a background value of 25.4 ± 3.5 when analyz-ing feral pig isolate RM10740. These quantification results weretypical for all environmental isolates examined by this microarraymethod. These results revealed a clear distinction between posi-tive signals, where polymer formation was observed on microarrayspots, when compared to the background, and this facilitatedaccurate genotyping of the tested environmental isolates.
DISCUSSIONThe growing concern about sporadic and outbreak illnesses asso-ciated with STEC has prompted the development of methodsfor more efficient detection of STEC in the United States (John-son et al., 1996; Brooks et al., 2005; Gould et al., 2009; Hoefer
Frontiers in Cellular and Infection Microbiology www.frontiersin.org May 2012 | Volume 2 | Article 61 | 6
Quiñones et al. Rapid and inexpensive STEC genotyping
FIGURE 2 | Genotyping Shiga toxin-producing Escherichia coli (STEC)
with low-density DNA microarrays and the ampliPHOX colorimetric
method. STEC reference strains from clinical or environmental sources withdifferent genotypes (Table 1) were analyzed by 30-mer oligonucleotide DNAmicroarrays and the ampliPHOX colorimetric method. The panels, shownunder strain designations, illustrate polymer formation on spotted probes for
microarrays hybridized with amplification reactions testing a particular STECreference strain or controls lacking a DNA template. The array layout showsthe duplicate spots with probes targeting the O-antigen and virulence genesthat are represented in groups 1–4. Biotinylated probes spotted along the top,middle and bottom rows (dark gray) of the array layout correspond to positivecontrols for polymer formation.
et al., 2011; Stigi et al., 2012). To address this issue, the presentstudy developed a simple, rapid, cost–effective, and quantitativecolorimetric method for the assessment of molecular risk fac-tors associated with STEC pathogenesis. The advantage of usingthe DNA microarray platform in conjunction with ampliPHOXcolorimetric method was successfully demonstrated by simultane-ously detecting highly relevant genes on a selected group of STECrecovered from clinical and environmental sources. Previously, alow-density DNA oligonucleotide microarray was developed totarget E. coli O157 (Quiñones et al., 2011), the STEC that has beenmost-commonly associated with produce outbreaks that traced
back to leafy vegetables from the United States (Cooley et al.,2007; Mandrell, 2011). In the present study, additional probeswere designed to target six non-O157 serogroups, reported pre-viously to be associated with the majority of STEC infections inthe United States and worldwide as well as another set of non-O157serogroups, linked to sporadic disease and diarrhea (Brooks et al.,2005; Bettelheim,2007). The selected virulence-specific probes tar-geted stx, eae, nle, and ent genes, located on pathogenicity islandsand implicated in conferring E. coli strains with an increased abilityto cause disease (Coombes et al., 2008; Bolton, 2011). In additionto katP, exhA, espP, and subA gene detection, this microarray
Frontiers in Cellular and Infection Microbiology www.frontiersin.org May 2012 | Volume 2 | Article 61 | 7

Quiñones et al. Rapid and inexpensive STEC genotyping
Ta
ble
4|
Ge
no
typ
ing
Sh
iga
tox
in-p
rod
ucin
gE
sch
eri
ch
iaco
lie
nv
iro
nm
en
tal
iso
late
sw
ith
DN
Am
icro
arr
ay-b
ase
da
mp
liP
HO
Xco
lori
me
tric
me
tho
d.
Iso
late
nu
mb
er
So
urc
eO
-an
tig
en
PC
Ra
ssay
Mic
roa
rray-a
mp
liP
HO
Xg
en
oty
pin
ga
ssay
ge
ne
s
wzyO26
wzyO45
wzxO91
wzyO103
wzyO104
wzyO111
wzyO113
wzyO121
wzyO128
wzyO145
wzyO157
eae
ehxA
ent
espP
fliCH7
katP
nleA
per
saa
stx1
stx2
subA
RM
7847
Cat
tleO
26+
−−
−−
−−
−−
−−
+−
+−
−−
+−
−−
−−
RM
7914
Coy
ote
O26
+−
−−
−−
−−
−−
−+
++
+−
++
−−
+−
−R
M99
13Fe
ralp
igO
26+
−−
−−
−−
−−
−−
++
++
−+
−−
−+
−−
RM
9414
Cat
tleO
45−
+−
−−
−−
−−
−−
−−
−+
−−
−−
++
−−
RM
9408
Cat
tleO
45−
+−
−−
−−
−−
−−
−−
−+
−−
−−
++
−−
RM
1072
9C
attle
O45
−+
−−
−−
−−
−−
−−
−−
+−
−−
−+
+−
−R
M71
90Fe
ralp
igO
91−
−+
−−
−−
−−
−−
−+
−−
−−
−−
+−
+−
RM
7191
Sed
imen
tO
91−
−+
−−
−−
−−
−−
−+
−−
−−
−−
+−
+−
RM
7933
Cat
tleO
91−
−+
−−
−−
−−
−−
−−
−−
−−
−−
−+
+−
RM
9882
Cat
tleO
103
−−
−+
−−
−−
−−
−+
++
+−
+−
−−
+−
−R
M10
408
Cro
wO
103
−−
−+
−−
−−
−−
−+
++
+−
+−
−−
+−
−R
M10
804
Fera
lpig
O10
3−
−−
+−
−−
−−
−−
++
++
−+
+−
−+
−−
RM
8799
Cat
tleO
104
−−
−−
+−
−−
−−
−−
+−
++
−−
−+
−+
+R
M93
87C
attle
O10
4−
−−
−+
−−
−−
−−
−+
−+
+−
−−
+−
++
RM
1103
7C
attle
O10
4−
−−
−+
−−
−−
−−
−+
−+
+−
−−
+−
++
RM
9322
Sed
imen
tO
111
−−
−−
−+
−−
−−
−+
++
−−
−+
−−
+−
−R
M98
81C
attle
O11
1−
−−
−−
+−
−−
−−
++
+−
−−
+−
−+
−−
RM
9907
Fera
lpig
O11
1−
−−
−−
+−
−−
−−
++
+−
−−
+−
−+
−−
RM
7513
Cat
tleO
113
−−
−−
−−
+−
−−
−−
+−
+−
−−
−+
−+
+R
M78
06Fe
ralp
igO
113
−−
−−
−−
+−
−−
−−
+−
+−
−−
−+
−+
+R
M10
410
Cro
wO
113
−−
−−
−−
+−
−−
−−
−−
−−
−−
−−
++
−R
M10
046
Cat
tleO
121
−−
−−
−−
−+
−−
−+
++
+−
−+
−−
−+
−R
M10
068
Sed
imen
tO
121
−−
−−
−−
−+
−−
−+
++
+−
−+
−−
−+
−R
M10
740
Fera
lpig
O12
1−
−−
−−
−−
+−
−−
−−
−−
−−
−−
−−
+−
RM
7408
Dee
rO
128
−−
−−
−−
−−
+−
−−
+−
−−
−−
−−
++
−R
M10
461
Cat
tleO
128
−−
−−
−−
−−
+−
−−
−−
+−
−−
−+
+−
−R
M10
743
Sed
imen
tO
128
−−
−−
−−
−−
+−
−−
−−
+−
−−
−+
+−
−R
M93
03C
attle
O14
5−
−−
−−
−−
−−
+−
++
++
−−
−−
−+
−−
RM
9320
Soi
lO
145
−−
−−
−−
−−
−+
−+
++
+−
−−
−−
+−
−R
M99
17Fe
ralp
igO
145
−−
−−
−−
−−
−+
−+
++
+−
+−
−−
+−
−R
M94
71C
attle
O15
7−
−−
−−
−−
−−
−+
++
++
++
++
−+
+−
RM
9908
Soi
lO
157
−−
−−
−−
−−
−−
++
++
++
++
+−
−+
−R
M10
058
Cro
wO
157
−−
−−
−−
−−
−−
++
++
−+
−+
+−
−+
−
+ Sig
nals
are
prov
ided
with
grey
shad
e.
Frontiers in Cellular and Infection Microbiology www.frontiersin.org May 2012 | Volume 2 | Article 61 | 8

Quiñones et al. Rapid and inexpensive STEC genotyping
method targeted saa, encoding an attachment factor that has beenfound in non-O157 STEC strains isolated from patients sufferingfrom severe disease symptoms (Bettelheim, 2007; Bolton, 2011).An important advantage of the ampliPHOX colorimetric methodis the relatively short 30-mer oligonucleotide probes used, thusfacilitating the specific detection of target genes without any cross-hybridization of non-target genes. In contrast, the commonly usedfluorescent assays for microarray detection require longer probes(70 or 100-mer) to distinguish signals from the background noise(Letowski et al., 2004). Quantification of the colorimetric pos-itive signals in this study revealed that mean pixel intensitieswere at least three times higher than the colorimetric signals forspots without any specific hybridization, and consequently, posi-tive signal intensities were discriminated easily from backgroundnoise.
The use of DNA oligonucleotide arrays on glass slides in con-junction with traditional fluorescence detection assays for geno-typing STEC has been reported previously (Call et al., 2001;Chizhikov et al., 2001; Chen et al., 2005; Bruant et al., 2006).The disadvantage of traditional fluorescent assays for microarray-based detection is that the labeling of target DNA with fluorescentCy dyes can be inconsistent, resulting consequently in decreasedassay sensitivity (Call, 2005; Kuck and Taylor, 2008; Vora et al.,2008). Furthermore, the use of traditional fluorescence requiresthe use of expensive and non-portable confocal scanners fordata analysis and quantification (Kuck and Taylor, 2008; Moultonet al., 2011). Recent reports have documented the developmentof microtube-based DNA arrays as more cost–effective than stan-dard fluorescent methods (Anjum et al., 2007; Ballmer et al., 2007).However, the use of the microtube-based arrays requires micro-gram amounts of purified genomic DNA from the tested strainto reliably detect all expected genes (Anjum et al., 2007), whichis not amenable for high-throughput sampling of a large num-ber of bacterial isolates. In contrast, the ampliPHOX colorimetricdetection method, employed in the present study, uses a small,portable, and inexpensive scanner that is at least tenfold lowerin cost, compared with confocal microarray scanners (Moultonet al., 2011). Moreover, this colorimetric assay uses 2–3 μl ofcrude/unpurified bacterial lysates to successfully detect all target
genes on the microarray with a rapid assay time. The inclusionof an amplification step coupled with an exonuclease digestion oftarget DNA allowed for rapid and accurate genotyping of 25–30STEC isolates in approximately 3–4 h.
The microarray-based colorimetric assay was then employed toexamine the genetic composition of environmental isolates froman important produce production region in the United Stateslocated on the central coast of California. Our findings indicatedthat this assay simultaneously detected relevant O-antigens andvirulence genes in isolates recovered from multiple types of ani-mal fecal samples (livestock and wildlife) and watershed sedimentsamples present on or near farms or ranches in this agriculturalregion. The genotyping results demonstrated that different iso-lates with the same O-antigen gene had a similar virulence geneprofile. Still to be determined is whether the similar virulencegene profiles in non-O157 and in O157 strains represents a sta-ble and predominant genotype in this major produce productionregion. Future work is aimed at assessing molecular risk factorsassociated with STEC pathogenesis in a larger and diverse set ofenvironmental isolates recovered from ranches, farms, and water-shed sites in produce production regions in California for assessingpathogen incidence, movement, and virulence potential. Thus, theDNA microarray-based ampliPHOX colorimetric system, usinglow-cost reagents and instrumentation, proved to be a simple andquantitative method that allowed for rapid and high-throughputO-antigen and virulence factor typing of STEC isolates.
ACKNOWLEDGMENTSThis work was supported by the USDA-Agricultural Research Ser-vice CRIS project number 5325-42000-047 and by the NationalResearch Initiative Competitive Grant numbers 2006-55212-16927 and 2007-35212-18239 from the USDA-National Instituteof Food and Agriculture. We thank Dr. Erica D. Dawson and AmberT. Taylor (InDevR, Inc., Boulder, CO, USA) for assistance withampliPHOX reagents and instrumentation. We also thank Drs. E.Robert Atwill and Michelle T. Jay-Russell from the University ofCalifornia at Davis, the USDA/APHIS-Wildlife Services, and theCalifornia Department of Fish and Game for providing wildlifesamples.
REFERENCESAnjum, M. F., Mafura, M., Slick-
ers, P., Ballmer, K., Kuhnert, P.,Woodward, M. J., and Ehricht,R. (2007). Pathotyping Escherichiacoli by using miniaturized DNAmicroarrays. Appl. Environ. Micro-biol. 73, 5692–5697.
Ballmer, K., Korczak, B. M., Kuhnert, P.,Slickers, P., Ehricht, R., and Hachler,H. (2007). Fast DNA serotyping ofEscherichia coli by use of an oligonu-cleotide microarray. J. Clin. Micro-biol. 45, 370–379.
Bettelheim, K. A. (2007). The non-O157 Shiga-toxigenic (verocytotox-igenic) Escherichia coli; under-ratedpathogens. Crit. Rev. Microbiol. 33,67–87.
Boissinot, K., Huletsky, A., Peytavi, R.,Turcotte, S., Veillette, V., Boissinot,M., Picard, F. J., Martel, E. A., andBergeron, M. G. (2007). Rapidexonuclease digestion of PCR-amplified targets for improvedmicroarray hybridization. Clin.Chem. 53, 2020–2023.
Bolton, D. J. (2011). Verocytotoxigenic(Shiga toxin-producing) Escherichiacoli: virulence factors and patho-genicity in the farm to fork par-adigm. Foodborne Pathog. Dis. 8,357–365.
Brooks, J. T., Sowers, E. G., Wells, J.G., Greene, K. D., Griffin, P. M.,Hoekstra, R. M., and Strockbine, N.A. (2005). Non-O157 Shiga toxin-producing Escherichia coli infections
in the United States, 1983-2002. J.Infect. Dis. 192, 1422–1429.
Bruant, G., Maynard, C., Bekal, S.,Gaucher, I., Masson, L., Brousseau,R., and Harel, J. (2006). Develop-ment and validation of an oligonu-cleotide microarray for detection ofmultiple virulence and antimicro-bial resistance genes in Escherichiacoli. Appl. Environ. Microbiol. 72,3780–3784.
Buvens, G., Possé, B., De Schrijver,K., De Zutter, L., Lauwers, S.,and Piérard, D. (2011). Virulenceprofiling and quantificationof verocytotoxin-producingEscherichia coli O145:H28 andO26:H11 isolated during an icecream-related hemolytic uremic
syndrome outbreak. FoodbornePathog. Dis. 8, 421–426.
Call, D. R. (2005). Challenges andopportunities for pathogen detec-tion using DNA microarrays. Crit.Rev. Microbiol. 31, 91–99.
Call, D. R., Brockman, F. J., and Chan-dler, D. P. (2001). Detecting andgenotyping Escherichia coli O157:H7using multiplexed PCR and nucleicacid microarrays. Int. J. Food Micro-biol. 67, 71–80.
CDC, Centers for Disease Control,and Prevention. (1995). Outbreakof acute gastroenteritis attribut-able to Escherichia coli serotypeO104:H21 – Helena, Montana, 1994.MMWR Morb. Mortal. Wkly. Rep. 44,501–503.
Frontiers in Cellular and Infection Microbiology www.frontiersin.org May 2012 | Volume 2 | Article 61 | 9
Quiñones et al. Rapid and inexpensive STEC genotyping
Chen, S., Zhao, S., Mcdermott, P. F.,Schroeder, C. M., White, D. G., andMeng, J. (2005). A DNA microar-ray for identification of virulenceand antimicrobial resistance genes inSalmonella serovars and Escherichiacoli. Mol. Cell. Probes 19, 195–201.
Chizhikov, V., Rasooly, A., Chumakov,K., and Levy, D. D. (2001). Microar-ray analysis of microbial virulencefactors. Appl. Environ. Microbiol. 67,3258–3263.
Cooley, M., Carychao, D., Crawford-Miksza, L., Jay, M. T., Myers, C., Rose,C., Keys, C., Farrar, J., and Mandrell,R. E. (2007). Incidence and track-ing of Escherichia coli O157:H7 ina major produce production regionin California. PLoS ONE 2, e1159.doi:10.1371/journal.pone.0001159
Coombes, B. K., Gilmour, M. W.,and Goodman, C. D. (2011).The evolution of virulence innon-O157 Shiga toxin-producingEscherichia coli. Front. Microbiol.2:90. doi:10.3389/fmicb.2011.00090
Coombes, B. K., Wickham, M. E., Mas-carenhas, M., Gruenheid, S., Finlay,B. B., and Karmali, M. A. (2008).Molecular analysis as an aid to assessthe public health risk of non-O157Shiga toxin-producing Escherichiacoli strains. Appl. Environ. Microbiol.74, 2153–2160.
Dean-Nystrom, E. A., Melton-Celsa, A.R., Pohlenz, J. F. L., Moon, H. W.,and O’Brien, A. D. (2003). Com-parative pathogenicity of Escherichiacoli O157 and intimin-negative non-O157 Shiga toxin-producing E. colistrains in neonatal pigs. Infect.Immun. 71, 6526–6533.
Gould, L. H., Bopp, C., Strockbine, N.,Atkinson, R., Baselski, V., Body, B.,Carey, R., Crandall, C., Hurd, S.,Kaplan, R., Neill, M., Shea, S., Som-sel, P., Tobin-D’Angelo, M., Griffin,P. M., and Gerner-Smidt, P. (2009).Recommendations for diagnosis ofShiga toxin-producing Escherichiacoli infections by clinical laborato-ries. MMWR Recomm. Rep. 58, 1–14.
Gyles, C. L. (2007). Shiga toxin-producing Escherichia coli: anoverview. J. Anim. Sci. 85, E45–E62.
Hoefer, D., Hurd, S., Medus, C., Cron-quist, A., Hanna, S., Hatch, J.,Hayes, T., Larson, K., Nicholson,C., Wymore, K., Tobin-D’Angelo,M., Strockbine, N., Snippes, P.,Atkinson, R., Griffin, P. M., and
Gould, L. H. (2011). Laboratorypractices for the identification ofShiga toxin-producing Escherichiacoli in the United States, FoodNetsites, 2007. Foodborne Pathog. Dis. 8,555–560.
Ito, H., Terai, A., Kurazono, H., Takeda,Y., and Nishibuchi, M. (1990).Cloning and nucleotide sequencingof Vero toxin 2 variant genes fromEscherichia coli O91:H21 isolatedfrom a patient with the hemolyticuremic syndrome. Microb. Pathog. 8,47–60.
Johnson, R. P., Clarke, R. C., Wilson, J.B., Read, S. C., Rahn, K., Renwick, S.A., Sandhu, K. A., Alves, D., Karmali,M. A., Lior, H., Mcewen, S. A., Spika,J. S., and Gyles, C. L. (1996). Grow-ing concerns and recent outbreaksinvolving non-O157:H7 serotypes ofverotoxigenic Escherichia coli. J. FoodProt. 59, 1112–1122.
Karmali, M. A. (1989). Infectionby verocytotoxin-producing Esche-richia coli. Clin. Microbiol. Rev. 2,15–38.
Karmali, M. A., Mascarenhas, M., Shen,S., Ziebell, K., Johnson, S., Reid-Smith, R., Isaac-Renton, J., Clark,C., Rahn, K., and Kaper, J. B.(2003). Association of genomic Oisland 122 of Escherichia coli EDL933 with verocytotoxin-producingEscherichia coli seropathotypes thatare linked to epidemic and/or seri-ous disease. J. Clin. Microbiol. 41,4930–4940.
Karmali, M. A., Steele, B. T., Petric, M.,and Lim, C. (1983). Sporadic cases ofhaemolytic-uraemic syndrome asso-ciated with faecal cytotoxin andcytotoxin-producing Escherichia coliin stools. Lancet 321, 619–620.
Kimura, R., Mandrell, R. E., Gal-land, J. C., Hyatt, D., and Riley, L.W. (2000). Restriction-site-specificPCR as a rapid test to detectenterohemorrhagic Escherichia coliO157:H7 strains in environmentalsamples. Appl. Environ. Microbiol.66, 2513–2519.
Kuck, L. R., and Taylor, A. W.(2008). Photopolymerization as aninnovative detection technique forlow-density microarrays. BioTech-niques 45, 179–186.
Letowski, J., Brousseau, R., and Mas-son, L. (2004). Designing bet-ter probes: effect of probe size,mismatch position and number
on hybridization in DNA oligonu-cleotide microarrays. J. Microbiol.Methods 57, 269–278.
Mandrell, R. E. (2011). “Tracingpathogens in fruit and vegetable pro-duction chains,” in Tracing Pathogensin the Food Chain, eds S. Brul, P.M. Fratamico, and T. Mcmeekin(Philadelphia, PA: Woodhead Pub-lishing), 548–595.
Mathusa, E. C., Chen, Y., Enache, E.,and Hontz, L. (2010). Non-O157Shiga toxin-producing Escherichiacoli in foods. J. Food Prot. 73,1721–1736.
Moulton, K. R., Taylor, A. W., Rowlen,K. L., and Dawson, E. D. (2011).ampliPHOX colorimetric detectionon a DNA microarray for influenza.J. Vis. Exp. 52, e2682.
Ørskov, I., Ørskov, F., Jann, B., and Jann,K. (1977). Serology, chemistry, andgenetics of O and K antigens ofEscherichia coli. Bacteriol. Rev. 41,667–710.
Quiñones, B., Swimley, M. S., Taylor, A.W., and Dawson, E. D. (2011). Iden-tification of Escherichia coli O157by using a novel colorimetric detec-tion method with DNA microar-rays. Foodborne Pathog. Dis. 8,705–711.
Rangel, J. M., Sparling, P. H., Crowe,C., Griffin, P. M., and Swerd-low, D. L. (2005). Epidemiology ofEscherichia coli O157:H7 outbreaks,United States, 1982-2002. EmergingInfect. Dis. 11, 603–609.
Reid, S. D., Betting, D. J., and Whittam,T. S. (1999). Molecular detection andidentification of intimin alleles inpathogenic Escherichia coli by mul-tiplex PCR. J. Clin. Microbiol. 37,2719–2722.
Rozen, S., and Skaletsky, H. (2000).“Primer3 on the WWW for gen-eral users and for biologist pro-grammers,” in Bioinformatics Meth-ods and Protocols, eds S. Misener andS. A. Krawetz (Totowa, NJ: HumanaPress), 365–386.
Schmidt, H., Scheef, J., Morabito, S.,Caprioli,A.,Wieler, L. H., and Karch,H. (2000). A new Shiga toxin 2 vari-ant (Stx2f) from Escherichia coli iso-lated from pigeons. Appl. Environ.Microbiol. 66, 1205–1208.
Sikes, H. D., Hansen, R. R., John-son, L. M., Jenison, R., Birks, J. W.,Rowlen, K. L., and Bowman, C. N.(2008). Using polymeric materials to
generate an amplified response tomolecular recognition events. Nat.Mater. 7, 52–56.
Smith, D. K., Kassam, T., Singh, B.,and Elliott, J. F. (1992). Escherichiacoli has two homologous gluta-mate decarboxylase genes that mapto distinct loci. J. Bacteriol. 174,5820–5826.
Stigi, K. A., Macdonald, J. K., Tellez-Marfin, A. A., and Lofy, K. H. (2012).Laboratory practices and incidenceof non-O157 Shiga toxin-producingEscherichia coli infections. EmergingInfect. Dis. 18, 477–479.
Uttamchandani, M., Neo, J. L., Ong, B.N., and Moochhala, S. (2009). Appli-cations of microarrays in pathogendetection and biodefence. TrendsBiotechnol. 27, 53–61.
Vora, G. J., Meador, C. E., Ander-son, G. P., and Taitt, C. R. (2008).Comparison of detection and sig-nal amplification methods for DNAmicroarrays. Mol. Cell. Probes 22,294–300.
Wang, L., Rothemund, D., Curd, H., andReeves, P. R. (2003). Species-widevariation in the Escherichia coli fla-gellin (H-antigen) gene. J. Bacteriol.185, 2936–2943.
Conflict of Interest Statement: Theauthors declare that the research wasconducted in the absence of any com-mercial or financial relationships thatcould be construed as a potential con-flict of interest.
Received: 16 March 2012; paper pend-ing published: 13 April 2012; accepted:18 April 2012; published online: 11 May2012.Citation: Quiñones B, Swimley MS,Narm K-E, Patel RN, Cooley MB andMandrell RE (2012) O-antigen and vir-ulence profiling of Shiga toxin-producingEscherichia coli by a rapid and cost–effective DNA microarray colorimetricmethod. Front. Cell. Inf. Microbio. 2:61.doi: 10.3389/fcimb.2012.00061Copyright © 2012 Quiñones, Swimley,Narm, Patel, Cooley and Mandrell. Thisis an open-access article distributed underthe terms of the Creative Commons Attri-bution Non Commercial License, whichpermits non-commercial use, distribu-tion, and reproduction in other forums,provided the original authors and sourceare credited.
Frontiers in Cellular and Infection Microbiology www.frontiersin.org May 2012 | Volume 2 | Article 61 | 10