Embed Size (px)
Citation preview

BIOGAS DISTRIBUTED GENERATION SYSTEMS EVALUATION AND TECHNOLOGY TRANSFER
NYSERDA PROJECT NO. 6597 Interim Report for May 2001 to May 2005
Prepared for
THE NEW YORK STATE ENERGY RESEARCH AND DEVELOPMENT AUTHORITY Albany, NY
Mr. Tom Fiesinger Project Manager
Prepared By:
CORNELL UNIVERSITY
DEPARTMENT OF BIOLOGICAL AND ENVIRONMENTAL ENGINEERING PRO-DAIRY PROGRAM
Ithaca, NY
Curt A. Gooch, P.E.
Principal Investigator
Scott F. Inglis Research Associate
Peter E. Wright, P.E.
Former Principal Investigator
Date: April 15, 2007
NOTICE
This report was prepared by Curt Gooch P.E., and Scott Inglis in the course of performing work contracted
for and sponsored by the New York State Energy Research and Development Authority (hereafter
“NYSERDA”). The opinions expressed in this report do not necessarily reflect those of NYSERDA or the
State of New York, and reference to any specific product, service, process, or method does not constitute an
implied or expressed recommendation or endorsement of it. Further, NYSERDA, the State of New York,
and the contractor make no warranties or representations, expressed or implied, as to the fitness for
particular purpose or merchantability of any product, apparatus, or service, or the usefulness, completeness,
or accuracy of any processes, methods, or other information contained, described, disclosed, or referred to
in this report. NYSERDA, the State of New York, and the contractor make no representation that the use
of any product, apparatus, process, method, or other information will not infringe privately owned rights
and will assume no liability for any loss, injury, or damage resulting from, or occurring in connection with,
the use of information contained, described, disclosed, or referred to in this report.
ii
Table of Contents
Introduction ................................................................................................................................................- 1 - Anaerobic Digestion Overview ..................................................................................................................- 2 -
Energy Production .................................................................................................................................- 2 - Nutrients ................................................................................................................................................- 3 - Pathogens...............................................................................................................................................- 3 -
Project Background ....................................................................................................................................- 3 - Farm Information .......................................................................................................................................- 4 -
Herd Size ...............................................................................................................................................- 5 - Digester Loading ...................................................................................................................................- 6 - Loading Rates ........................................................................................................................................- 7 - Pump Calibration...................................................................................................................................- 7 - Digester Design Parameters.................................................................................................................- 10 -
Testing and Monitoring ............................................................................................................................- 11 - Digester Influent and Effluent Sampling Protocol and Analytical Procedures.........................................- 13 -
Laboratory Procedures.........................................................................................................................- 15 - Project Data ..............................................................................................................................................- 16 -
Digester Influent and Effluent Sampling Results ................................................................................- 16 - Effect of Anaerobic Digestion on Constituents ...................................................................................- 19 -
Mechanical Solid-Liquid Separator Sampling Results .............................................................................- 24 - Solid-liquid Separation Efficiency.......................................................................................................- 28 - Manure Storage Sampling Results.......................................................................................................- 30 - Anaerobic Digester Biogas Production................................................................................................- 31 - Biogas Volume: Measured vs. Calculated ...........................................................................................- 33 - Biogas CO2 Content.............................................................................................................................- 34 - Electrical Energy Generated On-Farm from Biogas............................................................................- 36 - Capacity Factor....................................................................................................................................- 42 - Biogas to Electricity ............................................................................................................................- 43 - Digester Heating ..................................................................................................................................- 46 -
Anaerobic Digester System Economics....................................................................................................- 51 - Digester Performance Indices...................................................................................................................- 53 -
General ................................................................................................................................................- 53 - Electrical Energy Generation...............................................................................................................- 54 - Heat Energy Recovery.........................................................................................................................- 54 - Economics ...........................................................................................................................................- 54 -
Future Work .............................................................................................................................................- 55 -
iii

Potential Optimization Strategies ........................................................................................................- 55 - Odor Quantification..................................................................................................................................- 55 - Project Data ..............................................................................................................................................- 55 - Publications to Date Supported by Project Work .....................................................................................- 56 - References ................................................................................................................................................- 59 -
iv
Table of Tables
Table 1. Daily number of cows in the herd on test day for all farms from January 2004 to May 2005. ...- 6 - Table 2. Estimated digester daily loading (gallons per day) for all farms by month from January 2004 to
May 2005....................................................................................................................................................- 8 - Table 3. Results from Houle piston pump calibration at DDI. ..................................................................- 9 - Table 4. Digester system information.......................................................................................................- 10 - Table 5. Digester influent/effluent sampling start dates. .........................................................................- 11 - Table 6. Equipment purchased in collaboration with the Connected Energy project. .............................- 12 - Table 7. Equipment used to obtain data...................................................................................................- 13 - Table 8. Laboratory analytical methods. .................................................................................................- 15 - Table 9. Digester influent constituent concentrations for all farms.........................................................- 17 - Table 10. Digester effluent constituent concentrations for all farms. ......................................................- 18 - Table 11. Percent change in constituent concentration during anaerobic digestion for each farm.1,2......- 20 - Table 12. Percent change in constituent concentration per unit treatment volume for all digesters.1,2....- 22 - Table 13. Solid-liquid separator influent constituent concentrations for AA, FA, ML, and NH.............- 25 - Table 14. Solid-liquid separator liquid effluent constituent concentrations for AA, FA, ML and NH. ..- 26 - Table 15. Solid-liquid separator solid effluent constituent concentrations for AA, FA, ML, and NH. ...- 27 - Table 16. Average mass flow rate (lbs/min and ft3/min) for four solid-liquid manure separators...........- 28 - Table 17. Percent efficiency of capture for nutrients and solids for AA, FA, and ML............................- 29 - Table 18. Average concentration of constituents in the long-term storage for AA and ML....................- 30 - Table 19. Total monthly metered biogas (ft3) for all farms from January 2004 to May 2005. ................- 32 - Table 20. Average, range, and standard deviation of total monthly metered biogas for all farms from
January 2004 – May 2005. .......................................................................................................................- 32 - Table 21. Biogas produced per pound of volatile solids consumed (ft3/lb.) ............................................- 33 - Table 22. Average biogas CO2 content, percent. .....................................................................................- 35 - Table 23a. Estimated and actual monthly energy generated, purchased, sold, displaced, and utilized for all
farms from January 2004 to July 2004. ....................................................................................................- 37 - Table 23b. Estimated and actual monthly energy generated, purchased, sold, displaced, and utilized for all
farms from August 2004 to May 2005. ....................................................................................................- 38 - Table 24. Capacity factor for each month for AA, ML and NH..............................................................- 42 - Table 25. Biogas (ft3) used per energy produced (kWh) and engine-generator set efficiency (percent) by
month from January 2004 to May 2005. ..................................................................................................- 44 - Table 26. Energy (kWh) per cubic foot of biogas used, multiplied by 1,000. .........................................- 45 - Table 27. Estimated average daily heat (Btu’s) for each digester by month from January 2004 to May
2005..........................................................................................................................................................- 47 -
v
Table 28. Estimated average daily heat demand per treatment volume (Btu’s/gallon) for each digester from
January 2004 to May 2005. ......................................................................................................................- 48 - Table 29. Estimated heat (Btu’s) per estimated daily influent volume (gallons) for AA, DDI, and FA from
January 2004 to May 2005. ......................................................................................................................- 50 - Table 30. Predicted net annual cost or benefit for the five digester systems (Wright et al., 2004)..........- 51 -
vi

Table of Figures
Figure 1. Waste treatment system flow diagram for AA, DDI, ML and NH.............................................- 4 - Figure 2. Waste treatment system flow diagram for FA............................................................................- 5 - Figure 3. Percent change in constituent concentration during anaerobic digestion for each farm...........- 21 - Figure 4. Percent change in constituent concentration during anaerobic digestion for each farm...........- 21 - Figure 5. Graphical representation of normalized Table 12 values for TS, TVS, Acetic A, DCOD, COD,
MAP, and F. Coli. ....................................................................................................................................- 23 - Figure 6. Graphical representation of normalized Table 12 values for TKN, NH3-N, ON, TP, OP, and K. .. -
23 - Figure 7. Measured and calculated biogas (based on prediction equations with COD and VS destroyed as
predictor variables) for AA.......................................................................................................................- 34 - Figure 8. Monthly energy generated, purchased, sold and utilized for AA from January 2004 to May 2005.-
40 - Figure 9. Electrical energy surplus deficit ratios for AA, ML, and NH from January 2004 to May 2005. ... -
40 - Figure 10. Electrical energy surplus projected ratios for ML based on measured biogas production. ....- 41 - Figure 11. Capacity factor for AA, ML, and NH from January 2004 to May 2005. ...............................- 43 - Figure 12. Biogas volume (ft3) utilized at AA, ML, and NH for each kWh generated from April 2004 to
May 2005..................................................................................................................................................- 45 - Figure 13. Estimated average daily heat demand per treatment volume (Btu/gallon) for all farms. .......- 49 - Figure 14. Estimated heat per daily influent volume (Btu’s/gal) for all AA, DDI, and FA.....................- 50 -
vii

Introduction
New York State livestock produce over 15 million tons of manure annually. Improper waste management
can lead to nutrient runoff, pollution of watersheds, and contamination of groundwater. With new
regulations for large concentrated animal feeding operations (CAFOs), farmers are facing increased
expenses to properly manage manure and other by-products. Individual farms (mostly larger farms due to
economics) and groups of farms are looking at anaerobic digestion as a means of treating manure. The
economic viability of anaerobic digestion and its widespread adoption will largely depend on how reliable
the system proves to be over time. Reliability of digester systems is of interest not only to dairy producers,
but also to buyers of their distributed power and of their solid and liquid byproducts.
The goal of NYSERDA’s on-farm distributed generation and composting effort is to help New York State’s
dairy industry manage by-products effectively, efficiently, and economically, while producing electricity
through distributed biogas resources when possible. This on-farm anaerobic digestion monitoring project is
being conducted as a support component of NYSERDA’s Industrial and Agricultural Waste Management
Program. The project focus is to monitor, test, and evaluate anaerobic digestion systems, and disseminate
the findings to dairy producers and their advisors so they can make efficient use of biogas for production of
electricity and heat.
The objectives of this project are to:
1) Perform initial monitoring of performance and characterization of the system outputs.
2) Develop a greater understanding of the performance of components of the overall digester system
(Future testing will be performed for key parameters and components at selected sites.)
3) Build on the results of the baseline monitoring and the shorter-term select testing by identifying
and evaluating opportunities for optimizing the anaerobic digester systems. Experimental testing
may be performed to assess the potential for promising optimization opportunities.
4) Transfer the findings of the work to participating digester system operators and other farmers,
agricultural consultants, equipment designers, digester service businesses, government agencies,
and others who can use the project results to optimize the performance of digester systems and
increase their energy, environmental and economic benefits.
This report primarily focuses on objectives 1, 2 and 4.
- 1 -
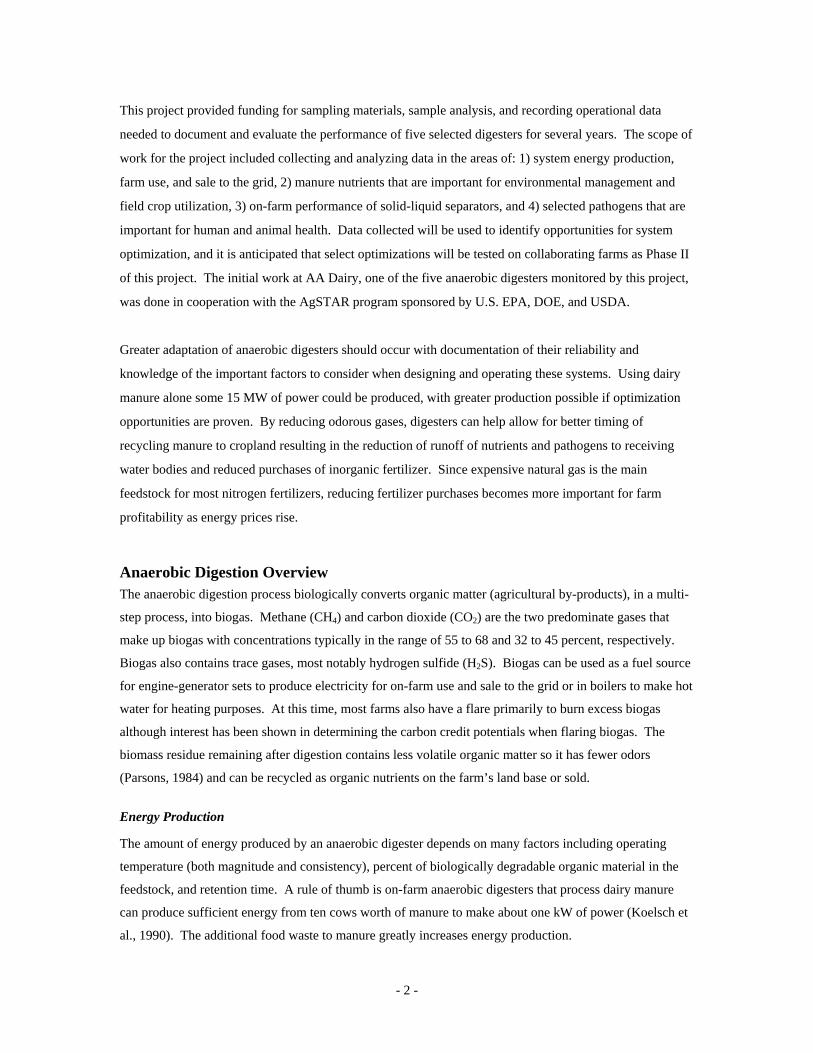
This project provided funding for sampling materials, sample analysis, and recording operational data
needed to document and evaluate the performance of five selected digesters for several years. The scope of
work for the project included collecting and analyzing data in the areas of: 1) system energy production,
farm use, and sale to the grid, 2) manure nutrients that are important for environmental management and
field crop utilization, 3) on-farm performance of solid-liquid separators, and 4) selected pathogens that are
important for human and animal health. Data collected will be used to identify opportunities for system
optimization, and it is anticipated that select optimizations will be tested on collaborating farms as Phase II
of this project. The initial work at AA Dairy, one of the five anaerobic digesters monitored by this project,
was done in cooperation with the AgSTAR program sponsored by U.S. EPA, DOE, and USDA.
Greater adaptation of anaerobic digesters should occur with documentation of their reliability and
knowledge of the important factors to consider when designing and operating these systems. Using dairy
manure alone some 15 MW of power could be produced, with greater production possible if optimization
opportunities are proven. By reducing odorous gases, digesters can help allow for better timing of
recycling manure to cropland resulting in the reduction of runoff of nutrients and pathogens to receiving
water bodies and reduced purchases of inorganic fertilizer. Since expensive natural gas is the main
feedstock for most nitrogen fertilizers, reducing fertilizer purchases becomes more important for farm
profitability as energy prices rise.
Anaerobic Digestion Overview The anaerobic digestion process biologically converts organic matter (agricultural by-products), in a multi-
step process, into biogas. Methane (CH4) and carbon dioxide (CO2) are the two predominate gases that
make up biogas with concentrations typically in the range of 55 to 68 and 32 to 45 percent, respectively.
Biogas also contains trace gases, most notably hydrogen sulfide (H2S). Biogas can be used as a fuel source
for engine-generator sets to produce electricity for on-farm use and sale to the grid or in boilers to make hot
water for heating purposes. At this time, most farms also have a flare primarily to burn excess biogas
although interest has been shown in determining the carbon credit potentials when flaring biogas. The
biomass residue remaining after digestion contains less volatile organic matter so it has fewer odors
(Parsons, 1984) and can be recycled as organic nutrients on the farm’s land base or sold.
Energy Production
The amount of energy produced by an anaerobic digester depends on many factors including operating
temperature (both magnitude and consistency), percent of biologically degradable organic material in the
feedstock, and retention time. A rule of thumb is on-farm anaerobic digesters that process dairy manure
can produce sufficient energy from ten cows worth of manure to make about one kW of power (Koelsch et
al., 1990). The additional food waste to manure greatly increases energy production.
- 2 -

Nutrients
Digester effluent has increased concentrations of ammonia-nitrogen (NH3-N) and ortho phosphorus (OP)
over that of the influent, both of which are readily available for utilization by growing plants. In the case
where post-digested effluent is spread on cropland (when crops are not growing) the possibility of NH3-N
and OP mobilizations outside of the plant root zone exists, possibly contributing to eutrophication of
receiving surface water bodies and contamination of groundwater sources. For Northeastern U.S. farms to
maximize the nutrient value of post-digested manure a minimum of 9-months of storage is needed; at this
time the manure storage period is significantly less on most farms. Land application methods of post-
digested material, assuming odor control is achieved, can result in reduced application costs. For example,
the cost to spray irrigate manure on cropland can be as low as one-quarter of one cent per gallon while
tanker spreading can cost as much as two to two and one-half cents per gallon. Spray irrigation of
untreated manure that has been stored long-term is generally not acceptable due to odor emissions.
Pathogens
Manure-borne pathogens are a concern to both human and cattle health. Pasteurization, chemical
treatment, and separation from the generating source are the primary methods used to kill pathogens. The
anaerobic digestion process can be beneficial to both dairy cows and humans through the reduction of
pathogens entering the environment, specifically M. avium paratuberculosis (Johne’s disease) and fecal
coliform.
Project Background The five New York State dairy farms that participated in the initial phase of the project were AA Dairy
(AA) in Candor, Dairy Development International (DDI) in Homer, J.J. Farber Farm (FA) in East Jewett,
Matlink Farms (ML) in Clymer, and Noblehurst Farms, Inc. (NH) in Linwood. AA, DDI and NH
constructed plug flow digesters. The digester at ML was a mixed digester that digested imported food waste
pre-blended with dairy manure. (Accepting food waste was a strategy to increase biogas production and
collect waste tipping fees both with the goal of increasing revenue generated by the system.) The digester
at FA was originally an experimental fixed-film unit implemented with the goal to determine if this type of
digester, with a four-day retention time using liquid effluent from a solid-liquid manure separator as a
digester feed source, could function in a cold climate and successfully control odor. The primary reason
that each farm constructed an anaerobic digester was to reduce odor emissions from the dairy.
- 3 -

Farm Information Detailed information for each farm participating in the study can be found in the case studies written as part
of this project. Included in each case study is the digester system layout, biogas utilization system,
combined heat and power (CHP) information, manure handling system description, economic information,
system advantages and disadvantages, lessons learned, and farm contact information. A web site link to
each case study is provided in the publications section of this report, or they can be found at
http://www.manuremanagement.cornell.edu/. The initial case studies for each farm were written in June
2004. A waste treatment flow diagram for AA, DDI, ML and NH is shown in Figure 1 and for FA in
Figure 2. Milking center wastewater is not processed by anaerobic digestion at AA, DDI, ML, and NH.
Reception Pit
Aggregated
Barn Manure Food Waste1
Anaerobic Digestion Eng.-Gen.
set
P
P
Solid-Liquid Separator
Liquid Effluent Solid Effluent
Long-term
Storage
Recycled to
Cropland
Stack Pad
Recycled to
Crop Land Sold
Freestall Bedding2
1Food Waste for ML only. 2Separated manure solids used as
bedding material for NH only
Electricity
Figure 1. Waste treatment system flow diagram for AA, DDI, ML and NH.
- 4 -

Figure 2. Waste treatment system flow diagram for FA.
Reception Pit
Aggregated
Barn Manure Milk House
Wastewater
Solid-Liquid Separator
Boiler
P
Anaerobic Digestion
Solid Effluent
Recycled to
Cropland
Recycled to
Crop Land Sold
Liquid Effluent
Long-term
Storage
P
Biogas
Herd Size
The daily number of cows in the herd on test day at each farm, based on data obtained from DHI-202 herd
summary records, is shown in Table 1. For DDI and ML, where test data was not available for every
month, the rolling average number of cows is shown. Overall, this data cannot be used in equations as
independent variables in most cases since it does not accurately represent all waste sources digested.
- 5 -

Table 1. Daily number of cows in the herd on test day for all farms from January 2004 to May 2005. Month AA DDI FA ML NH
January 2004 573 991 105 511 1,303
February 2004 578 991 105 497 1,226
March 2004 560 922 103 497 1,179
April 2004 545 981 104 516 1,186
May 2004 539 972 104 499 1,180
June 2004 528 970 104 499 1,421
July 2004 519 970 113 543 1,431
August 2004 519 947 113 505 1,454
September 2004 525 960 114 505 1,484
October 2004 522 952 117 571 1,492
November 2004 514 956 111 521 1,493
December 2004 512 949 110 521 1,499
January 2005 512 959 113 571 1,516
February 2005 513 952 110 540 1,506
March 2005 510 957 106 540 1,493
April 2005 511 967 105 575 1,481
May 2005 515 957 107 556 1,526
Digester Loading
All five digesters were loaded with a pumping system. A Houle piston pump was used at AA and DDI. At
AA, the pump was controlled by a time clock that automatically ran the pump continuously for
approximately 4 hours daily while at DDI a countdown timer was used to automatically turn off the pump
after it was manually started. The DDI time clock was typically set to run the influent pump continuously
for 2-3 hours daily. Centrifugal pumps were used at ML, NH, and FA. At ML, food waste was pumped
into a mix tank and mixed with dairy manure four times per day; the resulting mixture was pumped into the
digester six times a day. The mix tank impeller agitator ran for 5 minutes twice each day. The digester
influent pump at NH was controlled automatically using a float control system. At FA the influent pump
- 6 -

was controlled by a time clock set to feed the digester initially 12 then later 24 times daily. Calibration of
the influent pumps is discussed later in this report.
Loading Rates
The estimated daily average loading volume for each digester is shown in Table 2. Missing table values
represent times when digester influent loading data was not available. The methods used to collect and
calculate the average loading rate varied between farms. For AA and DDI, the influent pump calibration
data (Table 3), was used in conjunction with the pump daily operating time to obtain the estimated loading
volume. For ML and NH, the farm owners provided the estimated daily loading values based on their
observations. At FA, the loading volumes were obtained from project data collected under NYSERDA
project No. 6249. The estimated daily loading values for AA, DDI, and FA were considered sufficiently
accurate to use in equations as values for predictor variables.
Influent volumes for AA and NH are consistent from month to month. The digester influent pump at AA
was on a time clock and its settings were not changed. Volumes for NH were estimated by the producer
and the estimation did not change throughout the monitoring period.
Pump Calibration
The Houle piston pump used to load the DDI digester was calibrated by measuring the change in manure
depth in the manure reception pit every 5 minutes over the period of time to load the digester for a day.
Manure reception pit recharge rate subsequent to pumping was measured every 10 minutes for the next two
hours. The results of the test are summarized in Table 3.
Future loading calculations will be based on data collected by an ultrasonic level detector or similar device
installed on selected farms. Depth to manure level data will be used in combination with the dimensions of
the influent and effluent reception tanks to more accurately quantify the daily digester influent values.
- 7 -

Table 2. Estimated digester daily loading (gallons per day) for all farms by month from January 2004 to May 2005.
Month Substrate AA1 DDI1 FA1 ML2,3 NH2
Manure 11,055 24,259 709 14,000 18,000 January 2004 Other - - - 5,000 -
Manure 11,055 28,302 709 12,000 18,000 February 2004 Other - - - 14,000 -
Manure 11,055 25,000 857 12,000 18,000 March 2004 Other - - - 10,000 -
Manure 11,055 28,302 896 - 18,000 April 2004 Other - - - - -
Manure 11,055 25,000 1,040 17,000 18,000 May 2004 Other - - - 15,000 -
Manure 11,055 25,000 1,181 - 18,000 June 2004 Other - - - - -
Manure 11,055 25,000 1,181 13,000 18,000 July 2004 Other - - - 4,000 -
Manure 11,055 24,259 1,181 15,000 18,000 August 2004 Other - - - 15,000 -
Manure 11,055 20,000 1,181 15,000 18,000 September 2004 Other - - - 12,000 -
Manure 11,055 24,000 1,155 15,000 18,000 October 2004 Other - - - 12,000 -
Manure 11,055 24,000 1,155 22,000 18,000 November 2004 Other - - - 7,000 -
Manure 11,055 24,500 1,155 15,000 18,000 December 2004 Other - - - 10,000 -
Manure 11,055 24,259 1,155 14,000 18,000 January 2005 Other - - - 3,500 -
Manure 11,055 26,280 1,155 12,000 18,000 February 2005 Other - - - 6,000 -
Manure 11,055 20,793 1,155 15,000 18,000 March 2005 Other - - - 10,000 -
Manure 11,055 12,129 1,155 15,000 18,000 April 2005 Other - - - 12,000 -
Manure 11,055 15,000 1,155 15,000 18,000 May 2005 Other - - - 13,000 - 1Based on pump calibration test data 2Estimated values by producer 3Manure and food waste combined
- 8 -

Table 3. Results from Houle piston pump calibration at DDI. Results
Average pumping (inches/minute) -0.535
Average filling (inches/minute) 0.071
Average pumping (filling factored in): -0.606
Total surface area (in2) 49,662
Average volume pumped out (cubic inches/min) 30,076
Average volume pumped out (gallons/minute) 129.9
Average (gallons/stroke) 43.3
The Houle piston pump at AA is the same make and model tested at DDI and therefore, it was assumed that
the pump at AA also displaced 43 gallons/stroke. Rate of delivery (gallons per minute) of the pump at AA
was calculated per site conditions at the farm. Site conditions at AA included total pump run time and
frequency of stokes per minute.
- 9 -
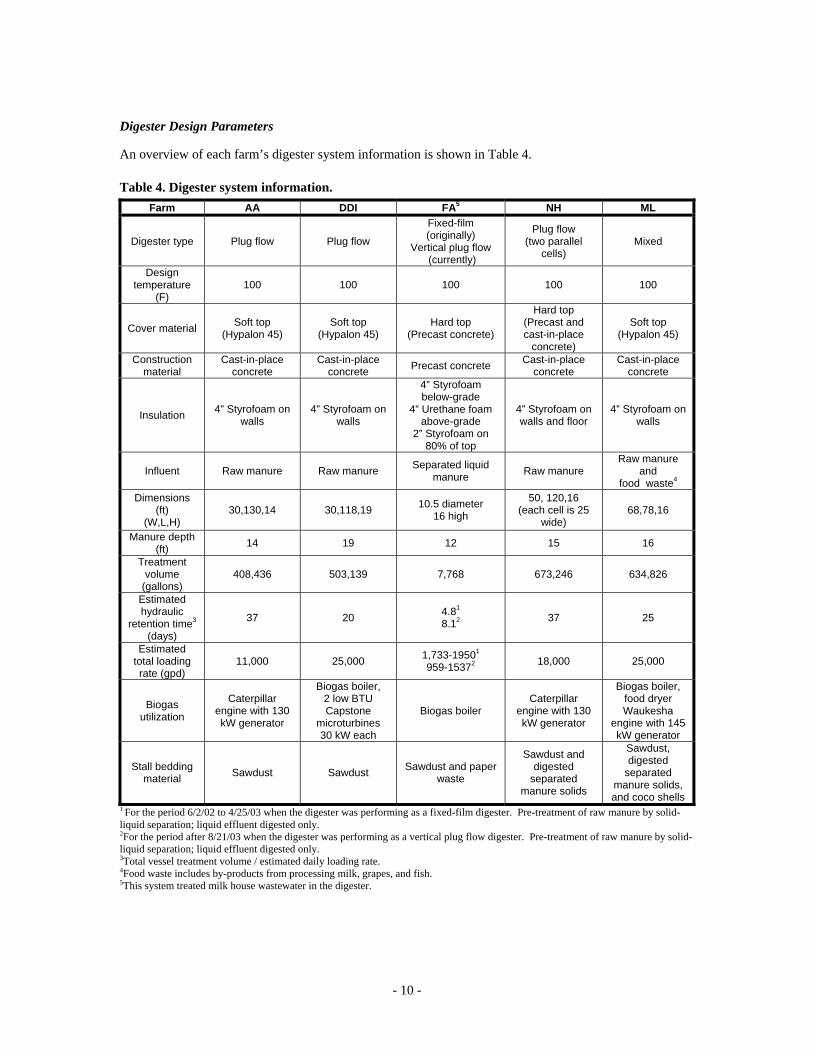
Digester Design Parameters
An overview of each farm’s digester system information is shown in Table 4.
Table 4. Digester system information. Farm AA DDI FA5 NH ML
Digester type Plug flow Plug flow
Fixed-film (originally)
Vertical plug flow (currently)
Plug flow (two parallel
cells) Mixed
Design temperature
(F) 100 100 100 100 100
Cover material Soft top (Hypalon 45)
Soft top (Hypalon 45)
Hard top (Precast concrete)
Hard top (Precast and cast-in-place
concrete)
Soft top (Hypalon 45)
Construction material
Cast-in-place concrete
Cast-in-place concrete Precast concrete Cast-in-place
concrete Cast-in-place
concrete
Insulation 4” Styrofoam on walls
4” Styrofoam on walls
4” Styrofoam below-grade
4” Urethane foam above-grade
2” Styrofoam on 80% of top
4” Styrofoam on walls and floor
4” Styrofoam on walls
Influent Raw manure Raw manure Separated liquid manure Raw manure
Raw manure and
food waste4
Dimensions (ft)
(W,L,H) 30,130,14 30,118,19 10.5 diameter
16 high
50, 120,16 (each cell is 25
wide) 68,78,16
Manure depth (ft) 14 19 12 15 16
Treatment volume
(gallons) 408,436 503,139 7,768 673,246 634,826
Estimated hydraulic
retention time3 (days)
37 20 4.81
8.12 37 25
Estimated total loading rate (gpd)
11,000 25,000 1,733-19501
959-15372 18,000 25,000
Biogas utilization
Caterpillar engine with 130 kW generator
Biogas boiler, 2 low BTU Capstone
microturbines 30 kW each
Biogas boiler Caterpillar
engine with 130 kW generator
Biogas boiler, food dryer Waukesha
engine with 145 kW generator
Stall bedding material Sawdust Sawdust Sawdust and paper
waste
Sawdust and digested
separated manure solids
Sawdust, digested
separated manure solids, and coco shells
1 For the period 6/2/02 to 4/25/03 when the digester was performing as a fixed-film digester. Pre-treatment of raw manure by solid-liquid separation; liquid effluent digested only. 2For the period after 8/21/03 when the digester was performing as a vertical plug flow digester. Pre-treatment of raw manure by solid-liquid separation; liquid effluent digested only. 3Total vessel treatment volume / estimated daily loading rate. 4Food waste includes by-products from processing milk, grapes, and fish. 5This system treated milk house wastewater in the digester.
- 10 -

Testing and Monitoring
Differences in construction schedules, final construction completion dates, and commissioning periods
resulted in various monitoring start dates for each digestion system as shown in Table 5.
Table 5. Digester influent/effluent sampling start dates. Farm Monitoring Starting Date AA May, 2001 DDI January, 2002 FA June, 2001 ML March, 2003 NH August, 2003
Influent and effluent grab samples were taken monthly in most cases for all digesters monitored. Samples
were analyzed in the laboratory for some or all of the following constituents as appropriate: total Kjeldahl
nitrogen (TKN), ammonia-nitrogen (NH3-N), total phosphorous (TP), ortho phosphorous (OP), total
potassium (K), copper (Cu), pH, volatile acids calculated and reported as acetic acid (Acetic A), chemical
oxygen demand (COD), dissolved COD (DCOD), fecal Coliform (F. Coli.), Johne’s disease (MAP), total
solids (TS) and total volatile solids (TVS). Organic-nitrogen (ON) was determined by subtracting NH3-N
from TKN. Sampling points for each farm include digester influent and effluent and the two effluent
streams from the solid-liquid separator.
The constituents TKN, NH3-N, ON, TP, OP, and K are important from a crop nutrient management
perspective while pH, Acetic A, COD, DCOD, TS, and TVS can be used to evaluate the performance of an
anaerobic digester. Quantification of TS and TVS consumed (Minott, 2002) and COD consumed (Metcalf
and Eddy, Inc, 2003) by the anaerobic digestion process can be used to predict biogas production. An
understanding of the reductions of MAP and F. Coli can be used to quantify the effect of the anaerobic
digestion process on overall pathogen reduction.
AA, DDI, ML, and NH each had a digester/engine-generator set performance log sheet that included the
following categories: biogas used, biogas flared (where available), energy generated, energy purchased,
energy sold, digester heating loop temperature to and from the digester, digester temperature, and, for ML,
the number of cows and heifers supplying manure to the digester. Some farms recorded this information
daily and others weekly. Data from these logs were entered monthly into Microsoft EXCEL.
The project purchased two portable ultrasonic flow meters, a Dynasonics Model No. TFXP ($6,190) and a
Dynasonics Model No. TFXD ($3,382), to measure the heat used to operate the digesters. Portable
temperature sensors (Hobo Pro, Onset Computer Corp. ($1,725)) were also purchased to record ambient
- 11 -
temperature and digester influent and effluent temperatures. This equipment was shared between farms; it
was located at a pair of farms for a month and then relocated to another pair of farms.
Engine parameters recorded by the project were obtained from instrumentation installed by each farm that
generated electricity. The instrumentation at AA and ML was purchased from Martin Machinery and at
NH from Perennial Energy.
Biogas carbon dioxide concentrations were measured during the same site visits when heat flow equipment
was installed. Additionally, digester operators periodically measured and recorded carbon dioxide
concentration.
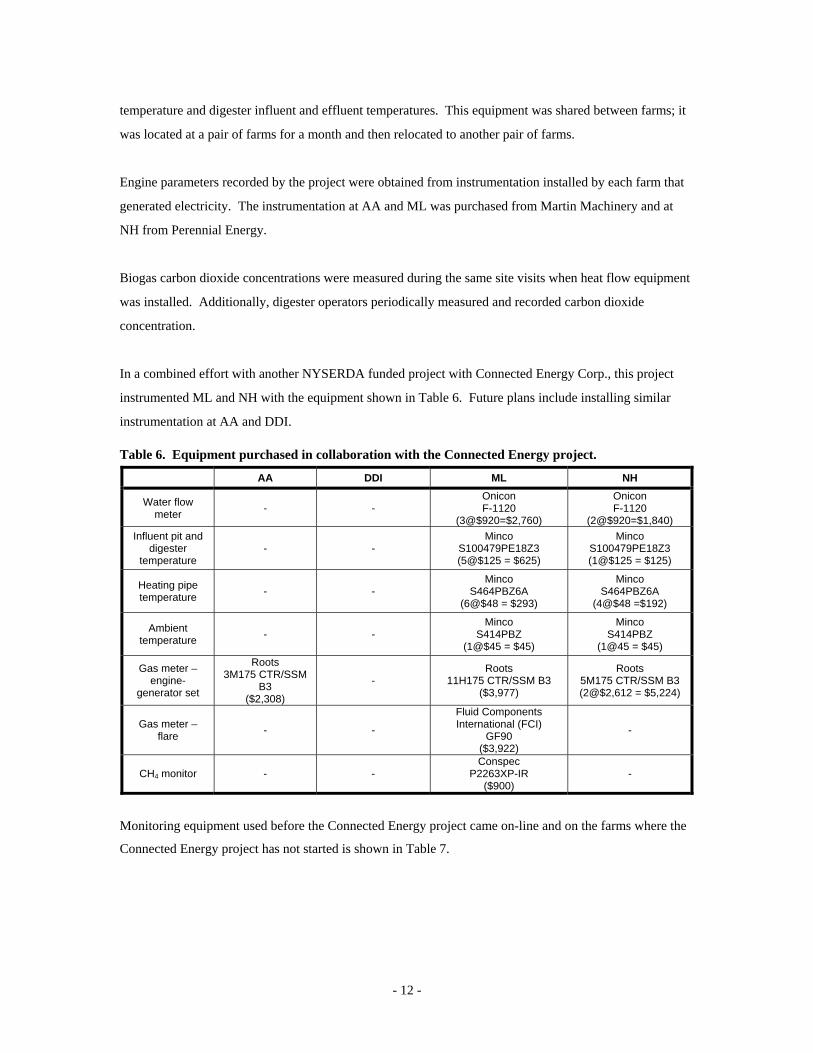
In a combined effort with another NYSERDA funded project with Connected Energy Corp., this project
instrumented ML and NH with the equipment shown in Table 6. Future plans include installing similar
instrumentation at AA and DDI.
Table 6. Equipment purchased in collaboration with the Connected Energy project.
AA DDI ML NH
Water flow meter - -
Onicon F-1120
(3@$920=$2,760)
Onicon F-1120
(2@$920=$1,840) Influent pit and
digester temperature
- - Minco
S100479PE18Z3 (5@$125 = $625)
Minco S100479PE18Z3 (1@$125 = $125)
Heating pipe temperature - -
Minco S464PBZ6A
(6@$48 = $293)
Minco S464PBZ6A
(4@$48 =$192)
Ambient temperature - -
Minco S414PBZ
(1@$45 = $45)
Minco S414PBZ
(1@45 = $45)
Gas meter – engine-
generator set
Roots 3M175 CTR/SSM
B3 ($2,308)
- Roots
11H175 CTR/SSM B3 ($3,977)
Roots 5M175 CTR/SSM B3 (2@$2,612 = $5,224)
Gas meter – flare - -
Fluid Components International (FCI)
GF90 ($3,922)
-
CH4 monitor - - Conspec
P2263XP-IR ($900)
-
Monitoring equipment used before the Connected Energy project came on-line and on the farms where the
Connected Energy project has not started is shown in Table 7.
- 12 -

Table 7. Equipment used to obtain data.
AA DDI FA ML NH
Engine parameters (hrs,
kWh)
Equipment purchased from
Martin Machinery
- - Equipment
purchased from Martin Machinery
Equipment purchased from
Perennial Energy
Digester heating water flow meter
Dynasonics TFXP, TFXD
Dynasonics TFXP, TFXD
In-line meter from Mitchell Instruments
Dynasonics TFXP, TFXD
Dynasonics TFXP, TFXD
Onicon
Digester and reception pit temperature
Onset HOBO, Extech
EasyView 10
Onset HOBO, Extech
EasyView 10
Omega MDSS41-TC
(digester only)
Onset HOBO, Extech EasyView
10
Onset HOBO, Extech EasyView
10
Digester heating pipe temperature
Minco S464PBZ6A
Minco S464PBZ6A
In-line from Mitchell
Instruments
Minco S464PBZ6A
Minco S464PBZ6A
Ambient temperature Onset HOBO Onset HOBO Omega
MDSS41-TC Onset HOBO Onset HOBO
Gas meter – engine-generator
set
Roots 3M175
CTR/SSM B3
Roots 3M175 SSM
B3
Roots 2M175 SSM B3
Roots 11H175 CTR/SSM
B3
Roots 5M175 CTR/SSM
B3
Gas meter – flare - - -
Fluid Components International (FCI)
GF90 ($3,922)
-
CO2 measurement
Bacharach Fyrite (0-60%)
Bacharach Fyrite (0-60%)
Bacharach Fyrite (0-60%)
Bacharach Fyrite (0-60%)
Bacharach Fyrite (0-60%)
CH4 line monitor - - - Conspec P2263XP-IR -
Digester Influent and Effluent Sampling Protocol and Analytical Procedures
The following protocol was followed to sample the digester influent, effluent and solid-liquid manure
separator effluent streams from project initiation until August 2001 at AA.
1. Label sample containers with date, time, farm, location.
2. Sample from lowest pathogen concentration to highest pathogen concentration; i.e. digester
effluent, solid-liquid manure separator streams, and lastly digester influent.
3. Collect separator solid effluent in a clean, 25-gallon Rubbermaid storage container until it is about
half full. Mix the contents of the container by hand, and take a sub-sample from the mixed batch
and place sample in one 4-oz. sample container.
4. Place the sealed sample container in cooler filled with ice.
5. Use a clean 5-gallon pail to collect separated liquid from the closest discharge pipe available. Fill
the pail until it is ¾ full by placing the pail in the separated liquid effluent stream. Mix the
contents of the pail. Pour the mixed contents into one 4-oz. sample container.
6. Place in cooler filled with ice.
- 13 -

7. Digester effluent was sampled using a dipper to take ten non-interrupted continuous 16-oz. sub-
samples from the overflow of the weir when manure is flowing freely from digester. All 10
samples were combined in a clean 5-gallon pail and mixed thoroughly. A 4-oz. composite sample
was taken from the pail and placed on ice.
8. The dipper was thoroughly rinsed with clean water.
9. The dipper was used to take ten non-interrupted continuous 16-oz sub-samples of well-agitated
raw manure from the raw manure storage tank. Each sample was combined in a clean 5-gallon
pail and mixed thoroughly. A 4-oz. composite sample was taken from the pail and placed on ice.
10. All samples were delivered to the lab within 24 hours.
After August 2001 the sampling protocol was adjusted in an effort to reduce settling in the 5-gallon pails
and to reflect a true grab sample protocol. The sampling protocol used after August 2001 for all farms was
as follows.
1. Label the sample cups with date, time, farm, location.
2. Sample from lowest pathogen concentration to highest pathogen concentration i.e. the digester
effluent before digester influent, and the solid-liquid manure separator effluent streams before the
digester. At FA, because the separator was located upstream of the digester, the digester was
sampled first, then the solid-liquid manure separator effluent streams, and finally the raw manure
pit.
3. If manure was not flowing over the effluent weir, digester effluent samples were collected using a
16-oz. dipper, and transferred to a 4-oz. sample container. Typically, digester effluent samples
were collected while the digester was loaded, resulting in flow over the digester effluent weir.
Any solids build-up was removed such that digester effluent could flow over the entire weir prior
to sampling. A 4-oz sample was obtained by placing a 4-oz. sample container in the digester
effluent stream.
4. Separated liquid effluent was sampled by placing the 4-oz. container directly in the stream of the
separated liquid effluent.
5. Separated solid samples were taken directly from the separated solid effluent stream. Collected
solids were placed directly in a 4-oz. sample container.
6. Raw manure was collected by using a 16-oz. dipper. The dipper was filled completely with well
agitated manure. Manure was transferred immediately from the 16-oz. dipper into the 4-oz.
sample container.
7. Collected samples were placed in a cooler filled with ice immediately after sample was collection.
- 14 -

When triplicate samples were taken (at FA from March 2004 to December 2004) the sampling procedure
above was performed three times.
Laboratory Procedures
Collected samples were analyzed singularly at Certified Environmental Services, Inc. (CES) located in
Syracuse, New York for all constituents except Johne’s disease (MAP). The testing for MAP was
performed at the Cornell Veterinary School Diagnostic Lab. The analytical methods used to determine
constituent concentrations are shown in Table 8. All samples were analyzed by the laboratories on an as-
received basis.
Table 8. Laboratory analytical methods.
Sampling / Monitoring Parameter Test Method
Total Solids (TS) EPA 160.3
Total Volatile Solids (TVS) EPA 160.4
Total Phosphorous (TP) EPA 365.3
Ortho Phosphorous (OP) EPA 365.3
Total Kjeldahl Nitrogen (TKN) EPA 351.4
Ammonia-Nitrogen (NH3-N) SM18 4500F
Organic-Nitrogen (ON) By subtraction: TKN - NH3-N
Total Potassium (K) EPA SW 846 6010
Total Copper (Cu) SW846 6010
Fecal Coliform (F. Coli.) SM18 9221E
Johne’s Disease (MAP) Cornell method
Volatile Acid as Acetic Acid (Acetic A) SM18 5560C
Dissolved COD (DCOD) SM18 5220B
Chemical Oxygen Demand (COD) SM18 5220B
pH SW846 9045
Each sample was analyzed for MAP by the Cornell Diagnostic Laboratory using a procedure they
developed and that is recognized as the industry standard method for MAP concentration determination.
For the test, 0.15 mL of each sample was diluted in three tubes with 1, 10 and 100 mL of water and the
largest MAP population count was reported to give a worst case scenario for the result. Note: MAP
concentration is calculated differently by different labs but it is generally reported as cfu/gram (Stabel,
1997; Whitlock, et al., 2000).
- 15 -

CES also had to perform dilutions of the manure samples for several of the analysis they performed. The
total solids, total volatile solids, and pH analysis were performed on the samples as received. The TP, OP,
TKN, NH3-N, K, F Coli., Acetic A, DCOD, and COD constituents were determined from a dilution of 40
mL from each sample collected from the digester influents, effluents, and solid-liquid separator influents
and liquid effluents with 40 mL of distilled water. These same constituents were determined from 15
grams of each sample collected from the solid effluents from the solid-liquid separators. All diluted
samples were blended in a blender prior to analysis.
Project Data
The data and analyses developed to date are as follows.
Digester Influent and Effluent Sampling Results The values in Tables 9 and 10 are the average (Ave), standard deviation (St. Dev.), 99 percent confidence
interval (CI) and the number of samples (n) for the digester influent and effluent samples. A confidence
interval for a mean specifies a range of values within which the unknown population parameter, in this case
the mean, may lie (Easton and McColl, 2005). An example using Table 9 is as follows. The mean log 10
MAP and its associated confidence interval for AA is 3.9±0.1. There is a level of confidence of 99% that
the true population mean is in the range of 3.9 – 0.1 and 3.9 + 0.1 or 3.8 to 4.0.
All samples are included in Tables 9 and 10 as reported from the laboratory except for ML calculated
influent. ML calculated influent is the weighted average of the food waste and manure lab data multiplied
by their associated estimated volumes.
The data shows that the food wastes imported to ML varied in constituent concentration when compared to
the farm’s manure. As would be expected, the concentration of F. Coli was much less in food waste
compared to manure. The concentrations of Acetic A, TKN, and ON were very similar for the food wastes
and manure while the food waste concentration of NH3-N, TP, OP, and K were lower than manure. From a
comprehensive nutrient management plan (CNMP) perspective, a unit of food waste contained overall less
nutrients by mass compared to a unit of manure on this farm. (Note: a recent analysis of a food waste
sample collected from a cheese plant had a TP concentration about four times greater than cow manure.)
Average food waste concentrations for DCOD, COD, TS, and TVS were 16, 46, 50, and 53 percent,
respectively greater than the ML manure average values. These comparatively higher concentrations
provided more biogas production potential for food wastes mixed with manure than just manure alone.
Overall, the addition of food wastes added more biogas production potential per unit volume and less
nutrients of concern with respect to the farm’s CNMP than adding more cow manure alone.
- 16 -

Table 9. Digester influent constituent concentrations for all farms.
Constituent Statistic AAA DDIBFA
Fixed- Film1,C
FA Vertical
Plug Flow1,D
ML ManureE
ML Food
WasteF
ML Calculated
Influent NHG
Ave 3.9 3.3 - - 3.1 - 3.0 3.6 St. Dev. 0.5 0.6 - - 0.8 - 0.8 0.4
CI 0.1 0.4 - - 0.6 - 0.6 0.3 Log10 MAP (cfu/gram)
n 65 17 - - 13 - 13 11 Ave 6.1 5.9 5.5 5.9 5.5 1.0 5.4 6.0
St. Dev. 0.8 0.9 0.7 0.5 0.6 1.1 0.6 0.6 CI 0.2 0.5 0.5 0.2 0.3 0.6 0.3 0.3
Log10 F. Coli. (mpn/gram)
n 73 27 12 46 24 23 24 19 Ave 3,273 3,688 - 2,799 3,382 3,654 3,623 2,881
St. Dev. 1,368 1,005 - 799 1,174 2,035 1,277 1,021 CI 536 402 - 217 451 798 671 437
Acetic A (mg/kg)
n 25 24 - 52 26 25 24 21 Ave 24,331 22,797 22,463 23,583 38,712 46,335 39,111 23,508
St. Dev. 8,315 7,877 4,656 6,453 11,624 22,330 11,956 11,021 CI 1,894 3,028 2,866 2,582 4,650 8,934 6566 4,714
DCOD (mg/l)
n 74 26 10 24 24 24 22 21 Ave 125,875 103,496 54,028 57,184 171,761 364,169 200,756 78,586
St. Dev. 174,622 66,317 4,439 11,284 82,745 206,665 103,487 28,638 CI 39,520 25,014 2,623 3,097 32,435 82,682 55583 12,248
COD (mg/kg)
n 75 27 11 51 25 24 23 21 Ave 4,782 3,682 3,898 3,718 3,366 3,086 3,174 4,075
St. Dev. 1,275 641 722 584 984 1,118 877 974 CI 289 238 365 163 386 447 471 416
TKN (mg/kg)
n 75 28 15 49 25 24 23 21 Ave 1,876 1,866 2,140 2,226 1,296 571 1,177 1,944
St. Dev. 474 423 345 330 558 234 438 634 CI 107 157 175 90 214 92 230 271
NH3-N (mg/kg)
n 75 28 15 52 26 25 24 21 Ave 2,908 1,815 1,758 1,485 2,095 2,392 1,944 2,130
St. Dev. 1,167 613 679 505 643 1,212 698 923 CI 264 227 344 141 252 475 367 395
ON (mg/kg)
n 75 28 15 49 25 25 24 21 Ave 803 561 659 517 570 446 534 503
St. Dev. 241 105 100 94 189 168 143 148 CI 55 39 51 26 73 66 75 63
TP (mg/kg)
n 75 28 15 52 26 25 24 21 Ave 457 298 382 313 329 198 296 242
St. Dev. 132 92 62 56 137 119 90 80 CI 30 34 31 15 53 47 47 34
OP (mg/kg)
n 75 28 15 52 26 25 24 21 Ave 1,927 2,425 - 2,756 2,756 931 2,742 2,374
St. Dev. 299 341 - 638 875 1,165 909 422 CI 169 193 - 232 458 633 649 239
K (mg/kg)
n 12 12 - 29 14 13 13 12 Ave 11.15 9.81 4.96 5.36 13.06 26.1 15.5 10.4
St. Dev. 1.24 1.55 0.42 0.65 4.16 18.7 8.21 2.29 CI 0.28 0.58 0.21 0.18 1.60 7.34 4.31 0.98
TS (percent)
n 75 28 15 52 26 25 24 21 Ave 9.44 8.21 3.37 3.75 11.73 25.21 14.31 7.72
St. Dev. 1.05 1.40 0.39 0.52 4.19 18.8 8.33 1.91 CI 0.24 0.52 0.20 0.14 1.61 7.37 4.38 0.82
TVS (percent)
n 75 28 15 52 26 25 24 21 Ave 16.08 50 - - 12 2.82 7.00 15.7
St. Dev. 8.95 19 - - 11 0.73 2.68 6.2 CI 3.92 18 - - 10 0.64 3.45 6.08
Cu (mg/kg)
n 20 4 - - 5 5 4 4 Ave 7.24 7.48 7.34 7.35 5.43 3.65 5.36 7.42
St. Dev. 0.32 0.47 0.18 0.27 0.96 0.77 0.83 0.39 CI 0.07 0.18 0.9 0.07 0.37 0.30 0.44 0.17
pH (Std. units)
n 75 28 15 52 26 25 24 21 1The influent for digester at FA is the same as the separator liquid effluent. AAA was sampled monthly from 5/2001 – 6/2002 and 7/2003 – 4/2005. BDDI was sampled monthly from 1/2002 – 8/2002 and 7/2003 – 4/2005. CFA fixed-film was sampled monthly from 11/2001 – 4/2003. DFA vertical plug flow was sampled monthly, and for some periods more intensively, from 8/2003 – 9/2004 and one sample during 12/2004. EML manure was sampled monthly from 3/2003 – 4/2005. FML food waste was sampled monthly from 3/2003 – 4/2005. GNH was sampled monthly from 8/2003 – 4/2005.
- 17 -

Table 10. Digester effluent constituent concentrations for all farms.
Constituent Statistic AAA DDIBFA
Fixed- FilmC
FA Vertical
Plug FlowD
MLENH
Digester Cell 1F
NH Digester Cell 2G
Ave 1.8 1.5 - - 2.0 1.7 2.0 St. Dev. 0.6 0.3 - - 0.5 0.4 0.4
CI 0.2 0.2 - - 0.4 0.4 0.4 Log (MAP) (cfu/gram)
N 59 15 - - 11 9 8 Ave 3.1 3.5 3.8 4.4 3.4 3.5 3.8
St. Dev. 0.7 0.9 0.9 0.8 0.6 0.7 0.5 CI 0.2 0.5 0.6 0.3 0.3 0.4 0.3
Log (F. Coli.) (mpn/gram)
N 70 24 15 43 22 17 17 Ave 871 1,658 929 1,077 469 569 589
St. Dev. 1,582 1,416 484 775 273 270 395 CI 620 566 274 213 105 115 169
Acetic A (mg/kg)
N 25 24 12 51 26 21 21 Ave 16,053 17,711 16,411 19,577 13,244 20,211 18,168
St. Dev. 6,555 7,520 3,838 5,736 7,257 8,060 5,869 CI 1,494 2,890 2,379 2,295 2,903 3,447 21
DCOD (mg/l)
N 74 26 10 24 24 21 2510 Ave 88,993 88,232 45,309 46,669 63,070 63,107 63,067
St. Dev. 76,921 12,620 13,764 44,224 12,516 17,272 17,846 CI 17,409 47,760 8,134 12,137 4,906 7,387 7,633
COD (mg/kg)
N 75 27 11 51 25 21 21 Ave 5,145 3,717 3,830 3,854 3,263 4,203 4,001
St. Dev. 1,292 928 737 575 513 869 829 CI 292 344 373 161 201 372 355
TKN (mg/kg)
N 75 28 15 49 25 21 21 Ave 2,588 2,294 2,439 2,636 1,326 2,516 2,329
St. Dev. 421 454 314 357 381 464 515 CI 95 168 159 100 146 199 220
NH3-N (mg/kg)
N 75 28 15 49 26 21 21 Ave 2,556 1,815 1,391 1,218 1,921 1,687 1,672
St. Dev. 1,292 613 790 564 421 749 681 CI 292 227 400 158 165 321 291
ON (mg/kg)
N 75 28 15 49 25 21 21 Ave 811 556 627 487 553 518 514
St. Dev. 220 126 94 116 122 102 92 CI 50 47 48 32 47 44 39
TP (mg/kg)
N 75 28 15 51 26 21 21 Ave 534 325 440 360 290 310 290
St. Dev. 122 84 61 83 89 40 56 CI 28 31 31 23 34 17 24
OP (mg/kg)
N 75 28 15 51 26 21 21 Ave 2,216 2,530 - 2,650 2,592 2,363 2,499
St. Dev. 401 342 - 628 590 580 500 CI 227 194 - 225 309 328 283
K (mg/kg)
N 12 12 - 30 14 12 12 Ave 8.08 7.25 3.99 4.62 5.60 8.52 8.20
St. Dev. 1.08 1.56 0.54 1.12 0.74 1.31 1.57 CI 0.24 0.58 0.27 0.31 0.29 0.56 0.67
TS (percent)
N 75 28 15 51 26 21 21 Ave 6.43 5.81 2.60 2.89 4.35 6.51 6.26
St. Dev. 0.91 1.47 0.45 0.33 0.51 1.22 1.39 CI 0.21 0.55 0.23 0.09 0.20 0.52 0.60
TVS (percent)
N 75 28 15 51 26 21 21 Ave 31 74 - - 15.4 15.3 20.75
St. Dev. 14 12 - - 3.51 6.15 4.86 CI 6.4 12 - - 3.07 6.03 4.76
Cu (mg/kg)
N 20 4 - - 5 4 4 Ave 7.90 7.68 7.72 7.86 7.60 7.74 7.75
St. Dev. 0.10 0.23 0.10 0.12 0.13 0.18 0.14 CI 0.02 0.08 0.05 0.03 0.05 0.08 0.06
pH (Std. units)
N 75 28 15 51 26 21 21 AAA was sampled monthly from 5/2001 – 6/2002 and 7/2003 – 4/2005. BDDI was sampled monthly from 1/2002 – 8/2002 and 7/2003 – 4/2005. CFA fixed-film was sampled monthly from 11/2001 – 4/2003. DFA vertical plug flow was sampled monthly, and for some periods more intensively, from 8/2003 – 9/2004 and one sample during 12/2004. EML manure was sampled monthly from 3/2003 – 4/2005. FNH Cell 1 waste was sampled monthly from 8/2003 – 4/2005. GNH Cell 2 was sampled monthly from 8/2003 – 4/2005.
- 18 -

Effect of Anaerobic Digestion on Constituents
The percent change of all constituents between digester influent and digester effluent was calculated using
Equation 1 with results shown in Table 11. The average value for each constituent at each farm shown in
Tables 9 and 10 were used in Equation 1.
Equation 1.
[ ] [ ][ ] 100
influenteffluent influentchange Percent ∗⎟⎟
⎠
⎞⎜⎜⎝
⎛ −=
A negative value indicates an increase in the constituent concentration as a result of the digestion process
while a positive value represents a constituent concentration reduction. A paired two-tailed student’s T-test
was used to determine if the digester influent and effluent constituent concentration values are equal or not,
and shaded table cells indicates those values found to be statistically different at the 99 percent confidence
interval (CI) while those cells not shaded were not found to be statistically different at the 95 percent CI.
A graphical representation of Table 11 values are shown in Figures 3 and 4. The constituents related to
manure solids and pathogens (TS, TVS, Acetic A, DCOD, COD, MAP, and F. Coli.) are shown in Figure 3
while those related to manure nutrients (TKN, NH3-N, ON, TP, OP, and K) are shown in Figure 4.
As expected to occur, a consistent reduction for TS, TVS, ON, Acetic A, DCOD, COD, MAP and F. Coli
was shown to exist due to the anaerobic digestion process. Organic matter, represented by TS, TVS, Acetic
A (indirectly), DCOD, and COD was consumed by operative microorganism during the anaerobic digestion
process to make biogas. (Since plug flow digesters also inherently function as sedimentation tanks, a
reduction of organic matter can occur due to the sedimentation process as well.) The two pathogens, MAP
and F. Coli, were subject to consistent heating for a time frame that in theory equals the estimated digester
hydraulic retention time; this, combined with the time they were away from the host appears to be the two
governing reasons for their significant reduction. Particle short circuiting of the digestion system that
inherently takes place for ML (due to the mixing system) did not adversely affect the concentration
reductions of the pathogens based on comparisons made to the other digester performances.
- 19 -

Table 11. Percent change in constituent concentration during anaerobic digestion for each farm.1,2
Constituent AAA DDIB FA Fixed- FilmC
FA Vertical Plug
FlowDMLE
NH Digester Cell 1F
NH Digester Cell 2G
TS 27.5 26.2 19.6 15.1 63.9 18.1 21.2
TVS 31.9 29.3 22.8 22.8 69.6 15.5 18.8
TKN -7.5 -1.0 1.7 -3.7 -2.8 -3.15 1.81
NH3-N -37.9 -22.9 -14.0 -17.7 -12.7 -29.4 -19.7
ON 12.1 21.6 20.9 17.9 1.2 20.8 21.5
TP -0.93 0.9 4.9 5.79 -3.6 -3.10 -2.26
OP -16.7 -9.0 -15.2 -15.0 2.0 -28.0 -19.7
K -14.9 -4.3 - 3.86 5.5 0.47 -5.26
Acetic A 73.3 55.0 66.8 61.5 87.1 80.2 79.5
DCOD 34.0 22.3 26.9 17.0 66.1 14.0 22.7
COD 29.3 14.7 16.1 18.3 68.6 19.7 19.7
MAP 98.7 99.1 - - 94.8 98.7 98.1
F. Coli. 99.9 99.7 80.7 96.3 98.4 99.5 99.5 1Positive table values represent a reduction in constituent concentration while negative values represent an increase in the constituent concentration. 2Shaded table cells indicates those values found to be statistically different at the 99 percent confidence interval (CI) while those cells not shaded were not found to be statistically different at the 95 percent CI. AAA was sampled monthly from 5/2001 – 6/2002 and 7/2003 – 4/2005. BDDI was sampled monthly from 1/2002 – 8/2002 and 7/2003 – 4/2005. CFA fixed-film was sampled monthly from 11/2001 – 4/2003. DFA vertical plug flow was sampled monthly, and for some periods more intensively, from 8/2003 – 9/2004 and one sample during 12/2004. EML manure was sampled monthly from 3/2003 – 4/2005. FNH Cell 1 was sampled monthly from 8/2003 – 4/2005. GNH Cell 2 was sampled monthly from 8/2003 – 4/2005.
Conversely, there was a noticeable increase in NH3-N and OP concentrations during the anaerobic
digestion process. The conditions present in an anaerobic digester were favorable for the mineralization of
ON (as indicated by its concentration reduction) to NH3-N and for a shift of some organic P to OP.
Increases in NH3-N and OP concentration both need to be accounted for in each farm’s comprehensive
nutrient management plan (CNMP).
There should be an insignificant change in concentration of TKN, TP, and K due to the anaerobic digestion
process since biogas does not appreciably contain the elements N, P, or K. However for TKN, the data
vary from a 4 percent decrease to an 8 percent increase; this could be the result of settling of some TKN in
the digesters (for the cases where there were decreases), sampling variation, and/or laboratory error.
Relatively little concentration change existed for TP from influent to effluent, as expected for all digesters.
Influent/effluent potassium concentration showed little change for all digesters.
- 20 -

0
10
20
30
40
50
60
70
80
90
100
AA DDI FA FixedFilm
FA VerticalPlug Flow
ML NH DigesterCell 1
NH DigesterCell 2
Perc
ent C
hang
e
TS
TVS
VA
DCOD
COD
MAP
F. Coli.
Figure 3. Percent change in constituent concentration during anaerobic digestion for each farm.
-50
-40
-30
-20
-10
0
10
20
30
AA DDI FA FixedFilm
FA VerticalPlug Flow
ML NHDigester
Cell 1
NHDigester
Cell 2
Perc
ent C
hang
e
TKN
NH3-N
ON
TP
OP
K
Figure 4. Percent change in constituent concentration during anaerobic digestion for each farm.
- 21 -

The effect of each digester’s hydraulic retention time (HRT) on the percent change in constituent
concentration was normalized by dividing the values in Table 11 by the estimated HRT (Table 4); results
are shown in Table 12. Graphical representation of Table 12 values for TS, TVS, Acetic A, DCOD, COD,
MAP, and F. Coli. are shown in Figure 5 while values for TKN, NH3-N, ON, TP, OP, and K are shown in
Figure 6.
Table 12. Percent change in constituent concentration per unit treatment volume for all digesters.1,2
Constituent AAA DDIBFA
Fixed FilmC
FA Vertical
Plug FlowD
MLENH
Digester Cell 1F
NH Digester Cell 2G
TS 0.74 1.31 4.90 2.32 2.55 0.49 0.57 TVS 0.86 1.47 5.70 3.51 2.78 0.42 0.51 TKN -0.20 -0.05 0.43 -0.57 -0.11 -0.09 0.05
NH3-N -1.02 -1.15 -3.50 -2.72 -0.51 -0.79 -0.53
ON 0.33 1.08 5.23 2.75 0.05 0.56 0.58 TP -0.03 0.05 1.23 0.89 -0.14 -0.08 -0.06 OP -0.45 -0.45 -3.80 -2.31 0.08 -0.76 -0.53 K -0.40 -0.22 - 0.59 0.22 0.01 -0.14
Acetic A 1.98 2.75 16.70 9.46 3.48 2.17 2.15 DCOD 0.92 1.12 6.73 2.62 2.65 0.38 0.61 COD 0.79 0.74 4.03 2.82 2.74 0.53 0.53 MAP 2.67 4.96 - - 3.79 2.67 2.65
F. Coli. 2.70 4.99 20.18 14.82 3.93 2.69 2.69 1 Positive table values represent a reduction in constituent concentration while negative values represent an increase in the constituent concentration. 2Shaded table cells indicates those values found to be statistically different at the 99 percent confidence interval (CI) while those cells not shaded were not found to be statistically different at the 95 percent CI. AAA was sampled monthly from 5/2001 – 6/2002 and 7/2003 – 4/2005. BDDI was sampled monthly from 1/2002 – 8/2002 and 7/2003 – 4/2005. CFA fixed-film was sampled monthly from 11/2001 – 4/2003. DFA vertical plug flow was sampled monthly, and for some periods more intensively, from 8/2003 – 9/2004 and one sample during 12/2004. EML manure was sampled monthly from 3/2003 – 4/2005. FNH Cell 1 was sampled monthly from 8/2003 – 4/2005. GNH Cell 2 was sampled monthly from 8/2003 – 4/2005.
Results shown in Table 12 represent the daily efficiency of each digester design to reduce or increase each
constituent. As expected the digester with the highest surface area per treatment volume (FA, fixed film)
had the highest efficiency to reduce or increase each constituent. In several cases FA (vertical plug flow
digester) had the second highest efficiencies. At ML the mixed digester processing food waste was not as
efficient as the FA digester; however, it did perform better than the plug flow digesters at DDI, AA, and
NH. The general trends mentioned in the previous sentences are supported by the data in that the highest
TVS reduction per unit volume occurred at FA (fixed-film) followed by FA (plug flow), ML, DDI, AA,
and finally NH. The pathogen reduction trend was nearly identical as exhibited by TS and TVS. Digesters
with longer HRT’s were less efficient at reducing TS, TVS, and pathogen concentrations per unit volume.
The Acetic A unit reductions were similar to TS, TVS, except at NH, DDI, and AA.
- 22 -

0
2
4
6
8
10
12
14
16
18
20
AA DDI FA Fixed Film FA VerticalPlug Flow
ML NH DigesterCell 1
NH DigesterCell 2
Perc
ent c
hang
e / H
RT
TSTVSVADCODCODMAPF. Coli.
Figure 5. Graphical representation of normalized Table 12 values for TS, TVS, Acetic A, DCOD,
COD, MAP, and F. Coli.
-5
-4
-3
-2
-1
0
1
2
3
4
5
AA DDI FA Fixed Film FA VerticalPlug Flow
ML NH DigesterCell 1
NH DigesterCell 2
Perc
ent c
hang
e / H
RT
TKN
NH3-N
ON
TP
OP
K
Figure 6. Graphical representation of normalized Table 12 values for TKN, NH3-N, ON, TP, OP,
and K.
- 23 -

Mechanical Solid-Liquid Separator Sampling Results
All anaerobic digester treatment systems included a screw-press solid-liquid separator. A separator
processed digester effluent at AA, DDI (infrequently), ML, and NH and raw manure at FA where the liquid
effluent was subsequently fed to the digester. AA used two FAN separators during the study: Model No.
PSS 1-520 and Model No. PSS 2-520, both with a 0.5 mm screen. FA also used a FAN separator, Model
No. PSS 2-520 with a 0.75 mm screen. A Vincent separator (Model No. K2-10) with a 2.25 mm screen
was used at ML while model No. KP-10 was used at NH.
Separator influent and effluents were sampled monthly, with increased frequency for AA-1 during the 14-
month period from May 2001 to June 2002. The average (Ave), standard deviation (St. Dev.), 99 percent
confidence interval (CI), and number of samples (n) for the solid-liquid separator influent stream, liquid
effluent stream, and solid effluent stream are shown in Tables 13, 14 and 15, respectively. The two
columns for AA (AA-1 and AA-2) represent the two different separators that the farm used over the course
of the sampling. All available data from NH digester cell 1 and cell 2 during the entire study were
averaged to determine the influent concentration of the constituents for the NH separator. Operation of the
separator at DDI was infrequent and therefore was not sampled as part of this project.
The nutrient concentrations in the solid effluent stream varied more than the liquid effluent stream. TP and
OP were consistently higher in concentration for all farms except for FA; K was consistently lower for all
farms.
Separator influent and effluent estimated mass flow rates are shown in Table 16 for AA, ML, and FA. The
separator installation at FA allowed the influent flow rate to be measured directly while the installations at
AA and ML did not; influent flow rate was calculated by performing a system mass balance where the
separator liquid influent is equal to the sum of the measurements of the separator liquid and solid effluent
streams. Mass flow data for FA was obtained from Ludington (2006). Mass flow data at NH was not
obtained and therefore this farm was included in this analysis.
- 24 -

Table 13. Solid-liquid separator influent constituent concentrations for AA, FA, ML, and NH.
Constituent Statistic AA-1A AA-2B FAC MLD NHE
Ave 1.8 1.8 - 2.0 1.8 St. Dev. 0.5 0.5 - 0.5 0.3
CI 0.2 0.5 - 0.4 0.2 Log10 MAP (cfu/gram)
n 48 7 - 11 11 Ave 3.0 3.5 6.0 3.4 3.6
St. Dev. 0.8 0.3 0.6 0.6 0.5 CI 0.5 0.3 0.3 0.3 0.2
Log10 F. Coli. (mpn/gram)
n 52 11 27 22 19 Ave 15,937 17,350 27,957 13,244 19,242
St. Dev. 5,193 5,667 19,380 7,257 6,653 CI 1,385 3,513 10,535 2,903 2,916
DCOD (mg/l)
n 54 10 13 24 20 Ave 87,025 66,555 89,370 63,070 61,714
St. Dev. 25,436 11,567 40,857 12,516 10,221 CI 6,784 6,835 16,697 4,906 4,479
COD (mg/kg)
n 54 11 23 25 20 Ave 5,445 4,292 3,944 3,263 4,029
St. Dev. 1,232 1,457 617 513 776 CI 329 861 233 201 340
TKN (mg/kg)
n 54 11 27 25 20 Ave 2,683 2,231 2,253 1,326 2,414
St. Dev. 408 373 425 381 470 CI 109 220 160 146 206
NH3-N (mg/kg)
n 54 11 27 26 20 Ave 2,762 2,061 1,691 1,921 1,616
St. Dev. 1,288 1,490 654 421 629 CI 343 880 247 165 276
ON (mg/kg)
n 54 11 27 25 20 Ave 908 552 649 553 508
St. Dev. 163 124 170 122 79 CI 43 73 64 47 35
TP (mg/kg)
n 54 11 27 26 20 Ave 583 397 363 290 300
St. Dev. 86 71 61 89 44 CI 23 42 23 34 19
OP (mg/kg)
n 54 11 27 26 20 Ave - 2,234 - 2,592 2,435
St. Dev. - 523 - 590 500 CI - 388 - 309 295
K (mg/kg)
n - 7 - 14 11 Ave 8.37 7.40 9.96 5.60 8.25
St. Dev. 1.08 0.77 1.38 0.74 1.21 CI 0.29 0.45 0.27 0.29 0.53
TS (percent)
n 54 11 27 26 20 Ave 6.61 5.93 7.97 4.35 6.28
St. Dev. 0.96 0.65 1.18 0.51 1.09 CI 0.26 0.39 0.44 0.20 0.48
TVS (percent)
n 54 11 27 26 20 Ave 7.92 7.83 7.45 7.60 7.74
St. Dev. 0.09 0.09 0.25 0.13 0.13 CI 0.02 0.05 0.09 0.05 0.06
pH (Std. units)
n 54 11 27 26 20 AAA-1 was sampled monthly from 5/2001 – 6/2002 BAA-2 was sampled monthly from 1/2004 – 11/2004. CFA was sampled monthly from 11/2001 – 12/2003. DML manure was sampled monthly from 3/2003 – 4/2005. ENH was sampled monthly from 10/2004 – 2/2005.
- 25 -
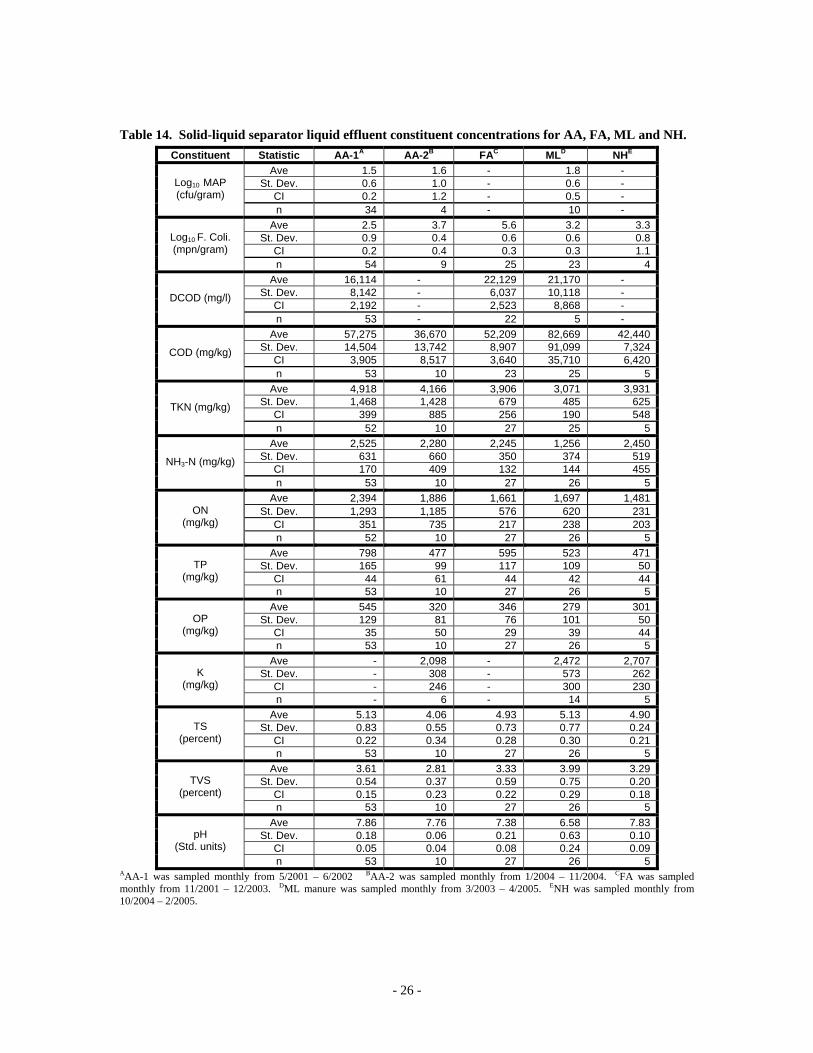
Table 14. Solid-liquid separator liquid effluent constituent concentrations for AA, FA, ML and NH. Constituent Statistic AA-1A AA-2B FAC MLD NHE
Ave 1.5 1.6 - 1.8 - St. Dev. 0.6 1.0 - 0.6 -
CI 0.2 1.2 - 0.5 - Log10 MAP (cfu/gram)
n 34 4 - 10 - Ave 2.5 3.7 5.6 3.2 3.3
St. Dev. 0.9 0.4 0.6 0.6 0.8 CI 0.2 0.4 0.3 0.3 1.1
Log10 F. Coli. (mpn/gram)
n 54 9 25 23 4 Ave 16,114 - 22,129 21,170 -
St. Dev. 8,142 - 6,037 10,118 - CI 2,192 - 2,523 8,868 -
DCOD (mg/l)
n 53 - 22 5 - Ave 57,275 36,670 52,209 82,669 42,440
St. Dev. 14,504 13,742 8,907 91,099 7,324 CI 3,905 8,517 3,640 35,710 6,420
COD (mg/kg)
n 53 10 23 25 5 Ave 4,918 4,166 3,906 3,071 3,931
St. Dev. 1,468 1,428 679 485 625 CI 399 885 256 190 548
TKN (mg/kg)
n 52 10 27 25 5 Ave 2,525 2,280 2,245 1,256 2,450
St. Dev. 631 660 350 374 519 CI 170 409 132 144 455
NH3-N (mg/kg)
n 53 10 27 26 5 Ave 2,394 1,886 1,661 1,697 1,481
St. Dev. 1,293 1,185 576 620 231 CI 351 735 217 238 203
ON (mg/kg)
n 52 10 27 26 5 Ave 798 477 595 523 471
St. Dev. 165 99 117 109 50 CI 44 61 44 42 44
TP (mg/kg)
n 53 10 27 26 5 Ave 545 320 346 279 301
St. Dev. 129 81 76 101 50 CI 35 50 29 39 44
OP (mg/kg)
n 53 10 27 26 5 Ave - 2,098 - 2,472 2,707
St. Dev. - 308 - 573 262 CI - 246 - 300 230
K (mg/kg)
n - 6 - 14 5 Ave 5.13 4.06 4.93 5.13 4.90
St. Dev. 0.83 0.55 0.73 0.77 0.24 CI 0.22 0.34 0.28 0.30 0.21
TS (percent)
n 53 10 27 26 5 Ave 3.61 2.81 3.33 3.99 3.29
St. Dev. 0.54 0.37 0.59 0.75 0.20 CI 0.15 0.23 0.22 0.29 0.18
TVS (percent)
n 53 10 27 26 5 Ave 7.86 7.76 7.38 6.58 7.83
St. Dev. 0.18 0.06 0.21 0.63 0.10 CI 0.05 0.04 0.08 0.24 0.09
pH (Std. units)
n 53 10 27 26 5 AAA-1 was sampled monthly from 5/2001 – 6/2002 BAA-2 was sampled monthly from 1/2004 – 11/2004. CFA was sampled monthly from 11/2001 – 12/2003. DML manure was sampled monthly from 3/2003 – 4/2005. ENH was sampled monthly from 10/2004 – 2/2005.
- 26 -
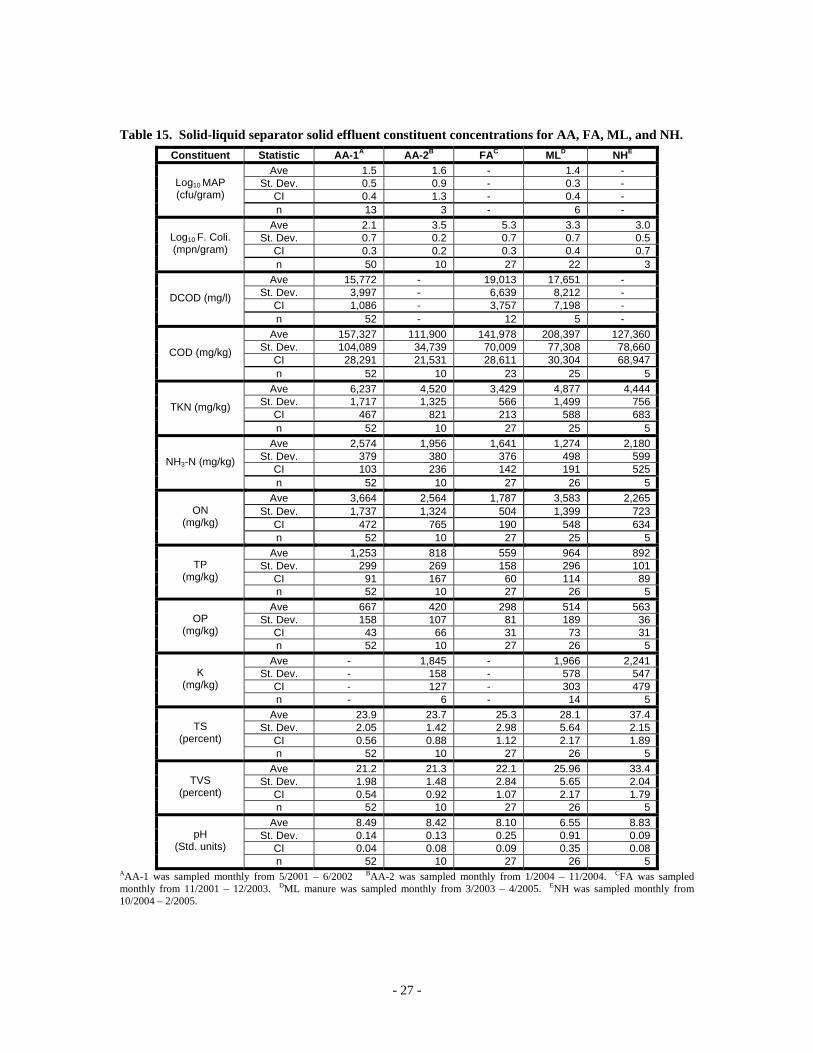
Table 15. Solid-liquid separator solid effluent constituent concentrations for AA, FA, ML, and NH. Constituent Statistic AA-1A AA-2B FAC MLD NHE
Ave 1.5 1.6 - 1.4 - St. Dev. 0.5 0.9 - 0.3 -
CI 0.4 1.3 - 0.4 - Log10 MAP (cfu/gram)
n 13 3 - 6 - Ave 2.1 3.5 5.3 3.3 3.0
St. Dev. 0.7 0.2 0.7 0.7 0.5 CI 0.3 0.2 0.3 0.4 0.7
Log10 F. Coli. (mpn/gram)
n 50 10 27 22 3 Ave 15,772 - 19,013 17,651 -
St. Dev. 3,997 - 6,639 8,212 - CI 1,086 - 3,757 7,198 -
DCOD (mg/l)
n 52 - 12 5 - Ave 157,327 111,900 141,978 208,397 127,360
St. Dev. 104,089 34,739 70,009 77,308 78,660 CI 28,291 21,531 28,611 30,304 68,947
COD (mg/kg)
n 52 10 23 25 5 Ave 6,237 4,520 3,429 4,877 4,444
St. Dev. 1,717 1,325 566 1,499 756 CI 467 821 213 588 683
TKN (mg/kg)
n 52 10 27 25 5 Ave 2,574 1,956 1,641 1,274 2,180
St. Dev. 379 380 376 498 599 CI 103 236 142 191 525
NH3-N (mg/kg)
n 52 10 27 26 5 Ave 3,664 2,564 1,787 3,583 2,265
St. Dev. 1,737 1,324 504 1,399 723 CI 472 765 190 548 634
ON (mg/kg)
n 52 10 27 25 5 Ave 1,253 818 559 964 892
St. Dev. 299 269 158 296 101 CI 91 167 60 114 89
TP (mg/kg)
n 52 10 27 26 5 Ave 667 420 298 514 563
St. Dev. 158 107 81 189 36 CI 43 66 31 73 31
OP (mg/kg)
n 52 10 27 26 5 Ave - 1,845 - 1,966 2,241
St. Dev. - 158 - 578 547 CI - 127 - 303 479
K (mg/kg)
n - 6 - 14 5 Ave 23.9 23.7 25.3 28.1 37.4
St. Dev. 2.05 1.42 2.98 5.64 2.15 CI 0.56 0.88 1.12 2.17 1.89
TS (percent)
n 52 10 27 26 5 Ave 21.2 21.3 22.1 25.96 33.4
St. Dev. 1.98 1.48 2.84 5.65 2.04 CI 0.54 0.92 1.07 2.17 1.79
TVS (percent)
n 52 10 27 26 5 Ave 8.49 8.42 8.10 6.55 8.83
St. Dev. 0.14 0.13 0.25 0.91 0.09 CI 0.04 0.08 0.09 0.35 0.08
pH (Std. units)
n 52 10 27 26 5 AAA-1 was sampled monthly from 5/2001 – 6/2002 BAA-2 was sampled monthly from 1/2004 – 11/2004. CFA was sampled monthly from 11/2001 – 12/2003. DML manure was sampled monthly from 3/2003 – 4/2005. ENH was sampled monthly from 10/2004 – 2/2005.
- 27 -
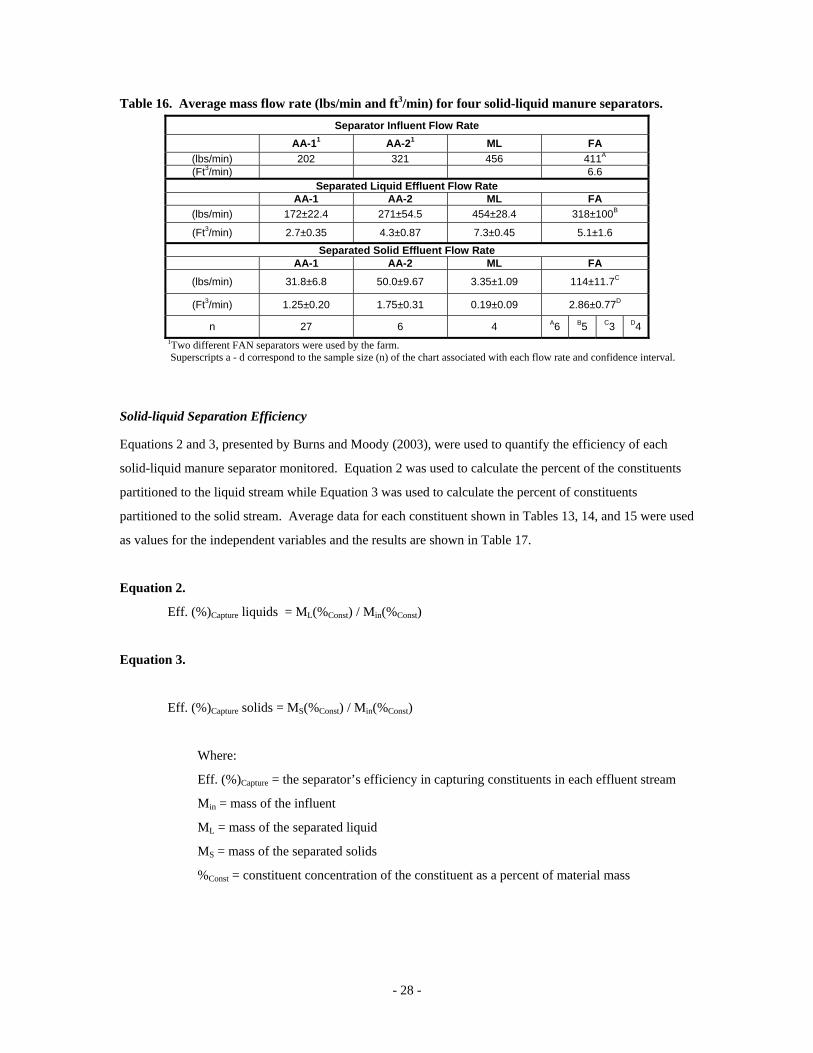
Table 16. Average mass flow rate (lbs/min and ft3/min) for four solid-liquid manure separators. Separator Influent Flow Rate
AA-11 AA-21 ML FA
(lbs/min) 202 321 456 411A
(Ft3/min) 6.6 Separated Liquid Effluent Flow Rate
AA-1 AA-2 ML FA (lbs/min) 172±22.4 271±54.5 454±28.4 318±100B
(Ft3/min) 2.7±0.35 4.3±0.87 7.3±0.45 5.1±1.6
Separated Solid Effluent Flow Rate AA-1 AA-2 ML FA
(lbs/min) 31.8±6.8 50.0±9.67 3.35±1.09 114±11.7C
(Ft3/min) 1.25±0.20 1.75±0.31 0.19±0.09 2.86±0.77D
n 27 6 4 A6 B5 C3 D4 1Two different FAN separators were used by the farm.
Superscripts a - d correspond to the sample size (n) of the chart associated with each flow rate and confidence interval.
Solid-liquid Separation Efficiency
Equations 2 and 3, presented by Burns and Moody (2003), were used to quantify the efficiency of each
solid-liquid manure separator monitored. Equation 2 was used to calculate the percent of the constituents
partitioned to the liquid stream while Equation 3 was used to calculate the percent of constituents
partitioned to the solid stream. Average data for each constituent shown in Tables 13, 14, and 15 were used
as values for the independent variables and the results are shown in Table 17.
Equation 2.
Eff. (%)Capture liquids = ML(%Const) / Min(%Const)
Equation 3.
Eff. (%)Capture solids = MS(%Const) / Min(%Const)
Where:
Eff. (%)Capture = the separator’s efficiency in capturing constituents in each effluent stream
Min = mass of the influent
ML = mass of the separated liquid
MS = mass of the separated solids
%Const = constituent concentration of the constituent as a percent of material mass
- 28 -

Table 17. Percent efficiency of capture for nutrients and solids for AA, FA, and ML.
Separated Liquid Effluent
Constituent AA-11 AA-21 ML FA
TKN 75.8 80.0 94.0 76.6
NH3-N 81.3 87.5 93.3 77.1
ON 69.3 72.5 94.5 76.0
TP 74.1 76.7 96.5 71.0
OP 77.8 68.9 97.8 73.8
TS 51.8 46.1 93.8 38.3
TVS 46.3 39.9 95.6 32.3
K - 78.7 93.2 -
n nK 29 - 10 6 19 7 27 -
Separated Solid Effluent
Constituent AA-11 AA-22 ML FA
TKN 16.8 16.0 1.2 24.1
NH3-N 14.5 13.8 0.7 20.2
ON 19.6 18.2 1.5 29.3
TP 20.1 24.3 1.2 23.9
OP 17.5 16.7 1.2 22.8
TS 46.5 49.6 3.9 70.5
TVS 52.5 55.7 4.7 76.9
K - 12.7 0.5 -
n nK 29 - 10 6 19 7 27 - 1Two different FAN separators were used by the farm.
The efficiencies in Table 17 indicate that all separators, regardless of farm specific affects on separator
performance, captured no more than 25 percent of the TKN and TP in the solid stream effluent. The FAN
separator at FA, as predicted based on the influent material being raw manure, had the highest TS capture
efficiency in the solid stream effluent with 70.5 percent. Farm ML had the lowest TS reclamation
efficiency at 3.9 percent; this may be explained by the low TS concentration in the separator influent,
comparatively higher TS consumed by the anaerobic digester, and the larger screen size used in the
separator, and may not reflect on the overall design, installation, or maintenance of the separator.
- 29 -

Manure Storage Sampling Results The long-term storages at AA and ML were sampled for all constituents. The long-term storages were
sampled vertically at 4’and 8’ below the manure surface and at the bottom (12’ for AA and 10’ for ML)
and horizontally at each end and the center of the storage. Data were averaged and are shown in Table 18.
Samples from the long-term storage were also obtained as the storage was being emptied at ML and are
included in the analysis.
Table 18. Average concentration of constituents in the long-term storage for AA and ML. Constituent Statistic AA ML
Ave 1.1 2.1 St. Dev. 0.2 0.3
CI 0.2 0.3 Log10 MAP (cfu/gram)
n 7 9 Ave 3.5 3.4
St. Dev. 0.8 0.3 CI 0.4 0.3
Log10 F. Coli. (mpn/gram)
n 27 10 Ave 30,680 14,779
St. Dev. 14,033 5,740 CI 5,293 3,248
DCOD (mg/l)
n 27 12 Ave 12,952 29,707
St. Dev. 6,713 9,786 CI 2,532 4,952
COD (mg/kg)
n 27 15 Ave 2,564 1,972
St. Dev. 614 366 CI 232 185
TKN (mg/kg)
n 27 15 Ave 1,552 1,031
St. Dev. 665 122 CI 251 62
NH3-N (mg/kg)
n 27 15 Ave 1,012 942
St. Dev. 595 280 CI 224 142
ON (mg/kg)
n 27 15 Ave 457 335
St. Dev. 190 93 CI 72 48
TP (mg/kg)
n 27 14 Ave 360 208
St. Dev. 156 61 CI 60 32
OP (mg/kg)
n 26 14 Ave - -
St. Dev. - - CI - -
K (mg/kg)
n - - Ave 2.84 2.83
St. Dev. 1.02 0.51 CI 0.38 0.26
TS (percent)
n 27 15 Ave 1.86 2.04
St. Dev. 0.79 0.41 CI 0.30 0.21
TVS (percent)
n 27 15 Ave 7.57 7.32
St. Dev. 0.10 0.07 CI 0.04 0.04
pH (Std. units)
n 27 15
- 30 -
Anaerobic Digester Biogas Production The total monthly metered biogas data shown in Table 19 were obtained from the farm log sheets and
monthly farm visits. Roots brand gas meters were used to meter biogas (see Tables 6 and 7); they were not
compensated for temperature or pressure. For every 1.0 inch of water (WC) above atmospheric at the gas
meter, the lower heating value (LHV), Btu per ft3 of biogas measured, will increase by approximately 0.25
percent. For every degree F increase in temperature above 32 F, the LHV, Btu per ft3 of biogas measured,
will decrease by 0.25 percent (Ludington, 2005).
For DDI, ML, and NH the total monthly metered biogas was not necessarily the total biogas produced for
the month; there were biogas streams that were not measured on these farms. All biogas produced at AA
was metered prior to use by the engine-generator set. DDI used biogas to fire a boiler and any excess
biogas was flared. FA burned all biogas generated in a biogas-fired boiler and excess heat was dispersed to
the ambient with a heat dump radiator-fan unit. ML used biogas to fire an engine-generator set, a biogas
boiler, occasionally a six million Btu biogas food dryer, and to boil maple sap for syrup production during
the spring season; excess biogas was flared. From January 2005 – May 2005 the table values for ML are
divided into two rows. The top row represents biogas used by the engine-generator set, and the bottom row
represents total metered biogas production for the month. NH used biogas to fire an engine-generator set
and the excess was flared. Blank cells in Table 19 represent times when meter readings were not available.
- 31 -

Table 19. Total monthly metered biogas (ft3) for all farms from January 2004 to May 2005. Month AA DDI FA MLA NH
January 2004 1,310,900 1,139,100 27,145 2,248,604 -
February 2004 1,361,700 1,115,700 14,948 2,083,013 -
March 2004 846,500 883,900 36,855 2,333,516 -
April 2004 1,455,100 937,800 37,999 2,309,184 1,623,683
May 2004 - 581,500 61,789 2,381,176 1,965,919
June 2004 - 710,700 26,573 2,521,927 1,592,215
July 2004 - 589,900 22,673 2,366,446 415,500
August 2004 856,600 577,600 54,922 2,504,337 1,437,838
September 2004 1,363,000 653,379 13,647 2,031,481 518,500
October 2004 1,264,100 1,132,400 19,400 2,756,856 1,898,735
November 2004 701,000 912,300 54,354 2,176,922 1,995,126
December 2004 884,400 1,242,700 52,010 2,416,991 1,196,800
2,303,292 January 2005 396,700 134,000 44,183
6,517,740 1,619,800
2,110,320 February 2005 - 134,050 26,256
6,384,959 1,546,200
2,160,402 March 2005 872,300 3,101 61,829
9,383,185 1,533,003
2,323,522 April 2005 1,029,800 350,000 63,696
8,605,361 1,714,197
2,443,672 May 2005 1,198,500 350,000 70,183
8,373,584 1,561,994
AJanuary 2005 – May 2005 are divided into two rows. The top row represents biogas used by the engine-generator set, and the bottom
row represents total metered biogas production for the month.
The average, range, and standard deviation for the data in Table 19 is shown in Table 20. ML produced the
greatest amount of biogas; increased biogas production is attributed to the addition of food waste to the
digester.
Table 20. Average, range, and standard deviation of total monthly metered biogas for all farms from January 2004 – May 2005.
Farm AA DDI FA ML NH Average 1,041,585 673,419 40,025 3,964,428 1,472,822
Range 396,700 1,455,100
3,101 1,242,700
13,647 70,183
2,031,481 9,383,185
415,500 1,995,126
Standard Deviation 313,727 386,110 18,792 2,676,995 475,334
No. Months 13 17 15 17 14
- 32 -

Biogas Volume: Measured vs. Calculated The amount of methane one gram of anaerobically digested COD will produce is 0.40 liters at a
temperature of 35C (Metcalf and Eddy, Inc., 2003). Minott (2002) developed a TS/VS predictive equation
that assumed one gram of anaerobically digested biologically degradable VS yielded 0.5 liter of methane.
These two prediction equations were used with project data for AA as follows. Biogas production was
predicted by converting the average manure volume in Table 2 from gallons to grams. The resulting mass
value was then multiplied by the influent and effluent concentration of COD and TVS respectively.
Accounting for the plug flow nature at AA, the difference of effluent and previous month’s influent mass
for both COD and TVS was used to predict methane production. Predicted methane production was then
divided by 0.6 (or multiplied by 1.4) to account for carbon dioxide content in biogas.
Predicted biogas production, based on COD and TS/VS, and measured biogas production for AA are shown
in Figure 7. The breaks in the measured production line are when the gas meter was malfunctioning. As
previously mentioned in the report, COD concentration varied greatly, and the plot of the predicted biogas
production reflects this accordingly. When the effluent COD concentration was greater than the influent
COD concentration the equation predicts negative gas production. When all the COD data was used in the
predictive equation, the lower limit of biogas production was 13,581 ft3/day, the mean was 35,334ft3/day,
and the upper limit was 57,087 ft3/day. When all the TVS data was used in the predictive equation, the
lower limit of biogas production was 41,695 ft3/day, the mean was 42,111 ft3/day, and the upper limit was
42,320 ft3/day. AA’s actual biogas production ranged from 30,000 - 60,000 ft3/day and averaged
43,731ft3/day.
The average daily biogas production for AA, and FA was divided by the average daily weight of VS
consumed by the digester to compare each digester’s efficiency in production of biogas. Biogas produced
per pound of volatile solids consumed was not calculated for DDI and, NH as the total biogas measured in
Table 19 was not necessarily total biogas produced. Biogas flow to the flare at DDI and NH was not
measured. Biogas produced per pound of volatile solids consumed was not calculated for ML as average
daily weight of VS consumed could not be reliably calculated with the data collected.
Table 21. Biogas produced per pound of volatile solids consumed (ft3/lb.) Farm AA FA
Average 16.2 15.3 Standard Deviation 7.6 8.1
No. Samples 23 12
- 33 -

B
T
a
t
s
s
2
Figure 7. Measured and calde
-20
0
20
40
60
80
100
12/25/2003 4/3/2004
Bio
gas
(1,0
00 F
t^3
/ day
)Measured productionVS destruction predictionCOD destruction prediction
iogas CO2 Content
he biogas carbon dioxide concen
nalyzer measured the concentrati
he farm or the researchers during
how that concentration of CO2 in
tarting in March 2005 were due to
005.
Ave = 43.8
culated biogas (based on predictiostroyed as predictor variables) for
7/12/2004 10/20/2004
Date
tration was measured using a Bacha
on of biogas CO2 in a range of 0 - 60
farm visits, and the recorded values
biogas range from 30 to 40 percent.
the unintended over heating of the
- 34 -
Ave = 38.7
Ave = 11.1
n equations with COD and VS AA.
1/28/2005 5/8/2005
rach, Inc. FYRITE gas analyzer. The
percent. The biogas was tested by
are shown in Table 22. The results
The readings at DDI over 40 percent
digester to 120°F in February of

Table 22. Average biogas CO2 content, percent. Month AA DDI FA ML NH
% CO2 38 34 32 30 40 January 2004 n 1 7 1 1 1
% CO2 38 34 32 30 37 February 2004 n 1 20 1 1 2
% CO2 38 34 33 30 40 March 2004 n 1 23 2 1 1
% CO2 38 33 33 - 40 April 2004 n 1 24 2 - 1
% CO2 38 32 32 26 - May 2004 n 1 20 2 1 -
% CO2 38 33 31 34 40 June 2004 n 1 19 1 3 14
% CO2 38 33 - 33 - July 2004 n 2 19 - 1 -
% CO2 36 33 31 31 - August 2004 n 1 12 2 2 -
% CO2 34 33 30 - 36 September 2004 n 1 18 2 - 1
% CO2 36 33 32 - - October 2004 n 1 1 1 - -
% CO2 34 33 - - 32 November 2004 n 1 14 - - 1
% CO2 36 33 34 33 38 December 2004 n 1 10 1 2 1
% CO2 38 33 - 34 - January 2005 n 1 6 - 1 -
% CO2 34 37 - - - February 2005 n 1 6 - - -
% CO2 36 45 30 33 38 March 2005 n 1 22 1 10 1
% CO2 40 50 32 31 - April 2005 n 1 7 1 1 -
% CO2 34 44 32 30 38 May 2005 n 1 13 1 11 1
The average CO2 concentration over the monitoring period was 34.5, 35.4, 31.8, 31.5, and 39 percent for
AA, DDI, FA, ML, and NH respectively. The methane (CH4) concentration was approximated by
subtracting the percent CO2 concentration from 100. Therefore, the estimated CH4 concentrations were
65.5, 64.6, 68.1, 68.5, and 61 percent respectively for AA, DDI, FA, ML, and NH. ML had the lowest
percentage of CO2 (highest calculated CH4 content) perhaps resulting from the mixing action and/or
addition of food waste to the raw manure prior to digestion.
- 35 -
Electrical Energy Generated On-Farm from Biogas
The estimated electrical energy generated, purchased, sold, displaced, and used by each farm is shown in
Tables 23a and 23b. Electricity production sold by DDI to Niagara Mohawk to date was 100 kWh; this is
not shown in the table. Displaced energy was the energy sold subtracted from the energy produced. Farm
utilization was calculated by adding the energy displaced and the energy purchased. For example, for AA
in January of 2004, the displaced energy was 26,251 kWh (31,851 kWh – 5,600 kWh) and the farm
utilization was 30,411 kWh (26,251 kWh + 4,160 kWh). Energy generated at AA, ML, and NH was
obtained every farm visit from the Watt-hour meter included as part of the engine-generator set control
panel instrumentation. Energy purchased and sold was obtained from the Niagara Mohawk or NYSEG
meter at AA, FA, and NH. Energy purchased by DDI was retrieved from the Niagara Mohawk energy
check website; the 15-minute interval power data was summed for every month. Energy purchased and
sold at ML was obtained from spreadsheet files containing 15-minute power data developed by Niagara
Mohawk and supplied by the farm. Blank table values represent times when data was unavailable.
- 36 -
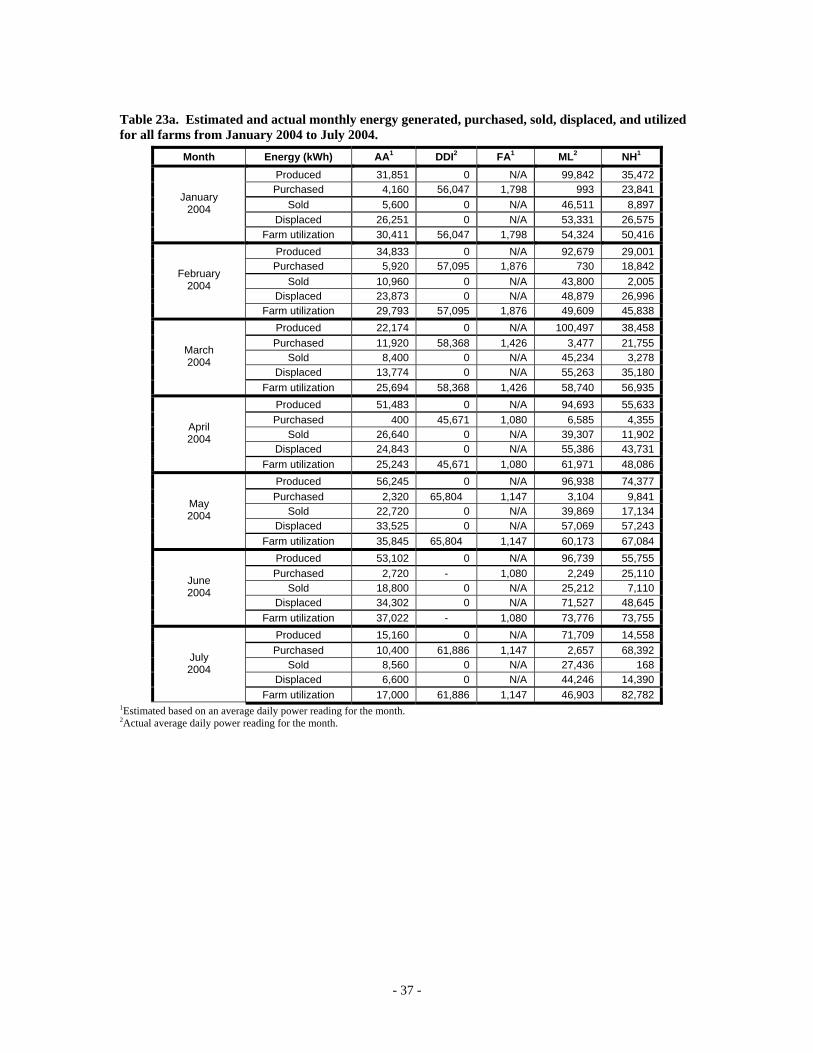
Table 23a. Estimated and actual monthly energy generated, purchased, sold, displaced, and utilized for all farms from January 2004 to July 2004.
Month Energy (kWh) AA1 DDI2 FA1 ML2 NH1
Produced 31,851 0 N/A 99,842 35,472Purchased 4,160 56,047 1,798 993 23,841
Sold 5,600 0 N/A 46,511 8,897Displaced 26,251 0 N/A 53,331 26,575
January 2004
Farm utilization 30,411 56,047 1,798 54,324 50,416Produced 34,833 0 N/A 92,679 29,001Purchased 5,920 57,095 1,876 730 18,842
Sold 10,960 0 N/A 43,800 2,005Displaced 23,873 0 N/A 48,879 26,996
February 2004
Farm utilization 29,793 57,095 1,876 49,609 45,838Produced 22,174 0 N/A 100,497 38,458Purchased 11,920 58,368 1,426 3,477 21,755
Sold 8,400 0 N/A 45,234 3,278Displaced 13,774 0 N/A 55,263 35,180
March 2004
Farm utilization 25,694 58,368 1,426 58,740 56,935Produced 51,483 0 N/A 94,693 55,633Purchased 400 45,671 1,080 6,585 4,355
Sold 26,640 0 N/A 39,307 11,902Displaced 24,843 0 N/A 55,386 43,731
April 2004
Farm utilization 25,243 45,671 1,080 61,971 48,086Produced 56,245 0 N/A 96,938 74,377Purchased 2,320 65,804 1,147 3,104 9,841
Sold 22,720 0 N/A 39,869 17,134Displaced 33,525 0 N/A 57,069 57,243
May 2004
Farm utilization 35,845 65,804 1,147 60,173 67,084Produced 53,102 0 N/A 96,739 55,755Purchased 2,720 - 1,080 2,249 25,110
Sold 18,800 0 N/A 25,212 7,110Displaced 34,302 0 N/A 71,527 48,645
June 2004
Farm utilization 37,022 - 1,080 73,776 73,755Produced 15,160 0 N/A 71,709 14,558Purchased 10,400 61,886 1,147 2,657 68,392
Sold 8,560 0 N/A 27,436 168Displaced 6,600 0 N/A 44,246 14,390
July 2004
Farm utilization 17,000 61,886 1,147 46,903 82,7821Estimated based on an average daily power reading for the month. 2Actual average daily power reading for the month.
- 37 -
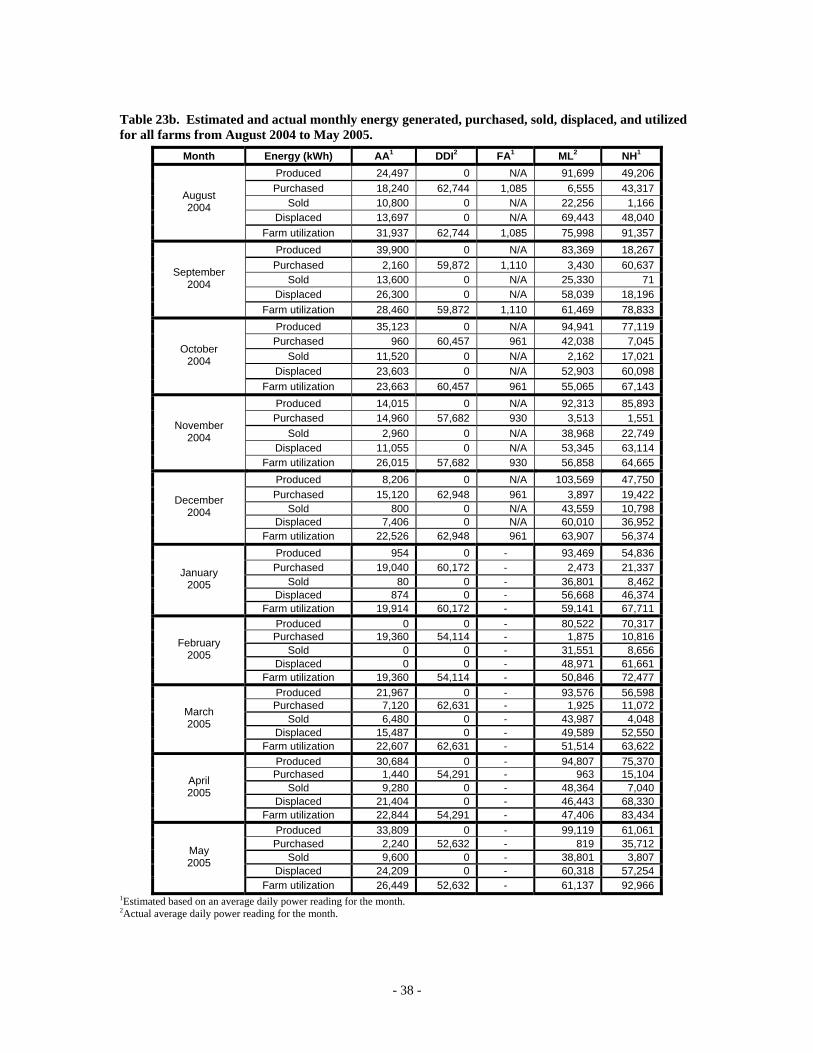
Table 23b. Estimated and actual monthly energy generated, purchased, sold, displaced, and utilized for all farms from August 2004 to May 2005.
Month Energy (kWh) AA1 DDI2 FA1 ML2 NH1
Produced 24,497 0 N/A 91,699 49,206Purchased 18,240 62,744 1,085 6,555 43,317
Sold 10,800 0 N/A 22,256 1,166Displaced 13,697 0 N/A 69,443 48,040
August 2004
Farm utilization 31,937 62,744 1,085 75,998 91,357Produced 39,900 0 N/A 83,369 18,267Purchased 2,160 59,872 1,110 3,430 60,637
Sold 13,600 0 N/A 25,330 71Displaced 26,300 0 N/A 58,039 18,196
September 2004
Farm utilization 28,460 59,872 1,110 61,469 78,833Produced 35,123 0 N/A 94,941 77,119Purchased 960 60,457 961 42,038 7,045
Sold 11,520 0 N/A 2,162 17,021Displaced 23,603 0 N/A 52,903 60,098
October 2004
Farm utilization 23,663 60,457 961 55,065 67,143Produced 14,015 0 N/A 92,313 85,893Purchased 14,960 57,682 930 3,513 1,551
Sold 2,960 0 N/A 38,968 22,749Displaced 11,055 0 N/A 53,345 63,114
November 2004
Farm utilization 26,015 57,682 930 56,858 64,665Produced 8,206 0 N/A 103,569 47,750Purchased 15,120 62,948 961 3,897 19,422
Sold 800 0 N/A 43,559 10,798Displaced 7,406 0 N/A 60,010 36,952
December 2004
Farm utilization 22,526 62,948 961 63,907 56,374Produced 954 0 - 93,469 54,836Purchased 19,040 60,172 - 2,473 21,337
Sold 80 0 - 36,801 8,462Displaced 874 0 - 56,668 46,374
January 2005
Farm utilization 19,914 60,172 - 59,141 67,711Produced 0 0 - 80,522 70,317Purchased 19,360 54,114 - 1,875 10,816
Sold 0 0 - 31,551 8,656Displaced 0 0 - 48,971 61,661
February 2005
Farm utilization 19,360 54,114 - 50,846 72,477Produced 21,967 0 - 93,576 56,598Purchased 7,120 62,631 - 1,925 11,072
Sold 6,480 0 - 43,987 4,048Displaced 15,487 0 - 49,589 52,550
March 2005
Farm utilization 22,607 62,631 - 51,514 63,622Produced 30,684 0 - 94,807 75,370Purchased 1,440 54,291 - 963 15,104
Sold 9,280 0 - 48,364 7,040Displaced 21,404 0 - 46,443 68,330
April 2005
Farm utilization 22,844 54,291 - 47,406 83,434Produced 33,809 0 - 99,119 61,061Purchased 2,240 52,632 - 819 35,712
Sold 9,600 0 - 38,801 3,807Displaced 24,209 0 - 60,318 57,254
May 2005
Farm utilization 26,449 52,632 - 61,137 92,9661Estimated based on an average daily power reading for the month. 2Actual average daily power reading for the month.
- 38 -
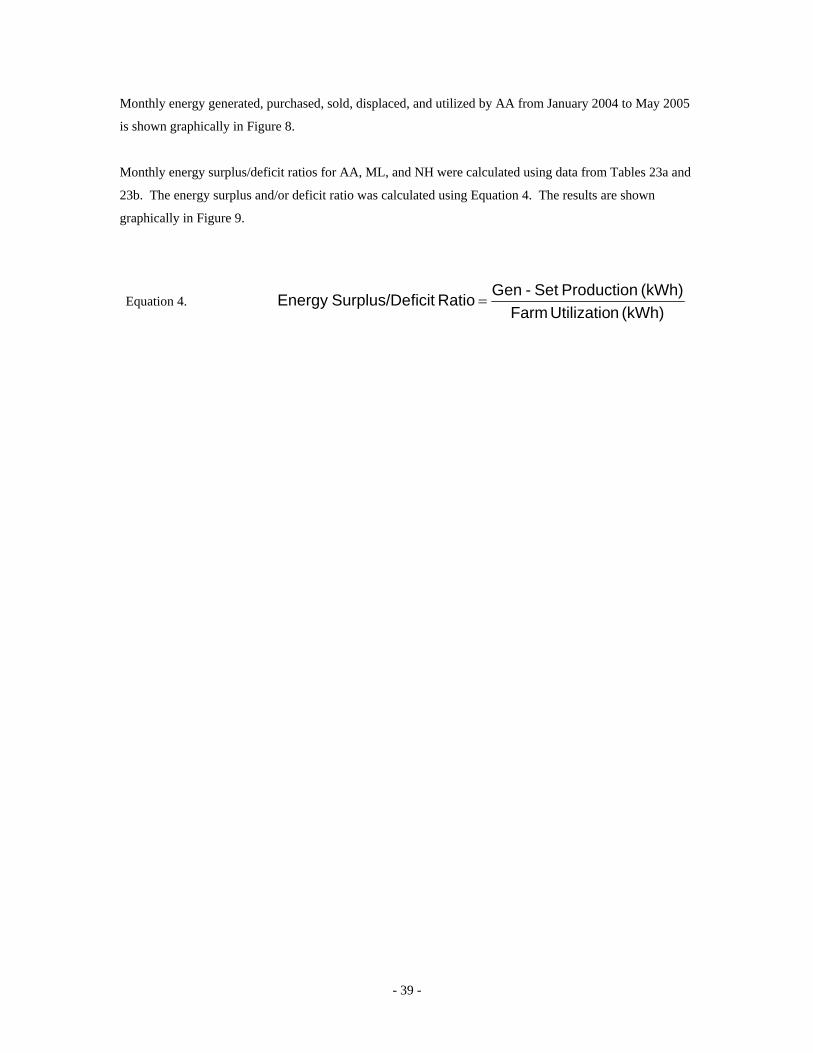
Monthly energy generated, purchased, sold, displaced, and utilized by AA from January 2004 to May 2005
is shown graphically in Figure 8.
Monthly energy surplus/deficit ratios for AA, ML, and NH were calculated using data from Tables 23a and
23b. The energy surplus and/or deficit ratio was calculated using Equation 4. The results are shown
graphically in Figure 9.
Equation 4. (kWh) nUtilizatio Farm
(kWh) Production Set-Gen Ratio ficitSurplus/DeEnergy =
- 39 -

0
10,000
20,000
30,000
40,000
50,000
60,000
Jan-
04
Feb-
04
Mar
-04
Apr
-04
May
-04
Jun-
04
Jul-0
4
Aug
-04
Sep-
04
Oct
-04
Nov
-04
Dec
-04
Jan-
05
Feb-
05
Mar
-05
Apr
-05
May
-05
kWh
Produced PurchasedSoldDisplacedFarm utilization
Figure 8. Monthly energy generated, purchased, sold and utilized for AA from January 2004 to May
2005.
0.0
0.5
1.0
1.5
2.0
2.5
Jan-
04
Feb-
04
Mar
-04
Apr
-04
May
-04
Jun-
04
Jul-0
4
Aug
-04
Sep-
04
Oct
-04
Nov
-04
Dec
-04
Jan-
05
Feb-
05
Mar
-05
Apr
-05
May
-05
Surp
lus
Rat
io
AA NH ML
Figure 9. Electrical energy surplus deficit ratios for AA, ML, and NH from January 2004 to May
2005.
- 40 -

If the energy surplus deficit ratio in Figure 9 is equal to one the farm produced as much electricity as it used
for the month. If the ratio is less than one the farm produced less energy than it used for the month, and if
the ratio is equal to zero the farm did not produce any energy for the month. If the ratio is equal to two the
farm produced twice as much electricity as it used.
Biogas production at ML was consistently greater than could be utilized by the farm’s engine-generator set.
Subsequently, large amounts of energy were lost by the farm to the atmosphere by flaring excess biogas.
The maximum electrical energy surplus ratios that could be developed for ML based on total measured
biogas production, engine-generator set efficiency, and engine down time is shown in Figure 10.
0
1
2
3
4
5
6
7
8
9
Jan-
05
Feb-
05
Mar
-05
Apr
-05
May
-05
Surp
lus
Rat
io
ML projected
Figure 10. Electrical energy surplus projected ratios for ML based on measured biogas production.
If ML had more engine-generators almost eight times more energy could be produced by the farm than was
required for farm use.
- 41 -

Capacity Factor
The monthly capacity factor for the engine-generator sets at AA, ML and NH was calculated using
Equation 5 and with input values from Tables 23a and 23b. The results are shown in Table 24.
Equation 5.
(kW) output powermax generatormonth in hours(kWh)monthly producedenergy electricalfactorCapacity
∗=
Table 24. Capacity factor for each month for AA, ML and NH.
AA ML NH
January 2004 0.329 0.925 0.367
February 2004 0.399 0.951 0.332
March 2004 0.229 0.932 0.398
April 2004 0.550 0.907 0.594
May 2004 0.582 0.899 0.769
June 2004 0.567 0.927 0.596
July 2004 0.157 0.665 0.151
August 2004 0.253 0.850 0.509
September 2004 0.426 0.799 0.195
October 2004 0.363 0.889 0.797
November 2004 0.150 0.884 0.918
December 2004 0.085 0.960 0.494
January 2005 0.010 0.866 0.567
February 2005 0.0 0.826 0.805
March 2005 0.227 0.867 0.585
April 2005 0.328 0.908 0.805
May 2005 0.350 0.919 0.631
A capacity factor that approaches unity is desired. Low monthly capacity factors at AA are the result of an
engine-generator sized for a digester processing manure from 1,000 cows, while the digester at AA only
processed manure from 550 cows. NH had low monthly capacity factors as a result of the engine controls
frequently shutting the engine down due to low biogas pressure. Higher capacity factors at ML may be a
result of the digester consistently producing more biogas than the engine required.
Capacity factor values shown in Table 24 are shown graphically in Figure 11.
- 42 -
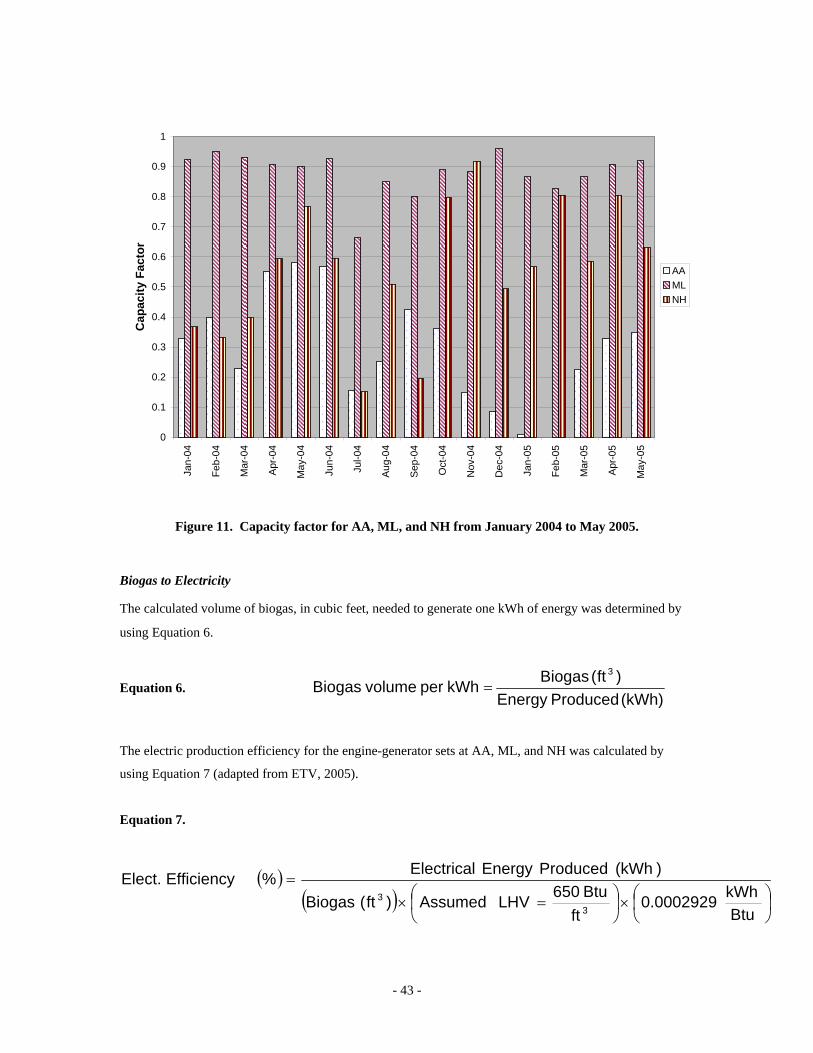
0
0.1
0.2
0.3
0.4
0.5
0.6
0.7
0.8
0.9
1
Jan-
04
Feb-
04
Mar
-04
Apr
-04
May
-04
Jun-
04
Jul-0
4
Aug
-04
Sep
-04
Oct
-04
Nov
-04
Dec
-04
Jan-
05
Feb-
05
Mar
-05
Apr
-05
May
-05
Cap
acity
Fac
tor
AAMLNH
Figure 11. Capacity factor for AA, ML, and NH from January 2004 to May 2005.
Biogas to Electricity
The calculated volume of biogas, in cubic feet, needed to generate one kWh of energy was determined by
using Equation 6.
Equation 6. (kWh)ProducedEnergy
)ft(BiogaskWh per volume Biogas3
=
The electric production efficiency for the engine-generator sets at AA, ML, and NH was calculated by
using Equation 7 (adapted from ETV, 2005).
Equation 7.
( )( ) ⎟
⎠⎞
⎜⎝⎛×⎟
⎠⎞
⎜⎝⎛ =×
=
BtukWh0.0002929
ftBtu650LHVAssumed)ft(Biogas
)(kWh ProducedEnergy Electrical%Efficiency Elect.
33
- 43 -
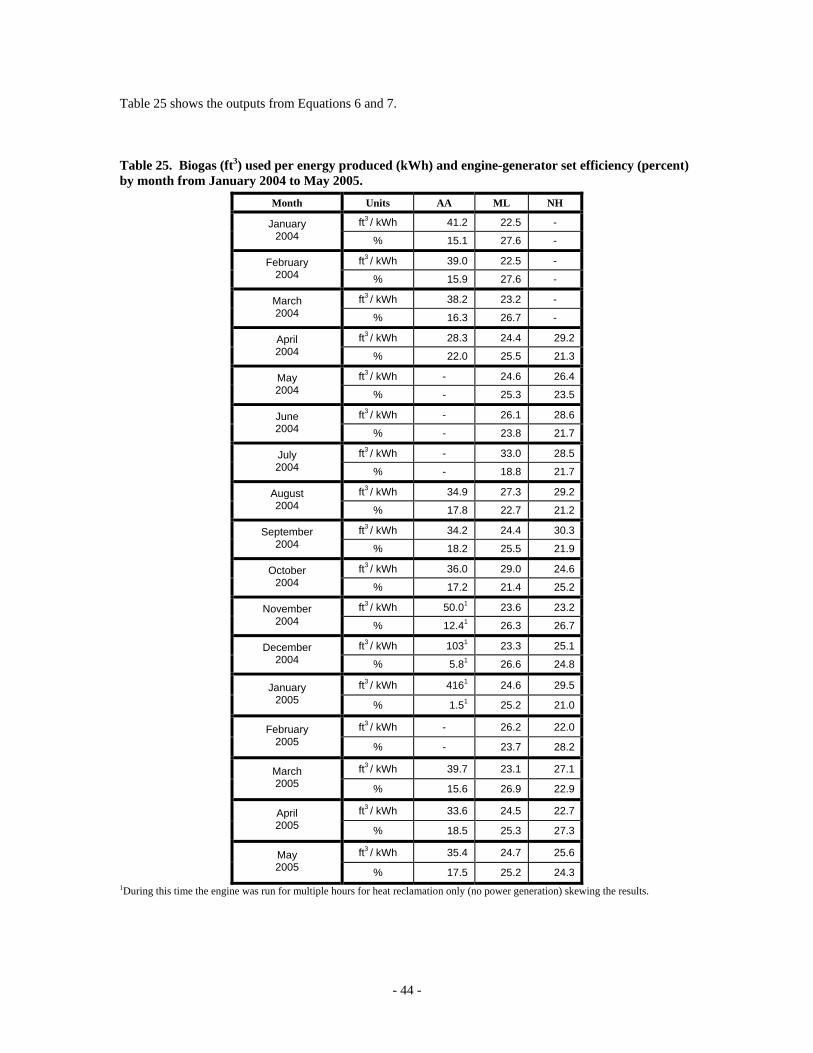
Table 25 shows the outputs from Equations 6 and 7.
Table 25. Biogas (ft3) used per energy produced (kWh) and engine-generator set efficiency (percent) by month from January 2004 to May 2005.
Month Units AA ML NH
ft3 / kWh 41.2 22.5 - January 2004 % 15.1 27.6 -
ft3 / kWh 39.0 22.5 - February 2004 % 15.9 27.6 -
ft3 / kWh 38.2 23.2 - March 2004 % 16.3 26.7 -
ft3 / kWh 28.3 24.4 29.2 April 2004 % 22.0 25.5 21.3
ft3 / kWh - 24.6 26.4 May 2004 % - 25.3 23.5
ft3 / kWh - 26.1 28.6 June 2004 % - 23.8 21.7
ft3 / kWh - 33.0 28.5 July 2004 % - 18.8 21.7
ft3 / kWh 34.9 27.3 29.2 August 2004 % 17.8 22.7 21.2
ft3 / kWh 34.2 24.4 30.3 September 2004 % 18.2 25.5 21.9
ft3 / kWh 36.0 29.0 24.6 October 2004
% 17.2 21.4 25.2
ft3 / kWh 50.01 23.6 23.2 November 2004 % 12.41 26.3 26.7
ft3 / kWh 1031 23.3 25.1 December 2004 % 5.81 26.6 24.8
ft3 / kWh 4161 24.6 29.5 January 2005 % 1.51 25.2 21.0
ft3 / kWh - 26.2 22.0 February 2005 % - 23.7 28.2
ft3 / kWh 39.7 23.1 27.1 March 2005 % 15.6 26.9 22.9
ft3 / kWh 33.6 24.5 22.7 April 2005 % 18.5 25.3 27.3
ft3 / kWh 35.4 24.7 25.6 May 2005 % 17.5 25.2 24.3
1During this time the engine was run for multiple hours for heat reclamation only (no power generation) skewing the results.
- 44 -

Average biogas volume (ft3) used per energy produced (kWh) were 36.1, 25.1, and 26.6 for AA, ML, and
NH respectively. Average engine-generator set electrical production efficiency over the data collection
period was 17.4, 24.9, and 23.7 for AA, ML, and NH respectively. Biogas volume (ft3) per kWh generated
is shown in Figure 12.
0
5
10
15
20
25
30
35
40
45
Apr
-04
May
-04
Jun-
04
Jul-0
4
Aug
-04
Sep-
04
Oct
-04
Nov
-04
Dec
-04
Jan-
05
Feb-
05
Mar
-05
Apr
-05
May
-05
Ft3 /
kWh
AA ML NH
Figure 12. Biogas volume (ft3) utilized at AA, ML, and NH for each kWh generated from April 2004
to May 2005.
The inverse of Equation 6, multiplied by 1,000 was used to calculate the values shown in Table 26.
Table 26. Energy (kWh) per cubic foot of biogas used, multiplied by 1,000. Month AA ML NH
January 2004 24.3 44.4 - February 2004 25.6 44.4 -
March 2004 26.2 43.1 - April 2004 35.3 41.0 34.2May 2004 - 40.7 37.9June 2004 - 38.3 35.0July 2004 - 30.3 35.1
August 2004 28.7 36.6 34.2September 2004 29.2 41.0 33.0
October 2004 27.8 34.5 40.7November 2004 20.0 42.4 43.1December 2004 1.0 42.9 39.8January 2005 0.2 40.7 33.9February 2005 - 38.2 45.5
March 2005 25.2 43.3 36.9April 2005 29.8 40.8 44.1May 2005 28.2 40.5 39.1
- 45 -

Digester Heating
The estimated average heat each digester used per month is shown in Table 27. Portable Btu meters were
used at AA, DDI, and NH to collect data. FA had permanent Btu meters installed previous to January
2004. ML had permanent flow meters and temperature sensors (to calculate Btu’s) installed after
November 2004. The design of the portable and permanent Btu meters and the design of the digester
heating systems precluded the placement of the meters immediately adjacent to the digesters. Therefore,
the Btu meters were located in the building that housed the digester heating system. For AA, ML, and NH
meter placement was in the engine-generator room while for FA and DDI meter placement was in the
boiler room. The meter placement resulted in data that included heat losses to the ground from the hot
water heating loop circulation lines between the heat source and the digesters, in addition to heat needed to
maintain the temperature of the digester. The monthly heating values for FA were lower than the other
digesters because of the comparatively small size of the FA digester. Technical difficulties prevented the
use of the portable Btu meters at ML previous to the installation of the permanent equipment installation in
November of 2004. All values for ML were obtained after November of 2004 from the Connected Energy
website. The project only purchased two portable meters; therefore, some of the missing data in the table is
due to a shortage of equipment. Other missing data is due to equipment malfunction.
- 46 -

Table 27. Estimated average daily heat (Btu’s) for each digester by month from January 2004 to May 2005.
Month AA DDI FA ML NH January
2004 - 8,797,164 346,687 - -
February 2004 - - 402,734 - 5,230,922
March 2004 - 10,510,108 377,233 - 7,935,071
April 2004 - - 379,931 - 5,620,650
May 2004 4,343,550 9,291,609 421,000 - -
June 2004 2,824,426 - 402,667 - 2,506,352
July 2004 - 10,340,241 306,667 - -
August 2004 3,072,456 - 342,364 - -
September 2004 - 11,655,611 113,900 - -
October 2004 - 9,051,238 384,370 - -
November 2004 - 14,022,398 534,300 10,315,000 -
December 2004 - - 552,387 13,055,000 12,306,600
January 2005 - - 561,387 11,893,000 -
February 2005 5,403,250 18,298,6791 534,429 10,724,000 -
March 2005 - - 537,032 11,035,000 8,394,192
April 2005 6,923,788 5,115,637 517,233 10,056,000 -
May 2005 - 6,053,634 532,871 9,193,000 11,447,568
1Digester was inadvertently heated to 120°F.
The estimated average daily heat (Btu’s) required per unit treatment volume (gallons) for each digester was
calculated by dividing Table 27 values by the treatment volume (gallons) shown in Table 4. The results are
shown in Table 28.
- 47 -

Table 28. Estimated average daily heat demand per treatment volume (Btu’s/gallon) for each digester from January 2004 to May 2005.
Month AA DDI FA ML NH January
2004 - 17.4 44.6 - -
February 2004 - - 51.8 - 8.2
March 2004 - 20.8 48.6 - 12.5
April 2004 - - 48.9 - 8.9
May 2004 10.6 18.4 54.2 - -
June 2004 6.9 - 51.8 - 3.9
July 2004 - 20.5 39.5 - -
August 2004 7.5 - 44.1 - -
September 2004 - 23.1 14.6 - -
October 2004 - 17.9 49.4 - -
November 2004 - 27.8 68.7 16.2 -
December 2004 - - 71.1 20.6 19.4
January 2005 - - 72.2 18.7 -
February 2005 13.2 36.3 68.7 16.9 -
March 2005 - - 69.1 17.4 13.2
April 2005 16.9 10.1 66.5 15.8
May 2005 - 12.0 68.5 14.5 18.0
Data shown in Table 28 are shown graphically in Figure 13.
- 48 -
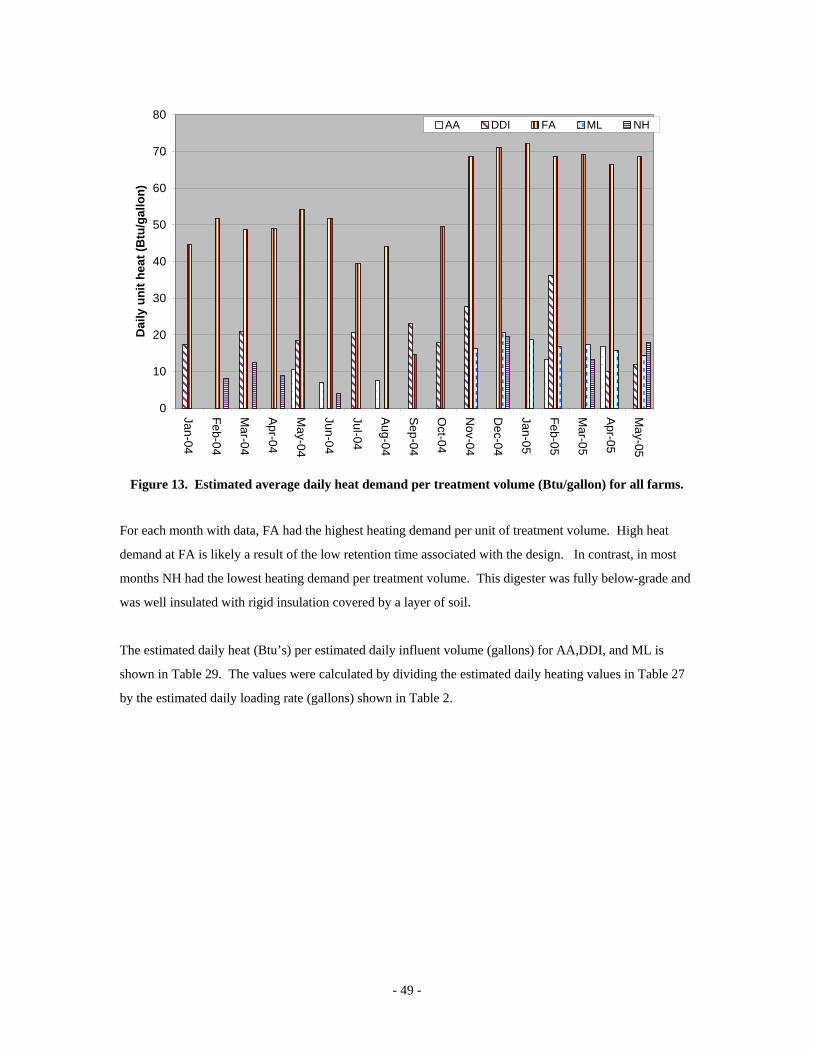
0
10
20
30
40
50
60
70
80
Jan-04
Feb-04
Mar-04
Apr-04
May-04
Jun-04
Jul-04
Aug-04
Sep-04
Oct-04
Nov-04
Dec-04
Jan-05
Feb-05
Mar-05
Apr-05
May-05
Dai
ly u
nit h
eat (
Btu
/gal
lon)
AA DDI FA ML NH
Figure 13. Estimated average daily heat demand per treatment volume (Btu/gallon) for all farms.
For each month with data, FA had the highest heating demand per unit of treatment volume. High heat
demand at FA is likely a result of the low retention time associated with the design. In contrast, in most
months NH had the lowest heating demand per treatment volume. This digester was fully below-grade and
was well insulated with rigid insulation covered by a layer of soil.
The estimated daily heat (Btu’s) per estimated daily influent volume (gallons) for AA,DDI, and ML is
shown in Table 29. The values were calculated by dividing the estimated daily heating values in Table 27
by the estimated daily loading rate (gallons) shown in Table 2.
- 49 -

Table 29. Estimated heat (Btu’s) per estimated daily influent volume (gallons) for AA, DDI, and FA from January 2004 to May 2005.
Month AA DDI FA January 2004 - 363 489 February 2004 - - - March 2004 - 420 440 April 2004 - - 424 May 2004 393 372 405 June 2004 255 - 341 July 2004 - 414 260
August 2004 278 - 290 September 2004 - 583 96
October 2004 - 377 333 November 2004 - 584 463 December 2004 - - 478 January 2005 - - 486 February 2005 489 696 463
March 2005 - - 465 April 2005 626 422 448 May 2005 - 404 461
Data in Table 29 is shown graphically in Figure 14.
0
100
200
300
400
500
600
700
Jan-04
Feb-04
Mar-04
Apr-04
May-04
Jun-04
Jul-04
Aug-04
Sep-04
Oct-04
Nov-04
Dec-04
Jan-05
Feb-05
Mar-05
Apr-05
May-05
Dai
ly In
fluen
t Hea
t (B
tu/g
al)
AA DDI FA
Figure 14. Estimated heat per daily influent volume (Btu’s/gal) for all AA, DDI, and FA.
- 50 -

Anaerobic Digester System Economics
A complete economic analysis is needed for anaerobic digester systems so a producer can make an
informed business decision regarding their use. Producers who make a capital investment in an anaerobic
digester need to understand the economics of the system. The capital, estimated operating costs, and
estimated total annual costs for the five farms are shown in Table 30. The available data for the capital
costs shown have not been adjusted to reflect the grant funds each farm received.
Table 30. Predicted net annual cost or benefit for the five digester systems (Wright et al., 2004).
Farm
AA DDI NH ML FA
Number of Cows 500 850 1,100 725 100
Capital Costs
Digester Set $192,000 $442,200 $339,400 $298,149 $80,183
Separator Set $50,000 $89,000 $61,000 $61,689 $44,013
Gas Utilization Equipment $61,000 $138,2004 $287,300 $130,431 $13,135
Total Capital Cost $303,000 $669,400 $687,700 $490,269 $137,331
Total Capital Cost Per Cow $606 $788 $625 $676 $1,373
Annual Projected Capital Cost $25,468 $52,978 $63,274 $49,016 $13,396
Annual Projected Capital Cost Per Cow $51 $62 $58 $68 $134
Total Predicted Annual Cost1 $37,540 $79,317 $103,960 $70,880 $21,497
Total Predicted Annual Cost Per Cow1 $75 $93 $95 $96 $215
Total Predicted Annual Revenues $56,445 $60,4003 $77,680 $287,685 $10,900
Total Predicted Annual Revenues Per Cow $113 $713 $71 $397 $109
Total Predicted Annual Cost or Benefit1, 2 $18,906 -$18,9172, 3 -$26,2802 $216,805 -$10,5972
Total Predicted Annual Benefit Per Cow1, 2 $38 -$222, 3 -$242 $299 -$1062
1 Does not include system electrical use. 2 Negative numbers mean the farm incurs a net loss from the digester system. 3 The electrical savings for DDI assumes the price of electricity is 10 cents/kW. This farm actually incurs a lower cost due to a
specific business initiative. Since this is not typical of most dairy farms, the higher price is used. 4 This cost assumes the microturbines were purchased new.
- 51 -

The values shown for the digester set include capital costs, as applicable by farm, such as site preparation,
digester structure and cover, influent/effluent, circulate, mixture, and feed pumps, biogas boilers, heat
exchangers, hot water tanks, and other auxiliary equipment. The separator set includes the capital cost of
the separator system, separator building, and interim storage. The gas utilization set includes the capital
costs, as applicable by farm, of microturbines, engine/generator sets, electrical switch gear, engine building,
biogas flare, coolant pumps, heat radiator, solids dryer, electrical engineer consulting fee, any initial
engine-generator set rebuild costs, and other gas utilization equipment.
Annual projected capital cost is calculated as the foregone interest, which is estimated to be five percent of
the average investment value of the capital plus the annual capital straight-line depreciation cost. When
calculating the annual capital straight-line depreciation, varying useful lives are used according to the
expected life of the piece of equipment in the system. The digesters, solid digester covers, buildings,
separators, boilers, heat exchangers, microturbines, variable speed drives, and piston pumps are estimated
to have a useful life of 20 years. The flexible digester covers, mixing, coolant, and circulating pumps,
flares, heat dump radiators, and new engine-generator sets are estimated to have a useful life of 10 years.
Engine-generator sets that were acquired used, or had to be rebuilt upon purchase, are estimated to have a
useful life of seven years. The pH and CO2 meters, centrifugal, effluent, separator, and food waste feed
pumps are estimated to have a useful life of five years. Also, certain components of the system are
projected to have a salvage value at the end of their useful life. The salvage value of such equipment is
calculated as 10 percent of the capital cost, or initial investment, for that particular component.
The total estimated annual cost for each digester system is the sum of the estimated annual capital cost and
the estimated annual operating costs for each component. Estimated annual operating costs were estimated
based on any annual repairs on the equipment and facilities plus the cost of management, labor, and
insurance, but do not include electrical cost to operate the system. Total estimated annual revenues were
calculated as an addition of heat savings, electricity savings (only for the non-parasitic power) and sales,
profits on solids, tipping fees, bedding, hot water, and composting. They do not include any odor control
benefits.
The capital and estimated annual cost and revenue calculations do not include any costs/revenues from
manure storage, spreading, or electrical cost to run the system. Manure storage costs, not shown here,
varied significantly from farm-to-farm depending on whether earth, concrete, or metal were used as
construction materials. The benefit of being able to use treated manure on cropland previously unavailable
for manure use (due to odor problems) was also not considered in this analysis.
- 52 -

Total capital costs vary because each digester is specifically designed for each farm. DDI had
microturbines, FA doesn’t generate electricity, and the three others used internal combustion engine-
generator sets. AA’s capital cost is less than its electricity-generating counterparts because it was built in
June of 1998.
The total annual cost or benefit calculation is considered to be the cost the farm pays for odor control when
the value is less than zero. ML had a comparatively high annual economic benefit because of the annual
tipping fee received. Total annual cost per cow is not correlated with the total number of cows, again
showing that site-specific systems have highly variable costs.
It is anticipated that some of the economic data will be used to calculate digester performance indices as
part of phase II of the project.
Digester Performance Indices
The following performance indices were developed as a proposed means to quantify the performance of
anaerobic digestion and gas utilization on dairy farms. Data needed for the calculations can be obtained
from a combination of Connect Energy monitoring, individual equipment monitoring, logs kept by the
farm, and laboratory analysis of biogas samples. Values for select indices are anticipated to be calculated
under phase II of the project.
General 1. Biogas Production Rating; Biogas produced (ft3 or Btu’s1) / Influent volume (ft3); measure of
efficiency of digester in converting biologically degradable solids to biogas. Note: on farms
where accurate total solid (TS) reduction or volatile fatty acids (VFA) reduction data is available,
this would be used in lieu of volume.
2. AD System Energy Production Efficiency; [System parasitic energy (kWh) + Supplemental
energy added (Btu’s)] / Heat value of utilized biogas produced (Btu’s1); measure of the overall
energy efficiency of the AD system.
3. Combined Heat and Power Efficiency; [Electrical power produced + Heat recovered] / Biogas
energy value.
4. Overall Parasitic Heat Rating; Total heat (Btu’s) / Influent volume (gal or ft3); influent heat
required per unit volume calculated on a daily, monthly, or yearly basis. Higher rating values will
occur for systems with cold or frozen manure, less insulation, and/or more exposure.
- 53 -
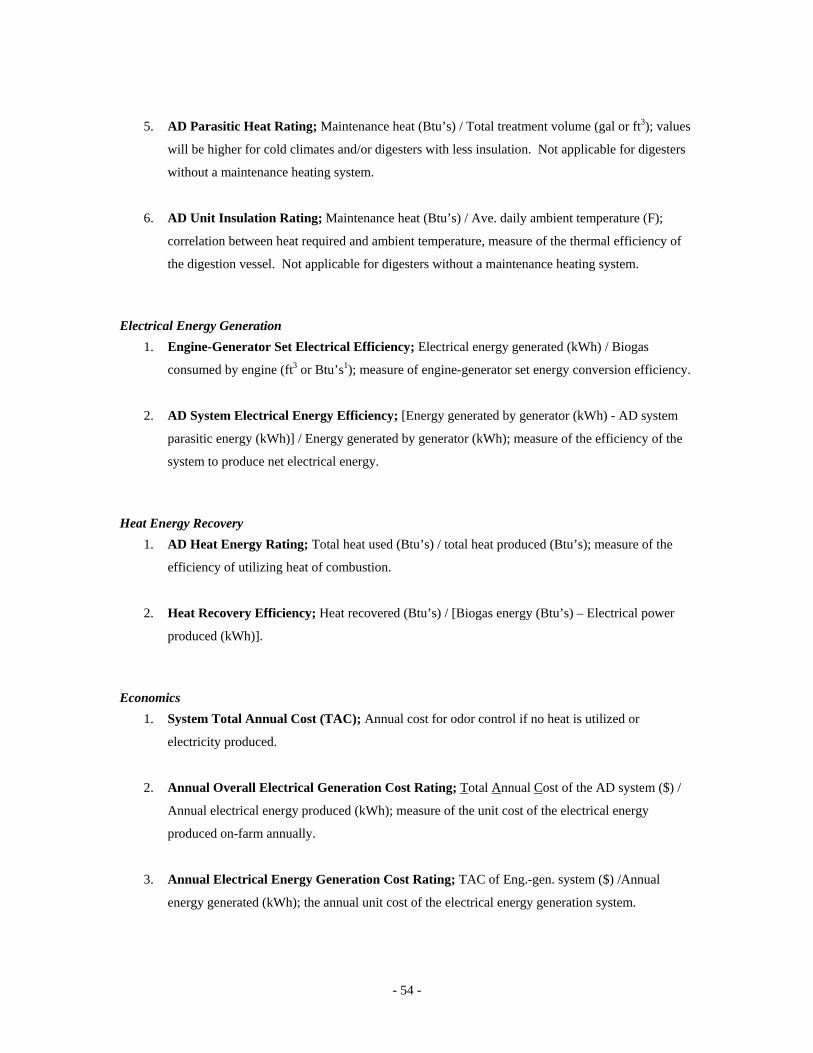
5. AD Parasitic Heat Rating; Maintenance heat (Btu’s) / Total treatment volume (gal or ft3); values
will be higher for cold climates and/or digesters with less insulation. Not applicable for digesters
without a maintenance heating system.
6. AD Unit Insulation Rating; Maintenance heat (Btu’s) / Ave. daily ambient temperature (F);
correlation between heat required and ambient temperature, measure of the thermal efficiency of
the digestion vessel. Not applicable for digesters without a maintenance heating system.
Electrical Energy Generation 1. Engine-Generator Set Electrical Efficiency; Electrical energy generated (kWh) / Biogas
consumed by engine (ft3 or Btu’s1); measure of engine-generator set energy conversion efficiency.
2. AD System Electrical Energy Efficiency; [Energy generated by generator (kWh) - AD system
parasitic energy (kWh)] / Energy generated by generator (kWh); measure of the efficiency of the
system to produce net electrical energy.
Heat Energy Recovery 1. AD Heat Energy Rating; Total heat used (Btu’s) / total heat produced (Btu’s); measure of the
efficiency of utilizing heat of combustion.
2. Heat Recovery Efficiency; Heat recovered (Btu’s) / [Biogas energy (Btu’s) – Electrical power
produced (kWh)].
Economics 1. System Total Annual Cost (TAC); Annual cost for odor control if no heat is utilized or
electricity produced.
2. Annual Overall Electrical Generation Cost Rating; Total Annual Cost of the AD system ($) /
Annual electrical energy produced (kWh); measure of the unit cost of the electrical energy
produced on-farm annually.
3. Annual Electrical Energy Generation Cost Rating; TAC of Eng.-gen. system ($) /Annual
energy generated (kWh); the annual unit cost of the electrical energy generation system.
- 54 -

4. Annual Heat Recovery Cost Rating; TAC of the heat recovery system ($) / Annual captured
heat (Btu’s); the annual unit cost to capture engine combustion heat.
5. Annual Heat Generation Cost Rating; TAC of boiler equipment ($) / Annual heat produced
(Btu’s); the annual unit cost of producing heat by biogas combustion in a boiler.
6. Annual System CHP Cost Rating; [Value of electrical energy produced + Value of Heat
Recovered] / TAC of system.
7. Annual Wasted Energy Rating; Heat or biogas dumped reported as an equivalent of heating oil
(or diesel, kerosene etc.)
1Energy content of biogas generated by the AD can be calculated by the product of the measured gas produced multiplied by 1) either
an assumed energy density of the gas or 2) using data developed based on gas sampling. Currently, no gas sampling is being
performed.
Future Work
Potential Optimization Strategies
The follow optimization strategies have been identified for consideration. Select optimization strategies
will tested on farms based on the appropriateness and interest by the farm owner.
1. Manure inputs
Loading rate; feed; bedding; water content
2. Add materials to digester influent
Micronutrients; specialty microbes; fats or other energy sources
3. Change mixing times and/or frequency for mixed digesters
4. Change digester temperature
5. Use a portion of digester effluent to inoculate digester influent
Odor Quantification Odor logs completed by the farm and/or ambient air sample analysis by a olfactory panel are two ways that
quantification of odor control as a result of the anaerobic digestion process may be implemented in future
project work.
Project Data
Raw data associated with this project is maintained on file at the Cornell Biological and Environmental
Engineering department and is available by written request.
- 55 -

Publications to Date Supported by Project Work
1. Anaerobic Digester at AA Dairy: Case Study. Available from:
http://www.manuremanagement.cornell.edu/Docs/AA%20Case%20Study%20draft%20(6-11-
04).htm
2. Anaerobic Digester at Dairy Development International: Case Study. Available from:
http://www.manuremanagement.cornell.edu/Docs/DDI%20Case%20Study%20draft%20(6-11-
04).htm
3. Fixed-Film Digester at Farber Farm: Case Study. Available from:
http://www.manuremanagement.cornell.edu/Docs/Farber%20Case%20Study%20draft%20(6-11-
04).htm
4. Anaerobic Digester at Matlink Dairy Farm: Case Study. Available from:
http://www.manuremanagement.cornell.edu/Docs/Matlink%20Case%20Study%20draft%20(6-11-
04).htm
5. Anaerobic Digester at Noblehurst Farms, Inc.: Case Study. Available from:
http://www.manuremanagement.cornell.edu/Docs/Noblehurst%20Case%20Study%20draft%20(6-
11-04).htm
6. Gooch, C.A, S.F. Inglis, and K.J. Czymmek. 2005. Mechanical Solid-Liquid Manure Separation:
Performance and Evaluation on Four New York State Dairy Farms – A Preliminary Report.
Presented at the 2005 ASAE Annual International Meeting. July 17-20, Paper No. 05-4104.
ASAE 2950 Niles Road, St. Joseph, MI 49085-9659
7. Gooch, C.A. and T. Mathews. 2005. Anaerobic Digestion at Matlink Dairy Farm. Proceedings
from Dairy Manure Management: Treatment, Handling, and Community Relations Conference.
Syracuse, NY March 15-17, 2005. Natural Resource Agricultural Engineering Service. NRAES-
176 B-16 Morrison Hall, Ithaca, New York 14853-5701
8. Inglis, S.F., C.A. Gooch, and K.J. Czymmek. 2005. Mechanical Solid-Liquid Manure Separation:
Application and Performance on Four Dairy Farms. Proceedings from Dairy Manure
Management: Treatment, Handling, and Community Relations. Syracuse, NY March 15-17, 2005.
- 56 -
Natural Resource Agricultural Engineering Service. NRAES-176 B-16 Morrison Hall, Ithaca,
New York 14853-5701
9. Gebremedhin, K.G., B. Wu, C.A. Gooch, and P.E. Wright. 2004. Simulation of Heat Transfer for
Maximum Biogas Production. Presented at the 2004 ASAE Annual International Meeting August
1-4, Paper No. 04-4165. ASAE 2950 Niles Road, St. Joseph, MI 49085-9659
10. Wright, P.E., S.F. Inglis, J. Ma, C.A. Gooch, B. Aldrich, and N. Scott. 2004. Preliminary
Comparison of Five Anaerobic Digestion Systems on Dairy Farms in New York State. Presented
at the 2004 ASAE Annual International Meeting August 1-4, Paper No. 04-4032. ASAE 2950
Niles Road, St. Joseph, MI 49085-9659
11. Martin, J.H., P.E. Wright, S.F. Inglis, and K.F. Roos. 2003. Evaluation of the Performance of a
550 Cow Plug-Flow Anaerobic Digester under Steady – State Conditions. Proceedings of the
Ninth International Symposium, Animal, Agricultural and Food Processing Wastes IX pp. 350 –
359, October 12 –15, 2003 Raleigh, North Carolina, ASAE 2950 Niles Road, St. Joseph, MI
49085-9659
12. Wright, P.E., S.F. Inglis, S.M. Stehman, and J. Bonhotal. 2003. Reduction of Selected Pathogens
in Anaerobic Digestion. Proceedings of the Ninth International Symposium, Animal, Agricultural
and Food Processing Wastes IX pp. 74 – 82, October 12 –15, 2003 Raleigh, North Carolina,
ASAE 2950 Niles Road, St. Joseph, MI 49085-9659
13. Wright, P.E. and S.F. Inglis. 2003. An Economic Comparison of Two Anaerobic Digestion
Systems on Dairy Farms. Presented at the 2003 ASAE Annual International Meeting July 27- 31,
Paper No. 03-4154. ASAE 2950 Niles Road, St. Joseph, MI 49085-9659
14. Inglis, S.F., P.E. Wright, and J. Ma. 2003. Complete Mix Mesophilic Anaerobic Digester in
Western N.Y. Proceedings from the Anaerobic Digester Technology Applications in Animal
Agriculture A National Summit. Raleigh, NC, June 2-4 2003. pp. 130-136.
15. Wright, P.E. and J. Ma. 2003. Case Study: Anaerobic Digestion of Dairy Manure and Food
Waste. Proceedings from the Agricultural Hydrology and Water Quality 2003 Spring Specialty
conference American Water Resources Association. May 12-14, 2003 Kansas City, Missouri
- 57 -
16. Wright, P.E. 2002. Don’t Let Pathogens Escape. Northeast Dairy Business Vol. 4, No. 4 P. O.
Box 299, 6437 Collamer Rd., East Syracuse, NY 13057
17. Wright, P.E. and S.F. Inglis. 2002. Dairies Search for Ways to Control Manure Odors. Northeast
Dairy Business Vol. 4, No. 4 P. O. Box 299, 6437 Collamer Rd., East Syracuse, NY 13057 April
2002
18. Wright, P.E. and S.F. Inglis. 2002. Comparing Odor Control Treatment Methods on North East
Dairy Farms. Northeast Dairy Producers Conference Proceedings March 13-15, 2002 Liverpool,
NY Department of Animal Science, Cornell University
19. Wright, P.E. and S.F. Inglis. 2001. Comparing Odor Control Treatment Methods on New York
Dairy Farms. Presented at the 2001 ASAE Annual International Meeting. July 30- August 1,
Paper No. 01-2235. ASAE 2950 Niles Road, St. Joseph, MI 49085-9659
20. Wright, P.E. 2001. Overview of Anaerobic Digestion Systems for Dairy Farms. Proceedings
from Dairy Manure Systems, Equipment and Technology. Rochester, NY. March 20-22, 2001.
Natural Resource Agricultural Engineering Service. NRAES-143 152 Riley-Robb Hall, Ithaca,
New York 14853-5701
- 58 -

References
Burns, R.T. and L.B. Moody. 2003. Development of a Standard Method for Testing Mechanical Manure Solids Separators. ASAE Paper No. 03-4131. St. Joseph, MI.: ASAE. Easton, V.J. and J. H. McColl. 2005. Statistics Glossary: Version 1.1. Available from http://www.cas.lancs.ac.uk/glossary_v1.1/confint.html 3/23/2005 ETV. 2005. Generic Verification Protocol: Distributed Generation and Combined Heat and Power Field Testing Protocol. Available from: http://www.sri-rtp.com/Protocols/DG-GVP_v1.0%20final.pdf Koelsch, R.K., E.F. Fabian, R.W. Guest, and J.K. Campbell. 1990. Anaerobic Digesters for Dairy Farms. Agricultural and Biological Engineering Extension Bulletin 458. Ithaca, NY 14853 Ludington, D.C. 2006. Treatment and Handling Manure on Dairy Farms to Protect the Environment. Final report for the Watershed Agricultural Council for the NYC Watersheds, Inc., Walton, New York. Ludington, D.C. 2005. Heating Value of Biogas. Available from http://www.dairyfarmenergy.com/DLtech.Publications/Heating_Value_of_Biogas.pdf Metcalf and Eddy, Inc. 2003. Wastewater Engineering Treatment and Reuse, 4th ed., Revised by G. Tchobanoglous, F. L. Burton, and H.D. Stencil. McGraw-Hill, New York, New York. Minott, S. J. 2002. Feasibility of Fuel Cells for Energy Conversion on the Dairy Farm. M.S. Thesis. Department of Biological and Environmental Engineering. Cornell University. Ithaca, NY. Available from http://www.cowpower.cornell.edu/project_docs/Stefans-masters-thesis.pdf Accessed 2/20/2007 Parsons, R.A. 1984. NRAES-20: On-Farm Biogas Production. Natural Resource, Agricultural and Engineering Service. Ithaca, NY. Stabel, J.R. 1997. An improved method for cultivation of Mycobacterium paratuberculosis from bovine fecal samples and comparison to three other methods. Journal of Veterinary Diagnostic Investigation. 9(4): 375-80. Whitlock, R.H., S.J. Wells, R.W. Sweeney, and J. van Tiem. 2000. ELISA and fecal culture for paratuberculosis (Johne's disease): sensitivity and specificity of each method. Veterinary Microbiology 77(3-4): 387-398. Wright, P.E., S.F. Inglis, J. Ma, C.A. Gooch, B. Aldrich, and N. Scott. 2004. Preliminary Comparison of Five Anaerobic Digestion Systems on Dairy Farms in New York State. Presented at the 2004 ASAE Annual International Meeting August 1-4, Paper No. 04-4032. ASAE 2950 Niles Road, St. Joseph, MI 49085-9659
- 59 -