Embed Size (px)
Citation preview

Quarterly Metrics Report No. 13 (September 30, 2017) Webinar | November 30, 2017
NY Green Bank
1Agenda
Performance Performance at a Glance – As of
September 30, 2017
Portfolio Update Transaction Status & Active Pipeline Transaction Status Comparison
(Year-on-Year) Active Pipeline - Technology,
Geography & End-Users Q3 2017 Investments Level Solar Update
Objectives, Milestones & Deliverables Overarching Goals, KPIs & Metrics FY 2017 – 18 Objectives Progress Against FY 2017 – 18
Objectives Progress Against FY 2017 – 18 Plan
Deliverables
Quarterly Metrics
Trends Pipeline of Investment Opportunities Investment Portfolio Estimated Lifetime GHG Reductions Revenues & Expenses (Quarterly) Revenues & Expenses (Cumulative)
What’s Coming Next?
Stay In Touch with NY Green Bank
Questions
Note: All data included in this quarterly update is current as of September 30, 2017, unless otherwise indicated

2
Performance

3Performance at a Glance – As of September 30, 2017
Q3 Metrics Report was filed November 14, 2017, pursuant to the Metrics, Reporting & Evaluation Plan v3.0 and is available at www.greenbank.ny.gov/Resources/Public-Filings.
NYGB achieves breakeven on a cumulative basis for the first time with Cumulative Revenues in excess of Cumulative Expenses. NYGB closed $31.5 million of new clean energy investments in
New York State. Stimulating New Clean
Energy Proposals in
the State
Proposals received for over $2.1 billion in
NYGB investment
since inception
Mobilizing Capital
NYGB’s investment
portfolio as a whole
represents expected
mobilization ratio on track at or above 3:1; over 10
years on track to meet or exceed 8:1
Revenue Growth
Maintaining Self-Sufficiency
$23.0 millionin cumulative
revenues generated
since inception,
including $5.2 million in Q3
2017. Cumulative Revenues in
excess of Cumulative Expenses
($20.8 million)
Contributing to CEF
Objectives, REV & the
CES
Estimated lifetime GHG reductions
between 5.5 and 7.4
million metric tons,
equivalent to removing 54,800 –
72,500 cars off the road for 22
years
Driving Material Clean Energy Investments Across NYS
Investments support clean
energy projects with total project
costs between $1.31 and
$1.59 billion, based on Overall
Investments to Date of $440.9
million
(1) “Active Pipeline” means, at any time and for any period, the sum (expressed in dollars) of the proposed NYGB investment amount in all NYGB active transactions in the Pipeline where, in relation to each transaction: (a) there is agreement in principle between the parties; (b) there is momentum in moving the transaction forward; (c) conditions to investment are expected to be met; and (d) NYGB is dynamically proceeding towards and through “greenlight” recommendation, IRC approval and transaction execution. Unlike other Metrics that are cumulative measures since NYGB Inception, “Active Pipeline” is a point in time measure. As momentum behind individual transactions fluctuates while advancing towards execution due to various factors, including many not under NYGB’s control, transactions may move in and out of the Active Pipeline at any given time.
Strong Active Pipeline (1)
Active Pipeline of transactions
moving towards
closing is $519.0 million

4
Portfolio Update

5Transaction Status & Active Pipeline
Since inception through September 30, 2017:
Over $2.1 billion of proposals received and evaluated by NYGB’s Scoring Committee
Over $1.9 billion of proposals passed Scoring Committee evaluation –representing potential investments that meet NYGB’s mandate and proposal evaluation criteria
Active Pipeline currently $519.0 million $924.0 million of proposals received
Greenlight Committee recommendation for advancement
$497.3 million of proposals vetted by the Investment & Risk Committee (IRC) and approved by NYSERDA’s President & CEO
$440.9 million of transactions closed -comprising Overall Investments to Date -mobilizing public and private investments to support in the range of $1.3 to $1.6 billionin Total Project Costs (Cumulative) for new clean energy deployment in the State
$0
$200
$400
$600
$800
$1,000
$1,200
$1,400
$1,600
$1,800
$2,000
$2,200
Proposal Submitted Scoring Committee -Passed
Greenlight Committee -Passed
Investment & RiskCommittee - Passed
Executed & Closed
Active Pipeline- $519.0 million
Transaction Status & Active Pipeline ($ million)
NYGB Analysis; DealCloud Data
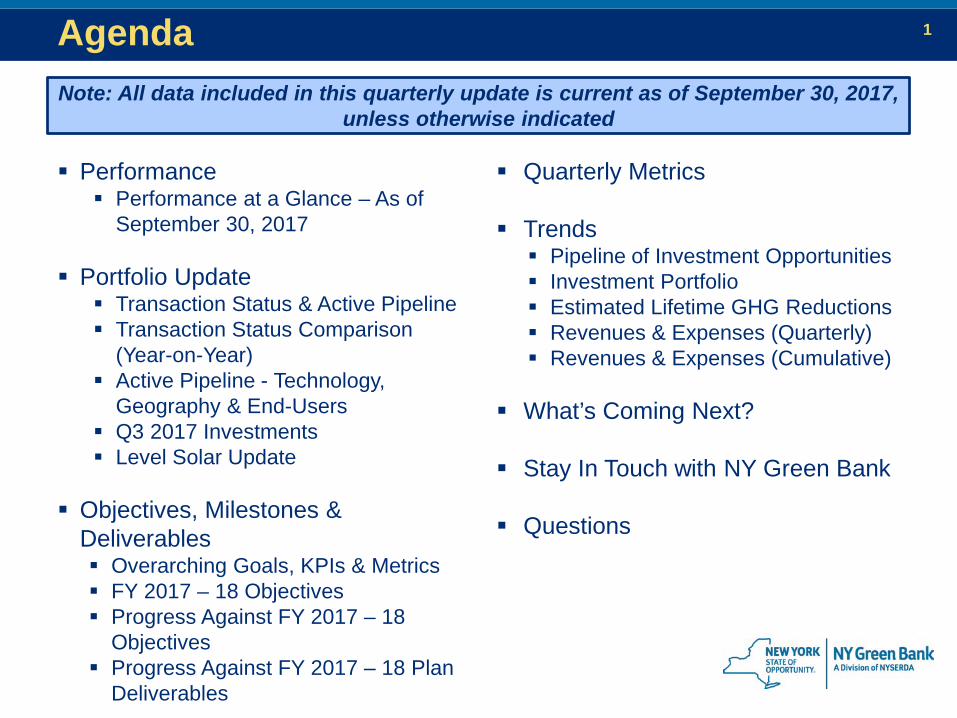
6Transaction Status Comparison (Year-on-Year)
Transaction Status & Active Pipeline ($ million)
NYGB Analysis; DealCloud Data
Comparing the last twelve months ending in September 30, 2017:
Additional $508.0 million of additional proposals received and evaluated by NYGB’s Scoring Committee
Additional $473.0 million of proposals passed Scoring Committee evaluation
Additional $348.0 million of proposals received Greenlight Committee recommendation for advancement
Additional $251.0 million of proposals vetted by the IRC and approved by NYSERDA’s President & CEO
Additional $242.0 million of transactions executed and closed
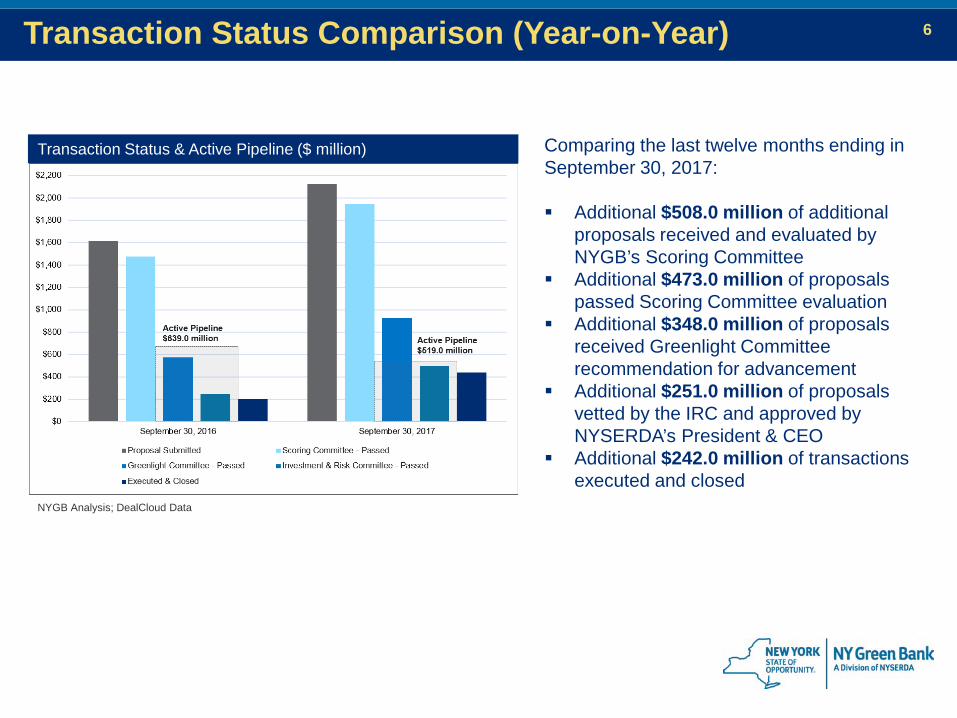
7Active Pipeline – Technology, Geography & End-UsersActive Pipeline by Technology
NYGB Analysis; DealCloud Data
Technology Distribution of Active Pipeline($519.0 million)
Energy Efficiency SolarWind BioenergySustainable Transportation OtherMultiple Technologies
Active Pipeline by End-Use Customer Segment
NYGB Analysis; DealCloud Data
End-Use Customer Segment Distribution of Active Pipeline($519.0 million)
MUSH/Government Utility-Scale/Grid Interconnected
Commercial Residential
Industrial Agricultural
Multple End-Users
NYGB Analysis; DealCloud Data
Active Pipeline by Geographic Distribution
Geographic Distribution of Active Pipeline($519.0 million)
Upstate Downstate Statewide

8
Cypress Creek Renewables LLC
Financing up to 72 Community DG solar projects in NYS
Support the deployment of as much as 168.0 MW of solar assets, reducing up to 2,610,000 metric tons of GHG emissions over a 25-year project life
$11.5 million to finance interconnection advance payments to NYS utilities
Plug Power Inc
Upsize of $20.0 million to support Plug Power’s deployment of fuel cell systems powering forklifts in distribution centers across NYS
Additional funding will finance up to 2,340 new systems for commercial customers
NYGB’s first investment in the fuel cell industry –now totaling $45.0 million
Q3 2017 InvestmentsIn Q3 2017, NYGB closed two new transactions, totaling a $31.5 million addition to Overall Investments To Date.(1)
(1) Details of all NYGB investments can be found in Transaction Profiles available at www.greenbank.ny.gov/Investments/Portfolio.Press releases can be accessed at www.greenbank.ny.gov/News-and-Media/In-The-News.

9Level Solar Update
(1) More details can be found on the SUNation website at www.SUNationsolarsystems.com/SUNation-level-solar-press-release.
Background
Level Solar Residential solar PV installer NYGB entered into a $25.0 million back-leveraged credit facility on September 30, 2015 Following the transaction, the company deployed an incremental 14.8 MW of clean solar
energy systems to over 2,000 NYS homeowners
Transaction Update
Level Solar closed its doors in September 2017, and NYGB worked closely with Level Solar’s shareholders to identify a third-party servicer to step in to service the residential solar PV systems
On October 16, 2017 SUNation Solar Systems announced that it will provide complete services for all Level Solar customers1
Under this arrangement, SUNation assumed responsibility for: Monitoring and servicing existing systems Managing billing without any changes to the current process Providing support of any questions or service issues.
SUNation reached out to all Level Solar Customers to ensure that this transition was carried out smoothly

10
Objectives, Milestones & Deliverables

11Overarching Goals, KPIs & Metrics
NYGB Goals Key Performance Indicators Metrics
Attract Capital to Clean Energy Capital Markets in NYS
Mobilizing capital Mobilization Ratio of Total Project Costs (Cumulative) to
NYGB investment Portfolio driving material clean
energy investments across NYS Total Project Costs (Cumulative) enabled by NYGB ($)
Growing portfolio Overall Investments to Date ($) Strong Active Pipeline Active Pipeline ($) Stimulating new clean energy
proposals in NYS Investment proposals received (cumulative) ($)
Be Self-Sufficient Revenue growth paving the way to self-sufficiency
Revenues (cumulative) ($) Expenses (cumulative) ($)
Deliver Energy & Environmental Impact Benefits
Contributing to CEF objectives and in turn REV & the CES (by supporting increased deployment of renewable energy, distributed energy & energy efficiency)
Estimated energy and environmental benefits: Lifetime energy saved by fuel type from energy
efficiency projects (MWh/MMBtu) and/or Lifetime clean energy generated (MWh);
First-Year energy saved by fuel type from energy efficiency projects (MWh/MMBtu) and/or estimated First-Year clean energy generated (MWh);
Lifetime and First-Year energy saved from CHP (MWh); Lifetime and First-Year energy savings from CHP
(MMBtu); Clean energy generation installed capacity (MW) from
CHP;

12Overarching Goals, KPIs & Metrics (cont.)
NYGB Goals Key Performance Indicators Metrics
Deliver Energy & Environmental Impact Benefits (cont.)
Contributing to CEF objectives and in turn REV & the CES (by supporting increased deployment of renewable energy, distributed energy & energy efficiency) (cont.)
Estimated energy and environmental benefits (cont.): Other clean energy generation installed capacity (MW);
and GHG emissions reductions (metric tons); and
Installed energy and environmental benefits: Energy saved by fuel type from energy efficiency
projects (MWh/MMBtu) and/or actual clean energy generated (MWh);
Primary energy saved from CHP (Btu); Clean energy generation installed capacity (MW), if
applicable; and GHG emissions reductions (metric tons).

13FY 2017 – 18 Objectives
NYGB’s Annual Review 2016 – 17 and Annual Business Plan 2017 – 18 defined three primary objectives:
Put Ratepayer Money to WorkCommit $550.0 million
(cumulative) to NYGB investments over the fiscal year ending March
31, 2018, with an average of $50.0 million in closed transactions per
quarter.
Mobilize CapitalMaintain an average, portfolio-wide
Mobilization Ratio of at least 3:1(the ratio of Total Project Costs (Cumulative) to NYGB Overall Investments to Date), driving towards a ratio of at least 8:1
across all NYGB investments by the end of the CEF term in 2025.
Maintain Self-SufficiencyContinue to grow revenues and
manage expenses to maintain self-sufficiency and generate net
income.
These primary objectives are being accomplished by discrete activities & deliverables:
Conduct Baseline Evaluations of
Investment PortfolioBaseline Evaluations of the Investment Portfolio
Growing Impact Benefits
Attract & Retain Required Staff
Continue Market & Stakeholder Outreach
Optimize Performance & Impact
Revenue & Expense Targets
Build & Maintain Active Pipeline
Cultivate Opportunities Related to New State
Programs and Initiatives
14
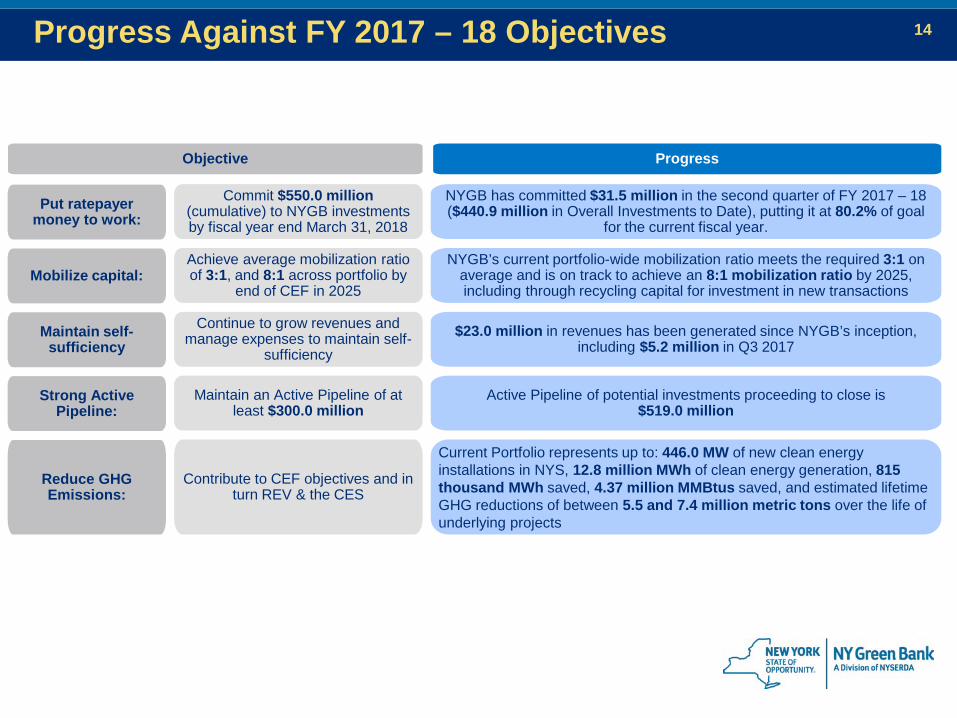
Objective
Commit $550.0 million(cumulative) to NYGB investments by fiscal year end March 31, 2018
Progress
NYGB has committed $31.5 million in the second quarter of FY 2017 – 18 ($440.9 million in Overall Investments to Date), putting it at 80.2% of goal
for the current fiscal year. Put ratepayer
money to work:
Achieve average mobilization ratio of 3:1, and 8:1 across portfolio by
end of CEF in 2025
NYGB’s current portfolio-wide mobilization ratio meets the required 3:1 onaverage and is on track to achieve an 8:1 mobilization ratio by 2025, including through recycling capital for investment in new transactions
Mobilize capital:
Continue to grow revenues and manage expenses to maintain self-
sufficiency$23.0 million in revenues has been generated since NYGB’s inception,
including $5.2 million in Q3 2017Maintain self-
sufficiency
Maintain an Active Pipeline of at least $300.0 million
Active Pipeline of potential investments proceeding to close is$519.0 million
Strong Active Pipeline:
Contribute to CEF objectives and in turn REV & the CES
Current Portfolio represents up to: 446.0 MW of new clean energy installations in NYS, 12.8 million MWh of clean energy generation, 815 thousand MWh saved, 4.37 million MMBtus saved, and estimated lifetime GHG reductions of between 5.5 and 7.4 million metric tons over the life of underlying projects
Reduce GHG Emissions:
Progress Against FY 2017 – 18 Objectives

15Progress Against FY 2017 – 18 Plan DeliverablesCategory Deliverable Status in Quarter Ending September 30, 2017
Strong Active Pipeline Active Pipeline Maintain an Active Pipeline of at least $300.0 million
on average throughout the year. Achieved for this Quarter: Active Pipeline of $519.0
million.
Streamline Investment Proposal Submission Process & Data Collection
Create an online portal for submission of Investment RFPs to NYGB with straight-through processing and data collection in NYGB’s CRM system to make management and reporting tools more efficient and effective.
Achieved for the Plan Year: In May 2017 NYGB launched the online portal for submission of investment proposals to NYGB pursuant to all current Investment RFPs.1
Portfolio Driving Material Clean Energy Investments Across NYS Committed Funds Commit $550.0 million (cumulative) to NYGB
investments, equating to an average of $50.0 million in closed transactions per quarter.
Achieved for this Quarter: $31.5 million of closed transactions in the quarter, such that current Plan Year 2017 - 18 commitment averaging $47.4 million per quarter.
Issue CDG RFP Publicly Issue RFP. Ongoing & On Track: Preparation of RFPs/RFIs has commenced.
Issue Interconnection Bridge Loan RFP
Publicly issue RFP.
Perform Initial Evaluation Activities
Engage with independent evaluators to conduct baseline assessments for both financial market transformation and energy and environmental impact of NYGB’s Investment Portfolio.
Ongoing & On Track: Baseline Evaluation Plan reviewed and accepted by DPS. Selection of third-party evaluators to occur in Q1 2018. Evaluation activities expected to be underway in early 2018.
Mobilizing Private Capital Mobilization Ratio Achieve an average, portfolio-wide Mobilization Ratio
of at least 3:1, driving towards a ratio of 8:1 across all NYGB investments by the end of the CEF term in 2025.
Achieved for this Quarter: Current quarter Mobilization Ratio on track at least 3:1 on average across NYGB’s portfolio.2
(1) The new online portal for submission of Investment RFPs to NYGB can be accessed by clicking the “Submit Proposal Online” button available at: www.greenbank.ny.gov/Work-with-Us/Propose-an-Investment. (2) Given the range of Total Project Costs that NYGB investments mobilize, the Mobilization Ratio also represents a range; currently of 3.0:1 to 3.6:1.

16
Quarterly Metrics

17Quarterly MetricsQuarterly Metrics are set out below, without footnotes. For complete Metrics and narrative, please see the full
Report filed on November 14, 2017 available at www.greenbank.ny.gov/Resources/Public-Filings
Quarterly Metric Prior Quarter Current QuarterCapital Position Authorized Capital ($) $1.0 billion $1.0 billion Authorized Administrative Expenses ($) $17.5 million $17.6 million Authorized Evaluation Expenses ($) $4.0 million $4.0 million
Operational Matters Cumulative Revenues ($) $17.8 million $23.0 million Cumulative Operating Expenses ($) $19.0 million $20.8 million Direct Operating Expenses ($) $10.8 million $12.0 million Allocated Expenses ($) $8.1 million $8.8 million Credit Facility (if in place) Credit Facility Amount ($) Not Applicable Not Applicable Credit Facility Drawn Amount ($) Not Applicable Not Applicable Credit Facility Fees & Interest (Cumulative) ($) Not Applicable Not Applicable
Investment Portfolio Committed Funds (Cumulative) ($) $76.7 million $71.4 million Deployed Funds (Cumulative) ($) $320.0 million $329.4 million Current Portfolio ($) $396.6 million $400.8 million Overall Investments to Date ($) $409.4 million $440.9 million Total Project Costs (Cumulative) ($) In the range of $1.2 - $1.4 billion In the range of $1.31 - $1.59 billion
Mobilization Ratio Tracking at least 3:1 on average across portfolio
Tracking at least 3:1 on average across portfolio
Portfolio Concentrations (%) 66.8% Renewable Energy 64.7% Renewable Energy12.3% Energy Efficiency 11.4% Energy Efficiency20.9% Other 24.0% Other
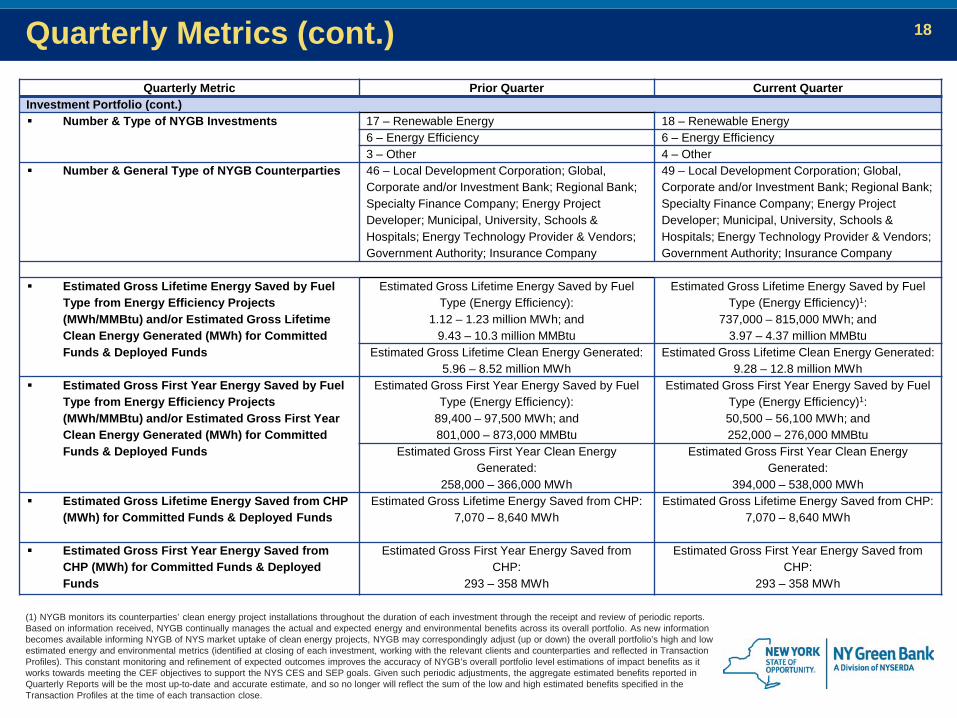
18Quarterly Metrics (cont.)Quarterly Metric Prior Quarter Current Quarter
Investment Portfolio (cont.) Number & Type of NYGB Investments 17 – Renewable Energy 18 – Renewable Energy
6 – Energy Efficiency 6 – Energy Efficiency3 – Other 4 – Other
Number & General Type of NYGB Counterparties 46 – Local Development Corporation; Global, Corporate and/or Investment Bank; Regional Bank; Specialty Finance Company; Energy Project Developer; Municipal, University, Schools & Hospitals; Energy Technology Provider & Vendors; Government Authority; Insurance Company
49 – Local Development Corporation; Global, Corporate and/or Investment Bank; Regional Bank; Specialty Finance Company; Energy Project Developer; Municipal, University, Schools & Hospitals; Energy Technology Provider & Vendors; Government Authority; Insurance Company
Estimated Gross Lifetime Energy Saved by Fuel Type from Energy Efficiency Projects (MWh/MMBtu) and/or Estimated Gross Lifetime Clean Energy Generated (MWh) for Committed Funds & Deployed Funds
Estimated Gross Lifetime Energy Saved by Fuel Type (Energy Efficiency):
1.12 – 1.23 million MWh; and9.43 – 10.3 million MMBtu
Estimated Gross Lifetime Energy Saved by Fuel Type (Energy Efficiency)1:
737,000 – 815,000 MWh; and3.97 – 4.37 million MMBtu
Estimated Gross Lifetime Clean Energy Generated:5.96 – 8.52 million MWh
Estimated Gross Lifetime Clean Energy Generated:9.28 – 12.8 million MWh
Estimated Gross First Year Energy Saved by Fuel Type from Energy Efficiency Projects (MWh/MMBtu) and/or Estimated Gross First Year Clean Energy Generated (MWh) for Committed Funds & Deployed Funds
Estimated Gross First Year Energy Saved by Fuel Type (Energy Efficiency):
89,400 – 97,500 MWh; and801,000 – 873,000 MMBtu
Estimated Gross First Year Energy Saved by Fuel Type (Energy Efficiency)1:50,500 – 56,100 MWh; and252,000 – 276,000 MMBtu
Estimated Gross First Year Clean Energy Generated:
258,000 – 366,000 MWh
Estimated Gross First Year Clean Energy Generated:
394,000 – 538,000 MWh Estimated Gross Lifetime Energy Saved from CHP
(MWh) for Committed Funds & Deployed FundsEstimated Gross Lifetime Energy Saved from CHP:
7,070 – 8,640 MWhEstimated Gross Lifetime Energy Saved from CHP:
7,070 – 8,640 MWh
Estimated Gross First Year Energy Saved from CHP (MWh) for Committed Funds & Deployed Funds
Estimated Gross First Year Energy Saved from CHP:
293 – 358 MWh
Estimated Gross First Year Energy Saved from CHP:
293 – 358 MWh
(1) NYGB monitors its counterparties’ clean energy project installations throughout the duration of each investment through the receipt and review of periodic reports. Based on information received, NYGB continually manages the actual and expected energy and environmental benefits across its overall portfolio. As new information becomes available informing NYGB of NYS market uptake of clean energy projects, NYGB may correspondingly adjust (up or down) the overall portfolio’s high and low estimated energy and environmental metrics (identified at closing of each investment, working with the relevant clients and counterparties and reflected in Transaction Profiles). This constant monitoring and refinement of expected outcomes improves the accuracy of NYGB’s overall portfolio level estimations of impact benefits as it works towards meeting the CEF objectives to support the NYS CES and SEP goals. Given such periodic adjustments, the aggregate estimated benefits reported in Quarterly Reports will be the most up-to-date and accurate estimate, and so no longer will reflect the sum of the low and high estimated benefits specified in the Transaction Profiles at the time of each transaction close.

19Quarterly Metrics (cont.)Quarterly Metric Prior Quarter Current Quarter
Investment Portfolio (cont.) Estimated Gross Lifetime Energy Savings from
CHP (MMBtu) for Committed Funds & Deployed Funds
Estimated Gross Lifetime Energy Savings from CHP:-(41,000 – 50,100) MMBtu
Estimated Gross Lifetime Energy Savings from CHP:
-(41,000 – 50,100) MMBtu Estimated Gross First Year Energy Savings from
CHP (MMBtu) for Committed Funds & Deployed Funds
Estimated Gross First Year Energy Savings from CHP:
-(1,700 – 2,070) MMBtu
Estimated Gross First Year Energy Savings from CHP:
-(1,700 – 2,070) MMBtu Estimated Gross Clean Energy Generation
Installed Capacity from CHP (MW), if applicable, for Committed Funds & Deployed Funds
1.6 MW 1.6 MW
Estimated Gross Clean Energy Generation Installed Capacity (MW), if applicable, for Committed Funds & Deployed Funds
220.0 – 300.0 MW 330.0 – 446.0 MW
Estimated Gross Lifetime GHG Emission Reductions (metric tons) for Committed Funds & Deployed Funds
4.32 – 5.77 million metric tons 5.53 – 7.44 million metric tons
Investment Pipeline Active Pipeline (In the Quarter) ($) $588.3 million $519.0 million
Investment Process Proposals Received – Value (Cumulative) ($) $2.1 billion $2.1 billion1
Approvals - Scoring Committee (Cumulative) ($) $1.9 billion $1.9 billion2
Approvals - Greenlight Committee (Cumulative) ($) $904.5 million $924.0 million
Approvals - IRC (Cumulative) ($) $445.8 million $497.3 million
(1) Proposals Received – Value (Cumulative) ($) increased to $2,122 million in Q3 2017, from $2,094 million in Q2 2017.(2) Approvals - Scoring Committee (Cumulative) ($) increased to $1,946 million in Q3 2017, from $1,917 million in Q2 2017.

20
Trends

21
$-
$500.0
$1,000.0
$1,500.0
$2,000.0
$2,500.0
Proposals Received - Value (Cumulative) ($) Approvals - Scoring Committee (Cumulative) ($)
Approvals - Greenlight Committee (Cumulative) ($) Approvals - IRC (Cumulative) ($)
Pipeline of Investment Opportunities
NYGB Pipeline of Proposals & Approvals ($ million)
NYGB Pipeline continues to show healthy trends in each category
In evolving Metrics, Pipeline of Investment
Opportunities not reported until 2015
NYGB Analysis; DealCloud Data

22Investment Portfolio
NYGB Current Portfolio vs. Deployed Funds ($ million)
NYGB Analysis; SS&C Data
$400.8
$329.4
$-
$50.0
$100.0
$150.0
$200.0
$250.0
$300.0
$350.0
$400.0
$450.0
Current Portfolio ($) Deployed Funds (Cumulative) ($)
Not all funds that NYGB commits are intended to be deployed immediately, or in some cases, at all
Capital is often drawn over time, pursuant to conditions precedent contained in investment
agreements
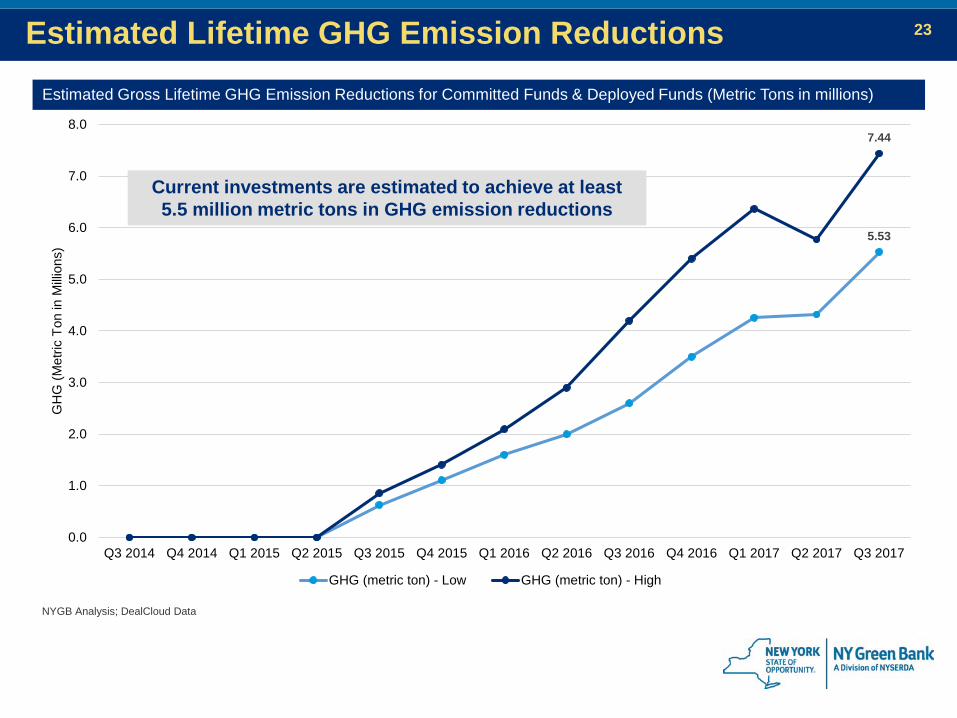
23Estimated Lifetime GHG Emission Reductions
Estimated Gross Lifetime GHG Emission Reductions for Committed Funds & Deployed Funds (Metric Tons in millions)
NYGB Analysis; DealCloud Data
5.53
7.44
0.0
1.0
2.0
3.0
4.0
5.0
6.0
7.0
8.0
Q3 2014 Q4 2014 Q1 2015 Q2 2015 Q3 2015 Q4 2015 Q1 2016 Q2 2016 Q3 2016 Q4 2016 Q1 2017 Q2 2017 Q3 2017
GH
G (M
etric
Ton
in M
illion
s)
GHG (metric ton) - Low GHG (metric ton) - High
Current investments are estimated to achieve at least 5.5 million metric tons in GHG emission reductions

24Revenues & Expenses (Quarterly)
Quarterly Revenues vs. Expenses ($ million)
Expenses not reported until December 2014
Revenues not reported until June 2015
NYGB Analysis; SS&C Data
$5.2
$1.8
$-
$1.0
$2.0
$3.0
$4.0
$5.0
$6.0
Quarterly Revenues ($) Quarterly Operating Expenses ($)
NYGB quarterly revenues increased to $5.2 million in Q3 2017, while limiting growth in expenses
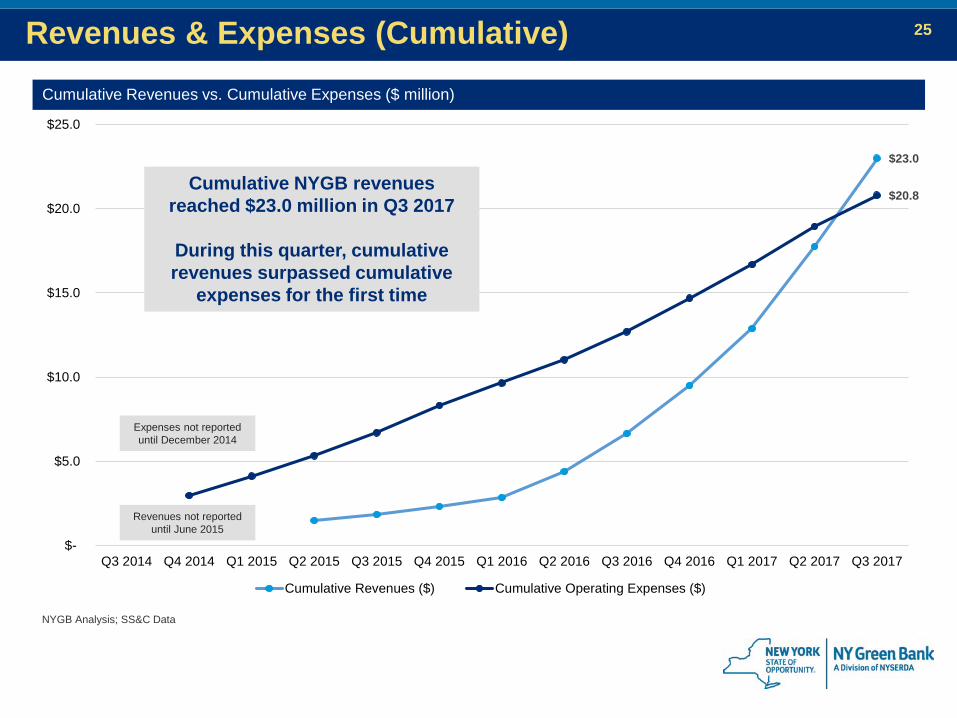
25Revenues & Expenses (Cumulative)
Cumulative Revenues vs. Cumulative Expenses ($ million)
Expenses not reported until December 2014
Revenues not reported until June 2015
NYGB Analysis; SS&C Data
$23.0
$20.8
$-
$5.0
$10.0
$15.0
$20.0
$25.0
Q3 2014 Q4 2014 Q1 2015 Q2 2015 Q3 2015 Q4 2015 Q1 2016 Q2 2016 Q3 2016 Q4 2016 Q1 2017 Q2 2017 Q3 2017
Cumulative Revenues ($) Cumulative Operating Expenses ($)
Cumulative NYGB revenues reached $23.0 million in Q3 2017
During this quarter, cumulative revenues surpassed cumulative
expenses for the first time

26
What’s Coming Next?
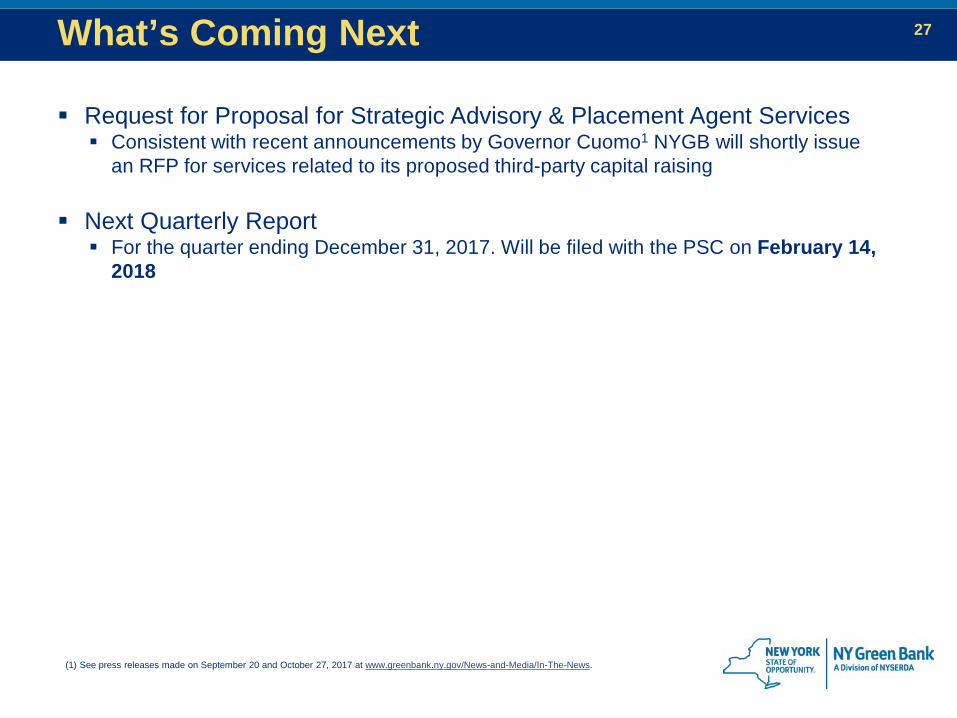
27What’s Coming Next
Request for Proposal for Strategic Advisory & Placement Agent Services Consistent with recent announcements by Governor Cuomo1 NYGB will shortly issue
an RFP for services related to its proposed third-party capital raising
Next Quarterly Report For the quarter ending December 31, 2017. Will be filed with the PSC on February 14,
2018
(1) See press releases made on September 20 and October 27, 2017 at www.greenbank.ny.gov/News-and-Media/In-The-News.

28
Stay In Touch with NY Green Bank

29Stay In Touch with NY Green Bank
All information available on the website: www.greenbank.ny.gov

30Stay In Touch with NY Green Bank (cont.)
Contact us at any time Sign up for our mailing list for periodic updates
Follow us on social media:
NY Green Bank #nygreenbank
1359 Broadway19th Floor
New York, NY 10018
T: (212) 379-6260E: [email protected]
www.greenbank.ny.gov
31
Questions

New York, NY
NY Green Bank Expansion: US Climate Alliance & Third-Party Capital RaiseQuarterly Report Review WebinarNovember 30, 2017

Expansion Plans Formally Initiated by Governor Andrew M. Cuomo
33
“Building on the success of its $400 million in commitments across 21 projects and robust pipeline of deals, NY Green Bank is today committing to work with the private sector to raise new funds, assist other states in the establishment of new Green Bank offices, and provide capacity for those Green Banks for back-end services including due diligence, underwriting and general technical support.”
Governor Andrew M. Cuomo, September 20, 2017
“These additional funds to be raised from third-party investors will enable NY Green Bank to deliver even greater environmental and cost benefits to New Yorkers and broaden the scope of investable projects beyond the boundaries of New York State.”
Governor Andrew M. Cuomo, October 27, 2017

United States Climate Alliance
34
U.S. Climate Alliance Members represent:
More than 36% of the population of the United States
At least $7 trillion in GDP
1.3 million clean energy jobs
Launched by Governors Andrew Cuomo, Jay Inslee and Jerry Brown
U.S. Climate Alliance is a bi-partisan coalition of States committed to reducing GHGs consistent with the Paris Agreement goals

Climate Alliance States are collectively on track to reduce GHG emissions 24% - 29% below 2005 levels by 2025
Between 2005 and 2015, Climate Alliance States reduced GHG emissions by15%
During the same decade, combined economic output of Climate Alliance States grewby 14%
United States Climate Alliance (cont.)
35

Expected Benefits:
Greater leverage of public dollars in sustainable infrastructure financing will directly and indirectly further support NY State’s ambitious clean energy goals
Additional capital and investments across the US will accelerate greater scale, diversification, and standardization of clean energy projects, exerting downward pressure on costs, including for clean, resilient and affordable solutions in New York
What this means for NYGB:
Leverage NYGB’s expertise in origination, credit underwriting, execution, operations, risk management and asset management
Continue to execute on current mandate, including utilizing the eligible technologies under the Clean Energy Fund
Bottom Line:
Process of information gathering and evaluation is just beginning Any path that NYGB considers must involve benefit to New Yorkers as well as maintain focus on
delivering the benefits of clean energy to New York ratepayers as effectively as possible
Proposed Expansion Plans
36
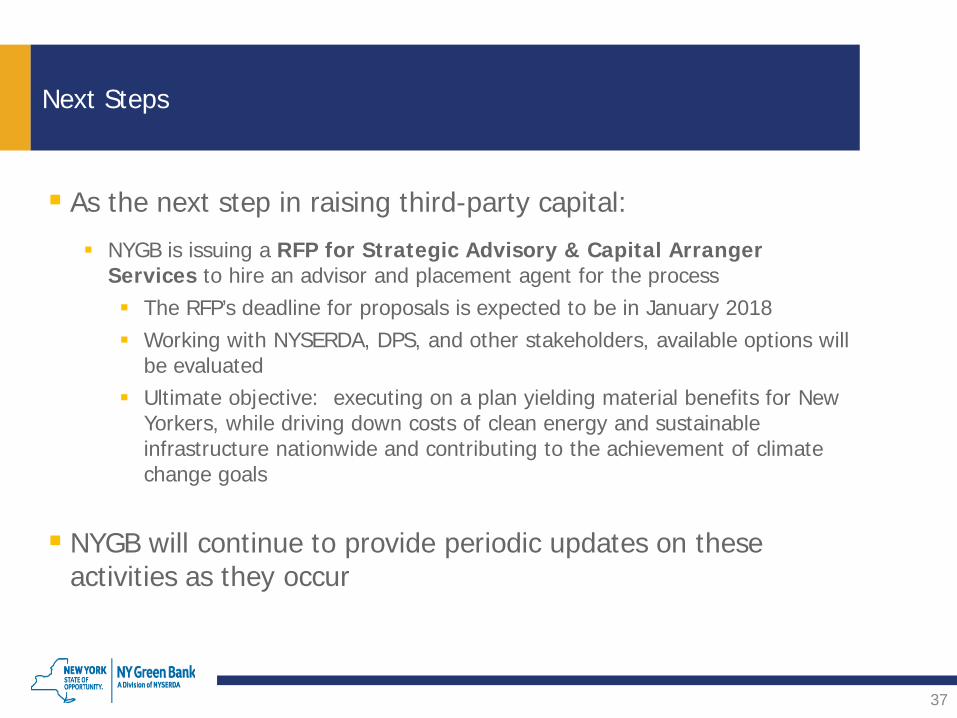
As the next step in raising third-party capital:
NYGB is issuing a RFP for Strategic Advisory & Capital Arranger Services to hire an advisor and placement agent for the process The RFP’s deadline for proposals is expected to be in January 2018 Working with NYSERDA, DPS, and other stakeholders, available options will
be evaluated Ultimate objective: executing on a plan yielding material benefits for New
Yorkers, while driving down costs of clean energy and sustainable infrastructure nationwide and contributing to the achievement of climate change goals
NYGB will continue to provide periodic updates on these activities as they occur
Next Steps
37