Embed Size (px)
Citation preview
Nutrition, Anemia, and Micronutrients │ 123
NUTRITIONAL STATUS, PREVALENCE OF ANEMIA, AND MICRONUTRIENT SUPPLEMENTATION 10 This chapter focuses on infant feeding practices, and the nutritional and micronutrient status of women and children. Infant feeding practices, including breastfeeding, complementary feeding patterns, and the prevalence of bottle-feeding are presented first. Anthropometric data (height and weight) col-lected in the survey are used to assess the current nutritional status of children under age five as well as that of their mothers. The chapter considers information collected on the prevalence of anemia in chil-dren under five and in women 15-49 years. Other important nutritional issues, including consumption of foods rich in vitamin A among children and iron supplementation among pregnant women, are also dis-cussed. 10.1 BREASTFEEDING AND SUPPLEMENTATION Breastfeeding and complementary feeding behaviors are important predictors of infant and child nutrition, health and survival. Poor nutritional status has been shown to increase the risk of illness and death among children. Breastfeeding practices also have an effect on the mother’s fertility. A well-documented effect of exclusive breastfeeding of sufficient intensity and duration is delayed return to ovu-lation, resulting in longer birth intervals and lower fertility, which is strongly related to infant and child survival. Initiation of Breastfeeding Breast milk excels as the most desirable source of nutrients for infants. Breastfeeding provides a complete source of nutrition for the first six months of life, half of all requirements in the second six months of life and one-third of requirements in the second year of life. The attributes of breast milk go beyond its nutrient content, as it offers the infant unsurpassed protection against infection. Colostrum, a premilk substance containing antibodies and white cells from the mother’s blood, is produced during the first 2-3 days of lactation. Colostrum contains maternal immune factors and helps protect the newborn infant from infections. There is evidence that links having been breastfed as a child with stronger intel-lectual development and a reduced risk of cancer, obesity and several chronic diseases. The early initia-tion of breastfeeding is also beneficial for the mother since it stimulates breast milk production and causes the uterus to retract, which reduces postpartum blood loss. Furthermore, women who breastfeed have a reduced risk of ovarian cancer and premenopausal breast cancer (ACC/SCN, 2000). Table 10.1 shows that breastfeeding is common in Jordan. Among children born in the five years preceding the survey, 94 percent were breastfed – a figure similar to the one reported in the 1997 JPFHS. There are small or negligible differences in the percentage of infants ever breastfed by sex, residence, re-gion and mother’s education. There is a small variation in the ever breastfed infants with respect to place of delivery: children who were delivered at home are more likely to have been breastfed than those who were delivered in a health facility (98 percent and 94 percent, respectively). Among Jordanian children who were breastfed, Table 10.1 shows that 40 percent begin breast-feeding within an hour after delivery, and more than three-fourths (79 percent) of infants were breastfed within the first day. The Central region shows a lower percentage of infants breastfeeding within an hour after delivery and within one day of birth compared with the North and South regions. Delivery at home is associated with higher proportion (60 percent) of infants for whom breastfeeding was initiated within

124 │ Nutrition, Anemia, and Micronutrients
an hour of birth compared with children who were delivered in a health facility (39 percent). Breastfeed-ing was initiated within a day after delivery for 93 percent of children who were delivered at home com-pared with 79 percent deliveries in a health facility. Despite the high proportion of ever-breastfed chil-dren, lower levels of early initiation of breastfeeding may be reflective of cultural practices regarding breastfeeding. Prelacteal feeding is the practice of giving other liquids to a child during the period after birth before the mother’s milk is flowing freely. According to Table 10.1, a total of 61 percent received a prelacteal feed. The proportion of infants receiving a prelacteal feed is slightly higher in the Central re-gion (62 percent) compared with the North and South regions (59 and 57 percent, respectively). Also, the proportion receiving a prelacteal feed is higher in infants born to mothers with elementary (64 percent) and higher education (63 percent) compared with infants born to mothers with no education (56 percent). The World Health Organization and UNICEF recommendation is that mothers and their new ba-bies initiate breastfeeding within the first hour of life, and that prelacteal feeds, which interfere with the breastfeeding relationship and may introduce pathogens into the infant’s system, are to be discouraged.
Table 10.1 Initial breastfeeding Percentage of children born in the five years preceding the survey who were ever breastfed, and among chil-dren ever breastfed, the percentage who started breastfeeding within one hour and within one day of birth, andpercentage who received a prelacteal feed, by background characteristics, Jordan 2002 ––––––––––––––––––––––––––––––––––––––––––––––––––––––––––––––––––––––––––––––––––––––––––––– Among children ever breastfed, percentage who: All children ––––––––––––––––––––––––––––––––––––––––––––––––– ––––––––––––––––––––––– Started Started Number of Percentage Number breastfeeding breastfeeding Received a children Background ever of within 1 hour within 1 day prelacteal ever characteristic breastfed children of birth of birth1 feed2 breastfed –––––––––––––––––––––––––––––––––––––––––––––––––––––––––––––––––––––––––––––––––––––––––––––Sex Male 93.9 2,950 38.9 78.8 60.9 2,769 Female 94.6 2,870 40.6 79.1 60.2 2,715 Residence Urban 94.1 4,487 39.3 78.5 60.9 4,221 Rural 94.8 1,333 41.2 80.2 59.5 1,263 Region Central 93.9 3,635 38.0 75.6 61.9 3,413 North 95.1 1,596 43.5 84.8 58.7 1,518 South 94.0 589 40.2 83.7 57.0 553 Mother’s education No education 92.9 237 45.8 80.8 55.7 220 Elementary 93.7 484 37.9 73.7 63.6 454 Preparatory 95.0 1,154 45.7 82.6 59.9 1,096 Secondary 94.4 2,440 39.4 79.2 59.2 2,305 Higher 93.7 1,504 35.3 77.0 63.0 1,409 Preparatory + secondary 94.6 3,594 41.4 80.3 59.4 3,401 Place of delivery Health facility 94.1 5,640 39.0 78.5 60.4 5,307 At home/other 98.2 180 60.4 92.6 64.0 177 Total 94.2 5,820 39.7 78.9 60.6 5,484 –––––––––––––––––––––––––––––––––––––––––––––––––––––––––––––––––––––––––––––––––––––––––––––Note: Table is based on all births whether the children are living or dead at the time of interview. 1 Includes children who started breastfeeding within one hour of birth 2 Children given something other than breast milk during the first three days of life before the mother startedbreastfeeding regularly.

Nutrition, Anemia, and Micronutrients │ 125
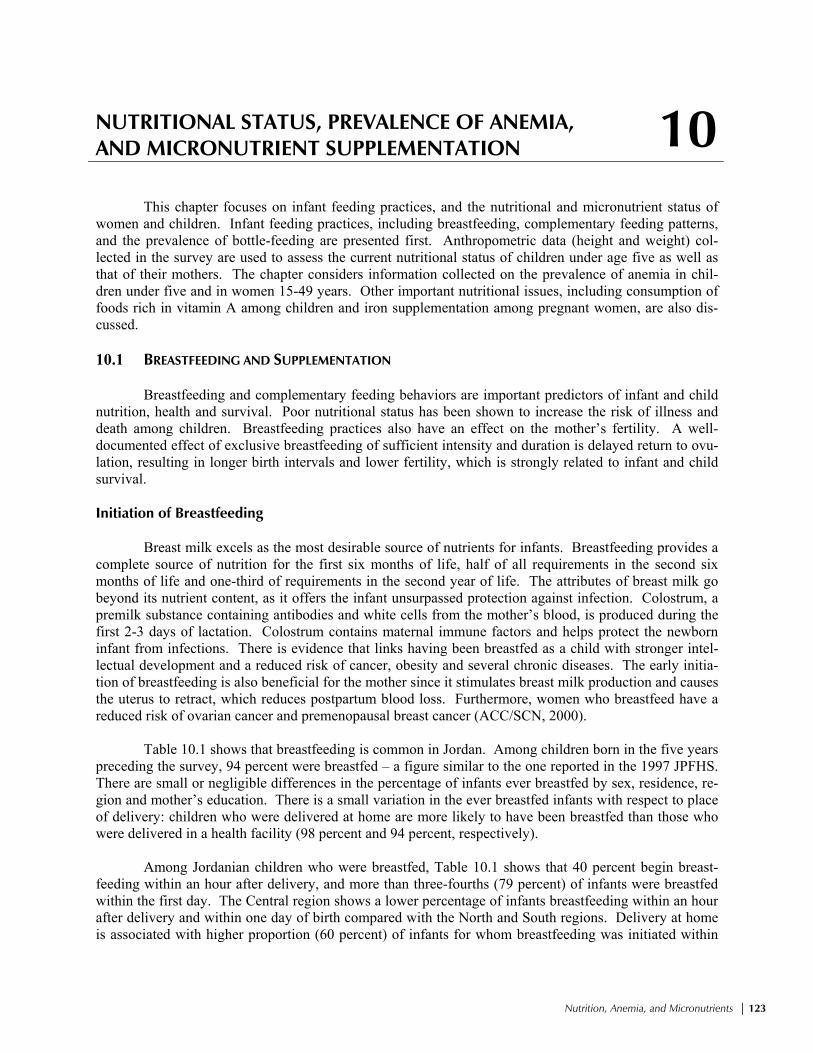
Introduction of Complementary Feeding Exclusive breastfeeding, defined as the consumption of human milk as a sole source of energy, is the preferred method of feeding for normal full-term infants from birth to 6 months. Breastfeeding com-plemented by the appropriate introduction of other foods is recommended for the remainder of the first year or longer if desired. Early supplementation is discouraged for several reasons. First, it exposes infants to pathogens and increases their risk of infection, especially diarrheal disease. Second, it decreases infant’s intake of breast milk and therefore suckling, which reduces breast milk production. Third, in harsh socioeconomic environments, available supplementary food is often nutritionally inferior. On the other hand, after six months of age, breastfeeding alone provides insufficient nutrition for the infant, and must be supple-mented with the introduction of other appropriate foods in order to promote the best growth possible. Information on supplementation was obtained by asking mothers about the current breastfeeding status of all children under five years of age, and about the foods (liquids and solids) given to the child the day before the survey. Although information on breastfeeding was collected for all children born in the five years preceding the survey, the tables are restricted to children born in the three years before the sur-vey because most children are weaned by age three. Table 10.2 shows the percent distribution of living children in the three years before the survey by breastfeeding status. According to the World Health Organization’s recommendation, children should receive exclusive breastfeeding for up to first 6 months of life. However, only 55 percent of Jordanian children under 2 months of age are exclusively breastfed. While it appears to be an increase from the 1997 JPFHS, where only 20 percent of children under 2 months of age were exclusively breastfed, changes in the questionnaire wording mainly account for the increase.1 By age 4-5 months, only 3 percent of children are exclusively breastfed. After the age of five months almost no children receive exclusive breastfeeding. The table shows that less than one-fourth (22 percent) of children under 2 months of age consume other milk (e.g., fresh milk or powdered milk), 9 per-cent of children consume plain water and breast milk, 6 percent consume breast milk and other water-based liquids or juices, and none are given complementary food. Weaning takes place rapidly by 4-5 months; slightly more than half of children consume complementary food by this age. By 12-15 months, little more than 50 percent of children are still breastfed. Bottle-feeding is discouraged for very young children. It is usually associated with increased risk of illness, especially diarrheal disease, because of difficulty in sterilizing the nipples properly. Bottle-feeding also shortens the period of postpartum amenorrhea and increases the risk of pregnancy. The prac-tice of bottle-feeding with a nipple is prevalent in 35 percent of children under 2 months of age; however, the proportion of children who are bottle-fed increases to 45 percent among children less than 4 months of age and remains at this level among children age 6-9 months.
1 In the 1997 JPFHS, mothers were asked if their young children were given any of a list of liquids and specific foods in the preceding 24 hours. A final question concerned “any other solid or semi-solid foods.” In the 2002 JPFHS, mothers were asked only about specific food groups, with no final “any other food” category. This may have resulted in an overestimation of exclusive breastfeeding.
126 │ Nutrition, Anemia, and Micronutrients
Duration and Frequency of Breastfeeding The median duration of breastfeeding by background characteristics is shown in Table 10.3. Es-timates of the mean and median duration of breastfeeding are based on current status data, that is, the pro-portion of children under three years who were being breastfed at the time of the survey. The median and mean durations of breastfeeding are very similar: 13.1 months and 13.5 months, respectively (Table 10.3). There is a slight difference in the duration of breastfeeding by sex of the child. Female children are breastfed for a slightly longer duration than male children. There are slight variations among different regions; however, these do not appear to be significant. Mothers with elementary and higher education breastfeed their children for a shorter duration than mothers with no education. Both duration and frequency of breastfeeding can affect the length of postpartum amenorrhea. Table 10.3 shows that the majority of children (91 percent) under 6 months of age were breastfed 6 or more times in the past 24 hours. Breastfeeding is more frequent in the daytime than at night, with the mean number of feeds in the daytime being 6.2 compared with 3.4 at night. Breastfeeding is slightly more frequent among children residing in rural areas and among children of mothers with no education.
Table 10.2 Breastfeeding status by child’s age Percent distribution of youngest children under three years living with the mother by breastfeeding status and percentageof children under three years using a bottle with a nipple, according to age in months, Jordan 2002 ––––––––––––––––––––––––––––––––––––––––––––––––––––––––––––––––––––––––––––––––––––––––––––––––––––– Breastfeeding and consuming: Exclu- –––––––––––––––––––––––––––––––– Using Number Not sively Plain Water-based Comple- Number a bottle of breast- breast- water liquids/ Other mentary of with living Age in months feeding fed only juice milk foods Total children a nipple1 children –––––––––––––––––––––––––––––––––––––––––––––––––––––––––––––––––––––––––––––––––––––––––––––––––––––<2 7.5 54.8 9.2 6.2 22.3 0.0 100.0 144 35.1 145 2-3 10.0 26.1 25.4 2.7 23.3 12.4 100.0 172 45.0 178 4-5 12.5 3.2 19.3 5.1 9.8 50.1 100.0 167 39.3 171 6-7 20.2 0.0 3.8 4.2 2.3 69.5 100.0 199 44.5 203 8-9 26.8 0.1 1.1 1.0 0.0 71.0 100.0 238 45.8 242 10-11 37.6 0.0 1.1 0.3 1.3 59.7 100.0 218 48.3 227 12-15 48.9 0.0 0.3 0.2 0.0 50.7 100.0 355 46.1 370 16-19 66.6 0.0 0.0 0.4 0.0 33.0 100.0 359 32.4 401 20-23 87.6 0.0 0.6 0.0 0.6 11.2 100.0 306 29.5 364 24-27 96.1 0.0 0.0 0.0 0.0 3.9 100.0 275 19.8 393 28-31 94.7 0.0 0.0 0.0 0.0 5.3 100.0 240 12.7 378 32-35 97.8 0.0 0.0 0.0 0.0 2.2 100.0 197 9.1 382 <6 10.1 26.7 18.5 4.6 18.4 21.8 100.0 483 40.1 493 6-9 23.8 0.0 2.3 2.4 1.0 70.3 100.0 437 45.2 445 –––––––––––––––––––––––––––––––––––––––––––––––––––––––––––––––––––––––––––––––––––––––––––––––––––––Note: Breastfeeding status refers to a “24-hour” period (yesterday and last night). Children classified as breastfeedingand consuming plain water only consume no supplements. The categories of not breastfeeding, exclusively breastfed,breastfeeding and consuming plain water, water-based liquids/juice, other milk, and complementary foods (solids andsemi-solids) are hierarchical and mutually exclusive, and their percentages add to 100 percent. Thus, children who re-ceive breast milk and water-based liquids and who do not receive complementary foods are classified in the water-basedliquid category even though they may also get plain water. Any children who get complementary food are classified inthat category as long as they are breastfeeding as well. 1 Based on all children under three years

Nutrition, Anemia, and Micronutrients │ 127
Types of Supplemental Food Information on the types of food given to children under three years of age in the 24 hours pre-ceding the survey, according to breastfeeding status, is shown in Table 10.4. In Jordan, the introduction of other liquids such as water, juice, and formula takes place earlier than the recommended age of about 6 months. Even among the youngest breastfed children (under 2 months of age), almost one in four chil-dren receives milk (infant formula) other than breast milk, and 9 percent consume other liquids. Use of other liquids increases with age, and by 12-15 months, about 79 percent of children receive other liquids. WHO recommends the introduction of solid food to infants around the age of 6 months because by that age breast milk by itself is no longer sufficient to maintain a child’s optimal growth. Among Jor-danian children, cereals, grains and some solid and semi-solid foods are introduced even before 6 months of age. Breastfed children consume breads, cereals, grains and semi-solid or solid types of foods early in life. Among infants age 6-7 months, about 69 percent and 89 percent consume foods made from grains
Table 10.3 Median duration and frequency of breastfeeding Median duration of any breastfeeding, exclusive breastfeeding, and predominant breastfeeding among children born inthe three years preceding the survey, percentage of breastfeeding children under six months living with the mother whowere breastfed six or more times in the 24 hours preceding the survey, and mean number of feeds (day/night), by back-ground characteristics, by background characteristics, Jordan 2002 ––––––––––––––––––––––––––––––––––––––––––––––––––––––––––––––––––––––––––––––––––––––––––––––––––––– Median duration (months) of breastfeeding1 Breastfeeding children under six months2 –––––––––––––––––––––––––––––––––––––––––––––––––––––––––––––––––––––––––––– Predo- Percentage Mean Mean Any Exclusive minant Number breastfed 6+ number number Number Background breast- breast- breast- of times in last of of of characteristic feeding feeding feeding3 children 24 hours day feeds night feeds children –––––––––––––––––––––––––––––––––––––––––––––––––––––––––––––––––––––––––––––––––––––––––––––––––––––Sex Male 12.8 0.7 2.0 1,794 90.6 6.0 3.6 209 Female 13.3 1.2 2.6 1,746 91.9 6.3 3.3 228 Residence Urban 13.0 0.8 2.2 2,739 90.2 6.1 3.4 330 Rural 13.2 1.3 2.7 801 94.7 6.4 3.5 107 Region Central 12.7 1.1 2.1 2,218 89.3 6.2 3.3 276 North 14.0 0.7 2.8 969 96.0 6.1 3.7 116 South 13.0 0.7 2.7 352 91.3 6.2 3.5 45 Mother’s education No education 18.9 1.0 2.1 127 97.1 (7.1) (3.3) 16 Elementary 14.1 0.6 3.4 289 94.6 (5.9) (3.3) 37 Preparatory 14.6 0.7 2.2 694 93.9 6.4 3.3 75 Secondary 12.9 1.4 2.7 1,518 92.1 6.2 3.4 201 Higher 12.1 0.7 1.2 912 86.0 6.0 3.6 107 Preparatory + secondary 13.2 1.2 2.5 2,211 92.6 6.2 3.4 276 Total 13.1 0.9 2.3 3,539 91.3 6.2 3.4 437 Mean for all children 13.5 2.2 3.6 na na na na na –––––––––––––––––––––––––––––––––––––––––––––––––––––––––––––––––––––––––––––––––––––––––––––––––––––Note: Median and mean durations are based on current status. Figures in parentheses are based on 25-49 unweighted cases. na = Not applicable 1 It is assumed that non-last-born children or last-born children not living with the mother are not currently breastfeeding2 Excludes children who do not have a valid answer on the number of times breastfed 3 Either exclusively breastfed or received breast milk and plain water, water-based liquids, and/or juice only (excludes other milk)

128 │ Nutrition, Anemia, and Micronutrients
and any solid or semi-solid food, respectively. The percentage receiving cereals, grains, and solid or semisolid food increases with age, and by age one most children are fed solid or semi-solid foods. In addition to the above foods, by age one 68 percent of the children consume meat, fish, or poul-try and more than three-fourths receive foods made with oil, fat or butter. In comparison, consumption of roots, tubers, legumes, and foods rich in vitamin A is lower in Jordanian children. As expected, the per-centage of nonbreastfed children who consume supplements at an earlier age is higher than the percentage of breastfed children.
Table 10.4 Foods consumed by children in the day or night preceding the interview Percentage of children under three years of age living with the mother who consumed specific foods in the day or nightpreceding the interview, by breastfeeding status and age, Jordan 2002 ––––––––––––––––––––––––––––––––––––––––––––––––––––––––––––––––––––––––––––––––––––––––––––––––––––– Solid/semisolid foods ––––––––––––––––––––––––––––––––––––––––––––––––––––––––––– Any Food Meat/ Food Fruits and solid Other Food made Food fish/ made vegetables or milk/ made Fruits/ from made shellfish/ with rich in semi- Number Child’s age Infant cheese/ Other from vege- roots/ from poultry oil/fat/ vitamin solid of in months formula yogurt liquids1 grains tables tubers legumes eggs butter A2 food children –––––––––––––––––––––––––––––––––––––––––––––––––––––––––––––––––––––––––––––––––––––––––––––––––––––
BREASTFEEDING CHILDREN –––––––––––––––––––––––––––––––––––––––––––––––––––––––––––––––––––––––––––––––––––––––––––––––––––––<2 24.2 0.0 8.9 0.0 0.0 0.0 0.0 0.0 0.0 0.0 0.0 133 2-3 28.3 6.1 8.7 8.2 2.6 0.4 0.7 0.0 1.0 0.4 17.4 155 4-5 20.0 41.1 29.4 34.2 20.2 6.6 7.5 5.3 8.1 5.6 63.9 146 6-7 22.7 65.9 43.5 68.8 52.0 30.2 16.4 22.4 36.1 19.1 89.3 159 8-9 13.6 82.0 70.4 84.7 74.2 48.0 27.7 40.7 58.5 27.7 97.0 174 10-11 8.8 85.3 61.5 91.0 75.4 37.2 33.2 44.1 70.6 32.9 97.9 136 12-15 4.0 89.3 78.9 94.1 90.2 41.9 36.5 67.7 75.8 37.2 99.1 182 16-19 0.0 88.5 87.3 96.2 91.9 55.6 40.8 71.0 82.6 50.0 98.9 120 20-23 (1.5) (83.2) (87.0) (85.2) (87.3) (45.5) (42.8) (69.8) (67.6) (30.0) (90.2) 38 24-27 * * * * * * * * * * * 11 28-31 * * * * * * * * * * * 13 32-35 * * * * * * * * * * * 4 <6 24.2 16.0 15.7 14.4 7.8 2.3 2.7 1.8 3.1 2.0 27.7 434 6-9 17.9 74.3 57.6 77.1 63.6 39.5 22.3 32.0 47.8 23.6 93.3 333 –––––––––––––––––––––––––––––––––––––––––––––––––––––––––––––––––––––––––––––––––––––––––––––––––––––
NONBREASTFEEDING CHILDREN –––––––––––––––––––––––––––––––––––––––––––––––––––––––––––––––––––––––––––––––––––––––––––––––––––––<2 * * * * * * * * * * * 11 2-3 * * * * * * * * * * * 17 4-5 * * * * * * * * * * * 21 6-7 (77.1) (85.6) (64.5) (73.6) (56.9) (34.0) (12.6) (22.5) (50.0) (16.2) (96.3) 40 8-9 54.3 95.8 74.1 95.1 84.2 49.2 20.4 53.2 48.8 49.1 100.0 64 10-11 27.6 92.6 72.7 92.4 92.1 42.0 30.3 68.2 77.0 56.3 100.0 82 12-15 15.0 96.0 77.7 93.6 86.2 42.1 41.5 64.2 77.9 46.6 99.6 174 16-19 2.3 93.7 84.6 96.5 90.6 50.6 42.5 76.5 87.1 49.7 99.3 239 20-23 0.9 96.0 91.4 99.7 96.6 52.1 47.7 80.2 88.8 51.4 100.0 267 24-27 0.0 90.7 93.0 98.8 96.0 49.8 58.2 81.9 89.9 54.7 100.0 264 28-31 2.1 92.9 95.4 99.2 96.2 46.8 55.3 81.9 88.5 53.7 100.0 228 32-35 0.0 92.3 92.2 99.8 95.7 40.9 60.2 81.2 84.4 60.8 99.8 192 <6 (94.7) (9.7) (18.0) (19.0) (9.1) (1.2) (0.0) (0.0) (4.2) (4.0) (28.4) 49 6-9 63.1 91.9 70.4 86.8 73.7 43.3 17.4 41.4 49.2 36.4 98.6 104 –––––––––––––––––––––––––––––––––––––––––––––––––––––––––––––––––––––––––––––––––––––––––––––––––––––Note: Breastfeeding status and food consumed refer to a “24 hour” period (yesterday and last night). Figures in parenthe-ses are based on 25-49 unweighted cases. An asterisk indicates that a figure is based on fewer than 25 unweighted casesand has been suppressed. 1 Does not include plain water 2 Includes pumpkin, carrots, red sweet potatoes, green leafy vegetables, apricot, palm nuts, yellow melon, andother locally grown fruits and vegetables that are rich in vitamin A

Nutrition, Anemia, and Micronutrients │ 129
Frequency of Food Supplementation The nutritional requirements of young children are more likely to be met if they are fed a variety of foods. In the JPFHS, interviewers read a list of specific foods and asked the mother to report the num-ber of times during the last seven days a child had consumed each food. For any food consumed at least once in the last seven days, the mother was also asked for the number of times the child had consumed the food in the 24 hours preceding the survey. Tables 10.5 and 10.6 show the mean number of times and the mean number of days children under age three consumed specific foods in the 24 hours before the survey and in the 7 days before the survey, by age and breastfeeding status.
Table 10.5 Frequency of foods consumed by children in the day or night preceding the interview Mean number of times specific foods were consumed in the day or night preceding the interview by youngest children under three years of age living with the mother, according to breastfeeding status and age, Jordan 2002 ––––––––––––––––––––––––––––––––––––––––––––––––––––––––––––––––––––––––––––––––––––––––––––– Solid/semisolid foods ––––––––––––––––––––––––––––––––––––––––––––––––––––– Food Meat/ Food Fruits and Other Food made Food fish/ made vegetables milk/ made Fruits/ from made shellfish/ with rich in Number Child’s age Infant cheese/ Other from vege- roots/ from poultry/ oil/fat/ vitamin of in months formula yogurt liquids 1 grains tables tubers legumes eggs butter A2 children –––––––––––––––––––––––––––––––––––––––––––––––––––––––––––––––––––––––––––––––––––––––––––––
BREASTFEEDING CHILDREN ––––––––––––––––––––––––––––––––––––––––––––––––––––––––––––––––––––––––––––––––––––––––––––– <2 0.6 0.0 0.1 0.0 0.0 0.0 0.0 0.0 0.0 0.0 133 2-3 0.9 0.1 0.1 0.1 0.0 0.0 0.0 0.0 0.0 0.0 155 4-5 0.6 0.6 0.4 0.5 0.3 0.1 0.1 0.1 0.1 0.1 146 6-7 0.5 0.9 0.7 1.0 0.9 0.3 0.2 0.2 0.5 0.2 159 8-9 0.3 1.2 1.0 1.4 1.4 0.5 0.3 0.5 0.7 0.3 174 10-11 0.2 1.4 1.1 1.6 1.6 0.4 0.4 0.5 1.0 0.4 136 12-15 0.1 1.8 1.5 1.9 2.3 0.5 0.4 0.8 0.9 0.5 182 16-19 0.0 1.7 1.9 2.2 2.3 0.6 0.5 0.8 1.2 0.6 120 20-23 (0.1) (1.8) (2.7) (2.1) (1.9) (0.5) (0.6) (0.8) (1.0) (0.3) 38 24-27 * * * * * * * * * * 11 28-31 * * * * * * * * * * 13 32-35 * * * * * * * * * * 4 <6 0.7 0.2 0.2 0.2 0.1 0.0 0.0 0.0 0.0 0.0 434 6-9 0.4 1.1 0.8 1.2 1.2 0.4 0.2 0.4 0.6 0.3 333 –––––––––––––––––––––––––––––––––––––––––––––––––––––––––––––––––––––––––––––––––––––––––––––
NONBREASTFEEDING CHILDREN ––––––––––––––––––––––––––––––––––––––––––––––––––––––––––––––––––––––––––––––––––––––––––––– <2 * * * * * * * * * * 11 2-3 * * * * * * * * * * 17 4-5 * * * * * * * * * * 21 6-7 (3.0) (1.8) (0.9) (1.2) (1.0) (0.4) (0.1) (0.3) (0.7) (0.2) 40 8-9 2.1 2.9 1.2 1.7 2.3 0.5 0.2 0.7 0.6 0.8 64 10-11 1.1 3.5 1.8 1.9 2.4 0.5 0.4 0.8 1.0 0.8 82 12-15 0.6 3.2 1.6 2.0 2.4 0.5 0.5 0.7 1.0 0.7 174 16-19 0.1 3.0 2.1 2.2 2.8 0.5 0.5 0.9 1.2 0.8 239 20-23 0.0 2.6 2.6 2.4 2.8 0.6 0.6 1.0 1.2 0.7 267 24-27 0.0 2.4 2.6 2.3 2.9 0.5 0.7 1.1 1.2 0.8 264 28-31 0.1 2.2 2.9 2.4 2.9 0.5 0.7 1.0 1.3 0.8 228 32-35 0.0 2.2 2.7 2.6 2.8 0.4 0.8 1.0 1.1 0.8 192 <6 (5.2) (0.4) (0.3) (0.2) (0.1) (0.0) (0.0) (0.0) (0.1) (0.0) 49 6-9 2.5 2.5 1.1 1.5 1.8 0.5 0.2 0.5 0.6 0.5 104 –––––––––––––––––––––––––––––––––––––––––––––––––––––––––––––––––––––––––––––––––––––––––––––Note: Breastfeeding status and food consumed refer to a “24 hour” recall period (yesterday and last night). Figures inparentheses are based on 25-49 unweighted cases. An asterisk indicates that a figure is based on fewer than 25 un-weighted cases and has been suppressed. 1 Does not include plain water 2 Includes pumpkin, carrots, red sweet potatoes, green leafy vegetables, mangoes, apricot, palm nuts, yellow melon,and other locally grown fruits and vegetables that are rich in vitamin A

130 │ Nutrition, Anemia, and Micronutrients
As seen in Table 10.6, children under three years of age consumed foods made from grains most often during the 7 days before the survey (4 times a week), followed by cheese and yogurt (more than three times a week). Green leafy vegetables, fruits and other vegetables (good sources of vitamin A) are consumed less than once a week whereas meat or fish and foods made with oil, fat or butter are consumed almost twice a week. As expected, nonbreastfed and older children consumed supplements more fre-quently than breastfed children and younger children.
Table 10.6 Frequency of foods consumed by children in preceding seven days Mean number of days specific foods were received in the seven days preceding the interview by youngest children under three years of age living with the mother, by breastfeeding status and age, Jordan 2002 –––––––––––––––––––––––––––––––––––––––––––––––––––––––––––––––––––––––––––––––––––––––––––––––––––––––––––––––––– Fruits and Food Food vege- Food made Apricot, Any Pumpkin Food made tables made Meat/ with palm type carrots/ Green made from not rich from fish/ oil/ nuts, or of nuts red leafy NumberAge in Plain Infant Other Fruit Soup/ Other from roots/ in vita- leg- Cheese/ poultry/ fat/ yellow or sweet vege- of months water formula milk juice broth Tea liquids grains tubers min A umes yogurt eggs butter melon seeds potatoes tables children––––––––––––––––––––––––––––––––––––––––––––––––––––––––––––––––––––––––––––––––––––––––––––––––––––––––––––––––––
BREASTFEEDING CHILDREN ––––––––––––––––––––––––––––––––––––––––––––––––––––––––––––––––––––––––––––––––––––––––––––––––––––––––––––––––––<2 1.4 1.5 0.0 0.0 0.0 0.0 0.2 0.0 0.0 0.0 0.0 0.0 0.0 0.0 0.0 0.0 0.0 0.0 133 2-3 4.0 2.0 0.0 0.2 0.0 0.0 0.3 0.5 0.0 0.1 0.0 0.3 0.0 0.0 0.0 0.0 0.0 0.0 155 4-5 5.9 1.4 0.5 1.0 0.6 0.1 0.1 2.0 0.4 0.8 0.2 1.7 0.2 0.4 0.1 0.0 0.1 0.0 146 6-7 6.9 1.6 0.7 2.1 1.0 0.4 0.2 4.5 1.5 2.1 0.7 3.4 1.2 2.0 0.5 0.0 0.6 0.2 159 8-9 6.9 0.9 1.0 2.6 1.6 0.8 0.2 5.1 2.2 2.8 1.3 4.6 2.3 3.4 0.8 0.1 0.6 0.5 174 10-11 6.9 0.5 1.3 2.8 1.7 0.8 0.3 5.7 2.1 2.9 1.6 4.7 2.7 4.2 1.0 0.1 0.3 0.8 136 12-15 7.0 0.3 2.1 3.0 1.8 1.7 0.7 6.0 2.4 3.8 1.4 5.0 3.5 4.6 1.3 0.3 0.5 0.7 182 16-19 7.0 0.1 2.8 2.8 1.4 4.1 0.9 6.4 2.9 3.3 1.8 5.3 3.6 5.2 1.7 0.6 0.6 0.7 120 20-23 (7.0) (0.1) (3.4) (3.6) (1.5) (4.3) (1.6) (6.0) (2.9) (3.6) (1.5) (4.7) (3.9) (4.5) (0.7) (0.9) (0.2) (1.0) 38 24-27 * * * * * * * * * * * * * * * * * * 11 28-31 * * * * * * * * * * * * * * * * * * 13 32-35 * * * * * * * * * * * * * * * * * * 4 <6 3.8 1.7 0.2 0.4 0.2 0.0 0.2 0.8 0.1 0.3 0.1 0.7 0.1 0.1 0.0 0.0 0.0 0.0 434 6-9 6.9 1.2 0.8 2.4 1.3 0.6 0.2 4.8 1.9 2.5 1.0 4.0 1.8 2.7 0.7 0.1 0.6 0.4 333 Total 5.9 1.0 1.1 2.0 1.1 1.1 0.4 3.9 1.5 2.1 0.9 3.3 1.8 2.6 0.7 0.2 0.3 0.4 1,271 ––––––––––––––––––––––––––––––––––––––––––––––––––––––––––––––––––––––––––––––––––––––––––––––––––––––––––––––––––
NONBREASTFEEDING CHILDREN ––––––––––––––––––––––––––––––––––––––––––––––––––––––––––––––––––––––––––––––––––––––––––––––––––––––––––––––––––<2 * * * * * * * * * * * * * * * * * * 11 2-3 * * * * * * * * * * * * * * * * * * 17 4-5 * * * * * * * * * * * * * * * * * * 21 6-7 (6.9) (5.4) (1.7) (3.0) (0.9) (0.5) (0.2) (4.7) (1.5) (2.7) (0.7) (4.5) (1.3) (2.7) (0.3) (0.0) (0.6) (0.2) 40 8-9 6.9 3.8 3.3 2.5 1.8 0.8 0.2 6.0 2.1 3.6 1.2 4.6 3.3 2.9 1.4 0.0 1.0 0.6 64 10-11 6.8 1.9 4.8 2.8 2.1 1.6 0.8 5.8 2.1 4.2 1.2 5.0 3.5 4.9 2.0 0.2 0.7 0.7 82 12-15 7.0 1.0 5.4 3.2 1.3 1.8 1.0 6.4 2.5 3.9 1.9 4.9 3.6 4.7 1.8 0.3 0.4 0.8 174 16-19 7.0 0.2 5.6 3.4 1.5 3.8 1.3 6.4 3.0 4.1 1.9 5.4 4.4 5.5 2.0 0.7 0.6 1.0 239 20-23 7.0 0.1 5.3 3.8 1.6 4.4 2.0 6.8 3.1 4.4 1.8 5.3 4.7 5.8 1.8 1.1 0.6 0.9 267 24-27 7.0 0.0 4.7 3.5 1.4 5.0 1.9 6.8 2.8 4.2 2.4 5.3 4.6 5.6 1.8 1.5 0.7 1.0 264 28-31 7.0 0.1 4.5 3.7 1.2 5.0 2.0 6.7 2.8 4.2 2.2 5.1 4.2 5.3 1.6 1.5 0.6 1.0 228 32-35 7.0 0.0 4.6 3.7 1.3 4.8 2.4 6.8 2.7 3.9 2.4 5.6 4.7 5.6 1.7 1.6 0.4 0.9 192 <6 (5.3) (6.6) (0.4) (0.6) (0.1) (0.0) (0.3) (1.2) (0.1) (0.4) (0.0) (0.4) (0.0) (0.3) (0.1) (0.0) (0.1) (0.0) 49 6-9 6.9 4.4 2.7 2.7 1.5 0.7 0.2 5.5 1.9 3.3 1.0 4.6 2.6 2.8 0.9 0.0 0.8 0.5 104 Total 6.9 0.8 4.7 3.4 1.4 3.7 1.6 6.4 2.7 4.0 1.9 5.1 4.1 5.1 1.7 1.0 0.6 0.9 1,600 ––––––––––––––––––––––––––––––––––––––––––––––––––––––––––––––––––––––––––––––––––––––––––––––––––––––––––––––––––Note: Breastfeeding status refers to a “24-hour” period (yesterday and last night). Figures in parentheses are based on 25-49 unweighted cases. An asterisk indicates that a figure is based on fewer than 25 unweighted cases and has been suppressed.

Nutrition, Anemia, and Micronutrients │ 131
10.2 NUTRITIONAL STATUS OF CHILDREN The nutritional status of young children is a comprehensive index that reflects the level and pace of household, community, and national development. Malnutrition (inadequate nutrition) is a direct result of insufficient food intake or repeated infectious diseases, or a combination of both. It can result in in-creased risk of illness and death, and can also result in a lower level of cognitive development. In the JPFHS, anthropometric data on height and weight for children under five years were col-lected from all the households sampled in the survey to evaluate their nutritional status. Their standing height (for children age 24 months and older) or recumbent length (for children under age 24 months) was measured using the Shorr height board. Electronic Seca scales supplied by UNICEF were used to meas-ure the weight of children. Based on these measurements, three internationally accepted indices were constructed and are used to reflect the nutritional status of children. These are: Height-for-age (stunting) Weight-for-height (wasting) Weight-for-age (underweight) The assessment of nutritional status is based on the concept that in a well-nourished population, the distribution of children’s height and weight at a given age will approximately follow a normal distri-bution. Since all populations have similar genetic potential for growth (Habicht et al., 1974), for com-parative purposes, the nutritional status has been determined using the International Reference Population defined by the U. S. National Center for Health Statistics (NCHS), as recommended by WHO and the U.S. Centers for Disease Control and Prevention (CDC). Children who fall below minus two standard deviations from the reference median are considered malnourished, and children who fall below minus three standard deviations from the reference median are considered severely malnourished. Since chil-dren’s height and weight change with age, it is suggested that height and weight be related to age and that weight be related to height, taking the sex of the child into consideration. Each of the three indices pro-vides information about different aspects of children’s nutritional status. The height-for-age index reflects linear growth achieved pre- and postnatally, with its deficit in-dicating the long-term, cumulative effects of inadequate nutrition and/or compromised health. Children who are below minus two standard deviations (-2 SD) from the median of the reference population are considered short for their age, or stunted. Children who are below minus three standard deviations (-3 SD) are severely stunted. Stunting of a child’s growth may be the result of failure to receive adequate nutrition over a long period, or of sustained improper feeding practices, or of the effects of repeated epi-sodes of illness. Height-for-age therefore represents a measure of the outcome of undernutrition in a population over a long period and does not vary appreciably with the season of data collection. The weight-for-height index measures body mass in relation to body length. It describes a recent and severe process that has produced a substantial weight loss, usually as a consequence of acute shortage of food and/or severe disease. Children whose weight-for-height is below minus two standard deviations (-2 SD) from the median of the reference population are too thin for their height, or wasted, while those who measure below minus three standard deviations (-3 SD) from the reference population median are severely wasted. Wasting represents the failure to receive adequate nutrition during the period immedi-ately before the survey and usually shows marked seasonal patterns associated with changes in food availability or disease prevalence. It may be the result of recent episodes of illness, particularly diarrhea, improper feeding practices, or acute food shortage.

132 │ Nutrition, Anemia, and Micronutrients
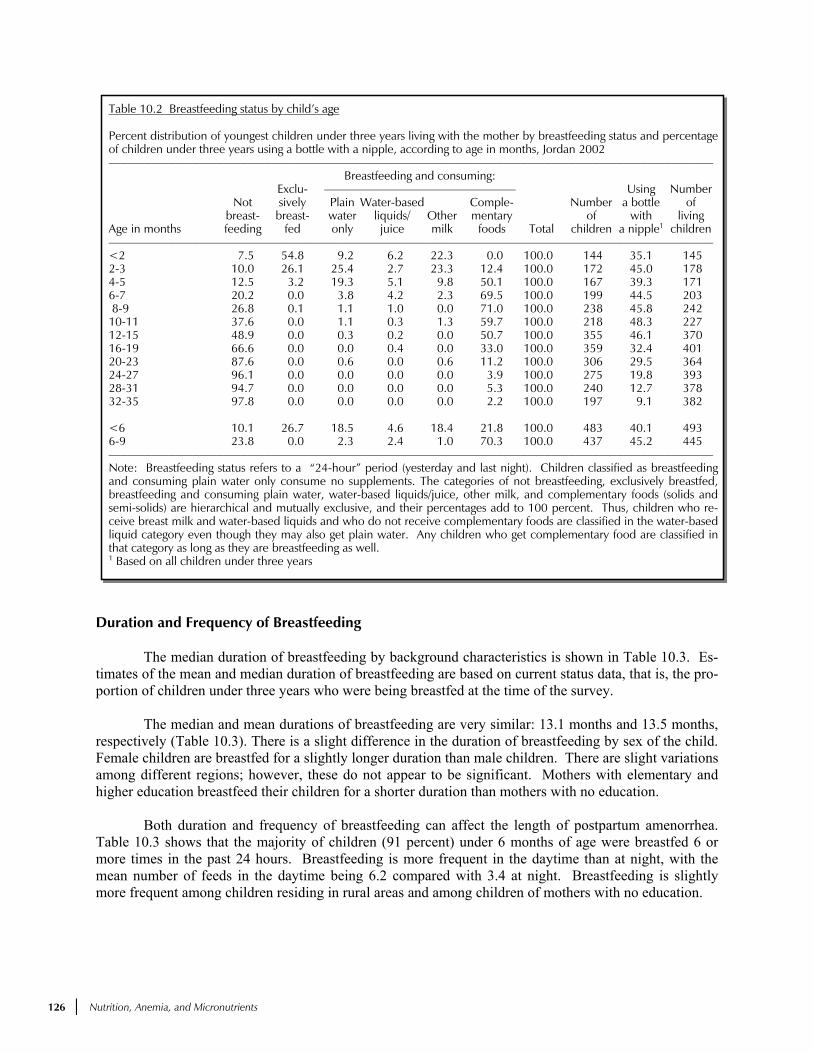
Weight-for-age is a composite index of height-for-age and weight-for-height. It represents body mass relative to age. Children whose weight-for-age measures below minus two standard deviations (-SD) from the median of the reference population are underweight for their age, while those whose meas-urements are below minus three standard deviations (-3SD) from the reference population median are se-verely underweight. Being underweight for one’s age therefore could mean that a child is stunted or wasted or both stunted and wasted. In the absence of wasting, both weight-for-age and height-for-age reflect the long-term nutrition and health experience of the individual or population. The JPFHS measured and weighed all children born in the five years prior to the survey who were listed in the Household Questionnaire. Table 10.7 shows the percentage of children less than five years old who are classified as malnourished according to background characteristics. The table also shows the nutritional status of children of noninterviewed mothers by whether or not the mother lives in the household. A total of 4,633 children were weighed and measured. Out of the 5,727 eligible children, anthropometric measurements are available for 81 percent of children. Nineteen percent of children could not be measured either because they were not at home at the time of the survey, they refused to be measured, or the mother refused to allow the child to be measured. In some cases, measurements were not taken if the child was too sick. However, the data are unlikely to be biased, since missing information on anthropometry is consistent across age groups and other back-ground characteristics. Chronic malnutrition among Jordanian children is relatively low, with 9 percent of children mod-erately stunted and 2 percent severely stunted (Table 10.7). The level of stunting increases rapidly with age, from 3 percent among children less than six months of age to 13 percent among children age 12-23 months (Figure 10.1). There is little difference in the level of stunting by sex. First births are least likely to be stunted while children of birth order 6 or higher are most likely to be stunted. The length of the birth interval is inversely related to stunting: children with a birth interval of less than 24 months were most likely to be stunted (10 percent). As expected, rural children are more likely to be stunted than ur-ban children, and children residing in the Central region (including the capital city Amman) are much less likely to be stunted than those in the South. Mother’s education impacts children’s nutritional status posi-tively, with 5 percent of children of highly educated mothers stunted, compared with 22 percent of chil-dren of mothers with no education. Two percent of children under five years of age are wasted (thin for their height), and less than 1 percent are severely wasted. As with stunting, the proportion of wasted children is highest in the 10-11 month age group. Rural children are more likely to be wasted than urban children. As with stunting, children residing in the South are more likely to be wasted than children residing in other regions. Varia-tions in wasting are also seen with respect to birth order and birth intervals; however, there is no clear pattern. Mother’s education has a positive impact on lowering wasting. Also, the proportion of wasting is highest in children born to young mothers (15-19 years). Four percent of children are underweight (low weight-for-age), and less than 1 percent are se-verely underweight. Differentials by background characteristics are very similar to those discussed for stunting. Children who live in households where the mother was not interviewed may not receive the qual-ity of care and nurturance they would if they lived with their natural mother, because the natural mother may have died or is otherwise unavailable. Children of noninterviewed mothers are more likely to be stunted and wasted than children of interviewed mothers. There is no significant difference between these two groups for moderate wasting and underweight. However, children of noninterviewed mothers were four times more likely to be severely wasted and underweight than children of interviewed mothers.

Nutrition, Anemia, and Micronutrients │ 133
Table 10.7 Nutritional status of children
Percentage of children under five years classified as malnourished according to three anthropometric indices of nutritional status:height-for-age, weight-for-height, and weight-for-age, by background characteristics, Jordan 2002 –––––––––––––––––––––––––––––––––––––––––––––––––––––––––––––––––––––––––––––––––––––––––––––––––––––––––––––––– Height-for-age (stunted) Weight-for-height (wasted) Weight-for-age (underweight) ––––––––––––––––––––––– ––––––––––––––––––––––– ––––––––––––––––––––––– Percent- Percent- Percent- Percent- Percent- Percent- age age Mean age age Mean age age Mean Number Background below below Z-score below below Z-score below below Z-score of characteristic -3 SD -2 SD1 (SD) -3 SD -2 SD1 (SD) -3 SD -2 SD1 (SD) children ––––––––––––––––––––––––––––––––––––––––––––––––––––––––––––––––––––––––––––––––––––––––––––––––––––Age in months <6 0.6 3.3 -0.0 0.5 1.7 0.6 0.2 1.0 0.5 395 6-9 2.2 5.5 -0.2 0.0 1.4 0.2 0.1 1.8 -0.0 382 10-11 0.4 6.5 -0.4 0.5 4.6 -0.2 0.0 3.0 -0.6 189 12-23 3.2 12.5 -0.8 0.2 2.8 0.1 0.4 4.8 -0.4 929 24-35 1.6 8.5 -0.5 0.5 2.2 -0.2 0.5 5.8 -0.5 935 36-47 0.9 7.1 -0.5 0.7 1.7 -0.1 0.8 5.3 -0.5 852 48-59 1.0 9.6 -0.6 0.5 1.2 -0.0 0.5 4.6 -0.4 952 Sex Male 1.6 7.8 -0.5 0.5 2.3 -0.0 0.5 4.1 -0.3 2,325 Female 1.6 9.2 -0.5 0.4 1.8 0.0 0.4 4.7 -0.4 2,307 Birth order2 First birth3 1.1 7.3 -0.3 0.2 2.2 0.0 0.4 4.1 -0.2 920 2-3 1.3 7.8 -0.5 0.1 1.9 0.0 0.2 4.1 -0.3 1,671 4-5 2.2 8.4 -0.5 1.0 1.8 -0.0 0.7 4.5 -0.4 1,125 6+ 1.7 10.7 -0.6 0.3 2.5 -0.0 0.5 5.3 -0.4 857 Birth interval in months2 First birth3 1.1 7.5 -0.4 0.2 2.4 0.0 0.4 4.3 -0.3 936 <24 1.3 10.4 -0.7 0.5 1.6 -0.0 0.6 5.2 -0.5 1,212 24-47 2.3 9.2 -0.5 0.2 2.2 -0.0 0.3 4.7 -0.4 1,615 48+ 1.0 4.8 -0.3 0.7 1.9 0.0 0.4 2.7 -0.2 810 Size at birth2 Very small 3.4 20.3 -1.0 0.0 2.7 -0.2 1.5 11.4 -0.9 200 Small 1.3 12.4 -0.8 1.0 3.2 -0.3 0.9 8.0 -0.8 579 Average or larger 1.5 7.2 -0.4 0.4 1.8 0.1 0.3 3.5 -0.2 3,846 Missing * * * * * * * * * 8 Residence Urban 1.3 7.1 -0.4 0.4 1.9 0.0 0.3 3.5 -0.3 3,542 Rural 2.5 13.2 -0.7 0.3 2.5 -0.0 0.8 7.4 -0.5 1,091 Region Central 1.4 7.3 -0.4 0.5 2.2 0.0 0.3 4.0 -0.3 2,884 North 1.4 9.7 -0.5 0.3 1.5 0.0 0.5 4.1 -0.3 1,233 South 3.1 12.4 -0.7 0.5 2.4 -0.1 1.2 7.5 -0.6 516 Mother’s education4 No education 4.7 21.5 -1.1 1.8 4.3 -0.1 3.0 12.2 -0.8 190 Elementary 2.3 12.1 -0.7 1.1 3.5 0.0 0.7 7.1 -0.5 398 Preparatory 2.0 10.5 -0.7 0.1 2.2 -0.1 0.4 4.8 -0.5 939 Secondary 1.3 7.6 -0.4 0.3 1.6 0.0 0.4 3.8 -0.3 1,920 Higher 0.9 4.9 -0.2 0.4 1.8 0.0 0.1 2.9 -0.2 1,149 Preparatory + secondary 1.5 8.5 -0.5 0.2 1.8 -0.0 0.4 4.1 -0.4 2,859 Mother’s age4 15-19 0.3 7.0 -0.5 1.1 3.6 0.0 0.0 3.1 -0.4 88 20-24 1.9 8.1 -0.5 0.0 2.5 0.1 0.3 4.3 -0.3 737 25-29 2.0 9.1 -0.5 0.4 1.6 0.1 0.5 4.3 -0.3 1,348 30-34 1.3 7.8 -0.5 0.4 1.9 0.0 0.5 4.6 -0.3 1,352 35-49 1.3 9.0 -0.5 0.7 2.2 -0.1 0.5 4.4 -0.4 1,107 Children of interviewed mothers 1.6 8.4 -0.5 0.4 2.0 0.0 0.4 4.4 -0.3 4,573 Children of non- interviewed mothers5 4.2 16.8 -0.6 1.7 1.7 0.2 1.7 3.6 -0.3 60 Total 1.6 8.5 -0.5 0.4 2.0 0.0 0.5 4.4 -0.3 4,633 ––––––––––––––––––––––––––––––––––––––––––––––––––––––––––––––––––––––––––––––––––––––––––––––––––––Note: Table is based on children who stayed in the household the night before the interview. Each of the indices is expressed in stan-dard deviation units (SD) from the median of the NCHS/CDC/WHO International Reference Population. The percentage of childrenwho are more than three or more than two standard deviations below the median of the International Reference Population (-3 SDand -2 SD) are shown according to background characteristics. Table is based on children with valid dates of birth (month and year)and valid measurement of both height and weight. An asterisk indicates that a figure is based on fewer than 25 unweighted cases andhas been suppressed. 1 Includes children who are below -3 standard deviations (SD) from the International Reference Population median. 2 Excludes children whose mothers were not interviewed 3 First born twins (triplets, etc.) are counted as first births because they do not have a previous birth interval. 4 For women who are not interviewed, information is taken from the Household Questionnaire. Excludes children whose mothers arenot listed in the household schedule. 5 Includes children whose mothers are deceased

134 │ Nutrition, Anemia, and Micronutrients
Figure 10.1 Nutritional Status of Children by Age
JPFHS 2002
,
,
,,,,,,,,,,,,,
,,,,,,,,,,,,,
,,,,,,
,,,,,,
,,,,,,,,,,,,,,,,,
,
,
,
+
+
+++++++++++
++++
++++++++++
++++++++++++
++++++++++
+++++++++++
'
'
''''''
'
'
'
'
''''''
'
'
'
'''
'
'
'
''''''''''''
''''
'''''
'''
'''''''
''
0 5 10 15 20 25 30 35 40 45 50 55
Age (in months)
0
2
4
6
8
10
12
14
Percent
Stunted
Underweight
Wasted
Note: Plotted values are smoothed by a five-month moving average.
Nutritional Status of Women In the JPFHS, data were collected on the height and weight of women age 15-49 in all households sampled. Women’s nutritional status is important both as an indicator of overall health and as a predictor of pregnancy outcome for both mother and child. Two indices of women’s nutritional status are pre-sented in Table 10.8: height and body mass index (BMI). Maternal height is a measure of past nutritional status and reflects in part the cumulative effect of social and economic outcomes on access to nutritional foods during childhood and adolescence. It can be used to predict the risks associated with difficult de-liveries, since small stature is often associated with small pelvis size and a greater likelihood of obstructed labor. Short stature is also correlated with low birth weight in infants, high risk of stillbirths, and high rates of miscarriage. A woman is considered to be at nutritional risk if her height is in the range of 140 to 150 centimeters. The BMI, which utilizes both height and weight and provides a better measure of thin-ness than weight alone, is defined as weight in kilograms divided by the square of the height in meters (kg/m2). The WHO Expert Committee on Physical Growth has suggested the following classifications: Mild underweight (BMI = 17-18.49) Moderate underweight (BMI = 16-16.99) Severe underweight (BMI <16) These three groups are considered to be chronically energy deficient (CED). A body mass index of more than 25 kg/m2 is considered to be overweight. To avoid bias in the measurement of women’s nutritional status, pregnant women and women who had given birth in the two months preceding the survey were excluded from the calculation of weight and body mass measures. Table 10.8 shows the means and percent distributions of height and BMI among women 15-49 years by background characteristics.

Nutrition, Anemia, and Micronutrients │ 135
The cut-off point for height, below which a woman can be identified as nutritionally at risk, var-ies among populations, but it is usually considered to be in the range of 140-150 centimeters (cm). The JPFHS found a mean height of 158 cm. The mean height varies only slightly (between 155 and 159 cm) for women in different population groups, as shown in Table 10.8. In general, younger women and women with higher education are slightly taller. Women from urban areas and the Central region are also taller than women residing in rural areas or other regions of Jordan. Only 1 percent of women are under 145 cm in height and can be considered short. The mean BMI of women in Jordan is 26.6, higher than the normal BMI range of 18.5-24.9. Forty-one percent of women fall in the normal BMI category. Five percent of women fall below the cut-off of 18.5, indicating that the level of chronic energy deficiency is relatively low in Jordan. However, an alarming proportion of women – more than half (54 percent) – have a BMI of over 25, and thus can be considered overweight or obese. In general, very young women (15-19) are more likely than other women to suffer from chronic energy deficiency. Mean BMI is higher in women in the oldest age group
Table 10.8 Nutritional status of women by background characteristics Among all women age 15-49, mean height, percentage under 145 cm, mean body mass index (BMI), and percentage with specific BMIlevels, by background characteristics, Jordan 2002 ––––––––––––––––––––––––––––––––––––––––––––––––––––––––––––––––––––––––––––––––––––––––––––––––––––––––––––––––––– Height Body mass index BMI 1 (kg/m2) –––––––––––––––––––––– ––––––––––––––––––––––––––––––––––––––––––––––––––––––––––––––––––––––––––––––– Normal Thin Overweight/obese –––––––– –––––––––––––––––––––––––––––– ––––––––––––––––––––––––– Percent- 17.0- 16.0- �25.0 25.0- 30.0 Mean age Number 18.5- 18.4 16.9 <16.0 (over- 29.9 or NumberBackground height below of Mean 24.9 <18.5 (mildly (moderat- (severe- weight/ (over- higher of characteristic in cm 145 cm women BMI (normal) (thin) thin) ely thin) ly thin) obese) weight) (obese) women –––––––––––––––––––––––––––––––––––––––––––––––––––––––––––––––––––––––––––––––––––––––––––––––––––––––––––––––––––Age 15-19 158.7 0.0 148 22.4 66.7 12.7 9.9 1.5 1.2 20.7 15.3 5.4 1,729 20-24 158.9 0.7 680 23.9 60.8 6.9 5.4 0.8 0.7 32.3 22.9 9.4 1,227 25-29 158.6 1.2 1,122 25.9 44.9 2.7 2.3 0.4 0.0 52.4 35.5 16.9 1,156 30-34 158.1 0.9 1,253 27.6 33.2 2.3 1.8 0.5 0.0 64.5 34.6 29.9 1,182 35-39 157.3 0.7 1,003 29.6 18.6 1.7 1.5 0.0 0.2 79.7 35.5 44.2 989 40-44 157.2 1.9 788 31.0 14.3 0.6 0.4 0.1 0.1 85.1 31.3 53.8 804 45-49 156.1 2.1 587 32.5 8.0 0.7 0.0 0.5 0.2 91.3 25.4 65.9 593 Residence Urban 158.3 0.7 4,419 26.7 40.7 4.9 4.0 0.5 0.4 54.4 28.1 26.3 6,018 Rural 156.1 2.6 1,162 26.3 42.5 5.5 3.9 1.0 0.6 52.0 25.8 26.2 1,663 Region Central 158.3 0.9 3,584 26.5 41.4 5.1 4.2 0.5 0.5 53.5 27.8 25.7 4,814 North 157.3 1.3 1,451 26.8 40.7 4.4 3.2 0.8 0.4 54.9 27.3 27.6 2,083 South 156.5 2.3 547 26.5 40.6 6.4 4.7 1.2 0.6 53.0 26.8 26.2 784 Mother’s education No education 154.8 5.0 344 29.8 19.7 4.4 2.8 0.5 1.1 75.9 27.0 48.9 352 Elementary 156.1 1.3 653 30.4 20.8 1.3 1.2 0.1 0.0 77.9 28.2 49.7 763 Preparatory 157.6 0.9 1,174 27.6 35.1 4.3 2.8 0.9 0.6 60.6 28.0 32.6 1,445 Secondary 158.4 0.9 2,103 25.3 47.8 7.0 5.8 0.7 0.6 45.2 26.2 18.9 3,369 Higher 158.9 0.7 1,308 25.9 46.2 3.6 3.0 0.5 0.2 50.1 29.8 20.3 1,752 Preparatory + secondary 158.1 0.9 3,277 26.0 44.0 6.2 4.9 0.8 0.6 49.8 26.7 23.1 4,813 Total 157.8 1.1 5,582 26.6 41.1 5.1 4.0 0.6 0.5 53.9 27.6 26.3 7,681 –––––––––––––––––––––––––––––––––––––––––––––––––––––––––––––––––––––––––––––––––––––––––––––––––––––––––––––––––––1 Excludes pregnant women and women with a birth in the preceding 2 months

136 │ Nutrition, Anemia, and Micronutrients
(45-49 years old). Older women and women with no education or elementary education are also more likely to be overweight or obese. 10.3 MICRONUTRIENT STATUS Causes and consequences of early childhood deficiencies have implications for later life and may be present as risk factors for future generations. Severe iron deficiency anemia during pregnancy may even place a woman’s life at risk during childbirth. Iron deficiency anemia and vitamin A deficiency (VAD) may also have significant implications for the newborn infant, born with low stores. VAD may increase morbidity and mortality risk, and affect vision, while anemia may lead to cognitive deficits. Iron Deficiency Anemia Iron deficiency is the most common micronutrient deficiency in the world, affecting more than 3.5 billion people in the developing world (ACC/SCN, 2000). Iron deficiency anemia occurs when iron stores are exhausted and the supply of iron to the tissues is compromised. The prevalence of anemia, de-fined by low hemoglobin or hematocrit, is commonly used to assess the severity of iron deficiency in a population. The hemoglobin cutoff used to define anemia in pregnant women and preschool children (6 months to 5 years) is 11 g/dl. The cutoff for nonpregnant women (including lactating women) is 12 g/dl of hemoglobin. Iron deficiency anemia is a severe stage of iron deficiency in which hemoglobin (or he-matocrit) falls below the cutoffs. Iron deficiency anemia is a major threat to safe motherhood: it contributes to low birth weight, lowered resistance to infection, poor cognitive development, and decreased work capacity. In children, iron deficiency anemia is associated with impaired cognitive performance, motor development, coordina-tion, language development, and scholastic achievement. Anemia increases morbidity from infectious diseases because it adversely affects several immune mechanisms. Hemoglobin testing is the primary method of anemia diagnosis. The JPFHS included direct measurement of hemoglobin levels in a subsample of one-fourth of all JPFHS households for children (6-59 months) and women (15-49 years). Hemoglobin measurements were taken in the field using the HemoCue system (HemoCue AB, Sweden). A drop of capillary blood taken from the finger (or from the heel in the case of infants under 6 months) is drawn in one continuous process directly into a reagent-coated microcuvette that serves as a blood collection device. Excess blood on the outside of the microcu-vette is wiped off and the filled microcuvette is inserted into a cuvette holder of a portable, battery-operated photometer. In less than a minute, hemoglobin concentration is indicated on a digital readout in grams per deciliter. About 76 percent of eligible children and 74 percent of all women age 15-49 were tested for hemoglobin levels. The remaining eligible children and women could not be measured because of various reasons such as not being available in the household at the time of interview. Before hemoglobin testing, a separate informed consent statement was read to the respondent explaining that participation in the hemoglobin testing was completely voluntary. This too could have led to refusals of testing by the mother for herself or her child. In some cases measurements were not taken if the children were too sick. However, since missing information is almost uniform by background characteristics for both children and women we can assume that the response rate has not caused any bias in the data. Prevalence of Anemia in Children Table 10.9 shows anemia levels for children 6-59 months. A total of 1,503 children were tested for anemia. The mild form of anemia is more prevalent (21 percent) than moderate anemia (13 percent), together contributing to the 34 percent of Jordanian children who have any anemia. The severe form of

Nutrition, Anemia, and Micronutrients │ 137
Table 10.9 Prevalence of anemia in children Percentage of children age 6-59 months classified as having anemia, by background charac-teristics, Jordan 2002 ––––––––––––––––––––––––––––––––––––––––––––––––––––––––––––––––––––––––––––– Percentage of children with anemia ––––––––––––––––––––––––––––––––––––– Mild Moderate Severe Number Background Any (10.0-10.9 (7.0-9.9 (below 7.0 of characteristic anemia g/dl) g/dl) g/dl) children ––––––––––––––––––––––––––––––––––––––––––––––––––––––––––––––––––––––––––––– Age in months 6-9 47.2 23.1 23.7 0.4 152 10-11 64.5 43.3 21.2 0.0 71 12-23 51.0 28.5 21.9 0.6 326 24-35 31.2 20.0 11.2 0.0 349 36-47 22.2 14.2 7.8 0.2 284 48-59 18.1 12.6 5.5 0.1 321 Sex Male 37.3 23.1 14.0 0.2 788 Female 30.8 17.8 12.7 0.3 715 Birth order2 1 28.6 16.3 12.3 0.0 293 2-3 35.3 21.6 13.3 0.4 561 4-5 35.1 21.2 13.6 0.3 365 6+ 35.4 22.5 12.8 0.0 258 Birth interval in months1 First birth2 29.2 15.9 13.0 0.3 301 <24 34.9 18.9 15.8 0.3 390 24-47 37.5 24.1 13.2 0.2 531 48+ 30.6 21.8 8.8 0.0 255 Residence Urban 32.4 20.2 12.1 0.1 1,139 Rural 39.9 21.9 17.5 0.5 364 Region Central 34.5 21.1 13.0 0.3 968 North 34.0 19.9 14.0 0.0 398 South 33.1 18.9 14.1 0.2 137 Mother’s education3 No education 36.9 12.4 24.5 0.0 62 Elementary 34.2 19.4 14.6 0.2 126 Preparatory 42.6 27.7 14.9 0.0 331 Secondary 31.9 18.4 13.2 0.2 617 Higher 28.9 19.9 8.6 0.5 350 Preparatory + secondary 35.6 21.7 13.8 0.1 948 Mother’s age3 15-19 (58.5) (29.3) (29.2) (0.0) 26 20-24 35.7 18.5 16.9 0.3 240 25-29 36.2 23.8 12.0 0.3 447 30-34 35.5 19.6 15.7 0.2 441 35-49 27.3 18.6 8.7 0.0 349 Children of interviewed mothers 33.9 20.6 13.1 0.2 1,477 Children of non-interviewed mothers4 (50.0) (18.6) (31.3) (0.0 ) 26 Total 34.2 20.6 13.4 0.2 1,503 ––––––––––––––––––––––––––––––––––––––––––––––––––––––––––––––––––––––––––––– Note: Table is based on children who stayed in the household the night before the interview.Prevalence is adjusted for altitude using CDC formulas (CDC, 1998). Figures in parenthses arebased on 25-49 unweighted cases. g/dl = grams per deciliter 1 Excludes children whose mothers were not interviewed 2 First born twins (triplets, etc.) are counted as first births because they do not have a previousbirth interval. 3 For women who are not interviewed, information is taken from the Household Questionnaire.Excludes children whose mothers are not listed in the household schedules 4 Includes children whose mothers are deceased

138 │ Nutrition, Anemia, and Micronutrients
anemia (<7 gm/dl) is not of public health significance in Jordan. Among infants, the highest level of ane-mia (65 percent) is found in the age group of 10-11 months, followed by 51 percent in the age group of 12-23 months. Thereafter, the level of anemia drops to 31 percent in children age 24-35 months, to about 22 percent in children age 36-47 months; it further decreases to 18 percent in preschool age children (48-59 months). UNICEF found that 20 percent of Jordanian children in the same age group were anemic (UNICEF/WHO, 1995). Mild to moderate anemia is more prevalent among males than females. Prevalence of anemia is also higher among higher birth order children, and highest in children that are born 24-47 months after a previous birth. There is a substantial difference in anemia rates among children by mother’s education. The rate of moderate anemia is higher among children born to mothers with no education. In general, children residing in rural areas have higher levels of anemia (both moderate and severe anemia). Also, younger mothers are more likely to have anemic children than older mothers. Regional variations in anemia levels are not significant. Prevalence of Anemia in Women and Iron Supplementation During Pregnancy Table 10.10 shows anemia levels among all women 15-49 years of age. Twenty-six percent of women in Jordan have some degree of anemia. About 20 percent have mild and six percent have moder-ate forms of anemia. UNICEF found that more than 28 percent of women in their childbearing age were anemic in Jordan (UNICEF/WHO, 1995), a prevalence similar to the one found in the current survey (26 percent). Age was associated with anemia levels, with women age 45-49 being more anemic than younger women. As was the situation with children, anemia is higher among women living in rural areas than ur-ban. Also, women with no education had higher levels of anemia (39 percent) than women with secon-dary and higher education (23 and 26 percent, respectively). In addition, the proportion of uneducated women with severe anemia is almost ten times greater than that for women with higher education. Preva-lence of anemia is slightly higher in the North region compared with the Central or South regions. Again, as in the case of children, severe anemia is not a significant public health problem among women in Jor-dan (Figure 10. 2). Among the ever-married women, 29 percent of women in Jordan have some degree of anemia. About 22 percent have mild and 7 percent have moderate forms of anemia. Pregnant women providing iron to the developing fetus are at greater risk for anemia than non-pregnant women. As expected, pregnant women had higher levels of anemia than lactating women and nonpregnant, nonlactating women. Parity was associated with anemia levels: women with 4 or more chil-dren have higher levels of anemia.

Nutrition, Anemia, and Micronutrients │ 139
Table 10.10 Prevalence of anemia in women Percentage of all women age 15-49 with anemia, by background characteristics, Jordan 2002 ––––––––––––––––––––––––––––––––––––––––––––––––––––––––––––––––––––––––– Anemia status –––––––––––––––––––––––––––––––––––––– Background Any Mild Moderate Severe Number characteristic anemia anemia anemia anemia of women ––––––––––––––––––––––––––––––––––––––––––––––––––––––––––––––––––––––––––––––––––
ALL WOMEN IN HOUSEHOLD –––––––––––––––––––––––––––––––––––––––––––––––––––––––––––––––––––––––––––––––––– Age 15-19 20.0 15.8 4.0 0.3 632 20-24 26.9 22.7 4.2 0.0 484 25-29 25.4 20.2 5.1 0.0 515 30-34 28.8 19.1 8.7 1.0 467 35-39 27.0 21.9 4.9 0.2 358 40-44 31.9 20.9 10.6 0.4 261 45-49 33.0 26.3 6.6 0.0 183 Residence Urban 25.6 20.1 5.3 0.1 2,255 Rural 28.7 20.3 7.7 0.8 645 Region Central 25.0 19.2 5.6 0.2 1,870 North 29.2 22.2 6.6 0.4 768 South 27.0 21.2 5.6 0.2 262 Educational level attended1 No education 39.0 23.6 13.4 2.0 129 Elementary 33.6 24.8 8.4 0.3 288 Preparatory 26.5 20.9 5.2 0.3 526 Secondary 23.3 18.5 4.8 0.1 1,275 Higher 26.2 20.1 5.9 0.2 681 Preparatory + secondary 24.3 19.2 4.9 0.2 1,801 Total 26.3 20.2 5.8 0.3 2,900 –––––––––––––––––––––––––––––––––––––––––––––––––––––––––––––––––––––––––
INTERVIEWED EVER-MARRIED WOMEN ––––––––––––––––––––––––––––––––––––––––––––––––––––––––––––––––––––––––– Children ever born None 22.1 16.8 5.0 0.3 148 1 24.8 18.0 6.8 0.0 200 2-3 27.6 22.4 5.0 0.2 530 4-5 32.6 25.2 7.3 0.2 468 6+ 31.1 22.9 8.3 0.0 504 Pregnancy/breastfeeding status Pregnant 37.0 23.5 13.4 0.1 228 Breastfeeding 27.4 23.5 3.9 0.0 386 Neither 28.2 21.8 6.3 0.2 1,236 Using IUD Yes 30.1 21.2 8.8 0.0 407 No 28.8 22.6 6.0 0.2 1,442 Total 29.1 22.3 6.7 0.1 1,849 ––––––––––––––––––––––––––––––––––––––––––––––––––––––––––––––––––––––––––––––––– Note: Table is based on women who stayed in the household the night before the interview.Prevalence is adjusted for altitude using CDC formulas (CDC, 1998). Women with <7.0 g/dl(grams per deciliter) of hemoglobin have severe anemia, women with 7.0-9.9 g/dl have moderateanemia, and pregnant women with 10.0-10.9 g/dl and nonpregnant women with 10.0-11.9 g/dlhave mild anemia. 1For women who are not interviewed, information is taken from the Household Questionnaire.

140 │ Nutrition, Anemia, and Micronutrients
Figure 10.2 Prevalence of Anemia in Children and Women
2122
13
7
0 0
Children Women0
5
10
15
20
25
Perc
ent
Mild anemia Moderate anemia Severe anemia
JPFHS 2002
Table 10.11 shows the prevalence of anemia for children according to the anemia status of their mothers. Among children of mothers with moderate anemia, about 2 percent have severe anemia and 19 percent have moderate anemia. Similarly, among children of mothers with mild anemia, 22 percent have mild and 17 percent have moderate levels of anemia.
Table 10.11 Prevalence of anemia in children by anemia status of mother Percentage of children age 6-59 months classified as having anemia, by anemia statusof mother, Jordan 2002 ––––––––––––––––––––––––––––––––––––––––––––––––––––––––––––––––––––––––– Anemia status of child ––––––––––––––––––––––––––––––––––– Number Any Mild Moderate Severe of Anemia status of mother anemia anemia anemia anemia children ––––––––––––––––––––––––––––––––––––––––––––––––––––––––––––––––––––––––– Any anemia 38.6 20.9 17.3 0.4 438 Anemia status Mild anemia 38.9 22.1 16.6 0.1 338 Moderate anemia 37.8 16.9 19.4 1.5 101 Total 34.1 20.8 13.0 0.2 1,460 ––––––––––––––––––––––––––––––––––––––––––––––––––––––––––––––––––––––––– Note: Table is based on children who stayed in the household the night before theinterview. Prevalence is adjusted for altitude using CDC formulas (CDC, 1998).Women with <7.0 g/dl (grams per deciliter) of hemoglobin have severe anemia,women with 7.0-9.9 g/dl have moderate anemia, and pregnant women with 10.0-10.9g/dl and nonpregnant women with 10.0-11.9 g/dl have mild anemia.

Nutrition, Anemia, and Micronutrients │ 141
Pregnant women are the highest risk group for anemia, as the gap between the requirements for iron and intake during pregnancy cannot be filled by diet alone. This is the group most in need of sup-plementation. Twenty-eight percent of women did not consume iron supplements during pregnancy (Ta-ble 10.12). About one in six women took iron supplements for two months during pregnancy; 9 percent took them for three months; and 46 percent took iron supplements for more than three months during pregnancy.
First-time mothers took iron tablets or syrup more often than mothers who have had 2 or more children. Women residing in urban areas and in the Central region (including Amman) were more likely to take iron supplements for 90 days or more. Also, mother’s education had a positive impact on taking iron supplements during pregnancy for three months or more.
Table 10.12 Intake of iron supplements during pregnancy Percent distribution of women with a birth in the five years preceding the survey who took iron tablets orsyrup for specific number of days, by background characteristics, Jordan 2002 –––––––––––––––––––––––––––––––––––––––––––––––––––––––––––––––––––––––––––––––––––––––––– Number of days iron tablets/ syrup taken during pregnancy ––––––––––––––––––––––––––––––––––––––––––––––––––– Don’t NumberBackground know/ of characteristic None <60 60-89 90+ missing Total women ––––––––––––––––––––––––––––––––––––––––––––––––––––––––––––––––––––––––––––––––––––––––––Age at birth <20 30.6 16.1 5.9 47.4 0.0 100.0 171 20-24 24.8 18.5 10.4 45.4 0.9 100.0 799 25-29 27.6 15.2 8.0 47.3 1.9 100.0 1,148 30-34 27.7 13.8 9.2 48.6 0.7 100.0 959 35-49 29.3 16.9 10.3 42.5 1.0 100.0 667 Number of children ever born 1 18.8 17.2 8.9 54.8 0.3 100.0 555 2-3 24.9 17.1 8.8 48.1 1.1 100.0 1,338 4-5 29.0 15.6 9.4 44.5 1.6 100.0 1,011 6+ 35.5 13.6 9.5 40.3 1.1 100.0 839 Residence Urban 24.9 14.6 9.1 50.1 1.3 100.0 2,931 Rural 36.6 20.6 9.3 32.8 0.6 100.0 812 Region Central 22.6 13.9 8.3 53.8 1.5 100.0 2,378 North 34.6 20.4 11.0 33.4 0.6 100.0 1,001 South 39.8 16.5 9.5 33.8 0.5 100.0 364 Educational level attended No education 48.1 17.3 6.7 25.7 2.3 100.0 149 Elementary 42.3 12.2 9.6 35.7 0.2 100.0 306 Preparatory 36.3 15.3 7.2 39.6 1.5 100.0 741 Secondary 25.3 16.7 9.2 47.6 1.2 100.0 1,539 Higher 16.6 16.1 10.7 55.7 0.9 100.0 1,008 Preparatory + secondary 28.9 16.3 8.5 45.0 1.3 100.0 2,280 Total 27.5 15.9 9.1 46.4 1.1 100.0 3,743 ––––––––––––––––––––––––––––––––––––––––––––––––––––––––––––––––––––––––––––––––––––––––––Note: For women with two or more live births in the five-year period, data refer to the most recent birth.

142 │ Nutrition, Anemia, and Micronutrients
Table 10.13 Intake of fruits and vegetables rich in vita-min A among children Percentage of youngest children under age three livingwith the mother who consumed fruits and vegetablesrich in vitamin A in the seven days preceding the survey,by background characteristics, Jordan 2002 ––––––––––––––––––––––––––––––––––––––––––––––– Consumed fruits and vegetables Number Background rich in of characteristic vitamin A1 children –––––––––––––––––––––––––––––––––––––––––––––––Age in months <6 2.2 483 6-9 26.7 437 10-11 41.7 218 12-23 46.7 1,020 24-35 55.9 712 Sex Male 39.3 1,441 Female 36.8 1,430 Birth order 1 35.1 496 2-3 39.7 1,060 4-5 39.1 728 6+ 36.3 586 Breastfeeding status Breastfeeding 22.4 1,271 Not breastfeeding 50.4 1,599 Residence Urban 40.1 2,249 Rural 30.8 622 Region Central 40.5 1,820 North 33.6 769 South 34.7 282 Mother’s education No education 28.5 103 Elementary 36.1 228 Preparatory 35.4 563 Secondary 35.5 1,225 Higher 46.1 752 Preparatory + secondary 35.5 1,788 Mother’s age at birth <20 28.4 148 20-24 38.0 670 25-29 40.2 871 30-34 36.5 714 35-49 39.5 468 Total 38.1 2,871 –––––––––––––––––––––––––––––––––––––––––––––1 Includes pumpkin, carrots, red sweet potatoes, greenleafy vegetables, apricot, palm nuts, yellow melon, andother locally grown fruits and vegetables that are rich invitamin A
Vitamin A Vitamin A is an essential micronutrient for the normal functioning of the visual system, for growth and development, for maintenance of epithelial cellular integrity, for immune function, and for reproduction. VAD occurs when body stores are depleted to the extent that physiological functions are impaired. At first, the integrity of epithelial barriers is impaired and the immune function system becomes compromised, followed by impairment of the visual system. Conse-quently, there is increased severity of infections and an increased risk of death, especially among children. Improving the vitamin A status of young children reduces mortality rates. VAD is linked to the nature of foods available and feeding practices, rather than to geochemical or other conditions affecting whole populations of geographic areas. Table 10.13 shows the percentage of children less than three years of age who consumed foods rich in vitamin A in the seven days preceding the survey. Thirty-eight percent of children consumed foods rich in vitamin A and vegetables. Consumption of foods rich in vitamin A increases with age. Children who are not breastfed consume more foods rich in vitamin A than breastfed children. Consumption is highest in urban areas and in the Central region of Jordan. Mother’s education and mother’s age are strongly associated with increased intake of foods rich in vitamin A among children.