Embed Size (px)
Citation preview

Nutrition Perspectivesin Children and Youth with Special Health Care Needs (CYSHCN)
Corine Neumiller, RDCorine Neumiller, RDPediatric Pulmonary Center Pediatric Pulmonary Center Tucson, Arizona Tucson, Arizona 20062006
Describe characteristics of CYSHCNDescribe characteristics of CYSHCN
Be familiar with various assessment Be familiar with various assessment techniques techniques
Identify nutrition concerns for CYSHCNIdentify nutrition concerns for CYSHCN
– Asthma, Cystic Fibrosis
Understand family-centered approaches to Understand family-centered approaches to developing a nutrition care plandeveloping a nutrition care plan
Review family centered nutritionReview family centered nutrition care care through case studythrough case study
Learning Objectives

Definition
Children and Youth with Children and Youth with
Special Health Care Needs Special Health Care Needs
(CYSHCN)(CYSHCN)
Children who have or are at risk for chronic physical, developmental, behavioral or emotional conditions and who also require health and related services of a type or amount beyond that required by children generally.
MCHB, Div of Services for CSHCN
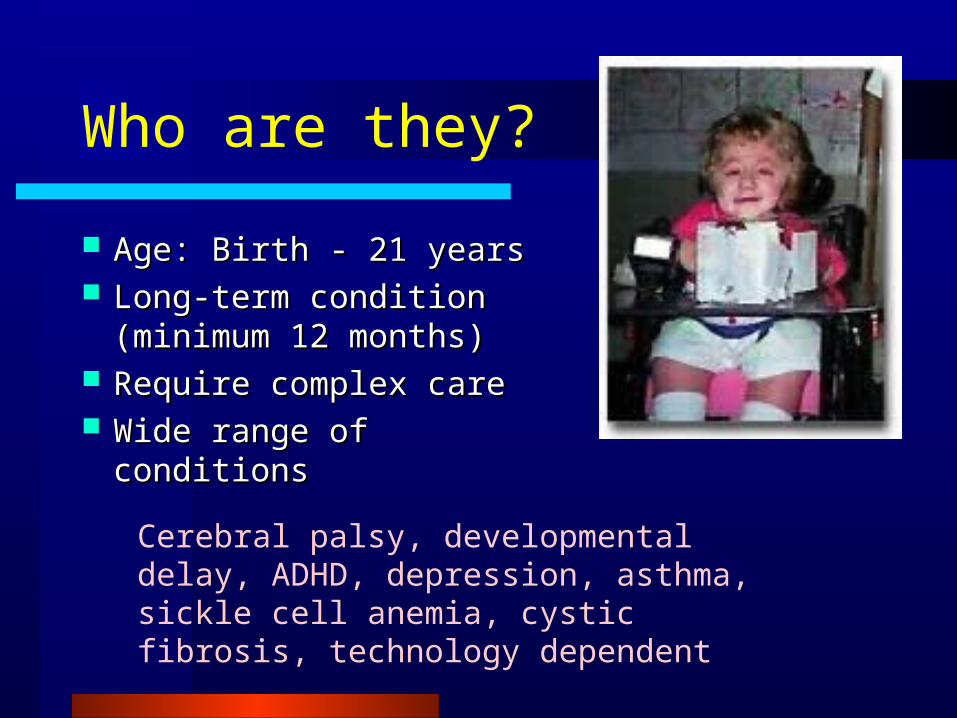
Who are they?
Age: Birth - 21 yearsAge: Birth - 21 years Long-term condition Long-term condition
(minimum 12 months)(minimum 12 months) Require complex care Require complex care Wide range of conditions Wide range of conditions
Cerebral palsy, developmental delay, ADHD, depression, asthma, sickle cell anemia, cystic fibrosis, technology dependent
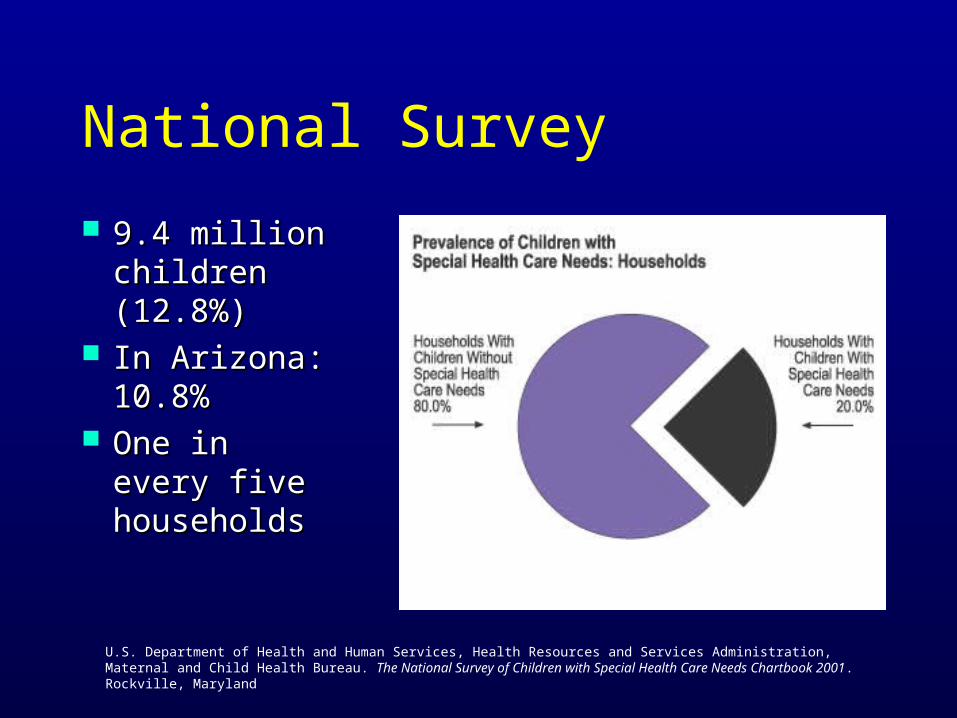
National Survey
9.4 million 9.4 million children children (12.8%)(12.8%)
In Arizona: In Arizona: 10.8% 10.8%
One in One in every five every five householdhouseholdss
U.S. Department of Health and Human Services, Health Resources and Services Administration, Maternal and Child Health Bureau. The National Survey of Children with Special Health Care Needs Chartbook 2001. Rockville, Maryland

Common Perspective
They all share the consequences of their conditions, such as reliance on medications or therapies, special educational services, or assistive devices or equipment.
Nutritional Consequences
On average, 40% of CYSHCN at risk for On average, 40% of CYSHCN at risk for nutrition problemsnutrition problems
Early nutrition screeningEarly nutrition screening– 92% met one criterion for nutrition referral
– 68% met two or more criterion
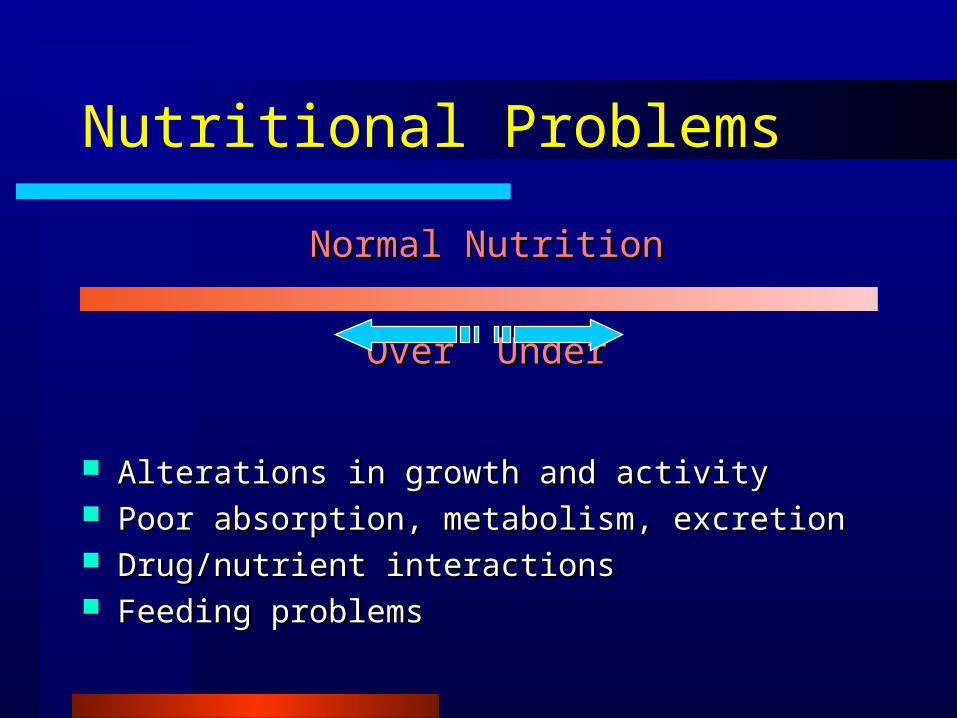
Nutritional Problems
Normal NutritionNormal Nutrition
OverOver UnderUnder
Alterations in growth and activityAlterations in growth and activity Poor absorption, metabolism, excretionPoor absorption, metabolism, excretion Drug/nutrient interactionsDrug/nutrient interactions Feeding problemsFeeding problems
Assessing Nutrition Status

Nutritional Status
WeightWeight– Primary indicator for
over-/under- nutrition Growth chartGrowth chart
– Reflection of growth pattern
TechniqueTechnique– Key to consistency
and accuracy

Growth & Development
HeightHeight– Slower response to nutrition changes– Indicator of undernutrition
when measurements continually trend down
TechniqueTechnique – Recumbent
length (0-36 mo)– Standing
height (2-20 yrs)
Growth & Development
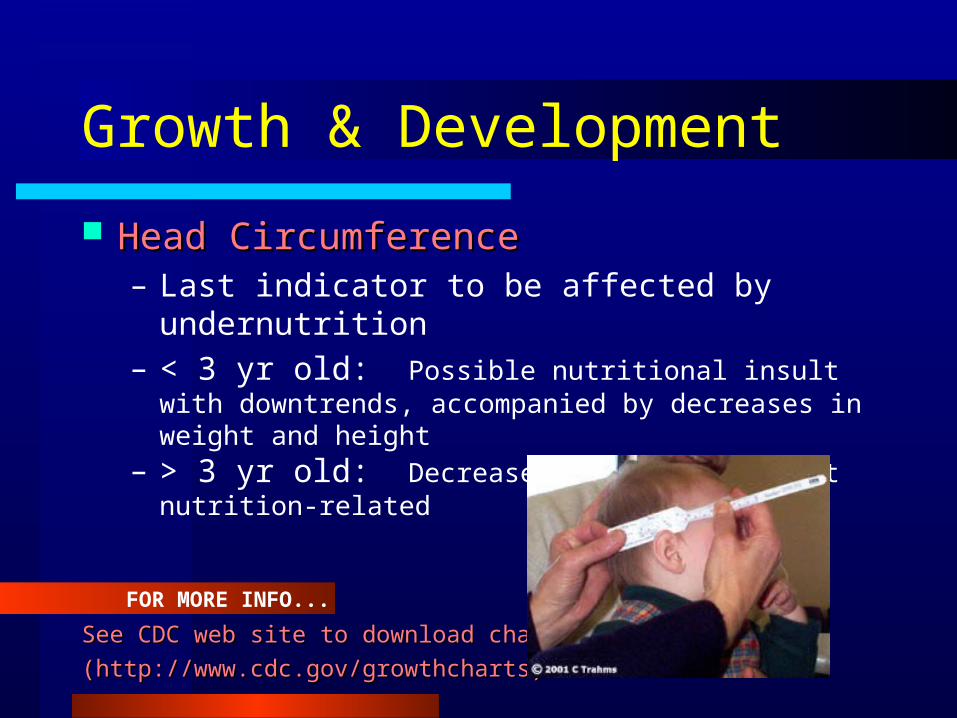
Head CircumferenceHead Circumference– Last indicator to be affected by undernutrition– < 3 yr old: Possible nutritional insult with
downtrends, accompanied by decreases in weight and height
– > 3 yr old: Decreases are generally not nutrition-related
See CDC web site to download chartsSee CDC web site to download charts
(http://www.cdc.gov/growthcharts)(http://www.cdc.gov/growthcharts)
FOR MORE INFO...

Assessment Skills
Subjective Global Assessment (SGA)Subjective Global Assessment (SGA)– Simple technique for assessing nutritional
status– Evaluates body fat and muscle stores– Involves visual review of physical body – May be applied by any healthcare worker

SGA
Fat StoresFat Stores– Eye fat pad– Cheek pad– Tricep pinch
Detsky, A, et al. JPEN. Detsky, A, et al. JPEN.
11:8, Jan/Feb, 1987.11:8, Jan/Feb, 1987.
REFERENCE:
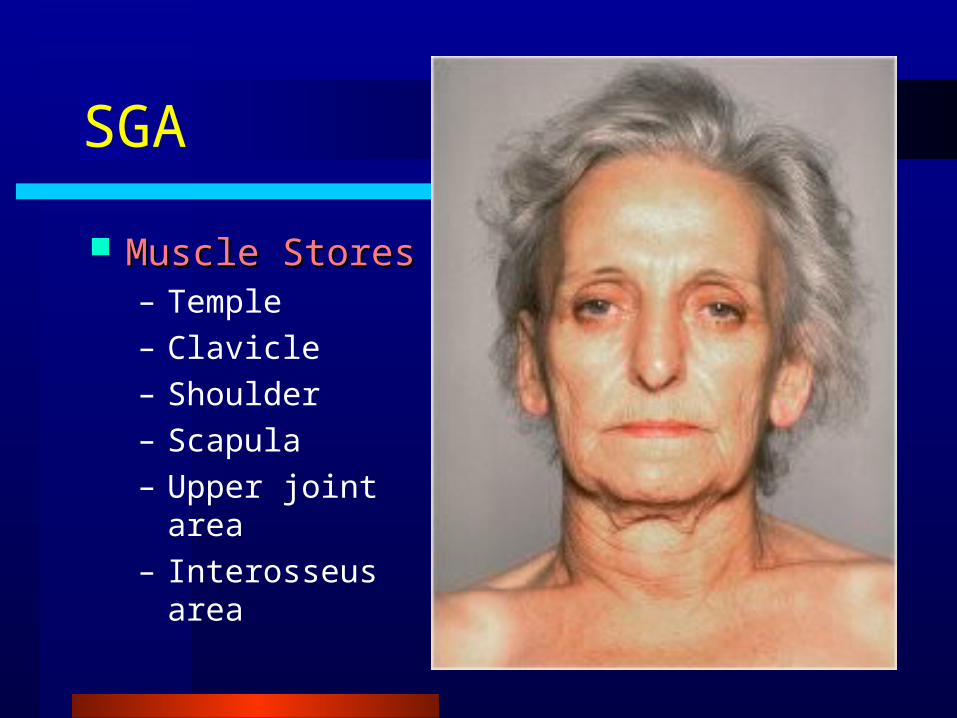
SGA
Muscle StoresMuscle Stores– Temple– Clavicle– Shoulder– Scapula– Upper joint area– Interosseus area

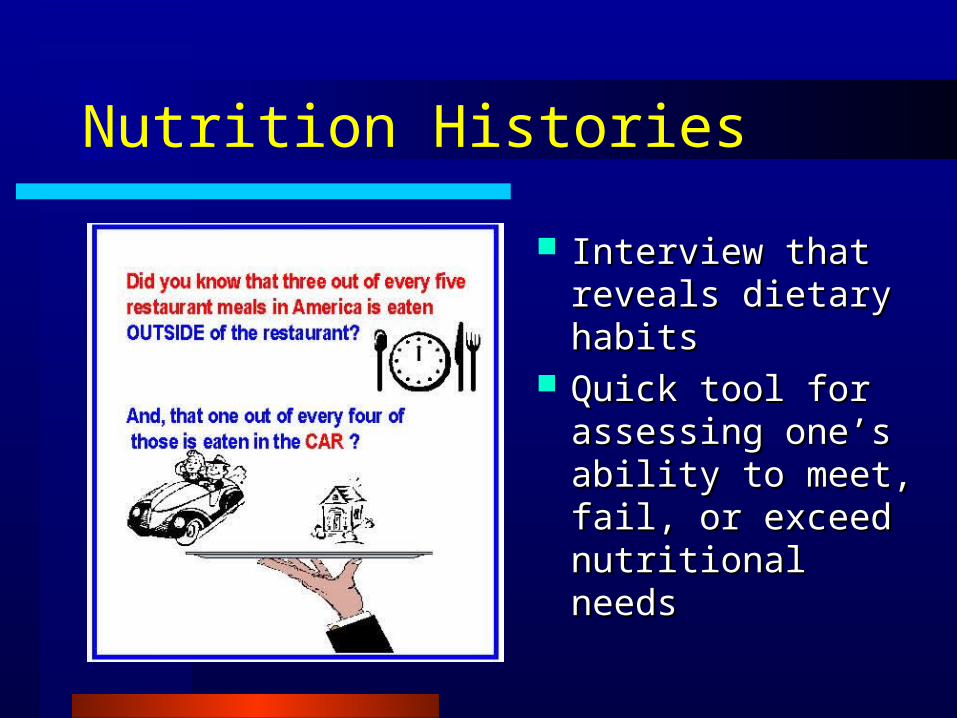
Nutrition Histories
Interview that Interview that reveals dietary reveals dietary habitshabits
Quick tool for Quick tool for assessing one’s assessing one’s ability to meet, ability to meet, fail, or exceed fail, or exceed nutritional needsnutritional needs

What would you ask?
What is the home life/meal What is the home life/meal pattern? pattern?
How much is consumed? How much is consumed?
Who is present at mealtimes? Who is present at mealtimes?
Food allergies or intolerances?Food allergies or intolerances?
Is the child interested in eating?Is the child interested in eating?
Any weight change perceived? Any weight change perceived?
Any problems with chewing, Any problems with chewing, swallowing, gagging or choking?swallowing, gagging or choking?
What religious or cultural What religious or cultural backgrounds are present?backgrounds are present?

Childhood Obesity
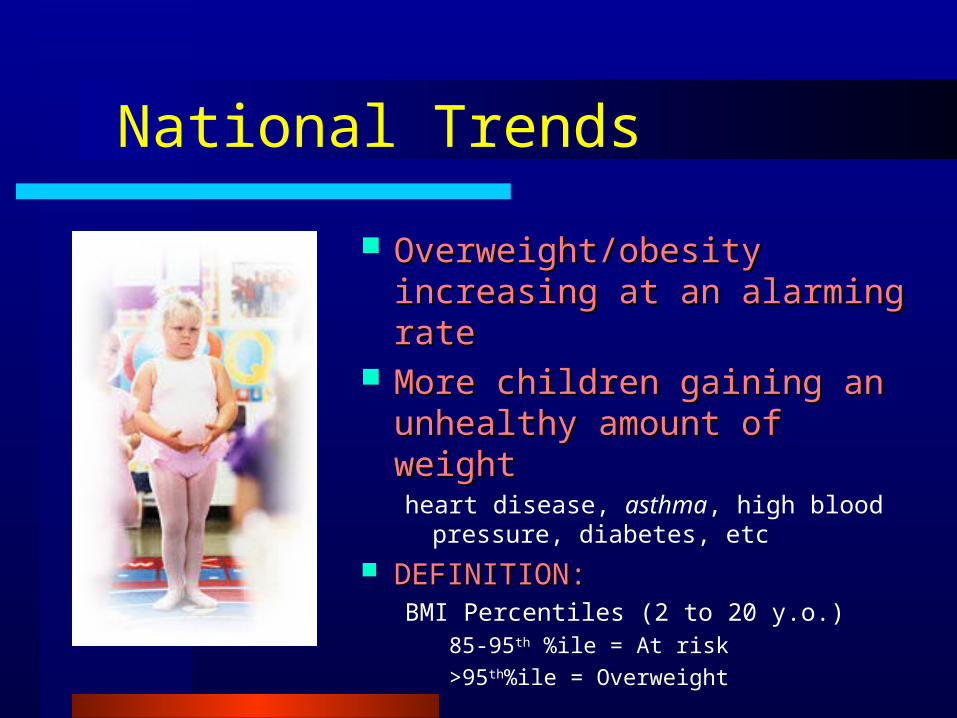
Overweight/obesity Overweight/obesity increasing at an alarming increasing at an alarming raterate
More children gaining an More children gaining an unhealthy amount of weightunhealthy amount of weightheart disease, asthma, high blood
pressure, diabetes, etc DEFINITION:DEFINITION:
BMI Percentiles (2 to 20 y.o.)85-95th %ile = At risk>95th%ile = Overweight
National Trends
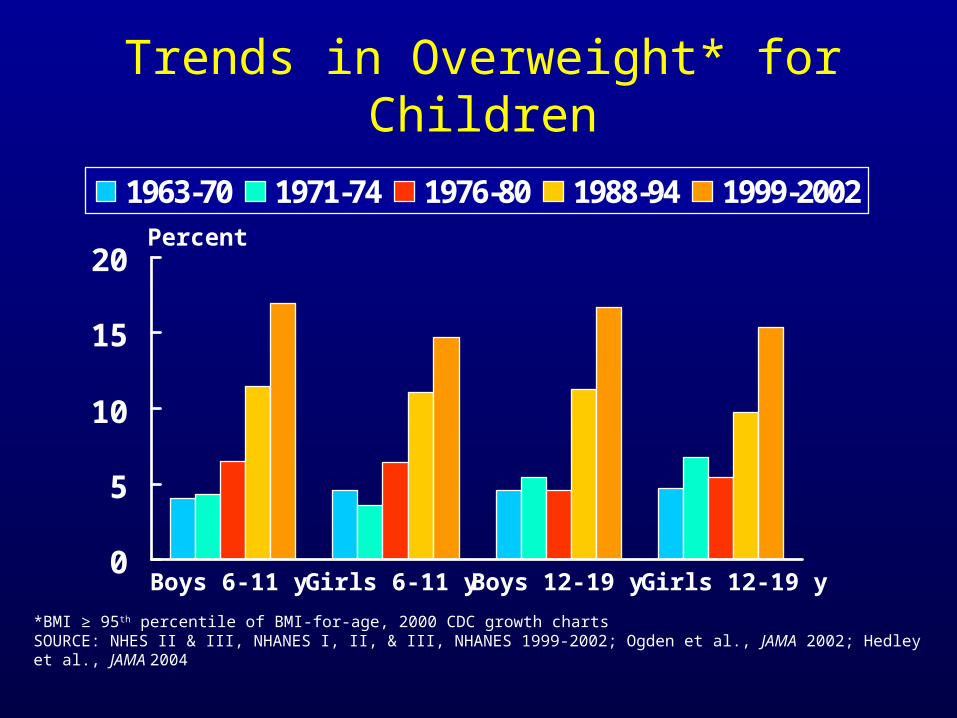
Trends in Overweight* for Children
0
5
10
15
20
1963-70 1971-74 1976-80 1988-94 1999-2002Percent
*BMI ≥ 95th percentile of BMI-for-age, 2000 CDC growth chartsSOURCE: NHES II & III, NHANES I, II, & III, NHANES 1999-2002; Ogden et al., JAMA 2002; Hedley et al., JAMA 2004
Boys 6-11 y Girls 6-11 yBoys 12-19 y Girls 12-19 y
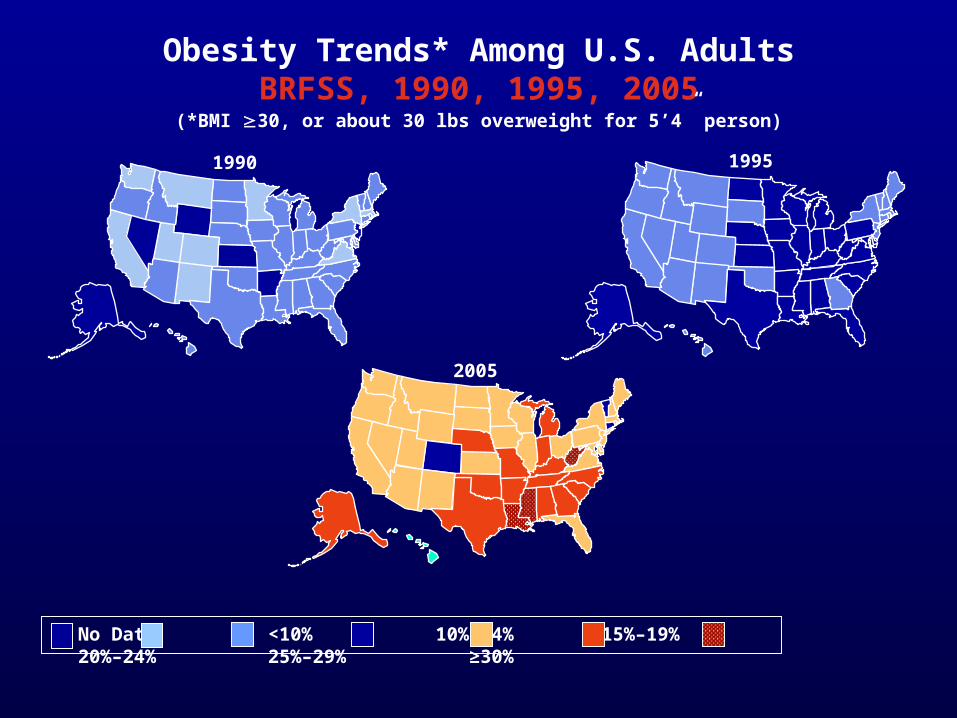
1995
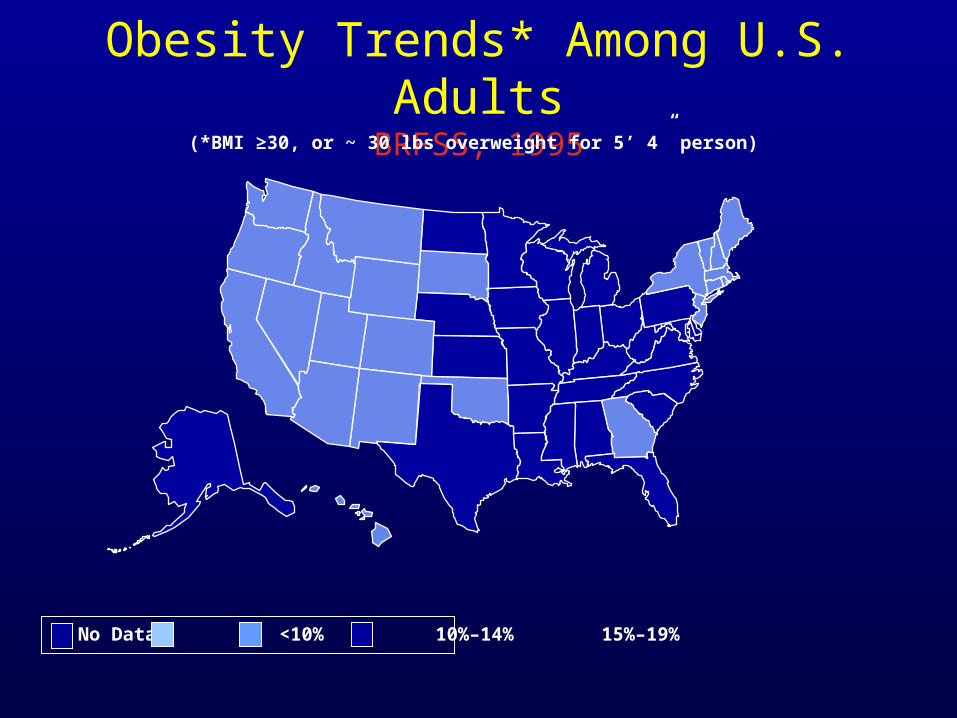
Obesity Trends* Among U.S. AdultsBRFSS, 1990, 1995, 2005
(*BMI 30, or about 30 lbs overweight for 5’4” person)
2005
1990
No Data <10% 10%–14% 15%–19% 20%–24% 25%–29% ≥30%
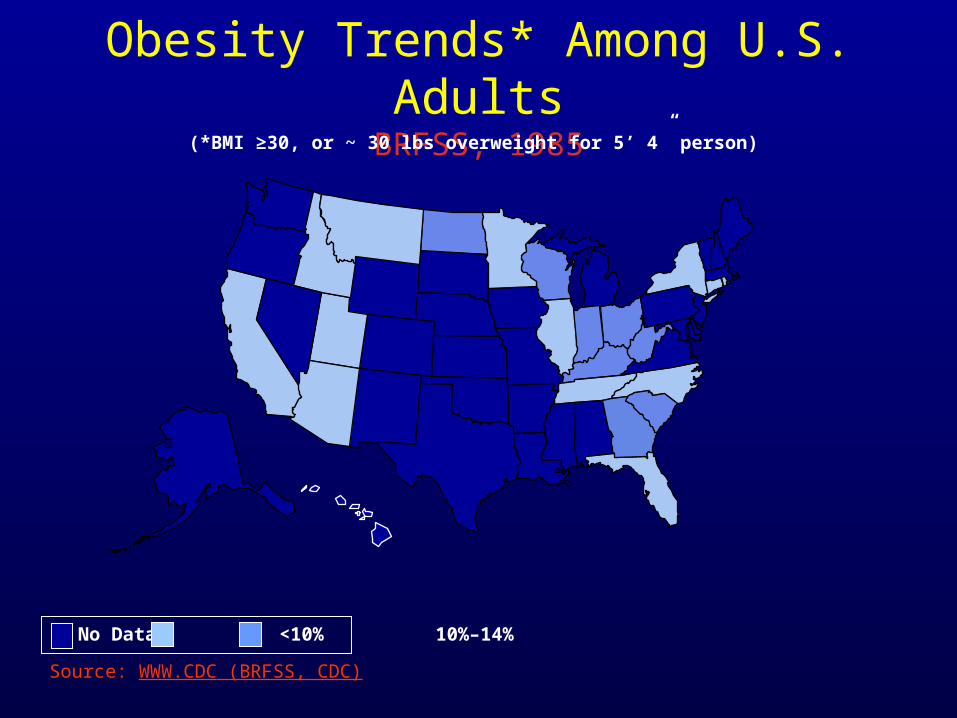
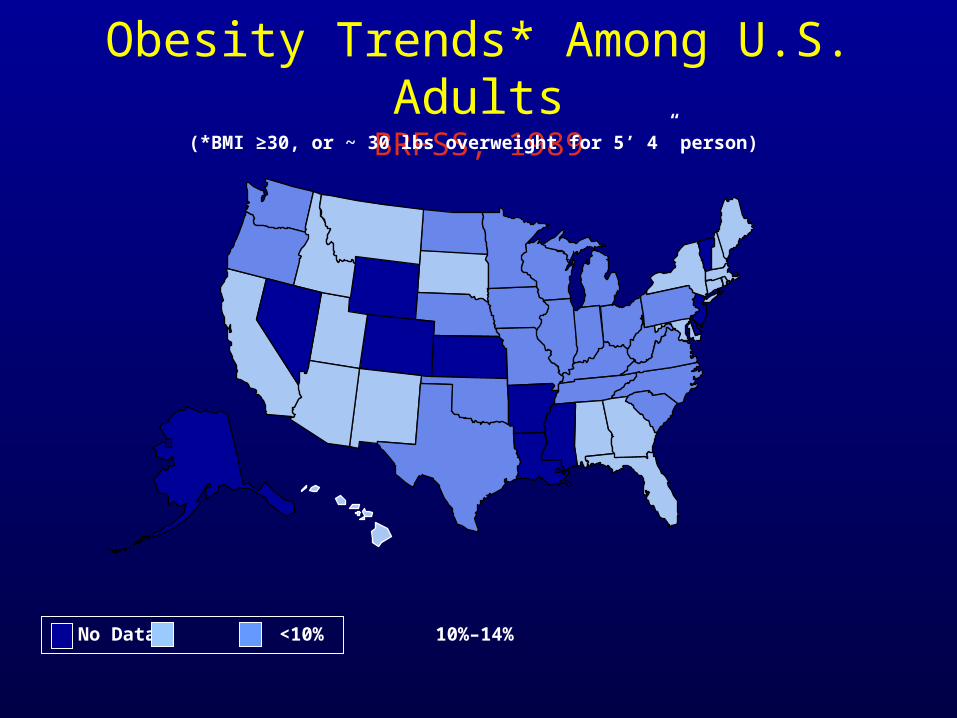
Obesity Trends* Among U.S. AdultsBRFSS, 1985
(*BMI ≥30, or ~ 30 lbs overweight for 5’ 4” person)
No Data <10% 10%–14%
Source: WWW.CDC (BRFSS, CDC)

Obesity Trends* Among U.S. AdultsBRFSS, 1986
(*BMI ≥30, or ~ 30 lbs overweight for 5’ 4” person)
No Data <10% 10%–14%

Obesity Trends* Among U.S. AdultsBRFSS, 1987
(*BMI ≥30, or ~ 30 lbs overweight for 5’ 4” person)
No Data <10% 10%–14%

Obesity Trends* Among U.S. AdultsBRFSS, 1988
(*BMI ≥30, or ~ 30 lbs overweight for 5’ 4” person)
No Data <10% 10%–14%
Obesity Trends* Among U.S. AdultsBRFSS, 1989
(*BMI ≥30, or ~ 30 lbs overweight for 5’ 4” person)
No Data <10% 10%–14%

Obesity Trends* Among U.S. AdultsBRFSS, 1990
(*BMI ≥30, or ~ 30 lbs overweight for 5’ 4” person)
No Data <10% 10%–14%

Obesity Trends* Among U.S. AdultsBRFSS, 1991
(*BMI ≥30, or ~ 30 lbs overweight for 5’ 4” person)
No Data <10% 10%–14% 15%–19%
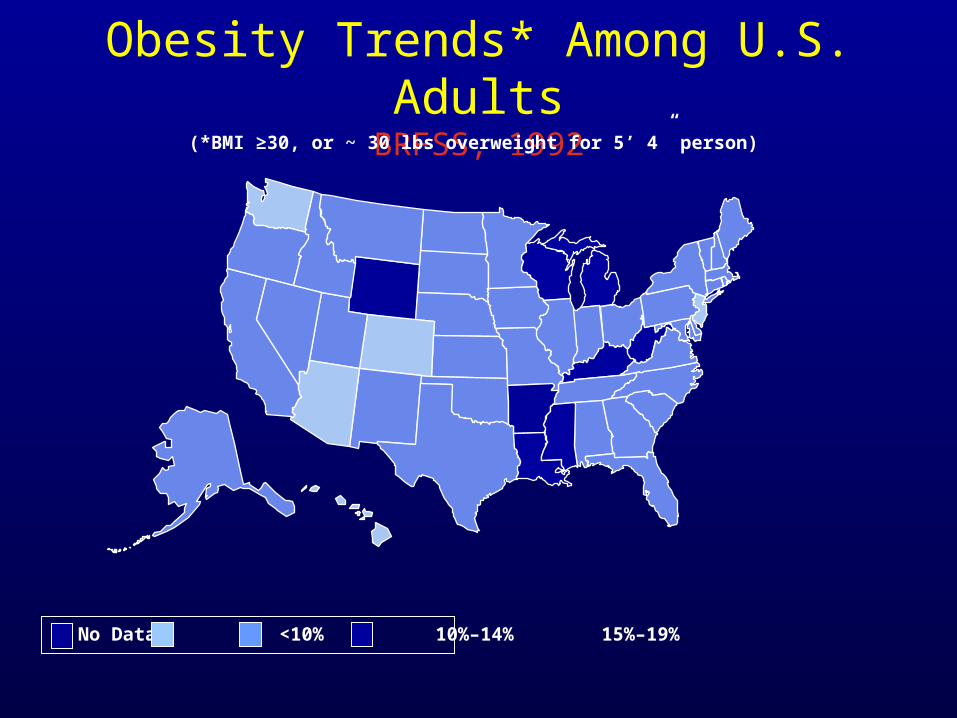
Obesity Trends* Among U.S. AdultsBRFSS, 1992
(*BMI ≥30, or ~ 30 lbs overweight for 5’ 4” person)
No Data <10% 10%–14% 15%–19%
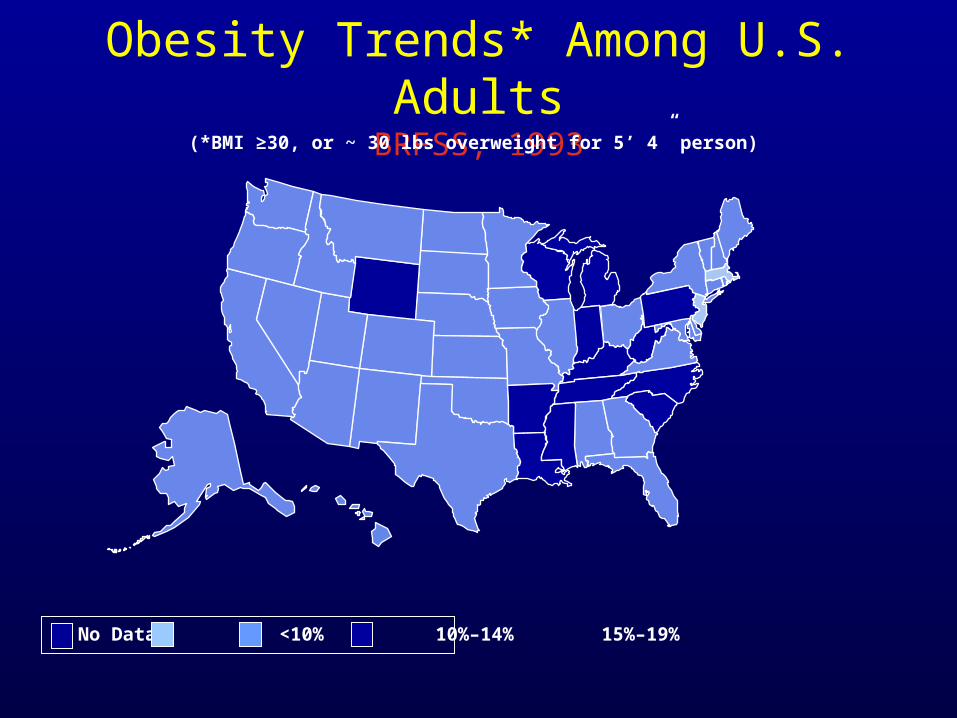
Obesity Trends* Among U.S. AdultsBRFSS, 1993
(*BMI ≥30, or ~ 30 lbs overweight for 5’ 4” person)
No Data <10% 10%–14% 15%–19%
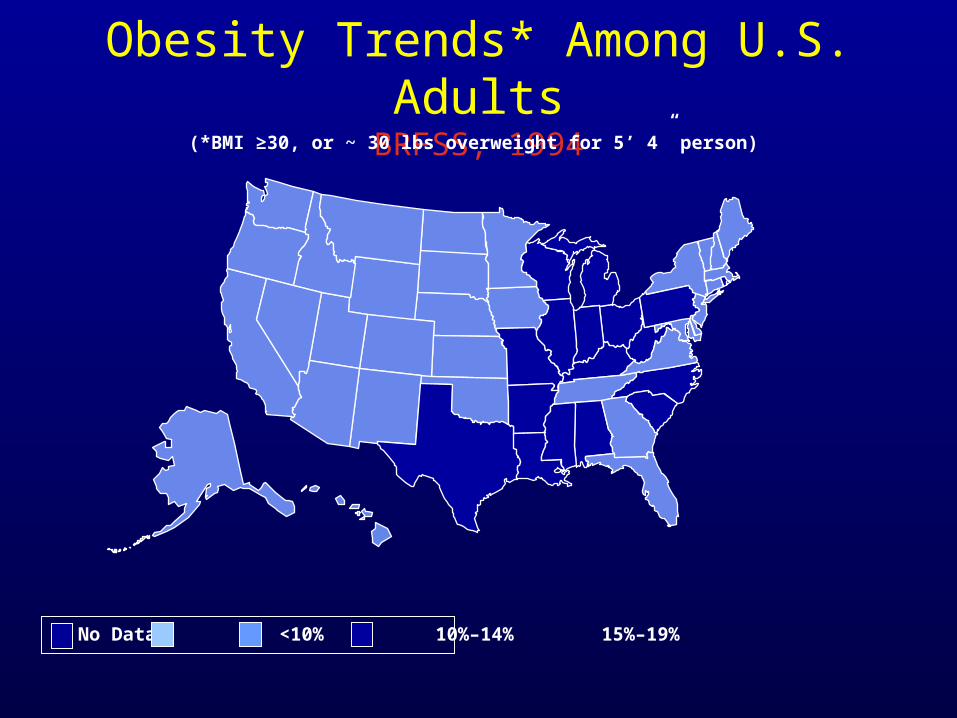
Obesity Trends* Among U.S. AdultsBRFSS, 1994
(*BMI ≥30, or ~ 30 lbs overweight for 5’ 4” person)
No Data <10% 10%–14% 15%–19%
Obesity Trends* Among U.S. AdultsBRFSS, 1995
(*BMI ≥30, or ~ 30 lbs overweight for 5’ 4” person)
No Data <10% 10%–14% 15%–19%

Obesity Trends* Among U.S. AdultsBRFSS, 1996
(*BMI ≥30, or ~ 30 lbs overweight for 5’ 4” person)
No Data <10% 10%–14% 15%–19%

Obesity Trends* Among U.S. AdultsBRFSS, 1997
(*BMI ≥30, or ~ 30 lbs overweight for 5’ 4” person)
No Data <10% 10%–14% 15%–19% ≥20%

Obesity Trends* Among U.S. AdultsBRFSS, 1998
(*BMI ≥30, or ~ 30 lbs overweight for 5’ 4” person)
No Data <10% 10%–14% 15%–19% ≥20%

Obesity Trends* Among U.S. AdultsBRFSS, 1999
(*BMI ≥30, or ~ 30 lbs overweight for 5’ 4” person)
No Data <10% 10%–14% 15%–19% ≥20%
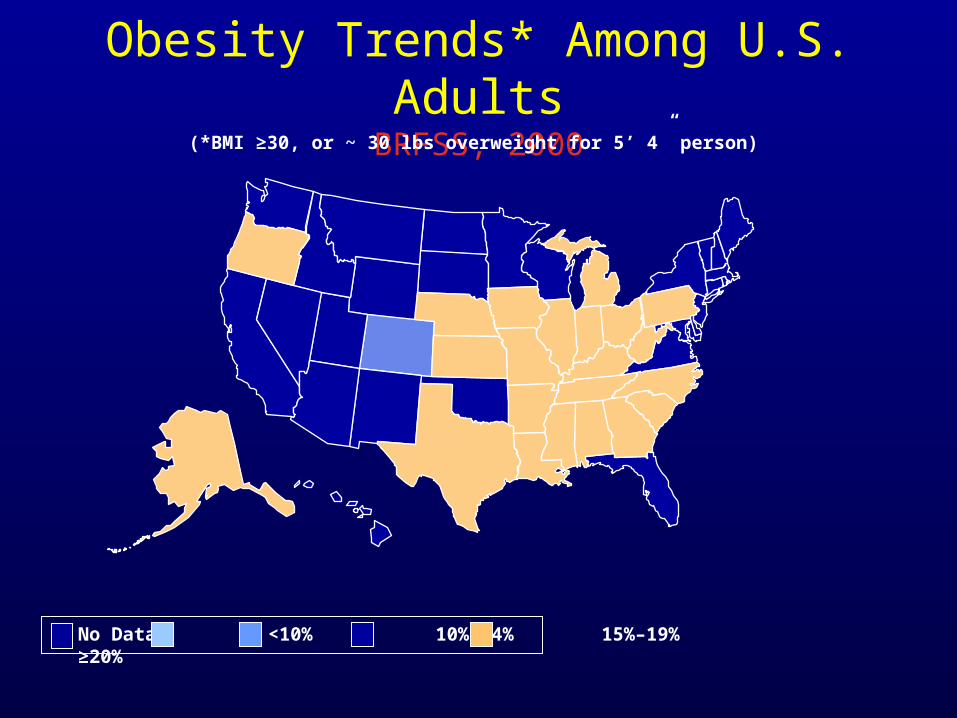
Obesity Trends* Among U.S. AdultsBRFSS, 2000
(*BMI ≥30, or ~ 30 lbs overweight for 5’ 4” person)
No Data <10% 10%–14% 15%–19% ≥20%

Obesity Trends* Among U.S. AdultsBRFSS, 2001
(*BMI ≥30, or ~ 30 lbs overweight for 5’ 4” person)
No Data <10% 10%–14% 15%–19% 20%–24% ≥25%

(*BMI ≥30, or ~ 30 lbs overweight for 5’ 4” person)
No Data <10% 10%–14% 15%–19% 20%–24% ≥25%
Obesity Trends* Among U.S. AdultsBRFSS, 2002

Obesity Trends* Among U.S. AdultsBRFSS, 2003
(*BMI ≥30, or ~ 30 lbs overweight for 5’ 4” person)
No Data <10% 10%–14% 15%–19% 20%–24% ≥25%
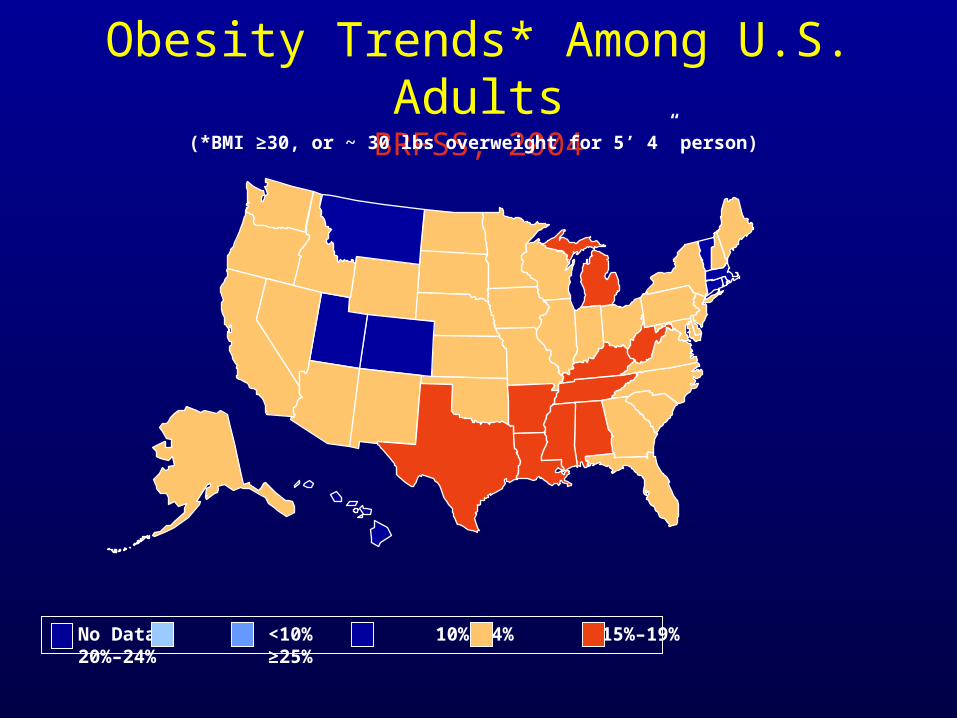
Obesity Trends* Among U.S. AdultsBRFSS, 2004
(*BMI ≥30, or ~ 30 lbs overweight for 5’ 4” person)
No Data <10% 10%–14% 15%–19% 20%–24% ≥25%

Obesity Trends* Among U.S. AdultsBRFSS, 2005
(*BMI ≥30, or ~ 30 lbs overweight for 5’ 4” person)
No Data <10% 10%–14% 15%–19% 20%–24% 25%–29% ≥30%

Something’s wrong...

Why the increase?% Change in Mean Intake of Beverages, Children 6-11 Years Old
Carbonated soda
Milk
Fruit juice
Fruit drinks
0% % increase% decrease
-39%
54%
69%
137%
431
261 258
109
1977-78 2001-02
gram
s
Milk Soda
SOURCE: L. Cleveland USDA; NFCS 1977-78 and WWEIA, NHANES 2001-02, 1 day
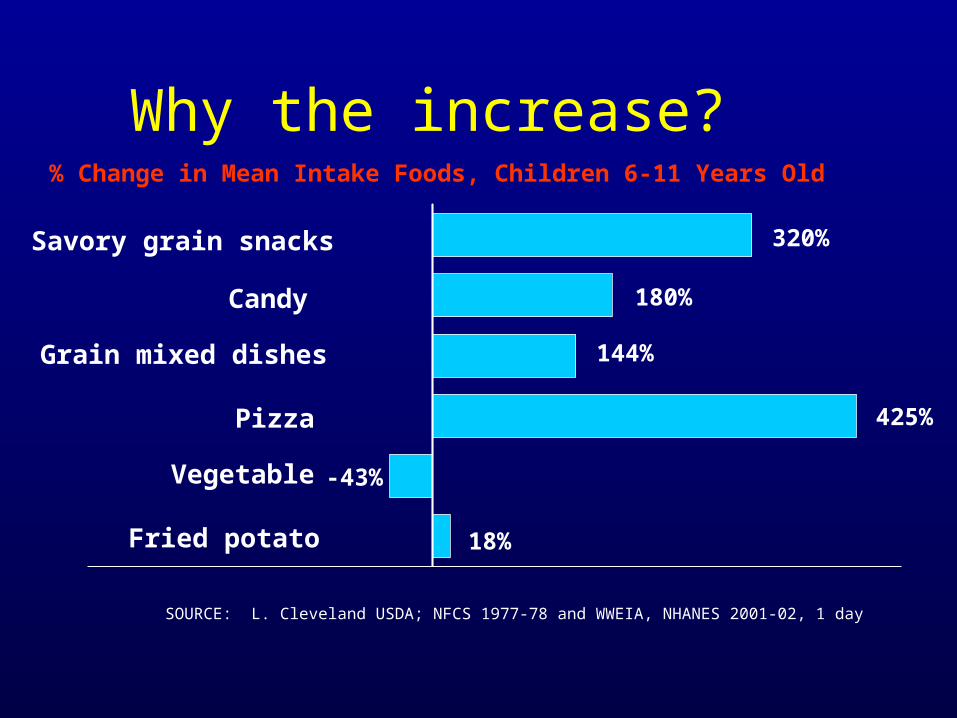
Why the increase?% Change in Mean Intake Foods, Children 6-11 Years Old
Fried potato
Savory grain snacks
Grain mixed dishes
Pizza
Candy
Vegetable-43%
320%
144%
425%
18%
180%
SOURCE: L. Cleveland USDA; NFCS 1977-78 and WWEIA, NHANES 2001-02, 1 day

National Trends
BEGIN EARLY interventionBEGIN EARLY intervention Prevention of excess Prevention of excess
weight gain may decrease weight gain may decrease asthma-related morbidityasthma-related morbidity
Obesity will soon overtake Obesity will soon overtake tobacco as chief cause of tobacco as chief cause of preventable deaths in USpreventable deaths in US -CDC-CDC
Asthma and Obesity
Simultaneous Simultaneous increases in increases in obesity and obesity and asthmaasthma
What came first:Obesity or Asthma?
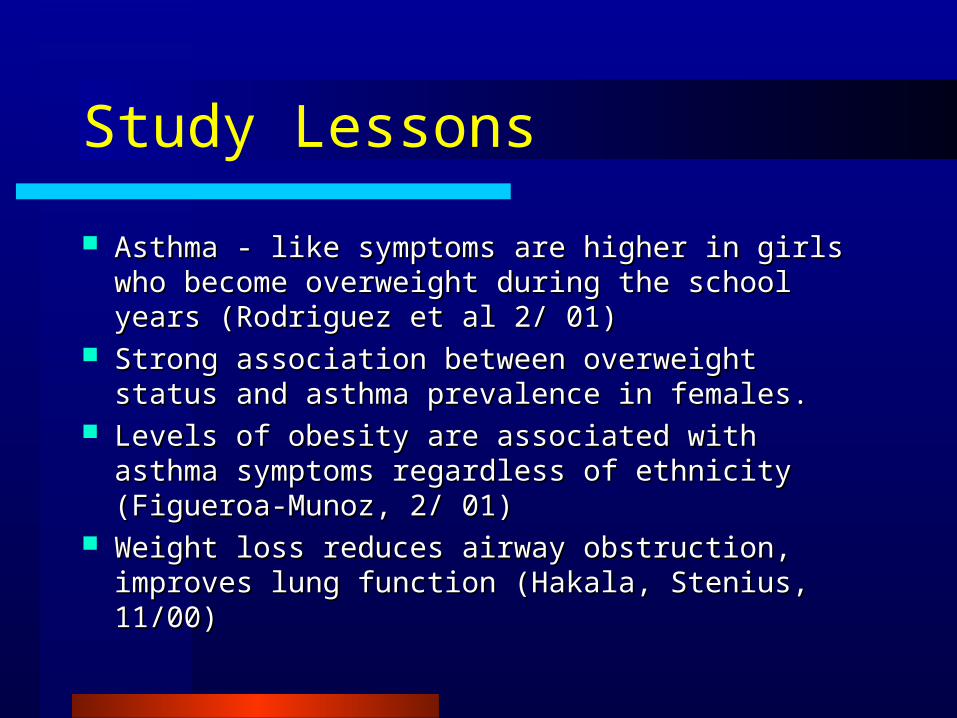
Study Lessons
Asthma - like symptoms are higher in girls who Asthma - like symptoms are higher in girls who become overweight during the school years become overweight during the school years (Rodriguez et al 2/ 01)(Rodriguez et al 2/ 01)
Strong association between overweight status Strong association between overweight status and asthma prevalence in females.and asthma prevalence in females.
Levels of obesity are associated with asthma Levels of obesity are associated with asthma symptoms regardless of ethnicity (Figueroa-symptoms regardless of ethnicity (Figueroa-Munoz, 2/ 01)Munoz, 2/ 01)
Weight loss reduces airway obstruction, Weight loss reduces airway obstruction, improves lung function (Hakala, Stenius, 11/00)improves lung function (Hakala, Stenius, 11/00)

Treatment
Diet Diet ManagementManagement
Physical ActivityPhysical Activity
Behavior Behavior ModificationModification

Nutrition Therapy
DietDiet
– Consume a healthy, balanced diet – Avoid excessive salt, fat, sweets – Avoid skipping meals – Emphasize fluid intake– Change behavior if weight loss needed

CalciumCalcium– For increased risk of growth delay with hi
dose corticosteroids– Absorption enhanced with 800 IU Vit D– Foods rich in calcium
• Dairy, fortified orange juice, tofu, raisins, sardines, salmon with bones, dark green, leafy vegetables, calcium supplementation, mineral water
Supplemental Nutrients

AntioxidantsAntioxidants– Vitamins A,C, E = may have protective effect– Low dietary intake = ?decreased lung function
Omega 3 Fatty AcidsOmega 3 Fatty Acids– May be effective in reducing asthma
symptoms– May even reduce risk of developing asthma in
children– Foods with omega-3 fatty acids
• oily fish (salmon, tuna, orange roghy, mullet, and rainbow trout), flaxseed, soybean oil, canola oil, and dark green, leafy vegetables, or supplements
Supplemental Nutrients
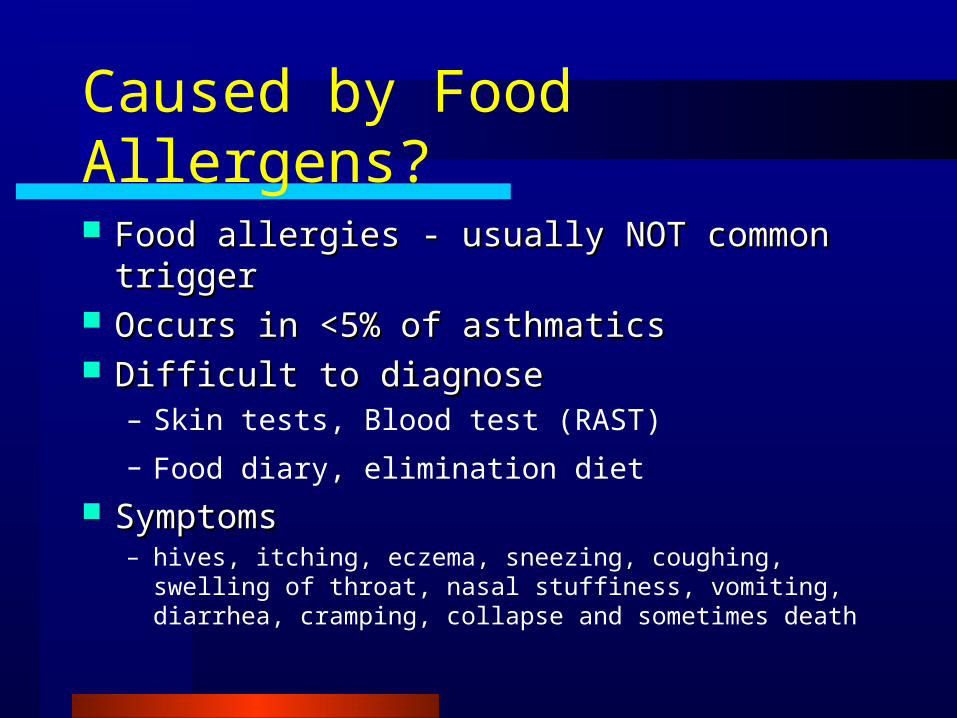
Caused by Food Allergens?
Food allergies - usually NOT common Food allergies - usually NOT common triggertrigger
Occurs in <5% of asthmaticsOccurs in <5% of asthmatics Difficult to diagnoseDifficult to diagnose
– Skin tests, Blood test (RAST)
– Food diary, elimination diet SymptomsSymptoms
– hives, itching, eczema, sneezing, coughing, swelling of throat, nasal stuffiness, vomiting, diarrhea, cramping, collapse and sometimes death
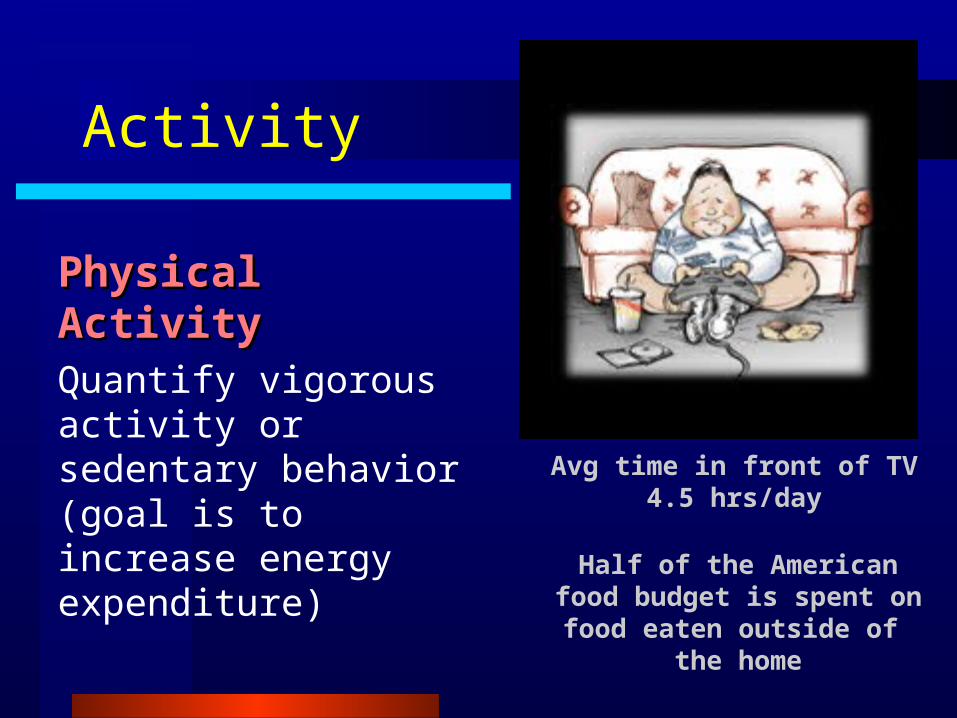
Activity
Physical ActivityPhysical ActivityQuantify vigorous activity or sedentary behavior (goal is to increase energy expenditure)
Avg time in front of TV4.5 hrs/day
Half of the American food budget is spent on food eaten outside of
the home

Asthma & Exercise
Aerobic activity 3 Aerobic activity 3 times per weektimes per week
Avoid asthma Avoid asthma triggers triggers
May lessen May lessen Exercise Induced Exercise Induced Asthma (EIB)Asthma (EIB)
Tips•Check local pollen, mold, spore levels.
•Lengthen the time between breaks while conditioning occurs.
•Wear scarves over mouth and nose in winter to keep heat & moisture in lungs.
•Warm-up to lessen chances of EIB.
•Do pursed lip breathing when medication is not readily available.

Childhood Malnutrition
Cystic Fibrosis
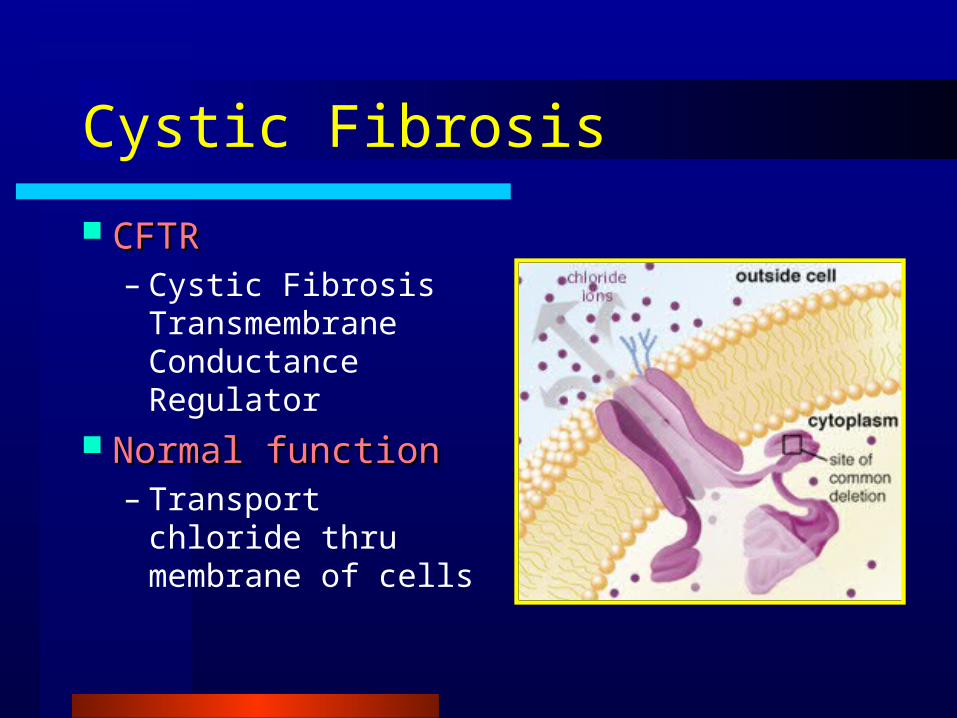
CFTR CFTR – Cystic Fibrosis
Transmembrane Conductance Regulator
Normal functionNormal function– Transport chloride
thru membrane of cells

Normal CFTR
– When the Cl leaves the cell, an imbalance is created which draws water out of the cell through osmosis.
– Water keeps mucus moist, prevents infection.

Abnormal CFTR
Cl cannot leave cell Water movement
diminishes Mucus thickens

Primary Problem = “Clogging”

In the Lungs
Cilia cannot beat properly
Bacteria collect Chronic
infection occurs Chronic
inflammation damages airway
Bronchiectasis, respiratory failure results and often leads to death
The GI Tract in CF
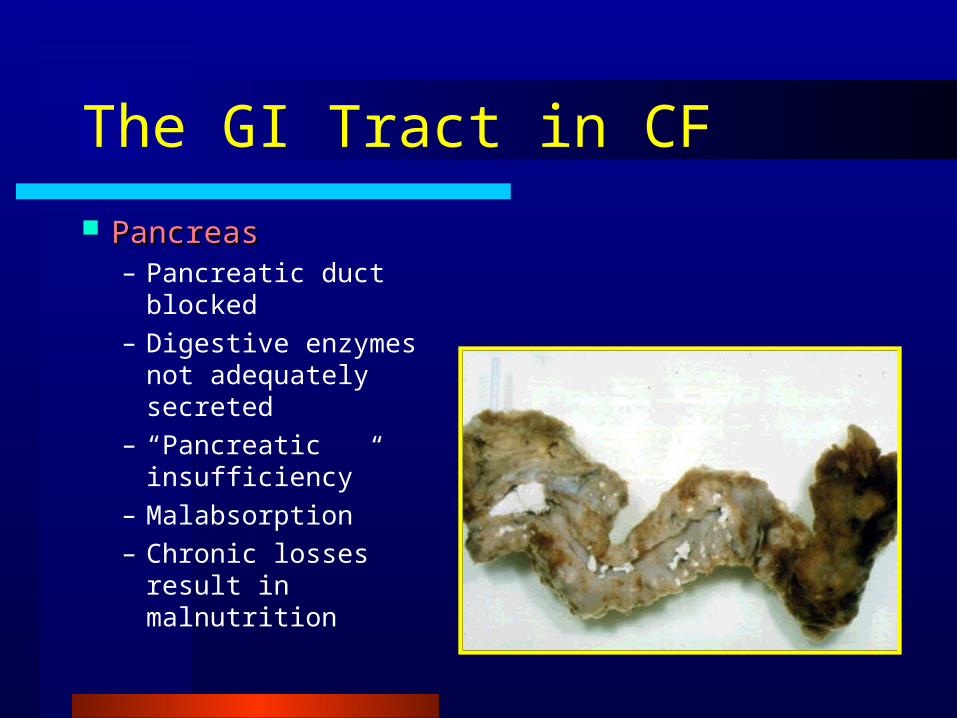
PancreasPancreas– Pancreatic duct
blocked– Digestive enzymes
not adequately secreted
– “Pancreatic insufficiency”
– Malabsorption– Chronic losses result
in malnutrition

The GI Tract in CF
Cystic Fibrosis Related Diabetes Cystic Fibrosis Related Diabetes (CFRD)(CFRD)Leading comorbidity associated with CF•Prevalence increases with age
3-12% are reported to have diabetes•14% of CF patients >14 years old•25% of CF patients 35-44 years old
Average age of onset 18-21 y/oFemales > Males
Survival
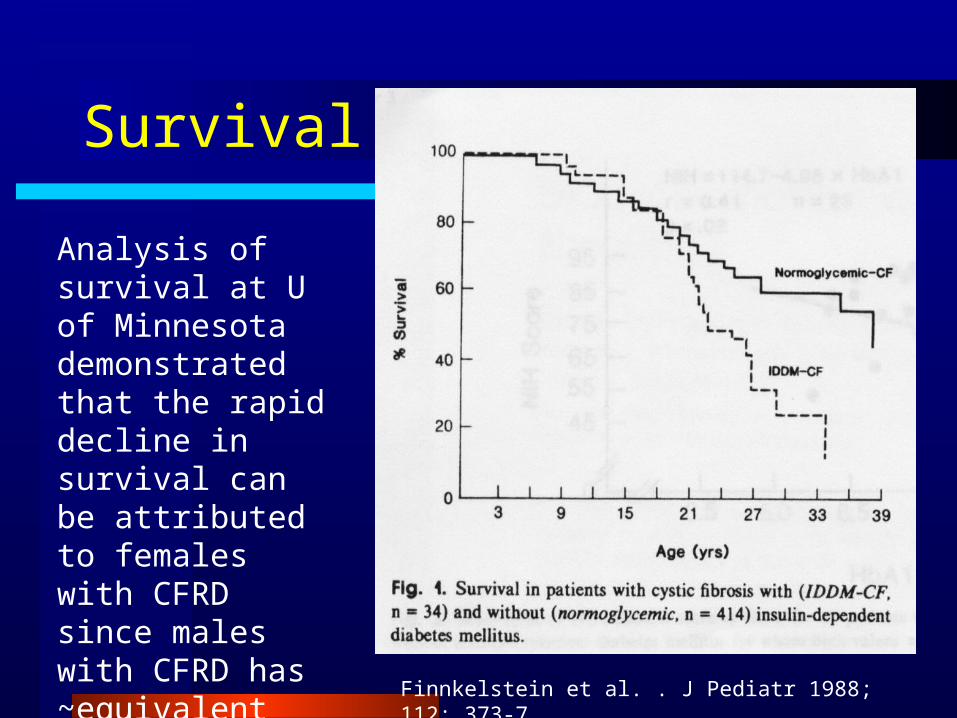
Finnkelstein et al. . J Pediatr 1988; 112: 373-7
Analysis of survival at U of Minnesota demonstrated that the rapid decline in survival can be attributed to females with CFRD since males with CFRD has ~equivalent suvival rates to males without CFRD

The GI Tract in CF
IntestinesIntestines– Meconium Ileus
• Sticky bits of mucus/intestinal cells preventing baby from having first BM within first 2 days after birth
– Distal Intestinal Obstruction Syndrome (DIOS)
• Non-infant version of meconium ileus• Causes: dehydration, diet, hx mec
ileus, too few or too many enzymes
– Fibrosing Colonopathy– Rectal Prolapse

The GI Tract in CF
StomachStomach– Increased Acidity
EsophagusEsophagus– GERD, Esophagitis– Aspiration
LiverLiver– Fatty Liver– Blocked Bile Duct
GallbladderGallbladder
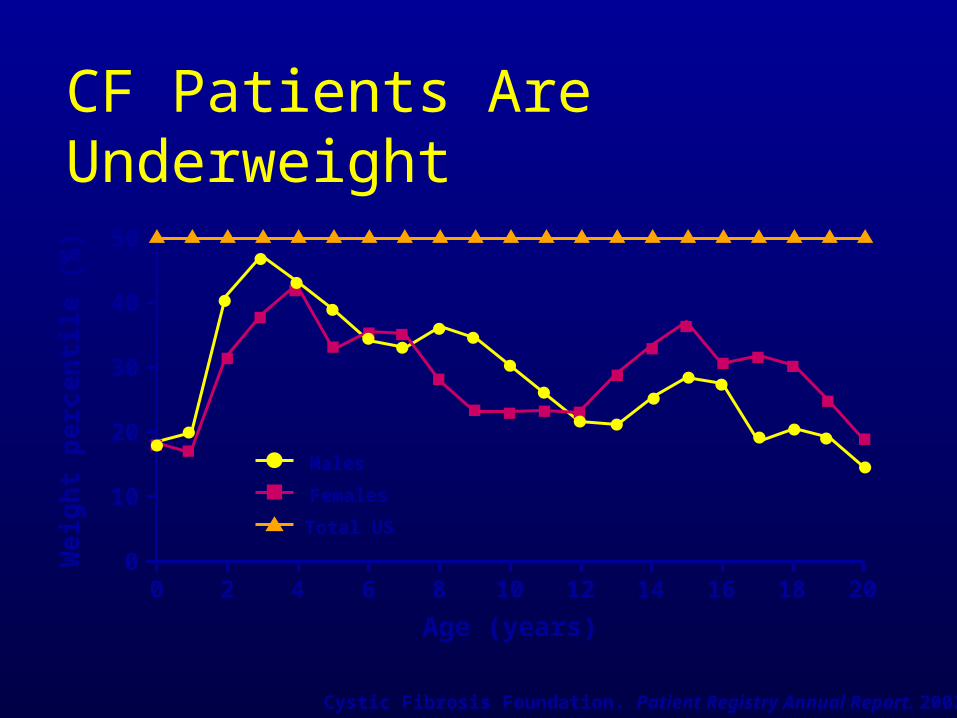
CF Patients Are Underweight
0 2 4 6 8 10 12 14 16 18 200
10
20
30
40
50
Age (years)
We
igh
t p
erc
en
tile
(%
)
Cystic Fibrosis Foundation. Patient Registry Annual Report. 2002.
Males
Females
Total US
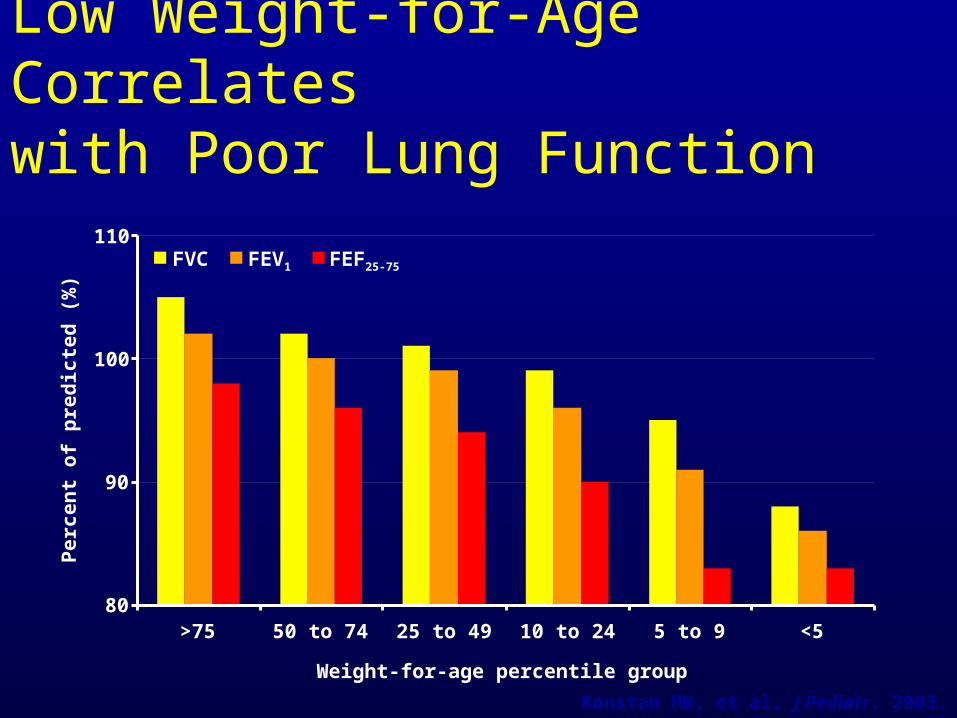
Low Weight-for-Age Correlates with Poor Lung Function
Konstan MW, et al. J Pediatr. 2003.
80
90
100
110
>75 50 to 74 25 to 49 10 to 24 5 to 9 <5
Weight-for-age percentile group
Pe
rce
nt
of
pre
dic
ted
(%
)
FVC FEV1 FEF25-75

New Data from PortCF
Makes an association between Makes an association between FEVFEV11 and BMIand BMI
- Children: >200,000 data points- Adults: >60,000 data points

Males - FEV1 Percent Predicted vs BMI %ile
Age:
404550556065707580859095
100
<5 5 10 15 20 25 30 35 40 45 50 55 60 65 70 75 80 85 90 95+
BMI Percentile
FEV
1 %
pre
dict
ed
6 to 9 10 to 12 13 to 17 18 to 20
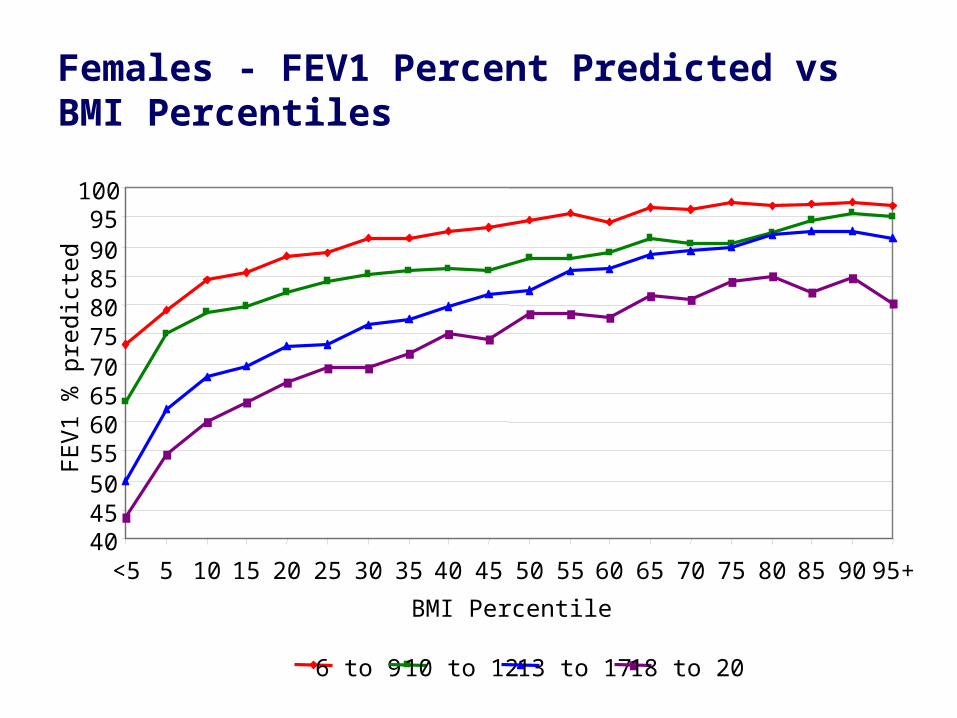
Females - FEV1 Percent Predicted vs BMI Percentiles
Age:
404550556065707580859095
100
<5 5 10 15 20 25 30 35 40 45 50 55 60 65 70 75 80 85 90 95+
BMI Percentile
FEV
1 %
pre
dict
ed
6 to 9 10 to 12 13 to 17 18 to 20

The CF Diet
Basic Diet PrescriptionBasic Diet Prescription1. High calorie (moderate fat), high protein2. Snacks 2-3 times/day3. Salt repletion, especially with sweating4. Fat soluble vitamins in water miscible form
SupplementationSupplementation– Calorically dense– Oral or enteral
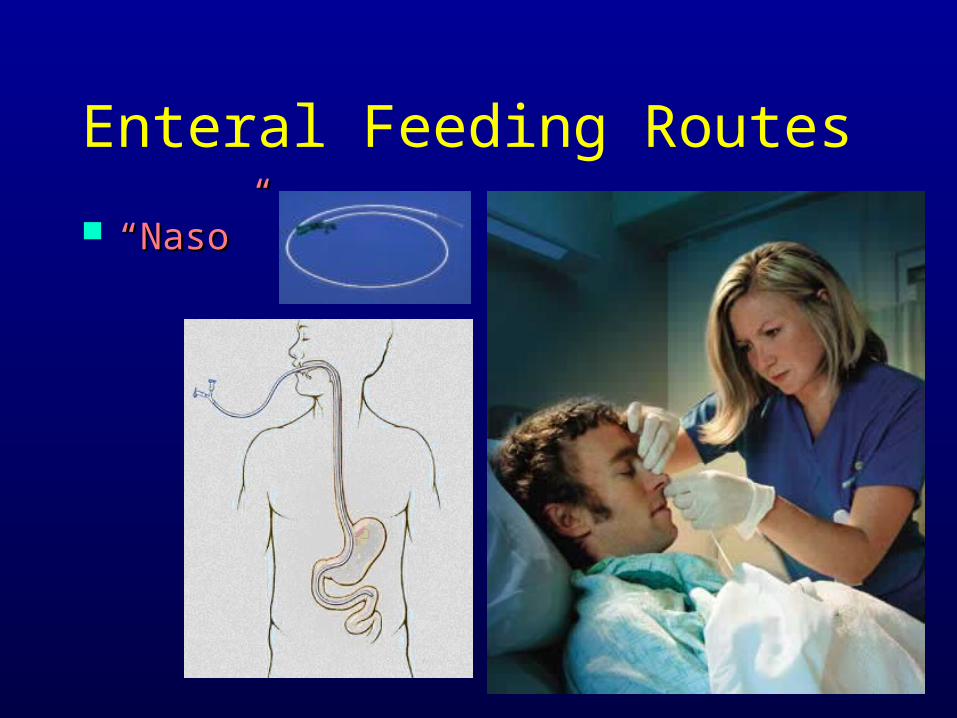
Enteral Feeding Routes
““Naso” - Naso” -

Enteral Feeding Routes
- “ostomy”- “ostomy”
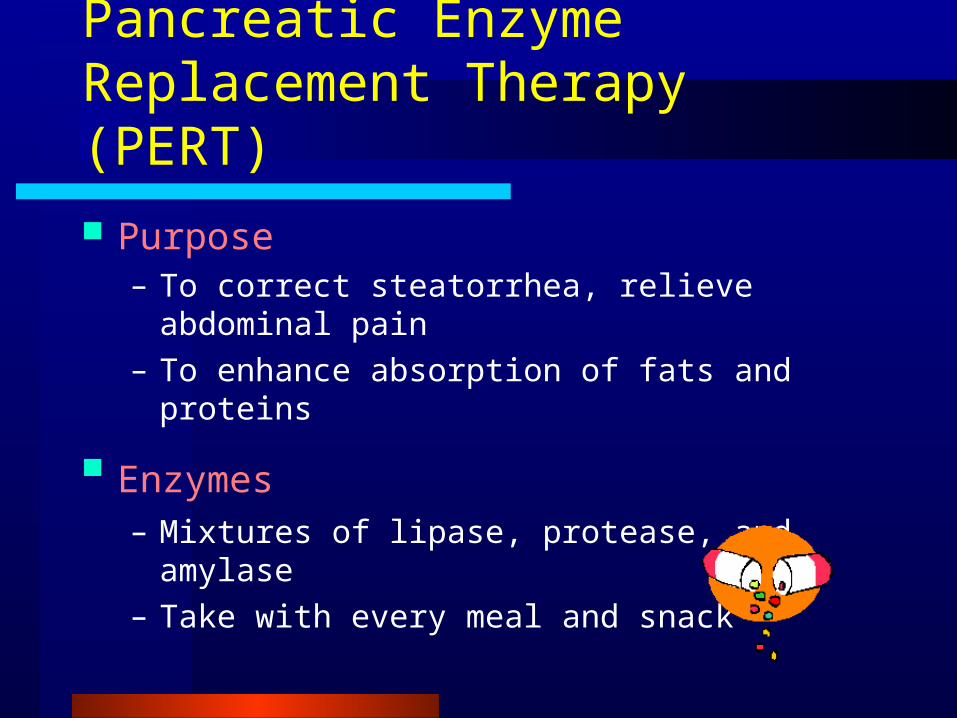
Pancreatic Enzyme Replacement Therapy (PERT)
Purpose– To correct steatorrhea, relieve abdominal
pain– To enhance absorption of fats and proteins
Enzymes – Mixtures of lipase, protease, and amylase – Take with every meal and snack
The CFRD Diet
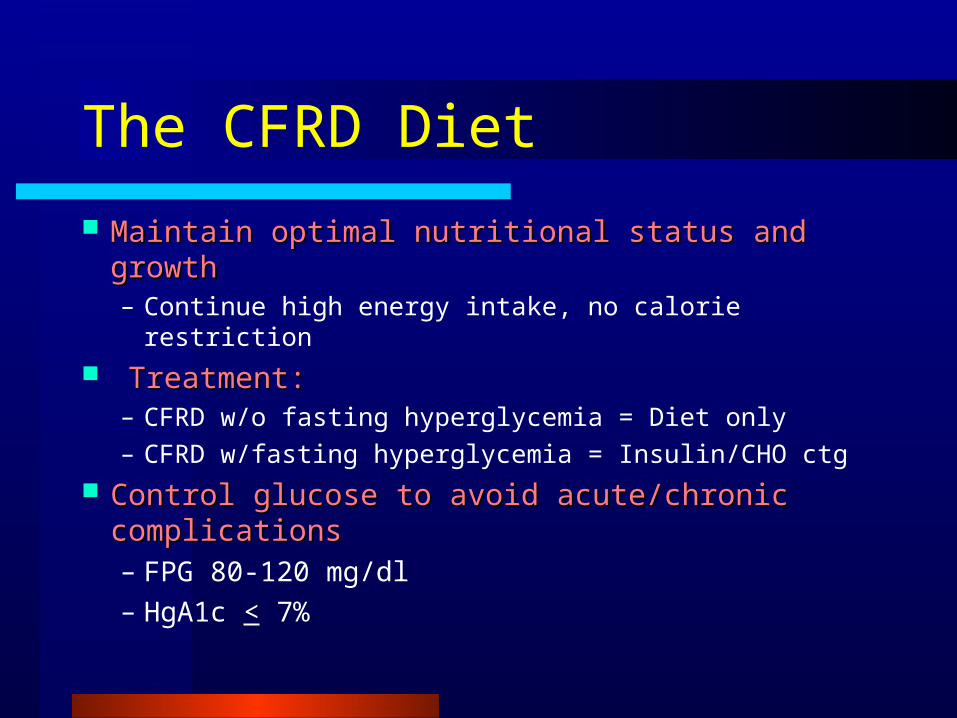
Maintain optimal nutritional status and growthMaintain optimal nutritional status and growth– Continue high energy intake, no calorie restriction
Treatment: Treatment: – CFRD w/o fasting hyperglycemia = Diet only– CFRD w/fasting hyperglycemia = Insulin/CHO ctg
Control glucose to avoid acute/chronic Control glucose to avoid acute/chronic complicationscomplications– FPG 80-120 mg/dl– HgA1c < 7%
The Vitamins and Minerals
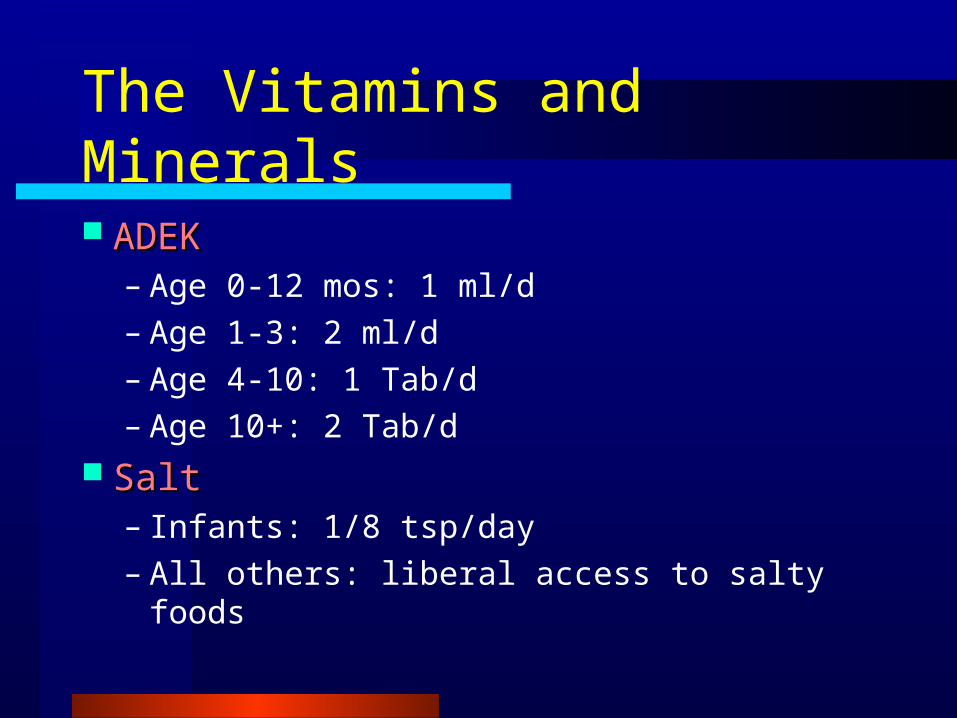
ADEKADEK– Age 0-12 mos: 1 ml/d– Age 1-3: 2 ml/d– Age 4-10: 1 Tab/d– Age 10+: 2 Tab/d
Salt Salt – Infants: 1/8 tsp/day – All others: liberal access to salty foods

Stomach Management
Treatment optionsTreatment options– H2 (histamine) blockers -- cimetidine
(tagamet), ranitidine (zantac), famotidine (pepcid)
– Proton Pump Inhibitors (PPI) -- omeprazole (prolosec), lansoprazole (prevacid), pantoprazole (protonix, esomeprazole (Nexium)
– Erythromycin– Nissen fundoplication
Adjuvant Therapies
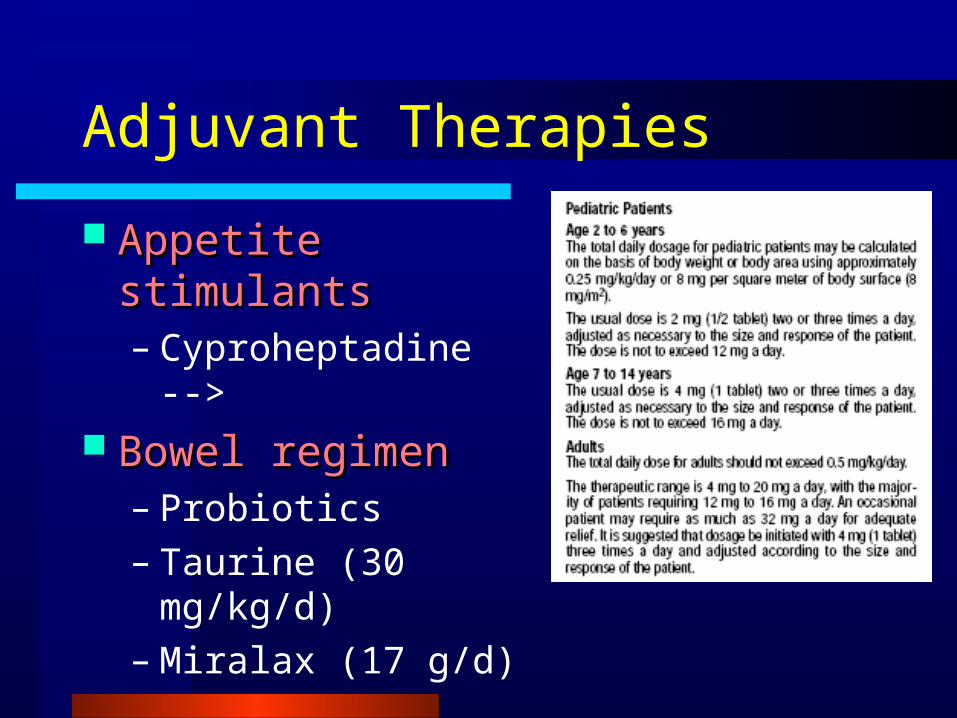
Appetite Appetite stimulantsstimulants– Cyproheptadine -->
Bowel regimenBowel regimen– Probiotics– Taurine (30
mg/kg/d)– Miralax (17 g/d)

Accelerating Improvement
in CF Care
““We believe that during the next five We believe that during the next five years, the life expectancy of CF can years, the life expectancy of CF can be extended by 5-10 years through be extended by 5-10 years through the consistent application of existing the consistent application of existing evidence-based clinical care.”evidence-based clinical care.”
– Cystic Fibrosis Foundation, 2003
Family Centered Approach
Position Statement
Nutrition services are an essential component Nutrition services are an essential component of of
comprehensive care for CSHCN. These nutrition comprehensive care for CSHCN. These nutrition
services should be provided within a system of services should be provided within a system of
coordinated interdisciplinary services in a coordinated interdisciplinary services in a
manner that is preventive, manner that is preventive, family centeredfamily centered, ,
community based and culturally competent.community based and culturally competent.
American Dietetic Association Position StatementAmerican Dietetic Association Position Statement

Family-Centered Care (FCC)
DefinitionDefinition
Family-centered care assuresFamily-centered care assuresthe health and well-being of the health and well-being of children and their families children and their families through a respectful family- professional partnership. through a respectful family- professional partnership. It honors the strengths, cultures, traditions and expertise It honors the strengths, cultures, traditions and expertise that everyone brings to this relationship. Family Centered that everyone brings to this relationship. Family Centered Care is the standard of practice which results in high quality Care is the standard of practice which results in high quality services.”services.”
http://www.familycenteredcare.org

Principles of FCC
Foundation = Partnership between Foundation = Partnership between families and professionalsfamilies and professionals– entities work together in the best
interest of child; as child grows, s/he assumes partnership role
– participants make decisions together– information sharing are open and
objective– there is a willness to negotiate
Case Study
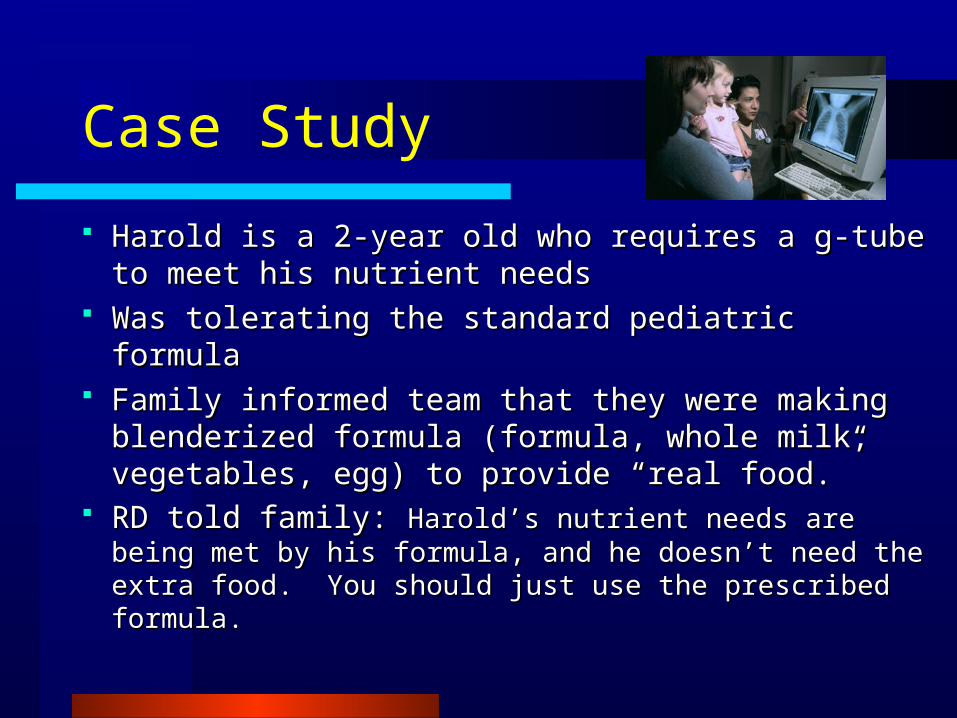
Harold is a 2-year old who requires a g-tube to Harold is a 2-year old who requires a g-tube to meet his nutrient needsmeet his nutrient needs
Was tolerating the standard pediatric formulaWas tolerating the standard pediatric formula Family informed team that they were making Family informed team that they were making
blenderized formula (formula, whole milk, blenderized formula (formula, whole milk, vegetables, egg) to provide “real food.”vegetables, egg) to provide “real food.”
RD told family: RD told family: Harold’s nutrient needs are being met Harold’s nutrient needs are being met by his formula, and he doesn’t need the extra food. by his formula, and he doesn’t need the extra food. You should just use the prescribed formula.You should just use the prescribed formula.

What went right?
Harold’s family was connected to appropriate Harold’s family was connected to appropriate health care serviceshealth care services
Harold’s family communicated with service Harold’s family communicated with service providersproviders
Harold’s family cared about his nourishmentHarold’s family cared about his nourishment

What went wrong?
Disconnected communication between Disconnected communication between professional and parentprofessional and parent
No acknowledgement of information shared No acknowledgement of information shared parents about their child’s careparents about their child’s care
Unsupportive responses by professionalUnsupportive responses by professional Told family what to do instead of developing a Told family what to do instead of developing a
plan togetherplan together

What really happened...
RD realizes need for collaboration, and explains RD realizes need for collaboration, and explains concerns about the homemade formula:concerns about the homemade formula:
– raw egg is unsafe– nutrient composition may not meet needs – can have problems with contamination – can have problems with tube clogging because of
viscosity of formula
Harold’s parents would like to use the home Harold’s parents would like to use the home prepared formula, if possible. RD works with prepared formula, if possible. RD works with family to make it possible:family to make it possible:
– Raw egg is unsafe; they agree to stop using it– Recipe is adjusted to meet Harold’s nutrient
needs– Family will watch for clogging problems and
communicate them to RD
The family’s response...

Further thoughts…
Think of a time when you practiced family-Think of a time when you practiced family-centered carecentered care
Think of an example of care you’ve received that Think of an example of care you’ve received that was not family-centered…what could the was not family-centered…what could the clinician have done differently?clinician have done differently?
How can you improve your practice?How can you improve your practice?

ThankThank
YouYou