Embed Size (px)
Citation preview

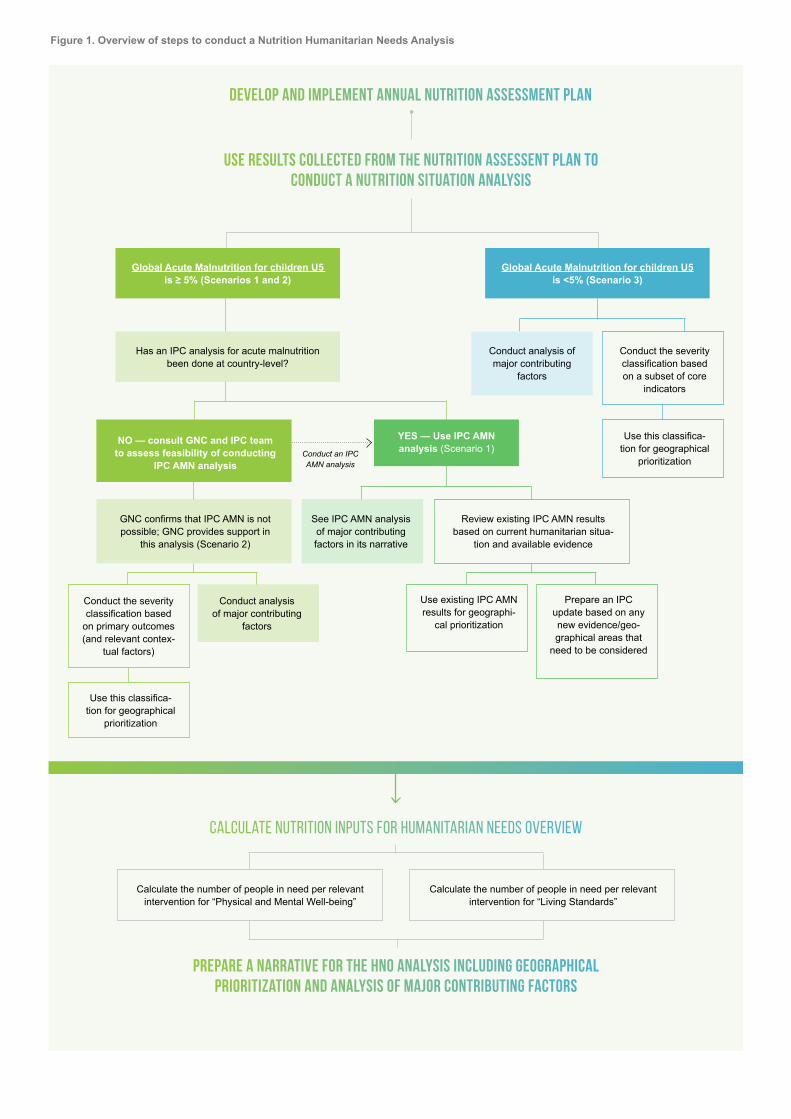
Steps to conducting a Nutrition Humanitarian Needs AnalysisThe purpose of this working guidance is to outline the steps (summarized in Figure 1 below) for con-ducting a Nutrition Situation Analysis, identifying information for the Humanitarian Needs Overview (HNO), which feeds into response plans and up-dates, whether IASC Cluster system has been ac-tivated or not. This includes the development and implementation of an annual nutrition assessment plan and a nutrition situation analysis (or align it with IPC’s Acute Malnutrition (AMN) results) along with major contributing factors, and calculation of the number of People in Need (PiN) and other key figures for the HNO.
nutrition humanitarian needs analysis guidance
CLUSTER
GlobalNUTRITION
Global Acute Malnutrition for children U5 is ≥ 5% (Scenarios 1 and 2)
Calculate the number of people in need per relevant intervention for “Physical and Mental Well-being”
Calculate the number of people in need per relevant intervention for “Living Standards”
NO — consult GNC and IPC team to assess feasibility of conducting
IPC AMN analysis
YES — Use IPC AMN analysis (Scenario 1)
Calculate Nutrition inputs for humanitarian needs overview
prepare a narrative for the HNO analysis including geographical prioritization and analysis of major contributing factors
Has an IPC analysis for acute malnutrition been done at country-level?
Conduct an IPC AMN analysis
Conduct analysis of major contributing
factors
See IPC AMN analysis of major contributing factors in its narrative
GNC confirms that IPC AMN is not possible; GNC provides support in
this analysis (Scenario 2)
Global Acute Malnutrition for children U5 is <5% (Scenario 3)
Conduct the severity classification based on a subset of core
indicators
Use this classifica-tion for geographical
prioritization
Conduct the severity classification based
on primary outcomes (and relevant contex-
tual factors)
Use this classifica-tion for geographical
prioritization
Use existing IPC AMN results for geographi-
cal prioritization
Prepare an IPC update based on any new evidence/geo-graphical areas that
need to be considered
Review existing IPC AMN results based on current humanitarian situa-
tion and available evidence
Develop and implement annual nutrition assessment plan
Use results collected from the nutrition assessent plan to conduct a nutrition situation analysis
Conduct analysis of major contributing
factors
Figure 1. Overview of steps to conduct a Nutrition Humanitarian Needs Analysis

01
04
04
05
06
06
07
10
12
16
43
44
References
Annex 1 Key components of the Acute Malnutrition Analytical Framework
Steps to conducting a Nutrition Humanitarian Needs Analysis
Acknowledgements
Limitations
Abbreviations
List of Tables
List of Figures
Glossary
Purpose, audience and scope
1 Develop the annual nutrition assessment plan
2 Conduct a Nutrition Situation Analysis
3 Prepare key nutrition figures for the Humanitarian Needs Overview and subsequent Response Plan (only applicable to IASC Clusters)
Annex 2 Gender Considerations for Nutrition Needs Assessments and Analyses
Annex 3 Example of an annual nutrition assessment plan
Annex 4 Key terminology of Humanitarian Needs Overview and Response Plan
Annex 5 Minimum information required for Nutrition Section of HNOs
46
49
50
52
32
• Recommended “core” nutrition indicators for response planning
• Scenario 1 Humanitarian situations where the prevalence of U5 GAM is ≥5% with an existing IPC Acute Malnutrition (AMN) analysis
• Scenario 2 Humanitarian situations where the prevalence of U5 GAM is ≥5% and no IPC AMN analysis can be conducted
• Scenario 3 Humanitarian situations where the prevalence of U5 GAM is <5%
• Outcomes
• Contributing factors or determinants
• Collecting gender-related information to guide nutrition response planning
• One step close to gender-transformative nutrition interventions
18
27
27
29
45
45
47
48
41
41
42
43
• Calculating PiN for Scenarios 1 and 2
• Calculating PiN for Scenario 3
• Inputs to the HRP
• Conclusion
TABLE OF CONTENTS

4 nutrition humanitarian needs analysis guidance
This guidance note was developed by the Global Nutrition Cluster (GNC) and was made possible through support provided by the U.S. Agency for International Development under the terms of Award No 720FDZ20IO00019. The opinions expressed in this publication are those of the author(s) and do not necessarily reflect the views of the U.S. Agency for International Development.
The GNC Task Force for the HNO, created under the Nutrition Information System working group (of the Global Technical Assistance mechanism) oversaw the preparation of this document, with the leadership of the GNC Deputy Coordinator, Anna Ziolkovska. The GNC acknowledges the technical contribution from Victoria Sauveplane, who produced the initial draft and subsequent revsions following its piloting. Special thanks goes to the members of the Task Force: Alessandro Iellamo (Save the Children, IFE Core Group Steering Committee), Anna Ziolkovska (GNC-CT), Douglas Jayasekaran (IPC Global Support Unit), Gwenaelle Garnier (WFP), Hassan Ali Ahmed (Action Against Hunger Canada), Lilian Kastner (UNICEF), Louise Mwirigi (UNICEF), David Rizzi (GNC-CT), Shabib AlQobati (GNC-CT), and Yara Sfeir (GNC-CT); as well as the GTAM NISWG for their support with the identification of core indicators: Alexandra Rutishauser-Perera (Action Against Hunger UK), Andi Kendle (IMC), Esther Busquet (IMC), Kerstin Hanson (WFP), Oleg Bilukha (CDC), Suzanne Brinkmann (IMC).
This global-level guidance note is a dynamic document aimed at streamlining Nutrition Humanitarian Needs Analysis that will be revised based on results and lessons learned from its use. Nonetheless, it is important to take note of its limitations: 1) a number of the “core” indicators from the other sectors (WASH, Food Security, Health) proposed in Table 1 should be discussed with corresponding Cluster/Sector counterparts before including them into the Nutrition Situation Analysis; 2) the preliminary scoring table put forward in Scenario 3’s Nutrition Situation Analysis is not based on hard evidence, rather a three-tiered system that associates more points to certain “core” indicators versus others (details provided on p.16) with proposed cut-offs based on rough simulations and will be adjusted based on the results from its use; 3) countries may choose to adapt this guidance according to their needs and context and therefore may lose comparability across countries. For any suggestions or recommendations on how to further improve this guidance, please contact the GNC-CT.
Acknowledgements
Limitations
Dudhiya Dhara, Limkhdea, Gujarat.© UNICEF/UNI342651/Panjwani

5nutrition humanitarian needs analysis guidance
abbreviations
4W
AMN
BMS
BSFP
CDC
CMAM
ENA
ENAs
cGAM
GAM
GBV
GNC
GNC-CT
GSU
GTAM
HAZ
HINI
HNO
HRP
IASC
LW
MAM
MICS
MUAC
NCC
NiE
NIS
NIS TWG
OCHA
OTP
PiN
PLW
PLWHIV
PW
RUSF
RUTF
SADD
cSAM
SAM
SMART
U2
U5
UNICEF
VAD
WASH
WHO
WFP
WHZ
WRA
IPC
IPC AMN
IYCF
IYCF-E
JIAF
Who, What, Where and When
Acute Malnutrition
Breastmilk Substitute
Blanket Supplementary Feeding Programme
CDC – Centers for Disease Control
and Prevention
Community Management of Acute
Malnutrition
Emergency Nutrition Assessment (software)
Essential Nutrition Actions
combined Global Acute Malnutrition
(aggregate indicator by combining GAM
based on WHZ and GAM based on MUAC)
Global Acute Malnutrition
Gender-Based Violence
Global Nutrition Cluster
Global Nutrition Cluster Core Team
Global Support Unit
Global Technical Assistance Mechanism
for Nutrition
Height-for-Age Z-score
High Impact Nutrition Interventions
Humanitarian Needs Overview
Humanitarian Response Plan
Inter-Agency Standing Committee
an expert advocacy and resource group on
IYCF-E.
Integrated Food Security Phase
Classification
Integrated Food Security Phase
Classification for Acute Malnutrition
Infant and Young Child Nutrition
Infant and Young Child Nutrition
in Emergencies
Joint Inter-sectoral Analysis Framework
Lactating Women
Moderate Acute Malnutrition
Multiple Indicator Cluster Survey
Mid Upper Arm Circumference
Nutrition Cluster Coordinator
Nutrition in Emergencies
Nutrition Information System
Nutrition Information System Technical
Working Group
(United Nations) Office for the Coordination
of Humanitarian Affairs
Outpatient Therapeutic Programme
People in Need
Pregnant and Lactating Women
Pregnant and Lactating Women
with HIV
Pregnant Women
Ready-to-Use Supplementary Food
Ready-to-Use Therapeutic Food
Sex-and Age-Disaggregated Data
combined Severe Acute Malnutrition
(aggregate indicator that combines SAM
based on WHZ and SAM based on MUAC)
Severe Acute Malnutrition
Standardized Monitoring and Assessment
of Relief and Transitions
(Children aged) Under Two
(Children aged) Under Five
United Nations Children’s Fund
Vitamin A Deficiency
Water, Sanitation and Hygiene
World Health Organization
World Food Programme
Weight-for-Height Z-score
Women of Reproductive Age
IFE Core Group

6 nutrition humanitarian needs analysis guidance
list of tables
Table 1
Table 2
Table 3
Table 4A
Table 4B
Table 4C
Core Nutrition indicators for Nutrition Situation Analysis
Definitions of humanitarian population figures categories
List of considerations and adaptations when conducting the Nutrition Sectoral Analysis
Summary of PiN calculations per acute and chronic undernutrition, overnutrition
Summary of PiN calculations per IYCF practice
Summary of PiN calculations per micronutrient deficiency
LIST OF FIGURES
Figure 1
Figure 2
Figure 3
Figure 4
Overview of steps to conduct a Nutrition Humanitarian Needs Analysis
IPC Acute Malnutrition Reliability Score Table for Nutritional Need Evidence
Representation of overall humanitarian population figures categories
Subset of areas of focus drawn from WHO’s ENAs

7nutrition humanitarian needs analysis guidance
y Acute Malnutrition: caused by a (sudden and) drastic reduction in food intake and/or illness, often aggravated by suboptimal infant and young child feeding practices, leading to a significant loss of body weight (with severe health consequences). There are two levels of classification of acute malnutrition within an individual: severe and moder-ate. Acute malnutrition is of key concern because children who suffer from severe acute malnutrition (SAM) face a 9 times higher chance of dying compared to children who do not suffer from acute malnutrition1. Global Acute Malnutrition (GAM) among children 0-59 months is assessed using the nutritional indices of weight-for-height or weight-for-length (WHZ), mid-upper arm circumference (MUAC), and signs of bilateral pitting oedema known as either GAM based on WHZ, GAM based on MUAC or an aggregate indicator of both known as cGAM.
y Analysis Framework: the methodological ecosystem aimed at approaching a problem with logic and guiding sense-making processes based on theoretical (a general and visual representation of what will be investigated) and conceptual frameworks (how the data will be obtained and analysed) required to estimate and understand the humani-tarian conditions of the affected population.
y Anthropometric measurements: assessment of the size, shape, and proportions of the human body (e.g. height, weight, Mid-Upper Arm Circumference - MUAC) to deter-mine the nutritional status of an individual or population by comparing indices (e.g. weight-for-height) to standards, references or cut-offs2.
y Breastmilk substitutes: any food marketed or otherwise represented as a partial or total replacement for breastmilk, whether or not suitable for that purpose.
y Chronic Malnutrition: classified by stunting levels in terms of the standardized index of height-for-age z-score among children (height or length for specific sex and age). Stunting is the measure of growth retardation due to persistent inabil-ity to meet minimum micro- and macro-nutrient absorption requirements, frequent recurrence of acute malnutrition episodes, or a combination of these.
y Complementary Feeding: defined as the process starting when breastmilk alone is no longer sufficient to meet the nutritional requirements of infants, and therefore other food and liquids are needed, along with breastmilk.
y Coordinated Assessments: also considered as Joint or Multi-sectoral, these occur when assessments are planned and carried out in partnership with other humanitarian actors, with the results shared for the benefit of the broader humanitarian community to identify the needs of the affect-ed population of a humanitarian situation.
y Disability Inclusion: achieved when persons with disabili-ties (see definition below) meaningfully participate in all their diversity, when their rights are promoted, and when dis-ability-related concerns are addressed in compliance with the Convention on the Rights of Persons with Disabilities, known as CRPD.
y Exclusive Breastfeeding: defined as no other food or drink, not even water, except breast milk (including milk expressed or from a wet nurse) for 6 months of life, but allows the infant to receive ORS, drops and syrups (vitamins, minerals and medicines)3.
y Gender Based Violence: an umbrella term for any harmful act that is perpetrated against a person’s will, and that is based on socially ascribed (gender) differences between males and females.
y Gender Norms: standards and expectations to which wom-en and men generally conform, within a range that defines a particular society, culture and community at that point in time. Internalised early in life, gender norms can establish a life cycle of gender socialisation and stereotyping. Although gender norms are learned, they are neither static nor uni-versal and change over time.
y Incidence: a measure of the proportion of new cases in a population during a specific time period (generally one year) who will develop a certain disease or condition.
y Integrated Food Security Phase Classification (IPC): common global scale for classifying the severity and magni-tude of food insecurity and malnutrition, including a process
1 Olofin I, McDonald CM, Ezzati M, Flaxman S, Black RE, et al. (2013) Associations of Suboptimal Growth with All-Cause and Cause-Specific Mortality in Children under Five Years: A Pooled Analysis of Ten Prospective Studies.
2 For more information on indices, references and cut-offs: Cashin, K. & Oot, L. (2018) GUIDE TO ANTHROPOMETRY A practical tool for Program Planners, Managers and Implementers.
3 As defined by World Health Organization in their infant feeding recommendation.
Glossary

8 nutrition humanitarian needs analysis guidance
to build evidence-based technical consensus among key stakeholders, an approach to consolidate wide-ranging evidence, a path to provide actional knowledge for strate-gic decision-making, and a platform to ensure a rigorous, neutral analysis.
y Infant and Young Child Nutrition (IYCF): term to describe the recommended feeding practices of infants (aged less than 12 months) and young children (aged 12-23 months). Programmes focus on the protection, promotion and sup-port of breastfeeding and exclusive breastfeeding; timely, safe and appropriate introduction of complementary feeding and continued breastfeeding; and issues of policy and leg-islation around creating enabling environments for women and their children, covering critical aspects like infant and young child feeding in emergencies (IYCF-E), compliance with the IYCF-E operational guidance, the marketing of infant formula, BMS, commercial complementary foods for infants and young children, protocols and guidelines in the health system, communities, workplace and working condi-tions for women.
y Harmonized Assessments: when agencies collect, pro-cess and analyse data separately, but where the collected data is sufficiently comparable (because of the use of com-mon operational data sets, key indicators, and geographical and temporal synchronisation) to be compiled into a single database and used in a shared analysis.
y Micronutrient deficiency: when certain essential vitamins and minerals are deficient, due to insufficient dietary intake and/or insufficient absorption and/or suboptimal utilization of the vitamins or minerals. Specific clinical signs and symp-toms may develop.
y Mid-Upper Arm Circumference (MUAC): measured on a straight left arm midway between the tip of the shoulder (acromion) and the tip of the elbow (olecranon) and used to assess acute malnutrition or wasting. In children 6-59 months of age, MUAC<115mm indicates a child is severely malnourished, and MUAC between 115mm and <125mm indicates a child is moderately malnourished. Low MUAC (<125mm) combined with the presence of bilateral pitting edema is reported as GAM based on MUAC.
y Needs Assessment: the set of activities necessary to understand a given situation that entails the collection, up-dating and analysis of data pertaining to the population of concern (needs, capacities, resources, etc.).
y Nutrition-specific Interventions: address the immediate determinants of fetal and child nutrition and development (i.e. adequate food and nutrient intake, feeding, caregiving and parenting practices, and low burden of infectious diseases).
y Nutrition-sensitive Interventions: address the underlying determinants of malnutrition respectively (i.e. food security; adequate caregiving resources at the maternal, household and community levels; and access to health services and a safe and hygienic environment).
y Oedema: excessive accumulation of extracellular fluid in the body. Bilateral pitting oedema (fluid retention on both sides of the body) is a clinical sign of severe acute malnutri-tion and is referred to as nutritional oedema.
y Older People: refers to people aged 50 and above, taking into account the social construction of ageing in low-to mid-dle-income countries in contract to the retirement-from-work age applied in high-income countries.
y Overweight: occurs when a person has too much body fat and weighs more than would be expected for a healthy person of the same height, with obesity being its severe form4. Overweight and obesity are complex conditions with multiple causes, including an imbalance between calories consumed and calories expended, low levels of physical activity, medical conditions, and genetics, among others. Although undernutrition is still the primary concern in developing countries, globally, overweight and obesity are associated with more deaths than underweight. What was previously only considered an issue for high-income coun-tries is now an emerging public health threat in countries across the globe, creating a double burden of malnutrition in many developing countries that continue to have a high prevalence of undernutrition.
y Persons with disabilities: persons who have long-term sensory, physical, psychosocial, intellectual or other impair-ments that, in interaction with various barriers, prevent them from participating in, or having access to, humanitarian pro-grammes, services or protection. Persons with disabilities are a diverse group. They have different impairments and diverse identities (as women, indigenous persons, children, etc.).
y Prevalence: a measure of the proportion of individuals in a population who have a certain disease or condition at a specific point in time.
4 Cashin, K. & Oot, L. (2018) GUIDE TO ANTHROPOMETRY A practical tool for Program Planners, Managers and Implementers.

nutrition humanitarian needs analysis guidance 9Juba, Sudan© UNICEF/UNI286808/Ryeng
y Screenings: rapid population-based assessments, primarily conducted to identify people who may be malnourished and refer them for more detailed assessment and treatment, often done in a health facility or in a community setting.
y Seasonality: seasonal variation of various factors affecting nutrition status, such as disease, weather, migration, sourc-es of food, and the agricultural cycle.
y Sex and age disaggregated data: one of the most effec-tive ways to understand different needs within a population is to collect data by sex and age (SADD), and to analyse the data, in part, using a gender gender (socially construct-ed roles, behaviours, activities, and attributes that a given society considers appropriate for males and females) and generational analysis that is situated within the context of the particular country, region, and crisis.
y Situation Analysis: a deliberate process whereby the current incident humanitarian situation, the factors that are relevant to the incident, their consequences are reviewed, alternative strategies are assessed, and an incident plan is recommended.
y Undernutrition: consequence of inadequate nutrition intake and/or absorption, and/or illness or disease, with major types including – acute malnutrition (wasting, thinness, and/or bilateral pitting oedema), chronic malnutrition (stunting), underweight (a composite of stunting and wasting) and mi-cronutrient deficiencies (e.g. deficiencies in vitamin A, iron).

10 nutrition humanitarian needs analysis guidance
Purpose, audience and scope
The purpose of this step-by-step guidance is to provide those involved in nutrition coordination with relevant tools, informa-tion and resources for conducting a Nutrition Situation Analy-sis, identifying information for the Humanitarian Needs Over-view (HNO), which feeds into response plans and updates including the Humanitarian Response Plan (HRP). Applicable across the range of country contexts and different types of humanitarian situations, spanning acute-onset/slow-onset, natural disasters, conflict and protracted crises, this document complements the existing IASC’s Humanitarian Programme Cycle guidance aimed at ensuring an evidence-based and results-oriented collective response to which Clusters and organizations contribute. Sections of this guidance are orga-nized according to a scenario-based approach: Scenario 1 in situations where an IPC Acute Malnutrition analysis can be conducted or utilized, Scenario 2 in situations where an IPC Acute Malnutrition analysis cannot be conducted and GAM for children U5 (≥5%) is of primary concern, or Scenario 3 for situations where GAM <5% (summarized in Figure 1 above) with the following steps for a given country:
• Develop the annual nutrition assessment plan;
• Conduct a Nutrition Situation Analysis according to one of these three scenarios;
• Prepare key nutrition figures for the HNO and subsequent HRP (only applicable to IASC Clusters).

11nutrition humanitarian needs analysis guidance
Purpose, audience and scope
Among others involved in nutrition coordination in humanitar-ian situations, this operational guidance note is primarily aimed at Nutrition Cluster Coordinators (NCCs), Infor-mation Management Officers (IMOs), Nutrition Cluster partners and staff within the Cluster Lead Agency. It is also pertinent for coordination teams and partners of the Nutrition Sectors and partners from other Clusters/Sectors; in partic-ular those having relevant links to nutrition outcomes, who are responsible for the consolidation and situation analysis of nutrition-related needs of affected populations. The outputs stemming from this guidance are relevant to all humanitarian actors, including but not limited to decision-makers, humani-tarian coordinators, Humanitarian Coordination Teams (HCTs), humanitarian organizations contributing to coordinated assess-ments, policy-makers, donors, national and local authorities during both inter-agency preparedness and response phases in humanitarian situations.
Addendum 1 provides details on how these figures contribute to the Joint Inter-sectoral Analysis Framework (JIAF).
Using an indicative timeline, this guidance should serve as a guide for discussions and consensus-building on situation analysis and nutritional needs analysis in crisis situations and response planning and monitoring, whether the IASC Cluster system has been activated or not.
This guidance was devised to be used in conjunction with:
y the accompanying spreadsheet tool, Nutrition Cluster Nutrition Humanitarian Needs Analysis Calculation Tool.
y marked with ► symbols or key steps outlined in special boxes.
y Further reading, tools and resources are also provided in Boxes,
y along with key points highlighted by: ■ s.
Syrian Arab Republic. © UNICEF/UNI308394/Sanadiki

Dhanghadi, Nepal© UNICEF/UNI274936/Karki
1 Develop the annual nutrition assessment plan

13nutrition humanitarian needs analysis guidance
01 — Develop the annual nutrition assessment plan
1. Develop the annual nutrition assessment planIndicative timeline: Last quarter of previous year/first months of current year
A NIS is an integrated and centrally coordinated set of pro-cesses to continuously collect, analyze and interpret nutri-tion-related data, transform it into tangible information and disseminate it for making timely and effective decisions to improve the nutritional health of a population. In order to inform appropriate response strategies, the development and regular maintenance of an annual nutrition assessment plan (see guidance provided in Annex 2) ensures up-to-date and quality data are used for nutrition situation (or trend) analyses, to help target areas or vulnerable populations that are at increased risk or in heightened need of nutritional assistance. When the IASC Cluster system has been activated, this plan should be directly linked to the Humanitarian Programme Cycle, taking into account seasonal considerations and input from deci-sion-makers as they play an important role in defining units of analysis, geographical coverage and subsequent preparation of Humanitarian Needs Overview and Response Plans.
Considerations for the eventual development of an IPC annual calendar may also be applicable given the humanitarian situa-tion – see Box A for more details.
Led by the in-country NIS TWG (Technical Working Group) or equivalent5, the following steps are recommended to support the contextualization of their nutrition assessment plan:
Discuss what nutrition outcome data (see Annex 1) is available, including disaggregation by sex, age, disability and other diversity characteristics, as well as what is missing and needed for decision-mak-ing and planning.
Discuss which indicators for the key contributing factors (i.e. causes/drivers of malnutrition – see Table 1 below and Annex 1) are available, missing and needed. Agree with other Clusters/Sectors on which nutrition-sensitive indicators will be included in their assessment methodologies and the ratio-nale for their collection and use. When needed, agree whether or not some of these indicators can/should be collected as a part of nutrition assess-ments (e.g. measles vaccination) to avoid any duplication of efforts. When reviewing primary data needs, keep in mind the importance of sex, age, and disability disag-gregated data. It is also important to consider gender-based barriers (see Annex 2) and gender norms that may negatively impact on nutrition outcomes. For example, women may not have a decision-making power at home about what they eat or how they use money, or there could be dietary taboos or cultural feeding practices related to food consumption that can disadvantage young girls. Consider consultations6 and other qualitative methods, such as focus group discussions, to obtain voices and opinions from the community, providing information on who is impacted different-ly and why;
Identify critical data gaps based on the above and discuss the means to address these directly through primary data collection, often feasible us-ing the recommended SMART methodology. This may change depending on the humanitarian situa-tion, particularly during an outbreak or pandemic7.
Develop and coordinate an annual (harmonized with other Sectors) nutrition assessment plan (see Annex 3) to support the coordination of nutrition assessments and their results, taking into account timelines for data analysis, key considerations
01
02
03
04
BOX A. DEVELOPMENT OF AN IPC ANNUAL CALENDAR
In contexts where an IPC Acute Malnutrition analysis may be necessary (i.e. GAM ≥ 5%), it is important to start discussions with the GNC-CT and the IPC GSU on the necessary resources, timeline and financial requirements for the eventual implementation of the IPC in-country.
5 Further details on the roles and responsibilities of the NIS TWG can be found here. 6 Further tips on consultations with women and girls can be found here.
7 Considerations for primary data collection during the COVID-19 pandemic can be found here.

14 nutrition humanitarian needs analysis guidance
BOX B. KEY CONSIDERATIONS WHEN REVIEWING DATA FOR DECISION-MAKING AND PLANNING
• Accessibility: in some instances, the nature of the humanitarian crisis (e.g. conflict) may limit the access of organizations to collect suitable evidence and affect the geographical coverage. Alternative considerations should be followed — see IPC’s summary guidance for data collection in areas with limited/no humanitarian access (pages 193-195 in the IPC technical manual version 3.0; more detailed guidance is available from IPC GSU upon request).
• Appropriateness: it is better to choose a small number of well-established indicators based on prior experience and expert consensus.
• Contextual factors: context (e.g. double burden of malnutrition, measles epidemics, malaria), events (e.g. political events), changes in nutrition programme activities, shortage in supplies.
• Demographic coverage: whether selected indicator(s) can be used as a proxy for the needs of the entire population group’s needs or only subset (e.g. U5 SAM prevalence).
• Disaggregation: can be done by population group, age category, sex, disability, other diversity characteristics (e.g. IDP/host community status, rural/urban, ethnic or religious identities) or by
administrative level at which results from a survey can be representative at the unit of analysis. It is important to always consider how and why different groups may be affected differently.
• Representativeness: a measure of how well or accurately a sample reflects the population from which it is drawn, often ensured by probability (random) sampling methods.
• Seasonality: malnutrition fluctuations due to seasonal changes; information on the influence of seasonality can be established based on feeding centre admission data or national nutrition surveillance data.
• Sound statistical and data management methods: use of appropriate statistically viable methods used to collect, analyse, and manage data to ensure accurate interpretation of information.
• Transparency: clarity on the sources, the methods used to collect the data, the calculations and any technical and methodological notes used.
• Unit(s) of analysis: for Nutrition, the majority of indicators are at individual-level (e.g. GAM), aggregated at geographical and/or affected group level in terms of representativeness of findings - see Table 3 below.
01 — Develop the annual nutrition assessment plan
(see Box B below) and the reliability of certain collection methods over others (see Figure 2). Ad-ditional guidance can be found on pages 161-162 in the IPC technical manual version 3.0. All as-sessments should preferably be conducted during the same season for improved comparability, and data should be analysed as soon as possible after data collection.
Review assessment tools and questionnaires and modify them as needed to ensure that the full set of nutrition-specific and nutrition-sensitive indica-tors is accounted for.
05
06
07
Ensure implementation of the plan and timely vali-dation of data collected.
Ensure results are being shared with relevant stakeholders and stored in a consolidated manner to facilitate any subsequent trend and/or Nutrition Situation Analyses.

15nutrition humanitarian needs analysis guidance
01 — Develop the annual nutrition assessment plan
Time Relevance (T)
Part B: General Guidance for Evaluation of M and T
Good (T2) Limited(T1)
R2 = Reliable
R1 = Somewhat reliable
R2
R1 +
R1 -
X
Good (T2)
Good (M2)
Good (M2)
Limited(M1)
Soun
dnes
s
of m
etho
d (M
)So
undn
ess
met
hod
(M)
Tim
e re
leva
nce
(T)
Limited(T1)
Limited(M1)
GAM based on WHZ from surveys representative at the unit of analysis with adequate precision and validated by an authority in the country.
Evidence reflecting current conditions.
Evidence inferred to reflect current conditions.
GAM based on WHZ that partially meets representativeness and quality standards or GAM based on MUAC from minimally acceptable methods.
• Cluster surveys with ≥25 clusters.• Simple or systematic surveys with ≥150 observations.
• Evidence collected during the same season of analysis, when there is seasonality.• Evidence collected anytime during the previous 12 months when there is no seasonality
or significant shock to acute malnutrition contributing factor.
• Inferred estimates of evidence collected within the last 6 months but not from the same acute malnutrition season (12 months for areas with no seasonality).
• Historical evidence collected during the same acute malnutrition season from at least 2 similr years in the last 5 years — only to be used in the absence of any unusual shocks.
• Surveys representative at the unit of analysis.• Estimates “validated with caution” (for GAM based on WHZ only).• Estimates of GAM based on MUAC from surveys rated good method.
• GAM based on WHZ from disaggregated surveys representative at a higher administrative unit.• ≥5 clusters and ≥100 observations.
• GAM based on WHZ/MUAC from Sentinel sited.• ≥5 sites per unit of analysis with ≥200 total observations (if the area is pastoral, ≥5 sited
with 100 observations os acceptable).• GAM based on MUAC from Screening.
• Exhaustive screening (door to door) carried out at the unit of analysis (>80% coverage) or unit of analysis and ≥200 observationsselected randomly or exhaustively (>80% coverage) from each site and with convergence of estimates from these sites.
• Surveys from similar areas.• GAM based on WHZ from a survey with Good Method from a similar area.
Figure 2. IPC Acute Malnutrition Reliability Score Table for nutritional need evidence

Balabhadrapur, India.© UNICEF/UNI296969/Narain
2 Conduct a Nutrition Situation Analysis

17nutrition humanitarian needs analysis guidance
2. Conduct a Nutrition Situation AnalysisIndicative timeline: 1-3 months per analysis cycle depending on the undernutrition seasonal calendar, geographical cover-age and other parameters; this excludes time required for its planning. In countries with recurring HNO/HRP processes, this tends to take place between August-October.
The purpose of a Nutrition Situation Analysis is to define/classify the severity of a given humanitarian situation across affected geographical areas based on the magnitude of the nutritional needs of the population in order to guide strategic and operational decision-making. It addresses the following questions: How severe? When and Where are the worst affect-ed areas? How many? Why? Who? What are the key charac-teristics of the situation?
This analysis aims to build consensus on classifying the severity based on the magnitude of nutritional needs (e.g. prevalence of different forms of malnutrition) of vulnerable pop-ulation groups (i.e. those more at risk/affected) and their key drivers (contributing factors) into meaningful categories to sup-port the response. This entails a critical review of the available data (e.g. results from the annual nutrition assessment plan), context and existing trends for each affected geographical area. Nuanced information may also be needed to inform the need for action to scale up malnutrition treatment and preven-tion for affected populations based on the following questions:
Based on the framework in Annex 1 and different steps according to various scenarios (Figure 1), this analysis is generally led by the Nutrition Cluster Coordinator and co-lead by national government representatives in partnership with the Cluster partners such as civil society institutions/organizations, resource partners, UN agencies, members of the NIS TWG or equivalent, and only if applicable – the IPC Technical Working Group (see Box C).
These representatives should come together to agree on the scope and focus of the nutrition situation analysis, and determine which scenario (1, 2 or 3) is most relevant to their context. Only one scenario should be chosen for the entire country. If GAM for U5 children hovers around 5% (being the cut-off between Scenarios 2 and 3) for the affected areas of interest and an IPC AMN analysis (Scenario 1) is not feasible, it is the majority prevalence across the affected areas that determines which scenario should be used.
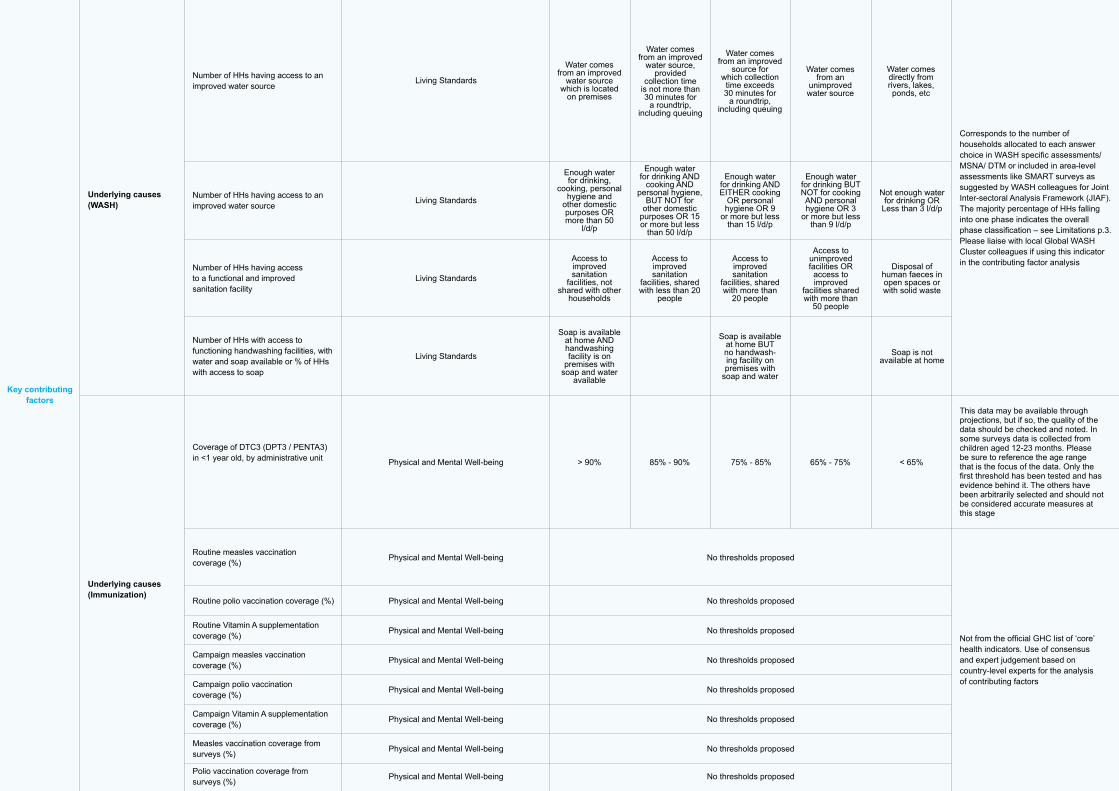
Once a scenario has been agreed upon, these representa-tives should then discuss the following recommended list of “core” indicators around agreed population groups, geographic areas and/or thematic issues when consolidating available and reliable8 evidence. When selecting indicators for the nutrition situation analysis, it is important to keep in mind the impor-tance of sex, age, and disability disaggregated data. Although disaggregated data does not factor into the severity classifica-tion, it will play an important role in estimating the magnitude of nutritional needs. For example, drawing from Table 1 below, indicators relating to the access WASH may be very different for men compared to adolescent girls.
• What is the prevalence of different forms of malnutrition (e.g. acute and chronic malnutrition outcomes, micronu-trient deficiencies) in the geographical areas of interest? Are there important differences by age group (e.g. infants, chronically ill adults, older people) or by sex to consider (e.g are U5 girls more likely to suffer from malnutrition)?
• Are certain geographical areas more affected than others by malnutrition accompanied by high or increasing levels of its drivers (e.g. individual food consumption gaps)?
• Are certain livelihoods, socio-economic, age or gender groups (e.g. adolescent PLW) more affected by malnutri-tion than others? What factors make them vulnerable to malnutrition (e.g. social norms related to diets)?
• Are there any trends, seasonal and/or long term, in the prevalence of malnutrition?
02 — Conduct a Nutrition Situation Analysis
8 Reliability of the nutrition outcome data in terms of time relevance and soundness of method described in Figure 2 above.

18 nutrition humanitarian needs analysis guidance
The GNC recognizes and advocates for the treatment of all forms of acute malnutrition, including all children with low MUAC, low WHZ or bilateral pitting oedema – known as combined GAM (cGAM)10. However, for the purpose of this situation analysis, a preference for GAM based on WHZ is ap-plied; GAM based on MUAC must only be used in the absence of GAM based on WHZ11, and always using convergence of evidence with contributing factors to arrive at the final conclu-sion of the situation analysis.
This recommended list of indicators was prepared by the GNC HNO Taskforce and NISWG members for phase characteris-tics and thresholds of international standards for GAM and its key contributing factors. It is meant to streamline this analy-sis process and is not intended to override the extensive list of nutrition indicators that can be used for program-ming or monitoring purposes9 – See ► Indicator Registry worksheet of the Nutrition Cluster Nutrition Humanitarian Needs Analysis Calculation Tool.
• Category: primary nutrition outcomes, optional contextual factors focusing on common vulnerable groups that can be considered to help guide decisions around what types of interventions may be better suited for a given humani-tarian situation, and key contributing factors selected by the Taskforce;
• Alignment with IPC AMN’s Analytical framework (Annex 1): nutritional status indicators, mortality indica-tors, immediate and underlying causes, and other issues;
• Humanitarian consequences: relevant for nutrition “Physical and Mental Well-being” and “Living Standards” which will be important later in the analysis when de-termining key population figures for response planning. These may differ depending on whether GAM for U5 is ≥5% (Scenarios 1 and 2) or <5% (Scenario 3);
• Thresholds and their sources: available for each indi-cator applied in the severity phases (based on IPC/OCHA terminology). It may also include preliminary thresholds used only in cases where global thresholds for that indica-tor are currently unavailable. This is an important technical limitation particularly when assessing acute and/or chronic malnutrition as primary outcomes.
10 cGAM will be preferred in Section 3 of this guidance when calculating the number of people in nutritional need for the HNO and HRP. ENA for SMART software (Version 2020) automatically produces these figures in Tables 3.7 and 3.8 in its survey report.
11 In alignment with IPC AMN, GAM based on MUAC classification is based on an analysis of the relationship between WHZ and MUAC in the analysis area and convergence of evidence. In exceptional conditions where GAM based on MUAC portrays a much more severe situation than GAM based on WHZ (i.e. two or more phases), GAM based on MUAC should also be taken into account in the phase classification. MUAC-based classifications should be supported by the relationship between GAM based on WHZ, and GAM based on MUAC in the area of analysis. Convergence of evidence should focus on assessing the status of contributing factors (e.g. disease outbreak, food security crisis) as well as historical trends.
9 See the Global Nutrition Cluster indicators registry with needs assessment and performance monitoring indicators.
Recommended “core” nutrition indicators for response planning
In alignment with the aforementioned IPC AMN Analytical Framework, Table 1 (also available in ► Classification Thresholds worksheet) suggests a core list of indicators, described according to:
BOX C. IPC TECHNICAL WORKING GROUP
Formed at either regional, national, or sub-national level, the IPC TWG should be hosted within an existing structure instead of creating a parallel single-purpose coordination body. Clear Terms of Reference (ToR) should be devised to ensure commitment to the IPC partnership; this includes purpose and memberships, roles and responsibilities of its members, chair, and co-chair, and its structure and working modalities. Formal agreement or signing of the ToR by senior management of all member organizations is strongly encouraged. For further information on this TWG, please contact the IPC GSU.
02 — Conduct a Nutrition Situation Analysis

Table 1. List of Core Nutrition Indicators to guide the Nutrition Situation Analysis
Category
Humanitarian Consequence Severity Scale based on IPC/OCHA phases
Alignment with IPC AMN Analytical
framework
Core Nutrition Indicators to guide response planning
Nutrition outcomes
(Contextual factors)
Key contributing factors
Acute and chronic malnutrition
Other causes
Acute malnutrition
Micronutrient deficiencies
Immediate causes (Food consumption)
Underlying causes (Caring and feeding practices)
Mortality indicators
Prevalence of GAM based on WHZ<-2 and/or bilateral pitting oedema among children 0-59 months (if no data, use 6-59 months)
Physical and Mental Well-being
Physical and Mental Well-being
Physical and Mental Well-being
Physical and Mental Well-being
Physical and Mental Well-being
Physical and Mental Well-being
Physical and Mental Well-being
Physical and Mental Well-being
Physical and Mental Well-being
Living Standards
Living Standards
Living Standards
Living Standards
Living Standards
Living Standards
Living Standards
Physical and Mental Well-being
Physical and Mental Well-being
<2.5%
<2.5%
<2.5% 2.5-4.9% 5-9.9% 10-14.9% ≥15%
<5%
<5%
<0.5
<5%
>70%
>70%
<1
5-9.9%
5-19.9%
5-19.9%
40-70%
40-70%
50-70%
40-60%
40-60%
20-39.9%
0.5-0.9 1-1.9 ≥2
20-39.9%
20-39.9%
20-39.9%
30-49.9%
20-39.9%
20-39.9%
10-19.9%
10-19.9%
<10%
<10%
<11%
<10%
<10%
1-1.9 2-3.9 ≥4
10-14.9% or 5-9.9%14 ≥15% or 10%-14.9%Ib
≥40%
≥40%
<12.6%
<5%
<5%
2.5-9.9%
2.5-4.9%
12.6-19.9%
5-9.9%
10-19.9%
5-9.9%
20-24.9%
5%-9.9%10%-14.9%
≥15%
10-14.9%
20-29.9%
10-14.9%
25-34.9%
15-29.9%
≥30%
≥15%
De Onis et al (2018) Prevalence thresholds for wasting, overweight, and stunting in children under 5 years
De Onis et al (2018) Prevalence thresholds for wasting, overweight, and stunting in children under 5 years
Preliminary thresholds suggested by Taskforce and NISWG members
HelpAge (2013) Nutrition Interventions for Older People in Emergencies
WHO (2011) Haemoglobin concentrations for the diagnosis of anaemia and assessment of severity
IPC Global Partners (2019) Integrated Food Security Phase Classification Technical Manual Version 3.0. Version 3.0.
Preliminary thresholds based on Somalia’s Food Security and Nutrition Analysis Unit (FSNAU)
Preliminary thresholds suggested by IPC Global Partners (2019) Integrated Food Security Phase Classification Technical Manual Version 3.0
PC Global Partners (2019) Integrated Food Security Phase Classification Technical Manual Version 3.0.
≥35%
≥30%
Prevalence of GAM based on MUAC12 <125mm and/or bilateral pitting oedema among children 6-59 months
Prevalence of GAM based on MUAC<210-230mm (depending on the country’s guidelines) among PLW
Prevalence of stunting based on HAZ <-2 among children U5
Prevalence of overweight based on WHZ>2 among children 0-59 months
Prevalence of GAM based on BMI-for-Age Z-Score<2 among Adolescents13
Prevalence of anemia (Hb <11g/dL) in pregnant women
Crude Death/Mortality Rate (deaths/ 10,000 persons/ day)
Prevalence of GAM based MUAC<210mm among Older People
Prevalence of anemia (Hb <11g/dL) in children 6-59 months
Minimum Dietary Diversity in children 6 to 23 months
Minimum Acceptable Diet in children 6 to 23 months*
Exclusive breastfeeding for infants 0-5 months
Infants 0-5 months that are not breastfed who have access to Breast Milk Substitutes supplies and support in line with the Code and the IFE Operational Guidance’s standards and recommendations
Infants 6-11 months that are not breastfed who have access to Breast Milk Substitutes supplies and support in line with the Code and the IFE Operational Guidance’s standards and recommendations
Preliminary thresholds suggested by IFE Core Group
Preliminary thresholds suggested by IFE Core Group
Adapted from UNICEF Breastfeeding Score Card
Preliminary thresholds suggested by IFE Core Group
Preliminary thresholds suggested by IFE Core Group
Under-five Death/Mortality Rate (deaths/ 10,000 children U5/ day)
U5 GAM ≥5% (Scenarios 1 and 2)
U5 GAM < 5% (Scenario 3)
Sources used for the thresholdsPhase 1 Acceptable/
Minimal
Phase 2 Alert/ Stress
Phase 3 Serious/ Severe
Phase 4 Critical/ Extreme
Phase 5 Extremely Critical/
Catastrophic
>70%
>60%
>60%
11-29.9%
10-19.9%
10-19.9%
Key contributing factors
Key contributing factors
Underlying causes (Immunization)
Living Standards
Living Standards
Living Standards
Living Standards
Physical and Mental Well-being
Physical and Mental Well-being
Physical and Mental Well-being
Physical and Mental Well-being
Physical and Mental Well-being
Physical and Mental Well-being
Physical and Mental Well-being
Physical and Mental Well-being
Physical and Mental Well-being
No thresholds proposed
No thresholds proposed
No thresholds proposed
No thresholds proposed
No thresholds proposed
No thresholds proposed
No thresholds proposed
No thresholds proposed
Water comes from an improved
water source, provided
collection time is not more than 30 minutes for
a roundtrip, including queuing
Water comes from an improved
source for which collection
time exceeds 30 minutes for
a roundtrip, including queuing
Water comes directly from rivers, lakes, ponds, etc
Number of HHs having access to an improved water source
Number of HHs having access to an improved water source
Number of HHs having access to a functional and improved sanitation facility
Number of HHs with access to functioning handwashing facilities, with water and soap available or % of HHs with access to soap
Coverage of DTC3 (DPT3 / PENTA3) in <1 year old, by administrative unit
Routine measles vaccination coverage (%)
Routine polio vaccination coverage (%)
Routine Vitamin A supplementation coverage (%)
Campaign measles vaccination coverage (%)
Campaign polio vaccination coverage (%)
Campaign Vitamin A supplementation coverage (%)
Measles vaccination coverage from surveys (%)
Polio vaccination coverage from surveys (%)
Corresponds to the number of households allocated to each answer choice in WASH specific assessments/ MSNA/ DTM or included in area-level assessments like SMART surveys as suggested by WASH colleagues for Joint Inter-sectoral Analysis Framework (JIAF). The majority percentage of HHs falling into one phase indicates the overall phase classification – see Limitations p.3. Please liaise with local Global WASH Cluster colleagues if using this indicator in the contributing factor analysis
This data may be available through projections, but if so, the quality of the data should be checked and noted. In some surveys data is collected from children aged 12-23 months. Please be sure to reference the age range that is the focus of the data. Only the first threshold has been tested and has evidence behind it. The others have been arbitrarily selected and should not be considered accurate measures at this stage
Not from the official GHC list of ‘core’ health indicators. Use of consensus and expert judgement based on country-level experts for the analysis of contributing factors
Water comes from an improved
water source which is located
on premises
Enough water for drinking,
cooking, personal hygiene and
other domestic purposes OR more than 50
l/d/p
Access to improved sanitation
facilities, not shared with other
households
> 90% 85% - 90% 75% - 85% 65% - 75% < 65%
Soap is available at home AND handwashing facility is on
premises with soap and water
available
Enough water for drinking AND
cooking AND personal hygiene,
BUT NOT for other domestic
purposes OR 15 or more but less
than 50 l/d/p
Access to improved sanitation
facilities, shared with less than 20
people
Enough water for drinking AND EITHER cooking
OR personal hygiene OR 9
or more but less than 15 l/d/p
Access to improved sanitation
facilities, shared with more than
20 people
Soap is available at home BUT no handwash-ing facility on premises with
soap and water
Enough water for drinking BUT NOT for cooking AND personal hygiene OR 3
or more but less than 9 l/d/p
Access to unimproved facilities OR access to improved
facilities shared with more than
50 people
Not enough water for drinking OR
Less than 3 l/d/p
Disposal of human faeces in open spaces or with solid waste
Soap is not available at home
Water comes from an
unimproved water source
Underlying causes (WASH)

Key contributing factors
Immediate causes (Health status)
Physical and Mental Well-being
Physical and Mental Well-being
Physical and Mental Well-being
Physical and Mental Well-being
Physical and Mental Well-being
Physical and Mental Well-being
Physical and Mental Well-being
Physical and Mental Well-being
Physical and Mental Well-being
Physical and Mental Well-being
No thresholds proposed
No thresholds proposed
Vitamin A supplementation coverage from surveys (%)
Coverage of all basic vaccinations from surveys (%)
Percentage of children aged six months to 15 years who have received measles vaccination
Number of cases or incidence rates for selected diseases relevant to the local context (cholera, measles, acute meningitis, others)
Case Fatality Ratio (CFR) for most common diseases
Proportion of children U5 with diarrhea in the last two weeks
Prevalence of HIV/AIDS
Proportion of children U5 with fever in malaria-risk areas
Proportion of children U5 who had Acute Respiratory Infections (ARI) in the last 2 weeks
Number of reported cases of cholera or Acute Watery Diarrhea (AWD)
This indicator is used to estimate vaccine coverage of the total EPI strategy. To avoid overestimation, measles vaccination coverage is used as proxy since it is usually lower than DPT3 coverage. Both indicators should be calculated on a yearly basis and can provide good indication of health system performance.
It is necessary to assess the quality of the available data. Only the first threshold has been tested and has evidence behind it. The others have been arbitrarily selected and should not be considered accurate measures at this stage
This indicator is primarily a country-level measurement and cannot be easily aggregated for use at higher levels. The list of diseases is context specific. Data collection can be problematic as health facility surveillance may have low sensitivity for conditions that do not commonly go to clinic. Access to health services is another factor. Please liaise with local GHC colleagues if using this indicator in the contributing factor analysis
Mixture of disease severity and of quality of health care. Most likely will be biased upwards because only more severe cases normally go to clinic. This indicator is primarily a country-level measurement and cannot be easily aggregated for use at higher levels. The list of diseases is context specific. Data collection can be problematic as health facility surveillance may have low sensitivity for conditions that do not commonly go to clinic. Access to health services is another factor. Please liaise with local GHC colleagues if using this indicator in the contributing factor analysis
Not from the official GHC list of ‘core’ health indicators. Use of consensus and expert judgement based on country-level experts for the analysis of contributing factors
<94-85% urban and camps
<89 - 84% in scattered or rural
areas
75%-85% <65%
>95% in camps /urban areas
>90% in scattered or rural
areas
No thresholds proposed
No thresholds proposed
No thresholds proposed
No thresholds proposed
No thresholds proposed
No thresholds proposed
No thresholds proposed, use of consensus and
expert judgement
This indicator is primarily a country-level
measurement and cannot be easily
aggregated for use at higher levels.
The list of diseases is context
specific. Data collection can
be problematic as health facility
surveillance may have low sensitivity for
conditions that do not commonly go
to clinic. Access to health services is
another factor
Number of cases for selected
diseases relevant to the local
context (e.g. cholera, measles, acute meningitis,
COVID-19)
Physical and Mental Well-
being
No thresholds proposed, use of consensus and
expert judgement
65%-75%
Corresponds to the number of households allocated to each answer choice in WASH specific assessments/ MSNA/ DTM or included in area-level assessments like SMART surveys as suggested by WASH colleagues for Joint Inter-sectoral Analysis Framework (JIAF). The majority percentage of HHs falling into one phase indicates the overall phase classification – see Limitations p.3. Please liaise with local Global WASH Cluster colleagues if using this indicator in the contributing factor analysis
This data may be available through projections, but if so, the quality of the data should be checked and noted. In some surveys data is collected from children aged 12-23 months. Please be sure to reference the age range that is the focus of the data. Only the first threshold has been tested and has evidence behind it. The others have been arbitrarily selected and should not be considered accurate measures at this stage
Not from the official GHC list of ‘core’ health indicators. Use of consensus and expert judgement based on country-level experts for the analysis of contributing factors
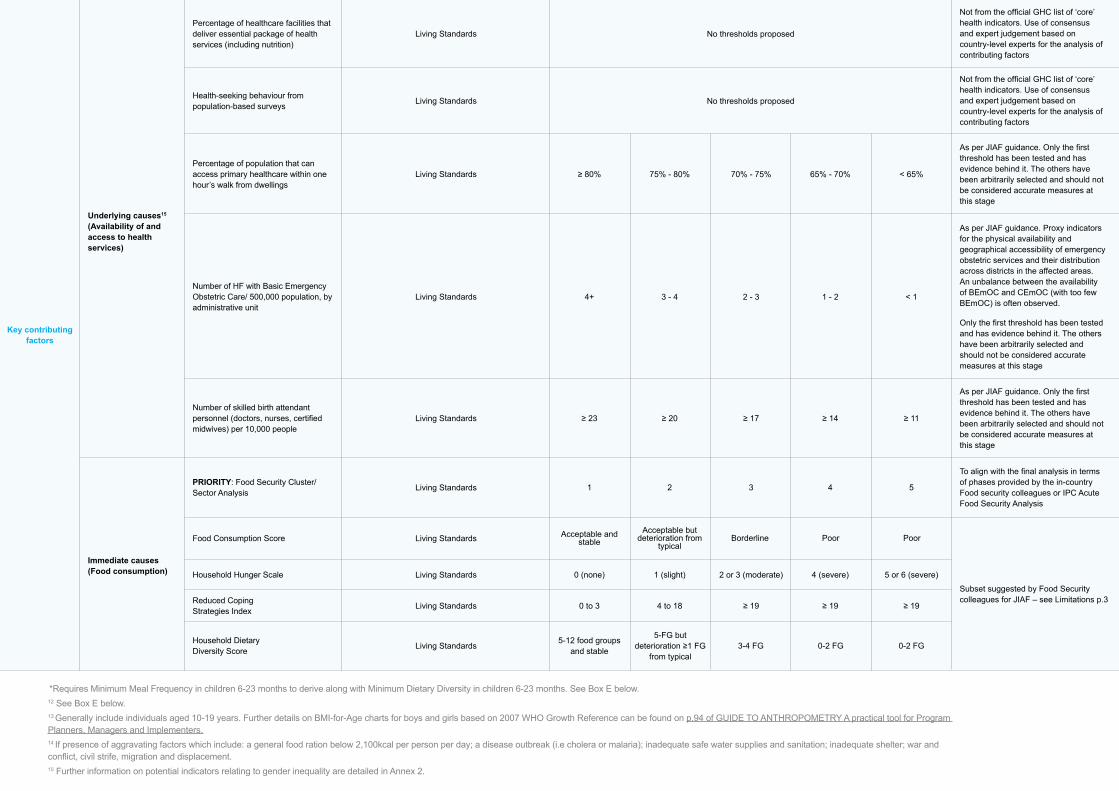
Underlying causes15 (Availability of and access to health services)
Immediate causes (Food consumption)
Living Standards
Living Standards
Living Standards
Living Standards
Living Standards
Living Standards
Living Standards
Living Standards
Living Standards
Living Standards
Percentage of healthcare facilities that deliver essential package of health services (including nutrition)
PRIORITY: Food Security Cluster/Sector Analysis
Food Consumption Score
Household Hunger Scale
Reduced Coping Strategies Index
Household Dietary Diversity Score
Health-seeking behaviour from population-based surveys
Percentage of population that can access primary healthcare within one hour’s walk from dwellings
Number of HF with Basic Emergency Obstetric Care/ 500,000 population, by administrative unit
Number of skilled birth attendant personnel (doctors, nurses, certified midwives) per 10,000 people
Not from the official GHC list of ‘core’ health indicators. Use of consensus and expert judgement based on country-level experts for the analysis of contributing factors
Not from the official GHC list of ‘core’ health indicators. Use of consensus and expert judgement based on country-level experts for the analysis of contributing factors
As per JIAF guidance. Only the first threshold has been tested and has evidence behind it. The others have been arbitrarily selected and should not be considered accurate measures at this stage
As per JIAF guidance. Proxy indicators for the physical availability and geographical accessibility of emergency obstetric services and their distribution across districts in the affected areas. An unbalance between the availability of BEmOC and CEmOC (with too few BEmOC) is often observed.
Only the first threshold has been tested and has evidence behind it. The others have been arbitrarily selected and should not be considered accurate measures at this stage
As per JIAF guidance. Only the first threshold has been tested and has evidence behind it. The others have been arbitrarily selected and should not be considered accurate measures at this stage
To align with the final analysis in terms of phases provided by the in-country Food security colleagues or IPC Acute Food Security Analysis
Subset suggested by Food Security colleagues for JIAF – see Limitations p.3
≥ 80%
4+
≥ 23
1
0 (none)
0 to 3
5-12 food groups and stable
75% - 80%
3 - 4
≥ 20
2
1 (slight)
4 to 18
5-FG but deterioration ≥1 FG
from typical
70% - 75%
2 - 3
≥ 17
3
2 or 3 (moderate)
≥ 19
3-4 FG
65% - 70%
1 - 2
≥ 14
4
4 (severe)
≥ 19
0-2 FG
< 65%
< 1
≥ 11
5
5 or 6 (severe)
≥ 19
0-2 FG
Key contributing factors
No thresholds proposed
No thresholds proposed
Acceptable and stable
Acceptable but deterioration from
typicalBorderline Poor Poor
*Requires Minimum Meal Frequency in children 6-23 months to derive along with Minimum Dietary Diversity in children 6-23 months. See Box E below.12 See Box E below.13 Generally include individuals aged 10-19 years. Further details on BMI-for-Age charts for boys and girls based on 2007 WHO Growth Reference can be found on p.94 of GUIDE TO ANTHROPOMETRY A practical tool for Program Planners, Managers and Implementers.14 If presence of aggravating factors which include: a general food ration below 2,100kcal per person per day; a disease outbreak (i.e cholera or malaria); inadequate safe water supplies and sanitation; inadequate shelter; war and conflict, civil strife, migration and displacement.15 Further information on potential indicators relating to gender inequality are detailed in Annex 2.

23nutrition humanitarian needs analysis guidance
Not from the official GHC list of ‘core’ health indicators. Use of consensus and expert judgement based on country-level experts for the analysis of contributing factors
Not from the official GHC list of ‘core’ health indicators. Use of consensus and expert judgement based on country-level experts for the analysis of contributing factors
As per JIAF guidance. Only the first threshold has been tested and has evidence behind it. The others have been arbitrarily selected and should not be considered accurate measures at this stage
As per JIAF guidance. Proxy indicators for the physical availability and geographical accessibility of emergency obstetric services and their distribution across districts in the affected areas. An unbalance between the availability of BEmOC and CEmOC (with too few BEmOC) is often observed.
Only the first threshold has been tested and has evidence behind it. The others have been arbitrarily selected and should not be considered accurate measures at this stage
As per JIAF guidance. Only the first threshold has been tested and has evidence behind it. The others have been arbitrarily selected and should not be considered accurate measures at this stage
To align with the final analysis in terms of phases provided by the in-country Food security colleagues or IPC Acute Food Security Analysis
Subset suggested by Food Security colleagues for JIAF – see Limitations p.3
BOX D. PREPARATION FOR AN IPC ACUTE MALNUTRITION ANALYSIS
Indicative timeline: usually April-October, depending on the seasonality and availability of assessment data.A request to the IPC Global Support Unit and the GNC-CT starts the discussion on whether support would be available to conduct a quality IPC AMN analysis within feasible timelines. An IPC AMN analysis requires:
• adequately trained analysts (i.e. technical officers) from relevant agencies and sectors, along with a chairperson from the government when feasible;
• in-country and/or regional stakeholders informed about the analysis process and po-tential dates for the analysis workshop;
• clear consensus on the unit of analysis, geo-graphical scope and validity period to ensure that minimum evidence requirements are met when evaluating against the reliability criteria (Figure 2);
• logistical and financial arrangements for the analysis workshop – this depends on the availability of financial and human resources to conduct analysis at the level of the intend-ed unit of analysis, and the feasibility of the number of units to be analysed and classified should be considered;
• preparation of the IPC AMN protocols (i.e. analysis worksheets, communication tem-plates, etc).
The following set of standardized steps according to scenar-io aims to provide a common approach for classifying the severity of malnutrition and identifying its key drivers in order to ensure applicability across contexts allowing decision-mak-ers to compare situations between one area and another, both within and across countries. For Scenarios 1 & 2 where GAM prevalence is ≥5%, an IPC AMN analysis should be ideally used or planned for – see Box D below for more details.
16 Reliability of the nutrition outcome data in terms of time relevance and soundness of method described in Figure 2 above.
17 This may be the case during a health epidemic or pandemic, or others events causing widespread mobility restrictions that would affect primary data collection – further details on recommendations can be found here.
A number of key considerations and potential adaptations (Table 3) when consolidating available and reliable16 evidence may be required prior to achieving consensus for the Nutri-tion Situation Analysis. Aimed at building consensus, the time required and the contextual factors at play when classifying and describing malnutrition conditions and their key contribu-tors as accurately as possible need to be well understood at the onset. Achieving mutual agreement based on the available data and a good understanding of the context of the area analyzed isn’t always obvious and requires careful stewardship to mitigate against bias, encourage openness and in some cases, reconcile interpersonal conflicts. This is of particular importance when using outdated nutrition outcome data17 in conjunction with recent data on contributing factors – see Box E below.
Malawi© UNICEF/UNI304526/Nyirenda
02 — Conduct a Nutrition Situation Analysis

Areesheh, Siria© UNICEF/ UNI273829/Aminnutrition humanitarian needs analysis guidance24
BOX E. KEY CONSIDERATIONS WHEN USING OUTDATED NUTRITION OUTCOME DATA
In situations where there is a lack of up-to-date nutrition outcome data (i.e. GAM dating from ≥2 years ago), it is important to consider the following when conducting your nutrition situation analysis:
1. Review outdated GAM prevalence along with results from contributing factors during that same period and draw some initial assumptions while taking into account the context;
2. Using the IPC AMN analytical framework, review this set of initial assumptions on what may be the current level of GAM (e.g. reduction/constant/deterioration expected) that take into account:
• availability of recent data on contributing factors (e.g. infant and young child feeding practices, dietary intake, morbidity, access to health and WASH services, household food security, feeding and care practices, poverty etc.) and whether similar trends from the outdated GAM may apply;
• review of recent performance data from pro-grammes and routine systems (i.e. CMAM data, IYCF counselling and sessions, growth monitor-ing, immunization, micronutrient supplementation, social protection, etc.) and compare to previous years to identify any changes in trends of chang-es on nutrition outcome data other than seasonal changes;
3. Discuss amongst representatives how these prelimi-nary assumptions would affect the outdated nutrition outcomes data in terms of severity classification (i.e. if any changes in phases);
4. Document the final assumptions agreed upon by the representatives and how, if any, these assump-tions adjusted the severity classification for the current nutrition situation analysis and its effects on the calculation of the number of people in nutritional need. These considerations may differ slightly in contexts conducting an IPC AMN analysis when discussing projections.
02 — Conduct a Nutrition Situation Analysis

25nutrition humanitarian needs analysis guidance
Table 3. List of considerations and adaptations when conducting the Nutrition Sectoral Analysis
Unit of Analysis Key Considerations and Potential Adaptations to Available Nutrition Data
Affected geographical area
(Provinces, districts, sub-districts, municipalities, villages, settlements, etc.)
Based on available nutrition outcome data collected by reliable population-based surveys, ideally representative for a given affected geographical area.
For Scenarios 1 & 2, GAM based on WHZ18 data from surveys designed to be representa-tive at a higher administrative level than the unit of analysis, under some specific circum-stances (see below), can be re-analysed to obtain estimates for lower administrative units and used in the analysis. The main deciding factor in the case of disaggregated survey data is the design effect19:
• If the design effect of the GAM based on WHZ from the higher administrative-level survey is <1.3, this higher administrative-level estimate can be used for all lower administrative levels without disaggregating the data.
• If the design effect of the GAM based on WHZ obtained at the higher administrative level is between 1.3 and 1.7, the data should be disaggregated for lower administrative levels with ≥5 clusters and ≥100 observations, and the disaggregated estimates can be used based on the design effect: • If design effect ≤1.7: use the point estimate. • If the design effect >1.7, use the lower bound of 95% confidence interval as the minimum phase (Note that
minimum phase refers to the phase that an area would be classified as being in based on the lower bound of the Confidence Interval – i.e. the area would be at least in this phase). This is only an indicative phase. The final phase for the area should be decided by taking into account this indicative phase as well as the phases based on the point estimate and the upper Confidence Interval and with convergence of evidence with the contributing factors.
• If the design effect of the GAM based on WHZ obtained at the higher administrative level is >1.7, these survey data should not be disaggregated for lower administrative levels.
For Scenarios 2 and 3 ONLY, if there is a gap in recent population-based survey data, consider using historical data to determine the severity classification based on the 5-phases per relevant indicator (see Table 1). Alternatively, consider using existing survey data from comparable areas to identify which phase classification of severity would be relevant for the affected geographical area in question.
For Scenario 3, similar considerations can be done for Chronic Malnutrition (Prevalence of stunting based on HAZ<-2) and relevant Micronutrient Deficiencies data (and only when applicable, Overnutrition can be taken into account) among children U5 and vulnerable groups based on the reliability of the data in terms of time relevance and soundness of method (see Figure 2 above).
Affected groups
(IDPs, host communities, refugees, non-displaced affected populations, etc)
Based on available nutrition outcome data collected by reliable population-based surveys, ideally representative for a given affected geographical area.
For all Scenarios, if the survey objectives did not disaggregate results by affected popula-tion group, then one cannot assume differences between affected groups and the results are representative across all affected groups present in the surveyed areas unless other reliable data shows otherwise. Therefore, the prevalence data can be repeated for each affected group present within a given geographical area.
If data is available per different affected group (i.e. host communities and refugees), disag-gregate raw data accordingly per affected geographical area. Ensure that the subsequent steps follow the same disaggregation since evidence is available to support findings.
02 — Conduct a Nutrition Situation Analysis
18 Similarly to IPC AMN’s parameters for analysis, a preference for GAM based on WHZ is put forward. GAM based on MUAC may only be used in the absence of GAM based on WHZ. In exceptional cases where GAM based on MUAC portrays a much more severe situation than GAM based on WHZ (i.e. two or more phases higher), GAM based on MUAC should also be taken into account along with a critical analysis of the contributing factors before a final phase is determined.
19 Based on the IPC AMN guidance. If ever these considerations based on the design effect cannot be undertaken, access the raw data and re-run the analysis to obtain the design effect. Based on the obtained design effect, apply the key considerations listed above.

Malawi, 2020© UNICEF/UNI303004
26 nutrition humanitarian needs analysis guidance
Demographic groups
(Sex, age disaggregated by relevant year intervals)
Based on available nutrition outcome data collected by reliable population-based surveys, ideally representative for a given affected geographical area and disaggregated by sex and age groups (automatically available in SMART survey reports).
If not readily available, access to the raw survey data can facilitate these changes by uploading the data into ENA for SMART software and running the reports again. Otherwise, the country-level percentage of boys vs. girls under-five (OCHA generally has this informa-tion) can be applied to the results based on the total U5 population to obtain sex-disaggre-gated results.
For age disaggregated data, having U5-specific data and results should be sufficient. For further disaggregation, rough estimates should be available at country-level for 0-5 months, 6-23 months and 24-59 months; this breakdown is generally generated automatically in the SMART survey reports.
Groups with specific needs
(PLW, Older People, disability, etc.)
Based on available nutrition outcome data collected by reliable population-based surveys. For Nutrition, PLW and in certain contexts, Older People, are common, nutritionally vulner-able target groups and therefore to ensure that their nutritional needs have been accounted for when conducting the Nutrition Situation Analysis.
For disability-disaggregated data, rough estimates should be available at country-level (check with the Protection Cluster); otherwise one can assume 15% of the total population and 10% for the children population. Therefore, these percentages can be applied to the overall results for the total target population groups to obtain disability-disaggregated results.
Specific contextual or vulnerability categories
(Rural/urban, specific eth-nic/minority groups, etc.)
Based on available nutrition outcome data collected by reliable population-based surveys. For each of these vulnerabilities, rough estimates should be available at country-level by the Protection Cluster. These estimates can be applied to the overall results per population target group to obtain disaggregated results.
02 — Conduct a Nutrition Situation Analysis

Aleppo, Syrian Arab Republic© UNICEF/UNI271372/Al-Issa
27nutrition humanitarian needs analysis guidance
SCENARIO 1Humanitarian situations where the prevalence of U5 GAM is ≥5% with an existing IPC Acute Malnutrition (AMN) analysis
SCENARIO 2Humanitarian situations where the prevalence of U5 GAM is ≥5% and no IPC AMN analysis can be conducted
• ► Insert the prevalence per geographical area for U5 GAM based on WHZ in column B. This prevalence will be the primary source for the classification, done automatically in column E.
• In cases where U5 GAM based on WHZ is not available, ► insert U5 GAM based on MUAC in column C. A prompt to “provide justification for value” is given where details should be included in column F.
• ► Insert the prevalence of PLW GAM based on MUAC in column D. Only in rare cases where neither U5 GAM based on WHZ or MUAC are available will this be used for classification, otherwise it will be used for the upcoming PiN calculation.
1. Access and review the existing IPC AMN classification al-ready conducted at country-level based on the IPC Acute Malnutrition Reference Table for phase characteristics, and thresholds of international standards;
2. Review the indicators used for the IPC AMN analysis, with GAM for U5 girls and boys being at the forefront. Ensure to include different lenses when analyzing the data while accounting for the ratio between boys and girls. For exam-ple, female-headed households may have lower food con-sumption scores than their male counterparts. Similarly, the female eco-stability principle in certain circumstances of food scarcity20 may contribute to higher levels of malnu-trition in boys than in girls;
3. Review the validity period of existing IPC AMN severity classification. If situation has significantly changed, use IPC guidance on updating the analysis;
4. Use the results of the IPC AMN analysis for your Nutrition Situation analysis.
1. Contact the GNC-CT to discuss the feasibility of preparing an IPC AMN analysis – see Box D on key steps and con-siderations. If feasible and in accordance with the GNC-CT, conduct an IPC AMN and use its results. Otherwise, the GNC-CT can support the following steps– please note that this is an exceptional option and can only be used after consultation with the GNC-CT wherein no possible option to conduct the IPC AMN in-country was found.
2. Use the IPC Acute Malnutrition Framework (see Annex 1) to guide the convergence of evidence for this analysis;
3. Respect the key parameters as the rules for severity classification – see ► Scenario 2 Nut. Analysis worksheet of the Nutrition Cluster Nutrition Humanitari-an Needs Analysis Calculation Tool:
3.1 Conduct the severity classification of GAM based on the thresholds from Table 1
02 — Conduct a Nutrition Situation Analysis
20 Further details on the female eco-stability principle can be found here.

28 nutrition humanitarian needs analysis guidance
• ► Insert the prevalences per geographical area for available Contextual factors and Living Stan-dards indicators in columns B-L. Note that Mini-mum Meal Frequency for children 6-23 months is used here over the composite indicator Minimum Acceptable Diet in children 6-23 months.
• ► Insert the death rates per geographical area for available Crude Death Rate and U5 Death Rate indicators in columns M-N.
• ► Insert the corresponding phase number (see ► Classification thresholds worksheet for details) per relevant Food Security, WASH, and Health indicators for each geographical area in columns O-AN.
• A qualitative analysis of key contributing factors will be done per completed column similar to the IPC AMN analysis based on the following cut-offs:
3.2 Conduct an analysis of key contributing/contextual factors based on thresholds from Table 1 using ► Scenario 2 Con-tributing Fact. of the Nutrition Cluster Nutrition Humanitar-ian Needs Analysis Calculation Tool based on the following:
4. Ensure to include different lenses when analyzing the data while accounting for the ratio between boys and girls; for example, the access to nutrition services may be different for men and women;
5. Prepare the report using the consensus of severity clas-sification and its key contributing factors for geographical prioritization – review Box E above in case of outdated nutrition outcome data;
6. Summarize the reliability of all evidence used in ► Reli-ability of Evidence Used worksheet based on the scores provided in the aforementioned IPC AMN’s Figure 2;
7. Present findings21 to decision-makers based on key points from Annex 5 while highlighting any population move-ments and accessibility issues to take into consideration;
8. Document any resource gaps, including capacity and ev-idence gaps, to inform future Nutrition Situation Analyses to the GNC-CT and/or IPC Global Support Unit on any technical and implementation issues for the development and review of existing guidance and training materials.
02 — Conduct a Nutrition Situation Analysis
21 Including details on the critical reasoning used for the current period, particularly when convergence of evidence is used to arrive at a conclusion, sources of evidence used and its analysis, brief description of the population characteristics per geographical area, time period of the analysis (i.e. validity period), key drivers of acute malnutrition and any limitations of the situation analysis.
Phase 1 Acceptable/
Minimal
No contributing factor
Minor contributing factor
Major contributing factor
Critical contributing factor
Phase 2 Alert/ Stress
Phase 3 Serious/ Severe
Phase 4 Critical/ Extreme
Phase 5 Extremely
Critical/ Catastrophic
No data

29nutrition humanitarian needs analysis guidance
Phase 1 Acceptable/
Minimal
PREMIMINARY SCORING SYSTEM
1,00
0,11
0,11
0,11
0,05
0,05
0,05
0,11
0,11
0,10
0,10
0,10
5,00
0,55
0,55
0,55
0,25
0,25
0,25
0,55
0,55
0,50
0,50
0,50
14,00
1,54
1,54
1,54
0,70
0,70
0,70
1,54
1,54
1,40
1,40
1,40
30,00
3,30
3,30
3,30
1,50
1,50
3,00
3,00
3,30
1.50
3,30
3,00
50,00
9,17
55%
30%
15%
9,17
9,17
3,75
3,75
7,50
7,50
100.00
Prevalence of exclusive breastfeeding for children 0-5 months
Minimum Dietary Diversity in children 6-23 months (if available, use Minimum Acceptable Diet children 6-23 months)
Stunting prevalence (HAZ) for children 0-59 months
GAM prevalence % for Older People (MUAC<210mm)
GAM prevalence % for Adolescents (BMI-for-Age)
For country inputs (if relevant)
Prevalence of overweight in children 0-59 months
Prevalence of anemia in children 6-59 months
Prevalence of anemia in pregnant women
% of infants 0-5 months that are not breastfed who have access to BMS supplies and support
% of infants 6-11 months that are not breastfed who have access to BMS supplies and support
Phase 2 Alert/ Stress
Phase 3 Serious/ Severe
Phase 4 Critical/ Extreme
Phase 5 Extremely Critical/
Catastrophic
22 The rationale is based on a three-tiered scoring system proposed by the GNC Taskforce where the indicators in purple represent 55% of the total amount of points per phase, those in blue 30% and those in green only 10%. For example, if the Stunting prevalence in U5 is in Phase 3, this will receive 1,54 points versus the prevalence of GAM in Older People only receiving 0.7 points. For any missing data, the accompanying Spreadsheet tool will automatically assume a Phase 1 for that indicator. This breakdown is not based on hard evidence, rather the assumed vulnerability and reliability of these 10 indicators for this scenario – see Limitations on p.3.
1. Use the IPC Acute Malnutrition Framework (see Annex 1) to guide the convergence of evidence for this analysis;
In the ► Scenario 3 Nut. Analysis worksheet, conduct the severity classification using a preliminary scoring system in columns P-U that takes into account both vulnerability of the target groups and reliability of these 10 indicators22 (taking note of using Minimum acceptable Diet for children 6-23 months if available) deemed relevant for this scenario. An optional 11th
SCENARIO 3Humanitarian situations where the prevalence of U5 GAM is <5%
02 — Conduct a Nutrition Situation Analysis
indicator with fixed number of associated points (see last row below) is included for country inputs if deemed necessary given its context - for example, the prevalence of acute malnu-trition based on WHZ (see Table 1 above for other indicators to consider). It is not recommended to include mortality indicators unless only non-traumatic deaths are accounted for. By default, Phase 1 is assumed for all of these indicators for Scenario 3’s preliminary scoring system (see Limitations)

30 nutrition humanitarian needs analysis guidance
• ► Insert the death rates per geographical area for available Crude Death Rate and U5 Death Rate indi-cators in columns B-C.
• ► Insert the corresponding phase number (see ► Classification thresholds worksheet for details) per relevant Food Security, WASH, and Health indicators for each geographical area in columns D-AC.
• A qualitative analysis of key contributing factors will be done per completed column similar to the IPC AMN analysis based on the following cut-offs:
Phase 1 Acceptable/
Minimal
<=4 5-13 14-29 30-49 >=50Preliminary cut-offs based on score
TABLE OF INTERPRETATION
Phase 2 Alert/ Stress
Phase 3 Serious/ Severe
Phase 4 Critical/ Extreme
Phase 5 Extremely Critical/
Catastrophic
1.1 ► Insert the prevalence per geographical area for any of the readily available indicators in columns B-L.
1.2 An automatic classification based on thresholds from Table 1 will be done in these columns. Based on this clas-sification, the associated number of points will be taken and added in column M.
1.3 Based on the total number of points calculated, the as-sociated severity classification per geographical area will be automatically provided in column N using the following preliminary cut-offs (see Limitations):
Phase 1 Acceptable/
Minimal
No contributing factor
Minor contributing factor
Major contributing factor
Critical contributing factor
Phase 2 Alert/ Stress
Phase 3 Serious/ Severe
Phase 4 Critical/ Extreme
Phase 5 Extremely
Critical/ Catastrophic
No data
02 — Conduct a Nutrition Situation Analysis
2. Conduct an analysis of key contributing/contextual factors based on thresholds from Table 1 using ► Scenario 3 - Contributing Fact. of the Nutrition Cluster Nutrition Humanitarian Needs Analysis Calculation Tool based on the following:

31nutrition humanitarian needs analysis guidance
23 Including details on the critical reasoning used for the current period, particularly when convergence of evidence is used to arrive at a conclusion, sources of evidence used and its analysis, brief description of the population characteristics per geographical area, time period of the analysis (i.e. validity period), key drivers of acute malnutrition and any limitations of the situation analysis.
02 — Conduct a Nutrition Situation Analysis
Village Ð Rajnandgaon, Raipur, India© UNICEF/UNI281384/Mukherjee
3. Ensure to include different lenses when analyzing the data while accounting for the ratio between boys and girls. For example, female-headed households may have lower food consumption scores than their male counterparts;
4. Prepare the report using the consensus of severity classi-fication based on ► Scenario 3 Nut. Analysis and its key contributing factors for geographical prioritization - review Box E above in case of outdated nutrition outcome data;
5. Summarize the reliability of all evidence used in ► Reli-ability of Evidence Used worksheet based on the scores provided in the aforementioned IPC AMN’s Figure 2;
6. Present findings23 to decision-makers based on key points from Annex 5 while highlighting any population move-ments and accessibility issues to take into consider-ation;
7. Document any resource gaps, including capacity and evidence gaps, to inform future Nutrition Situation Analy-ses to the GNC-CT on any technical and implementation issues for the development and review of existing guid-ance and training materials.

Prepare key nutrition figures for the Humanitarian Needs Overview and subsequent Response Plan
3
Liberia© UNICEF/UNI275401/Schermbrucker

Mauritania© UNICEF/UNI353698/Pouget
33nutrition humanitarian needs analysis guidance
3. Prepare key nutrition figures for the Humanitarian Needs Overview and subsequent Response Plan (only applicable to IASC Clusters)Indicative timeline: In parallel with the Nutrition Situation Analysis.
The results of the Nutrition Situation analysis feed into the HNO and HRP population figures defined in Figure 3 and Table 2 in Annex 4, where this commonly requested information in humanitarian situations provides the backbone to any human-itarian operation. Inconsistent terminology, unclear method-ologies and a lack of transparent, coordinated and standard-ized data gathering frequently result in humanitarian actors operating with different information. In parallel, understanding the magnitude of the situation at different levels of severity supports the response planning by identifying the number of People in Need (PiN), conducted per sector and inter-sectoral-ly (addressed in Addendum 1 on JIAF).
For the Nutrition Cluster, PiN is a sum of the number of persons in nutritional need, by humanitarian consequence, in each geographical area based on the situation analysis of data/information. Using the Nutrition Cluster Nutrition Humanitarian Needs Analysis Calculation Tool, the PiN needs to be calculated for each specific nutritional need and expressed as such, where the HNO already serves as a projection of nutritional needs for the coming year. Once the PiN is derived, an estimation on the PiN facing humanitar-ian access constraints can be determined. The calculation is based on the estimated incidence or prevalence of people that need the specific service (e.g. the number of U2 children that are affected by the humanitarian situation and need nutrition-al support through an IYCF programme). Regardless of the nature of the humanitarian situation, diverse Essential Nutrition Actions (ENAs)24 would affect the determinants of optimum nutrition, growth and development through nutrition-specific and nutrition-sensitive interventions (Figure 4).
03 — Prepare key nutrition figures for the Humanitarian Needs Overview and subsequent Response Plan
24 World Health Organization (2019) Essential nutrition actions: mainstreaming nutrition through the life-course

34 nutrition humanitarian needs analysis guidance
Figure 4. Subset of areas of focus drawn from WHO’s ENAs
Essential Nutrition ActionsContext (all settings vs targeted)
Others sectors Involved
1. Infants
2. Children
4. Adults
5. Older persons
3. Adolescents
A. Optimal timing of umbilical cord clamping
A. Appropriate complementary feeding
A. Nutritional care of woman during pregnancy and postpartum
B. Growth monitoring and assessment
C. Assessment and management of wasting
D. Iron-containing micronutrient supplementation
E. Vitamin A supplementation
F. Iodine supplementation
G. Zinc supplementation in the management of diarrhoea
A. Iron-containing micronutrient supplementation
B. Iron-containing micronutrient supplementation
C. Iodine supplementation
A. Nutritional care for at-risk older persons
Education, trade and industry
Education, trade and industry
Labour (maternity protection and parental leave)
Education
Education, trade and industry
Education, trade and industry
Education, trade and industry
Education, trade and industry
Education, trade and industry
Education, trade and industry
Education, trade and industry
Education, trade and industry
Education, trade and industry
B. Protecting, promoting and supporting breastfeeding
C. Care of low-birth-weight and very low-birth-weight infants
D. Assessment and management of wasting
E. Vitamin A supplementation for infants under 6 months of age
Labour (maternity protection), water, sanitation and hygiene (WASH)
All
All
All
All
Targeted
Targeted
Targeted
Targeted
Targeted
Targeted
Targeted
Targeted
Targeted
All
Targeted
Targeted
Targeted
03 — Prepare key nutrition figures for the Humanitarian Needs Overview and subsequent Response Plan
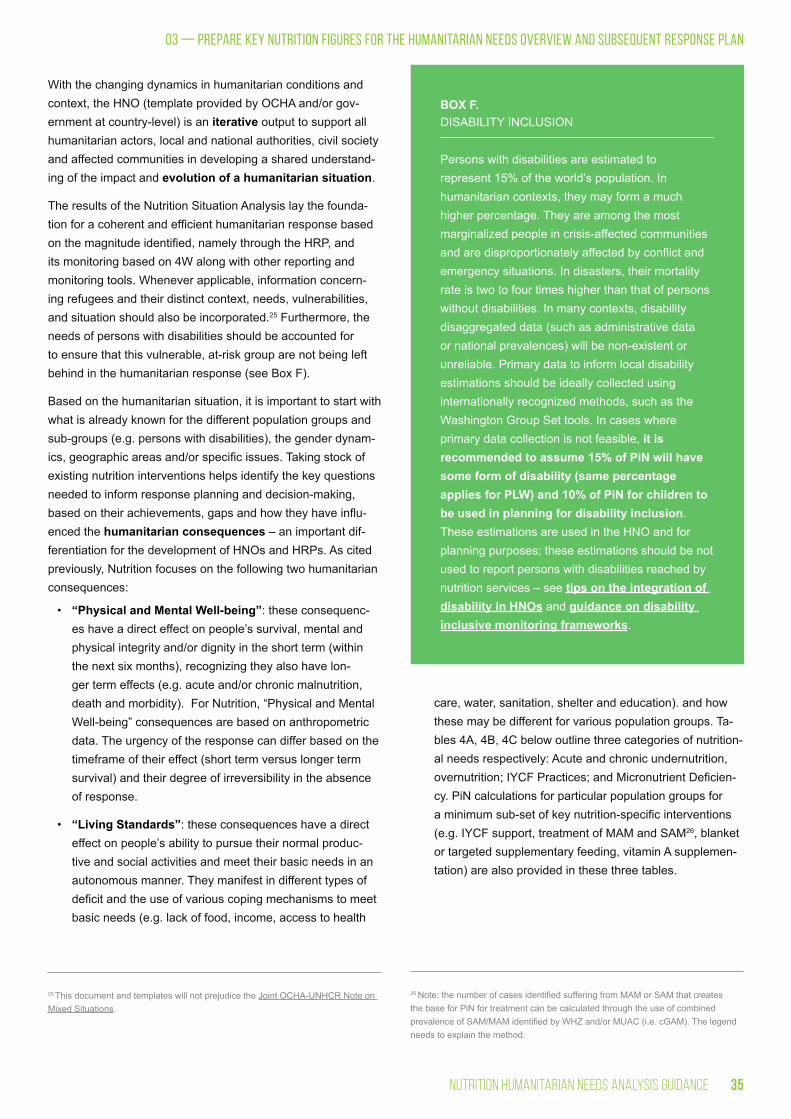
35nutrition humanitarian needs analysis guidance
03 — Prepare key nutrition figures for the Humanitarian Needs Overview and subsequent Response Plan
With the changing dynamics in humanitarian conditions and context, the HNO (template provided by OCHA and/or gov-ernment at country-level) is an iterative output to support all humanitarian actors, local and national authorities, civil society and affected communities in developing a shared understand-ing of the impact and evolution of a humanitarian situation.
The results of the Nutrition Situation Analysis lay the founda-tion for a coherent and efficient humanitarian response based on the magnitude identified, namely through the HRP, and its monitoring based on 4W along with other reporting and monitoring tools. Whenever applicable, information concern-ing refugees and their distinct context, needs, vulnerabilities, and situation should also be incorporated.25 Furthermore, the needs of persons with disabilities should be accounted for to ensure that this vulnerable, at-risk group are not being left behind in the humanitarian response (see Box F).
Based on the humanitarian situation, it is important to start with what is already known for the different population groups and sub-groups (e.g. persons with disabilities), the gender dynam-ics, geographic areas and/or specific issues. Taking stock of existing nutrition interventions helps identify the key questions needed to inform response planning and decision-making, based on their achievements, gaps and how they have influ-enced the humanitarian consequences – an important dif-ferentiation for the development of HNOs and HRPs. As cited previously, Nutrition focuses on the following two humanitarian consequences:
care, water, sanitation, shelter and education). and how these may be different for various population groups. Ta-bles 4A, 4B, 4C below outline three categories of nutrition-al needs respectively: Acute and chronic undernutrition, overnutrition; IYCF Practices; and Micronutrient Deficien-cy. PiN calculations for particular population groups for a minimum sub-set of key nutrition-specific interventions (e.g. IYCF support, treatment of MAM and SAM26, blanket or targeted supplementary feeding, vitamin A supplemen-tation) are also provided in these three tables.
• “Physical and Mental Well-being”: these consequenc-es have a direct effect on people’s survival, mental and physical integrity and/or dignity in the short term (within the next six months), recognizing they also have lon-ger term effects (e.g. acute and/or chronic malnutrition, death and morbidity). For Nutrition, “Physical and Mental Well-being” consequences are based on anthropometric data. The urgency of the response can differ based on the timeframe of their effect (short term versus longer term survival) and their degree of irreversibility in the absence of response.
• “Living Standards”: these consequences have a direct effect on people’s ability to pursue their normal produc-tive and social activities and meet their basic needs in an autonomous manner. They manifest in different types of deficit and the use of various coping mechanisms to meet basic needs (e.g. lack of food, income, access to health
25 This document and templates will not prejudice the Joint OCHA-UNHCR Note on Mixed Situations.
26 Note: the number of cases identified suffering from MAM or SAM that creates the base for PiN for treatment can be calculated through the use of combined prevalence of SAM/MAM identified by WHZ and/or MUAC (i.e. cGAM). The legend needs to explain the method.
BOX F. DISABILITY INCLUSION
Persons with disabilities are estimated to represent 15% of the world’s population. In humanitarian contexts, they may form a much higher percentage. They are among the most marginalized people in crisis-affected communities and are disproportionately affected by conflict and emergency situations. In disasters, their mortality rate is two to four times higher than that of persons without disabilities. In many contexts, disability disaggregated data (such as administrative data or national prevalences) will be non-existent or unreliable. Primary data to inform local disability estimations should be ideally collected using internationally recognized methods, such as the Washington Group Set tools. In cases where primary data collection is not feasible, it is recommended to assume 15% of PiN will have some form of disability (same percentage applies for PLW) and 10% of PiN for children to be used in planning for disability inclusion. These estimations are used in the HNO and for planning purposes; these estimations should be not used to report persons with disabilities reached by nutrition services – see tips on the integration of disability in HNOs and guidance on disability inclusive monitoring frameworks.

36 nutrition humanitarian needs analysis guidance
03 — Prepare key nutrition figures for the Humanitarian Needs Overview and subsequent Response Plan
Each of these tables summarizes key considerations when calculating PiN per nutritional need based on the following:
Each of these tables summarizes key considerations when calculating PiN per nutritional need based on the following:
• Nutritional need (Essential Nutrition Actions): based on the three categories detailed above and the corre-sponding ENAs (if available);
• Alignment with a subset of High Impact Nutrition Interventions: a series of nutrition-specific interventions promoted by the WHO to address these nutritional needs;
• Potential population groups to include: population groups in need of specific NiE interventions, with children aged 0-23 months, 0-59 months (U5), PLW, older people being a few examples. The decision on the selection of the groups to be included should be based on the analysis of the nutrition situation and other relevant information;
• Indicators and key considerations: list of core (with GAM being split by SAM and MAM) and other relevant indicators taken from the Global Nutrition Cluster’s Indicator Registry and Framework with key consider-ations in their estimation. If cGAM28 is available at country level, cGAM (along with its derivatives of cMAM and cSAM) will be preferred for Nutrition PiN calculations;
• PiN Calculation formulas: Clear formulas per relevant indicator are included. Disaggregation by sex, age group and disability should be done when data are available. The Nutrition Cluster HNO Calculation Tool Version 1, derived from the Global Nutrition Cluster’s Indicator Regis-try and Framework and its Caseload Calculation Tool, can be used to automatically calculate the number of persons based on a series of detailed steps using ► PiN work-sheets. The process must be well documented to show where the numbers stop being representative and where the expert opinion beings to have equal influence.
■ For the internal Nutrition Cluster analysis for the HNO and HRP, there is no need to consolidate PiNs per nutritional need by humanitarian consequence. A Total Nutrition PiN is useful for the HRP preparation and for the Joint Intersectoral Analy-sis Framework (see Addendum 1).
28 cGAM: aggregate indicator by combining GAM based on WHZ and GAM based on MUAC).
27 Taken from Annex 2 in WHO’s Rapid health assessment protocols during emergencies.
Nutritional need
(Essential Nutrition Actions)
Chronic Malnutrition
Overweight
Please note that the contents of Tables 4A, 4B, 4C are not meant to be comprehensive (i.e they do not include nutrition-sensitive interventions) and should be taken into account with the given context, existing national guide-lines and nature of the crisis situation.
Before proceeding to reviewing the automatic calculations, insert the following demographic information in ► Population Figures worksheet to derive subsequent PiNs:
For each Admin 2 for “Affected” areas of interest and population figures (from OCHA and/or government); collate all available demo-graphic information for U5 children, broken down by relevant age categories and disaggregated against relevant dimensions including gender, disability and other diversity characteristics if available:
• If no information is available for 0-5 months and 6-11 months, we can assume each represent 1.8% of the total percentage as per cohort data27;
• If no information is available for 6-23 months, we can assume based on the aforementioned cohort data that it represents 5.4% of the total population,
• If no information is available on disability, we can assume 15% of the adult PiN (same per-centage applies for PLW) has a disability and 10% of the children PiN.
• If no information is available for PLW, we can assume this group represents 7% of the total population, with 4% of PW.

Table 4A. Summary of PiN calculations for acute and chronic undernutrition, overnutrition
Nutritional need
(Essential Nutrition Actions)Alignment with a subset of High Impact Nutrition Interventions
Nutrition Screening and referral
Inpatient management of SAM (Stabilization centres -SC)
Outpatient Management (CMAM, Outpatient Therapeutic Program- OTP)
Treatment of MAM
Blanket Supplementary Feeding Programmes (BSFP)
• Number of U5 children to be screened for malnutrition
• Number of PLW to be screened for malnutrition
• Number of Adolescents to be screened for malnutrition
• Number of Older People to be screened for malnutrition
• 100% of the estimated children should be targeted for screening.
Where a nutrition program already exists and data is available from last year to define the proportion of population for each group in the area of intervention
• Prevalence of cSAM in U5 children (if not available, then use 6-59 months)
• Prevalence of SAM in children 0-59 months based on WHZ and/or bilateral pitting oedema (if not available, then use 6-59 months)
• Prevalence of SAM in children 6-59 months based on MUAC and/or bilateral pitting oedema
• Prevalence of SAM in Older People based on MUAC
• Prevalence of SAM in Adolescents based on BMI-for-Age
If GAM is known but the SAM prevalence is not known, consider using on average an estimate of 20% of GAM patients are suffering from SAM.
On average, a 5-20% of children with SAM are expected to be referred to inpatient treatment. This proportion will depend on the status of the CMAM program.
At the beginning of a CMAM program a high number of complicated cases can be expected to be referred to the SC, so the proportion will be high and might be around 15 to 20%. In a well-functioning CMAM program, this proportion can decrease over the time and be around 5 to 10%.
• Prevalence of cMAM in U5 (if not available, then use 6-59 months)
• Prevalence of MAM in U5 based on WHZ (if not available, then use 6-59 months)
• Prevalence of MAM in children 6-59 months based on MUAC
• Prevalence of MAM in PLW based on MUAC
• Prevalence of GAM in PLWHIV based on MUAC <210mm
If MAM prevalence is not known, consider using on average an estimate of 80% of GAM patients are suffering from MAM.
• Proportion of children 6-23 months in need of BSFP
• Proportion of PLW in need of BSFP
70-80% of U2 and PLW estimated should be targeted for BSFP.
Acute Malnutrition (AMN)
(Management of Wasting)
All children U5
PLW
Adolescents
Older people29
All infants below 6 months of age with SAMAt high risk mother/infant pairsGirls and boys between 6 and 59 months of age who have severe bilateral pitting oedema (+++) or severe acute malnutrition with medical complicationsPLW with SAM and medical complications
If relevant: Older women and men with SAMAdolescent girls and boys with SAM and medical complications
For behaviour changes activities: Caretaker benefiting from communication for development (behaviour changes) activities at facility level should be included. Estimates of one caretaker per child (the child admitted for SAM treatment either as inpatient SC or CMAM)
Moderately acutely malnourished girls and boys aged 6-59 months
Acutely malnourished (severe and moderate) PLW with infants 0-5 months,
Severely, moderately and mildly acutely malnourished PLWHIV
Girls and boys between 6 and 59 months of age who have mild/moderate bilateral oedema (+, ++) or severe wasting without any medical complications
PLW with SAM without any medical complications
If relevant: Adolescent girls and boys with SAM without medical complications
Girls and boys aged 6-23 months
PLW.
If resources allow, consider including U5 children and Older People.
Number of children to be screened for malnutrition (disaggregated by sex) = Population figures from “Affected” areas x % of children U5
Number of PLW to be screened for malnutrition = Population figures from “Affected” areas x % of PLW
Number of Adolescents to be screened for malnutrition (disaggregated by sex) = Population figures from “Affected” areas x % of Adolescents
Number of Older People to be screened for malnutrition (disaggregated by sex) = Population figures from “Affected” areas x % of Older People
Number of SAM U5 children in need30 (disaggregated by sex) = cSAM prevalence x population of U5 from “Affected” areas x k (SAM incident factor)
Number of SAM U5 in need of Inpatient TreatmentIbid (disaggregated by sex) = Number of SAM cases (based on cSAM by default) x Expected proportion of SAM cases for Inpatient treatment
Number of Older People in nutritional need (disaggregated by sex) = SAM prevalence based on MUAC x population of Older People from “Affected” areas
Number of Adolescents in nutritional need (disaggregated by sex) = SAM prevalence based on BMI-for-Age x population of Adolescents from “Affected” areas
Number of MAM children 6-59 months in need (disaggregated by sex) = cMAM prevalence (by default) x population of children 6-59 months from “Affected” areas x k (MAM incident factor)
Number of MAM children 6-59 months in need of programming (disaggregated by sex) = cMAM prevalence (by default) x population of children 6-59 months from “Affected” areas x k (MAM incident factor) x Expected proportion of MAM cases for programming
Number of MAM PLW in need = MAM prevalence x population of PLW from “Affected” areas
Number of SAM children 6-59 months in need of Outpatient Treatment31 (disaggregated by sex) = cSAM prevalence x population of children 6-59 months from “Affected” areas x k (SAM incident factor) x Expected proportion of SAM cases for Outpatient treatment
Same calculations details above for PLW and Adolescents.
Number of children 6-23 months in need of BSFP (disaggregated by sex) = Population of children aged 6-23 months from “Affected” areas x Expected coverage for BSFP
Number of MAM PLW in need of BSFP = population of PLW from “Affected” areas x Expected coverage for BSFP
PiN Calculation formulas(Core) Indicators and key considerations
Potential population groups to include
Prevention of malnutrition
Prevention of malnutrition
Prevalence of Stunting in U5 children based on HAZ
Prevalence of overweight in U5 children based on WHZ
Chronic Malnutrition
Overweight
Girls and boys between 0 and 59 months
Girls and boys between 0 and 59 months
Number of Stunted children U5 in need (disaggregated by sex) = Stunting prevalence x population of U5 from “Affected” areas
Number of Overweight children U5 in need (disaggregated by sex) = Overweight prevalence x population of U5 from “Affected” areas

29 The UN definition for older people is people aged 60 years of age and above (≥60). However, you might wish to adapt this definition according to the context: in some countries (e.g. Sub Saharan Africa), old age is more of a social or cultural concept (e.g. retiring, or getting white hair…), and it makes sense to target people when they reach the age of 50 or 55 years. Some countries have their own definition. If there is no national definition of older people, use the UN definition (≥60).
30 This will be revised based on upcoming UNICEF’s Guidance for Estimating the Number of Children in Need of Treatment for Wasting based on research data on children 6-59 months.
31 To consult the upcoming UNICEF’s Guidance for Estimating the Number of Children in Need of Treatment for Wasting based on research data on children 6-59 months.
Viet Nam© UNICEF/UNI279934/VietHung
38 nutrition humanitarian needs analysis guidance
Nutritional need
(Essential Nutrition Actions)

Table 4B. Summary calculations of PiN per IYCF practice
Establishment of IYCF safe spaces
Counselling (one-on-one)CommunityNutrition and Health facilitiesOther settings (e.g. food and cash distributions, women-friendly spaces) as applicable
Counselling (group sessions)
Community
Nutrition and Health facilities
Other settings (e.g. food and cash distributions, women-friendly spaces) as applicable
Specialized support for non-breastfed/partially breastfed infants* (i.e. infant formula dependant children)
* may include provision and support with BMS and BMS kit
Promotion and support to appropriate, timely and safe complementary feeding
Access to specialised nutrition commodities
Appropriate complementary feeding through food distributions (in kind)
Appropriate complementary feeding through cash “plus” and voucher initiatives
Refer to either BSFP PiN in Table 4A above, or Micronutrient Supplementation PiN in Table 4C below
• Proportion of PLW counselled on IYCF
• Proportion of PLW participating in group sessions on IYCF
• Exclusive breastfeeding (EBF)forchildren 0-5 months
• Infants (children 0-5 months) who are not breastfed who have access to BMS supplies and support in line with the Code and the IFE Operational Guidance’s standards and recommendations
• Infants (children 6-11 months) who are not breastfed who have access to BMS supplies and support in line with the Code and the IFE Operational Guidance’s standards and recommendations
• Proportion of non-breastfed children 0-11 months (disaggregated by sex)
• Continued breastfeeding at 1 year of age (Proportion of children 12-15 months who are fed breastmilk)
Where data is unavailable, assume:
• 0-5 months comprise 1.8% of population;
• 6-11 months comprise 1.8% of population;
• PLW combined comprise around 7% of population.
• Minimum dietary diversity in children 6-23 months
• Minimum meal frequency in children 6-23 months
• Minimum acceptable diet in children 6-23 months
Where data is unavailable, assume:
• 6-23 months comprise 5.4% of population.
IYCF practices
(Protection, promotion and support of optimum breastfeeding)
IYCF practices
(Appropriate complementary feeding)
PLW
Caregivers with U2 girls and boys
If feasible, access via community leaders and champions
PLW
Caregivers of non-breastfed girls and boys 0-5 months, 6-11 months, and nutritionally vulnerable infants
Families with U2 girls and boys
PLW
Blanket coverage may be an option when it is too difficult to target specific group of beneficiaries
Precise targeting criteria must be established at country level in case of cash and voucher initiatives. Targeting criteria should be based on vulnerability criteria = target at risk population (PLW, U2)
Number of PLW counselled (one-on-one) on IYCF = Population figures from “Affected” areas x % of PLW x Proportion of PLW individually counselled on IYCF
Number of PLW participating in group sessions on IYCF = Population figures from “Affected” areas x % of PLW x Proportion of PLW participating in group sessions on IYCF
Number of children 0-5 months in need of EBF support (disaggregated by sex) = Population figures from “Affected” areas x % of children 0-5 months x (1- EBF proportion)
Number of non-breastfed children aged 0-5 months in need of BMS supplies and support32 (disaggregated by sex) = Population figures from “Affected” areas from “Affected” areas x (# of non-breastfed children 0-5 months in need of BMS supplies and support surveyed / total children 0-5 months surveyed)
Number of non-breastfed children aged 6-11 months in need of BMS supplies and supportIbid (disaggregated by sex) = Population figures from “Affected” areas x (# of non-breastfed children 6-11 months in need of BMS supplies and support surveyed / total children 6-11 months surveyed)
Number of non-breastfed children aged 0-11 months (disaggregated by sex) = Population figures from “Affected” areas x (# of non-breastfed children 0-11 months / total children 0-11 months surveyed)
Number of children still breastfeeding at 1 year of age (disaggregated by sex) = Population figures from “Affected” areas x (# of children 12-15 months who are fed breastmilk / total children 12-15 months surveyed)
Number of children 6-23 months in need of Minimum Dietary Diversity support (disaggregated by sex) = Population figures from “Affected” areas x % of children 6-23 months x (1- MDD proportion)
Number of children 6-23 months in need of Minimum Meal Frequency support (disaggregated by sex) = Population figures from “Affected” areas x % of children 6-23 months x (1- MMF proportion)
Number of children 6-23 months in need of Minimum Acceptable Diet support (disaggregated by sex) = Population figures from “Affected” areas x % of children 6-23 months x (1- MAD proportion)
Nutritional need
(Essential Nutrition Actions)Alignment with a subset of High Impact
Nutrition Interventions PiN Calculation formulas(Core) Indicators and key considerations
Potential population groups to include
32 Note of caution: The number of infants and young children aged 0-5 or 6-11 months in need of BMS supplies and support should be used to guide programmatic priorities and not to estimate or request supplies. The interpretation of this number should help in strategizing priorities for infant feeding including to ensure that the most vulnerable caregivers and their infants receive the needed support which may consist of quality IYCF counselling and considering options like relactation, wet nursing, and donor breastmilk depending on what is culturally acceptable and feasible. Provision and support of BMS should be done as a last resort, fulfilling strict criteria and in line with the recommendation and standards provided in the Operational Guidance for Infant and Young Child Feeding in Emergencies.

Nutritional need
(Essential Nutrition Actions)Alignment with a subset of High Impact
Nutrition Interventions PiN Calculation formulas(Core) Indicators and key considerations
Potential population groups to include
Iron or iron/folic acid supplementation
Calcium supplementation during pregnancy
Balanced energy protein supplementation during pregnancy and breastfeeding
Vitamin A administration and prevention of Vitamin A Deficiency (VAD)
Zinc supplementation in children aged 6–59 months
Iodine supplementation and salt iodization
Not applicable
Deworming (e.g. schistosomiasis, soil transmitted helminthes)
Multiple micronutrient supplementation in pregnancy
• Prevalence of anemia Hb<11g/dl in children 6-59 months
• Prevalence of anemia Hb<11g/dl in PW• Proportion of children 6-59 months of age receiving
micronutrient supplements that contain adequate iron• Proportion of PW having received Iron-folic acid
supplementation daily in previous 6 months/during pregnancy
In areas with high GAM prevalence rate, do not forget to subtract children with GAM as they receive RUTF/RUSF that already content micronutrients
• Proportion of PW having received calcium supplementation during pregnancy
• Proportion of PW having received multiple micronutrient supplementation during pregnancy
If no data exists assume PW comprise 5% of population (low income countries only) as per WHO guidance (Annex 2 of Rapid assessment in emergencies)
• Proportion of PLW having received balanced energy protein supplementation during pregnancy/breastfeeding
If no data exists assume around 7% PLW (low income countries only)
• Prevalence of sub-clinical Vitamin A deficiency in children 6-59 months
• Proportion of children 6-59 months having received vitamin A in previous 6 months
Liaise with Health Cluster as often Vitamin A distribution takes place during immunisation campaigns or during the Child Health Days and is provided to children with measles as part of treatment for measles
• Prevalence of Iodine deficiency in children 6-23 months
• Prevalence of Iodine deficiency in PLW
• Prevalence of Iodine deficiency in Older People
• Proportion of children 6-59 months having received Zinc in previous 6 months
If no data exists, estimate children aged 6-59 months comprise 18-21% of the population (in low income countries only).Apply diarrhoea prevalence based on the WHO data
• Proportion of target group(s) being deficient in a given micronutrient
• Proportion of target population group having received deworming
Micronutrient deficiencies
(Iron-containing micronutrient supplementation for children, adolescents, women during pregnancy and postpartum)
Micronutrient deficiencies
(Vitamin A supplementation)
Micronutrient deficiencies(Zinc supplementation in the management of diarrhea)
Micronutrient deficiencies
(Iodine supplementation)
Other micronutrient deficiencies (e.g. Pellagra)
Disease prevention and management
Girls and boys 6-23 months of age (If resources allow, 6-32 or 6-59 months can be considered)
PW
WRA in populations where the prevalence of anaemia among non-pregnant women is 20% or higher
Women postpartum
Older women and men
PW
PLW
Girls and boys 6-59 months, disaggregated as 6-11 months and 12-59 months in populations where the prevalence of night blindness is 1% or higher in children 24-59 months of age or where the prevalence of VAD is 20% or higher in infants and children 6-59 months of ageIf relevant: PW in populations where the prevalence of night blindness is 5% or higher in pregnant women or children 24-59 months of ageGirls and boys with measlesGirls and boys with SAM (see existing protocol at national or international level regarding administration of Vitamin A and management of SAM cases)Older women and men
Girls and boys aged 6-23 months for iodine supplementation in countries with iodised salt consumption less than 20%PLW for iodine supplementation in countries with iodised salt consumption less than 20%. In cases where it is difficult to reach pregnant women, supplementation to all WRA is advised.Older women and menIf relevant: All households for iodised salt distribution in countries with iodised salt consumption 20% or more.
Girls and boys aged 6 – 59 months with diarrhoea management
Target group
Girls and boys 6-59 monthsSchool-age girls and boysAdolescent girls and boysPWOlder women and men
Number of anemic children 6-59 months (disaggregated by sex) = Population figures from “Affected” areas x % of children 6-59 months x U5 anemia prevalence Number of anemic PW = Population figures from “Affected” areas x % of PW x PW anemia prevalence Number of children 6-59 months in need of iron supplementation (disaggregated by sex) = Population figures from “Affected” areas x % of children 6-59 months x (1- Proportion of children 6-59 months having received micronutrient supplements that contain adequate iron) Number of PW in need of iron supplementation = Population figures from “Affected” areas x % of PW x (1- Proportion of PW having received micronutrient supplements that contain adequate iron)
Number of PW in need of calcium supplementation = Population figures from “Affected” areas x % of PW x (1- Proportion of PW having received calcium supplements during pregnancy)
Number of PLW in need of balanced energy protein supplementation = Population figures from “Affected” areas x % of PLW x (1- Proportion of PLW having received balanced energy protein supplements during pregnancy and breastfeeding)
Number of VAD children 6-59 months in need (disaggregated by sex) = Population figures from “Affected” areas x % of children 6-59 months x VAD prevalence for children 6-59 months
Number of children 6-59 months in need of Vitamin A supplementation (disaggregated by sex) = Population figures from “Affected” areas x % of children 6-59 months x (1- Proportion of children 6-59 months having received vitamin A in previous 6 months)
Number of iodine deficient children 6-23 months (disaggregated by sex) = Population figures from “Affected” areas x % of children 6-23 months x iodine deficiency prevalence for children 6-23 months
Number of iodine deficient PLW = Population figures from “Affected” areas x % of PLW x iodine deficiency prevalence for PLW
Number of iodine deficient Older People (disaggregated by sex) = Population figures from “Affected” areas x % of Older People x iodine deficiency prevalence for Older People
Number of children 6-59 months in need of zinc supplementation (disaggregated by sex) = Population figures from “Affected” areas x % of children 6-59 months x (1- Proportion of children 6-59 months having received zinc supplementation)
Number of target group(s) in need of a given micronutrient supplementation (disaggregated by sex) = Population figures from “Affected” areas x target group(s) x prevalence of a given micronutrient deficiency
Number of children 12-59 months in need of deworming (disaggregated by sex) = Population figures from “Affected” areas x % of children 12-59 months x (1- Proportion of children 12-59 months having received deworming)
Same calculations per other population groups.
Table 4C. Summary calculations of PiN per micronutrient deficiency

Mauritania© UNICEF/UNI349898/Pouget
PiN Calculation formulas
41nutrition humanitarian needs analysis guidance
CALCULATING PIN FOR SCENARIOS 1 AND 2
1. Insert key population figures for relevant population groups by sex, age category, and disability if available in ► Population Figures worksheet;
2. Review automatic calculations of the number of individ-uals in nutritional need based on relevant interventions detailed in Tables 4A-4B-4C using ► PiN worksheets;
3. Ensure the number of individuals in nutritional need dis-aggregated against relevant dimensions including gender (accounting for the sex ratio between boys and girls), age, disability and other diversity characteristics;
4. Review these Scenarios 1&2 PiN estimates by target group, sex and disability generated in the ► PiN Total worksheet along with the sources of information and their reliability based on the minimum reporting requirements detailed in Annex 5;
5. Share this report with relevant colleagues to contribute to the overall HNO analysis.
CALCULATING PIN FOR SCENARIO 3
1. Insert key population figures for relevant population groups by sex, age category, and disability if available in ► Population Figures worksheet;
2. Review the automatic calculation of the number of indi-viduals in nutritional need based on relevant interventions detailed in Tables 4A-4B-4C in ► PiN worksheets;
3. Ensure the number of individuals in nutritional need dis-aggregated against relevant dimensions including gender (accounting for the sex ratio between boys and girls), age, disability and other diversity characteristics;
4. Review these Scenario 3 PiN estimates by target group, sex and disability generated in the ► PiN Total worksheet along with the sources of information and their reliability based on the minimum reporting requirements detailed in Annex 5;
5. Share this report with relevant colleagues to contribute to the overall HNO analysis.
03 — Prepare key nutrition figures for the Humanitarian Needs Overview and subsequent Response Plan

42 nutrition humanitarian needs analysis guidance
On the basis of the above, Nutrition inputs for the HRP should focus on the identified population sub-groups (disaggregated by sex, age, and disability) based on geographical prioritiza-tion to deliver the full package of nutrition interventions. Both prevention and treatment of malnutrition are important considerations in humanitarian crises: chronic malnutrition can be prevented, but there is limited evidence that it can be re-versed or treated; acute malnutrition – which may be triggered during a crisis – can be prevented and treated with the right nutrition responses.
Considering delivery-related issues, such as government and agencies’ capacity, funding, insecurity in the area, it is im-portant to review existing GNC guidance (see Box G) for the preparation of specific objectives, indicators and monitoring framework for the response analysis in the HRP.
For each of the nutritional needs identified above, the NCCs, Nutrition Cluster partners and staff within the Cluster Lead Agency and partners from other Clusters, are then responsi-ble for the estimation of how many people are targeted for a specific nutrition service (i.e what percentage of those in need for nutrition services). Humanitarian response targets that are set in nutrition planning processes define the proportion of the Population in Need (PiN) to be reached collectively by all humanitarian partners for a specific result. They form the basis of response plans and funding appeals. A summary sheet of all PiNs calculated provides the basis for the HRP inputs and tracking – see ► PiN Total worksheet with the percentage targeted being captured.
In line with the SDG commitment of “leave no one behind” and humanitarian principles, especially the principle of impartiality, humanitarian response targets must be defined based on humanitarian needs alone, prioritizing the most vulnera-ble (e.g. persons with disabilities) and guarding against any practices which would distort or mask humanitarian needs. Taking into account accessibility (e.g. due to insecurity) and time constraints (e.g. time-bound limitations in initial plan-ning documents, such as the first month of a response), it is recommended to estimate a more nuanced, needs-based target, where all humanitarian responses should strive towards a 100% target. Program coverage surveys can assess these targets. Operational capacity and the funding trends for a given humanitarian situation should not be considered when determining this needs-based target.
Therefore, based on the SPHERE guidelines, acute mal-nutrition programmes should aim for at least: 50% in rural areas, 70% in urban areas, and 90% in camp settings.
03 — Prepare key nutrition figures for the Humanitarian Needs Overview and subsequent Response Plan
Inputs to the HRP
Based on the understanding of the magnitude of nutritional needs and its key drivers from the previous Nutrition Situation Analysis and PiN calculations per intervention, priority re-sponse objectives guide the development of HRP to determine the specific interventions and activities that are best suited to address malnutrition in each area of interest. This prioritisation of people in need and geographical areas in the HRP should be based on severity, magnitude (estimated numbers of peo-ple in need), underlying causes, people’s own priorities and the analysis of the most likely evolution of the situation while time-criticality informs the layering and sequencing of interven-tions within the HRP.
A barrier analysis (see Annex 2) including gender-based vio-lence (GBV) related safety risks in nutrition services is import-ant information to guide the development of response strate-gies in the HRP. Without addressing barriers and GBV-related safety risks in nutrition services/facilities, the target populations (e.g. persons with disabilities) may not be able to access nutri-tion services or could face GBV when they do. These barriers and risks identified by Nutrition may require collaboration with other sectors. For example, imbalanced power dynamics between women and men for decision-making at home can be a significant barrier to improve nutritional status but difficult to address by nutrition actors alone. In this case, a joint planning with other actors like GBV actors would be helpful. GBV actors may look into supporting behaviour change to transform the gender norms related to decision making while nutrition actors could target both women and men on good food consumption for better nutrition outcomes.
BOX G. TIPS ON NUTRITION INTERVENTIONS FOR THE HUMANITARIAN RESPONSE PLAN
Developed by the GNC, this guidance provides tips for nutrition clusters and its partners to facilitate the planning of a collective response and the development of NiE interventions once the specific sectoral objectives and type of emergency interventions have been agreed upon. It aligns with the key response areas outlined in Tables 4A/4B/4C, in addition to cluster coordination, accountability to affected population, nutrition survey, nutrition surveillance, and programme coverage evaluation.

43nutrition humanitarian needs analysis guidance
This working guidance and accompanying tool aim at stream-lining the process for discussions and consensus-building, of conducting a Nutrition Humanitarian Needs Analysis for re-sponse planning. Lessons learned will be gathered on a yearly basis to feed into subsequent versions, along with Addendum 1 and details on how these figures contribute to the Joint Inter-sectoral Analysis Framework.
conclusion
Cashin, K. & Oot, L. (2018) GUIDE TO ANTHROPOMETRY A practical tool for Program Planners, Managers and Implementers.
Disability Advisory Group (2020) Tip sheet for monitoring a disability-inclusive response to COVID-19
FANTA. (2018). Training Guide for Community-Based Management of Acute Malnutrition (CMAM).
Gender-Transformative Framework for Nutrition (2020) Gender-Transformative Framework for Nutrition
Global Nutrition Cluster (2013) GNC Handbook - Final
Global Nutrition Cluster (2016) TIPS ON NUTRITION INTERVENTIONS for the Humanitarian Response Plan.
Global Nutrition Cluster (2019) PREPAREDNESS GUIDELINES FOR NUTRITION IN EMERGENCIES COORDINATION.
HelpAge International, NutritionWorks, Global Nutrition Cluster (2013) The Harmonised Training Package (HTP): Resource Material for Training on Nutrition in Emergencies, Module 23, Version 1 (2013) Nutrition of older people in emergencies.
IASC (2012) Operational guidance on coordinated assessments in humanitarian crises.
IASC (2015) Reference module for the implementation of the humanitarian programme cycle 2015 - Version 2.
IASC (2016) Humanitarian Profile Support Guidance.
IASC (2019) Guidelines – Inclusion of Persons with Disabilities in Humanitarian Action
IPC Global Partners (2019) Integrated Food Security Phase Classification Technical Manual Version 3.0. Evidence and Standards for Better Food Security and Nutrition Decisions.
OCHA (2019) Step-by-step Practical Guide for Humanitarian Needs Overviews, Humanitarian Response Plans and Updates.
Olofin I, McDonald CM, Ezzati M, Flaxman S, Black RE, et al. (2013) Associations of Suboptimal Growth with All-Cause and Cause-Specific Mortality in Children under Five Years: A Pooled Analysis of Ten Prospective Studies.
Sphere Association (2018) The Sphere Handbook: Humanitarian Charter and Minimum Standards in Humanitarian Response – Chapter 6: Food Security and Nutrition, fourth edition.
Sphere (2019) Sphere Glossary.
The Lancet (2013) Executive Summary of The Lancet Maternal and Child Nutrition Series.
UNICEF (2013) Global SAM Management Update -Summary of findings.
UNICEF (2019) Maternal and Child Nutrition UNICEF Strategy 2020–2030
World Health Organization (1999) Rapid health assessment protocols for emergencies.
World Health Organization (2000) The management of nutrition in major emergencies – Annex 1: Energy requirements for emergency-affected populations.
World Health Organization (2016) Obesity and Overweight. Fact Sheet.
World Health Organization (2019) Essential nutrition actions: mainstreaming nutrition through the life-course.
World Health Organization and World Bank (2011) World Report on Disability
03 — Prepare key nutrition figures for the Humanitarian Needs Overview and subsequent Response Plan
References
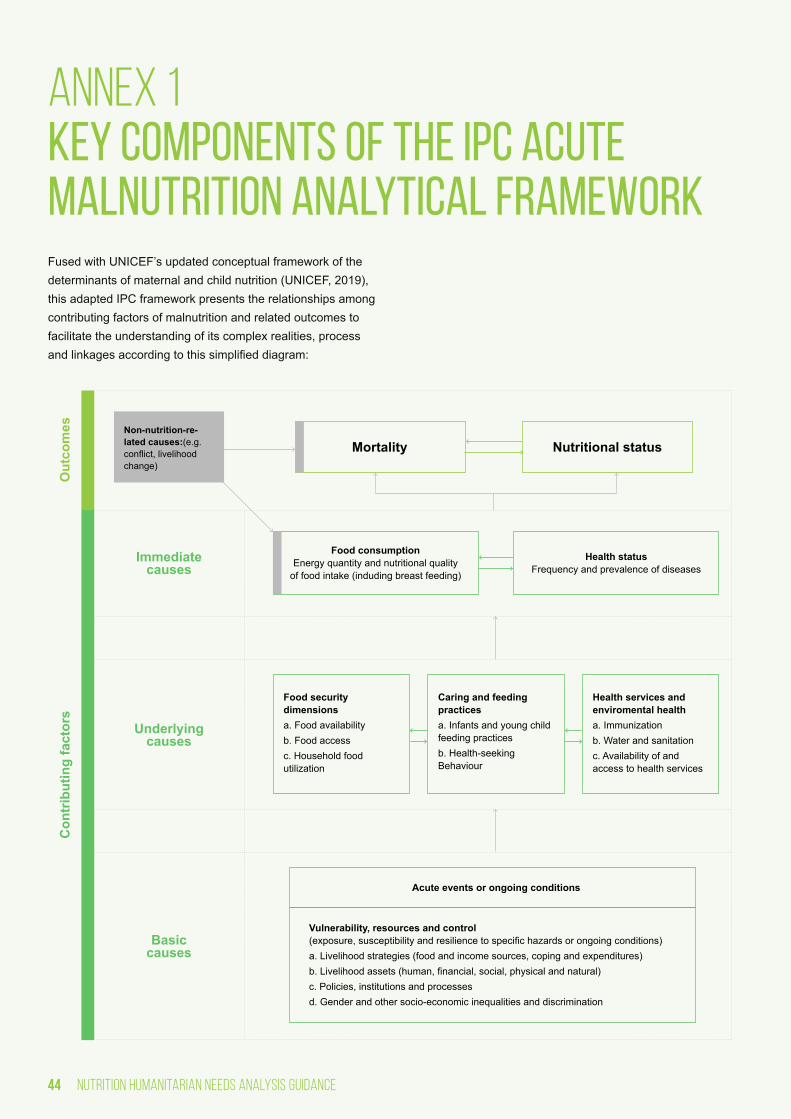
44 nutrition humanitarian needs analysis guidance
Non-nutrition-re-lated causes:(e.g. conflict, livelihood change)
Mortality
Immediate causes
Con
trib
utin
g fa
ctor
sO
utco
mes
Underlying causes
Basic causes
Nutritional status
Health status Frequency and prevalence of diseases
Food consumption Energy quantity and nutritional quality
of food intake (induding breast feeding)
Food security dimensionsa. Food availabilityb. Food accessc. Household food utilization
Acute events or ongoing conditions
Vulnerability, resources and control (exposure, susceptibility and resilience to specific hazards or ongoing conditions)a. Livelihood strategies (food and income sources, coping and expenditures)b. Livelihood assets (human, financial, social, physical and natural)c. Policies, institutions and processesd. Gender and other socio-economic inequalities and discrimination
Caring and feeding practicesa. Infants and young child feeding practicesb. Health-seeking Behaviour
Health services and enviromental healtha. Immunizationb. Water and sanitationc. Availability of and access to health services
annex 1 Key components of the IPC Acute Malnutrition Analytical FrameworkFused with UNICEF’s updated conceptual framework of the determinants of maternal and child nutrition (UNICEF, 2019), this adapted IPC framework presents the relationships among contributing factors of malnutrition and related outcomes to facilitate the understanding of its complex realities, process and linkages according to this simplified diagram:

45nutrition humanitarian needs analysis guidance
Aimed at improved survival, health, physical growth, cognitive development, school readiness and school performance in children and adolescents; improved survival, health, productiv-ity and wages in women and adults; and improved prosperity and cohesion in societies
• Acute Malnutrition
• Chronic Malnutrition
• Micronutrient deficiencies
Food Consumption-focus on diets’ quality and quantity Minimum Dietary Diversity in women and children, Minimum Meal Frequency, Minimum Acceptable Diet, Exclusive Breast-feeding under 6 months.
Health Status Diarrhea, dysentery, malaria/fever, acute respiratory infection.
Frequency and Prevalence of Diseases HIV/AIDS prevalence, Cholera or acute watery diarrhea, measles.
Acute events or ongoing conditions (Natural, socio-economic, conflict, disease and other)
Vulnerability, resources and control livelihood strategies (food and income sources, coping, and expenditures); livelihood assets (human, financial, social, environmental); policies, institutions, political and financial processes, and multi-sectoral commitments to advance the right to nutrition; gender and other socio-economic inequalities and discrimination including social and cultural commitments to advance children’s and women’s right to nutrition.
Nutrition-specific contributing factors (trauma, violence, GBV, genetics, etc.) are also considered.
• IYCF: Continued Breastfeeding at 1 and/or 2 year(s), introduction of solid, semi-solid or soft foods by 6 months of age.
• Health-seeking behaviour
• Intra-household resource allocation
• Cultural beliefs
• Crude Death Rate
• Under-five Death Rate
Nutritional status indicators
Immediate Causes33
Basic Causes or enabling determinants
Underlying Causes focusing on adequate food and feed-ing, and a healthy environment
Mortality indicators
outcomes
Contributing factors or determinants
Caring and Feeding Practices
• Immunization: routine measles/polio vaccination cover-age, routine vitamin A supplementation coverage, cam-paign measles/polio vaccination coverage, campaign vitamin A supplementation, coverage of all basic vaccina-tions from survey data or reports;
• Availability of and access to health services: skilled at-tendant at delivery, health-seeking behavior, coverage of outreach programme (e.g. CMAM programme coverage).
• WASH: access to a sufficient quantity of water, access to improved sanitation facilities, access to an improved source of drinking water.
Health Services and environmental health
33 Note a reciprocal and complex relationship between the two: it is expected that people who live in households that have an inadequate quantity or quality of food for consumption are more likely to become ill. Furthermore, they are more likely to eat less, while their disease can impact the ability of households to access and utilize food, either due to a weakened immune system, or to a weakened ability to engage in productive activities.
annex 1 — Key components of the IPC Acute Malnutrition Analytical Framework

46 nutrition humanitarian needs analysis guidance
annex 2 Gender Considerations for Nutrition Needs Assessments and AnalysesWhen reviewing data needs for upcoming analyses, keep in mind the importance of qualitative methods to complement data on nutrition outcomes, particularly when conducting a gender analysis. A nutrition-focused gender analysis may include the following information:
• Gender roles and responsibilities with regards to nutrition (e.g. food preparation);
• Decision making at household- and community- levels for nutrition-related aspects (e.g. who decides on when and what to eat, breastfeeding, access and use of nutrition facilities, etc);
• Access and control over resources (e.g. money, markets, land, etc);
• Social norms (e.g. food-related taboos and norms for the different groups - like who eats first and more, etc);
• Gender Based Violence and the identification of which forms exist in the context (including the denial of resourc-es like food or education) and the GBV risks associated with nutrition interventions/facilities and their potential cre-ation of tensions at HH or community level, for example).
Consultations, focus group discussions, key informant in-terviews, safety audits in health/nutrition facilities or barrier analyses (see Box H) also provide valuable insight on who is impacted differently and why in a given context. For nutrition, it is important to look at barriers of caregivers (both men and women) of children U5 as they are the ones who decide and bring children to nutrition services. In addition, it helps identify risks that women and children face when trying to access ser-vices. These could also include risks to GBV. One of common barriers and GBV risks that women face is lack of husband’s approval to access nutrition services. This type of barrier is not as obvious as a distance to the service but extremely import-ant to understand wide range of barriers that men, women and children face in accessing nutrition services.
BOX H. BARRIER ANALYSIS
A barrier analysis should be conducted to assess the barriers that affected populations may face in accessing nutrition services. A barrier analysis typically looks at least four different aspects: Availability, Accessibility, Acceptability, and Quality of services:
• Availability: There are sufficient quantity of functioning nutrition facilities, goods and services, and programs which cover gaps and ensure an acceptable ratio of skilled nutrition workers to the population needs
• Accessibility: There are nutrition facilities, goods, and services that are safely accessible, affordable and that there is enough information about them communicated to the population without discrimination
• Acceptability: There are nutrition facilities, goods, and services that are culturally appro-priate, sensitive to gender and age, respect confidentiality and improve the nutrition status of those concerned
• Quality: There are nutrition facilities, goods, and services that are scientifically and medi-cally approved and of good quality.
These can differ greatly for different population groups and their access to nutrition services. A barrier analysis can help identify the difficulties for (mostly) women, persons with disabilities and children to access nutrition services.

47nutrition humanitarian needs analysis guidance
Collecting gender-related information to guide nutrition response planning Similar to the indicators recommended in Table 1 above, the following list of potential indicators provide valuable informa-tion when collected in your population-based surveys (i.e. SMART surveys) or through the aforementioned qualitative methods. It is important to consider the following when plan-ning its collection:
• To determine the most appropriate target audience (indi-viduals/users vs. households) given your context;
• To capture the consequences on other children and work-load when visiting nutrition services;
• To specify the type of services and facilities;
• To include protocols when administering the questionnaire so that respondents may speak freely to the enumerators;
• To disaggregate findings by male and female head of households when feasible and relevant;
• To consult GBV measurement page for further information;
• To be aware of the limitations of this data.
Severity Scale based on IPC/OCHA phases
Potential Gender-related Indicators to guide nutrition
response planning
Humanitarian Consequence
Phase 1 Acceptable/
Minimal
Phase 2 Alert/ Stress
Phase 3 Serious/ Severe
Phase 4 Critical/ Extreme
Phase 5 Extremely Critical/
Catastrophic
Comments/Sources used for
the thresholds
Percentage of HH/individuals/users (men and women) feeling safe when accessing health/nutrition facilities
Living Standards >80% 60-79% 40-59% 20-39% <20%
Preliminary thresholds suggested by Gender Specialists.
Percentage of HH/individuals/users (men and women) reporting issues/problems when accessing health/nutri-tion facilities
Living Standards >80% 60-79% 40-59% 20-39% <20%
Preliminary thresholds suggested by Gender Specialists.
Number of hours per day demonstrating women’s aggregated workload
Living Standards 12 13 14 15 16
Part of a gender anal-ysis, whether through primary data collection or review of secondary sources, when designing nutrition interventions.
Number of Gender based discrimination and social norms related to nutrition practices
Living Standards No No Yes (1 type*)
Yes (2 types)
Yes (more than 2 types)
Part of a gender analysis, whether through primary data collection or review of secondary sources, when designing nutri-tion interventions. Ex-amples of types* may include preference for boys or girls feeding; food taboos negatively affecting women, men, girls and/or boys food intake; negative caring practices for girls and/or boys, etc.
annex 2 — Gender Considerations for Nutrition Needs Assessments and Analyses

48 nutrition humanitarian needs analysis guidance
Adolescent Birth rate Living Standards ≤16 16-42 42-67 67-80 ≥80
Proxy indicator that can be obtained at the Gender Inequality Index
Population with at least some secondary education
Living Standards ≤80% 70-80% 40-70% 30-40% ≥30% for
each sex
Proxy indicator that can be obtained at the Gender Inequality Index. When reviewing this indicator for women and men, the lowest percentage whether for women or men prevails: for example, if men is at 80% yet for women only at 50%, then 50% is retained for this indicator.
Maternal mortality Living Standards ≤13 13-63 63-180 180-543 ≥543
Proxy indicator that can be obtained at the Gender Inequality Index
One step close to gender-transformative nutrition interventions34 These aforementioned considerations would support mea-sures to change social structures, cultural norms, and gender relations in order to achieve more shared and equal power dynamics and control of resources, decision making, and support for women’s empowerment when planning nutrition interventions and response.
34 For further details on the Gender-transformative framework for nutrition.
annex 2 — Gender Considerations for Nutrition Needs Assessments and Analyses

49nutrition humanitarian needs analysis guidance
annex 3 Example of an annual nutrition assessment planThe development and maintenance of an annual nutrition as-sessment plan aims to streamline and prioritize the planning, implementation and reporting of nutrition assessments to en-sure timely availability of quality information for decision-mak-ing. Certain details change between surveys, contexts and countries but the details given below are general and should be applied to all nutrition assessments.
The importance of nutrition assessments should be discussed with the persons responsible in the government/Ministry of Health and members of the local NIS TWG or equivalent to ensure that nutrition assessments are included in the govern-ment annual work plan for the Nutrition Sector. This should be completed as early as possible to ensure adequate prepa-ration, funding and effective organization of the assessments (budget, administration, logistical planning, training of survey teams, etc). All data collected should undergo a transparent validation process (e.g. using the SMART Plausibility Check for anthropometric data) to ensure validity of survey meth-ods and should be centralized to facilitate its utilization and dissemination for action. In turn, the centralization of data and nutrition assessment results would also strengthen multi-sec-toral linkages on nutrition assessment and information of other nutrition-sensitive Clusters such as Health, WASH and Food Security. Furthermore, in rapid-onset emergencies, it is important to ensure that the annual nutrition assessment plan feeds into existing information management system to avoid developing a parallel system.
It is important to note that in some countries, nutrition data are considered sensitive data and all necessary authorisations from the relevant institutions red whenever collecting, analys-ing and publishing data and their results.
Starting with the Global Nutrition Cluster’s Surveys Data-base (Version 2 – April 2020) in Excel, NIS TWG members can adapt and customize this database to meet the needs and demands of the country’s context. It should includes the following types of surveys: anthropometric, IYCF, and micronutrient as appropriate. For the collection of anthropo-metric data, the use of the SMART methods and the ENA for SMART software (Version 2020) is recommended, along with Demographic Household Surveys (DHS) and Multiple Cluster
Indicator Survey (MICS) when applicable. Specific IYCF or micronutrient indicators can be added to nutrition assessments using SMART methods (while recognizing the important caveat of small sample sizes) or collected separately, depending on the prioritization and timeline required for data use.
The annual nutrition assessment plan is broken down by the 4W:
• Who: donor, funding through UN agencies (e.g. UNICEF), agency implementing the survey, other agencies/author-ities involved, name of focal point for the survey, email of the focal point and their supervisor;
• Where: geographical area(s), areas or villages excluded from geographical areas, number of Clusters planned, number of HHs planned, number of survey subjects (e.g. children) to be measured, comments;
• When: expected/actual start date and end date, season, status of the survey;
• What: type of nutrition assessment, methodology used (e.g. SMART/Rapid SMART), indicators to be included, status of data analysis, status of data validation, dissemi-nation activities.

50 nutrition humanitarian needs analysis guidance
annex 4 Key terminology of Humanitarian Needs Overview and Response PlanDetermining an overall, inter-sectoral number of people for establishing number of people “Affected” and “People in Need” (PiN), separated by those who are accessible and those facing humanitarian access constraints, is a key requirement in the HPC and its corresponding HNO and HRP seen in Figure 3. Based on the derived PiN, the number of people “Targeted” and “Reached” then feed into the HRP, where the number of individuals “Covered” is periodically monitored. The PiN figure, as well as those “Targeted”, “Reached” and “Covered” per service35 should be calculated by each Cluster and at the inter-cluster level. Each of these humanitarian population figures are further defined in Table 2 below.
■ During the process of HNO development, it is important all sector and inter-sector figures are ALL based on the same conceptual approach to ensure comparability and consistency. For example, total population and population affected should be the same for all nutrition calculations and should be in line with the figures used in other clusters.
Following the Nutrition Situation Analysis, its results will feed into each of these humanitarian population figures, where these most commonly requested information in humanitarian situations provides the backbone to any humanitarian opera-tion. Inconsistent terminology, unclear methodologies and a lack of transparent, coordinated and standardized data gath-ering frequently result in humanitarian actors operating with different information. Failure to establish and regularly update well-defined population figures not only demonstrates a weak evidence-base but may have a negative impact on resource allocation.
35 Especially IYCF services need always to be specified: what are the services and who are the ones in need or who are the recipients: PLW, children 0-23 months, caretakers of infants and young children < 24 months, caregivers and other family members receiving counseling, recipients of BMS
Figure 3. Representation of overall humanitarian population figures categories
Flas
h Ap
peal
HR
P
Situ
atio
n An
alys
is
MIR
A, H
NO
Perio
dic
Mon
itorin
g R
epor
ts
Total Pop
Affected
In Need
Targeted
Reached
Covered

Working exampleDefinitionCategories
Total Population
Affected
In Need (PiN)
Targeted
Covered
Reached
All people living within the administrative boundaries of a nation state; there can be a crisis-specific strategic decision to calculate the total population looking only at sub-national level.
Number of people whose lives have been impacted as a direct result of the humanitarian situation – often defining the scope or boundary of a needs assessment:
• Being in close geographical proximity to a humanitarian situation;
• Physically/emotionally impacted, including exposed to a human rights violation/ protection incident;
• Experiencing personal loss or loss of capital and assets as a direct result of the crisis (e.g. family member, livestock);
• Being faced with an immediate threat from a humanitarian situation.
Estimates of those “Affected” are among the very first information requirements at the onset of a humanitarian situation, being derived from the “Total Population” based on affected geographical areas or population groups.
“Affected” = sum of displaced (IDPs, refugees, asylum seekers) and non-displaced (host and non-host) persons
Number of people in need of humanitarian nutrition assistance (e.g. nutrition interventions/programmes, also known as “services”) which is a sub-set of “Affected”, being defined as people:
• Whose physical security, basic rights, dignity, living conditions or livelihoods are threatened or have been disrupted, AND
• Whose current level of access to basic services, goods and social protection is inadequate to re-establish normal living conditions with their accustomed means in a timely manner without additional assistance.
PiN will need to be monitored and adjusted over time. This helps to define the magnitude of a crisis and the overall cost estimate of a humanitarian response. Identifying the number of PiN is also essential to determine priority areas for interventions, when those are defined as a function of people in need, access and likely deterioration, etc.
Number of people targeted for a specific nutrition intervention/programme which humanitarian actors within the Nutrition Cluster aim or plan to assist. Beginning during the prioritisation stage to identify which population groups, humanitarian consequences and geographic areas are prioritizes out of the range of needs identified in the HNO, this is a sub-set of “PiN”, being typically smaller as it is rare that international humanitarian actors can meet all needs given available resources and access constraints. The calculation of how many people are targeted for a specific nutrition intervention/programme is done within the Nutrition Cluster.
Number of people receiving a specific type of assistance during a certain time period, i.e. people whose nutrition-specific needs met per intervention (see diagram above). It is recommended not to use the term people covered (despite OCHA using it); coverage in the SAM/MAM in the CMAM context is well defined by UNICEF.
Number of people admitted/enrolled/having received some form of nutrition intervention/programme (to avoid double counting), i.e. whose nutrition needs are met. This identifies where these nutrition interventions/programmes need to be scaled up or down.
‘People reached’ is an inclusive measure, as it includes all people reached by any activity; whereas ‘people covered’ is an exclusive measure, as it excludes all people unless they are fully covered by all activities (which targeted them).
Figure 3. Representation of overall humanitarian population figures categories
Number of people in need facing humanitarian access constraints (i.e. how many from the PiN are accessible).
8 million people live in Country X hit by a humanitarian situation, including 500,000 refugees who came one year ago.
This information is usually provided by a central authority to all clusters /sectors (e.g. OCHA, Central statistics organisation)
5 million people of Country X including 200,000 refugees living in 3 provinces were exposed to damages and destruction following an earthquake, including injuries, damage to dwellings and a high risk of aftershocks.
Population “Affected” equals 5 million people and 200,000 refugees.
This information is usually provided by a central authority to all clusters /sectors (e.g. OCHA, Central statistics organisation, etc.)
In the most populous provinces, where 3 million people out of the 5 million “Affected” reside, its under-five population represents 15% of the population (750,000 children under-five) are exposed to a severe food shortage and limited access to clean water following the earthquake’s destruction. A large number of the earthquake’s fatalities were caregivers of young children.
Out of the 750,000 children under-five, the number of those who are in need of acute malnutrition treatment is estimated at 89,250.
Based on the humanitarian situation and resources available, it is estimated that 62,475 will be targeted for GAM treatment (including inpatient and outpatient-OTP).
5,000 children under-two’s nutritional needs were met by the OTP treatment programmes for the months of January and June.
The number of people “Reached” by OTP services (from Jan-June) are all those that were newly admitted in this time period plus those that were already admitted at 1 Jan. This means that deaths whilst in the programme, defaulters, etc will be taken into account in this calculation.
All 89,250 in need of acute malnutrition treatment do not face humanitarian access constraints.
Table 2. Definitions of humanitarian population figures categories

52 nutrition humanitarian needs analysis guidance
annex 5 Minimum information required for Nutrition Section of HNOsSectoral sections in HNOs usually consist of a two-page analy-sis supported by the following information:
• Summary table with the following key figures:
1. PiNs per population group disaggregated by sex, age and disability for Physical and Mental Well-be-ing and conclusions from the severity classification;
2. PiNs per population group disaggregated by sex, age and disability for Living Standards and key contributing factors based on the results from the Nutrition Situation Analysis;
3. If any population movements and accessibility issues, PiNs facing humanitarian access constraints;
• Assessment registry reporting the sources of infor-mation used and their reliability:
• Repository and reliability of nutrition-related evidence used (see ► Evidence Repository, Reliability worksheet);
• Demographic data used/provided by OCHA/national government and any adjustments (e.g. population growth rate used);
• Analysis Team Composition (see ► Analysis Team Composition worksheet);
• Key challenges and lessons learned identified:
• Information gaps and mitigation measures in place for collection of these data for the next Nutrition Humani-tarian Needs Analysis.
The contact information of the Nutrition Cluster Coordinator along with the chairs from the NIS TWG should be provided in case of follow-up.

53nutrition humanitarian needs analysis guidance
CLUSTER
GlobalNUTRITION
Front cover: © UNICEF/UNI302996/Sukali Malawi
Back cover: © UNICEF/UNI308038/SchermbruckerLuumbo Health Centre