Embed Size (px)
Citation preview

Nutrition Assistance Program Report Series Office of Research and Analysis
Special Nutrition Programs Report No. WIC‐11‐ELIG
Volume I
National and StateLevel Estimates of Special Supplemental Nutrition Program for Women, Infants, and
Children (WIC) Eligibles and Program Reach, 2000–2009
Final Report
December 2011
Non-Discrimination Policy
The U.S. Department of Agriculture (USDA) prohibits discrimination in all its programs and activities on the basis of race, color, national origin, age, disability, and where applicable, sex, marital status, familial status, parental status, religion, sexual orientation, genetic information, political beliefs, reprisal, or because all or part of an individual’s income is derived from any public assistance program. (Not all prohibited bases apply to all programs.) Persons with disabilities who require alternative means for communication of program information (Braille, large print, audiotape, etc.) should contact USDA’s TARGET Center at (202) 720-2600 (voice and TDD).
To file a complaint of discrimination, write USDA, Director, Office of Civil Rights, 1400 Independence Avenue, SW, Washington, DC 20250-9410 or call (800) 795-3272 (voice) or (202) 720-6382 (TDD). USDA is an equal employment opportunity provider and employer.
December 2011 Special Nutrition Programs
Report No. WIC-11-ELIG
Volume I
National and State-Level Estimates of Special
Supplemental Nutrition Program for Women, Infants, and
Children (WIC) Eligibles and Program Reach, 2000–2009
Final Report Authors: David Betson Michael Martinez-Schiferl Linda Giannarelli Sheila Zedlewski Submitted by: The Urban Institute 2100 M Street, NW Washington, DC 20037 Project Director: Sheila Zedlewski
Submitted to: Office of Research and Analysis Food and Nutrition Service 3101 Park Center Drive Alexandria, VA 22302-1500 Project Officer: Grant Lovellette
The opinions expressed reflect those of the authors and not the Urban Institute. This study was conducted under Contract number AG-3198-B-10-0016 with the Food and Nutrition Service. This report is available on the Food and Nutrition Service web site: http://www.fns.usda.gov/ora Suggested Citation: U.S. Department of Agriculture, Food and Nutrition Service, Office of Research and Analysis. National and State-Level Estimates of Special Supplemental Nutrition Program for Women, Infants, and Children (WIC) Eligibles and Program Reach, 2000–2009, by David Betson, Michael Martinez-Schiferl, Linda Giannarelli, and Sheila Zedlewski. Project Officer: Grant Lovellette, Alexandria, VA: December 2011.

This page was left intentionally blank.

Acknowledgements
The authors would like to recognize excellent research assistance from Erika Huber throughout this project. Grant Lovellette, the FNS project officer, provided guidance throughout the project and editorial suggestions on this report.

This page was left intentionally blank.
Contents
Executive Summary ........................................................................................................................................ i
Introduction .................................................................................................................................................. 1
Overview of Methods for National Estimates through 2008 ........................................................................ 1
National Eligibility Estimates: 2008 and 2009 .............................................................................................. 8
2008 Estimates ........................................................................................................................................ 11
Territories ................................................................................................................................................ 17
2009 Estimates ........................................................................................................................................ 20
Comparing 2009 to 2008 ........................................................................................................................ 26
Regional and State Estimates of WIC Eligibility .......................................................................................... 28
Determining State‐Level WIC Eligibility with the ACS data ..................................................................... 28
Implementing the State‐Level WIC Eligibility Estimates ......................................................................... 31
Regional and State Estimates: 2008 and 2009. ................................................................................... 32
Validating the Results. ........................................................................................................................ 54
Regional and State Estimates: 2000 through 2007. ............................................................................ 54
Summary and Recommendations ............................................................................................................... 61
VOLUME II
Appendix A. National Estimates: 2008 and 2009
Appendix B. Estimating Eligibility in the U.S. Territories
Appendix C. State Estimates: 2008 and 2009
Appendix D. State and Regional Estimates: 2000 through 2007
Appendix E. Computing Standard Errors
Appendix F. Estimating WIC Eligibility Among Postpartum Women
Appendix G. Annual‐to‐Monthly Adjustment Factor
Appendix H. Coverage Rate Maps

Figures and Tables
Exhibit ES.1: WIC Eligibles by Participant Group: A Comparison of the Change from Calendar
Year 2008 to 2009 .............................................................................................................................. ii
Exhibit ES.2: WIC Eligibles and Coverage Rates by FNS Region, CY 2009 ................................................. iii
Table 1: Adjustment Factors Used in National‐Level WIC Eligibility Estimation for Infants and
Children .............................................................................................................................................. 2
Table 2: Adjustment Factors Used in National‐Level WIC Eligibility Estimation for Pregnant and
Postpartum Women ........................................................................................................................... 5
Table 3a: Steps and sources for 2008 and 2009 Estimates of WIC Eligibility: Infants and
Young Children ................................................................................................................................... 9
Table 3b: Steps and sources for 2008 and 2009 Estimates of WIC Eligibility: Pregnant and
Postpartum Women ........................................................................................................................... 10
Table 4: Estimates of the Total Average Monthly Number of Individuals Eligible for WIC by
Participant Group, CY 2008 ................................................................................................................ 12
Table 5: Adjustments for Calculating the Average Monthly Number of Individuals Eligible for WIC by
Participant Group, CY 2008 ................................................................................................................ 13
Table 6: Estimates of the Average Monthly Percentage of Infants and Children Eligible for WIC by
Income and Adjunctive Eligibility in the 2009 CPS‐ASEC by Demographic Characteristics, CY 2008 . ............................................................................................................................................................ 16
Table 7: Adjustments for Calculating the Average Monthly Number of Individuals Eligible for WIC in
Puerto Rico and the Other Island Territories by Participant Group, CY 2008 .................................... 18
Table 8: Estimates of the Total Average Monthly Number of Individuals Eligible for WIC by Participant
Group, CY 2008 ................................................................................................................................... 21
Table 9: Adjustments for Calculating the Average Monthly Number of Individuals Eligible for WIC by
Participant Group, CY 2009 ................................................................................................................ 23
Table 10: Estimates of the Average Monthly Number of Infants and Children Eligible for WIC by
Income and Adjunctive Eligibility in the 2010 CPS‐ASEC by Demographic Characteristics, CY 2009
............................................................................................................................................................ 24
Table 11: Adjustments for Calculating the Average Monthly Number of Individuals Eligible for WIC
in Puerto Rico and the Other Island Territories by Participant Group, CY 2009 ................................ 25
Table 12: Estimates of the Total Average Monthly Number of Individuals Eligible for WIC by
Participant Group: A Comparison of the Change from Calendar Year 2008 to 2009 ........................ 27
Table 13: Distribution of WIC Eligibles by FNS Region for each Participant Group, CY 2008 and
CY 2009 ............................................................................................................................................... 33
Table 14: Distribution of WIC Eligibility by State and FNS Region, 2008 and 2009 .................................. 34
Table 15: WIC Eligibles by FNS Region and Participant Group, CY 2008 and CY 2009 ............................. 35

Figure 1: WIC Coverage Rate for All Participants by FNS Region, 2008 .................................................... 36
Figure 2: WIC Coverage Rate for All Participants by FNS Region, 2009 .................................................... 37
Table 16: WIC Eligibles and Coverage Rates by FNS Region and Participant Group, CY 2008 .................. 38
Table 17: WIC Eligibles and Coverage Rates by FNS Region and Participant Group, CY 2009 .................. 39
Figure 3: WIC Coverage Rate for Infants by FNS Region, 2009 ................................................................. 40
Figure 4: WIC Coverage Rate for Children by FNS Region, 2009 .............................................................. 41
Figure 5: WIC Coverage Rate for Pregnant Women by FNS Region, 2009 ............................................... 42
Figure 6: WIC Coverage Rate for All Postpartum Women by FNS Region, 2009 ...................................... 43
Table 18: WIC Eligibles and Coverage Rates by State and FNS Region, 2008 ........................................... 45
Figure 7: WIC Coverage Rate for All Participants by State, 2008 ............................................................. 46
Table 19: WIC Eligibles and Coverage Rates by State and FNS Region, 2009 ........................................... 47
Figure 8: WIC Coverage Rate for All Participants by State, 2009 .............................................................. 48
Table 20: WIC Eligibles and Standard Errors by FNS Region and Participant Group, CY 2008 ................. 50
Table 21: WIC Eligibles Standard Errors by FNS Region and Participant Group, CY 2009 ........................ 51
Table 22: WIC Eligibles Standard Errors by State and FNS Region, 2008 .................................................. 52
Table 23: WIC Eligibles Standard Errors by State and FNS Region, 2009 .................................................. 53
Figure 9: All Participants Coverage Rate by FNS Region, 2000–2009 ....................................................... 56
Figure 10: Infants Coverage Rate by FNS Region, 2000–2009 .................................................................. 57
Figure 11: Children Coverage Rate by FNS Region, 2000–2009 ............................................................... 58
Figure 12: Pregnant Women Coverage Rate by FNS Region, 2000–2009 ................................................. 59
Figure 13: Postpartum Women Coverage Rate by FNS Region, 2000–2009 ............................................ 60

This page was left intentionally blank.

National‐ and State‐Level Estimates of WIC Eligibles and Program Reach i
Executive Summary
The Special Supplemental Nutrition Program for Women, Infants and Children (WIC) provides supplemental nutritious foods, nutrition education and counseling, and screening and referrals to other health, welfare, and social services. On average during 2010, the program served 9.2 million people, providing benefits and services at a cost of $6.7 billion. Because WIC is a Federal grant program for which Congress authorizes a specific amount of funds each year, the Food and Nutrition Service (FNS) requires estimates of the total number of individuals eligible for the program to anticipate funding needs.
In 2003 the Committee on National Statistics of the National Research Council (CNSTAT) published a report outlining recommendations for estimating the total number of people eligible for WIC living in the US mainland and territories. WIC eligibility is restricted to infants, children age 1 through 4, and pregnant and postpartum women. Participants must have income below 185 percent of the federal poverty guideline or be “adjunctively eligible” based on enrollment in another safety net program (Supplemental Nutrition Assistance Program or SNAP, Temporary Assistance for Needy Families or TANF, or Medicaid). Eligibility estimation requires nationally representative data and numerous assumptions that take into account program certification periods, enrollment in other programs, and breastfeeding choices. The CNSTAT methods, originally used to create estimates for 1994, detail procedures for estimating the total number of infants, children age 1 through 4, and pregnant and postpartum women (breastfeeding and non‐breastfeeding) eligible for WIC. The CNSTAT recommended relying on the Annual Social and Economic Supplement to the March Current Population Survey (the CPS‐ASEC) for the national estimates. This project extends WIC national eligibility estimates to single years of age for children, produces estimates for each State and the District of Columbia, and updates methods for estimating eligibility in the territories. The project began with a thorough review of current procedures, examining each factor used to produce the national estimates. This review led to some minor corrections to the 2008 national estimates and some modifications to adjustment factors. This project also considered alternatives for extending the estimates to the 50 States, which led to a recommendation for using the American Community Survey (ACS) as the basis for the State eligibility estimates. The ACS has large samples for each State and provides the income and program participation data required to estimate WIC income and adjunctive eligibility. In order to ensure consistency with the national estimates, the numbers of WIC eligibles in each State calculated from the ACS are converted to shares of the national estimates to produce State‐specific eligibility estimates.
The project required State‐level estimates going back to 2000, the first year of the ACS. One complication is the lack of Medicaid enrollment information (required for estimating adjunctive eligibility) on the ACS prior to 2008. Procedures that use State‐level Medicaid

National‐ and State‐Level Estimates of WIC Eligibles and Program Reach ii
enrollment over time were used to approximate the effect of Medicaid adjunctive eligibility on total WIC eligibility.
The review of existing procedures also showed that the method for estimating eligibility in the territories (basically an adjustment to the national estimates) did not produce realistic results. New methods estimate eligibility in the territories directly. The ACS sample for Puerto Rico, available beginning in 2005, allows for direct WIC eligibility estimates using procedures analogous to those implemented for the States. (Extrapolation methods are used to generate estimates for years between the 2000 Census and the 2005 ACS data.) Since Puerto Rico accounts for 80 percent of WIC eligibility in the territories, simpler methods that rely on adjustments to Census population counts are used to estimate eligibles in other territories. The project also implemented calculation of standard errors of estimate for national, regional, State, and Puerto Rico estimates. This report presents new national estimates for 2008 and 2009, including new estimates for single years of children’s ages and new territory estimates. The 2009 total estimates show a 6.4 percent increase in WIC eligibility relative to 2008, indicating 15.075 million individuals eligible in 2009 (Exhibit ES.1). WIC eligibility among children increased by 9.4 percent between 2008 and 2009. The weaker economy in 2009 increased the numbers of families with incomes below 185 percent of the federal poverty guidelines. In identifying characteristics of WIC‐eligible infants and children, this report highlights the fact that the majority live in two‐parent families and in families with incomes below the federal poverty thresholds.
Exhibit ES.1: WIC Eligibles by Participant Group:
A Comparison of the Change from Calendar Year 2008 to 2009
Participant Group 2009 2008Percent Change
Infants 2,674 2,634 1.5%
Total Children Age 1 to 4 9,469 8,657 9.4%
Children Age 1 2,431 2,292 6.0%
Children Age 2 2,399 2,144 11.9%
Children Age 3 2,374 2,117 12.1%
Children Age 4 2,266 2,104 7.7%
Pregnant Women 1,376 1,355 1.5%
Postpartum Breastfeeding Women 667 639 4.3%
Postpartum Non-Breastfeeding Women 889 886 0.3%
Total WIC Eligibles 15,075 14,171 6.4%
Source: 2009 and 2010 CPS-ASEC for U.S. estimate, PRCS and Census for territories
National‐ and State‐Level Estimates of WIC Eligibles and Program Reach iii
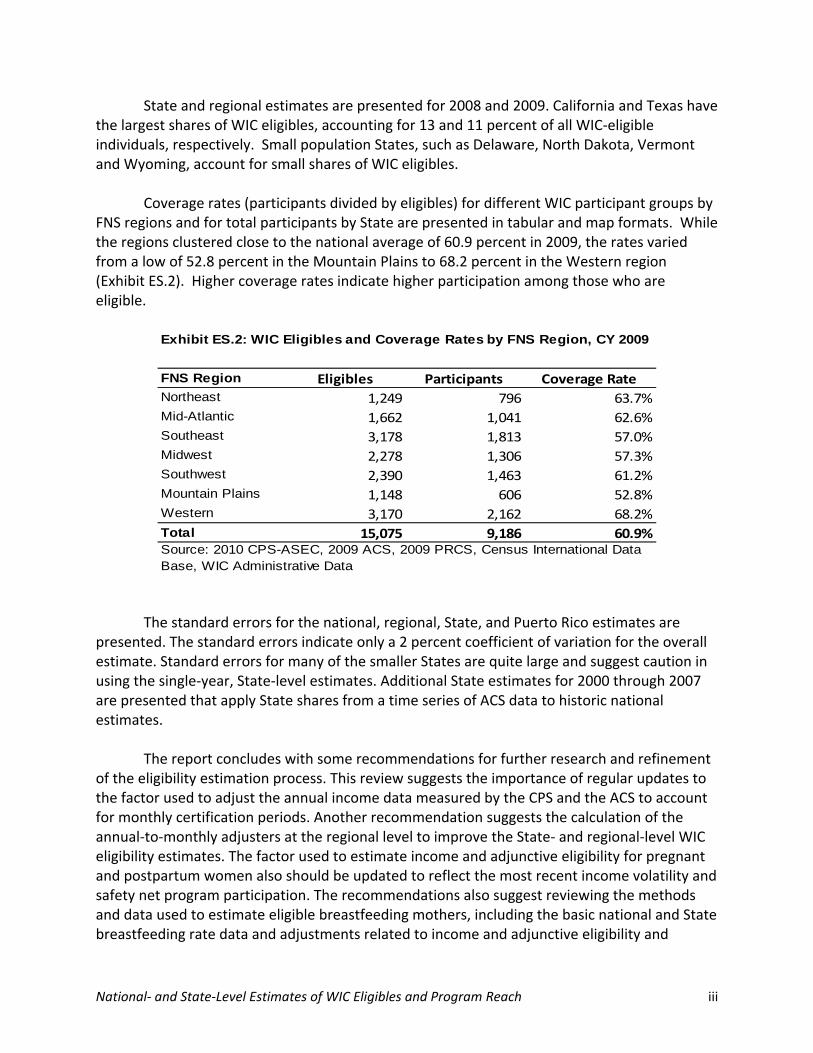
State and regional estimates are presented for 2008 and 2009. California and Texas have the largest shares of WIC eligibles, accounting for 13 and 11 percent of all WIC‐eligible individuals, respectively. Small population States, such as Delaware, North Dakota, Vermont and Wyoming, account for small shares of WIC eligibles.
Coverage rates (participants divided by eligibles) for different WIC participant groups by
FNS regions and for total participants by State are presented in tabular and map formats. While the regions clustered close to the national average of 60.9 percent in 2009, the rates varied from a low of 52.8 percent in the Mountain Plains to 68.2 percent in the Western region (Exhibit ES.2). Higher coverage rates indicate higher participation among those who are eligible.
FNS Region Eligibles Participants Coverage RateNortheast 1,249 796 63.7%Mid-Atlantic 1,662 1,041 62.6%Southeast 3,178 1,813 57.0%Midwest 2,278 1,306 57.3%Southwest 2,390 1,463 61.2%Mountain Plains 1,148 606 52.8%Western 3,170 2,162 68.2%
Total 15,075 9,186 60.9%Source: 2010 CPS-ASEC, 2009 ACS, 2009 PRCS, Census International Data Base, WIC Administrative Data
Exhibit ES.2: WIC Eligibles and Coverage Rates by FNS Region, CY 2009
The standard errors for the national, regional, State, and Puerto Rico estimates are
presented. The standard errors indicate only a 2 percent coefficient of variation for the overall estimate. Standard errors for many of the smaller States are quite large and suggest caution in using the single‐year, State‐level estimates. Additional State estimates for 2000 through 2007 are presented that apply State shares from a time series of ACS data to historic national estimates.
The report concludes with some recommendations for further research and refinement
of the eligibility estimation process. This review suggests the importance of regular updates to the factor used to adjust the annual income data measured by the CPS and the ACS to account for monthly certification periods. Another recommendation suggests the calculation of the annual‐to‐monthly adjusters at the regional level to improve the State‐ and regional‐level WIC eligibility estimates. The factor used to estimate income and adjunctive eligibility for pregnant and postpartum women also should be updated to reflect the most recent income volatility and safety net program participation. The recommendations also suggest reviewing the methods and data used to estimate eligible breastfeeding mothers, including the basic national and State breastfeeding rate data and adjustments related to income and adjunctive eligibility and

National‐ and State‐Level Estimates of WIC Eligibles and Program Reach iv
breastfeeding cessation rates. Other recommendations pertain to improving the estimates of WIC eligibility in Puerto Rico and island territories. Incorporating Puerto Rico–specific breastfeeding rates and Census 2010 data on income and adjunctive eligibility in the island territories would improve the estimates.
Eight appendices are presented. Appendix A presents more detailed national tables,
following formats used in prior years, for 2008 and 2009. Appendix B describes procedures used to estimate eligibility in the territories in more detail. Appendix C details the steps used to produce the 2008 and 2009 State estimates. Appendix D describes the procedures used to complete the 2000 through 2007 State estimates, starting with details on how the estimates of Medicaid adjunctive eligibility were completed. Appendix E details the calculation of the standard errors. Appendix F describes the calculation of WIC eligibility among postpartum women, including how estimates of breastfeeding rates are used in the estimation. This appendix describes current breastfeeding rate data and the adjustments to those rates required to estimate postpartum breastfeeding mothers. Appendix G provides an analysis of the series of adjustment factors used to account for monthly income certification. Finally, Appendix H provides a series of maps showing WIC coverage rates over time.

National‐ and State‐Level Estimates of WIC Eligibles and Program Reach 1
Introduction
This project updates national estimates of WIC eligibility for calendar years 2008 and 2009 and produces new, consistent WIC eligibility estimates for the 50 States, the District of Columbia, and five U.S. territories for calendar years 2000 through 2009. National and territory estimates are produced for infants, children by single year of age, pregnant women, and breastfeeding and non‐breastfeeding postpartum women. The national estimates use the Current Population Survey, Annual Social and Economic Supplement (CPS‐ASEC) data and generally follow methods originally developed by the Committee on National Statistics of the National Research Council (CNSTAT).1 The State‐level estimates are based on the American Community Survey (ACS). WIC eligibility is estimated in each State and then and converted to the States’ shares of WIC‐eligible individuals. These shares are applied to the CPS‐ASEC national estimates to produce a consistent set of national and State estimates. The project began with a thorough review of the most recent national estimates and the separate adjustment factors used in their production. Subsequently, alternative methods for producing State‐level WIC eligibility estimates were considered. The method for producing State‐level estimates recommended by project staff and approved by the Food and Nutrition Service (FNS) relies on the large State samples provided in the ACS. Estimates are provided back to 2000, the first year of the ACS. The State‐level estimates also required numerous decisions to implement various adjustment factors at the State level. For the first time, standard errors of estimates are provided for all of the 2008 and 2009 WIC eligibility estimates. Also, new methods were developed to provide WIC eligibility estimates for Puerto Rico and four smaller outlying island territories.
This report describes all of the analysis and results. It begins with an overview of the CNSTAT recommendations for producing the annual WIC eligibility estimates. Subsequently, the report describes the updated national estimates, new methods for territory estimates, and the development of the State‐level WIC eligibility estimates. The main body of the report summarizes various decisions and results. The final section presents recommendations for further refinement of the WIC eligibility estimates. The appendices present further details on results and some of the methods used to produce the 2000 through 2009 WIC eligibility estimates.
Overview of Methods for National Estimates through 2008
The national WIC eligibility estimates that have been produced for 1994 through 2008 have been based primarily on the recommendations of the CNSTAT Panel members. They recommended using the annual CPS‐ASEC data for an initial count of eligible infants and
1 See Ver Ploeg and Betson 2003 for the CNSTAT report. The estimates were implemented for FNS by the Urban Institute for 1994 through 2004, and updated by Mathematica Policy Research (MPR) for 2004 through 2008.

National‐ and State‐Level Estimates of WIC Eligibles and Program Reach 2
children. Those figures are refined through a series of adjustment factors designed to more closely mimic program procedures and to account for WIC eligibles in the territories. The estimates of eligible infants are used to estimate WIC‐eligible pregnant and postpartum women. Postpartum women are divided into breastfeeding and non‐breastfeeding mothers since certification and benefits vary for these two groups. Various data sets must be used to impute breastfeeding prevalence. As described below, a new adjuster was added recently to the recommended CNSTAT procedures to refine the prediction of breastfeeding cessation.
Infants and Children: The CPS‐ASEC survey conducted each spring is used to count the
number of infants (less than one year old) and children (age 1 through 4 years old) whose family income in the prior calendar year was less than 185 percent of the federal poverty guideline (the threshold for income eligibility) or whose families reported participation in Supplemental Nutrition Assistance Program (SNAP, formerly called Food Stamps), Temporary Assistance for Needy Families (TANF), or their State’s Medicaid program (the programs that confer adjunctive eligibility) at any point during the calendar year. Four proportional adjustments are made to these weighted counts to arrive at the final estimates of the number of eligible infants and children, as summarized in Table 1. Since the eligibility estimates of pregnant and postpartum women are constructed through a series of proportional adjustments to the eligibility estimates of infants, the estimates of infants play an especially important role in the estimation process.
Table 1 Adjustment Factors Used in National‐Level WIC Eligibility Estimation
for Infants and Children
PURPOSE DESCRIPTION
Population These factors apply to the sampling weights in the survey data to align the counts of infants and children to the Census Bureau’s population estimates. These factors change annually and are derived from the ratio of four years of Census population estimates to four years of weighted counts of CPS‐ASEC data. For each exact age (0, 1, 2, 3, and 4) there are six separate factors, varying by sex and by race (white, black, and other).
Annual‐ to‐Monthly
This factor adjusts for the fact that the initial eligibility estimates are based on an annual accounting period. (The CPS‐ASEC asks annual income and whether the family ever participated in various programs during the calendar year.) In reality, families’ incomes and participation status may fluctuate over the year. Eligible individuals are certified for either 6 or 12 months even if their circumstances change. The 2008 and 2009 factors for infants (1.18) and children (1.01) are derived by averaging factors that account for the relationship between monthly and annual income from the 2002, 2005, and 2006 Survey of Income and Program Participation (SIPP) data.
Territories This factor—based on analysis of Census long‐form data—reflects the additional eligible infants and children residing in U.S. territories. (This is not needed if territories are estimated individually.)
Nutritional Risk
This adjustment is made to the weighted count of WIC‐eligible infants and children to reflect that otherwise‐eligible individuals must also meet the nutritional risk criterion. These adjustment factors, 0.97 for infants and 0.99 for children, are based upon an analysis conducted by the CNSTAT Panel.

National‐ and State‐Level Estimates of WIC Eligibles and Program Reach 3
In estimating whether an infant or child is income eligible for WIC, the filing unit recommended by the CNSTAT Panel and used subsequently has been the broad definition of family: all individuals who live in the household and who are related by blood, marriage, or adoption.2 Consequently, all subfamilies and individuals related to the householder (the owner of the property or the person whose name is on the leasing agreement) are included in the unit when determining both family size and family income. People unrelated to the householder are treated separately. In particular, foster children are considered as filing units of one, and subfamilies that are not related to the householder are considered as separate family units. For example, if an unmarried partner of the householder and his or her children from another relationship live in the household, they are considered as a separate unit in estimating WIC eligibility. This would also be true in the case of an unrelated family rooming or boarding within a larger household. Because the CPS‐ASEC is a survey of the non‐institutionalized population, infants and children who are institutionalized are not captured in the CPS‐ASEC weighted counts of potentially eligible infants and children.3
The family’s annual income is compared to the poverty guideline amount based upon the number of family members. Poverty guidelines for WIC eligibility are in effect from July 1 of the year until June 30 of the next year. Consequently, a family’s calendar year income will span two years of poverty guidelines. The CNSTAT Panel recommended that income eligibility be determined by using a blended poverty guideline to construct the eligibility threshold. For example, when estimating income eligibility for calendar year 2009, 185 percent of the simple average of the poverty guideline used as of July 2008 and the poverty guideline used as of July 2009 is compared to the family’s income.
Individuals not income‐eligible for WIC may gain adjunctive eligibility through
participation in another safety net program. As long as other, noneconomic eligibility criteria are met, an individual is adjunctively eligible if the person’s narrowly defined family (parents and dependent children) receives benefits from the TANF program, if the person’s household receives benefits from SNAP, or if the person is enrolled in Medicaid.4 The CPS‐ASEC asks about
2 WIC regulations define the family as “related or nonrelated individuals who are living together as one economic unit” (Code of Federal Regulations, Title 7, Part 246). In some cases, the economic unit as defined by the local WIC agency could be smaller or larger than the family unit used in the WIC eligibility estimates. For example, when a household includes two unmarried parents, the current definition of the family includes only one of the parents. 3 Some institutionalized individuals do receive WIC services, but food benefits are not provided if the institution provides all meals. The CPS‐ASEC sample also excludes military families living on base when there is no nonmilitary adult, and it does not capture homeless families; both of these types of families could receive food benefits. The CPS‐ASEC includes some types of non‐institutional group quarters (such as rooming houses), but these are excluded from the counts. 4 Enrollment in a State’s Medicaid‐expansion program funded through the Children’s Health Insurance Program (CHIP) also confers adjunctive eligibility, but enrollment in a separate State health program funded by CHIP does not. However, if eligibility in a separate State health program is limited to individuals with incomes at or below the WIC income threshold, and the program collects income information in the enrollment process, then participation in such a program can serve as evidence of income eligibility for WIC. Because the CPS‐ASEC data do not separately identify the two types of CHIP programs, enrollment in CHIP is not counted as conferring adjunctive eligibility; this may lead to a slight underestimate of the count of adjunctively eligible infants and children.

National‐ and State‐Level Estimates of WIC Eligibles and Program Reach 4
enrollment in each of these programs during the prior year. However, adjunctive eligibility is likely underestimated due to the underreporting of benefit receipt in survey data.5
After the preliminary counts of infants and children who appear to be eligible (income or adjunctively), the CPS‐ASEC person weights are adjusted so that the weights reflect Census population estimates. These population adjustment factors are annually recomputed and reflect the Census population estimates by age (five, one‐year groups: age 0 through 4 years old), race (three groups: white, black, and other), and gender (two groups: female and male) over a four‐year period relative to the weighted counts in the CPS‐ASEC for the same period. This adjustment has fluctuated dramatically since 1994, the first year for which estimates were performed in the current historical series. For infants, the net effect has ranged from a reduction of 2.1 percent in the weighted counts of infants in the CPS‐ASEC (used for the 1994 through 1997 estimates) to an increase of 6.0 percent (used for the 2000 through 2002 estimates). The adjustment in the weights of young children has ranged from a reduction of 3.8 percent (for the 1999 estimates) to a reduction of only 0.3 percent (in the CY 2008 estimates). Adjustments for subgroups are larger; for example, in producing the national estimates for CY 2000 through 2002, the weights of black male infants were increased by 27.7 percent. While the population adjustment varies over time, the adjustment brings the weighted CPS‐ASEC counts up to the Census population estimates that show much more stability over time.
After the adjusted weighted count of income‐eligible or adjunctively eligible infants and children is determined from the CPS‐ASEC, adjustments are made to the estimates to account for differences between annual and monthly income, eligibility in the territories, and nutritional risk. The annual‐to‐monthly adjustment attempts to address the difference between a family’s income as a percentage of the poverty guideline when assessed using annual income as opposed to the time period used by the program—a month or shorter. It also reflects the impact of certification periods. This adjustment factor differs for infants and children, reflecting the fact that eligible infants are certified for a year (they remain enrolled for the year even if the family’s income increases) while eligible children are certified for only six months. After the certification period ends, income or adjunctive eligibility must again be demonstrated. The CNSTAT Panel recommended that the Survey of Income and Program Participation (SIPP) be used to construct proportional adjustments by comparing eligibility based upon monthly data and including certification periods with the results based upon a single annual determination. To date, estimates of the annual‐to‐monthly adjustment have been produced for different years using the 1996, 2001, and 2004 panels of the SIPP.
The CNSTAT recommended a simple territorial adjustment since the CPS‐ASEC does not interview families in the territories while FNS requires eligibility estimates to include these geographical areas. The territorial adjustment simply increased the national estimates to account for WIC eligibles in Puerto Rico and four smaller areas—American Samoa, Guam, the Northern Mariana Islands, and the Virgin Islands—based on decennial Census data. Recent
5 All surveys underestimate enrollment because some individual fail to report participation (Wheaton 2007). The CNSTAT‐recommended methods do not attempt to correct for the impacts of program underreporting.

National‐ and State‐Level Estimates of WIC Eligibles and Program Reach 5
estimates have been based on the 2000 Census. (As described below, the territory estimates for 2008 and 2009 use a different approach.)
The nutritional risk adjustment factor has remained constant or almost constant across
the time period of the historical estimates of national eligibility (1994 through 2008). Using data from the Continuing Survey of Food Intake by Individuals (CSFII), the Panel found that at least 97 percent of income‐eligible pregnant women were at nutritional risk. Since an infant whose mother would have qualified for WIC during pregnancy is automatically considered at‐risk, the nutritional risk adjustment factor for infants has been 0.97. The CSFII data also suggested that more than 99 percent of young children failed to meet dietary guidelines, leading to a 0.99 nutritional risk adjustment for children.
Pregnant and Postpartum Women: Estimates of the number of WIC‐eligible women (pregnant, postpartum breastfeeding, and postpartum non‐breastfeeding) are based upon adjusted counts of WIC‐eligible infants rather than separate counts of the CPS‐ASEC data. (The CPS‐ASEC does not identify pregnancy or breastfeeding status.) The proportional adjustments made to the infant estimates to arrive at the final estimates for women are summarized in Table 2.
Table 2 Adjustment Factors Used in National‐Level WIC Eligibility Estimation
for Pregnant and Postpartum Women
PURPOSE DESCRIPTION
Fetal and Infant Deaths and Multiple Births
If an infant dies or there are multiple births, the number of infants will misstate the number of pregnant and postpartum women. A single factor is used for both pregnant and postpartum women. The 0.9961 factor is derived from Vital Statistics on fetal and infant deaths, multiple births.
Gestation A pregnant woman is eligible only during her pregnancy (at most nine months). Also, she may not be eligible during her pregnancy even though she and her child may be eligible postpartum. The CNSTAT Panel examined SIPP data and estimated that a women eligible for WIC after the birth of her child was eligible for an average of 6.4 months of WIC during the pregnancy. The resulting 0.533 adjustment factor has been used subsequently.
Breast‐feeding
This adjustment factor reflects that breastfeeding postpartum mothers are eligible for a maximum of 12 months while non‐breastfeeding mothers are eligible for up to 6 months postpartum. Consequently, both the rate and the duration of breastfeeding are important. The Ross Mother’s Survey provides basic breastfeeding rates for WIC‐enrolled mothers in the hospital and at six months. These rates are adjusted for higher rates of breastfeeding among WIC‐eligible, non‐participating mothers. An additional factor, not included in the Panel’s recommendations, takes into account the decline in breastfeeding through the year, assuming that women report the cessation of breastfeeding prior to the end of a certification period.
Nutritional Risk
This adjustment is made to the weighted count of WIC‐eligible pregnant women to reflect that the recipient must also meet the nutritional risk criterion. All postpartum women are assumed to be at nutritional risk. Historically, this adjustment factor has been assumed to be 0.97 for infants, 0.99 for children, 0.97 for pregnant women, and 1.00 for postpartum women.
National‐ and State‐Level Estimates of WIC Eligibles and Program Reach 6
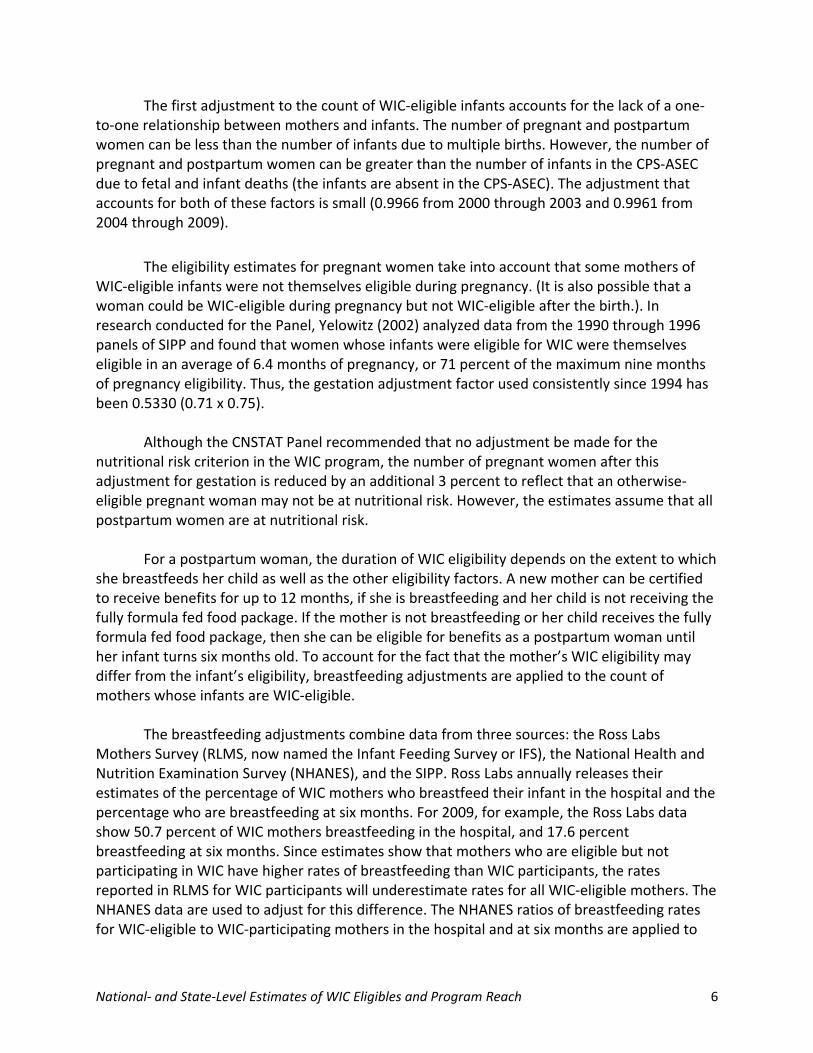
The first adjustment to the count of WIC‐eligible infants accounts for the lack of a one‐to‐one relationship between mothers and infants. The number of pregnant and postpartum women can be less than the number of infants due to multiple births. However, the number of pregnant and postpartum women can be greater than the number of infants in the CPS‐ASEC due to fetal and infant deaths (the infants are absent in the CPS‐ASEC). The adjustment that accounts for both of these factors is small (0.9966 from 2000 through 2003 and 0.9961 from 2004 through 2009).
The eligibility estimates for pregnant women take into account that some mothers of WIC‐eligible infants were not themselves eligible during pregnancy. (It is also possible that a woman could be WIC‐eligible during pregnancy but not WIC‐eligible after the birth.). In research conducted for the Panel, Yelowitz (2002) analyzed data from the 1990 through 1996 panels of SIPP and found that women whose infants were eligible for WIC were themselves eligible in an average of 6.4 months of pregnancy, or 71 percent of the maximum nine months of pregnancy eligibility. Thus, the gestation adjustment factor used consistently since 1994 has been 0.5330 (0.71 x 0.75).
Although the CNSTAT Panel recommended that no adjustment be made for the
nutritional risk criterion in the WIC program, the number of pregnant women after this adjustment for gestation is reduced by an additional 3 percent to reflect that an otherwise‐eligible pregnant woman may not be at nutritional risk. However, the estimates assume that all postpartum women are at nutritional risk.
For a postpartum woman, the duration of WIC eligibility depends on the extent to which she breastfeeds her child as well as the other eligibility factors. A new mother can be certified to receive benefits for up to 12 months, if she is breastfeeding and her child is not receiving the fully formula fed food package. If the mother is not breastfeeding or her child receives the fully formula fed food package, then she can be eligible for benefits as a postpartum woman until her infant turns six months old. To account for the fact that the mother’s WIC eligibility may differ from the infant’s eligibility, breastfeeding adjustments are applied to the count of mothers whose infants are WIC‐eligible.
The breastfeeding adjustments combine data from three sources: the Ross Labs Mothers Survey (RLMS, now named the Infant Feeding Survey or IFS), the National Health and Nutrition Examination Survey (NHANES), and the SIPP. Ross Labs annually releases their estimates of the percentage of WIC mothers who breastfeed their infant in the hospital and the percentage who are breastfeeding at six months. For 2009, for example, the Ross Labs data show 50.7 percent of WIC mothers breastfeeding in the hospital, and 17.6 percent breastfeeding at six months. Since estimates show that mothers who are eligible but not participating in WIC have higher rates of breastfeeding than WIC participants, the rates reported in RLMS for WIC participants will underestimate rates for all WIC‐eligible mothers. The NHANES data are used to adjust for this difference. The NHANES ratios of breastfeeding rates for WIC‐eligible to WIC‐participating mothers in the hospital and at six months are applied to

National‐ and State‐Level Estimates of WIC Eligibles and Program Reach 7
the Ross Labs annual estimates to reflect the rates expected in the eligible population. The most recent analysis of NHANES data showed that the breastfeeding rate of WIC‐eligible mothers in the hospital was 5.6 percent higher than for WIC participants. At six months, WIC‐eligible mothers were 15.0 percent more likely to breastfeed than WIC participants.6 The estimated percentage of WIC‐eligible mothers breastfeeding at birth gives an initial breakdown of postpartum women by breastfeeding versus non‐breastfeeding status for the first six months postpartum. The estimated percentage of women breastfeeding at six months gives an initial estimate of the number of women who may be certified for an additional six months.
The estimation of postpartum WIC eligibility is complicated by the decline in breastfeeding throughout the first year and by the fact that a woman may not be eligible even if her infant is eligible. If a mother is not initially eligible for WIC (for example the infant is eligible due to Medicaid enrollment but the mother is not enrolled in Medicaid), but the mother then becomes income‐eligible or adjunctively eligible later in the year, her eligibility will depend on whether she is breastfeeding at that point (not whether she was breastfeeding in the hospital or at six months). Although the CNSTAT Panel did not discuss an adjustment factor to address these issues, both the Urban Institute and Mathematica Policy Research, Incorporated (MPR) have simulated postpartum WIC eligibility using SIPP data to test the impact of these complications.
The most recent SIPP‐based simulations of postpartum WIC eligibility assume that mothers inform WIC staff members as soon as they stop breastfeeding. Mothers have this incentive because WIC provides non‐breastfeeding mothers with infant formula (although mothers whose infants are more than six months old will lose their own WIC eligibility if they report that they are no longer breastfeeding). The simulations assign a breastfeeding status and duration to each postpartum mother of a WIC‐eligible infant, using breastfeeding rates for WIC‐eligible mothers from NHANES. Eligibility is then simulated month‐by‐month, using each woman’s monthly income, program participation, and breastfeeding status, in combination with the appropriate certification periods, to estimate her months of eligibility. One simulation uses the in‐hospital breastfeeding status for the first six months and the status at six months for the remainder of the year, while a second simulation uses the monthly status. In the second simulation, fewer eligible women are counted as breastfeeding, and the total number of WIC‐eligible postpartum women is also lower. The ratio of the second set of estimates to the first provides an additional adjustment factor. In the most recently published WIC eligibility estimates, the SIPP‐based factor reduced the previous estimates of postpartum breastfeeding mothers.7
6 These adjusters have been used since 2008 and reflect updated estimates computed from 2005–2006 NHANES data. 7 Harper, Hirschman, Mabli, Nelson, and Hourihan 2009.
National‐ and State‐Level Estimates of WIC Eligibles and Program Reach 8
National Eligibility Estimates: 2008 and 2009
Under this project, national WIC eligibility estimates were produced for 2008 and 2009. As noted earlier, the project began with a thorough vetting of the methods and adjustment factors most recently used in 2008.8 This review identified a minor deviation from the Panel’s recommended methods in the production of the 2008 estimates, which was corrected in the updated estimates. The new estimates for 2008 and 2009 include national estimates for single years of age, State estimates, and regional estimates (all as required by this contract). New methods were developed and applied to estimate WIC eligibility in territories, calculate State eligibility estimates (in a manner that remains consistent with the national estimates), and calculate standard errors of the estimates.
The methods used to produce the estimates for 2008 and 2009 are summarized in Tables 3A (for infants and children) and 3B (for women). These methods follow the recommendations of the CNSTAT Panel as outlined earlier with the addition of the breastfeeding cessation factor. Newer data are incorporated from the CPS‐ASEC, the Ross Laboratories Mother Survey, the Census Bureau, and the Puerto Rico ACS. Also, this is the first time since the issuance of the CNSTAT Panel report that national estimates have been produced for children by single years of age.
The section begins by presenting the 2008 national estimates. Then we describe each factor used to produce the estimates along with improvements made to those procedures. (New procedures are documented more fully in the appendices referenced.) We next summarize the characteristics of the WIC population living in the United States. Then we present the 2009 national estimates. Since the methods match those used for 2008, we only highlight methods when factors were updated to reflect new data. The final national summary compares the 2009 and 2008 estimates. More detailed tables related to the 2008 and 2009 national estimates are provided in Appendix A.
8 All methods were validated by programming the procedures both in SAS (using updated historical code) and STATA and verifying the dual estimates until they matched.

National‐ and State‐Level Estimates of WIC Eligibles and Program Reach 9
Step Description Sources for Updates to Estimates and Adjustment Factors Demographic eligibility Identify individuals age 0, 1, 2, 3, or 4 in the survey. CPS-ASEC - National Estimates
ACS - State EstimatesCensus Bureau International Data Base - Other Island Territories
Weight adjustment Adjust sampling weights to account for undercount or overcount in the CPS relative to Census estimates, by exact age, gender, and race.
National Estimates:Updated population estimates from the Census Bureau and the CPS-ASEC based on four years of data.State Estimates:Updated population estimates by age and State from the Census Bureau using same Census year as the calendar year being estimated.
Income eligibility Count as eligible if prior year’s annual family income is <= 185 percent of the applicable poverty guideline--"family" for income purposes is the broadly-defined family, with related subfamilies included in the primary family.
Poverty guidelines are the blended poverty guidelines from current and prior year to reflect WIC eligibility rules.
CPS ASEC - National EstimatesACS - State Estimates
Blended poverty guidelines:FY 2007 and FY 2008 guidelines used for CY 2008 estimatesFY 2008 and FY 2009 guidelines used for CY 2009 estimates
Adjunctive eligibility Add in as eligible those infants/children whose household reports SNAP, whose family reports TANF, or who are themselves reported as enrolled in Medicaid during the prior calendar year.
For TANF receipt, "family" is the narrowly defined family (with subfamilies separate from the primary family). In the CPS, the family also includes any related children whose parents are not present in the household. The ACS does not separately identify Medicaid; all children reporting public health coverage are considered adjunctively eligible.
CPS-ASECACS - State Estimates
Adjust for fluctuations in monthly income and certification periods
Multiply the estimates by a factor of 1.18 for infants and 1.01 for children to account for the impact of monthly fluctuations in income and program participation, and for the impact of 6- and 12-month certification periods.
SIPP panels from 2001 and 2004
Adjust for nutritional risk Multiply the infant estimates by 0.97 and the child estimates by 0.99 to account for the fact that some otherwise-eligible infants and children might not be found to be at nutritional risk.
No update because CNSTAT-derived factors
Territories Eligibility in Puerto Rico is based on the PRCS and is estimated with the same methods as those used for the State estimates.Eligibility in the Other Island Territories is based on a proportion of the estimated population of infants and children.
American Community Survey sample (PRCS) - Puerto Rico
Census Bureau International Data Base - Other Island Territories
TABLE 3A
STEPS AND SOURCES FOR 2008 and 2009 ESTIMATES OF WIC ELIGIBILITY: INFANTS AND YOUNG CHILDREN

National‐ and State‐Level Estimates of WIC Eligibles and Program Reach 10
Step Description Sources for Updates to Estimates and Adjustment Factors Starting point Use as a starting point the final average monthly eligibility estimate for
infants Eligible infants from CPS-ASEC.
Adjust for multiple births and infant deaths
Multiply by a factor of 0.9961 to account for the impact of multiple births and infant deaths (so the number of pregnant women/mothers is not exactly equal to the number of infants).
Multiple birth, infant and fetal death data from 2004 vital statistics data. March 2004 Census estimates for count of infants.
For pregnant women : Adjust for length of pregnancy and difference in income and adjunctive eligibility during pregnancy vs. after birth
Multiply by 0.533 to account for 9 months of pregnancy (0.75 factor) and to account for lower likelihood of financial or adjunctive eligibility during pregnancy vs. after birth (additional 0.71)
No update because CNSTAT-derived factor.
For postpartum mothers : Separately estimate the average monthly number who are eligible as breastfeeding mothers and the number eligible as postpartum non-breastfeeding mothers
1) To estimate eligible breastfeeding mothers before and after the 6-month point, use Ross Labs Mothers Survey (RLMS) rates of breastfeeding by WIC participating mothers in-hospital and at 6 months (52.3% and 19.5% in 2008; 53.5% and 20.2% in 2009)2) Adjust these estimates to apply to WIC-eligible mothers, using multiplicative factors derived from NHANES (1.056 and 1.150 for in-hospital and at 6 months, respectively).3) Multiply estimates from step 2 to account using SIPP based factors that account for the interaction between women's certification periods, breastfeeding cessation, and the fact that women may not be income or adjunctively eligible throughout the year (0.620, 0.832). 4) Use above information to divide postpartum women between breastfeeding and not breastfeeding in first half of the year; and to estimate eligible breasteeding women in second half of the year.
Annual Ross Laboratories Mothers Survey (RLMS); 2001-2002, 2003-2004, and 2005-2006 waves of National Health and Nutrition Examination Survey (NHANES); 1996, 2001, and 2004 SIPP panels.
Territorial estimates assume the national breastfeeding rates.
Adjust for nutritional risk Multiply the estimate for pregnant women by 0.97 to account for the fact that some otherwise-eligible pregnant women might not be found to be at nutritional risk. Assume all postpartum women are at nutritional risk (factor of 1.0).
No update because CNSTAT-derived factor.
PREGNANT AND POSTPARTUM WOMEN
TABLE 3B
STEPS AND SOURCES FOR 2008 and 2009 ESTIMATES OF WIC ELIGIBILITY:

National‐ and State‐Level Estimates of WIC Eligibles and Program Reach 11
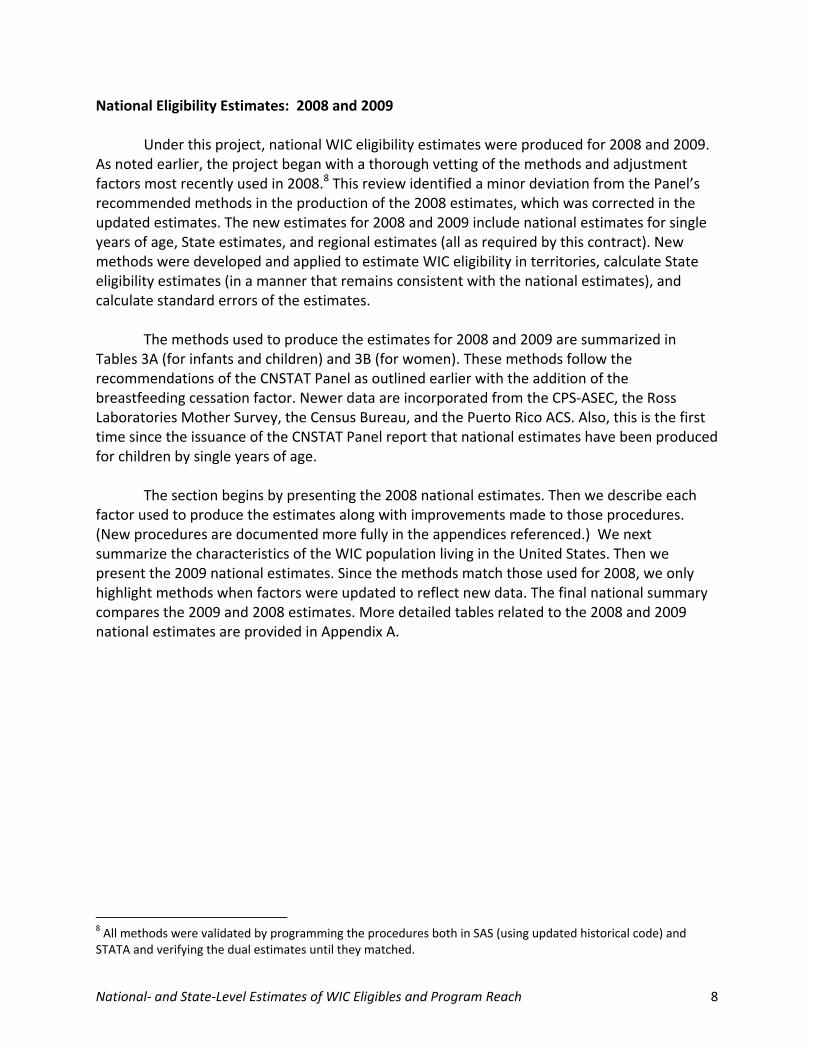
2008 Estimates.9
Table 4 shows that 14.171 million individuals are estimated to be eligible for WIC in the
average month of CY 2008, across the 50 States, the District of Columbia, Puerto Rico, and four other island territories.10 The estimate includes 2.634 million infants (59 percent of all infants in the United States and territories) and 8.657 million children age 1 through 4 (51 percent of all young children). The number of children eligible for WIC declines with each year of age, as eligibility and participation decline slightly over time. The estimated average monthly number of pregnant women eligible for WIC, 1.355 million, derives directly from the number of eligible infants (adjusted for multiple births and differences in income and adjunctive eligibility between infants and mothers, and adjusted for a maximum of nine months of benefits). The average monthly number of WIC‐eligible postpartum women also derives from the number of eligible infants and the estimates of breastfeeding rates calculated as summarized in Table 3B above. There are an estimated 0.639 million women eligible as breastfeeding mothers in the average month of CY 2009, and an estimated 0.886 million eligible non‐breastfeeding postpartum women.
These totals are derived from numerous factors. We focus first on the estimates for the 50 States and the District of Columbia (Table 5). The estimation process begins by adjusting counts of the number of infants and children from the 2009 CPS‐ASEC (reflecting income in CY 2008) to compensate for difference between CPS‐ASEC weighted population counts and Census Bureau population estimates. This slightly increases the numbers of infants and two‐year‐olds and decreases the numbers of children age one, three, and four. The numbers of income‐eligible infants and children, based on 185 percent of a two‐year average of the federal poverty guidelines, are shown. They comprise about 40 percent of all infants and young children in the 50 States and the District of Columbia. Adjunctive eligibility due to enrollment in SNAP, TANF, or Medicaid increases the infant eligibility estimate by 31 percent and increases the estimate for young children by 23 percent. Medicaid accounts for most of those adjunctively eligible for WIC in 2008 (0.424 million infants and 1.307 million children age 1 to 4). These patterns reflect program eligibility policies and caseload sizes. More children are enrolled in Medicaid than the other two programs,11 as many States have expanded eligibility for Medicaid to income levels above 185 percent of poverty.12
9 As explained, 2008 estimates were updated to correct the poverty guidelines, use an annual‐to‐monthly adjuster that averages only the more recent SIPP estimates, and implement new methods for territory estimates, and they were extended to provide estimates by single year of age for children. Appendix C, which details the 2008 State estimates, also provides a summary of the effects of these changes compared with the 2008 estimates provided to FNS by MPR in 2009. 10 The tables provide the unrounded eligibility estimates in order to show the precise impact of each adjustment. However, all the estimates are subject to sampling variability, discussed later. 11 In 2007, 28 million children (under age 18) were enrolled in Medicaid and 13.5 million children were enrolled in
SNAP. Medicaid caseload from Kaiser (2009) and SNAP caseload from Walkwitz and Trippe (2009). 12 In 2007, for example, 12 States offered Medicaid coverage to infants in families with incomes above 185 percent of poverty; 10 of these States offered this coverage to children through age 5. An additional 10 States offered CHIP coverage through Medicaid to children in families with incomes above 185 percent of poverty, but 3 of these
National‐ and State‐Level Estimates of WIC Eligibles and Program Reach 12
NOTE: This table includes estimates for the territories.
Participant Group Eligiblesa
Non-
Eligiblesb Total
Infants 2,633,819 1,811,679 4,445,498
Total Children Age 1 to 4 8,657,117 8,399,639 17,056,756
Children Age 1 2,292,023 2,054,735 4,346,758
Children Age 2 2,143,513 2,176,247 4,319,761
Children Age 3 2,117,479 2,113,062 4,230,541
Children Age 4 2,104,102 2,055,595 4,159,697
Pregnant Women 1,355,127
Postpartum Breastfeeding Women 639,003
Postpartum Non-Breastfeeding Women 886,312
Total WIC Eligibles 14,171,378
Source: 2009 CPS-ASEC for U.S. estimate, PRCS and Census for territories
Notes:
2008
a The eligible estimates represent the average monthly number of individuals income or adjunctively eligible for WIC in 2008, taking into account all adjustments as explained in Table 3a.b The non-eligible infants and children represent the difference between the Total estimates of infants and children age 1 to 4 in the total United States and the WIC-eligible infants and children.
Table 4: Estimates of the Total Average Monthly Number of Individuals Eligible for WIC by Participant Group, CY 2008
States limited the coverage to infants or children under age 2. Tabulated from Kaiser Family Foundation, Statehealthfacts.org, http://www.statehealthfacts.org/comparecat.jsp?cat=4&rgn=6&rgn=1.

National‐ and State‐Level Estimates of WIC Eligibles and Program Reach 13
U.S. States and D.C. (2009 CPS-ASEC) Infants
Children Age 1
Children Age 2
Children Age 3
Children Age 4
Total Children Age 1 to 4
Pregnant Women
Postpartum Breastfeeding
Women
Postpartum Non-Breastfeeding
Women Total
Total number of infants/children in the 2009 CPS-ASEC 4,300,938 4,345,399 4,206,092 4,193,299 4,141,181 16,885,971 21,186,909
Number (non-U.S. Territory) after adjustment for CPS under/overcount 4,392,888 4,292,829 4,264,202 4,174,087 4,103,644 16,834,762 21,227,650
Number with annual income <185% FPG 1,720,897 1,783,702 1,698,508 1,654,750 1,734,785 6,871,745 8,592,642
Number of additional people adjunctively eligible above 185% FPG 537,864 464,903 400,517 418,266 324,990 1,608,675 2,146,540
Through Food Stamps 109,341 92,110 68,757 85,028 42,794 288,689 398,030Through TANF 4,499 3,168 3,836 5,486 0 12,489 16,989Through Medicaid 424,024 369,625 327,924 327,752 282,196 1,307,497 1,731,521
Total number income and adjunctively eligible 2,258,761 2,248,605 2,099,025 2,073,016 2,059,775 8,480,420 10,739,182
Number after monthly income adjustment 2,665,338 2,271,091 2,120,015 2,093,746 2,080,373 8,565,225 11,230,563
Total Eligibles - Number after adjustment for nutritional risk (infants and children) 2,585,378 2,248,380 2,098,815 2,072,808 2,059,569 8,479,572 11,064,951
Starting point for estimates of women is fully eligible infants 2,585,378 2,585,378 2,585,378 7,756,135
Number after adjustment for length of pregnancy and income of woman during pregnancy 1,376,714 1,376,714
Number after adjustment for multiple births and infant deaths 1,371,345 2,575,295 2,575,295 6,521,935
Number after adjustment for breastfeeding 627,251 870,012 1,497,262
Total Eligibles - Number after adjustment for nutritional risk (pregnant and postpartum women) 1,330,204 627,251 870,012 2,827,467Source: 2009 CPS-ASEC
Eligibles in the U.S. Territories Infants
Children Age 1
Children Age 2
Children Age 3
Children Age 4
Total Children Age 1 to 4
Pregnant Women
Postpartum Breastfeeding
Women
Postpartum Non-Breastfeeding
Women Total
Total Eligibles in the U.S. Territories 48,440 43,642 44,698 44,671 44,533 177,544 24,923 11,752 16,301 278,961Source: 2008 PRCS and Census International Data Base
See Table 7 for details.
Total Eligibles - States and Territories U.S. Total 2,633,819 2,292,023 2,143,513 2,117,479 2,104,102 8,657,117 1,355,127 639,003 886,312 14,171,378
Note: a See Tables 1, 2, 3a, and 3b for adjustment factors applied.
Table 5: Adjustments for Calculating the Average Monthly Number of Individuals Eligible for WIC by Participant Group, CY 2008a

National‐ and State‐Level Estimates of WIC Eligibles and Program Reach 14
The next adjustment accounts for intra‐year income fluctuation and the fact that individuals are certified eligible for a number of months. The number of infants who appear eligible based on annual income and program participation is increased by 18 percent and the number of children by 1 percent. These factors represent the average factors calculated for 2002, 2005, and 2006 (from the 2001 and 2004 SIPP panels). Estimates from the 1996 SIPP panel (included in earlier annual‐to‐monthly adjustments) are not included in the average to reflect more recent income volatility and adjunctive eligibility patterns. As explained further in Appendix G, the annual‐to‐monthly adjustment has been declining over time for both infants and children. These declines may reflect changes in income volatility and increased safety net program enrollment. Changes in Medicaid and SNAP program eligibility rules, such as 12‐month certification periods and income eligibility above 185 percent of the poverty guidelines mean that more infants, children, and women will gain adjunctive eligibility for WIC. The CPS‐ASEC data estimate increasing numbers of adjunctively eligible infants and children over time, many with annual incomes above 185 percent of the federal poverty guidelines. Thus, the annual‐to‐monthly adjustment is smaller and has less impact on WIC eligibility.
The final adjustment to the number of infants and children reduces the estimates slightly to reflect the fact that some may meet all other criteria but not be considered at nutritional risk. The estimate for infants is reduced by 3 percent and the estimate for children is reduced by 1 percent, as in prior analyses. The estimates for pregnant women begin from the estimate of 2.585 million WIC‐eligible infants in the average month of CY 2008. This figure is adjusted for the length of pregnancy and the fact that a woman may have higher income during pregnancy than after birth (a combined adjustment factor of 0.533). The next adjustment compensates for the fact that the count of infants very slightly overstates the count of pregnant women (the factor is 0.9961) and final adjustment (0.97) reflects the assumption that 3 percent of otherwise‐eligible pregnant woman would not be found to be at nutritional risk. The final estimate is 1.330 million women eligible for WIC during pregnancy in the average month of CY 2008. The estimates for postpartum women—breastfeeding and non‐breastfeeding—also begin from the estimate of 2.585 million WIC‐eligible infants. As in the estimation process for pregnant women, this figure is adjusted by a factor of 0.9961 to adjust for fetal and infant deaths and multiple births. The next adjustments shown are intended to reflect that not all mothers of WIC‐eligible infants will receive WIC, that those who do receive WIC may not receive it for as many months as their infants, and that both breastfeeding and non‐breastfeeding women may receive WIC during the first six months of the infant’s life. The average monthly estimate of postpartum breastfeeding women eligible for WIC is 24.4 percent of the estimated infant eligibility (this counts women both before and after the six‐month point), and the estimate of postpartum non‐breastfeeding women is 33.8 percent of the estimated infant eligibility. Summing across both subgroups of women, the aggregate number of months that postpartum mothers are estimated to be eligible for WIC is about 58 percent of

National‐ and State‐Level Estimates of WIC Eligibles and Program Reach 15
the estimated months of infant eligibility. As shown in Table 5, there is no further adjustment for nutritional risk; all postpartum women are assumed to be at nutritional risk.
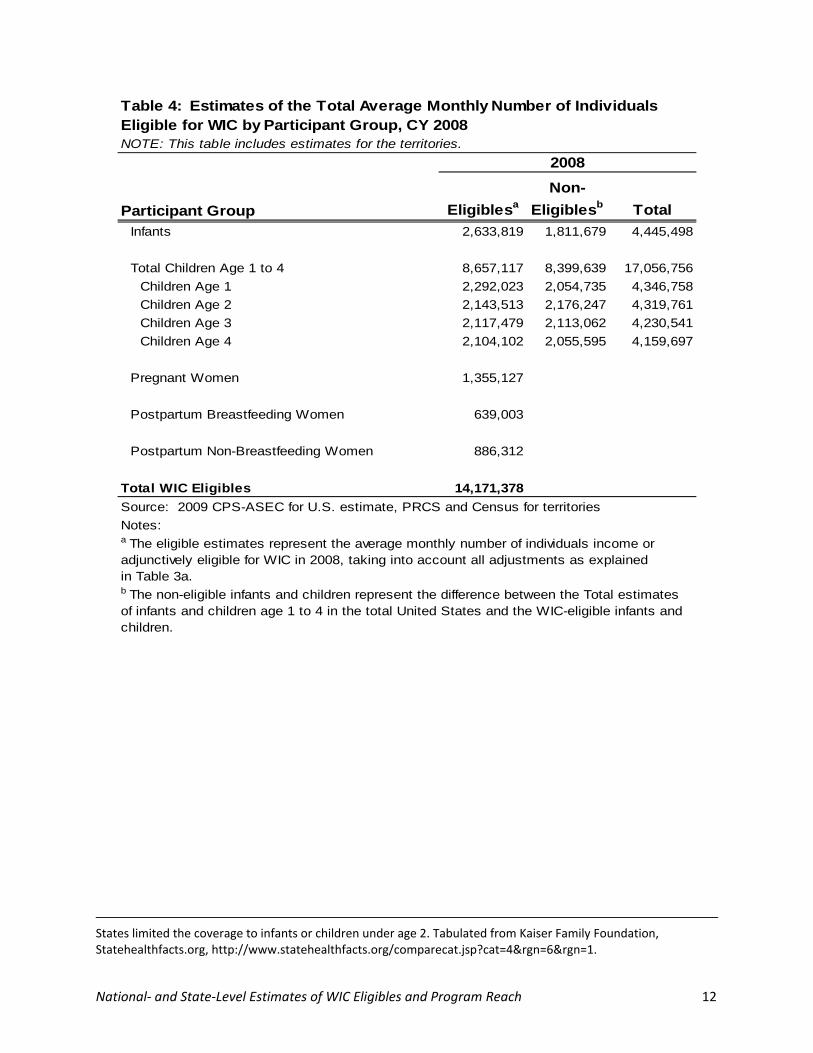
The characteristics of WIC income‐eligible and adjunctively eligible infants and children
provide a profile of children eligible for WIC in 2008 (Table 6). Infants and children that are income‐eligible for WIC are predominantly white (about 37 to 38 percent) and Hispanic (36 percent). Most (61 percent of infants and 57 percent of children) live in two‐parent families. Almost a quarter live in large households (with six or more persons). Most WIC‐eligible children also live with working parents (62 percent of infants and 68 percent of children). Among those who are estimated to be eligible based on income, 60 percent of infants and 55 percent of children live in families with annual incomes below the poverty threshold.13
The table also provides some insight into the characteristics of infants and children who
become eligible through adjunctive eligibility. As would be expected, these children live in families with higher economic status than children income‐eligible for WIC. More of these children have two parents and working parents. Also, their families tend to have higher incomes. About half of the adjunctively eligible infants and children have annual income of 250 percent of the poverty threshold and higher. Even though annual income seems relatively high, they may have experienced drops in income during the year that led the family to enroll in TANF, SNAP, or Medicaid. In that case, their eligibility for WIC would depend on their income and program participation at the point they applied for benefits. Some of the children at higher annual income levels may be adjunctively eligible because the TANF, SNAP, and Medicaid programs do not necessarily count all the income of all members of the family. For example, when a child’s caretaker is his or her grandparent, the grandparent’s income is typically not a factor in the child’s eligibility for Medicaid.
13 The table shows family income relative to the poverty threshold, the measure used for the Census Bureau’s tabulations of poverty status for research purposes (as opposed to the poverty guidelines, used for program administrative purposes).
National‐ and State‐Level Estimates of WIC Eligibles and Program Reach 16
Fully adjusted weightsa
Demographic Characteristics
Family income
<185% FPGb
Adjunct-ively
eligiblec Total
Family income
<185% FPGb
Adjunct-ively
eligiblec Total
Family income
<185% FPGb
Adjunct-ively
eligiblec Total
Total 1,969,739 615,640 2,585,378 6,871,058 1,608,514 8,479,572 8,840,797 2,224,153 11,064,950
GenderMale 52.0 49.6 51.4 50.6 51.5 50.8 50.9 50.9 50.9Female 48.0 50.4 48.6 49.4 48.5 49.2 49.1 49.1 49.1
Race/ethnicityWhite, non-Hispanic 33.5 50.8 37.7 34.7 47.9 37.2 34.5 48.7 37.3Black, non-Hispanic 23.4 16.4 21.8 23.6 15.8 22.1 23.6 16.0 22.1Other, non-Hispanic 4.7 4.2 4.6 4.9 4.9 4.9 4.9 4.7 4.8Hispanic 38.3 28.5 36.0 36.8 31.4 35.7 37.1 30.6 35.8
Living arrangementTwo-parent family 59.2 68.3 61.4 53.9 62.1 55.5 55.1 63.8 56.9Single-parent family 36.9 26.0 34.3 40.9 31.8 39.1 40.0 30.2 38.0No-parent family 3.8 5.8 4.3 5.2 6.1 5.4 4.9 6.0 5.1
Related non-parent caretaker 2.6 5.8 3.4 3.4 6.1 4.0 3.3 6.0 3.8Unrelated non-parent caretaker 1.2 0 0.9 1.7 0 1.4 1.6 0.0 1.3
Household size (number of persons)2 4.8 2.3 4.2 5.4 3.6 5.0 5.3 3.2 4.83 25.9 27.4 26.3 19.8 22.0 20.2 21.2 23.5 21.74 27.2 25.5 26.8 27.5 30.2 28.1 27.5 28.9 27.85 18.2 17.3 18.0 23.4 20.6 22.9 22.3 19.7 21.76 or more 23.8 27.5 24.7 23.8 23.6 23.8 23.8 24.7 24.0
Number with working parent(s) 57.8 75.7 62.1 65.1 78.9 67.8 63.5 78.0 66.4
Annual family income relative to povertyb
Less than 50% FPL 33.1 0 25.3 26.6 0 21.6 28.1 0 22.450% to <100% FPL 26.5 0 20.2 28.6 0 23.1 28.1 0 22.5100% to <130% FPL 18.2 0 13.9 18.7 0 15.2 18.6 0 14.9
130% to <185% FPLd 21.8 7.4 18.4 25.9 7.6 22.4 25.0 7.5 21.5185% to <200% FPL 0.3 10.6 2.8 0.1 12.4 2.5 0.2 11.9 2.5200% to <250% FPL 0 26.7 6.4 0 29.9 5.7 0 29.0 5.9250% FPL and above 0 55.3 13.2 0 50.1 9.5 0 51.6 10.4
Benefit receiptNo benefit receipt 23.6 0.0 17.9 29.0 0.0 23.5 27.8 0 22.2FSP, TANF, & Medicaid 8.3 1.7 6.7 6.5 2.9 5.8 6.9 2.5 6.0FSP & TANF 0 0 0 0 0 0 0 0 0FSP & Medicaid 0 0 0 0.1 0 0.1 0.1 0 0.1TANF & Medicaid 29.6 13.9 25.9 30.5 12.1 27.0 30.3 12.6 26.8FSP only 0.9 0.8 0.9 1.1 0.8 1.0 1.0 0.8 1.0TANF only 0 0 0 0 0 0 0 0 0Medicaid only 4.4 4.8 4.5 4.8 3.0 4.5 4.7 3.5 4.5
Source: 2009 CPS-ASEC
Notes for Table 6:FPG - Federal Poverty GuidelinesFPL - Federal Poverty Level
Table 6: Estimates of the Average Monthly Percentage of Infants and Children Eligible for WIC by Income and Adjunctive Eligibility in the 2009 CPS-ASEC by Demographic Characteristics - CY 2008
a These estimates are tabulated from the unadjusted person weights on the 2009 CPS-ASEC. They are not adjusted to account for the under or over count of infants and children in the CPS relative to Census estimates, eligibility in the U.S. Territories, monthly income, or nutritional risk. See Appendix Tables A.3, A.4a/b for the adjustment factors.b This table uses both the Federal Poverty Guidelines (FPG) and the Federal Poverty Thresholds or "Levels" (FPL). The thresholds are used to calculate the ratio of annual family income to the poverty threshold for their family size. The guidelines are used in determining WIC eligibility.c Infants and children adjunctively eligible are those whose family income was not below 185% FPG but who reported receipt of Food Stamps, Medicaid, or TANF. Therefore, the two categories are mutually exclusive.
WIC-Eligible InfantsWIC-Eligible Children
Age 1 to 4Total WIC-Eligible Infants and
Children Age 0 to 4
National‐ and State‐Level Estimates of WIC Eligibles and Program Reach 17
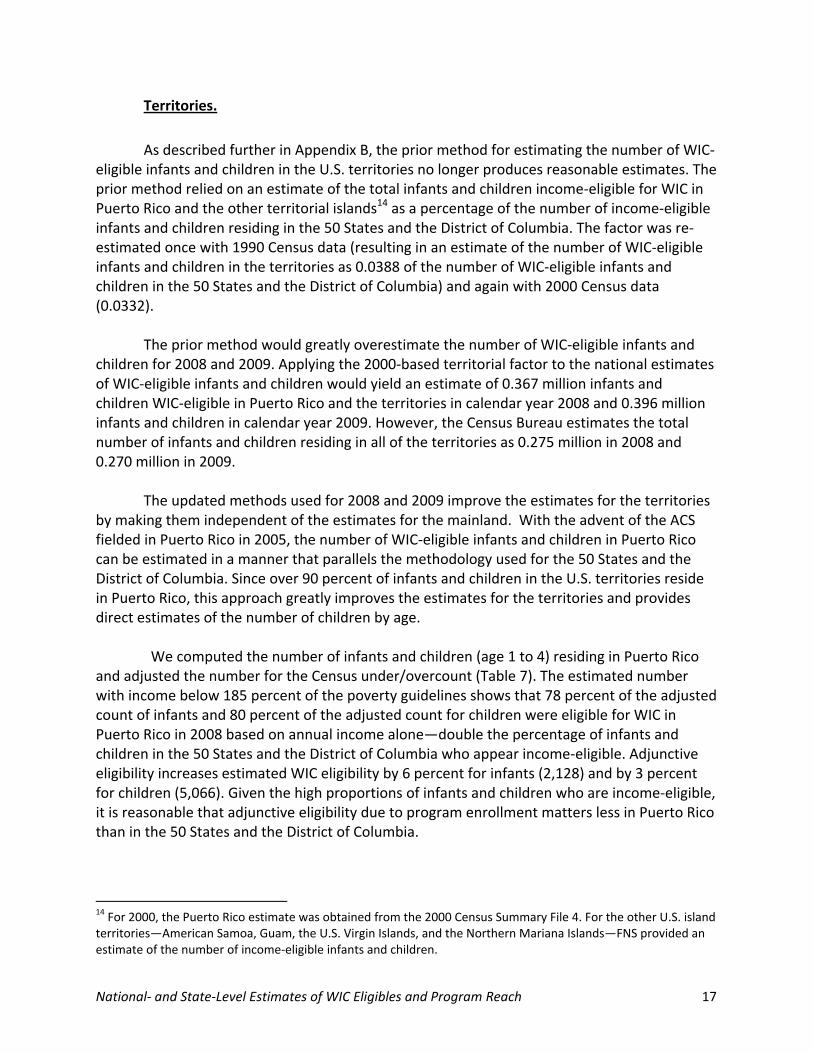
Territories.
As described further in Appendix B, the prior method for estimating the number of WIC‐
eligible infants and children in the U.S. territories no longer produces reasonable estimates. The prior method relied on an estimate of the total infants and children income‐eligible for WIC in Puerto Rico and the other territorial islands14 as a percentage of the number of income‐eligible infants and children residing in the 50 States and the District of Columbia. The factor was re‐estimated once with 1990 Census data (resulting in an estimate of the number of WIC‐eligible infants and children in the territories as 0.0388 of the number of WIC‐eligible infants and children in the 50 States and the District of Columbia) and again with 2000 Census data (0.0332).
The prior method would greatly overestimate the number of WIC‐eligible infants and children for 2008 and 2009. Applying the 2000‐based territorial factor to the national estimates of WIC‐eligible infants and children would yield an estimate of 0.367 million infants and children WIC‐eligible in Puerto Rico and the territories in calendar year 2008 and 0.396 million infants and children in calendar year 2009. However, the Census Bureau estimates the total number of infants and children residing in all of the territories as 0.275 million in 2008 and 0.270 million in 2009.
The updated methods used for 2008 and 2009 improve the estimates for the territories
by making them independent of the estimates for the mainland. With the advent of the ACS fielded in Puerto Rico in 2005, the number of WIC‐eligible infants and children in Puerto Rico can be estimated in a manner that parallels the methodology used for the 50 States and the District of Columbia. Since over 90 percent of infants and children in the U.S. territories reside in Puerto Rico, this approach greatly improves the estimates for the territories and provides direct estimates of the number of children by age.
We computed the number of infants and children (age 1 to 4) residing in Puerto Rico
and adjusted the number for the Census under/overcount (Table 7). The estimated number with income below 185 percent of the poverty guidelines shows that 78 percent of the adjusted count of infants and 80 percent of the adjusted count for children were eligible for WIC in Puerto Rico in 2008 based on annual income alone—double the percentage of infants and children in the 50 States and the District of Columbia who appear income‐eligible. Adjunctive eligibility increases estimated WIC eligibility by 6 percent for infants (2,128) and by 3 percent for children (5,066). Given the high proportions of infants and children who are income‐eligible, it is reasonable that adjunctive eligibility due to program enrollment matters less in Puerto Rico than in the 50 States and the District of Columbia.
14 For 2000, the Puerto Rico estimate was obtained from the 2000 Census Summary File 4. For the other U.S. island territories—American Samoa, Guam, the U.S. Virgin Islands, and the Northern Mariana Islands—FNS provided an estimate of the number of income‐eligible infants and children.

National‐ and State‐Level Estimates of WIC Eligibles and Program Reach 18
Puerto Rico Infants
Children Age 1
Children Age 2
Children Age 3
Children Age 4
Total Children Age 1 to 4
Pregnant Women
Postpartum Breastfeeding
Women
Postpartum Non-Breastfeeding
Women Total
Total number of infants/children in the 2008 PRCS 40,515 47,760 50,422 44,988 47,085 190,255 230,770
Number after adjustment for PRCS under/overcount 45,541 46,607 48,324 49,081 48,767 192,779 238,320
Number with annual income <185% FPG 35,441 37,574 38,582 38,589 38,676 153,421 188,862
Number of additional people adjunctively eligible above 185% FPG 2,128 1,292 1,397 1,272 1,104 5,066 7,193
Through Food Stamps 932 700 423 536 408 2,066 2,998Through TANF 0 0 0 85 0 85 85Through Medicaid 1,196 592 975 651 696 2,914 4,110
Total number income and adjunctively eligible 37,568 38,866 39,979 39,862 39,780 158,487 196,055
Number after monthly income adjustment 44,331 39,255 40,379 40,260 40,178 160,071 204,402
Total Eligibles - Number after adjustment for nutritional risk (infants and children) 43,001 38,862 39,975 39,858 39,776 158,471 201,472
Starting point for estimates of women is fully eligible infants 43,001 43,001 43,001 129,002
Number after adjustment for length of pregnancy and income of woman during pregnancy 22,898 22,898
Number after adjustment for multiple births and infant deaths 22,809 42,833 42,833 108,475
Number after adjustment for breastfeeding 10,433 14,470 24,903
Total Eligibles - Number after adjustment for nutritional risk (pregnant and postpartum women) 22,124 10,433 14,470 47,027Source: 2008 PRCS
Other Island Territories Infants
Children Age 1
Children Age 2
Children Age 3
Children Age 4
Total Children Age 1 to 4
Pregnant Women
Postpartum Breastfeeding
Women
Postpartum Non-Breastfeeding
Women Total
Territories Age 0 to 4 distributed by Puerto Rico's age demographics 7,068 7,322 7,235 7,373 7,286 29,216 36,284
Number income and adjunctively eligible 4,752 4,781 4,724 4,814 4,757 19,076 23,828
Number after monthly income adjustment 5,608 4,829 4,771 4,862 4,805 19,266 24,874
Total Eligibles - Number after adjustment for nutritional risk (infants and children) 5,440 4,780 4,723 4,813 4,757 19,074 24,513
Starting point for estimates of women is fully eligible infants 5,440 5,440 5,440 16,319
Number after adjustment for length of pregnancy and
income of woman during pregnancye 2,897 2,897
Number after adjustment for multiple births and infant deaths 2,885 5,418 5,418 13,722
Number after adjustment for breastfeeding 1,320 1,830 3,150
Total Eligibles - Number after adjustment for nutritional risk (pregnant and postpartum women) 2,799 1,320 1,830 5,949Source: Census Bureau International Data Base
Total Eligibles - U.S. Territories Total 48,440 43,642 44,698 44,671 44,533 177,544 24,923 11,752 16,301 278,961
Note: aSee Tables 1, 2, 3a, and 3b for adjustment factors applied.
Table 7: Adjustments for Calculating the Average Monthly Number of Individuals Eligible for WIC in Puerto Rico and the Other Island Territories by Participant Group, CY 2008a

National‐ and State‐Level Estimates of WIC Eligibles and Program Reach 19
An adjustment must be applied to the direct estimates from the ACS to take into account monthly income or certification periods. The SIPP‐estimated annual‐to‐monthly adjustment factors (1.18 for infants and 1.01 for children) do not reflect data for Puerto Rico. Since a high proportion of infants and children are income‐eligible in Puerto Rico, it is possible that the true factors should be lower. However, in the absence of other data, the SIPP annual‐to‐monthly factors are applied to derive the Puerto Rico eligibility estimates. The nutritional risk adjustment factors of 0.97 for infants and 0.99 for children also are applied for comparability with prior estimates. The final average monthly eligibility estimates for Puerto Rico equal 94 percent of the total adjusted infant population and 82 percent of total children age 1 to 4.
For infants and children residing in other island territories, the only data available are
annual population estimates (from the Census Bureau’s International Database) for the combined age group of 0 to 4 years and once‐in‐a‐decade estimates of the number of infants and children who are income and adjunctively eligible (from decennial Census data). Our methods therefore use each year’s population estimate (allowing the eligibility estimate to rise or fall with the estimated population of infants and young children), but assume that a constant percentage of the population is WIC‐eligible (since there are no data to support other assumptions). Because the available population data pertain only to the combined age group, we use vital statistics data for these territories over the five preceding years to allocate each year’s total population estimate to the number of infants and to each of the four years of children (age 1 to 4).
Based upon 2000 Census data, 56.8 percent of infants and children in the other island
territories were income‐eligible for WIC in 2008. While this percentage represents the most recently available evidence on income eligibility in the other island territories, it does not account for adjunctive eligibility. To estimate the additional number of infants and children who would gain eligibility through participation in other safety net programs, we examined the relationship between adjunctive eligibility and income eligibility in Puerto Rico and the mainland. That information implies roughly an increase of 18 percent in the number of WIC‐eligible infants, and an increase of 15 percent in the number of WIC‐eligible children, due to adjunctive eligibility. We estimated the number of WIC‐eligible infants in American Samoa, Guam, the Northern Mariana Islands, and the U.S. Virgin Islands to be 0.672 times the population estimates for each area, and we estimated the number of WIC‐eligible children in these areas as 0.653 times the population estimates. (The calculations are described in greater detail in Appendix B.)
As with the estimates for Puerto Rico, the final steps in the estimation of WIC‐eligible
infants and children in the other island territories are to apply the annual‐to‐monthly adjustment factors and the nutritional risk adjustment factors. The final eligibility estimates suggest that in the other island territories combined, the average monthly number of eligible infants is 0.005 million (77 percent of total infants), and the average monthly number of eligible children is 0.019 million (65 percent of total children).
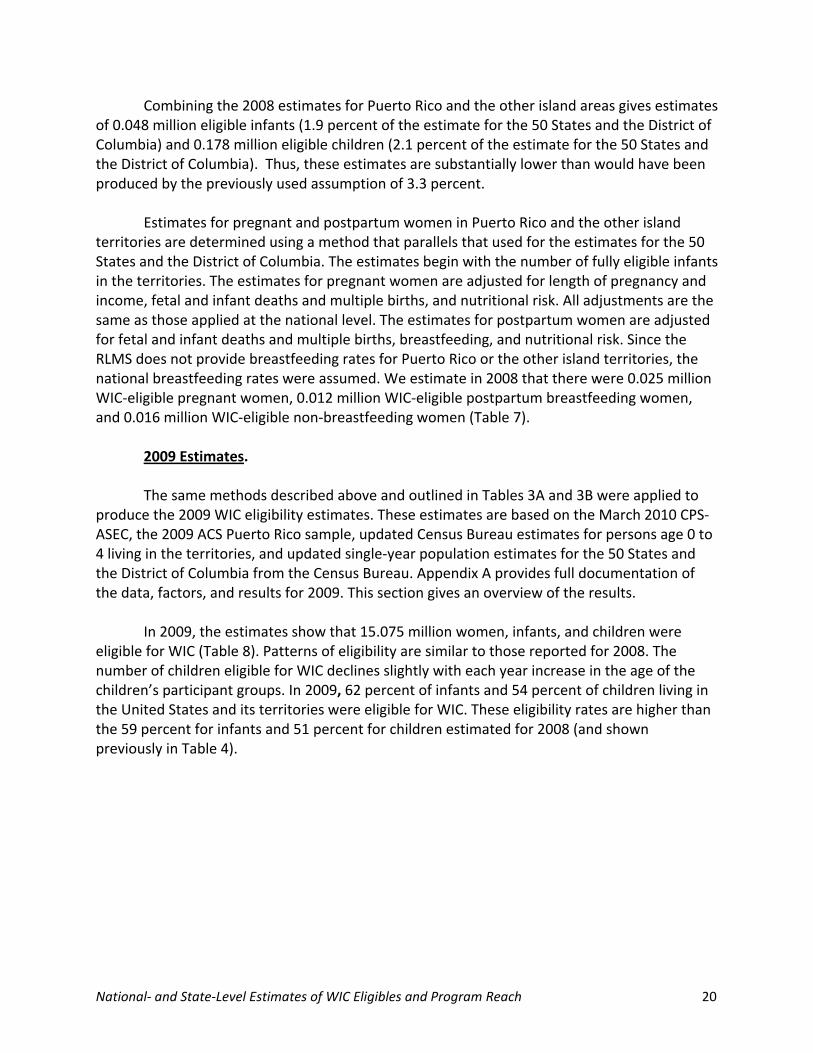
National‐ and State‐Level Estimates of WIC Eligibles and Program Reach 20
Combining the 2008 estimates for Puerto Rico and the other island areas gives estimates of 0.048 million eligible infants (1.9 percent of the estimate for the 50 States and the District of Columbia) and 0.178 million eligible children (2.1 percent of the estimate for the 50 States and the District of Columbia). Thus, these estimates are substantially lower than would have been produced by the previously used assumption of 3.3 percent.
Estimates for pregnant and postpartum women in Puerto Rico and the other island
territories are determined using a method that parallels that used for the estimates for the 50 States and the District of Columbia. The estimates begin with the number of fully eligible infants in the territories. The estimates for pregnant women are adjusted for length of pregnancy and income, fetal and infant deaths and multiple births, and nutritional risk. All adjustments are the same as those applied at the national level. The estimates for postpartum women are adjusted for fetal and infant deaths and multiple births, breastfeeding, and nutritional risk. Since the RLMS does not provide breastfeeding rates for Puerto Rico or the other island territories, the national breastfeeding rates were assumed. We estimate in 2008 that there were 0.025 million WIC‐eligible pregnant women, 0.012 million WIC‐eligible postpartum breastfeeding women, and 0.016 million WIC‐eligible non‐breastfeeding women (Table 7).
2009 Estimates.
The same methods described above and outlined in Tables 3A and 3B were applied to produce the 2009 WIC eligibility estimates. These estimates are based on the March 2010 CPS‐ASEC, the 2009 ACS Puerto Rico sample, updated Census Bureau estimates for persons age 0 to 4 living in the territories, and updated single‐year population estimates for the 50 States and the District of Columbia from the Census Bureau. Appendix A provides full documentation of the data, factors, and results for 2009. This section gives an overview of the results.
In 2009, the estimates show that 15.075 million women, infants, and children were
eligible for WIC (Table 8). Patterns of eligibility are similar to those reported for 2008. The number of children eligible for WIC declines slightly with each year increase in the age of the children’s participant groups. In 2009, 62 percent of infants and 54 percent of children living in the United States and its territories were eligible for WIC. These eligibility rates are higher than the 59 percent for infants and 51 percent for children estimated for 2008 (and shown previously in Table 4).
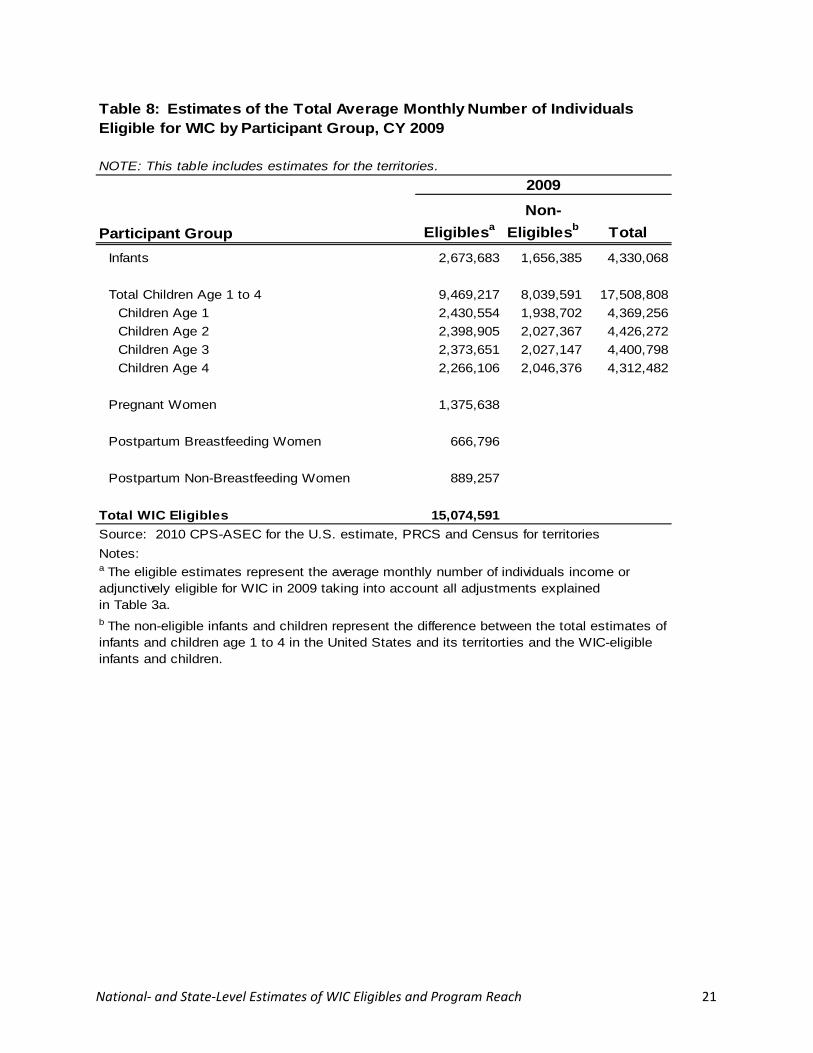
National‐ and State‐Level Estimates of WIC Eligibles and Program Reach 21
NOTE: This table includes estimates for the territories.
Participant Group Eligiblesa
Non-
Eligiblesb Total
Infants 2,673,683 1,656,385 4,330,068
Total Children Age 1 to 4 9,469,217 8,039,591 17,508,808
Children Age 1 2,430,554 1,938,702 4,369,256
Children Age 2 2,398,905 2,027,367 4,426,272
Children Age 3 2,373,651 2,027,147 4,400,798
Children Age 4 2,266,106 2,046,376 4,312,482
Pregnant Women 1,375,638
Postpartum Breastfeeding Women 666,796
Postpartum Non-Breastfeeding Women 889,257
Total WIC Eligibles 15,074,591
Source: 2010 CPS-ASEC for the U.S. estimate, PRCS and Census for territories
Notes:
2009
b The non-eligible infants and children represent the difference between the total estimates of infants and children age 1 to 4 in the United States and its territorties and the WIC-eligible infants and children.
a The eligible estimates represent the average monthly number of individuals income or adjunctively eligible for WIC in 2009 taking into account all adjustments explained in Table 3a.
Table 8: Estimates of the Total Average Monthly Number of Individuals Eligible for WIC by Participant Group, CY 2009

National‐ and State‐Level Estimates of WIC Eligibles and Program Reach 22
Focusing first on the 50 States and the District of Columbia, about 1.843 million infants and 7.594 million children were income‐eligible in 2009 (Table 9). An additional 0.448 million infants and 1.700 million children were adjunctively eligible. The annual‐to‐monthly income adjustment, accounting for continued eligibility during the certification period, adds 0.413 million infants (18 percent) and 0.093 million children (1 percent) to the WIC eligibles. The nutritional risk adjustment subtracts 3 percent of the infants and 1 percent of the children. The final component of the number of WIC‐eligible infants and children—estimated eligibility in the territories—adds 0.050 million infants and 0.176 million children. Counts for women that derive from these estimates indicate that in the 50 States and the District of Columbia, 1.350 million pregnant women are eligible and 1.527 million postpartum women are eligible (including 0.654 million estimated to be breastfeeding). Territory estimates add 0.026 million pregnant women and 0.029 million postpartum women.
The characteristics of WIC‐eligible infants and children, available only for the U.S.
mainland population, show that about 57 percent of the infants and children who are income‐eligible live in poor families (with income below the federal poverty thresholds) (Table 10). Including the infants and children who are adjunctively eligible, 47 percent of all WIC‐eligible infants and children live in poor families. The majority of WIC‐eligible infants and children (59 percent) live in two‐parent families. About 76 percent of WIC‐eligible infants and 74 percent of WIC‐eligible children in 2009 also have Medicaid coverage (either alone or with other government benefits). Table 11 summarizes the 2009 calculations used to produce estimates of WIC‐eligible individuals living in Puerto Rico and other island territories. As shown, the number of eligibles living in Puerto Rico—approximately 0.045 million infants, 0.157 million children, and 0.049 million women—comprise the great majority of the total estimates for territories. The direct method for estimating WIC eligibles that relies on the ACS data provides more accurate estimates than the adjusters used in the past. As noted earlier, the adjusters for income fluctuations and certification periods (the annual‐to‐monthly adjustment) use national estimates based on SIPP analyses.

National‐ and State‐Level Estimates of WIC Eligibles and Program Reach 23
Table 9: Adjustments for Calculating the Average Monthly Number of Individuals Eligible for WIC by Participant Group, CY 2009a
U.S. States and D.C. (2010 CPS-ASEC) Infants
Children Age 1
Children Age 2
Children Age 3
Children Age 4
Total Children Age 1 to 4
Pregnant Women
Postpartum Breastfeeding
Women
Postpartum Non-Breastfeeding
Women Total
Total number of infants/children in the 2010 CPS-ASEC 4,205,909 4,353,792 4,281,374 4,336,084 4,257,131 17,228,381 21,434,290
Number (non-U.S. Territory) after adjustment for CPS under/overcount 4,277,778 4,316,877 4,372,660 4,345,666 4,256,307 17,291,510 21,569,288
Number with annual income <185% FPG 1,843,336 1,902,086 1,953,867 1,906,057 1,831,964 7,593,974 9,437,310
Number of additional people adjunctively eligible above 185% FPG 448,617 485,373 402,934 421,534 390,144 1,699,985 2,148,602
Through Food Stamps 83,160 85,873 80,905 67,880 70,693 305,351 388,511Through TANF 5,206 2,405 4,047 10,070 14,586 31,108 36,314Through Medicaid 360,251 397,095 317,982 343,584 304,865 1,363,526 1,723,777
Total number income and adjunctively eligible 2,291,953 2,387,459 2,356,801 2,327,591 2,222,108 9,293,959 11,585,912
Number after monthly income adjustment 2,704,505 2,411,334 2,380,369 2,350,867 2,244,329 9,386,899 12,091,403
Total Eligibles - Number after adjustment for nutritional risk (infants and children) 2,623,370 2,387,220 2,356,565 2,327,358 2,221,886 9,293,030 11,916,399
Starting point for estimates of women is fully eligible infants 2,623,370 2,623,370 2,623,370 7,870,109
Number after adjustment for length of pregnancy and income of woman during pregnancy 1,396,944 1,396,944
Number after adjustment for multiple births and infant deaths 1,391,496 2,613,138 2,613,138 6,617,773
Number after adjustment for breastfeeding 654,248 872,523 1,526,771
Total Eligibles - Number after adjustment for nutritional risk (pregnant and postpartum women) 1,349,751 654,248 872,523 2,876,522Source: 2010 CPS-ASEC
Eligibles in the U.S. Territories InfantsChildren
Age 1Children
Age 2Children
Age 3Children
Age 4
Total Children Age 1 to 4
Pregnant Women
Postpartum Breastfeeding
Women
Postpartum Non-Breastfeeding
Women Total
Total Eligibles in the U.S. Territories 50,314 43,334 42,340 46,293 44,221 176,187 25,887 12,548 16,734 281,670Source: 2009 PRCS and Census International Data Base
See Appendix Table S7 for details.
Total Eligibles - States and Territories U.S. Total
2,673,683 2,430,554 2,398,905 2,373,651 2,266,106 9,469,217 1,375,638 666,796 889,257 15,074,591
Note: aSee Tables 1, 2, 3a, and 3b for adjustment factors applied.

National‐ and State‐Level Estimates of WIC Eligibles and Program Reach 24
Fully adjusted weightsa
Demographic Characteristics
Family income <185%
FPGb
Adjunct-ively
eligiblec Total
Family income <185%
FPGb
Adjunct-ively
eligiblec Total
Family income <185%
FPGb
Adjunct-ively
eligiblec Total
Total 2,109,883 513,488 2,623,370 7,593,214 1,699,815 9,293,030 9,703,097 2,213,303 11,916,400
GenderMale 48.3 55.3 49.7 50.4 50.4 50.4 49.9 51.6 50.2Female 51.7 44.7 50.3 49.6 49.6 49.6 50.1 48.4 49.8
Race/ethnicityWhite, non-Hispanic 33.0 50.8 36.4 35.4 47.8 37.7 34.9 48.5 37.4Black, non-Hispanic 24.8 17.3 23.4 23.5 14.2 21.8 23.8 14.9 22.1Other, non-Hispanic 5.8 4.5 5.6 4.9 7.1 5.3 5.1 6.5 5.4Hispanic 36.4 27.4 34.6 36.2 30.9 35.2 36.2 30.1 35.1
Living arrangementTwo-parent family 61.3 68.9 62.7 56.3 65.5 58.0 57.4 66.3 59.0Single-parent family 35.3 27.9 33.8 38.6 29.3 36.9 37.9 29.0 36.2No-parent family 3.5 3.2 3.4 5.1 5.1 5.1 4.7 4.7 4.7
Related non-parent caretaker 2.6 3.2 2.7 3.4 5.1 3.7 3.2 4.7 3.5Unrelated non-parent caretaker 0.9 0 0.7 1.7 0 1.4 1.5 0.0 1.2
Household size (number of persons)2 5.0 3.6 4.7 5.5 3.4 5.1 5.4 3.4 5.03 22.3 25.9 23.0 17.6 18.8 17.8 18.6 20.4 19.04 29.6 29.3 29.5 29.1 27.5 28.8 29.2 27.9 29.05 18.8 19.2 18.9 20.8 23.3 21.3 20.4 22.3 20.76 or more 24.3 22.0 23.9 27.0 27.0 27.0 26.5 25.9 26.3
% with working parent(s) 60.7 77.9 64.1 63.9 82.1 67.3 63.3 81.2 66.6
Annual family income relative to povertyb
Less than 50% FPL 28.2 0 22.7 27.4 0 22.4 27.6 0 22.550% to <100% FPL 29.4 0 23.7 29.5 0 24.1 29.5 0 24.0100% to <130% FPL 13.3 0 10.7 16.3 0 13.3 15.7 0 12.8
130% to <185% FPLd 28.1 4.8 23.6 25.9 2.7 21.6 26.4 3.2 22.1185% to <200% FPL 0.9 7.6 2.2 0.8 9.5 2.4 0.9 9.0 2.4200% to <250% FPL 0 32.5 6.4 0.1 26.8 5.0 0.1 28.1 5.3250% FPL and above 0 55.1 10.8 0 61.1 11.2 0 59.7 11.1
Benefit receiptNo benefit receipt 24.6 0 19.8 25.6 0 21.0 25.4 0 20.7FSP, TANF, & Medicaid 6.6 0.1 5.3 7.2 1.0 6.1 7.1 0.8 5.9FSP & TANF 0 0 0 0.0 0 0 0 0 0FSP & Medicaid 31.7 15.9 28.6 34.9 13.0 30.9 34.2 13.7 30.4TANF & Medicaid 0.9 1.2 0.9 0.7 1.8 0.9 0.8 1.7 0.9FSP only 5.1 2.5 4.6 5.4 3.9 5.1 5.3 3.6 5.0TANF only 0 0 0 0 0 0 0 0 0Medicaid only 31.1 80.3 40.7 26.2 80.2 36.0 27.2 80.2 37.1
Source: 2010 CPS-ASEC
Notes for Table 10:FPG - Federal Poverty GuidelinesFPL - Federal Poverty Level
Table 10: Estimates of the Average Monthly Number of Infants and Children Eligible for WIC by Income and Adjunctive Eligibility in the 2010 CPS-ASEC by Demographic Characteristics - CY 2009
a These estimates are tabulated from the unadjusted person weights on the 2010 CPS-ASEC. They are not adjusted to account for the under or over count of infants and children in the CPS relative to Census estimates, eligibility in the U.S. Territories, monthly income, or nutritional risk. See Appendix Tables A.3, A.4a, and A.4b for the adjustment factors.b This table uses both the Federal Poverty Guidelines (FPG) and the Federal Poverty Thresholds or "Levels" (FPL). The thresholds are used to calculate the ratio of annual family income to the poverty threshold for their family size. The guidelines are used in determining WIC eligibility.cInfants and children adjunctively eligible are those whose family income was not below 185% FPG but who reported receipt of Food Stamps, Medicaid, or TANF. Therefore, the two categories are mutually exclusive.
WIC-Eligible InfantsWIC-Eligible Children
Age 1 to 4Total WIC-Eligible Infants and
Children Age 0 to 4
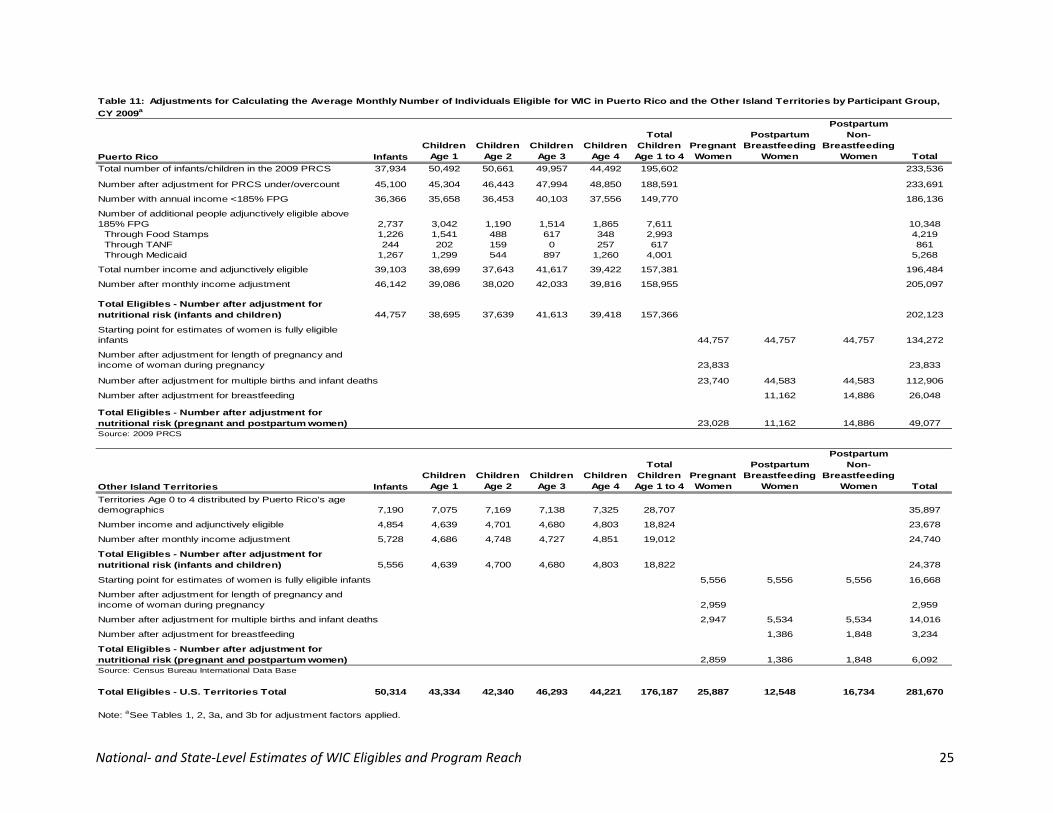
National‐ and State‐Level Estimates of WIC Eligibles and Program Reach 25
Puerto Rico Infants
Children Age 1
Children Age 2
Children Age 3
Children Age 4
Total Children Age 1 to 4
Pregnant Women
Postpartum Breastfeeding
Women
Postpartum Non-
Breastfeeding Women Total
Total number of infants/children in the 2009 PRCS 37,934 50,492 50,661 49,957 44,492 195,602 233,536
Number after adjustment for PRCS under/overcount 45,100 45,304 46,443 47,994 48,850 188,591 233,691
Number with annual income <185% FPG 36,366 35,658 36,453 40,103 37,556 149,770 186,136
Number of additional people adjunctively eligible above 185% FPG 2,737 3,042 1,190 1,514 1,865 7,611 10,348
Through Food Stamps 1,226 1,541 488 617 348 2,993 4,219Through TANF 244 202 159 0 257 617 861Through Medicaid 1,267 1,299 544 897 1,260 4,001 5,268
Total number income and adjunctively eligible 39,103 38,699 37,643 41,617 39,422 157,381 196,484
Number after monthly income adjustment 46,142 39,086 38,020 42,033 39,816 158,955 205,097
Total Eligibles - Number after adjustment for nutritional risk (infants and children) 44,757 38,695 37,639 41,613 39,418 157,366 202,123
Starting point for estimates of women is fully eligible infants 44,757 44,757 44,757 134,272
Number after adjustment for length of pregnancy and income of woman during pregnancy 23,833 23,833
Number after adjustment for multiple births and infant deaths 23,740 44,583 44,583 112,906
Number after adjustment for breastfeeding 11,162 14,886 26,048
Total Eligibles - Number after adjustment for nutritional risk (pregnant and postpartum women) 23,028 11,162 14,886 49,077Source: 2009 PRCS
Other Island Territories Infants
Children Age 1
Children Age 2
Children Age 3
Children Age 4
Total Children Age 1 to 4
Pregnant Women
Postpartum Breastfeeding
Women
Postpartum Non-
Breastfeeding Women Total
Territories Age 0 to 4 distributed by Puerto Rico's age demographics 7,190 7,075 7,169 7,138 7,325 28,707 35,897
Number income and adjunctively eligible 4,854 4,639 4,701 4,680 4,803 18,824 23,678
Number after monthly income adjustment 5,728 4,686 4,748 4,727 4,851 19,012 24,740
Total Eligibles - Number after adjustment for nutritional risk (infants and children) 5,556 4,639 4,700 4,680 4,803 18,822 24,378
Starting point for estimates of women is fully eligible infants 5,556 5,556 5,556 16,668
Number after adjustment for length of pregnancy and income of woman during pregnancy 2,959 2,959
Number after adjustment for multiple births and infant deaths 2,947 5,534 5,534 14,016
Number after adjustment for breastfeeding 1,386 1,848 3,234
Total Eligibles - Number after adjustment for nutritional risk (pregnant and postpartum women) 2,859 1,386 1,848 6,092Source: Census Bureau International Data Base
Total Eligibles - U.S. Territories Total 50,314 43,334 42,340 46,293 44,221 176,187 25,887 12,548 16,734 281,670
Note: aSee Tables 1, 2, 3a, and 3b for adjustment factors applied.
Table 11: Adjustments for Calculating the Average Monthly Number of Individuals Eligible for WIC in Puerto Rico and the Other Island Territories by Participant Group,
CY 2009a

National‐ and State‐Level Estimates of WIC Eligibles and Program Reach 26
Comparing 2009 to 2008.
Estimates of the number of people in all categories of WIC‐eligible children and women
increased between 2008 and 2009 (Table 12). The number of infants eligible for WIC increased by 1.5 percent (40,000) and the number of WIC‐eligible children age 1 to 4 increased by 9.4 percent (812,000). The increase in the estimated number of pregnant women eligible for WIC follows the increase for infants (since this estimate begins with the number of infants). The estimated number of postpartum breastfeeding women eligible for WIC increased by 4.4 percent.
These increases likely result from numerous changes. The total number of infants
decreased by 2.8 percent while the number of children age 1 to 4 increased by 2.5 percent (including the under/over count adjustment). In the 50 States and the District of Columbia, the number of infants and children in families with annual income below 185 percent of the poverty guidelines increased by 7.1 and 10.5 percent, respectively (Tables 5 and 9). This increase reflects continued weakness in the economy and long‐term unemployment in 2009. The effect of adjunctive eligibility for infants declined from 2008 to 2009, with fewer infants adjunctively eligible through SNAP and Medicaid enrollment. In contrast, adjunctive eligibility for children increased by 5.7 percent between 2008 and 2009, reflecting enrollment increases in all three programs.15 The annual‐to‐monthly income adjustment further increased WIC eligibility, as expected, using the adjusters of 1.18 for infants and 1.01 for children. The eligibility estimates for the territories are relatively flat between 2008 and 2009, with the total estimated eligibility across women, infants, and children increasing by only 1 percent. (As discussed, the new method for 2008 and 2009 directly uses the Puerto Rico Community Survey, and estimates for the other territories reflect a series of factors applied to Census population counts.)
15 Note that the large percentage increase in adjunctive eligibility through TANF likely reflects small sample sizes. Adjunctive eligibility through TANF fluctuated between 2000 and 2007 for infants, from a low of 3,400 (2007) to a high of 16,800 (2006) and for children from a low of 16,800 (2007) to a high of 39,000 (2005). This program is relatively small and very few families that are enrolled in TANF are not also eligible for WIC through the program’s income eligibility rules.
National‐ and State‐Level Estimates of WIC Eligibles and Program Reach 27
NOTE: This table includes estimates for the territories.
Participant Group Eligiblesa
Non-
Eligiblesb Total Eligiblesa
Non-
Eligiblesb Total EligiblesNon-
Eligibles Total
Infants 2,673,683 1,656,385 4,330,068 2,633,819 1,811,679 4,445,498 1.51% -8.57% -2.60%
Total Children Age 1 to 4 9,469,217 8,039,591 17,508,808 8,657,117 8,399,639 17,056,756 9.38% -4.29% 2.65%Children Age 1 2,430,554 1,938,702 4,369,256 2,292,023 2,054,735 4,346,758 6.04% -5.65% 0.52%Children Age 2 2,398,905 2,027,367 4,426,272 2,143,513 2,176,247 4,319,761 11.91% -6.84% 2.47%Children Age 3 2,373,651 2,027,147 4,400,798 2,117,479 2,113,062 4,230,541 12.10% -4.07% 4.02%Children Age 4 2,266,106 2,046,376 4,312,482 2,104,102 2,055,595 4,159,697 7.70% -0.45% 3.67%
Pregnant Women 1,375,638 1,355,127 1.51%
Postpartum Breastfeeding Women 666,796 639,003 4.35%Postpartum Non-Breastfeeding Women 889,257 886,312 0.33%
Total WIC Eligibles 15,074,591 14,171,378 6.37%Source: 2009 and 2010 CPS-ASEC for U.S. estimate, PRCS and Census for territoriesNotes:a The eligible estimates represent the average monthly number of individuals eligible for WIC in 2009 and 2008 taking into account all adjustments explained in Table 3a.b The non-eligible infants and children represent the difference between the total estimates of infants and children age 1 to 4 in the total United States and territories and the WIC-eligible infants and children.
Table 12: Estimates of the Total Average Monthly Number of Individuals Eligiblefor WIC by Participant Group:
A Comparison of the Change from Calendar Year 2008 to 2009
2009 2008 Percent Change

National‐ and State‐Level Estimates of WIC Eligibles and Program Reach 28
Regional and State Estimates of WIC Eligibility
A fundamental requirement of this task order is the creation of a methodology for estimating WIC eligibility at the State level. This required identifying the best data source for State estimates and considering State‐level adjustments for population counts, annual‐to‐monthly income, and breastfeeding. It required construction of a time series of State‐level WIC eligibility based upon the recommended methodology. We considered the usefulness of the CPS‐ASEC for State‐level estimation through both shrinkage estimates and multiple years of the CPS‐ASEC in comparison to the much larger American Community Survey. We concluded that the ACS is sufficiently large to support modeling at the State level with reasonable levels of precision. For the great majority of States, the ACS provides a more precise estimate of WIC eligibility than the CPS‐ASEC, and for all States a more up‐to‐date estimate than using an average of three years of CPS‐ASEC data.
We noted two limitations with this approach: 2000 is the first year that a full sample of the ACS is available and 2008 represents the first year that the ACS included a question on health insurance status. Insurance status is required to determine adjunctive eligibility for WIC through Medicaid enrollment. FNS concluded that an approach should be chosen to allow the best available estimates for WIC eligibility moving forward. Thus, a decision was reached to use the ACS in the estimation of State‐level WIC eligibility. Estimates for 2008 and 2009 can be made directly with the ACS, and estimates for 2000 through 2007 can be generated using adjustments for the effect of Medicaid adjunctive eligibility. The discussion below outlines all of the steps required for the State‐level estimates using the ACS. We first discuss methods and results for 2008 and 2009. These methods can be applied for future State‐level estimates. A separate section describes the State‐level estimates for 2000 through 2007, including procedures for estimating the effect of Medicaid enrollment on WIC.
Determining State‐Level WIC Eligibility with the ACS data.
While the ACS collects data from substantially more households than does the CPS‐ASEC, the data collected from each household are somewhat less detailed. The data provided by the ACS are less than ideal for defining the WIC filing unit and for estimating income eligibility.
As explained earlier, the CNSTAT Panel recommended that all members of a household related by blood, marriage, or adoption be considered as one family unit for the purposes of determining WIC eligibility. While for many households this definition amounts to defining the entire household as a filing unit, some households are more complex. For example, an unmarried partner of the householder (reference person) with a child from a prior relationship would be considered a separate filing unit in the CPS‐ASEC data used for the national
National‐ and State‐Level Estimates of WIC Eligibles and Program Reach 29
estimation process. However, the only information the ACS provides on family relationships is each individual’s relationship to the reference person (householder). Since the Minnesota Population Center’s IPUMS‐USA provides researchers with educated conjectures about the relationships between persons not related to the householder, State‐level eligibility estimates begin with these data.16 This allows WIC eligibility to be assessed within ACS families that are unrelated to the household head, as is done with the CPS‐ASEC data. The IPUMS is a respected and widely used data set created within weeks of when the ACS is released.17
The ACS surveys households on an ongoing basis throughout the year, and households are asked to report income received from various sources in the preceding 12‐month period. Consequently, only ACS households interviewed in January provide their income for the previous calendar year (analogous to the CPS‐ASEC). All other households have income that reflects a mixture of previous year’s income with the current year’s income. For example, those households interviewed in March 2010 report their income from March of 2009 through February of 2010. The ACS income reporting period presents a challenge to determining which infants and children meet the WIC income and adjunctive eligibility criteria. To facilitate annual income estimation with the ACS, the Census Bureau internally computes inflation factors to convert the reported income to the current calendar year. The Census Bureau releases only the average of the 12 factors computed for a given year’s data. We applied that average factor to the ACS incomes prior to determining income eligibility for each year.
Like the process for estimating national‐level WIC eligibility from the CPS‐ASEC data, the process for estimating State‐level eligibility from the ACS data involves the use of adjustment factors. State‐specific data were used in two of the adjustments—for population and for breastfeeding.
Population Adjustment: For the State estimates, the adjustments to the ACS weights mirror the adjustments that are made to the CPS national data.18 Using Census Bureau State population estimates by age, the ACS person weights for infants and children are proportionally adjusted so that the sum of the persons of a given age are equal to the Census population estimates for each State.
Breastfeeding Adjustment: As explained earlier, the breastfeeding adjustment includes three components—the in‐hospital and six‐month breastfeeding rates for women participating in WIC, the adjustment for differences between WIC participants and WIC‐eligible women, and the adjustment for the fact that breastfeeding declines from each month to the next. For the State‐level WIC eligibility estimates, the second and third components of the adjustment
16 Ruggles, Alexander, Genadek, Goeken, Schroeder, and Sobek 2010. 17 Although the ACS has a broader sampling frame than the CPS‐ASEC—including many types of institutions—all types of institutions and group quarters are excluded for purposes of the WIC eligibility estimates. 18 One difference between the methodology used for the ACS population adjustments and the CPS‐ASEC population adjustments is that the ACS adjustments are based on one year of Census Bureau estimates and one year of ACS data, while the CPS‐ASEC adjustments are based on four‐year accumulations of population estimates and survey data.

National‐ and State‐Level Estimates of WIC Eligibles and Program Reach 30
remain as in the national estimates, but the first component—breastfeeding rates in the hospital and at six months—is modified to capture State‐level variation in breastfeeding rates.19 Ross Labs publishes both in‐hospital and at‐six‐month breastfeeding rates for women participating in WIC by State. This annual series began in 1999 and has been updated through 2009.20 For other adjustment factors, the national factors were used in each State.
Annual‐to‐Monthly Adjustment: Ideally, the annual‐to‐monthly adjustment factor would be modified to account for State‐specific differences in economic factors that affect income patterns during the year (monthly unemployment, seasonal employment, and so on) and those that affect adjunctive eligibility during the year. States’ eligibility criteria and certification periods for SNAP and Medicaid differ. Ideally, State‐specific annual‐to‐monthly adjusters would also account for the sample design differences between the ACS and CPS‐ASEC data. While the numerator in the adjustment factor (number of months of eligibility given monthly income and certification) would remain the same, the denominator reflecting annual eligibility would need to be altered to reflect the differences in the sample design. The rolling time frame for income in the ACS, as opposed to the calendar year income from the CPS‐ASEC, also affects income eligibility.
The SIPP remains the only data source for estimation of the annual‐to‐monthly
adjustment at the national or sub‐national levels. However, the SIPP is too small to support State‐specific adjusters. Consequently, these initial State estimates use the national annual‐to‐monthly adjusters for infants and children.
Nutritional Risk: The current values for the nutritional risk adjustments reflect the CNSTAT Panel’s analysis of data from the 1994 to 1998 Continuing Survey of Food Intake (CSFI) for WIC‐eligible individuals.21 These data represent the latest years from this survey. We use the current national adjustment factors at the State level. Fetal and Infant Deaths and Multiple Births: To estimate the number of mothers of WIC‐eligible infants, we use the national‐level adjustment factor (0.9961) in all States. Pregnancy Adjustments: The ACS‐based estimates of eligibility due to pregnancy use the same factor (0.533) as the national estimates to adjust for the duration of pregnancy and for
19 For example, in 2009 the in‐hospital breastfeeding rate was 47 percent in Alabama and 78 percent in Vermont; the six‐month estimates were 23 and 42 percent for Alabama and Vermont, respectively, according to the Ross Labs data. 20 As discussed earlier and in Appendix F, the RLMS shows declining rates of breastfeeding over time since 2000. The trend varies from other data and needs to be vetted further in the future. Validation of RLMS rates by State also would be useful for future refinement of the estimates. 21 The CNSTAT Panel noted that a potentially preferable data set to account for the full range of nutritional risk criteria would be the NHANES, which contains many of the questions asked in the CSFI. However, sample sizes are quite small, and resources for this project did not allow re‐estimation of these factors.

National‐ and State‐Level Estimates of WIC Eligibles and Program Reach 31
the possibility that a woman might not be eligible for WIC during pregnancy even if the infant is eligible. It is possible that the relationship between income before and after the child’s birth varies across States or regions.
Implementing the State‐Level WIC Eligibility Estimates. After considering both ‘top‐down’ and ‘bottom‐up’ approaches for producing the State‐
level estimates, we concluded that a top‐down approach was superior. In a top down approach, national estimates of WIC eligibility are first produced using the CPS‐ASEC, and then the ACS is used to allocate the national total to individual States. The bottom‐up approach would begin with State estimates of WIC eligibility directly from the ACS and an aggregation of the State estimates would create the national WIC eligibility estimates. One clear advantage of the top‐down approach is that there currently exists an accepted methodology for producing national estimates and a time series of estimates. A bottom‐up strategy likely would not align with the current set of national estimates. The nationally representative CPS‐ASEC sample is well suited for WIC eligibility determination compared to the ACS due to its timeliness and more complete income and program participation data. Also, the CPS asks respondents for their income during the calendar year, while the ACS’s income covers not only the calendar year for which the estimate is being made but also income from the previous time period. Consequently the ACS is less likely to detect increases in eligibility as the economy falters or decreases in eligibility when the economy improves.
We examined the differences between the top‐down and bottom‐up approaches to estimating State level estimates of WIC‐eligible infants using national and State estimates from the CPS‐ASEC and the ACS. This analysis showed differences in the number of infants in the ACS and the CPS‐ASEC and higher WIC eligibility estimates using the ACS than the CPS. This analysis confirmed that national estimates from the ACS would differ from the prior time series used by FNS. This analysis also showed that the ACS produced lower standard errors of estimate at the State level compared with estimates from multiple years of the CPS.
The analysis led us to recommend and FNS to accept a method that uses the ACS to
estimate the shares of eligible infants, children, and women in each State. As explained further in Appendix C, the State and regional estimates are produced by first adjusting ACS population counts by the Census estimates for each year. Then WIC income and adjunctive eligibility (those enrolled in SNAP, TANF, or public health insurance) are estimated using the ACS data. Adjustments for annual‐to‐monthly income and for nutritional risk are applied using the national factors. Estimates for pregnant and postpartum women are derived from the infant estimates as with the national estimates, with the exception that the breastfeeding adjustments incorporate State variation in breastfeeding rates.
The ACS analysis results in State shares for each subgroup, which are applied to the CPS‐ASEC national estimates. This produces estimates by subgroup at the FNS regional level and total WIC eligibility estimates at the State level. While estimates for subpopulations help to
National‐ and State‐Level Estimates of WIC Eligibles and Program Reach 32
build total WIC eligibility variation across the States, they are not sufficiently reliable to publish individually. Eligibility subgroups are relatively small in many States.
Regional and State Estimates: 2008 and 2009.
The estimated distribution of WIC eligibility by FNS region (Table 13) shows the greatest portions of WIC eligibles in the Western and Southeast regions (each with approximately 21 percent of all WIC eligibles), while the Northeast and Mountain Plains regions have the fewest WIC‐eligible individuals (about 8 percent). The distribution of estimated eligibility across regions is approximately the same for each subgroup of WIC‐eligible individuals. By State (Table 14) California has the greatest share of WIC eligibles, with an estimated 13 percent of all WIC‐eligible individuals. Other States with large shares of total WIC eligibility are Texas (11 percent), Florida (6 percent), New York (5 percent), and Illinois (4 percent). As discussed earlier, the overall eligibility estimate increased by 6.4 percent from 2008 to 2009, with increases for all subgroups at the national level. Eligibility increased for each subgroup in most but not all of the regions (Table 15). In the Southwest, the estimated number of WIC‐eligible infants declined by 1.6 percent from 2008 to 2009, leading to similar declines in the estimated numbers of WIC‐eligible pregnant women and postpartum mothers in this region. The decline in infant eligibility likely reflects declines in total infants in two of the Southwestern States (Arkansas and Louisiana) coupled with relatively low increases in WIC eligibility in this region.22 In the Northeast, the estimated numbers of WIC eligibles increased for all subgroups except postpartum women; the decline for postpartum women is related in part to fluctuations in the Ross Labs breastfeeding estimates at the State level. The regional and State level eligibility estimates allow the computation of regional and State coverage rates, defined as the number of individuals enrolled in the WIC program divided by the number eligible in each State. (These are alternately referred to as participation rates.) Considering all WIC‐eligible individuals combined, the overall WIC coverage rate is lowest in the Mountain Plains region, at 54 percent in 2008 and 53 percent in 2009 (Figures 1 and 2 and Tables 16 and 17). The overall WIC coverage rate is highest in the Western region (71 percent in 2008 and 68 percent in 2009). Some regions have higher coverage rates than the national average for some but not all subgroups. In 2009, the Northeast has higher coverage rates than any other region for infants (86.3 percent) and postpartum women (88.6 percent), while its coverage rates for children and pregnant women are higher than the national averages but lower than the rates in the Western region (Table 17 and Figures 3 through 6).
22 Texas and Oklahoma had smaller increases in unemployment between 2008 and 2009 compared with the nation. The Texas rate increased from 4.9 to 7.6 percent, the Oklahoma rate increased from 3.7 to 6.6 percent, and the U.S. rate increased from 5.8 to 9.3 percent between 2008 and 2009. Data from the Bureau of Labor Statistics: http://stats.bls.gov/lau/lastrk08.htm and http://stats.bls.gov/lau/lastrk09.htm.

National‐ and State‐Level Estimates of WIC Eligibles and Program Reach 33
InfantsChildren
(age 1 to 4)Pregnant Women
All Postpartum Women Total
Distribution of Eligibles, 2008Northeast 8.2% 8.4% 8.2% 8.7% 8.4%Mid-Atlantic 10.6% 11.2% 10.6% 10.2% 10.9%Southeast 20.8% 21.0% 20.8% 20.3% 20.9%Midwest 15.3% 14.8% 15.3% 15.2% 15.0%Southwest 16.5% 16.4% 16.5% 16.0% 16.4%Mountain Plains 7.6% 7.4% 7.6% 7.8% 7.5%Western 21.0% 20.7% 21.0% 21.9% 20.9%
Total 100.0% 100.0% 100.0% 100.0% 100.0%
Distribution of Eligibles, 2009Northeast 8.2% 8.4% 8.2% 8.1% 8.3%Mid-Atlantic 11.1% 11.0% 11.1% 10.7% 11.0%Southeast 21.1% 21.2% 21.1% 20.5% 21.1%Midwest 15.2% 15.1% 15.2% 15.0% 15.1%Southwest 16.0% 15.9% 16.0% 15.3% 15.9%Mountain Plains 7.7% 7.5% 7.7% 8.3% 7.6%Western 20.8% 21.0% 20.8% 22.1% 21.0%
Total 100.0% 100.0% 100.0% 100.0% 100.0%Source: 2009 CPS-ASEC, 2008 ACS, 2008 PRCS, Census International Data Base
Table 13: Distribution of WIC Eligibles by FNS Region for each Participant Group, CY 2008 and CY 2009

National‐ and State‐Level Estimates of WIC Eligibles and Program Reach 34
Distribution of Eligibles, 2008
Distribution of Eligibles, 2009
Distribution of Eligibles, 2008
Distribution of Eligibles, 2009
StateAlabama 1.6% 1.6% New York 5.4% 5.3%Alaska 0.2% 0.3% North Carolina 3.3% 3.3%Arizona 2.7% 2.6% North Dakota 0.2% 0.2%Arkansas 1.2% 1.1% Ohio 3.3% 3.3%California 13.1% 13.0% Oklahoma 1.4% 1.4%Colorado 1.5% 1.5% Oregon 1.2% 1.2%Connecticut 0.7% 0.7% Pennsylvania 3.1% 3.1%Delaware 0.2% 0.3% Puerto Rico 1.8% 1.7%D.C. 0.2% 0.2% Rhode Island 0.2% 0.3%Florida 5.5% 5.9% South Carolina 1.6% 1.6%Georgia 3.8% 3.8% South Dakota 0.3% 0.3%Hawaii 0.3% 0.4% Tennessee 2.2% 2.2%Idaho 0.6% 0.6% Texas 10.9% 10.7%Illinois 4.0% 4.1% Utah 1.0% 1.0%Indiana 2.1% 2.1% Vermont 0.1% 0.2%Iowa 0.8% 0.8% Virginia 1.8% 1.9%Kansas 0.9% 0.8% Washington 1.9% 2.0%Kentucky 1.5% 1.5% West Virginia 0.5% 0.5%Louisiana 1.9% 1.7% Wisconsin 1.4% 1.4%Maine 0.3% 0.3% Wyoming 0.2% 0.2%Maryland 1.3% 1.4%
Massachusetts 1.3% 1.3% FNS Regiona
Michigan 2.9% 2.9% Northeast 8.4% 8.3%Minnesota 1.2% 1.3% Mid-Atlantic 10.9% 11.0%Mississippi 1.3% 1.3% Southeast 20.9% 21.1%Missouri 1.9% 1.9% Midwest 15.0% 15.1%Montana 0.3% 0.3% Southwest 16.4% 15.9%Nebraska 0.6% 0.6% Mountain Plains 7.5% 7.6%Nevada 0.8% 0.9% Western 20.9% 21.0%New Hampshire 0.2% 0.2%New Jersey 1.9% 2.0% Total 100.0% 100.0%New Mexico 0.9% 0.9%Source: 2009 CPS-ASEC, 2008 ACS, 2008 PRCS, Census International Data Base
Notes:a
Table 14: Distribution of WIC Eligibility by State and FNS Region, CY 2008 and CY 2009
Estimates for the other island territories (territories other than Puerto Rico) are included in regional totals but not shown separately due to small sample constraints.

National‐ and State‐Level Estimates of WIC Eligibles and Program Reach 35
InfantsChildren
(age 1 to 4)Pregnant Women
All Postpartum Women Total
Eligibles, 2008Northeast 216,092 730,540 111,182 133,389 1,191,203Mid-Atlantic 279,144 972,366 143,623 155,217 1,550,350Southeast 547,598 1,816,805 281,745 309,117 2,955,264Midwest 403,335 1,280,498 207,520 231,846 2,123,199Southwest 433,386 1,422,837 222,982 243,474 2,322,679Mountain Plains 201,425 640,013 103,635 118,605 1,063,678Western 552,839 1,794,057 284,441 333,668 2,965,005
Total 2,633,819 8,657,117 1,355,127 1,525,315 14,171,378
Eligibles, 2009Northeast 218,049 793,064 112,188 125,924 1,249,226Mid-Atlantic 296,202 1,045,813 152,399 167,224 1,661,638Southeast 564,646 2,003,637 290,516 319,646 3,178,445Midwest 407,540 1,427,199 209,684 233,124 2,277,547Southwest 426,602 1,505,367 219,491 238,130 2,389,590Mountain Plains 205,712 707,976 105,841 128,770 1,148,300Western 554,933 1,986,162 285,519 343,234 3,169,847
Total 2,673,683 9,469,217 1,375,638 1,556,053 15,074,591
Percent Change, 2009 vs. 2008Northeast 0.9% 8.6% 0.9% ‐5.6% 4.9%Mid-Atlantic 6.1% 7.6% 6.1% 7.7% 7.2%Southeast 3.1% 10.3% 3.1% 3.4% 7.6%Midwest 1.0% 11.5% 1.0% 0.6% 7.3%Southwest ‐1.6% 5.8% ‐1.6% ‐2.2% 2.9%Mountain Plains 2.1% 10.6% 2.1% 8.6% 8.0%Western 0.4% 10.7% 0.4% 2.9% 6.9%
Total 1.5% 9.4% 1.5% 2.0% 6.4%Source: 2009 CPS-ASEC, 2008 ACS, 2008 PRCS, Census International Data Base
Table 15: WIC Eligibles by FNS Region and Participant Group, CY 2008 and CY 2009
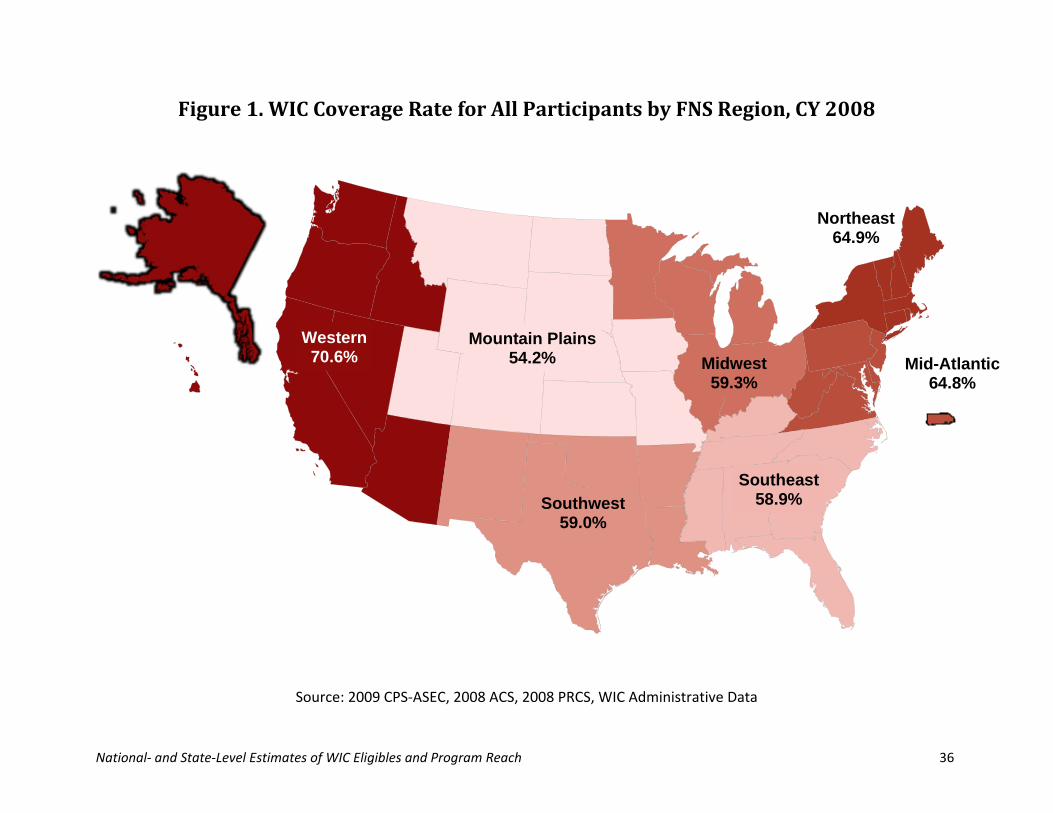
National‐ and State‐Level Estimates of WIC Eligibles and Program Reach 36
Figure 1. WIC Coverage Rate for All Participants by FNS Region, CY 2008
Source: 2009 CPS‐ASEC, 2008 ACS, 2008 PRCS, WIC Administrative Data
Midwest59.3%
Southwest59.0%
Southeast58.9%
Western70.6%
Mountain Plains54.2% Mid-Atlantic
64.8%
Northeast64.9%

National‐ and State‐Level Estimates of WIC Eligibles and Program Reach 37
Figure 2. WIC Coverage Rate for All Participants by FNS Region, CY 2009
Source: 2010 CPS‐ASEC, 2009 ACS, 2009 PRCS, WIC Administrative Data
Western68.2%
Mountain Plains52.8%
Southwest61.2%
Midwest57.3%
Southeast57.0%
Northeast63.7%
Mid-Atlantic62.6%

National‐ and State‐Level Estimates of WIC Eligibles and Program Reach 38
InfantsChildren
(age 1 to 4)Pregnant Women
All Postpartum Women Total
EligiblesNortheast 216,092 730,540 111,182 133,389 1,191,203Mid-Atlantic 279,144 972,366 143,623 155,217 1,550,350Southeast 547,598 1,816,805 281,745 309,117 2,955,264Midwest 403,335 1,280,498 207,520 231,846 2,123,199Southwest 433,386 1,422,837 222,982 243,474 2,322,679Mountain Plains 201,425 640,013 103,635 118,605 1,063,678Western 552,839 1,794,057 284,441 333,668 2,965,005
Total 2,633,819 8,657,117 1,355,127 1,525,315 14,171,378
ParticipantsNortheast 192,506 388,129 79,760 112,843 773,238Mid-Atlantic 246,883 520,595 101,537 135,992 1,005,008Southeast 465,717 839,725 185,829 250,839 1,742,111Midwest 336,391 621,196 136,656 164,293 1,258,537Southwest 352,223 679,316 150,632 189,299 1,371,470Mountain Plains 146,972 286,582 57,795 85,309 576,659Western 487,366 1,092,945 214,708 297,088 2,092,107
Total 2,228,058 4,428,489 926,919 1,235,664 8,819,130
Coverage RatesNortheast 89.1% 53.1% 71.7% 84.6% 64.9%Mid-Atlantic 88.4% 53.5% 70.7% 87.6% 64.8%Southeast 85.0% 46.2% 66.0% 81.1% 58.9%Midwest 83.4% 48.5% 65.9% 70.9% 59.3%Southwest 81.3% 47.7% 67.6% 77.7% 59.0%Mountain Plains 73.0% 44.8% 55.8% 71.9% 54.2%Western 88.2% 60.9% 75.5% 89.0% 70.6%Total 84.6% 51.2% 68.4% 81.0% 62.2%
Source: 2009 CPS-ASEC, 2008 ACS, 2008 PRCS, Census International Data Base, WIC Administrative Data
Table 16: WIC Eligibles and Coverage Rates by FNS Region and Participant Group, CY 2008

National‐ and State‐Level Estimates of WIC Eligibles and Program Reach 39
InfantsChildren
(age 1 to 4)Pregnant Women
All Postpartum Women Total
EligiblesNortheast 218,049 793,064 112,188 125,924 1,249,226Mid-Atlantic 296,202 1,045,813 152,399 167,224 1,661,638Southeast 564,646 2,003,637 290,516 319,646 3,178,445Midwest 407,540 1,427,199 209,684 233,124 2,277,547Southwest 426,602 1,505,367 219,491 238,130 2,389,590Mountain Plains 205,712 707,976 105,841 128,770 1,148,300Western 554,933 1,986,162 285,519 343,234 3,169,847
Total 2,673,683 9,469,217 1,375,638 1,556,053 15,074,591
ParticipantsNortheast 188,229 416,516 79,796 111,521 796,063Mid-Atlantic 246,282 556,006 103,551 134,836 1,040,674Southeast 460,468 917,303 187,953 247,303 1,813,027Midwest 329,250 673,806 140,752 162,031 1,305,839Southwest 363,530 739,239 157,684 202,312 1,462,765Mountain Plains 152,127 307,926 61,765 83,930 605,749Western 477,672 1,178,197 211,914 293,747 2,161,530
Total 2,217,557 4,788,994 943,415 1,235,679 9,185,646
Coverage RatesNortheast 86.3% 52.5% 71.1% 88.6% 63.7%Mid-Atlantic 83.1% 53.2% 67.9% 80.6% 62.6%Southeast 81.5% 45.8% 64.7% 77.4% 57.0%Midwest 80.8% 47.2% 67.1% 69.5% 57.3%Southwest 85.2% 49.1% 71.8% 85.0% 61.2%Mountain Plains 74.0% 43.5% 58.4% 65.2% 52.8%Western 86.1% 59.3% 74.2% 85.6% 68.2%Total 82.9% 50.6% 68.6% 79.4% 60.9%
Source: 2010 CPS-ASEC, 2009 ACS, 2009 PRCS, Census International Data Base, WIC Administrative Data
Table 17: WIC Eligibles and Coverage Rates by FNS Region and Participant Group, CY 2009

National‐ and State‐Level Estimates of WIC Eligibles and Program Reach 40
Figure 3. WIC Coverage Rate for Infants by FNS Region, CY 2009
Source: 2010 CPS‐ASEC, 2009 ACS, 2009 PRCS, WIC Administrative Data
Midwest80.7%
Southwest85.2%
Southeast81.5%
Western86.0%
Mountain Plains74.0% Mid-Atlantic
83.1%
Northeast86.3%
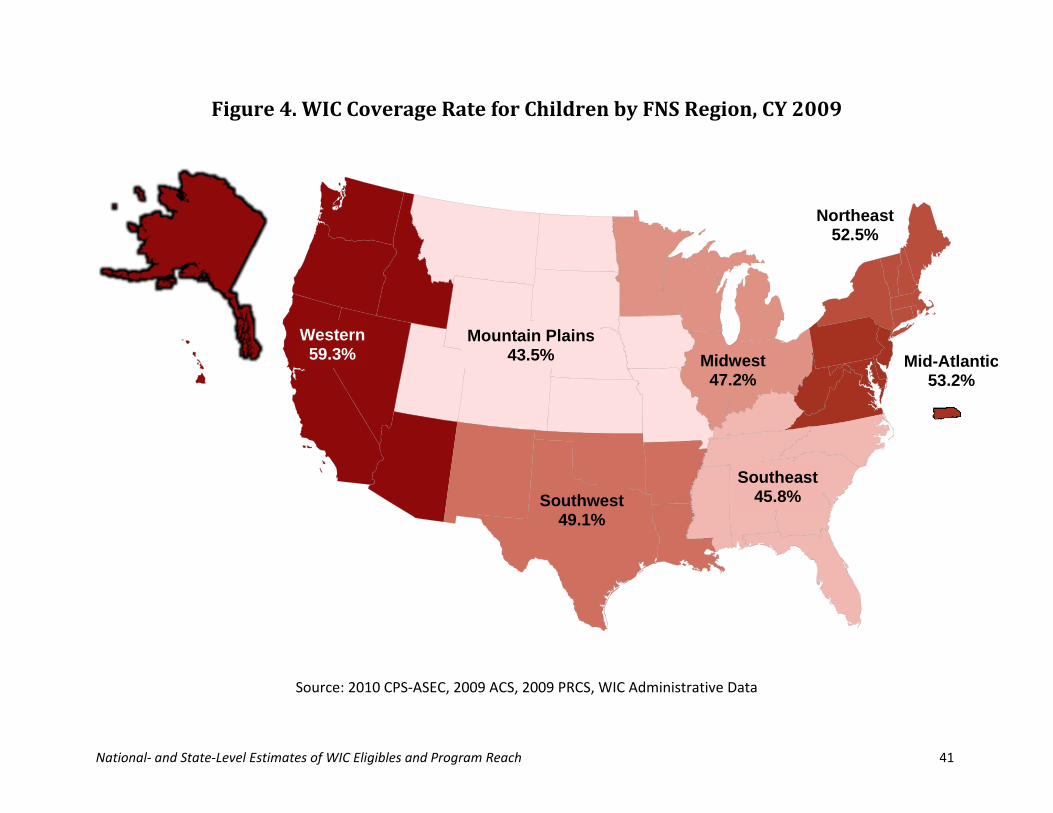
National‐ and State‐Level Estimates of WIC Eligibles and Program Reach 41
Figure 4. WIC Coverage Rate for Children by FNS Region, CY 2009
Source: 2010 CPS‐ASEC, 2009 ACS, 2009 PRCS, WIC Administrative Data
Midwest47.2%
Southwest49.1%
Southeast45.8%
Western59.3%
Mountain Plains43.5% Mid-Atlantic
53.2%
Northeast52.5%

National‐ and State‐Level Estimates of WIC Eligibles and Program Reach 42
Figure 5. WIC Coverage Rate for Pregnant Women by FNS Region, CY 2009
Source: 2010 CPS‐ASEC, 2009 ACS, 2009 PRCS, WIC Administrative Data
Western74.2%
Mountain Plains58.4%
Southwest71.8%
Midwest67.1%
Southeast64.7%
Northeast71.1%
Mid-Atlantic67.9%
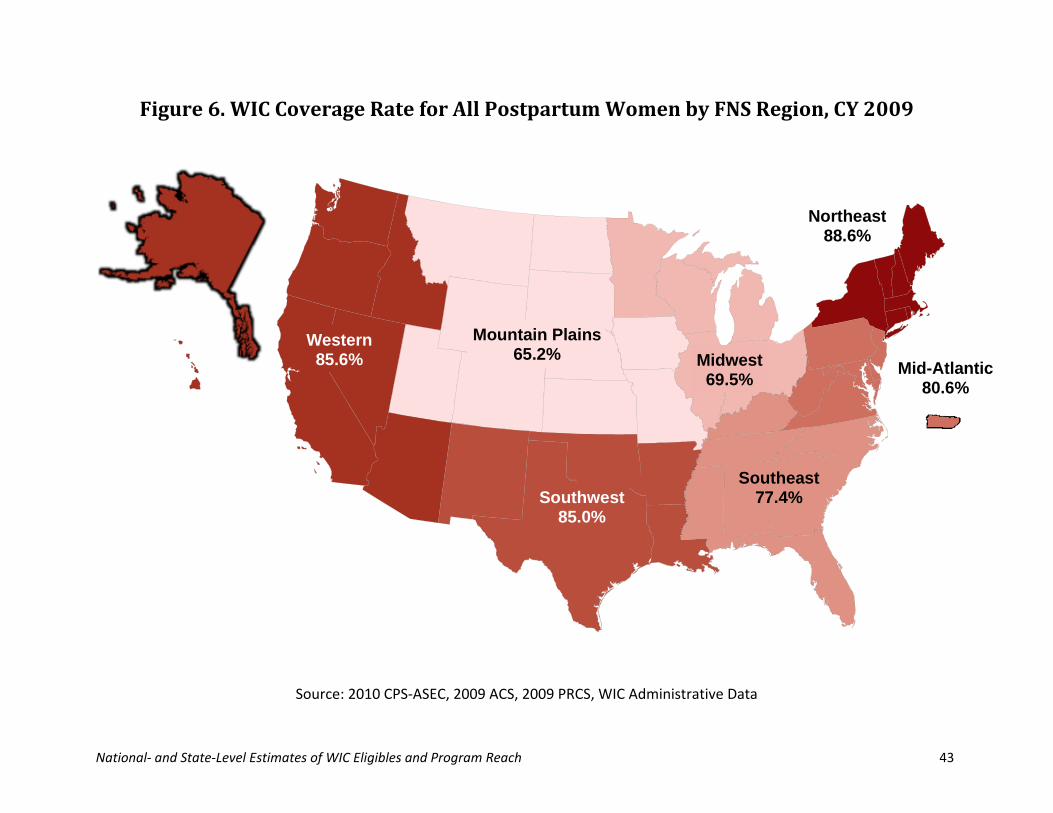
National‐ and State‐Level Estimates of WIC Eligibles and Program Reach 43
Figure 6. WIC Coverage Rate for All Postpartum Women by FNS Region, CY 2009
Source: 2010 CPS‐ASEC, 2009 ACS, 2009 PRCS, WIC Administrative Data
Northeast88.6%
Western85.6%
Southwest85.0%
Mountain Plains65.2% Midwest
69.5%Mid-Atlantic
80.6%
Southeast77.4%

National‐ and State‐Level Estimates of WIC Eligibles and Program Reach 44
State coverage rate estimates show substantial variation (Table 18 and Figure 7 for 2008, and Table 19 and Figure 8 for 2009). In 2008, the State coverage rates range from 46 percent in Utah to 81 percent in Minnesota. In 2009, the range is from 46 percent in Montana to 79 percent in Puerto Rico. Focusing on the four States with the largest numbers of WIC eligibles, California’s coverage rate is well above the national average in both years (77 percent in 2008 and 74 percent in 2009, compared to the national averages of 62 percent and 61 percent); the coverage rates in Texas and Florida are close to the national average; and the coverage rate in New York is slightly above the national average (66 percent in 2008 and 65 percent in 2009). The State maps (Figures 8 and 9) show a contiguous area of low WIC participation rates from Montana in the north through Idaho to Utah, Colorado, New Mexico, and Arizona. The high overall rate in the Western region is due to high rates in the States on the west coast, with Idaho and Nevada having lower than average coverage rates. The Northeast also shows a mix of States with higher than average rates (Vermont, New York, and Massachusetts) and States with lower than average rates (Maine and Connecticut). (Maps of coverage rates for all years back to 2000 are shown in Appendix H.)

National‐ and State‐Level Estimates of WIC Eligibles and Program Reach 45
Eligibles ParticipantsCoverage
RateEligibles Participants
Coverage Rate
StateAlabama 228,701 136,766 59.8% New York 766,852 503,708 65.7%Alaska 35,332 25,232 71.4% North Carolina 465,366 266,001 57.2%Arizona 385,799 200,710 52.0% North Dakota 24,976 14,888 59.6%Arkansas 173,586 90,981 52.4% Ohio 465,263 295,947 63.6%California 1,850,739 1,417,767 76.6% Oklahoma 205,320 124,421 60.6%Colorado 207,630 101,213 48.7% Oregon 166,021 109,638 66.0%Connecticut 101,592 57,269 56.4% Pennsylvania 445,205 254,131 57.1%Delaware 34,058 22,719 66.7% Puerto Rico 248,499 199,478 80.3%D.C. 23,929 16,798 70.2% Rhode Island 32,172 26,006 80.8%Florida 786,020 475,794 60.5% South Carolina 221,137 130,295 58.9%Georgia 542,517 313,300 57.7% South Dakota 37,162 22,743 61.2%Hawaii 47,300 34,744 73.5% Tennessee 318,208 171,396 53.9%Idaho 85,501 43,120 50.4% Texas 1,545,998 943,421 61.0%Illinois 571,071 299,045 52.4% Utah 147,837 67,697 45.8%Indiana 293,784 159,704 54.4% Vermont 20,972 16,955 80.8%Iowa 112,653 73,094 64.9% Virginia 253,242 153,642 60.7%Kansas 120,500 74,060 61.5% Washington 263,060 180,733 68.7%Kentucky 213,495 137,913 64.6% West Virginia 76,953 52,371 68.1%Louisiana 265,721 143,613 54.0% Wisconsin 200,544 123,140 61.4%Maine 46,949 26,025 55.4% Wyoming 22,168 12,715 57.4%Maryland 185,883 138,685 74.6%
Massachusetts 189,030 125,268 66.3% FNS Regiona
Michigan 417,369 238,166 57.1% Northeast 1,191,203 773,239 64.9%Minnesota 175,168 142,534 81.4% Mid-Atlantic 1,550,350 1,005,008 64.8%Mississippi 179,821 110,647 61.5% Southeast 2,955,264 1,742,111 58.9%Missouri 271,487 145,323 53.5% Midwest 2,123,199 1,258,537 59.3%Montana 39,833 20,105 50.5% Southwest 2,322,679 1,371,470 59.0%Nebraska 79,433 44,822 56.4% Mountain Plains 1,063,678 576,659 54.2%Nevada 114,107 63,067 55.3% Western 2,965,005 2,092,107 70.6%New Hampshire 33,635 18,008 53.5%New Jersey 269,266 161,684 60.0% Total 14,171,378 8,819,130 62.2%New Mexico 132,054 69,034 52.3%Source: 2009 CPS-ASEC, 2008 ACS, 2008 PRCS, Census International Data Base, WIC Administrative Data
Notes:a
Table 18: WIC Eligibles and Coverage Rates by State and FNS Region, CY 2008
Estimates for the other island territories (territories other than Puerto Rico) are included in regional totals but not shown separately due to small sample constraints.

National‐ and State‐Level Estimates of WIC Eligibles and Program Reach 46
Figure 7. WIC Coverage Rate for All Participants by State, CY 2008
Source: 2009 CPS‐ASEC, 2008 ACS, 2008 PRCS, WIC Administrative Data
61.0%
76.6%
50.5%
52.3%52.0%
55.3
48.7%
57.4%
66.0%
45.8%
81.4%
50.4%
61.5%
56.4%
61.2%
59.6%
60.6%
53.5%
68.7%
57.7%
52.4%
64.9%
61.4%
52.4%
59.8%
57.2%
61.5%
65.7
54.0%
57.1%
53.9%
57.1%
63.6%
64.6%60.7%
58.9%
60.5%
54.4%
55.4%
68.1%
WIC Coverage Rate,All Participants
45.8% - 52.4%
52.5% - 57.7%
57.8% - 63.6%
63.7% - 71.4%
71.5% - 81.4%
VT: 80.8% NH: 53.5% MA: 66.3% RI: 80.8% CT: 56.4% NJ: 60.0% DE: 66.7% MD: 74.6% DC: 70.2%
73.5%
80.3%
71.4%

National‐ and State‐Level Estimates of WIC Eligibles and Program Reach 47
Eligibles ParticipantsCoverage
RateEligibles Participants
Coverage Rate
StateAlabama 242,073 142,032 58.7% New York 802,166 519,245 64.7%Alaska 43,655 26,263 60.2% North Carolina 496,195 275,104 55.4%Arizona 399,065 210,149 52.7% North Dakota 24,164 14,561 60.3%Arkansas 171,518 95,535 55.7% Ohio 503,679 304,666 60.5%California 1,958,304 1,443,369 73.7% Oklahoma 211,057 131,974 62.5%Colorado 225,507 109,430 48.5% Oregon 175,123 114,016 65.1%Connecticut 103,954 60,255 58.0% Pennsylvania 461,912 262,250 56.8%Delaware 39,702 24,302 61.2% Puerto Rico 251,200 197,627 78.7%D.C. 22,937 17,479 76.2% Rhode Island 40,460 25,515 63.1%Florida 887,895 513,390 57.8% South Carolina 237,687 134,697 56.7%Georgia 570,651 320,910 56.2% South Dakota 42,606 22,908 53.8%Hawaii 55,526 36,696 66.1% Tennessee 325,065 174,555 53.7%Idaho 92,381 46,831 50.7% Texas 1,615,861 1,014,666 62.8%Illinois 612,800 311,063 50.8% Utah 156,235 73,827 47.3%Indiana 316,309 172,706 54.6% Vermont 22,841 17,436 76.3%Iowa 125,527 76,247 60.7% Virginia 284,171 161,503 56.8%Kansas 128,008 77,654 60.7% Washington 299,950 195,804 65.3%Kentucky 220,553 142,249 64.5% West Virginia 82,845 53,047 64.0%Louisiana 258,907 151,678 58.6% Wisconsin 214,103 128,737 60.1%Maine 51,620 26,851 52.0% Wyoming 26,166 13,639 52.1%Maryland 210,180 148,143 70.5%
Massachusetts 197,147 128,314 65.1% FNS Regiona
Michigan 439,128 247,942 56.5% Northeast 1,249,226 796,063 63.7%Minnesota 191,528 140,725 73.5% Mid-Atlantic 1,661,638 1,040,674 62.6%Mississippi 198,326 110,091 55.5% Southeast 3,178,445 1,813,027 57.0%Missouri 289,435 151,037 52.2% Midwest 2,277,547 1,305,839 57.3%Montana 45,204 20,746 45.9% Southwest 2,389,590 1,462,765 61.2%Nebraska 85,448 45,699 53.5% Mountain Plains 1,148,300 605,749 52.8%Nevada 128,810 69,432 53.9% Western 3,169,847 2,161,530 68.2%New Hampshire 31,037 18,447 59.4%New Jersey 295,254 170,424 57.7% Total 15,074,591 9,185,646 60.9%New Mexico 132,247 68,912 52.1%Source: 2010 CPS-ASEC, 2009 ACS, 2009 PRCS, Census International Data Base, WIC Administrative Data
Notes:a
Table 19: WIC Eligibles and Coverage Rates by State and FNS Region, CY 2009
Estimates for the other island territories (territories other than Puerto Rico) are included in regional totals but not shown separately due to small sample constraints.

National‐ and State‐Level Estimates of WIC Eligibles and Program Reach 48
Figure 8. WIC Coverage Rate for All Participants by State, CY 2009
Source: 2010 CPS‐ASEC, 2009 ACS, 2009 PRCS, WIC Administrative Data
62.8%
73.7%
45.9%
52.1%52.7%
53.9%
48.5%
52.1%
65.1%
47.3%
73.5%
50.7%
60.7%
53.5%
53.8%
60.3%
62.5%
52.2%
65.3%
56.2%
50.8%
60.7%
60.1%
55.7%
58.7%
55.4%
55.5%
64.7%
58.6%
56.8%
53.7%
56.5%
60.5%
64.5%56.8%
56.7%
57.8%
54.6%
52.0%
64.0%66.1%
78.7%
VT: 76.3% NH: 59.4% MA: 65.1% RI: 63.1% CT: 58.0% NJ: 57.7% DE: 61.2% MD: 70.5% DC: 76.2%
WIC Coverage Rate,All Participants
45.9% - 52.7%
52.8% - 56.8%
56.9% - 61.2%
61.3% - 66.1%
66.2% - 78.7%
60.2%

National‐ and State‐Level Estimates of WIC Eligibles and Program Reach 49
Standard Errors: 2008 and 2009.
For the first time, standard errors of estimates have been produced for the updated
national estimates, as well as for the new State and regional estimates.23 (The methods are described in detail in Appendix E.) The national‐level estimates are all derived from the CPS‐ASEC using the generalized variance estimates described in the annual P‐60 report entitled “Income, Poverty and Insurance Coverage in the United States.”24 The standard errors for the State‐level estimates were derived also using a generalized variance model described in the annual ACS report on the one year accuracy of the data.25 The standard errors for the first time provide a means to place a confidence interval around the estimates and highlight the estimates with the greatest level of uncertainty. The coefficients of variation for the 2008 and 2009 national eligibility estimates for infants and pregnant women are the highest at 4.5 percent. (See the Total rows in Tables 20 and 21, respectively.) While the coefficient of variation for postpartum women is slightly lower at 3.2 percent, the relative error for the estimate for all children drops to 2.5 percent, reflecting the larger sample size for this estimation group. The greatest precision of eligibility estimates is for the total of all WIC eligibles (1.9 percent).
At the State level, the precision of the estimates is generally lower than at the national level (see Tables 22 and 23). Given the large range of coefficient of variation (2.6 percent for Texas to 16.6 percent for the District of Columbia), caution should be exercised when using the State estimates, especially for smaller States. At the regional level, however, the relative precision of the estimates is quite high.
23 Our estimates of WIC eligibility in the other island territories are not based upon samples but Census Bureau estimates of the population by age and are not subject to sampling variability. While non‐sampling error can still be present in the other island estimates just as they are for the other jurisdictions, standard errors for the other island territories cannot be computed because of the non‐sample based methodology used in the estimation. 24 These reports can be found at http://www.census.gov/prod/www/abs/p60.html. 25 These reports can be found at http://www.census.gov/acs/www/data_documentation/documentation_main/.

National‐ and State‐Level Estimates of WIC Eligibles and Program Reach 50
InfantsChildren
(age 1 to 4)Pregnant Women
All Postpartum Women Total
EligiblesNortheast 216,092 730,540 111,182 133,389 1,191,203Mid-Atlantic 233,820 805,444 120,303 128,969 1,288,535Southeast 547,598 1,816,805 281,745 309,117 2,955,264Midwest 403,335 1,280,498 207,520 231,846 2,123,199Southwest 433,386 1,422,837 222,982 243,474 2,322,679Mountain Plains 201,425 640,013 103,635 118,605 1,063,678Western 549,722 1,783,436 282,838 331,863 2,947,859
Total 2,585,378 8,479,572 1,330,204 1,497,262 13,892,417
Standard ErrorNortheast 16,753 29,849 8,620 7,345 37,692Mid-Atlantic 17,624 31,824 9,067 7,249 39,682Southeast 31,826 56,671 16,375 13,177 71,418Midwest 25,482 43,784 13,111 10,561 55,950Southwest 26,821 47,248 13,800 11,001 59,704Mountain Plains 16,022 27,411 8,244 6,681 35,037Western 31,918 55,880 16,422 13,636 71,282
Total 116,343 208,554 59,860 48,265 264,397
Coefficient of VariationNortheast 7.8% 4.1% 7.8% 5.5% 3.2%Mid-Atlantic 7.5% 4.0% 7.5% 5.6% 3.1%Southeast 5.8% 3.1% 5.8% 4.3% 2.4%Midwest 6.3% 3.4% 6.3% 4.6% 2.6%Southwest 6.2% 3.3% 6.2% 4.5% 2.6%Mountain Plains 8.0% 4.3% 8.0% 5.6% 3.3%Western 5.8% 3.1% 5.8% 4.1% 2.4%Total 4.5% 2.5% 4.5% 3.2% 1.9%
Source: 2009 CPS-ASEC, 2008 ACS
Notes:a
Table 20: WIC Eligibles and Standard Errors by FNS Region and Participant Group, CY 2008a
Estimates for the territories, including Puerto Rico, are not included in regional totals or standard errors.

National‐ and State‐Level Estimates of WIC Eligibles and Program Reach 51
InfantsChildren
(age 1 to 4)Pregnant Women
All Postpartum Women Total
EligiblesNortheast 218,049 793,064 112,188 125,924 1,249,226Mid-Atlantic 249,081 879,964 128,155 139,801 1,397,001Southeast 564,646 2,003,637 290,516 319,646 3,178,445Midwest 407,540 1,427,199 209,684 233,124 2,277,547Southwest 426,602 1,505,367 219,491 238,130 2,389,590Mountain Plains 205,712 707,976 105,841 128,770 1,148,300Western 551,740 1,975,822 283,876 341,376 3,152,814
Total 2,623,370 9,293,030 1,349,751 1,526,771 14,792,922
Standard ErrorNortheast 16,683 31,044 8,584 6,887 38,509Mid-Atlantic 18,184 33,234 9,356 7,568 41,436Southeast 32,296 59,584 16,616 13,381 74,251Midwest 25,443 46,374 13,091 10,420 58,037Southwest 26,288 48,191 13,525 10,700 60,083Mountain Plains 16,075 28,855 8,271 7,122 36,473Western 31,740 58,955 16,331 13,913 73,796
Total 117,216 218,215 60,309 48,728 272,793
Coefficient of VariationNortheast 7.7% 3.9% 7.7% 5.5% 3.1%Mid-Atlantic 7.3% 3.8% 7.3% 5.4% 3.0%Southeast 5.7% 3.0% 5.7% 4.2% 2.3%Midwest 6.2% 3.2% 6.2% 4.5% 2.5%Southwest 6.2% 3.2% 6.2% 4.5% 2.5%Mountain Plains 7.8% 4.1% 7.8% 5.5% 3.2%Western 5.8% 3.0% 5.8% 4.1% 2.3%Total 4.5% 2.3% 4.5% 3.2% 1.8%
Source: 2010 CPS-ASEC, 2009 ACS
Notes:a
Table 21: WIC Eligibles Standard Errors by FNS Region and Participant Group, CY 2009a
Estimates for the territories, including Puerto Rico, are not included in regional totals or standard errors.
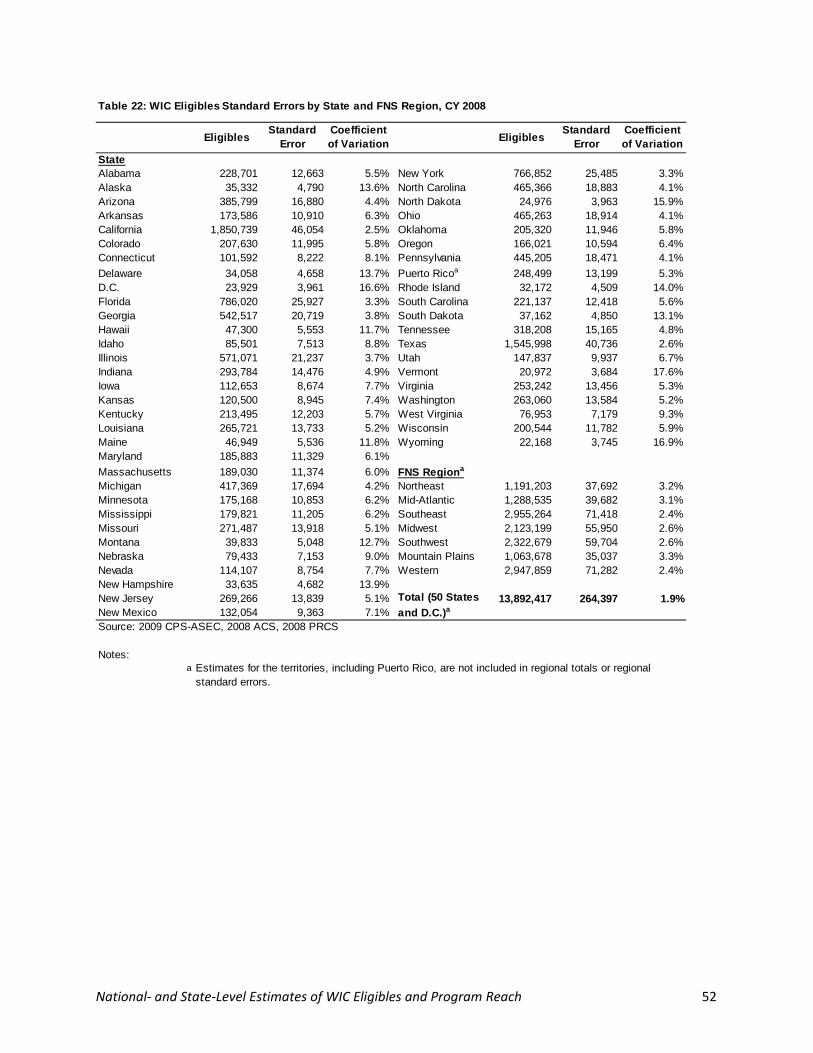
National‐ and State‐Level Estimates of WIC Eligibles and Program Reach 52
EligiblesStandard
ErrorCoefficient of Variation
EligiblesStandard
ErrorCoefficient of Variation
StateAlabama 228,701 12,663 5.5% New York 766,852 25,485 3.3%Alaska 35,332 4,790 13.6% North Carolina 465,366 18,883 4.1%Arizona 385,799 16,880 4.4% North Dakota 24,976 3,963 15.9%Arkansas 173,586 10,910 6.3% Ohio 465,263 18,914 4.1%California 1,850,739 46,054 2.5% Oklahoma 205,320 11,946 5.8%Colorado 207,630 11,995 5.8% Oregon 166,021 10,594 6.4%Connecticut 101,592 8,222 8.1% Pennsylvania 445,205 18,471 4.1%
Delaware 34,058 4,658 13.7% Puerto Ricoa 248,499 13,199 5.3%D.C. 23,929 3,961 16.6% Rhode Island 32,172 4,509 14.0%Florida 786,020 25,927 3.3% South Carolina 221,137 12,418 5.6%Georgia 542,517 20,719 3.8% South Dakota 37,162 4,850 13.1%Hawaii 47,300 5,553 11.7% Tennessee 318,208 15,165 4.8%Idaho 85,501 7,513 8.8% Texas 1,545,998 40,736 2.6%Illinois 571,071 21,237 3.7% Utah 147,837 9,937 6.7%Indiana 293,784 14,476 4.9% Vermont 20,972 3,684 17.6%Iowa 112,653 8,674 7.7% Virginia 253,242 13,456 5.3%Kansas 120,500 8,945 7.4% Washington 263,060 13,584 5.2%Kentucky 213,495 12,203 5.7% West Virginia 76,953 7,179 9.3%Louisiana 265,721 13,733 5.2% Wisconsin 200,544 11,782 5.9%Maine 46,949 5,536 11.8% Wyoming 22,168 3,745 16.9%Maryland 185,883 11,329 6.1%
Massachusetts 189,030 11,374 6.0% FNS Regiona
Michigan 417,369 17,694 4.2% Northeast 1,191,203 37,692 3.2%Minnesota 175,168 10,853 6.2% Mid-Atlantic 1,288,535 39,682 3.1%Mississippi 179,821 11,205 6.2% Southeast 2,955,264 71,418 2.4%Missouri 271,487 13,918 5.1% Midwest 2,123,199 55,950 2.6%Montana 39,833 5,048 12.7% Southwest 2,322,679 59,704 2.6%Nebraska 79,433 7,153 9.0% Mountain Plains 1,063,678 35,037 3.3%Nevada 114,107 8,754 7.7% Western 2,947,859 71,282 2.4%New Hampshire 33,635 4,682 13.9%New Jersey 269,266 13,839 5.1% 13,892,417 264,397 1.9%New Mexico 132,054 9,363 7.1%Source: 2009 CPS-ASEC, 2008 ACS, 2008 PRCS
Notes:a
Table 22: WIC Eligibles Standard Errors by State and FNS Region, CY 2008
Total (50 States
and D.C.)a
Estimates for the territories, including Puerto Rico, are not included in regional totals or regional standard errors.

National‐ and State‐Level Estimates of WIC Eligibles and Program Reach 53
EligiblesStandard
ErrorCoefficient of Variation
EligiblesStandard
ErrorCoefficient of Variation
StateAlabama 242,073 13,106 5.4% New York 802,166 26,145 3.3%Alaska 43,655 5,275 12.1% North Carolina 496,195 19,581 3.9%Arizona 399,065 17,241 4.3% North Dakota 24,164 3,953 16.4%Arkansas 171,518 10,848 6.3% Ohio 503,679 19,722 3.9%California 1,958,304 47,491 2.4% Oklahoma 211,057 12,066 5.7%Colorado 225,507 12,488 5.5% Oregon 175,123 10,931 6.2%Connecticut 103,954 8,336 8.0% Pennsylvania 461,912 18,826 4.1%
Delaware 39,702 5,091 12.8% Puerto Ricoa 251,200 13,274 5.3%D.C. 22,937 3,899 17.0% Rhode Island 40,460 5,112 12.6%Florida 887,895 27,815 3.1% South Carolina 237,687 12,949 5.4%Georgia 570,651 21,265 3.7% South Dakota 42,606 5,210 12.2%Hawaii 55,526 6,021 10.8% Tennessee 325,065 15,374 4.7%Idaho 92,381 7,812 8.5% Texas 1,615,861 41,594 2.6%Illinois 612,800 22,086 3.6% Utah 156,235 10,264 6.6%Indiana 316,309 15,103 4.8% Vermont 22,841 3,838 16.8%Iowa 125,527 9,176 7.3% Virginia 284,171 14,196 5.0%Kansas 128,008 9,271 7.2% Washington 299,950 14,629 4.9%Kentucky 220,553 12,406 5.6% West Virginia 82,845 7,425 9.0%Louisiana 258,907 13,570 5.2% Wisconsin 214,103 12,154 5.7%Maine 51,620 5,795 11.2% Wyoming 26,166 4,113 15.7%Maryland 210,180 12,106 5.8%
Massachusetts 197,147 11,678 5.9% FNS Regiona
Michigan 439,128 18,292 4.2% Northeast 1,249,226 38,509 3.1%Minnesota 191,528 11,453 6.0% Mid-Atlantic 1,397,001 41,436 3.0%Mississippi 198,326 11,699 5.9% Southeast 3,178,445 74,251 2.3%Missouri 289,435 14,382 5.0% Midwest 2,277,547 58,037 2.5%Montana 45,204 5,406 12.0% Southwest 2,389,590 60,083 2.5%Nebraska 85,448 7,462 8.7% Mountain Plains 1,148,300 36,473 3.2%Nevada 128,810 9,307 7.2% Western 3,152,814 73,796 2.3%New Hampshire 31,037 4,533 14.6%New Jersey 295,254 14,524 4.9% 14,792,922 272,793 1.8%New Mexico 132,247 9,433 7.1%Source: 2010 CPS-ASEC, 2009 ACS, 2009 PRCS
Notes:a
Table 23: WIC Eligibles Standard Errors by State and FNS Region, CY 2009
Total (50 States
and D.C.)a
Estimates for the territories, including Puerto Rico, are not included in regional totals or regional standard errors.

National‐ and State‐Level Estimates of WIC Eligibles and Program Reach 54
Validating the Results.
While we would like to know the accuracy of our estimates, this cannot be known with
certainty since it is impossible to observe eligibility. However, it is important that the estimates are reasonable. At a minimum, we would like our estimates have some face validity. One comparison that may produce confidence in the eligibility estimates is to examine whether the FNS participation estimates ever exceed the eligibility estimates by State or region. While it is quite possible that some ineligible individuals do participate, there also are eligible individuals who fail to enroll in the program or who have been inappropriately denied benefits. Thus, occurrences where the number of participants exceeds the estimated count of eligibles lead to concerns about the estimation methods.
Both the FNS estimates of participation and the estimates of eligibility are likely to be subject to measurement error and potential bias. However, the eligibility estimate is based upon a sample and hence is subject to sampling variability, while the FNS participation estimates are not subject to sampling variability. Consequently, even if the participation estimate exceeds the eligibility estimate, we cannot conclude there is something fundamentally wrong with the methodology because of the potential effect of sampling variability. A different sample could lead to a different conclusion about the relationship between participation and eligibility. At the level of detail shown in this report, there are no cases where estimated eligibility falls short of FNS participation figures. However, State‐level estimates for postpartum breastfeeding women are in some cases smaller than FNS estimates of postpartum breastfeeding women receiving WIC benefits. The analysis raises questions about assumptions and estimates used to implement the current methodology to allocate postpartum mothers to the breastfeeding and non‐breastfeeding categories (discussed further in Appendix F).
Regional and State Estimates: 2000 through 2007.
The regional and State estimates for 2000 through 2007 flow from the earlier annual
estimates using shares estimated from ACS data.26 State shares calculated from the ACS are applied to the CPS‐ASEC estimates, and new methods are used for estimating eligibility in Puerto Rico and territories. While the estimates generally followed the methodology created for use in 2008 and 2009, the lack of data in the ACS on participation in Medicaid prior to 2008 required a new adjustment. The ACS is first used to estimate annual income eligibility and adjunctive eligibility based upon participation in SNAP and TANF. In order to capture adjunctive eligibility due to Medicaid, we assume that the additional number of eligible infants and children is a constant proportion of the number enrolled in Medicaid relative to the estimated
26 Estimates by single year of age were not previously published for the national WIC eligibility estimates based on the CPS‐ASEC data. In order to obtain estimates of the total number of children by single year of age, the national estimates for total for children (age 1 to 4 combined) were distributed by single year of age based on ACS tabulations of the population by age for each calendar year.
National‐ and State‐Level Estimates of WIC Eligibles and Program Reach 55
number of infants and children eligible on the basis of income or participation in TANF and SNAP. Using the ACS data from 2008 and 2009, we developed an estimate of the State‐specific constant proportional adjustment that accounts for the lack of Medicaid data on the ACS in the years 2000 through 2007. Appendix D.1 further explains this adjuster and presents the details of the time series of State estimates.
The State‐ and regional‐level eligibility estimates back to 2000 allow analysis of coverage rates at a sub‐national level over that time period. Considering all WIC subgroups together (Figure 9), the coverage rates in the Western region have been consistently higher than in any other region across the entire period from 2000 to 2009, while the coverage rates in the Mountain Plains have been consistently lower than in other regions. Coverage rates have risen slightly since the middle part of the decade in some regions. The regional‐level coverage rates for infants across the decade (Figure 10) show a spike in the rate in 2002; this is due to a drop in the national‐level infant eligibility estimate for that year (2.2 million for 2002, relative to 2.5 million in both 2001 and 2003). The infant coverage rate estimates show a slight upward trend from the middle to the end of the decade, with a particularly marked increase for the Southwest. The Mountain Plains region has the lowest coverage rate for infants in all of the years in the series. The Western region stands out for children, with higher coverage rates than any other region in all years of the decade (Figure 11). Coverage rates for pregnant women show the impact of the low infant eligibility estimate in 2002 (figure 12). There is also some indication that coverage rates for pregnant women in the Northeast were higher in the earlier part of the decade than currently. Coverage rates for postpartum women show an increasing trend in most regions (Figure 13).

National‐ and State‐Level Estimates of WIC Eligibles and Program Reach 56
Figure 9. All Participants Coverage Rate by FNS Region, 2000–2009
Source: CPS‐ASEC, ACS, PRCS, Census International Data Base, WIC Administrative Data
30%
40%
50%
60%
70%
80%
90%
100%
2000 2001 2002 2003 2004 2005 2006 2007 2008 2009
Coverage Rate
Northeast
Mid‐Atlantic
Southeast
Midwest
Southwest
Mountain Plains
Western
U.S.

National‐ and State‐Level Estimates of WIC Eligibles and Program Reach 57
Figure 10. Infants Coverage Rate by FNS Region, 2000–2009
Source: CPS‐ASEC, ACS, PRCS, Census International Data Base, WIC Administrative Data
30%
40%
50%
60%
70%
80%
90%
100%
2000 2001 2002 2003 2004 2005 2006 2007 2008 2009
Coverage Rate
Northeast
Mid‐Atlantic
Southeast
Midwest
Southwest
Mountain Plains
Western
U.S.
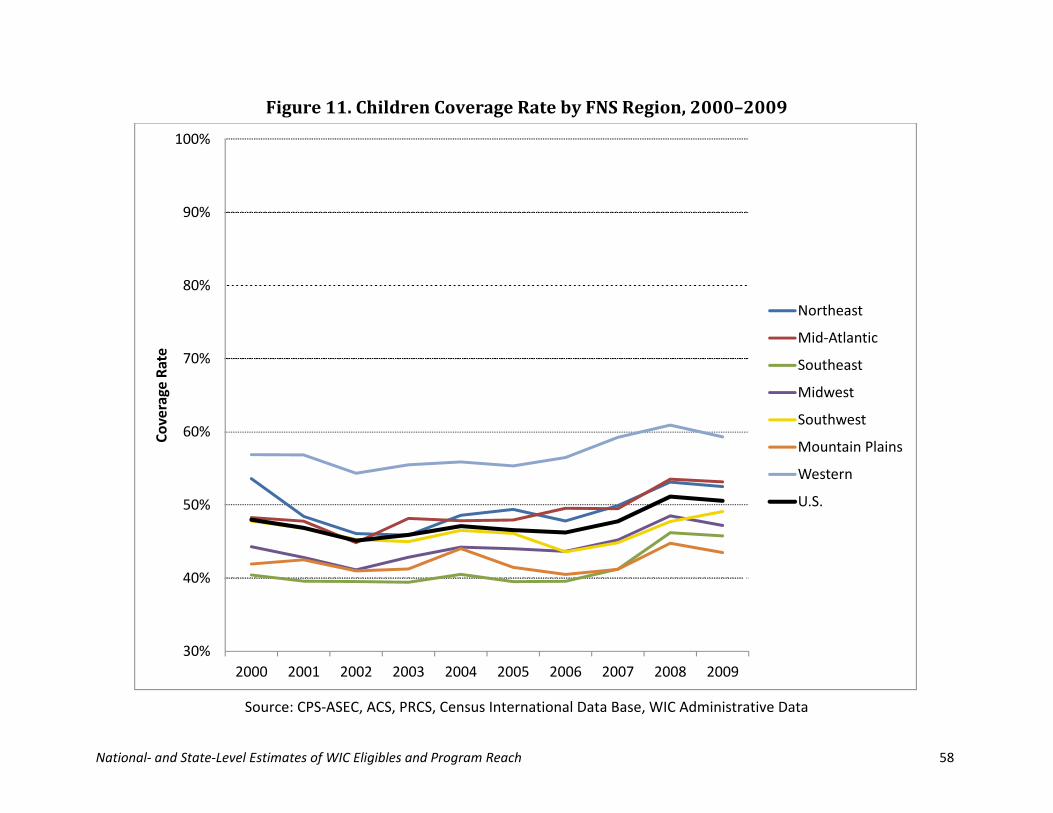
National‐ and State‐Level Estimates of WIC Eligibles and Program Reach 58
Figure 11. Children Coverage Rate by FNS Region, 2000–2009
Source: CPS‐ASEC, ACS, PRCS, Census International Data Base, WIC Administrative Data
30%
40%
50%
60%
70%
80%
90%
100%
2000 2001 2002 2003 2004 2005 2006 2007 2008 2009
Coverage Rate
Northeast
Mid‐Atlantic
Southeast
Midwest
Southwest
Mountain Plains
Western
U.S.

National‐ and State‐Level Estimates of WIC Eligibles and Program Reach 59
Figure 12. Pregnant Women Coverage Rate by FNS Region, 2000–2009
Source: CPS‐ASEC, ACS, PRCS, Census International Data Base, WIC Administrative Data
30%
40%
50%
60%
70%
80%
90%
100%
2000 2001 2002 2003 2004 2005 2006 2007 2008 2009
Coverage Rate
Northeast
Mid‐Atlantic
Southeast
Midwest
Southwest
Mountain Plains
Western
U.S.

National‐ and State‐Level Estimates of WIC Eligibles and Program Reach 60
Figure 13. Postpartum Women Coverage Rate by FNS Region, 2000–2009
Source: CPS‐ASEC, ACS, PRCS, Census International Data Base, WIC Administrative Data
30%
40%
50%
60%
70%
80%
90%
100%
2000 2001 2002 2003 2004 2005 2006 2007 2008 2009
Coverage Rate
Northeast
Mid‐Atlantic
Southeast
Midwest
Southwest
Mountain Plains
Western
U.S.

National‐ and State‐Level Estimates of WIC Eligibles and Program Reach 61
Summary and Recommendations
Under this contract, national estimates for WIC eligibility were updated for 2008 and completed for 2009 based on the 2009 and 2010 CPS‐ASEC data, respectively. The national estimates include eligibility for children by single years of age and use new, direct methods for estimating WIC eligibility in the territories. State‐level estimates for 2000 through 2009 also were produced. These estimates use the 2008 and 2009 ACS data that provide large samples for each State. For the first time, standard errors are provided for the national, State and Puerto Rico estimates. The standard errors show that some caution must be taken in using the State‐level estimates, especially for small States. Validation of the estimates that compares eligibility to actual participation also raises questions about the stability of the breastfeeding rates derived from Ross Laboratories. The analyses lead us to suggest several avenues for further refinement:
The annual‐to‐monthly adjustments based on SIPP data through 2006 suggest significant changes in either intra‐year income volatility, adjunctive eligibility, or both. We recommend re‐estimation of these adjusters based on calendar year 2009 from the SIPP 2008 panel and regular, future re‐estimation to account for economic and program policy changes. The estimation should detail each aspect of the analysis so that the effect of income volatility can be separated from that of adjunctive eligibility through TANF, SNAP, and Medicaid.
Basic breastfeeding rate data and subsequent adjustments developed from the NHANES and SIPP require further investigation. Trade‐offs between using the RLMS and the NIS data should be considered. The best data for estimating national and State‐level breastfeeding rates should be adopted for future estimates. Adjustments for postpartum mothers’ income and adjunctive eligibility and breastfeeding cessation should be re‐estimated using the latest SIPP data.
Other recommendations pertain to improving the estimates of WIC eligibility in Puerto Rico and island territories. Lacking other data, these estimates applied national adjusters for annual‐to‐monthly income and breastfeeding rates to Puerto‐Rico and the island territories. Puerto Rico might have more specific data that could be used.
WIC eligibility estimates for the other island territories rely on the 2000 Census data for income and adjunctive eligibility. These estimates could be updated using Census 2010 data expected to be released for these territories in 2013.
We provide numerous appendices for readers seeking details on the various new procedures and analyses completed. All computer code and spread sheets producing the estimates are provided to FNS.

National‐ and State‐Level Estimates of WIC Eligibles and Program Reach 62
References
Harper, E., J. Hirschman, J. Mabli, S. Nelson, and K. Hourihan. 2009. WIC Eligibles and Coverage – 1994 to 2007: Estimates of the Population of Women, Infants, and Children Eligible for WIC Benefits. Alexandria, VA: USDA Food and Nutrition Service. Kaiser Commission on Medicaid and the Uninsured. 2009. http://www.statehealthfacts.org/comparecat.jsp?cat=4&rgn=6&rgn=1. Ruggles, Steven, J. Trent Alexander, Katie Genadek, Ronald Goeken, Matthew B. Schroeder, and Matthew Sobek. 2010. Integrated Public Use Microdata Series: Version 5.0 [Machine‐readable database]. Minneapolis: University of Minnesota. U.S. Census Bureau. 2010. The American Community Survey. http://www.census.gov/acs/www/data_documentation. (Accessed August 1, 2011). U.S. Census Bureau. 2010. “Income, Poverty and Insurance Coverage in the United States.” Annual P‐60 Reports. http://www.census.gov/prod/www/abs/p60.html. (Accessed August 1, 2011). Ver Ploeg, Michele and David M. Betson (Eds.). 2003. Estimating Eligibility and Participation for the WIC Program: Final Report. Washington, D.C.: The National Academies Press..
Wheaton, Laura. 2007. “Underreporting of Means‐Tested Transfer Programs in the CPS and SIPP” 2007 Proceedings of the American Statistical Association, Social Statistics Section [CD‐ROM]. Alexandria, VA: American Statistical Association: 3622‐3629.
Wolkwitz, Kari and Carole Trippe. 2009. Characteristics of Supplemental Nutrition Assistance Program Households: Fiscal Year 2008. Alexandria, VA: USDA Food and Nutrition Service.
Yelowitz, Aaron. 2002. “Income Variability and WIC Eligibility: Evidence from the SIPP.” http://gatton.uky.edu/faculty/yelowitz/Yelowitz‐WIC.pdf (Accessed August 1, 2011).