Embed Size (px)
Citation preview
Papers and Proceedings of the Royal Society of Tasmania, Volume 134, 2000 1
NUTRIENT STOCKS IN TASMANIAN VEGETATION AND APPROXIMATE LOSSES DUE TO FIRE
by W.O. Jackson
(with seven tables and two text-figures)
JACKSON, W.D" 2000 (31 :xii): Nutrient stocks in Tasmanian vegetation and approximate losses due to fire. Pap. Proc. R. Soc, Tasm. 134: 1-18. ISSN 0080-4703. School of Plant Science, University of Tasmania, GPO Box 252-55, Hobart, Tasmania, Australia 7001.
Previously published data on the mass and concentration of major nutrients in Tasmanian vegetation types are presented in common units. The losses of nutrients in intensely hot wild-fires occurring once or twice a century are calculated and used to estimate losses in more frequent but less intense fires. Potential losses from consumed foliage and litter and from erosion and leaching of ash post-fire are estimated. Losses of phosphorus as a percentage ofthe mass ofthat element in the above-ground biomass and litter in rainforest or wet and dry eucalypt forest range from 75-85%; losses in scrub, heath and sedgeland range from 35-45%. Losses of 18% in potassium and 30% in calcium in sedgeland fires are particularly serious impediments to successional processes in western regions.
Data are provided on the input of nutrients into the precipitation and its attenuation with distance from the coast. In the absence of studies of nutrient balance in Tasmania, the available data from Vicroria have been analysed to provide some information which is probably applicable to eastern Tasmania. In addition, the study provides the input-output concentration difference for a number of Tasmanian watersheds and a table showing the outflow concentrations from a selection of catchments displaying a range of geology, precipitation input (P) and evaporation (E). In Tasmania, the large differences in PIE ratios between western and eastern catchments has a major nutritional effect. The input of sodium in the Yolande catchment in the west is 1270 ppm, but the difference in input-output concentration is only 0.55 ppm, whereas the Lisdillon catchment in the east has a sodium input of180 ppm, but a concentration difference of 20 ppm, indicating the effect of high evapotranspiration on the residence time and availability of nutrients. In precipitations of >2000 mm in western Tasmania, the large input of nutrients is balanced by equally large outflows from both rainforest and sedgeland. Thus, any additional mineralised nutrients following a fire will probably be lost by erosion, leaching or run-off. The data suggest that hot fire should not be used to regenerate cut-over forests in environments with high PIE ratios.
The relatively high predominance of disclimax fire-tolerant vegetation such as sedgeland and scrub in western Tasmania is due to the combination of a long period of Aboriginal burning during the Late Pleistocene and the low occurrence of clay-forming minerals in the geological exposures. In the eastern half, the topographical capping of dolerite has done much to supply an erosional mix of clay-forming minerals, so that the occupation of this region by Aborigines during the Holocene had a lower impact. Key Words: nutrients, loss, fire, vegetation, Tasmania.
INTRODUCTION
The long period (~34 000 yrs) of occupation of Tasmania by humans has been well documented by Cosgrove (1995: fig. 16) . Jackson (1999d) suggested that the period of occupation was likely to have been much longer, because of probable underestimation of age by the C14 dating methodology in Tasmanian conditions (Colhoun 1986). The palaeohistory of the vegetation derived from the Darwin impact crater indicates an anomalous change in the proportions of forest and open vegetation commencing approximately 70000 years ago Oackson 1999d).
The Aborigines used fire extensively, not merely for cooking and warmth but in communication, as a weapon, in hunting and, most importantly, as a management practice to increase herbivore production. The systematic patchburning of vegetation to create "greenpick" grazing was extensively used. As a consequence of this widespread use, and of the fact that fire was transported from place to place by smouldering firesticks (Ling Roth 1899), many accidental wild-fires were started. Every summer it would be inevitable that fires were already burning when extreme fire-hazard weather occurred, leading to extensive, hot, intense wildfires (Marsden-Smedley 1998). The limited occurrence of lightning-induced fires in Tasmania has been previously noted Oackson & Bowman 1982, Ingles 1985, Jackson 1999d). Thus, the presence of humans using fire intensively
would have caused a massive increase in the frequency of wild-fire due to accidental fires in extreme fire-hazard conditions a ackson 1999d). Jackson advanced the argument, based on the results of an analysis of palaeovegetation history in the core of the Darwin Crater (Colhoun & van de Geer 1998), that the present large proportion of disclimax vegetation developed over the Last Glacial Cycle as a result of fire associated with the presence of man a ackson 1999d).
In this recent article (l999d) Jackson revived an earlier thesis Oackson 1968) that fire, vegetation and soil are closely related via a series of feedback relationships. It was proposed that recurrent fire regimes interrupt the reproductive cycles of plants, causing sudden changes in the distribution of plant communities, if the interval between consecutive fires is either too short or too long -the "ecological drift" theory Oackson 1968, Noble & Slatyer 1981). Furthermore, recurrent fire encourages vegetation with lower nutrient requirements and greater reliance on vegetative reproduction or dependence on fire for regeneration. Fires cause a direct loss of nutrients by the removal of volatilised elements and particles in the updraft (Harwood & Jackson 1975, Bowman & Jackson 1981, Raison et al. 1985a, b, 1990, 1993, Walker et al. 1986, Fisher & Binkley 2000). Further losses of mineralised nutrients in the ash residue occur through gravitational movement due to wind and water and in solution both in run-off and down the soil profile by leaching (Bowman &
2 WD. Jackson
Jackson 1981, Bowman et al. 1986, Raison et al. 1993). Such losses relative to gains, from the input in precipitation and from the weathering of the geological parent materials, in time can reduce the availability of nutrients in the soil pool to the extent that vegetation types with a high nutrient demand become restricted. This present paper draws together the available data on nutrient limitation to vegetation in Tasmania and the impacts of fire on it.
FIRE AND NUTRIENT LOSS
Fire in natural vegetation is a major disruptive factor, changing the above-ground pools of organically complexed nutrients into a volatile or an inorganic mineralised state. Combustion accomplishes in a few minutes the process of nutrient transformation which would normally take five to ten years and, in some cases, much longer by biological decomposition. The loss of nutrient capital due to fire is difficult to estimate. Fire intensity affects nutrient transformations (Raison et al. 1993, Fisher & Binkley 2000). Hot, intense wild-fires, once they gain sufficient rate of spread, create fire-storm winds and strong convection updrafts which carry gases, burnt vegetation, ash and surface soil to high altitudes to be dispersed downwind, and, in Tasmania, often out to sea (McArthur 1968, Cheney 1981). The fire intensity (energy per metre of fire-front) is in the range 7000-70000 kw/m and flame heights are >15 m (Cheney 1981, Fisher & Binkley 2000). All the canopy foliage is consumed in such fires along with the understorey and litter. Slow, cool fires consume the litter and foliage up to a few metres leaving most nutrients as residual ash, although about 80% of the volatile elements Nand S are lost as gas with significant 40-60% non-particulate losses of P and K (Raison et al. 1985a, b). Fires which consume the forest duff or peat may burn slowly for long periods, causing massive mineralisation of the nutrient-rich pools of the surface organic soil. In such fires, some of the nutrients stay on the site as ash but are subject to erosion downslope and to leaching down the soil profile (Maclean 1979, Bowman & Jackson 1981, Bowman etal. 1986).
In most ecosystems, both soil and vegetation are the product of climate, geological influences and disturbances. In the absence of disturbance, the time required to achieve a climatic climax is controlled by geological characteristics such as the weathering rate and the mineral composition of the exposure. Palaeontological evidence from cores of the Darwin Crater in western Tasmania and from the Chatham Rise off the South Island of New Zealand shows that the vegetation has alternated between forest, largely rainforest, and open herbaceous communities with the cycles of glacial and interglacial climates during the Late Pleistocene Qackson 1999d). The climax in these ecosystems has been established during each alternation in approximately 2500 years. In these insular temperate climates, the incidence of natural lightning-induced fire is low, and the input of nutrients in the precipitation is high and dependable. In western Tasmania previous to the last glacial cycle, the alternation of forest-herbaceous vegetation occurred on geological exposures of highly siliceous Cambrian and Precambrian sediments, which are very slow weathering and have minimal clay-forming minerals. The present extent of disclimax vegetation in this area appears to be the combination of fire disturbance due to presence of humans during the Last Glacial Cycle and the low inherent fertility of many of the
geological exposures of the region. Although most regions of western Tasmania have suffered wild-fire at least once in the last two hundred years (Marsden-Smedley 1998), there are rare forests indicating very long periods of fire-free disturbance. In the Boyd River catchment, small patches of callidendrous rainforest occur on highly infertile Cambrian quartzwacke sediments where the P content of the parent material is undetectable (Harwood 1972, Jackson 1977). In such instances oflow disturbance, the biomass gradually increases its nutrient capital by accumulation of cyclic salt input in the precipitation. Adequate N is fixed by the large mass of micro-organisms in the epiphytes in the Tasmanian rainforest canopy (Parker 1982).
Fire causes a loss of nutrients from the site due (Raison et al. 1993, Fisher & Binkley 2000) to • volatilisation and particle loss in the up draught of the fire, • wind transport of the ash, • gravitational movement of the ash and charcoal downslope by run-off water, • solution in the run-off water and • leaching of dissolved ions down the soil profile. Even slow, cool fires which consume little more than the litter layer cause transformation of significant nutrients from complexed biological states to gases or mineral forms that can be solubilised. If the surface organic soil is sufficiently dry at the time of intense fire incidence, it can also be consumed. Such peat or duff fires cause mobilisation of a large proportion of the total nutrient capital of the site, rendering it susceptible to potential leaching and erosion. As Ellis & Graley (1987) have pointed out, the current vegetation sometimes produces greater changes to soil fertility than the previous fire history. However, the effect of erosion following fire on slopes is a major contribution to soil loss, lower fertility and vegetation change.
VEGETATION AND FIRE
Short descriptions of the vegetation in Tasmania are available Qackson 1965, 1981, 1999a) and detailed accounts of the important types are given in the Vegetation of Tasmania (Reid et al. 1999).
In other studies, the general environment Qackson 1999b, d), the fire environment (1981, 1999b: 34-36) and the distribution of vegetation (1999a: figs 1.1, 1.3) have been covered. The areas estimated at 1800 and at present with the average fuel loads and fire-free intervals are shown in table 1. The following notes on the principal vegetation types supply a brief outline sufficient for an understanding of the influence of recurrent fire on these communities in the past and present.
Alpine and montane vegetation Falling embers from hot wild-fires in lowland forests have probably always been a cause of spot-fires in montane regions. However, it is certain that the damage to montane vegetation has increased markedly since European settlement, due principally to the burning practices of graziers operating leaseholds of summer pasturage on the high country. One fire of this source in the summer of 1961-62 burnt nearly 128 000 ha (Mitchell 1962). Large proportions of the Athrotaxis forest and coniferous shrubberies were killed Qackson 1973, Kirkpatrick & Dickinson 1984b, Kirkpatrick etal.1995).
Tasmanian vegetation - nutrients and losses due to fire 3
TABLE 1 Areas of vegetation types pre-lSOO and at present, fire interval and fuel load
Vegetation type % area % area % area % area Fire-free Combustible pre-European * presentt northwest:j: southwest§ in terval yrs fuel t/ha~
.--------~
rainforest 9.S 8.5 26.2 19.5 150--300 25-30 swampforest 0.6 0.2 0.2 100-200 20-30 wet sclerophyll 19.2 14.6 24.9 15.7 80-150 180-320 dry sclerophyll 43.1 23.1 2.1 20-80 20-30 grassland 1.3 0.8 1.1 10-25 4-8 heathland 6.4 3.4 1 10-30 10-20 alpine 1.7 1.7 3.2 4 100-250 10-15 saltmarsh 0.06 0.05 wetland 0.4 0.2 40-80 2-4 sedgeland 17.4 17.2 27.4 56.2 20-40 10-30
total % 100 70 86.2 95.4 cleared land % 30 13.8 4.6 area millions ha 6.62 6.62 l.34 1.23
* Proportionate area of each vegetation type estimated to exist pre European settlement (Kirkpatrick et al.1995) relative to the whole state of Tasmania. t Proportionate area (1995) relative to the whole state of Tasmania (Kirkpatrick et aI.1995). :j: Proportionate area of the northwestern quarter (west of Forth Riverto Mt Manfred, estimate Kirkpatrick & Dickinson 19 84a). § Proportionate area of southwestern quarter protected region (modified after Marsden-Smedley 1998) after allowances for roads and impoundments.
The average interval between consecutive fires Q ackson 1968). ~ The average quantity of combustible fuel in tonnes per hectare at the time burnt, compiled from a number of sources.
Temperate rainforest Fire is rare in rainforest because the closed canopy maintains moisture content well into drought conditions. Low amounts of litter, low flammability and sparse understorey limit invasion of ground fires. The largest threat is from spot-fire embers setting the dense epiphytic moss and lichen load in the canopy alight when humidities are very low.
Mixed forest The age of mixed forest varies over a very wide span Q ackson 1999d; this paper, fig. lA, table 1). Close to sources of fire from open vegetation, the tree ages are commonly 50-100 yrs, reflecting the occasional overrun of fire across the forest boundary (fig. lA). In scattered patches within the sheet of rainforest, ages extend from about 200 to 300 years, the patches of eucalypt overstorey being maintained by chance spot fires often from upwind sources of sedgeland (fig. 1 B, C). The eucalypts in forests approaching 300 years of age are overmature, with moribund crowns, and often have a density ofless than five trees per hectare (fig. lA, B). The presence of eucalypts with large litter-cones of bark and leaves increases the risk of spot-fires in mixed forest. This elevated mass of sclerophyllous litter is easily ignited by falling embers in times of drought.
Wet sclerophyll forest Fires in wet sclerophyll forest are rare but very intense, usually killing all trees. Regeneration is from seed from fireresistant capsules shed soon after crown-fire scorch. Dense stockings result from the large fall of two to four years of viable seed held in the crowns. The consequent thinning over the first 80 years of growth to reduce the stocking from many tens of thousands to about 80 stems per hectare (Gilbert 1959) plus the branch fall from remaining dominant
trees contributes to the equilibrium fuel loads of up to 400 tlha, with litter and duff component up to 160 t/ha (Frankcombe 1966, Wells & Hickey 1999). The updraught from the fire-storm of wild-fires in severe fire weather conditions causes a rain of embers downwind, creating spotfires up to more than 50 km distant (Cheney 1981).
Dry sclerophyll forest The fire-free interval is short, ranging from ten or less to about 50 years. There is a continued accumulation of litter fuel in the drier sites in Tasmania due to the slow decay of the sclerophylllitter and limited termite activity. The litter layer contains 50-75% of the consumable fuel mass, and fuel accumulation continues to >20 t/ha after 30 years on sites with <700 mm precipitation but plateaus around 15 t/ha on sites with >700 mm precipitation (Bresnehan 1998). It seems likely that, in dry Eucalyptus amygdalina forests with a heathy understorey, the steady state oflitter accumulation would exceed 30 tlha. The Eucalyptus dominants of the dry sclerophyll show a marked ability to recover vegetatively from even intense fires by the survival of dormant buds under the dead phloem of the main trunk and larger limbs Qacobs 1955, Pryor 1976). This epicormic growth sustains carbon fixation till the crown dominance is again asserted. Very dry habitat species recover principally from similar buds in the massive lignotubers (Reid & Potts 1999).
Grassland/sedgeland These communities appear to derive from the burning regimes of the Aborigines during the Holocene. They may be divided into two types:
(a) Open savannah merging into grassy, open dry sclerophyll forest in dry habitats usually <800 mm in lowland environments. At the time of European settlement,
4 WD. Jackson
they extended throughout the east and north in the Midlands Graben and in the valleys of the larger streams (Fensham 1989, Jackson 1999d). These sparsely forested areas were quickly usurped by European graziers. Sheepgrazing has removed the previously rich intertussock herb layer and prevented the establishment of forest except at the margins, where advancing pole stands of eucalypts demonstrate the probable nature of the vegetation in the absence of disturbance (Duncan 1990). Where a short interval free of fire is maintained, the shrub storey of dry Eucalypt forest is slowly converted to a grassy sedgy understorey.
(b) Poa billardieri tussock grassland and grassy open E. delegatensis forest with corridors of forest on streams. These occur on moderately fertile soils on parent materials of basalt, granite or limestone on plateaus in the north at altitudes of 600-11 00 m. These grasslands in the northeast and northwest have been rapidly invaded by forest since European settlement by the succession of LeptospermumEucalyptus-Nothofogus. The eucalypt forest has a short tenure, due to die-back associated with rainforest invasion a ackson 1981, Ellis 1986).
Heathland Due to the intense utilisation of the coastal regions by the Aborigines in the Holocene, heathy communities have been extended inland by fire at the expense of the dry sclerophyll forest. Within the broad region dominated by dry sclerophyll forest there are many small patches of heath on sites where the watertable is high enough to create edaphic limits to trees. These sites are common on duplex soils of Permian and Triassic sediments. It is likely that most heathland was patch-burnt by the Aborigines every ten to 15 years to prevent closure by shrubs and to generate "greenpick" grazing conditions (Kirkpatrick & Harris 1999).
Sedgeland/heath or blanket moor The blanket moor carries sedges and an open shrub element of Epacridaceae, Myrtaceae and Proteaceae (Brown 1999). The moorland will carry fire even in damp conditions and burns intensely in drought. Where the fire-carry or intensity is limited by creeks or polar slopes, a dense wet scrub community of Leptospermum,Agastachys and Bauera develops until it is consumed by a hot fire. In valleys the peat depth may reach over 1 m but on steep slopes may be no more than a few centimetres. Most fires consume only the aboveground vegetation. From such fires Gymnoschoenus recovers quickly because of the large energy reserves held in the rhizomes. However, after prolonged drought, fires may consume the peat with serious losses of nutrients due to mobilisation and solution (Bowman &Jackson 1981,Jackson 1999d).
TASMANIAN DATA ON NUTRIENT LOSSES AND INPUTS
Losses due to Wild-fire and Estimation of Consumable Biomass
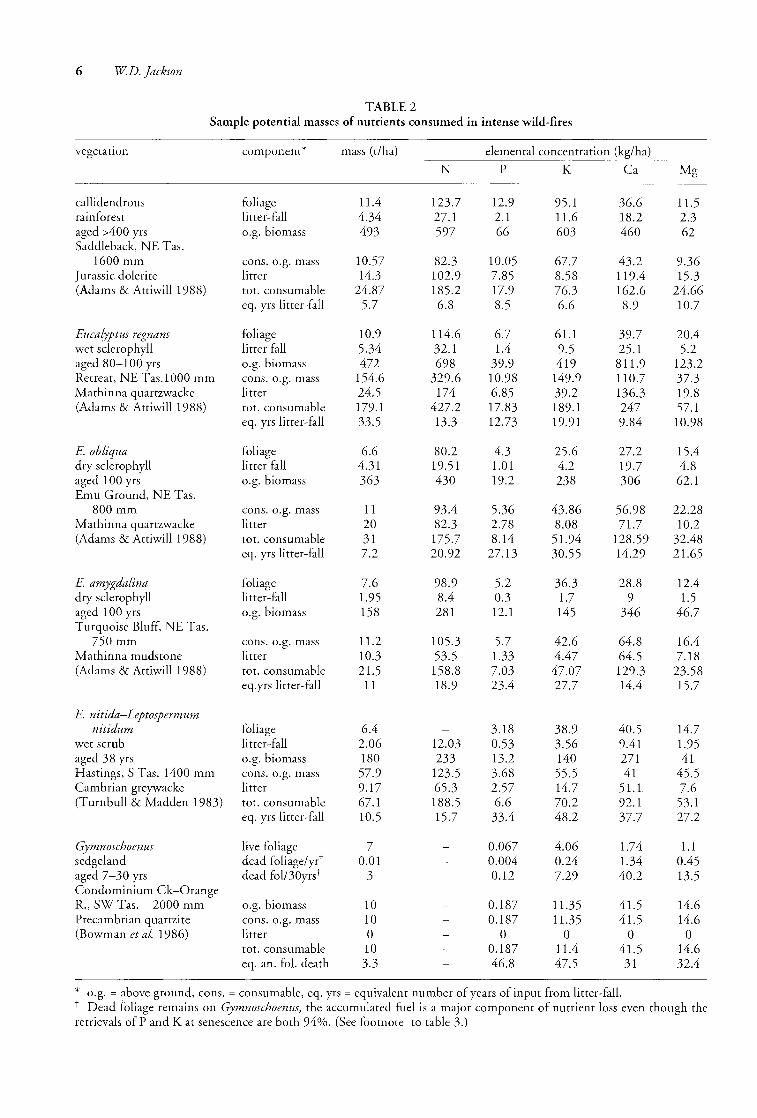
An attempt has been made in table 5 (see later) to collect the available data on potential nutrient loss due to very intense wild-fire in typical examples of vegetation types in Tasmania. This will hopefully provide a nutritional basis for the discussion on the patterns of vegetation discussed by Jackson & Brown (1999). The basis for the data in table 5 is provided by the estimated consumable masses shown in table 2, which have been collected from a number of published sources. These sources vary in sampling techniques, methods and analysis; hence, the original sources should be consulted to obtain their relative reliability. However, variability in the accuracy of the source data is small compared with the large potential errors in estimating fire-intensity effects when applying the estimates in table 5 to fires oflower intensity.
Where possible the concentration of elements is expressed in kg/ha, otherwise in ppm. Elements are denoted by their chemical symbols. Concentrations of the important elements Nand P are variously assessed in the form of ammonium (NH4+) and available P. Where measured, the available form is used in all tables.
It must be stressed that the losses shown in table 5 are based on the losses incurred in the extremely intense wildfires occurring once or twice a century in Tasmania (Marsden-Smedley 1998). Evidence gained from the inspection of sites which had carried wet sclerophyll forests, dry sclerophyll forests, shrubland and grassland before the 1967 fire in southeastern Tasmania was that complete removal of ash and considerable surface soil was general on all sites, due to the strong updraft.
The losses in these very intense wild-fires are used in table 5 because they allow a complete inventory oflosses of nutrients from the fire site. Losses of nutrients in less intense fires are much lower and are highly variable, due to the range of fuel consumed and the range of fire-intensity effects on volatile and particle loss in the smoke, transportation of elements into various mineral states in the ash, consumption of duff, removal of soil in the updraft, heating of the soil, exposure to erosion and leaching (Raison et al. 1993, Fisher & Binkley 2000). Estimates oflosses via atmospheric transfer in burning logging slash in forest regeneration in the Florentine Valley were approximately 15-20% in P, K, Ca and Mg (Harwood & Jackson 1975). Losses of nutrients in smoke during cool fuel-reduction fires are expected to be only 1-5% of the losses suggested in table 5. However, Raison et al. (1985a, b) have established relationships between the percentage of fuel mass consumed
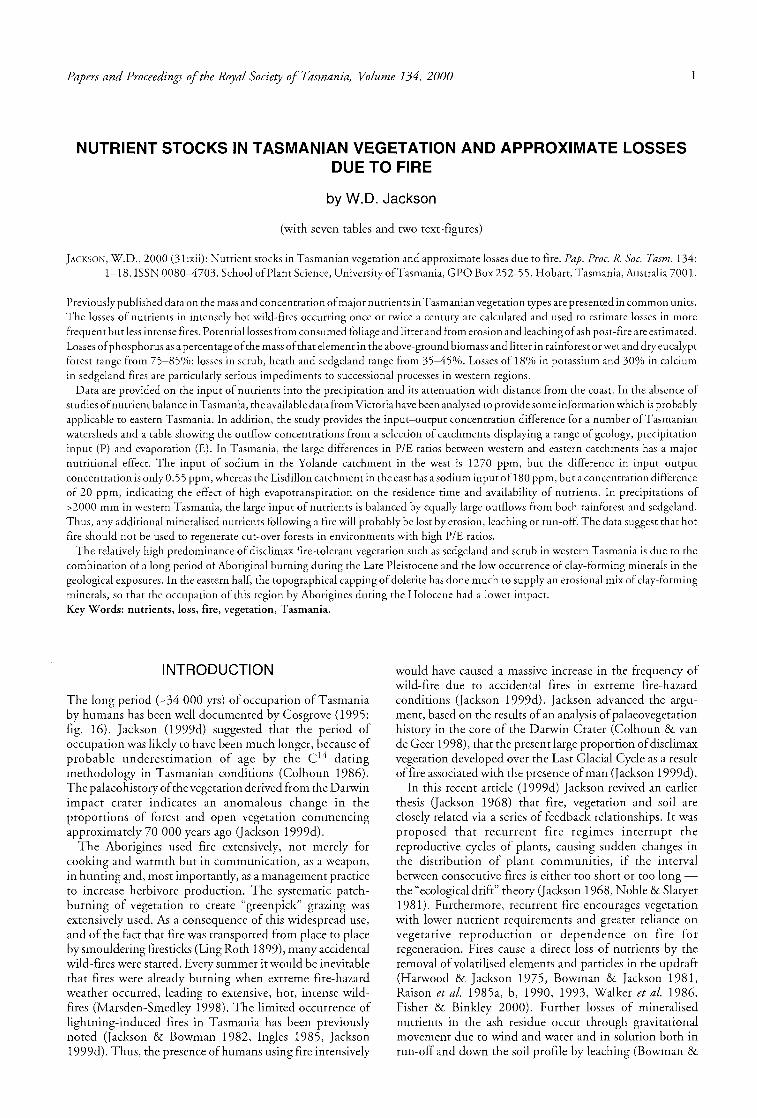
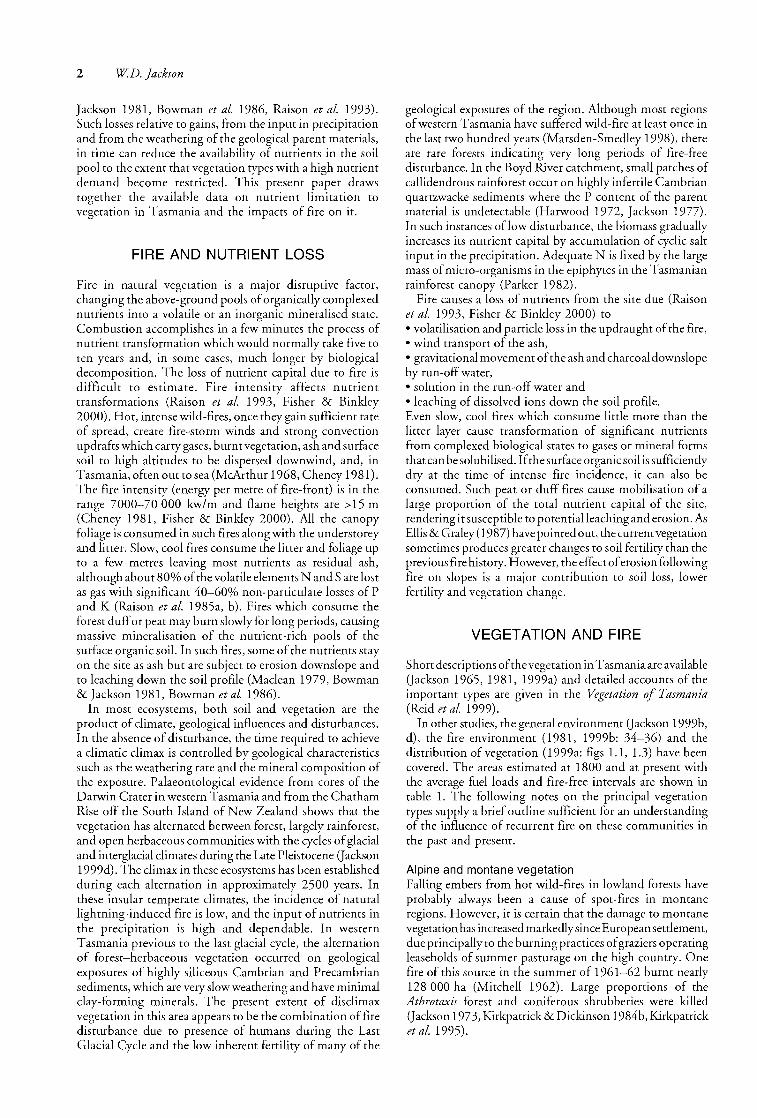
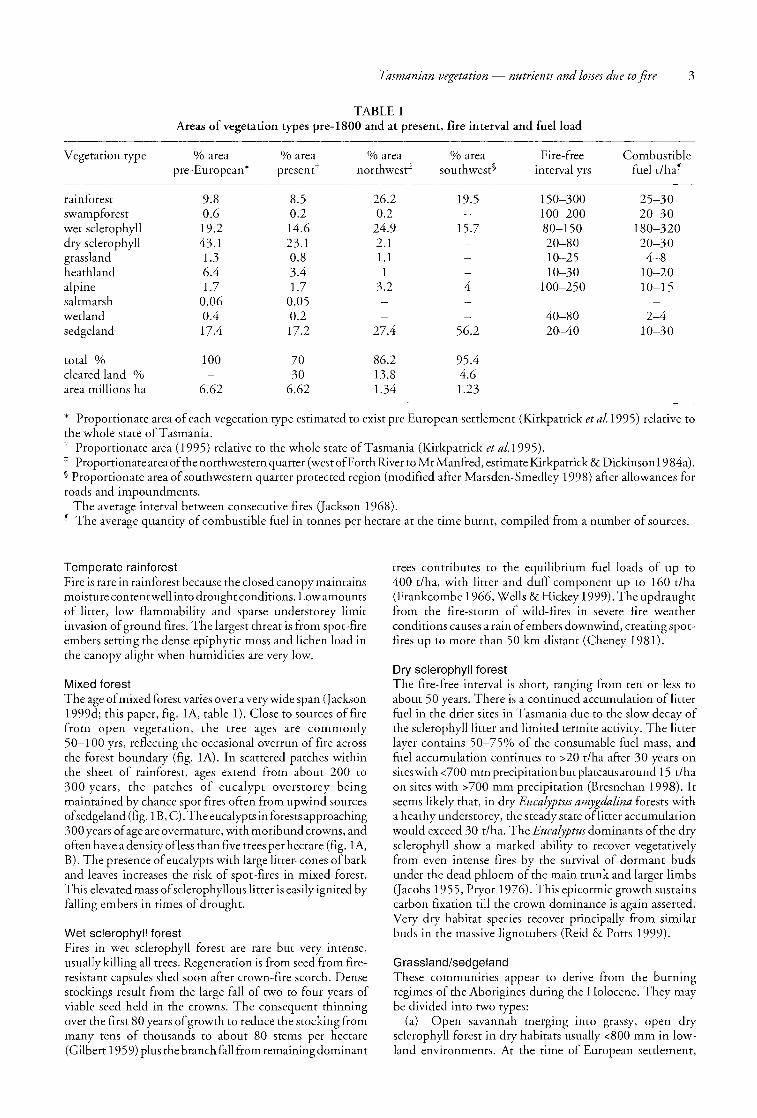
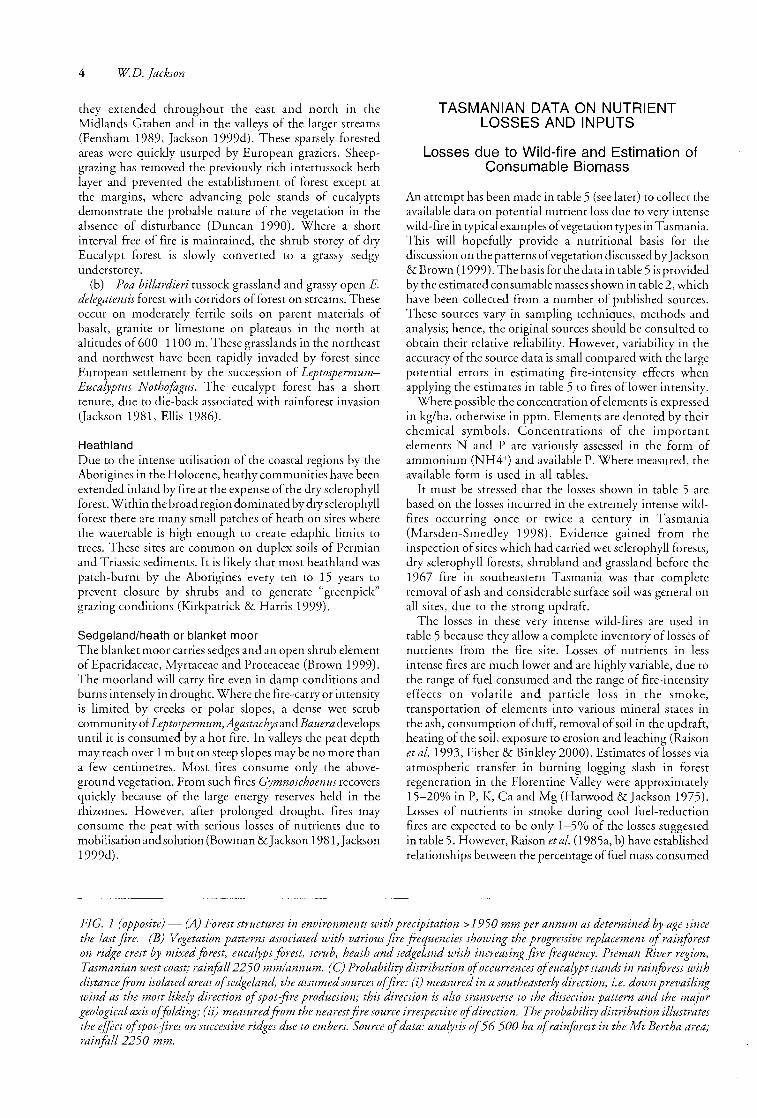
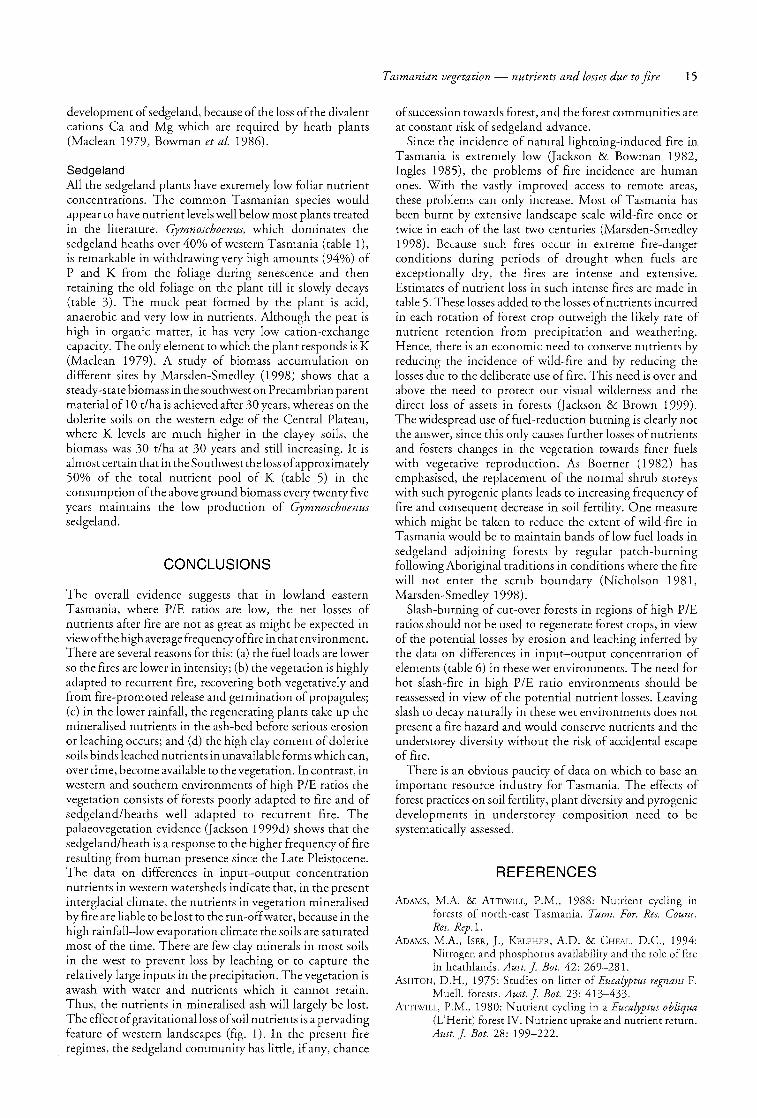
FIG. 1 (opposite) - (A) Forest structures in environments with precipitation> 1950 mm per annum as determined by age since the last fire. (B) Vegetation patterns associated with various fire frequencies showing the progressive replacement 0/ rainforest on ridge crest by mixed forest, eucalypt forest, scrub, heath and sedgeland with increasing fire frequency. Pieman River region, Tasmanian west coast; rainfol12250 mmlannum. (C) Probability distribution %ccurrences o/eucalypt stands in rainforest with distance from isolated areas o/sedgeland, the assumed sources o/fire: (i) measured in a southeasterly direction, i.e. down prevailing wind as the most likely direction 0/ spot-fire production; this direction is also transverse to the dissection pattern and the major geological axis o/folding; (ii) measured from the nearest fire source irrespective 0/ direction. The probability distribution illustrates the effect o/spot-fires on successive ridges due to embers. Source 0/ data: analysis 0/56500 ha 0/ rainforest in the Mt Bertha area; rain foIl 2250 mm.

A
B
C
Tasmanian vegetation - nutrients and losses due to fire 5
m Canopy height
75
60
45 Wet
Sclerophyll
30
15
Sedgeland Sapling Spar regrowth Submature stand. Mature stand Overmature edge regrowth Wet sclerophyll Wet sclerophyll rainforest stand. Rainforest
Wet scrub understorey and young rain- understorey understorey understorey forest understorey
10* 25 50 90 150 300 ot 1000 450 200 62 5
* years since last fire t Eucalypt stems per hectare
-Rain- over mature spar Scrub Sedge-
forest mature land
Eucalypt Stands -
P = 0'31 AT ZERO
(i) -03
·02
>t ·01 .jJ ·rl .-I ·rl .Q <1l
.Q
(ii) 0
'02
1 H P<
·01 ---0 ·8 1·6 2·4 3·2
Distance KIn
Cl'imax
Rainforest
400+ o
0,5km
4·0
6 WD.}ackson
TABLE 2 Sample potential masses of nutrients consumed in intense wild-fires
vegetation component* mass (t/ha) elemental concentration (kg/ha)
N P K Ca Mg . ~."-~--~----. ~-~~---~
callidendrous foliage 1l.4 123.7 12.9 95.1 36.6 11.5 rainforest litter-fall 4.34 27.1 2.1 1l.6 18.2 2.3 aged AOO yrs o.g. biomass 493 597 66 603 460 62 Saddleback, NE T as.
1600 mm cons. o.g. mass 10.57 82.3 10.05 67.7 43.2 9.36 Jurassic dolerite litter 14.3 102.9 7.85 8.58 119.4 15.3 (Adams & Attiwill 1988) tot. consumable 24.87 185.2 17.9 76.3 162.6 24.66
eq. yrs litter-fall 5.7 6.8 8.5 6.6 8.9 10.7
Eucalyptus regnans foliage 10.9 114.6 6.7 61.1 39.7 20.4 wet sclerophyll litter fall 5.34 32.1 l.4 9.5 25.1 5.2 aged 80-100 yrs o.g. biomass 472 698 39.9 419 81l.9 123.2 Retreat, NE T as. 1 000 mm cons. o.g. mass 154.6 329.6 10.98 149.9 110.7 37.3 Mathinna quartzwacke litter 24.5 174 6.85 39.2 136.3 19.8 (Adams & Attiwill 1988) tot. consumable 179.1 427.2 17.83 189.1 247 57.1
eq. yrs litter-fall 33.5 13.3 12.73 19.91 9.84 10.98
E. obliqua foliage 6.6 80.2 4.3 25.6 27.2 15.4 dry sclerophyll litter fall 4.31 19.51 1.01 4.2 19.7 4.8 aged 100 yrs o.g. biomass 363 430 19.2 238 306 62.1 Emu Ground, NE Tas.
800 mm cons. o.g. mass 11 93.4 5.36 43.86 56.98 22.28 Mathinna quartzwacke litter 20 82.3 2.78 8.08 7l.7 10.2 (Adams & Attiwill 1988) tot. consumable 31 175.7 8.14 51.94 128.59 32.48
eq. yrs litter-fall 7.2 20.92 27.13 30.55 14.29 21.65
E. amygdalina foliage 7.6 98.9 5.2 36.3 28.8 12.4 dry sclerophyll litter-fall 1.95 8.4 0.3 1.7 9 l.5 aged 100 yrs o.g. biomass 158 281 12.1 145 346 46.7 Turquoise Bluff, NE Tas.
750mm cons. o.g. mass 11.2 105.3 5.7 42.6 64.8 16.4 Mathinna mudstone litter 10.3 53.5 1.33 4.47 64.5 7.18 (Adams & Attiwill1988) tot. consumable 2l.5 158.8 7.03 47.07 129.3 23.58
eq.yrs litter-fall 11 18.9 23.4 27.7 14.4 15.7
E. nitida-Leptospermum nitidum foliage 6.4 3.18 38.9 40.5 14.7
wet scrub Ii tter -fall 2.06 12.03 0.53 3.56 9.41 l.95 aged 38 yrs o.g. biomass 180 233 13.2 140 271 41 Hastings, S Tas. 1400 mm cons. o.g. mass 57.9 123.5 3.68 55.5 41 45.5 Cambrian greywacke litter 9.17 65.3 2.57 14.7 5l.l 7.6 (Turnbull & Madden 1983) tot. consumable 67.1 188.5 6.6 70.2 92.1 53.1
eq. yrs litter-fall 10.5 15.7 33.4 48.2 37.7 27.2
Gymnoschoenus live foliage 7 0.067 4.06 1.74 l.1 sedgeland dead foliage/yr t 0.01 0.004 0.24 1.34 0.45 aged 7-30 yrs dead fol/30yrst 3 0.12 7.29 40.2 13.5 Condominium Ck-Orange R., SWTas. 2000 mm o.g. biomass 10 0.187 11.35 41.5 14.6 Precambrian quartzite cons. o.g. mass 10 0.187 11.35 41.5 14.6 (Bowman et al. 1986) litter 0 0 0 0 0
tot. consumable 10 0.187 11.4 4l.5 14.6 eq. an. fo!' death 3.3 46.8 47.5 31 32.4
* o.g. = above ground, cons. = consumable, eq. yrs = equivalent number of years of input from litter-fal!. Dead foliage remains on Gymnoschoenus, the accumulated fuel is a major component of nutrient loss even though the
retrievals of P and K at senescence are both 94%. (See footnote to table 3.)

Tasmanian vegetation - nutrients and losses due to fire 7
TABLE 3 Foliar concentrations of major vegetation types in ppm of oven dry weight
Vegetation Dominant or Nutrients* Site ReP important species P K Ca Mg
--,.-~-----
rainforest Atherosperma 1740 12980 5810 1290 Saddleback, NE T as AA moschatum 890 13100 6990 725 Boyd R., SW Tas J
[23J [52] [58J [-30] Nothofogus 1540 6500 2200 480 Saddleback, NE T as AA
cunninghamii 740 5450 6990 720 Boyd R., SW Tas J [32] [52J [56J [-23J
gully forest Olearia argophylla 1540 17800 5300 1830 Wallaby Ck, SE Vic A wet sclerophyll Eucalyptus regnans 780 5730 5730 3170 Wallaby Ck, SE Vic A
Pomaderris aspera 1800 11310 14234 3230 Wallaby Ck, SE Vic A E. obliqua 730 6660 4320 2210 Retreat, NE T as AA
dry sclerophyll E. obliqua 650 3400 4140 2350 Emu Ground, NE Tas AA E. amygdalina 700 4820 3820 1640 Turquoise Bluff, NE Tas AA
grassland Festuca 590 3280 3700 1400 Devonshire Dales, Eng!' Ll wet sclerophyll E. nitida 374 2880 3890 1530 Boyd R., SW Tas J
[27] [60] [-14] [5] woodland/ scrub 318 3890 4050 1470 Condominium Ck, SW T M wet scrub Leptospermum 207 3430 3550 1480 Condominium Ck, SW T M
nitidum dry heath 175 3300 5300 2150 Dark Island Hth, SA S wet heath Melaleuca 122 2940 8640 2020 Condominium Ck, SW T M
squarrosa Sprengelia 100 2450 4320 670 Condominium Ck, SW T M
incarnata sedgeland Lepidosperma 113 4090 540 950 Orange River, SW Tas M
filiforme [93] [93J [18] [18J Gymnoschoenus 67 4060 1100 1740 Orange River, SW Tas M
sphaerocephalus [94J [94] [23] [59] Leptocarpus 10 3300 900 410 Orange River, SW Tas M
tenax
* Figures in square brackets are the withdrawal percentage of the nutrient upon leaf senescence before leaf-fall; negative figures indicate excretion during senescence. t References: AA -Adams, M.A. & Attiwill, P.M. (1988); A - Ashton, D.H. (1975); J - Jackson, W.D. (1977); Ll- Lloyd, P.S. (1971); M - Mclean, A.R. (1979); S - Specht, R.L. (1969).
and the percentage loss of elements to the atmosphere. This demonstrates that up to 40% of the P content of combusted fuel can be lost in some low-intensity fires. Erosion of the ash remaining after lower intensity fires is potentially a far greater cause of nutrient loss than either atmospheric or leaching losses (Raison et at. 1985a, 1993). Both erosion and leaching are likely to be important causes of nutrient loss following fire in the dissected high rainfall regions of western Tasmania. The application of the losses estimated in table 5 to fires other than very intense wildfires occurring once or twice a century in Tasmanian vegetation can only be made with due adjustment for the lower fire intensity.
Biomass
The nutrient status of important Tasmanian plant communities is indicated in table 3 by the foliar concentration of elements in community dominants in approximate order ofP concentration. The distribution of these communities (Kirkpatrick & Dickinson 1984a, Jackson 1999a) demonstrates the limitations imposed by nutrient availability
due to both the prevalence of highly infertile siliceous sediments (Seymour & Calver 1995) and the fire regimes associated with each vegetation type over a long period of human occupation (table 1).
Except where production is limited by water availability, biomass can reflect lack of disturbance due to the accumulation of nutrient capital in the vegetation and organic soil from the input of cyclic salt. The above-ground biomass in forests is also a function of age, due to wood accumulation. However, while there is a good relationship between foliage mass and the basal area of sapwood, the basal area of accumulated heartwood contributes little to the nutrient mass. This is particularly so in eucalypts, where there is a large transfer of nutrients from the heartwood as it matures (Attiwill 1980). In Tasmania, the total above-ground biomass is often a response to the time since fire and the water availability at the site. In dry sclerophyll forest, fire in the litter and understorey occurs at intervals usually of less than 50 years, but the trees are not killed by even intense fires. In wet sclerophyll and mixed forest, the long fire-free interval and the open canopy of the eucalypts allow the development of large quantities of fuel in the understorey and litter. The consumption of this by fire

8 WD. Jackson
kills most trees. Consequently, the consumable biomass of rainforest and other older mixed forest is lower than that of wet sclerophyll forest.
Nutrient Pools and Fluxes
The nutrient content of the litter layer and the surface layers of organic soil are probably more important reservoirs of nutrient capital in Tasmanian environments that in most mainland Australian habitats. This proposal is based on the lower decomposition rates of litter, the preponderances of shallow soil, lack of clay-forming minerals and the slow weathering rates and infertility of geological exposures in many Tasmanian habitats. Most feeding roots of vegetation including those oflarge forest trees exploit mainly the upper few centimetres of the soil profile especially in the infertile soils of western Tasmania. Nutrients in the soil are highly conserved as organic complexes in the micro-organisms. The supply of labile nutrients to the plants via the root system is largely dependent on the flux of nutrients in the litter-fall. The number of years litter-fall equivalent to the loss of nutrients by intense wild-fire is shown in table 5 as a representative measure of nutrient loss.
The pool of micro-organisms in the surface layers of the soil forms an important buffer against losses of nutrients by leaching of the ashes following a fire. The micro-organisms are able to grow rapidly by utilising the flux of nutrient ions dissolved from the ash thus immobilising otherwise labile nutrients. The role of soil micro-organisms in providing immobilisation after a fire is particularly important in forest soils (Vitousek & Matson 1984, Polglase et al. 1986). For this reason, the consequences of duff and peat fires are particularly detrimental to the regeneration of the vegetation. This is demonstrated by the replacement of rainforest by sedgeland species such as Gahnia, Lepidosperma and Gymnoschoenus following duff fires in poor soils (Hill & Read 1984, Barker 1991).
Litter Accession and Decomposition
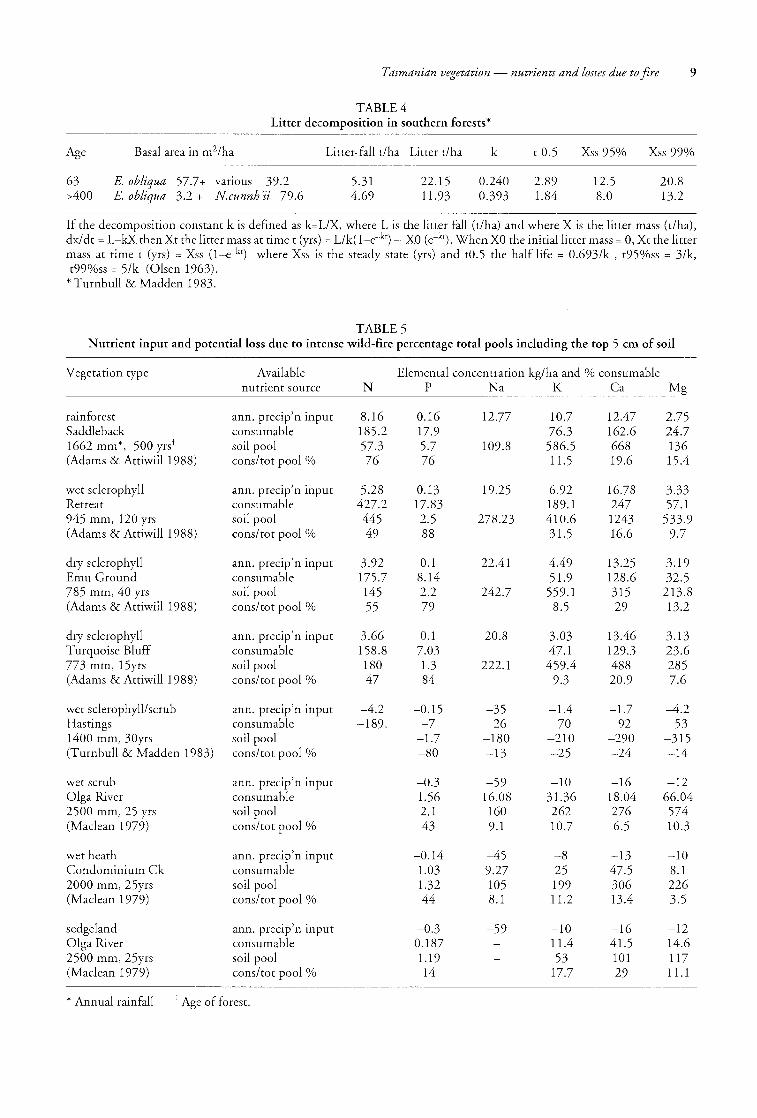
The standing crop of litter is more variable than the litterfall would indicate, due to the range in decomposition rates. Turnbull & Madden (1983) analysed the litter balance in southern Tasmanian wet forests near Hastings, where precipitation is ~ 1400 mm/yr. These results for litter-fall and standing crop are shown in table 4 and are similar to those of Adams & Attiwill (1988) for similar communities at Retreat and Saddleback shown in table 2. Turnbull & Madden (1983) developed a relationship between litter-fall and basal area (r2=0.92), where the litter accession in kg/ha was 35. 7x (basal area m/ha). This relationship has been used in table 2 to estimate missing data.
Decomposition constants (k) for dry sclerophyll forests in Tasmania are much lower than for wet forests. Although the accession rates are reduced, due to water limitation to production, the much slower decay of litter, due in part to the low activity of termites in Tasmania, more than compensates. Under the high average values of radiation inputs in eastern Tasmania (272-314 K joules/cm2/yr [Nunez 1978]' effectively doubled on steep northerly facing slopes [Holland & Steyn 1975]), the productivity is predominantly influenced by water availability rather than temperature. Dry sclerophyll in Tasmania is so regularly disturbed by
fire that it is difficult to estimate what the steady state of litter might be. In a study of litter accession following fuelreduction fires on sites in southeastern Tasmania, Bresneham (1998) found the k value for sites with precipitation >700 mm/yrwas 0.135 whereas the k for sites with precipitation <600 mm/yr was 0.0005, giving an unrealistically high steady state of litter. Accession curves developed by Raison et al. (1983) for dry sclerophyll in the Blue Mountains ofNSW suggest that steady states oflitter (Xss table 4) in dry sclerophyll in dry regions of Tasmania are about 25-30 t/ha. Such accumulations on dry sites are rare because of fire. It should be pointed out that the E. amygdalina dry sclerophyll on the Turquoise Bluff site (table 5) was burnt two years before the assessment by Adams & Attiwill (1988) with a fire sufficiently hot to produce a strong crop of epicormic foliage.
Nutrient Loss Relative to Total Pools
Losses considered relative to the total pools are shown in table 5 where the input in the rainfall is shown in the first row, the consumable mass from table 2 in the second and the exchangeable mass in the upper 5 em of the soil pool in the third row. The percentage loss in the above ground pools of foliage and litter relative to the total pools is shown in the last row for each vegetation type. The total pools in the soil are of course much greater than the available pools and the impact oflosses in the long term may be in part addressed by the slow conversion of elements from their unavailable pools. However, the losses in intense wild-fire should be assessed against the exchangeable pools as these will determine availability during the regeneration phases. In less intense fires where ash remains, fire mobilises nutrients especially N and P, stimulating growth of the regeneration. The pool in the top 5 em of soil has been used rather than deeper profiles because it has a far greater influence over the early phases of regeneration. Nutrient concentrations in the top 5 em are about 4-7 fold greater than those in the next 15 em of the soil profile. It has been demonstrated that draw-down on the supply of nutrients in the soil pool decreases after canopy closure, due to the flux of available cations resulting from competitive thinning of the vegetation. Litter-fall produces the majority of supply for Ca and Mg and also N, while through-fall supplies most of the K. P is predominantly cycled internally in the foliage and as the forest matures from the heartwood (Baker & Attiwill 1985, Attiwill et al. 1996).
Post-fire Erosion and Leaching Losses
Residual ash left by cooler fires is subject to erosion and leaching, moving the nutrient content downslope. This movement is considerable in Tasmania, due to the steep slopes of the topography. The first rains after a fire move considerable quantities of ash downslope in the surface run off. Further nutrients are removed in solution. However, quantitative data are difficult to obtain. It is probable that the flotation of charcoal fines over long periods accounts for significant nutrient loss adsorbed from the ash. The evidence oflong-term gravitational movement of nutrients is abundant in Western Tasmania, where sedgeland heaths and scrub replace forests on ridge tops where spot fires are more frequent (fig. IB, C).
The leaching of nutrients from residual ash is limited on
Tasmanian vegetation - nutrients and losses due to fire 9
TABLE 4 Litter decomposition in southern forests*
Age Basal area in m2/ha Litter-fall t/ha Litter t/ha k to.5 Xss 95% Xss 99%
63 >400
E. obliqua 57.7+ various 39.2 E. obliqua 3.2 + Ncunnh'ii 79.6
5.31 4.69
22.15 11.93
0.240 0.393
2.89 1.84
12.5 8.0
20.8 13.2
If the decomposition constant k is defined as bLlX, where L is the litter fall (t/ha) and where X is the litter mass (t/ha), dx/ dt = L-kX then Xt the litter mass at time t (yrs) = Llk(l-e-kt) - XO (e-kt). When XO the initial litter mass = 0, Xt the litter mass at time t (yrs) = Xss (l-e-kt) where Xss is the steady state (yrs) and to.5 the half life = 0.693/k , t95%ss = 3/k, t99%ss = 5/k (Olsen 1963).
* Turnbull & Madden 1983.
TABLE 5 Nutrient input and potential loss due to intense wild-fire percentage total pools including the top 5 cm of soil
Vegetation type
rainforest Saddleback 1662 mm*, 500 yrst (Adams & Attiwill 1988)
wet sclerophyll Retreat 945 mm, 120 yrs (Adams & Attiwill 1988)
dry sclerophyll Emu Ground 785 mm, 40 yrs (Adams & Attiwill1988)
dry sclerophyll Turquoise Bluff 773 mm, 15yrs (Adams & Attiwill1988)
wet sclerophyll/scrub Hastings 1400 mm, 30yrs (Turnbull & Madden 1983)
wet scrub Olga River 2500 mm, 25 yrs (Maclean 1979)
wet heath Condominium Ck 2000 mm, 25yrs (Maclean 1979)
sedgeland Olga River 2500 mm, 25yrs (Maclean 1979)
Available nutrient source
ann. precip'n input consumable soil pool cons/tot pool %
ann. precip'n input consumable soil pool consftot pool %
ann. precip'n input consumable soil pool cons/tot pool %
ann. precip'n input consumable soil pool consftot pool %
ann. precip'n input consumable soil pool consftot pool %
ann. precip'n input consumable soil pool cons/tot pool %
ann. precip'n input consumable soil pool consftot pool %
ann. precip'n input consumable soil pool cons/tot pool %
* Annual rainfall t Age of forest.
N
8.16 185.2 57.3 76
5.28 427.2 445 49
3.92 175.7 145 55
3.66 158.8 180 47
-4.2 -189.
Elemental concentration kg/ha and % consumable P Na K Ca Mg
0.16 17.9 5.7 76
0.13 17.83 2.5 88
0.1 8.14 2.2 79
0.1 7.03 1.3 84
-0.15 -7
-1.7 -80
-0.3 1.56 2.1 43
-0.14 1.03 1.32 44
-0.3 0.187 1.19 14
12.77
109.8
19.25
278.23
22.41
242.7
20.8
222.1
-35 -26
-180 -13
-59 16.08 160 9.1
-45 9.27 105 8.1
-59
10.7 76.3 586.5 11.5
6.92 189.1 410.6 31.5
4.49 51.9
559.1 8.5
3.03 47.1 459.4
9.3
-1.4 -70
-210 -25
-10 31.36 262 10.7
-8 25 199 11.2
-10 11.4 53
17.7
12.47 162.6 668 19.6
16.78 247 1243 16.6
13.25 128.6 315 29
13.46 129.3 488 20.9
-1.7 -92
-290 -24
-16 18.04 276 6.5
-13 47.5 306 13.4
-16 41.5 101 29
2.75 24.7 136 15.4
3.33 57.1 533.9
9.7
3.19 32.5
213.8 13.2
3.13 23.6 285 7.6
-4.2 -53
-315 -14
-12 66.04 574 10.3
-10 8.1 226 3.5
-12 14.6 117 11.1

10 W.D. Jackson
forest sites, due to the uptake of nutrients by the regeneration, the high cation-exchange capacity of the surface organic soil and the ability of the extensive microbial pool to expand and immobilise the mineralised nutrients (Vitousek & Matson 1974, Polglase et al. 1986, Adams & Attiwill 1988, Attiwill et at. 1996).
The flux of anions, especially bicarbonate, in the leaching water increases the loss of cations initially (Khanna & Raison 1986). However, in most forest soils, uptake by regenerating vegetation and immobilisation by the microbial pool usually prevent extended leaching, although this is very site-dependent. The analysis of soil water following fire suggests a return to close to prefire levels of nutrients after 18 months (Adams & Attiwill 1988). Where the surface organic-rich layers are burnt and are subject to . severe leaching, the presence of significant clay in the soil profile probably limits extensive leaching losses. Large quantities of nutrients may be captured on the clay. Deep sandy soils without clay horizons are certainly strongly leached after fire. The muck peat soil formed by Gymnoschoenus sedgeland in Tasmania is acid (pH ~4) and anaerobic. It has exceptionally low nutrient content, due to the high withdrawal of nutrients at leaf senescence and the retention of dead foliage by the plant (table 3). As a consequence the loss of potassium in a fire is considerably greater than the content of the soil pool (table 5). Should the peat dty sufficiently to burn, serious erosion and leaching occurs (Maclean 1979, Bowman & Jackson 1981, Bowman et al. 1986).
Geological Influences
There are very large differences in the soil-vegetation pools of nutrients on the different geological exposures in Tasmania. However, the more fertile igneous exposures are limited in distribution (Seymour & Calver 1995).
The input from weathering of geological substrates can only be estimated. An estimate has been made by Attiwill & Leeper (1987) for weathering inputs for granite soils of high productivity in Victoria. The estimate is possibly applicable to some igneous exposures in eastern Tasmania. However, the lower subsoil temperatures in Tasmania are likely to cause slower weathering rates. Fast-weathering igneous rocks like basalt yield deep clay-loams or kraznozem soils which, in Tasmania, have been largely utilised for agriculture. The much slower weathering exposures of dolerite provide shallow clay-rich loams. These clay-rich soils resist nutrient depletion by erosion and leaching in typical recurrent fire regimes.
The weathering inputs on Permian and Triassic and Devonian sediments are about an order of magnitude lower than those of the igneous rocks, while those of the preCarboniferous sediments of western Tasmania are about two orders of magnitude lower. These highly siliceous, slow-weathering sediments are deficient in clay-forming minerals. The soils on these sediments are shallow, with acid organic surface horizons over leached sandy Al horizons; they are susceptible to erosion and leaching following fire in the vegetation. Further, the organic soils are likely to be consumed in peat and duff fires, causing serious nutrient loss by erosion. Soil permeability and slope are major factors affecting erosion potential. Erosion is a key driver of soil and vegetation change.
The present maps of geological exposure (Seymour & Calver 1995) do not account for all of the soil-vegetation
responses, because erosion has removed the thin cover of igneous rocks which was once more widely distributed in the west. The clay-forming minerals from these past covers are now incorporated in many soils. Additionally, large volumes of dolerite are perched at elevations> IOOO m on mountain tops and on the Central Plateau on the western margin of the post-Carboniferous cover. During the Pleistocene, extensive ice-sheets and glaciers have deposited glacial till from the dolerite over wide areas of the preCarboniferous pavement to the west (Colhoun 1985, Kiernan 1989,1990, Kiernan & Hannan 1991, Fitzsimons & Colhoun 1991, Jackson 1999c). The remains of these rocks have been widely distributed by the erosional forces and contribute clay-forming minerals to the soil, increasing its cation-exchange capacity. These relatively small additions of day minerals do much to protect the soils on the othetwise highly quartzose sediments in the west from loss of nutrients from leaching after fire. In the eastern half, intensive frost action during periglacial conditions in the Pleistocene has distributed dolerite debris downslope from the capping sills on most of the topography. As a result, clay minerals are incorporated in many soils on sedimentary exposures. The influence of weathering and solution of the geological substrate and concentration due to low precipitation/ evaporation (P/E) ratios are evident from input-output differences in the streamwaters from the catchments shown in table 6 and the outflow concentration in table 7.
Input of Nutrients in the Precipitation (Cyclic Salt)
There are few data on the nutrient content of rainwater in Tasmania. Adams & Attiwill's (1988) data from northern Tasmania are the sole available source of information on inputs in precipitation from which attenuation of the elemental concentrations with distance from the coast can be derived. The set of data from the Cape Grim weather station (Ayers & Ivey 1988) provided an indication of the high maritime influence in the west. Data for eight years showed mean precipitation 794 mm, wind direction 63% westerly, wind velocity 6-17 m/ sec 80% of time, mean velocity 11-12 m/sec, mean input of elements in kg/ha: Na 267, K 11.8, Ca 15.6, Mg 30.0. In view of the strength of the westerly airstream and the generally rougher seas in the west, it could be expected that the inputs of aerosols would be higher and the transport of nutrients inland would be higher in the west than in the east. It is expected, therefore, that the data of Adams & Attiwill (1988) are unlikely to be applicable to western environments. To provide some estimates of the attenuation of nutrient concentration with distance from the western coast, data on the concentration of nutrients in very small natural catchments, such as lakes and tarns surveyed by Buckney & Tyler (1973), have been urilised to create approximate precipitation inputs. The catchments used are rock basins at high altitudes on hard dolerite or quartzite. The areas drained are all less than a few square kilometres and carry heathy vegetation and shallow peaty soils. The waters have totally dissolved solids ranging from 20-40 ppm. These data are summarised in figure 2B for eastern environments using Adams and Attiwill' s (1988) data and in figure 2A for western environments using Buckney & Tyler's (1973) data as an approximation. Exponential curves have been fitted to both data sets with respective correlation coefficients. The data collected over

Tasmanian vegetation - nutrients and losses due to fire 11
TABLE 6 Nutrient balance (NB kg/ha/yr) and difference in concentration (CD ppm) both input-output
Catchment* Prec. Evap. Dist.* C* Yr* Na K Ca Mg mm % km no. no. NB CD NB CD NB CD NB CD
Victorian data Cropper Ck, Myrtleford 1200 94 180 1 +1.56 -1.37 +1.44 -0.23 +3.02 -0.01 +0.40 -0.77 loami shale E radiata 1200 90 2 +1.29 -1.33 +1.47 -0.18 +2.82 -0.08 -0.05 -0.88 (Flinn et at. 1979) 1200 85 3 +0.06 -1.79 +1.27 -026 +2.16 -0.70 -0.92 -1.51
Stewarts Ck, Daylesford 1094 83 115 1 +13.2 -1.17 +7.30 -0.18 +1.60 -0.11 -0.10 -0.08 loami shale Eobliqua 1360 73 2 -5.80 -5.86 -0.10 -0.45 +0.80 -0.00 -3.50 -1.00 (Guthrie et al. 1978) 1432 73 3 -13.2 -5.74 -1.00 -5.91 +0.80 -0.02 -3.10 -1.03
Maroondah c Healesville 1554 66 100 1 1 -7.68 -3.06 -2.03 -0.93 -6.65 -1.78 -2.09 -0.68 kraznozem/granite E reg. 1514 47 1 2 -6.91 -2.02 -4.28 -0.57 -3.42 -0.76 -2.68 -0.48 (Feller 1981) 1495 51 2 1 -22.44 -4.09 -5.19 -1.04 -12.69 -2.60 -4.70 -0.77
1462 43 2 2 -18.26 -2.74 -6.63 -0.67 -6.16 -0.88 -5.91 -0.76
Tasmanian datat input CD input CD input CD input CD (Buckney & Tyler 1973) kg/ha ppm kg/ha ppm kg/ha ppm kg/ha ppm
Forester R. Dss Eobl. 1200 87 20 21.0 -0.80 3.0 -0.71 14.4 -0.69 3.8 -0.19 Lisdillon Rvl. Jd Eglob. 650 130 8 17.9 -20.2 2.3 -0.51 7.8 -12.84 2.6 -0.98 George R. D. granite rf/ws 950 86 26 13.3 -0.59 5.4 -0.85 11.4 -1.21 1.9 -0.21 Picton R. Pls.Eobl.ws/rf 1800 41 36 72.9 -1.60 11.2 -0.16 14.4 -3.92 9.0 -0.94 L St Clair Jd/Pms Edel.lrf 1700 40 70 32.3 -1.12 10.0 -0.43 13.6 +0.02 5.1 +0.16 Yolande R. Cvolc rf 3500 21 26 127.5 -0.55 26.3 -0.19 28.0 -0.12 17.5 -0.34 L. Pedder. Pcqrtz till sedgel 2700 28 40 64.8 -0.41 16.7 +0.11 23.0 +0.08 13.2 -0.46
* C = catchment, yr = year, dist. = distance from coast. t Pms = Permian mudstone, PIs = Permian limestone, Jd = Jurassic dolerite, Dss = Devonian siltstone, Cvolc = Cambrian volcanics, Pcqrtz = Precambrian quartzite, rf = rainforest, ws = wet sclerophyll.
A 7500
7000 -
6500 -
6000 -
5500
E 5000 ... 4500 ...
.5 4000
C 3500
t 3000
2500
3 2000
C 1500 -0 1000 0
500
0-
Na y ~ 4502.475 • 10 ·0.005x r2 ~ 0.650 K Y ~ 744.017 • 10 ·0.003x r2 ~ 0.234 Ca y ~ 755.050 • IO O.oo2x r2 ~ 0.146 Mg Y ~ 841.124' 10 ·0.002x r2 ~ 0.258
Western Attenuation derived from small catchments Buckney &Ty1er (1973)
so 100
Distance Inland (km)
Ca
150
B
200
3500
3000 -E !it 2500 -
Na c .;;; 2000
o
Na y = 3.671 • 10 -0.016x~ = 0.978
Ca y = 1.204 • lOo.ooox ~ = 0.003 K Y = 0.371 • lOo.004x ~ = 0.223
Mg Y ~ 0.507' 10 -O.D1Jx ~ = 0.945
Eastern Attenuation Adams & Attiwi 111988
~ 1500 f-_______ .::::::..~-C~a'--------__I fl1000 c
8 500 -E:=;:::~~=~=~~K~~:~M;~~ 10 20 30 40 50 60
Distance inland (km)
FIG. 2 -Attenuation of nutrients in the precipitation with distance inland. (Aj in western Tasmania; (Bj in eastern Tasmania.
12 WD.Jackson
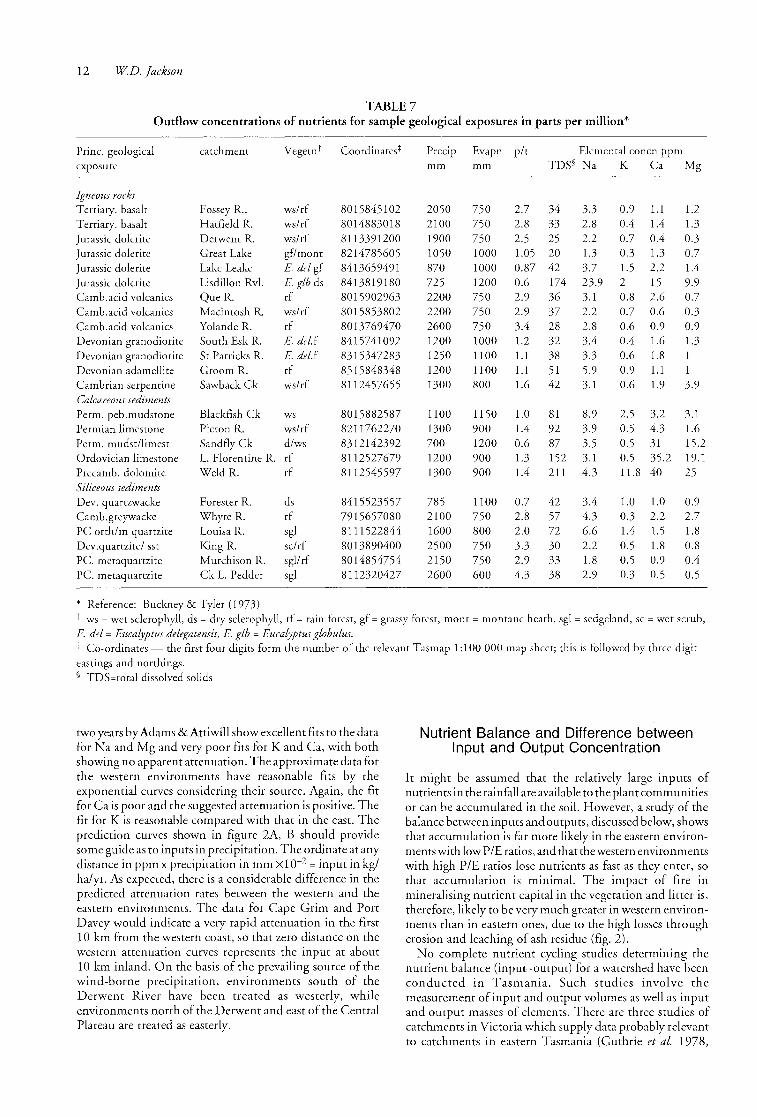
TABLE 7 Outflow concentrations of nutrients for sample geological exposures in parts per million*
Prine. geological catchment VegetnT Coordinates* Precip Evapn pit Elemental concn ppm exposure mm mm TDS§ Na K Ca Mg
-------,--------------- "~------.-
Igneous rocks Tertiary. basalt Fossey R .. wslrf 8015845102 2050 750 2.7 34 3.3 0.9 1.1 1.2 Tertiary. basalt Hatfield R. ws/rf 8014883018 2100 750 2"8 33 2.8 0.4 1.4 1.3 Jurassic dolerite Derwent R. ws/rf 8113391200 1900 750 2.5 25 2.2 0.7 0.4 0.3 Jurassic dolerite Great Lake gf/mont 8214785605 1050 1000 1.05 20 1.3 0.3 1.3 0.7 Jurassic dolerite Lake Leake E. del gf 8413659491 870 1000 0.87 42 3.7 1.5 2.2 1.4 Jurassic dolerite Lisdillon Rvl. E. glb ds 8413819180 725 1200 0.6 174 23.9 2 15 9.9 Camb.acid volcanics QueR. rf 8015902963 2200 750 2.9 36 3.1 0.8 2.6 0.7 Camb.acid volcanics Macintosh R. wslrf 8015853802 2200 750 2.9 37 2.2 0.7 0.6 03 Camb.acid volcanics Yolande R. rf 8013769470 2600 750 3.4 28 2.8 0.6 0.9 0.9 Devonian granodiorite South Esk R. E. del.f 8415741092 1200 1000 1.2 32 3.4 0.4 1.6 1.3 Devonian granodiorite St Patricks R. E. del.f 8315347283 1250 1100 1.1 38 3.3 0.6 1.8 Devonian adamellite Groom R. rf 8515848348 1200 1100 Ll 51 5.9 0.9 1.1 1 Cambrian serpentine Sawback Ck wslrf 8112457655 1300 800 1.6 42 3.1 0.6 1.9 3.9 Calcareous sediments Perm. peb.mudstone Blackfish Ck ws 8015882587 1100 1150 1.0 81 8.9 2.5 3.2 3.1 Permian limestone Picton R. wslrf 8211762270 1300 900 1.4 92 3.9 0.5 4.3 1.6 Perm. mudstllimest Sandfly Ck d/ws 8312142392 700 1200 0.6 87 3.5 0.5 31 15.2 Ordovician limestone L. Florentine R. rf 8112527679 1200 900 1.3 152 3.1 0.5 35.2 19.1 Precamb. dolomite Weld R. rf 8112545597 1300 900 1.4 211 4.3 11.8 40 25 Siliceous sediments Dev. quartzwacke Forester R. ds 8415523557 785 1100 0.7 42 3.4 1.0 1.0 0.9 Camb.greywacke Whyte R. rf 7915657080 2100 750 2.8 57 4.3 0.3 2.2 2.7 PC orth/m quartzite Louisa R. sgl 8111522844 1600 800 2.0 72 6.6 1.4 1.5 1.8 Dev.quartzite/ sst King R. sclrf 8013890400 2500 750 3.3 30 2.2 0.5 1.8 0.8 Pc. metaquartzite Murchison R. sgllrf 8014854754 2150 750 2.9 33 1.8 0.5 0.9 0.4 Pc. metaquartzite Ck L. Pedder sgl 8112320427 2600 600 4.3 38 2.9 0.3 0.5 0.5
* Reference: Buckney & Tyler (1973) t ws = wet sclerophyll, ds = dry sclerophyll, rf = rain forest, gf = grassy forest, mont = montane heath, sgl = sedgeland, sc = wet scrub, E. del = Eucalyptus delegatensis, E. glb = Eucalyptus globulus. j: Co-ordinates -- the first four digits form the number of the relevant Tasmap 1: 1 00 000 map sheet; this is followed by three digit eastings and northings. § TDS=total dissolved solids
two years by Adams & Attiwill show excellent fits to the data for Na and Mg and very poor fits for K and Ca, with both showing no apparent attenuation. The approximate data for the western environments have reasonable fits by the exponential curves considering their source. Again, the fit for Ca is poor and the suggested attenuation is positive. The fit for K is reasonable compared with that in the east. The prediction curves shown in figure 2A, B should provide some guide as to inputs in precipitation. The ordinate at any distance in ppm x precipitation in mm xl 0-2 = input in kgl ha/yr. As expected, there is a considerable difference in the predicted attenuation rates between the western and the eastern environments. The data for Cape Grim and Port Davey would indicate a very rapid attenuation in the first 10 km from the western coast, so that zero distance on the western attenuation curves represents the input at about 10 km inland. On the basis of the prevailing source of the wind-borne precipitation, environments south of the Derwent River have been treated as westerly, while environments north of the Derwent and east of the Central Plateau are treated as easterly.
Nutrient Balance and Difference between Input and Output Concentration
It might be assumed that the relatively large inputs of nutrients in the rainfall are available to the plant communities or can be accumulated in the soil. However, a study of the balance between inputs and outputs, discussed below, shows that accumulation is far more likely in the eastern environments with low PIE ratios, and that the western environments with high PIE ratios lose nutrients as fast as they enter, so that accumulation is minimal. The impact of fire in mineralising nutrient capital in the vegetation and litter is, therefore, likely to be very much greater in western environments than in eastern ones, due to the high losses through erosion and leaching of ash residue (fig. 2).
No complete nutrient cycling studies determining the nutrient balance (input--output) for a watershed have been conducted in Tasmania. Such studies involve the measurement of input and output volumes as well as input and output masses of elements. There are three studies of catchments in Victoria which supply data probably relevant to catchments in eastern Tasmania (Guthrie et al. 1978,

Flinn etal. 1979, Feller 1981). These have been summarised in tables by Attiwill & Leeper (1987: 137-139) and by Attiwill et al. (1996: table 3). In general, these studies show that the order of loss is Na » K> Mg > Ca, with some catchments showing small accumulation of Ca. Comparisons of catchments and years indicate that the nutrient balance is still responsive to the PIE ratio, even though it removes the direct effect of evapotranspiration in increasing the concentration of outputs, so that losses of elements tend to increase as the PIE ratio rises. As a result, it would seem that the Victorian data on nutrient balance are unlikely to be applicable to the western and southern regions of Tasmania, where PIE ratios are high and the vegetation and soil are wet much of the time, due to the trend to uniform rain in all seasons Gackson 1999b) and to high reliability (Scott 1956).
Data on the difference between input-output in elemental concentration are available for a few catchments in Tasmania from the work on water chemistty by Buckney & Tyler (1973). These data are limited to comparisons of concentrations in extremely small headwater catchments with downstream concentrations and to single sampling in time. As such, they must be regarded as only an approximate guide to the relative size of the input and output concentrations for the catchments. Since no volume measurements are available for river flows, the data can only be expressed in concentrations (ppm). Table 6 shows the data for the above Victorian catchments for nutrient balance and the difference between input and output concentration for a selection of Tasmanian catchments. The combined data allow a better interpretation of the very different environments across Tasmania. It appears from the collective data for Victoria in table 6 that nutrient accumulation generally increases in drier years, and that losses are greater in wet years so that the nutrient balance does not entirely account for all the evapotranspiration.
The apparent increase in accumulation in the drier sites and years demonstrated by the Victorian data for nutrient balance seems to indicate the conversion of elements into poorly soluble pools in proportion to the long residencetime in the catchments. The opposite tendency for increasing losses in wetter years and catchments probably reflects the flushing of accumulated nutrient in the wetter conditions. The increasing losses in wet years or catchments does not extend to wet environments in Tasmania. The data for difference between input-output concentrations clearly show that, in the very wet environments, the difference in concentration between input-output decreases to zero for elements like K and Ca while Na and Mg have very low differences of < 0.5 ppm.
The parallels between the data on nutrient balance and the difference in input-output concentrations allow some limited application of the Victorian data to Tasmania. It is possible to obtain a rough guide to the effects of PIE ratio, marine influence, geological substrate and vegetation. The small positive difference in K and Ca at Lake Pedder for instance reflects the high demand for these elements by the Gymnoschoenus and the heath community respectively. The table of concentration differences in inflow-outflow provides useful information on the nutrient environment. For instance, the high PIE ratio in the west provides an input to the Yolande catchment of 127 kg/ha/yr of Na with a balance of only 0.55 ppm, whereas the low PIE ratio in the east provides an input of 18 kglha/yr of Na for Lisdillon catchment, with a difference between input-
Tasmanian vegetation - nutrients and losses due to fire 13
output of 20 ppm, indicating the effect of high evapotranspiration concentrating the run-off. In contrast, in the western environments the vegetation is awash with water and nutrients which it cannot retain. This means that large erosion and leaching losses must occur following mineralisation of the above-ground vegetation by fire in these wet environments. The very approximate estimates derived from data by Buckney & Tyler (1973), shown in table 7, indicate the likely information on nutrient availability in Tasmanian watersheds, due to differing precipitationl evaporation ratios and the degree of weathering and solution of geological substrates which could be obtained from the collection and analysis of rainwater and catchment outflows.
In summary, it appears that the input of nutrients to the soil and vegetation in Tasmania derived from precipitation as cyclic salt and aerosols probably exceeds the input to most watersheds from the weathering of the geological substrate, the possible exceptions being those of basaltic exposures. The climate in Tasmania has been dominated by the marine influence and westerly airstream in all past climates of the Pleistocene, and the low average subsoil temperatutes would limit chemical weathering rates. It could be expected, therefore, that the input from weathering in Tasmania is likely to be less and the input from precipitation would be greater than corresponding inputs elsewhere in southeastern Australia.
Peat and Duff Fires
Peat and duff fires are reasonably common in the cooler wetter climates of Tasmania during periods of extended drought. Peat fires in 1961/62 burnt nearly 128 000 ha of the Central Plateau (Mitchell 1962). As a consequence of this fire, approximately one-third of the surface has lost 5-10 cm of top soil over the subsequent 20 years through sheet erosion Gackson 1973, Kirkpatrick & Dickinson 1984b). Duff fires in rainforests in the Frenchmans Cap and Mt McCall regions and in the Denison Range have caused serious erosion in the last twenty years. On this evidence, the damage incurred by duff and peat fires must be significant over the period of a millennium. Elements such as N and P are predominantly cycled in the foliage pool. The upper 10 cm of most organic soils contain 80-90% of the content of the total pools (Adams & Attiwill 1988). The consumption of this upper soil zone, therefore, must have a serious impact on future fertility of the site, especially if followed by erosion. The reduced potential of the soil to capture and retain nutrients from the precipitation input is an important factor in limiting the long-term rebuilding of the productivity of the site. Unfortunately, there is little quantitative evidence of leaching loss following peat or duff fires. The only evidence is for losses in a peat fire in the sedgelandlheath at Condominium Creek in the Southwest where 20 cm of the surface peat were consumed. The pulse of nutrients leached from the ash, as demonstrated by the analyses of Maclean (1979), moved large quantities of Fe and K down the profile to be fixed in unavailable states in clay zones of the lower profile, increasing concentrations in these zones two- to three-fold over the three years succeeding the fire. Elements such as Ca, Mg and P appear to pass right through the profile (Maclean 1979, Bowman & Jackson 1981, Bowman etal 1986).
14 WD. Jackson
Nutrient Losses due to Fire in Forest
Hot wild-fires usually completely kill most, if not all, trees in rainforest and wet sclerophyll forests, so that regeneration is normally wholly dependent on establishment from seed (Gilbert 1959, Barker 1991). Although the potential losses of nutrients in intense wild-fires are high (table 5) relative to the total pools before such fires (for P, 76% in rainforest and 88% in wet sclerophyll), there are, on the average, long intervals in which the nutrient pools are replenished from inputs from the precipitation and weathering ofthe geological parent material. In low-intensity fires, the nutrients, especially P, are mobilised in the ash bed. As Adams & Attiwill (1988, Attiwill et al. 1996) pointed out, the remaining pool of living organisms in the organic upper soil usually prevents serious leaching of the ash bed, although losses through erosion can be serious.
The consequences of losses of elements in high demand by dominant plants (table 3) can cause changes in vegetation structure over generations. Rainforest species have higher demand for Nand P than eucalypts. Considerable volatile losses of both Nand P occur in hot fires, and losses of P by transport of ash are potentially serious (Raison et al. 1985b), since P is only acquired very slowly from inputs in precipitation and weathering (table 5). The input of N in precipitation (table 5) supplies some replenishment over time. However, the main source is symbiotic fixation. In eucalypt forests, symbionts in Acacia species and possibly of the Rhamnaceous understorey are variable components. In rainforests, very high levels of N fixation occur, due to the epiphytic layers oflichens and mosses in the canopy. It is estimated that these fix N at the rate of about 35-45 kgl halyr in Tasmanian rainforests and mixed forests (Parker 1982: table 7.1, p.139). In wet sclerophyll, the rate of fixation falls to 2-6 kglha, so there is a large drop in N fixation if a mixed forest is burnt and replaced predominantly by eucalypts.
There has been considerable controversy in the past over the time required for the replacement of nutrients lost from Tasmanian forests due to harvesting by clear felling followed by hot slash-fire to established regeneration (Raison 1981, Neilsen & Ellis 1981). This problem cannot be resolved until detailed nutrient data are collected. Adams & Attiwill (1988) proposed that replacement of all nutrients lost from northeastern forests as a result of logging and regeneration fires was conservatively estimated to occur within 80-100 years from precipitation and weathering. Ellis & Graley (1983) proposed that replacement could be expected within 15-20 years in the southern forests. The latter estimate appears most unlikely, in view of the probable erosion and leaching losses in this wetter environment. In any case, changes in nutrient supply ratio relative to requirements of the regenerating vegetation is a more important issue.
In dry sclerophyll, the losses relative to pre-fire pools are potentially high, e.g. for P about 80% (table 5). Since the intervals free of fire are much shorter, there is a greater drain on nutrient resources. For example, the estimated potential losses of 84% in the consumable mass of P in the E. amygdalina dry sclerophyll forest in table 5 must represent a serious cumulative limitation to productivity. This forest was burnt by a fire which defoliated the canopy two years before assessment by Adams & Attiwill (1988). The main consequence of short-interval recurrent fire regimes is to
foster a change from understoreys of woody shrubs to
"grassy-sedgy" understoreys. These monocot understoreys have underground energy stores and are capable of rapid vegetative recovery. Their presence further shortens the fire-free interval and creates a serious threat to the growth rates of eucalypt regeneration, as for instance in E. delegatensis forests (Ellis 1986).
In low PIE environments, where regeneration is readily obtained without the use of fire, its use even for fuel reduction promotes pyrogenic monocot or bracken understoreys, with associated deterioration in fertility (Boerner 1982). The current management policy of the forest industry of using hot slash-burning to create a highly mineralised ash-bed effect for regeneration in high PIE environments also needs to be questioned, especially when applied to low fertility sites. The potential losses of nutrients by erosion and leaching can be serious (tables 5, 6 & 7; see also discussion of results of Lockett & Candy 1984 by Jordan et al. 1992).
Nutrient Losses due to Fire in Non-forest Communities
As table 5 indicates, the non-forest communities of scrub, heath and sedgeland have lower soil nutrient reserves. The shorter fire-free intervals in non-forest communities places them at far greater risk of nutrient depletion and, with the exception of grassland, the generally lower microbial content of the soils renders them vulnerable to leaching loss. Many of the soils of heaths and most of the sedgeland peats are acid and anaerobic with high water-tables at least in some seasons. As a consequence, the cation-exchange capacity is low. This is not the case with grassland soils, which are well drained and have high cation-exchange capacity.
Heathland On the basis offoliar concentrations Australian heath plants have lower nutrient status than other heaths (Specht 1969). The pools of soluble inorganic Nand P in the soil form a small proportion of the total pools and are in many cases unrelated. Most of the soil analysis in the early literature (pre 1980) measured total pools. A somewhat different picture is found when the available pools are assessed. Adams et al. (1994) showed that, when extractable labile Nand P were determined, the surface organic soils of the heaths on Wilsons Promontory, Victoria, were comparable in availability of P and N with soils of most eucalypt forests; also that the concentration of carbon, nitrogen and potentially mineralised nitrogen and phosphatase activity were greater in soils from unburnt heath land than in soils from heath sites repeatedly burnt. In contrast, the concentrations of available P were greater in soils from repeatedly burnt sites (8-10 yrs) than from unburnt sites (~40 yrs). These effects were limited to the surface 2 cm of the soil. The sustained increase in available P and decrease in available N on frequently burned heathland is attributed to a reduction in the concentration of organic matter. The loss of N on frequently burnt sites is in excess of total inputs and constitutes a significant reduction in N stocks.
The findings of Adams et al. (1994) should be applicable to most coastal and near coastal heaths in northern and eastern Tasmania and the islands of Bass Strait. It is likely that similar losses of N are serious on the wet heaths in montane and western regions. Maclean (1979) argued that the repeated fires on sedgeland/heaths favour the
development of sedgeland, because of the loss of the divalent cations Ca and Mg which are required by heath plants (Maclean 1979, Bowman et al. 1986).
Sedgeland All the sedgeland plants have extremely low foliar nutrient concentrations. The common Tasmanian species would appear to have nutrient levels well below most plants treated in the literature. Gymnoschoenus, which dominates the sedgeland heaths over 40% of western Tasmania (table 1), is remarkable in withdrawing very high amounts (94%) of P and K from the foliage during senescence and then retaining the old foliage on the plant till it slowly decays (table 3). The muck peat formed by the plant is acid, anaerobic and very low in nutrients. Although the peat is high in organic matter, it has very low cation-exchange capacity. The only element to which the plant responds is K (Maclean 1979). A study of biomass accumulation on different sites by Marsden-Smedley (1998) shows that a steady-state biomass in the southwest on Precambrian parent material of 1 0 tlha is achieved after 30 years, whereas on the dolerite soils on the western edge of the Central Plateau, where K levels are much higher in the clayey soils, the biomass was 30 tlha at 30 years and still increasing. It is almost certain that in the Southwest the loss of approximately 50% of the total nutrient pool of K (table 5) in the consumption of the above ground biomass every twenty five years maintains the low production of Gymnoschoenus sedgeland.
CONCLUSIONS
The overall evidence suggests that in lowland eastern Tasmania, where PIE ratios are low, the net losses of nutrients after fire are not as great as might be expected in view of the high average frequency offire in that environment. There are several reasons for this: (a) the fuel loads are lower so the fires are lower in intensity; (b) the vegetation is highly adapted to recurrent fire, recovering both vegetatively and from fire-promoted release and germination of propagules; (c) in the lower rainfall, the regenerating plants take up the mineralised nutrients in the ash-bed before serious erosion or leaching occurs; and (d) the high clay content of dolerite soils binds leached nutrients in unavailable forms which can, over time, become available to the vegetation. In contrast, in western and southern environments of high PIE ratios the vegetation consists of forests poorly adapted to fire and of sedgelandlheaths well adapted to recurrent fire. The palaeovegetation evidence Qackson 1999d) shows that the sedgelandlheath is a response to the higher frequency of fire resulting from human presence since the Late Pleistocene. The data on differences in input-output concentration nutrients in western watersheds indicate that, in the present interglacial climate, the nutrients in vegetation mineralised by fire are liable to be lost to the run-offwater, because in the high rainfall-low evaporation climate the soils are saturated most of the time. There are few clay minerals in most soils in the west to prevent loss by leaching or to capture the relatively large inputs in the precipitation. The vegetation is awash with water and nutrients which it cannot retain. Thus, the nutrients in mineralised ash will largely be lost. The effect of gravitational loss of soil nutrients is a pervading feature of western landscapes (fig. 1). In the present fire regimes, the sedgeland community has little, if any, chance
Tasmanian vegetation - nutrients and losses due to fire 15
of succession towards forest, and the forest communities are at constant risk of sedgeland advance.
Since the incidence of natural lightning-induced fire in Tasmania is extremely low Qackson & Bowman 1982, Ingles 1985), the problems of fire incidence are human ones. With the vastly improved access to remote areas, these problems can only increase. Most of Tasmania has been burnt by extensive landscape scale wild-fire once or twice in each of the last two centuries (Marsden-Smedley 1998). Because such fires occur in extreme fire-danger conditions during periods of drought when fuels are exceptionally dry, the fires are intense and extensive. Estimates of nutrient loss in such intense fires are made in table 5. These losses added to the losses of nutrients incurred in each rotation of forest crop outweigh the likely rate of nutrient retention from precipitation and weathering. Hence, there is an economic need to conserve nutrients by reducing the incidence of wild-fire and by reducing the losses due to the deliberate use of fire. This need is over and above the need to protect our visual wilderness and the direct loss of assets in forests Qackson & Brown 1999). The widespread use of fuel-reduction burning is clearly not the answer, since this only causes further losses of nutrients and fosters changes in the vegetation towards finer fuels with vegetative reproduction. As Boerner (1982) has emphasised, the replacement of the normal shrub storeys with such pyrogenic plants leads to increasing frequency of fire and consequent decrease in soil fertility. One measure which might be taken to reduce the extent of wild-fire in Tasmania would be to maintain bands oflow fuel loads in sedgeland adjoining forests by regular patch-burning following Aboriginal traditions in conditions where the fire will not enter the scrub boundary (Nicholson 1981, Marsden-Smedley 1998).
Slash-burning of cut-over forests in regions of high PIE ratios should not be used to regenerate forest crops, in view of the potential losses by erosion and leaching inferred by the data on differences in input-output concentration of elements (table 6) in these wet environments. The need for hot slash-fire in high PIE ratio environments should be reassessed in view of the potential nutrient losses. Leaving slash to decay naturally in these wet environments does not present a fire hazard and would conserve nutrients and the understorey diversity without the risk of accidental escape of fire.
There is an obvious paucity of data on which to base an important resource industry for Tasmania. The effects of forest practices on soil fertility, plant diversity and pyrogenic developments in understorey composition need to be systematically assessed.
REFERENCES
ADAMS, M.A. & ATTIWILL, P.M., 1988: Nutrient cycling in forests of north-east Tasmania. Tasm. For. Res. Counc. Res. Rep.I.
ADAMS, M.A., ISER, J., KELEHER, A.D. & CHEAL, D.C., 1994: Nitrogen and phosphorus availability and the role of fire in heathlands. Aust. J Bot. 42: 269-281.
ASHTON, D.H., 1975: Studies on litter of Eucalyptus regnans F. Muel!. forests. Aust. J Bot. 23: 413-433.
ATTIWILL, P.M., 1980: Nutrient cycling in a Eucalyptus obliqua (L'Herit) forest IV. Nutrient uptake and nutrient return. Aust. J Bot. 28: 199-222.

16 WD. Jackson
ATTIWILL, P.M. & LEEPER, G.W., 1987: FOREST SOILS AND NUTRIENT CYCLES. Melbourne University Press, Melbourne: 202 pp.
ATTIWILL, P.M., POLGLASE, P.]., WESTON, e.J. & ADAMS, M.A., 1996: Nutrient cycling in forests of south-eastern Australia. In Attiwill, P.M. & Adams, M.A. (Eds): NUTPJTION OF EUCALYPTS. CSIRO, Melbourne: 191·-227.
AYERS, G.P. & IVEY, J.P., 1988: Precipitation composition at Cape Grim 1977-1985. Tellus 40B: 297-307.
BAKER, T.G. & ATTfWTI.L, P.M., 1985: Above-ground nutrient distribution in Pinus radiata (Don.) and Eucalyptus obliqua (L'Herit) forests in south-eastern Australia. For. Eco!' Manage. 13: 41-52.
BARKER, M., 1991: The effect of fire on west coast lowland rainforest. Tasm. Rainfor. Conserv. Prog. Tech. Rep. 7. Forestry Commission of Tasmania: Hobart
BOERNER, R.E.J., 1982: Fire and nutrient cycling in temperate ecosystems. Bioscience 32: 187-192.
BOWMAN, D.M.J.S. & JACKSON, W.D., 1981: Vegetation succession in south-west Tasmania. Search 12: 358-362.
BOWMAN, D.M.J.S., MACLEAN, AR. & CROWDEN, R.K., 1986: Vegetation - soil relations in the lowlands of south-west Tasmania. Aust. J Eco!. 11: 141-153.
BRESNEHAN, S.J., 1998: AN ASSESSMENT OF FUEL CHARACTERISTICS AND FUEL LOADS IN DRY SCLEROPHYLL FORESTS IN SOUTH-EAST TASMANIA. Report to the Tasmanian Forest Research Co unci!. Hobart, Tasmania: 90 pp.
BROWN, M.J., 1999: Buttongrass moorlands. In Reid, J.B., Hill, R.S., Brown, M.J. & Hovenden, M.J. (Eds): VEGETATION OF TASMANIA. Aust. Bio!. Resour. Stud. (Ser.: FLORA OFAUSTRALIA, Supp!. ser. 8). Canberra. Ch.13: 286-303.
BUCKNEV, R. & TYLER, P.A, 1973: Chemistry of Tasmanian inland waters. Int. rev. gesamten Hydrobiol. 58: 61-78.
CHENEY, N.P.,1981: Fire behaviour. In Gill, AB., Groves, R.H. & Noble, LR. (Eds): FIRE AND THE AUSTRLIAN BIOTA. Australian Academy of Science, Canberra: 151-176.
COLHOUN, E.A, 1985: Glaciations of the West Coast Range, Tasmania. Quat. Res. 24: 39-58.
COLHOUN, E.A, 1986: Field problems of radiocarbon dating in Tasmania. Pap. Proc. R. Soc. Tasm. 120: 1-6.
COLHOUN, E.A & VAN DE GEER, G., 1998: Pollen analysis of 0-20 m at Darwin Crater, western Tasmania, Australia. In Horie, S. (Ed.): INTERNATIONAL PROJECT ON PALAEOLIMNOLOGY AND LATE CAINOZOIC CLIMATE. IPPCE 11: 68-89.
COSGROVE, R., 1995: Late Pleistocene behavioural variation and time trends: the case from Tasmania. Archeo!. Oceania 30: 83-104.
DUNCAN, F., 1990: Eucalypts in Tasmania's changing landscape. Tasm. For. 1: 13-25.
ELLIS, R.e., 1986: The relationship between sub-alpine grassland and forest communities in northern Tasmania. In Barlow, B.A. (Ed.): FLORA AND FAUNA OF ALPINE AUSTRALIA AGES AND ORIGINS. CSIRO, Melbourne: 243-245.
ELLIS, R.e. & GRALEY, A.M., 1983: Gains and losses in soil nutrients associated with harvesting and burning eucalypt rainforest. Plant Soil 74: 437-450.
ELLIS, R.e. & GRALEY, A.M., 1987: Soil chemical properties as related to forest succession in a highland area in northeast Tasmania. Aust. J Eco!. 12: 307-317.
FELLER, M.e., 1981: Catchment nutrient budgets and geological weathering in Eucalyptus regnans ecosystems in Victoria. Aust. J Ecol. 6: 65-77.
FENSHAM, R.J., 1989: The pre-European vegetation of the Midlands Tasmania floristic and historical analysis of vegetation pattern. J Biogeogr. 16: 29-45.
FISHER, R.F. & BINKLEY, D., 2000: Fire effects. In Fisher, R.F. & Binkley, D. (Eds): ECOLOGY AND MANAGEMENT OF FOREST SOILS.]. Wiley & Sons, New York: Ch. 10: 1-15.
FITZSIMONS, S.]. & COLHOUN, E.A., 1991: Pleistocene glaciation of the King Valley, Western Tasmania, Australia. Quat. Res. 36: 135-156.
FLINN, D.W., BREN, L.J. & HOPMANS, P., 1979: Soluable nutrient inputs from rain and outputs in stream water from small forested catchments. Aust. For. 42: 39--49.
FRANKOMllE, D.W., 1966: The regeneration burn. Appita 19: 127-132
GILBERT, ].M., 1959: Forest succession in the Florentine Valley Tasmania. Pap. Proc. R. Soc. Tasm. 93: 129-151.
GUTHRIE, H.B., ATTIWILL, P.M. & LWNING, R., 1978: Nutrient cycling in a Eucalyptus obliqua (L'Herit) forest II. A study in a small catchment. Aust. J Bot. 26: 189-201.
HARWOOD, e.E., 1972: Nutrient studies in south-west Tasmanian vegetation. Unpub!. BSc Honours thesis, Dep. Botany, Univ. Tasm., Hobart.
HARWOOD, e.E. & JACKSON, W.D., 1975: Atmospheric losses of four plant nutrients during a forest fire. Aust. J For. 38: 92-99.
HILL, R.S. & READ, ]., 1984: Post-fire regeneration of rainforest and mixed forest in western Tasmania. Aust. j. Bot. 32: 481-493.
HOLLAND, P.G. & STEYN, D.G., 1975: Vegetation responses to latitudinal variations in slope angle and aspect.]. Biogeogr. 2: 179-183.
INGLES, A, 1985: FIRE. Environmental impact statement into the continuation of wood chip exports from Tasmania after 1990. Working paper 5. Gov. Printer, Hobart.
JACKSON, W.D., 1965: Vegetation. In Davies, ].R. (Ed.): ATLAS OF TASMANIA. Lands and Surveys, Hobart: 30-35.
JACKSON, W.D., 1968: Fire, air, water and earth - an elemental ecology of Tasmania. Proc. Ecol. Soc. Aust. 3: 9-16.
JACKSON, W.D., 1973: Vegetation of the Central Plateau. In Banks, M.R. (Ed.): THE LAKE COUNTRY Royal Society of Tasmania, Hobart: 61-86.
JACKSON, W.D., 1977: Nutrient cycling in Tasmanian oligotrophic environments. In PROC. SYMP. NUTRIENT CYCLING AND INDIGENOUS FOREST ECOSYSTEMS. CSIRO, Div. of Land Resource Management, Perth, WA:122-123.
JACKSON, W.D., 1981: Vegetation and fire patterned vegetation. In Jackson, W.D. (Ed.): VEGETA TION OF TASMANIA. XIII International Botanical Congress, Sydney Field Trip 28. Australian Acadademy of Science, Canberra: 1-35.
JACKSON, W.D., 1999a: Vegetation types. In Reid, J.B., Hill, R.S., Brown, M.J. & Hovenden, M.J. (Eds): VEGETATION OF TASMANIA. Aust. Bio!. Resour. Stud. (Ser.: FLORA OF AUSTRALIA, Supp!. set. 8). Canberra. Ch. 1: 1-10.
JACKSON, W.D., 1999b: The Tasmanian environment. In Reid, J.B., Hill, R.S., Brown, M.J. & Hovenden, M.J. (Eds): VEGETATION OF TASMANIA. Aust. Bio!. Resour. Stud. (Ser.: FLORA OF AUSTRALIA, Supp!. ser. 8). Canberra. Ch. 2: 1-38.
JACKSON, W.D., 1999c: Palaeohistory of vegetation change- the last 2 million years. In Reid, J.B, Hill, R.S, Brown, M.J & Hovenden, M.J (Eds.): VEGETATION OF TASMANIA. Aust. Bio!. Resour. Stud. (Ser.: FLORA OF AUSTRALIA, Supp!. ser. 8). Canberra. Ch. 4: 64-88.
JACKSON, W.D., 1999d: The Tasmanian legacy of man and fire. Pap. Proc. R. Soc. Tasm. 133: 1-14.
JACKSON, W.D. & BOWMAN, D.M.].S., 1982: Slash burning in Tasmanian dry eucalypt forests. Comment. Aust. For. 1: 63-67.
JACKSON, W.D. & BROWN, M.J., 1999: Pattern and process in vegetation. In Reid, ].B., Hill, R.S., Brown, M.J. & Hovenden,M.]. (Eds): VEGETA TION OF TASMANIA.
Aust. Bio!. Resour. Stud. (Ser.: FLORA OFAUSTRALIA, Supp!. ser. 8). Canberra. Ch.16: 357-380.
JACOBS, M.R., 1955: GROWTH HABITS OF THE EUCALYPTS. Commonwealth Gov. Printer, Canberra.
JORDAN, G.J., PATMORE, c., DUNCAN, F. & LUTTRELL, S., 1992: The effects of fire intensity on the regeneration of mixed forest species in the Clear Hill Mt Wedge area. Tasforests 4: 25-38.
KHANNA, P.K & RAISON, R.J., 1986: Effects of fire intensity on solution chemistty of surface soil Aus. j. Soil Res. 24: 423-434.
KiERNAN, K, 1989: Muliple glaciation of the upper Franklin Valley, Western Tasmania Wilderness World Heritage Area. Aust. Geogr. Stud. 27: 208-235.
KiERNAN, K, 1990: The extent of Late Cenozoic glaciation in the Central Highlands of Tasmania, Australia. Arct. Alp. Res. 22: 341-354.
KiERNAN, K & HANNAN, D., 1991: Glaciation of the upper Forth River catchment Tasmania. Aust. Geogr. Stud. 29: 155-173.
KiRKPATRICK, J.B. & DICKINSON, KJ.M., 1984a: VEGETATION MAP OF TASMANIA 1 :500,000. Forestry Commission, Hobart.
KiRKPATRICK, J.B. & DICKINSON, KJ.M., 1984b: The impact of fire on Tasmanian alpine vegetation and soils. Aust. j. Bot. 32: 613-629.
KiRKPATRICK, ].B. & HARRIS, S., 1999: Coastal heath and wetland vegetation. In Reid, J.B., Hill, R.S., Brown, M.J. & Hovenden, M.J. (Eds): VEGETATION OF TASMANIA. Aust. Bio!. Resour. Stud. (Ser.: FLORA OFAUSTRALIA, Supp!. ser. 8). Canberra. Ch. 14: 304-332.
KiRKPATRICK, J.B., BARKER, P., BROWN, M.J., HARRIs, S. & MACKIE, R., 1995: The reservation status of Tasmanian vascular plant communities. Wildl. Sci. Rep. 95/4. Parks & Wildlife Service of Tasmania, Hobart.
LING ROTH, H., 1899: THE ABORIGINES OF TASMANIA. 2nd edn. King & Sons, Halifax England.
LLOYD, P.S., 1971: Effects of fire on the chemical status of herbaceous communities of the Derbyshire Dales. j. Ecol. 59: 261-273.
LOCKETT, E. & CANDY, S.G., 1984: Growth of eucalypt regeneration established with and without slash burns in Tasmania. Aust. For. 47: 119-125.
McARTHUR,AG., 1968: The Tasmanian bushfires of 7th February 1967, and associated fire behaviour characteristics. In. CONFERENCE PAPERS, 2ND AUSTRALIAN NATIONAL CONFERENCE ON FIRE, SYDNEY AUSTRALIA. Fire Protection Association, Melbourne: 25-48.
MACLEAN, AR., 1979: Mineral nutrients in soil and vegetation of sedgeland and heathland communities in south-west Tasmania. Unpub!. BSc Hans thesis, Dep. Botany, Univ. Tasm., Hobart.
MARSDEN-SMEDLEY, J.B., 1998: Changes in southwest Tasmania fire regimes since the early 1800s. Pap. Proc. R. Soc. Tasm. 132: 15-29.
MITCHELL, A, 1962: REPORT ON SOIL CONSERVATION PROBLEMS ON THE CENTRAL PLATEAU AND SOUTH ESK RIVER CATCHMENT IN TASMANIA. Report submitted to the Standing Committee on Conservation of Natural Resources of Tasmania.
NEILSEN, W.A. & ELLIS, R.A, 1981: Slash burning on forest sites: further comments. Search 12: 9-10.
NICHOLSON, P.H., 1981: Fire and the Australian Aborigines - an enigma. In Gill, AM., Groves, R.H. & Noble, LR. (Eds): FIRE AND THE AUSTRALIAN BIOTA. Australian Academy of Science, Canberra 3: 56-76.
NOBLE, I.R. & SLATYER, R.O., 1981: Concepts and models of succession in vascular plant communities subject to recurrent fire. In Gill, AM., Groves, R.H. & Noble, LR.
Tasmanian vegetation - nutrients and losses due to fire 17
(Eds): FIRE AND AUSTRALIAN BIOTA. Australian Academy of Science, Canberra: 311-335.
NUNEZ, M., 1978: The radiation index of dryness in Tasmania. Aust. Geogr. Stud. 16: 126-135.
OLSEN, J.H., 1963: Energy storage and the balance of producers and decomposers in ecological systems. Ecology 44: 322-331.
PARKER, S.E., 1982: Nitrogen fixing non-leguminous symbiosis. Unpub!. BSc Hans thesis, Dep. Plant Science, Univ. Tasm., Hobart.
POLGLASE, P.J., ATTIWELL, P.M. & ADAMS, M.A., 1986: Immobilization of soil nitrogen following wildfire in two eucalypt forests of south-eastern Australia. Oecol. Plant. 7: 261-272.
PRYOR, L.D. 1976: THE BIOLOGY OF EUCALYPTS. Edward Arnold, London.
RAISON, R.J., 1981: More on the effects of intense fires on the long-term productivity of forest sites: reply to comments. Search 12: 10-14.
RAISON, J.R., WOODS, P.V. & KHANNA, P.K., 1983: Dynamics of fine fuels in recurrently burnt eucalypt forests. Aust. For. 46: 294-302.
RAiSON, R.J., KHANNA, P.K & WOODS, P.V., 1985a: Mechanisms of element transfer to the atmosphere during vegetation fires. Can. j. For. Res. 15: 132-140.
RAISON, R.J., KHANNA, P.K & WOODS, P.Y., 1985b: Transfer of elements to the atmosphere during low-intensity prescribed fires in three Australian subalpine eucalypt forests. Can. j. For. Res. 15: 657-664.
RAiSON, R.J., KiETH, H. & KHANNA, P.K, 1990: Effects of fire on the nutrient supplying capacity of forest soils. In Dyck, W.J. & Mees, C.A (Eds): IMPACT OF INTENSIVE HARVESTING ON FOREST SITE PRODUCTIVITY. FRI (Rotorua, N.Z.) Bull. 159: 39-54.
RAiSON, R.J., O'CONNELL, A.M., KHANNA, P.K & KEITH, H., 1993: Effects of repeated fires on nitrogen and phosphorus budgets and cycling processes in forest ecosystems. In Trabaud, L. & Prodon, R. (Eds): FIRE IN MEDITERRANEAN ECOSYSTEMS. ECSC-EEC-EAEC Brussels 5: 347-363.
REID, J.B. & POTTS, B.M., 1999: Eucalypt biology. In Reid, J.B., Hill, R.S., Brown, M.J. & Hovenden, M.J. (Eds): VEGETATION OF TASMANIA. Aust. Bio!. Resour. Stud. (Ser.: FLORA OF AUSTRALIA, Supp!. ser. 8). Canberra. Ch. 9: 198-223.
REID, J.B., HILL, R.S., BROWN, M.J. & HOVEDEN, M.J. (EDS), 1999. VEGETATION OF TASMANIA. Aust. BioI. Resour. Stud. (Ser.: FLORA OF AUSTRALIA, Suppl. ser. 8). Canberra: 441 pp.
SCOTT, P., 1956: Variability of annual rainfall in Tasmania. Pap. Proc. R. Soc. Tasm. 90: 49-57.
SEYMOUR, D.B. & CALVER, C.R., 1995: STRATOTECTONIC ELEMENTS MAP 1:5 000 000 series. Tasmania Development and Resources and Australian Geological Survey Organization, Hobart.
SPECHT, R.L., 1969: A comparison of the sclerophyllous vegetation characteristic of Mediterranean-type climate in France, California and southern Australia. Dry matter, energy and nutrient accumulation. Aust. j. Bot. 17: 293-308.
TURNBULL, C.R.A. & MADDEN, J .L., 1983: Relationship oflitterfall to basal area and climatic variables in cool temperate forests of Southern Tasmania. Aust. j. Ecol. 8: 425-431.
VITOUSEK, P.M. & MATSON, P.A, 1984: Mechanisms of nitrogen retention in forest ecosystems: a field experiment. Science 225: 51-52.
WALKER, J., RAiSON, R.J. & KHANNA, P.K, 1986: Fire. In Russell, J.S. & Isbell, R.F. (Eds): THE IMPACT OF HUMAN ACTIVITIES ON AUSTRALIAN SOILS. University of Queensland Press, Brisbane: 185-216.

18 WD. Jackson
WELLS, P. & HICKEY, ]., 1999: Wet sclerophyll, mixed and swamp forest. In Reid, J.B., Hill, R.S., Brown, M.J. & Hovenden,M.J. (Eds): VEGETATJONOFTASMANIA. Aust. Bio!. Resour. Stud. (Ser.: FLORA OF AUSTRALIA, Supp!. ser. 8). Canberra. Ch. 10: 224-243.
(accepted 17 May 2000)