Embed Size (px)
Citation preview

Nutrient limitation and interactions with
organic matter and sediments within dryland
streams of the Pilbara region of northwest
Australia
Jordan Andrew Iles
B.Sc. (Environmental Biology) University of Technology Sydney
This thesis is presented for the degree of Doctor of Philosophy
of The University of Western Australia
School of Biological Sciences
2019

ii
THESIS DECLARATION
I, Jordan Andrew Iles, certify that:
This thesis has been substantially accomplished during enrolment in the
degree.
This thesis does not contain material which has been submitted for the award
of any other degree or diploma in my name, in any university or other tertiary
institution.
No part of this work will, in the future, be used in a submission in my name,
for any other degree or diploma in any university or other tertiary institution
without the prior approval of The University of Western Australia and where
applicable, any partner institution responsible for the joint-award of this
degree.
This thesis does not contain any material previously published or written by
another person, except where due reference has been made in the text and,
where relevant, in the Declaration that follows.
The work(s) are not in any way a violation or infringement of any copyright,
trademark, patent, or other rights whatsoever of any person.
This thesis does not contain work that I have published, nor work under
review for publication.
Signature:
Date: 31th
August 2018

iii
ABSTRACT
This thesis seeks to increase understanding of the ecological functioning of
ephemeral streams of the arid Pilbara region of northwest Australia. In this sub-
tropical region, nutrient and organic matter dynamics are closely coupled to the
highly episodic flows generated by cyclonic recharge, which are in turn punctuated
by prolonged periods of drought. Flood events redistribute nutrients and organic
matter throughout the catchment and into streams, but these events tend to be
irregular in occurrence as well as short-lived. Hence, the typical state of surface
water of these streams for the majority of the year – and sometimes for multiple
consecutive years – are as contracted and isolated pools. The nutrient status and
metabolism of Pilbara streams are thus likely to be strongly influenced by both
evaporative loss and groundwater connectivity of individual pools. In this thesis, I
investigated: i) patterns in biogeochemical processes in pools of varying hydrologic
connectivity across one of the largest river catchments in the Pilbara; ii) phosphorus
adsorption and desorption characteristics of stream sediments and how organic
matter interacts with sorption processes; and iii) ecosystem metabolism and the
response of phytoplankton, periphyton, and charophytes to increased nutrient
availability in persistent versus more ephemeral pools.
My analysis of the biogeochemical nature of surface waters suggests that the
intermittent and ephemeral streams within the Fortescue River catchment can be split
into three broad groups; spring-fed streams, streams with connectivity to alluvial
water, and ephemeral streams disconnected from alluvial water. I observed that
nutrient concentrations, water isotope composition, as well as dissolved organic

iv
matter (DOM) concentration and composition were strongly differentiated between
the upper and lower sub-catchments of the Fortescue River. I thus sought to explore
further some of the longitudinal in-stream processes that affect the biogeochemistry
of ephemeral and intermittent streams, particularly in the confined upper gorges,
where many streams are dominated by iron-rich sediments but may also contain
considerable amounts of calcrete.
Preliminary observations indicated that these streams act as a sink for allochthonous
organic matter due to the accumulations of leaf litter within the pools. Leaching of
this material in situ contributes to the total loading of dissolved organic matter
(DOM) in the system, with a presumed concentration of DOM compounds occurring
at the litter-sediment-water interface. In order to understand the mechanisms that
might explain the low concentrations of phosphorus (P) in the water column, I
investigated interactions between inorganic phosphate, dissolved organic matter
(DOM) and iron-rich stream sediments (hematite and goethite 39-50%) by
characterising adsorption-desorption kinetics. Sediment adsorption of P closely
follows Freundlich and Langmuir isotherm models with Langmuir P sorption
maxima ranging from 0.106 to 0.152 mg g-1
. P sorption characteristics did not differ
among pools of contrasting hydrological connectivity but were altered by DOM
additions. While moderate DOM additions (~5 mg L-1
DOC) from leaf litter
leachates reduced sediment P adsorption capacity, more concentrated additions (~50
mg L-1
DOC) likely saturated sediment surface adsorption sites and produced P-OM-
Fe complexes, resulting in removal of phosphate from solution. There was a
preferential sorption of high spectral slope OM to sediments when phosphate was at
negligible to low concentrations. Increasing the concentration of DOM in solution

v
also increased the amount of P initially desorbed from sediment. These findings
reveal that interactions of phosphates with organic matter inputs, often from
allochthonous sources, may be important in regulating nutrient availability in both
ephemeral and persistent pools by reducing the adsorption capacity of sediments and
releasing Fe-bound phosphate from sediment sinks.
Given the high sorption capacity of sediments as well as low nutrient content of soils
in the surrounding catchments, I sought to better understand whether nitrogen (N), P
or both were most limiting to within pool productivity and whether responsiveness to
nutrient-additions differed between persistent versus more ephemeral pools. I used 6
h in-situ bottle incubations with a 13
C-enriched NaHCO3 isotopic tracer to measure
rates of charophyte and phytoplankton production in response to nutrient
amendments. I hypothesised that autochthonous production is greater in pools that
become disconnected from groundwater owing to increased concentration of
nutrients as a consequence of evaporation processes compared to pools that remain
connected to alluvial groundwater. Charophyte production was ~2 mg C g-1
DW h-1
regardless of hydrologic status, and order of magnitude greater than phytoplankton
production (~0.01 mg C g-1
DW h-1
). While charophyte productivity was not
significantly increased with either N or P addition, productivity was nevertheless
positively correlated to both charophyte N (R2 = 0.65, p < 0.001) and P tissue content
(R2 = 0.41, p < 0.001). Overall, these findings suggest that P may be more limiting
over longer periods to pool productivity in the Pilbara.
Finally, I investigated if and how periphyton community structure is affected by
increased availability of N and/or P. Given the limited short term responsiveness to

vi
nutrient additions observed in the 13
C-labelling experiment, I paired a 28 day nutrient
limitation experiment using diffusing substrates with photo- and accessory-pigment
analysis to: i) identify which nutrient(s) most limit periphyton production; and ii)
assess if particular components of the periphyton community respond in different
ways to N and P or both. I found that periphyton communities in both persistent and
ephemeral pools were co-limited by N and P availability, which interacted
synergistically. Nitrogen additions caused the periphyton to shift from a diatom-
dominated to chlorophyte-dominated community structure. In contrast, P additions
reduced diatom biomass, and in ‘ephemeral’ pools also promoted dinoflagellate
growth. These findings, together with observations of charophyte and phytoplankton
responses, suggest that autotrophic production is likely co-limited by both N and P.
Community structure within pools, particularly of the periphyton, is also likely to be
vulnerable to shifts in nutrient availability in and around pools, which may arise
seasonally owing to pool contraction during drought or due to impacts of, for
example, livestock activity.
Overall, the findings of the research presented in this thesis demonstrate that
interactions between organic matter and nutrients are important in regulating nutrient
availability in the pools of Pilbara streams. Further, altered nutrient loads and/or
hydrology due to land use change and shifting climate patterns may have significant
but as yet poorly understood impacts on the ecological functioning of intermittent
streams.

vii
TABLE OF CONTENTS
Thesis Declaration ............................................................................................................. ii
Abstract ............................................................................................................................. iii
Table of Contents ............................................................................................................ vii
List of Tables .................................................................................................................... xi
List of Figures ................................................................................................................. xiii
Acknowledgements ........................................................................................................... xx
Authorship Declaration: Co-Authored Publications ................................................. xxii
1. General Introduction .................................................................................................. 1
1.1. Hydrological characteristics of intermittent and ephemeral streams in hot
arid environments ............................................................................................................. 4
1.2. Processes underpinning nutrient dynamics in intermittent and ephemeral
streams .............................................................................................................................. 8
1.3. Nutrient limitation of metabolic processes in intermittent and ephemeral
streams of hot, arid regions ............................................................................................ 11
1.4. Objectives and organisation of this thesis ........................................................... 13
2. Overview of dryland stream hydrochemistry in the Fortescue River
catchment .......................................................................................................................... 15
2.1. Introduction ......................................................................................................... 15
2.2. Methods ............................................................................................................... 17
2.2.1. Study region and sampling ........................................................................... 17
2.2.2. Stable isotope, carbon, and nutrient analysis .............................................. 24
2.2.3. Data analysis ................................................................................................ 25
2.3. Results ................................................................................................................. 26
2.3.1. Variability in hydrochemistry of surface water across the catchment ......... 26
2.3.2. How is stream nutrient availability linked to hydrology across the
catchment? .................................................................................................................. 34
2.4. Discussion ........................................................................................................... 37
2.4.1. Longitudinal gradients ................................................................................. 37
2.4.2. Evaporative loss drives stream hydrochemistry .......................................... 39
3. Phosphorus sorption and dissolved organic matter interactions in iron-rich
stream sediments .............................................................................................................. 43

viii
3.1. Introduction ......................................................................................................... 43
3.2. Methods ............................................................................................................... 47
3.2.1. Study site and sampling ............................................................................... 47
3.2.2. Sediment mineralogy and elemental chemistry............................................ 49
3.2.3. Phosphorus sorption characteristics ........................................................... 50
3.2.4. Data analyses ............................................................................................... 53
3.3. Results ................................................................................................................. 54
3.3.1. Sediment properties ..................................................................................... 54
3.3.2. DOM properties of litter leachates .............................................................. 59
3.3.3. Phosphorus sorption characteristics ........................................................... 59
3.3.4. Desorption of P from iron-rich sediments ................................................... 61
3.3.5. Changes in DOM composition with incubation and P adsorption .............. 62
3.4. Discussion ........................................................................................................... 67
3.4.1. DOM composition is influenced by the presence of excess P ...................... 68
3.4.2. Surface/alluvial hydrodynamics do not control sediment P sorption at
the pool scale .............................................................................................................. 69
4. Does low phosphorus limit the short-term metabolic response of
phytoplankton and charophytes of instream pools on an intermittent dryland
stream? .............................................................................................................................. 73
4.1. Introduction ......................................................................................................... 73
4.2. Methods ............................................................................................................... 77
4.2.1. Site description............................................................................................. 77
4.2.2. Pool water physicochemistry of persistent and ephemeral pools ................ 77
4.2.3. Estimation of net ecosystem production ...................................................... 78
4.2.4. Nutrient limitation experiments ................................................................... 78
4.2.5. Laboratory analyses of N, P and carbon ..................................................... 80
4.2.6. Stable isotope analysis of plant tissues, filters and water samples.............. 81
4.2.7. Calculation of productivity based on uptake of 13
CDIC ................................ 82
4.2.8. Data analyses ............................................................................................... 83
4.3. Results ................................................................................................................. 85
4.3.1. Pool hydrology and water chemistry ........................................................... 85
4.3.2. Ecosystem metabolism ................................................................................. 86
4.3.3. 13
C enrichment due to photosynthetic uptake of 13
C-enriched HCO3 .......... 88

ix
4.3.4. Short-term metabolic response of phytoplankton and charophytes to
nutrient enrichment ..................................................................................................... 89
4.4. Discussion ........................................................................................................... 91
5. Chemotaxonomic responses of autotrophic periphyton communities to
nutrient additions in an intermittent stream ................................................................. 97
5.1. Introduction ......................................................................................................... 97
5.2. Methods ............................................................................................................. 100
5.2.1. Site description ........................................................................................... 100
5.2.2. Nutrient limitation experiments.................................................................. 101
5.2.3. HPLC Pigment analysis ............................................................................. 102
5.2.4. Pool hydrochemistry .................................................................................. 103
5.2.5. Data analyses ............................................................................................. 105
5.3. Results ............................................................................................................... 106
5.3.1. Pool nutrients and hydrologic characteristics ........................................... 106
5.3.2. Periphyton biomass response to nutrient additions ................................... 106
5.3.3. Chemotaxanomic response of autotrophic periphyton .............................. 110
5.4. Discussion ......................................................................................................... 117
6. General discussion .................................................................................................. 120
6.1. Overview ........................................................................................................... 120
6.2. Alluvial groundwater connectivity influences stream biogeochemistry and
metabolism ................................................................................................................... 120
6.3. Sediment mineralogy constrains within-stream nutrient bioavailability ........... 123
6.4. Complex responses of aquatic primary productivity to perturbations in
nutrient status in dryland streams ................................................................................. 126
6.5. Implications from this research to understanding responses of stream
ecosystems in northwest Australia to changing land use and climate ......................... 128
6.6. Conclusion ......................................................................................................... 131
7. Appendix 1 - Pilot study investigating the suitability of 31
P-nmr for the
characterisation of organic phosphorus in iron-rich Pilbara stream sediments ...... 133
7.1. Methods ............................................................................................................. 133
7.1.1. Sample pre-treatment ................................................................................. 133
7.1.2. Sediment chemistry..................................................................................... 134
7.1.3. 31
P-nmr experiment .................................................................................... 134
7.2. Results ............................................................................................................... 136

x
7.2.1. Sediment and extract chemistry ................................................................. 136
7.2.2. 31P-nmr spectra......................................................................................... 137
7.2.3. Comments on method suitability ................................................................ 137
8. Appendix 2 – Two-way ANOVA ........................................................................... 139
References ....................................................................................................................... 140

xi
LIST OF TABLES
Table 2.1 Surface water sampling sites across the Fortescue River catchment,
Northwest Australia. ...................................................................................... 19
Table 3.1 Chemical characteristics of sediments collected from Coondiner Creek.
Electrical conductivity (EC) and pH were measured in a 1:10 (w/v) soil-
solution. Bulk sediment samples from each pool were air-dried prior to
chemical analysis. .......................................................................................... 56
Table 3.2 Freundlich and Langmuir model parameters fitted to experimental
adsorption isotherms. KF: Freundlich adsorption energy constant, n:
Freundlich correction factor, KL: Langmuir isotherm constant (L mg-1
), b:
Langmuir maximum adsorption capacity (mg g-1
). Mean values with standard
deviation in parenthesis (n = 3). Model fits were compared using adjusted-R2,
and residual sum of squares (RSS)................................................................. 58
Table 4.1 Ambient dissolved nitrate/nitrite (NOx), ammonium (NH4), and soluble
reactive phosphorus (SRP) concentrations of stream water at each pool. N:P
ratios calculated as the ratio between DIN and SRP where DIN = NOx + NH4.
Values given are means and standard deviation (n = 3). Ambient dissolved
inorganic carbon (DIC) concentration and its carbon isotope ratio (δ13
CDIC)
are also given.................................................................................................. 79
Table 4.2 C:N:P stoichiometry of pool water, charophytes and phytoplankton. ...... 84
Table 5.1 Characteristics of study pools along Coondiner Creek at initial and final
period of periphyton incubation. Total dissolved nitrogen (TDN), soluble
reactive phosphorus (SRP), dissolved organic carbon (DOC), specific
absorbance at 254nm (SUVA254), dissolved inorganic carbon (DIC), stable
xii
isotopes of filtered water samples (δ13
CDIC, δ2H, and δ
18O), and pool
evaporative loss (f). ...................................................................................... 109
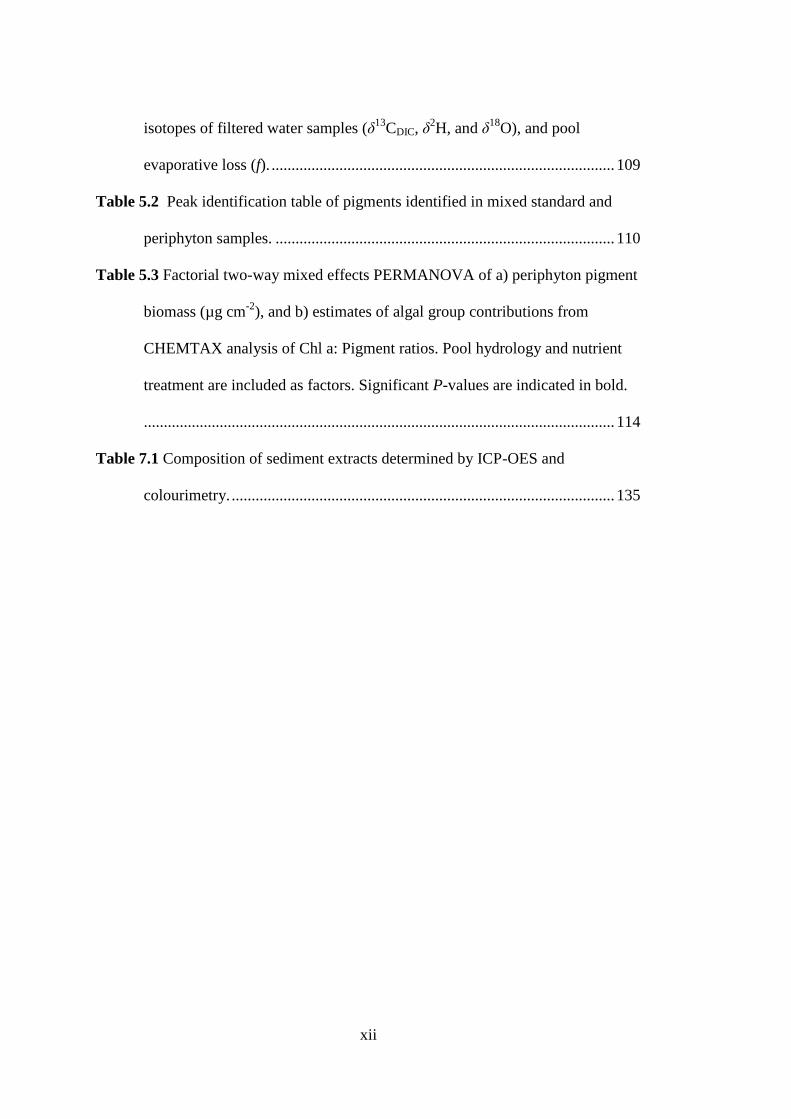
Table 5.2 Peak identification table of pigments identified in mixed standard and
periphyton samples. ..................................................................................... 110
Table 5.3 Factorial two-way mixed effects PERMANOVA of a) periphyton pigment
biomass (µg cm-2
), and b) estimates of algal group contributions from
CHEMTAX analysis of Chl a: Pigment ratios. Pool hydrology and nutrient
treatment are included as factors. Significant P-values are indicated in bold.
...................................................................................................................... 114
Table 7.1 Composition of sediment extracts determined by ICP-OES and
colourimetry. ................................................................................................ 135

xiii
LIST OF FIGURES
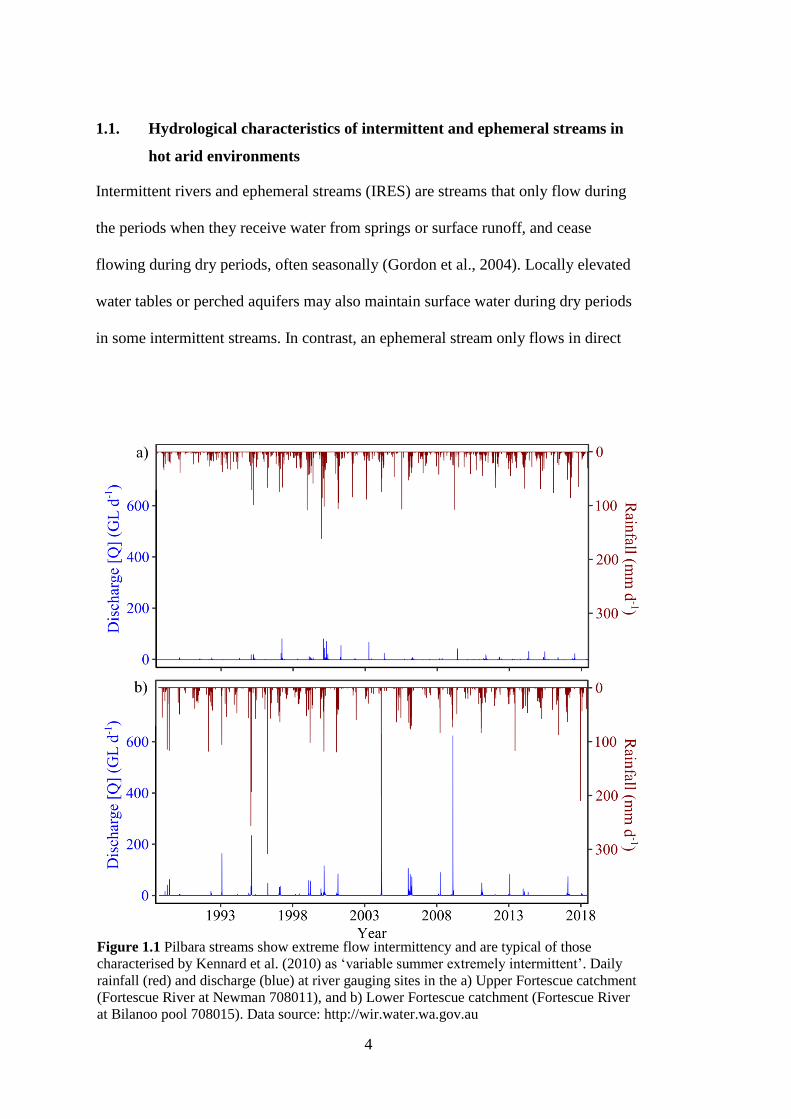
Figure 1.1 Pilbara streams show extreme flow intermittency and are typical of those
characterised by Kennard et al. (2010) as ‘variable summer extremely
intermittent’. Daily rainfall (red) and discharge (blue) at river gauging sites in
the a) Upper Fortescue catchment (Fortescue River at Newman 708011), and
b) Lower Fortescue catchment (Fortescue River at Bilanoo pool 708015).
Data source: http://wir.water.wa.gov.au .......................................................... 4
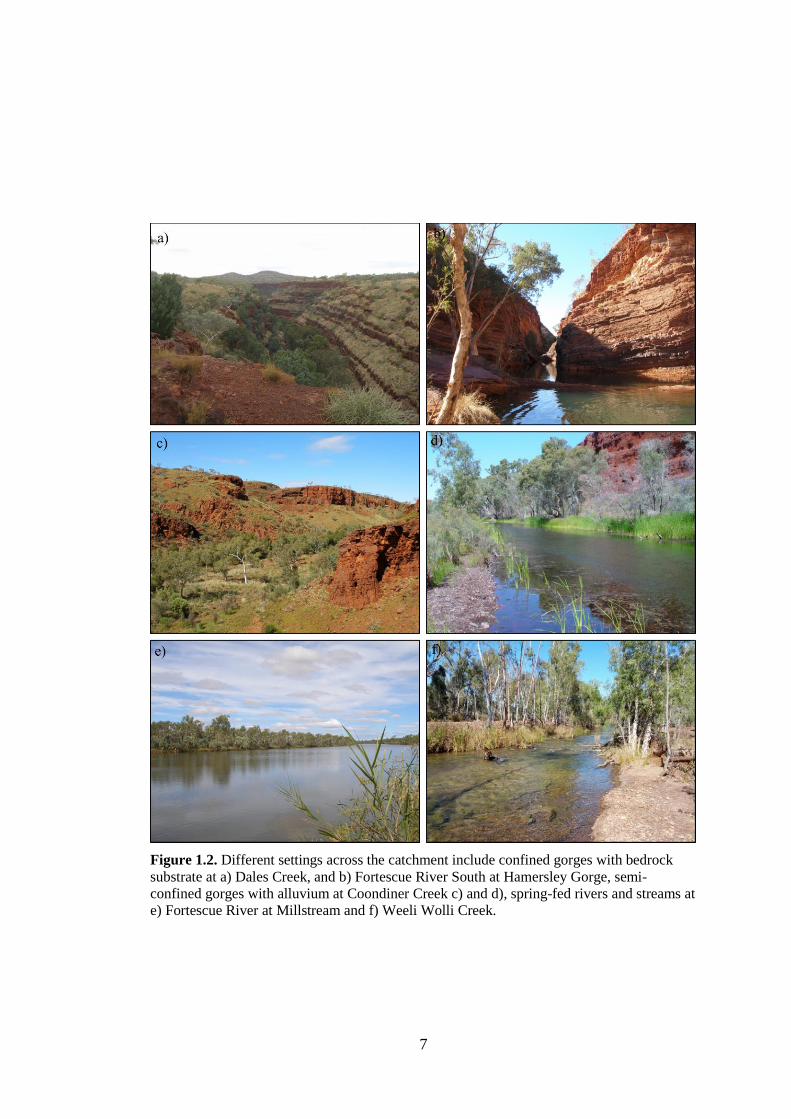
Figure 1.2. Different settings across the catchment include confined gorges with
bedrock substrate at a) Dales Creek, and b) Fortescue River South at
Hamersley Gorge, semi-confined gorges with alluvium at Coondiner Creek c)
and d), spring-fed rivers and streams at e) Fortescue River at Millstream and
f) Weeli Wolli Creek. ....................................................................................... 7
Figure 2.1 a) The Fortescue river catchment of, northwest Australia. b) Location of
sampling sites across the Fortescue River catchment, northwest Australia. c)
Lower and Upper Fortescue River sub-catchments. ...................................... 18
Figure 2.2 a) Stable isotope composition of perennial (red) and intermittent (yellow)
stream waters, located in Lower (□) and Upper (○) catchment positions in the
Fortescue River catchment, northwest Australia. Also shown are rainwater
(+) and groundwater () samples collected from the region at the time of this
study. The local evaporation line (LEL) was calculated from 55 surface water
samples whilst the local meteoric water line (LMWL) was sourced from
Dogramaci et al. (2012). b) Relationship between the distance from river
mouth and stable hydrogen (δ2H) and c) oxygen (δ
18O) isotopes of water. .. 28

xiv
Figure 2.3 Relationship between the distance from river mouth and total dissolved
nitrogen (TDN), soluble reactive phosphorus (SRP), N:P ratio, dissolved
organic carbon (DOC), dissolved inorganic carbon (DIC), and the stable
isotope composition of dissolved inorganic carbon (δ13
CDIC). Shaded fill
denote perennial (red) and intermittent (yellow) stream waters, symbols
denotes Lower (□) and Upper (○) catchment position (n = 55). .................... 31
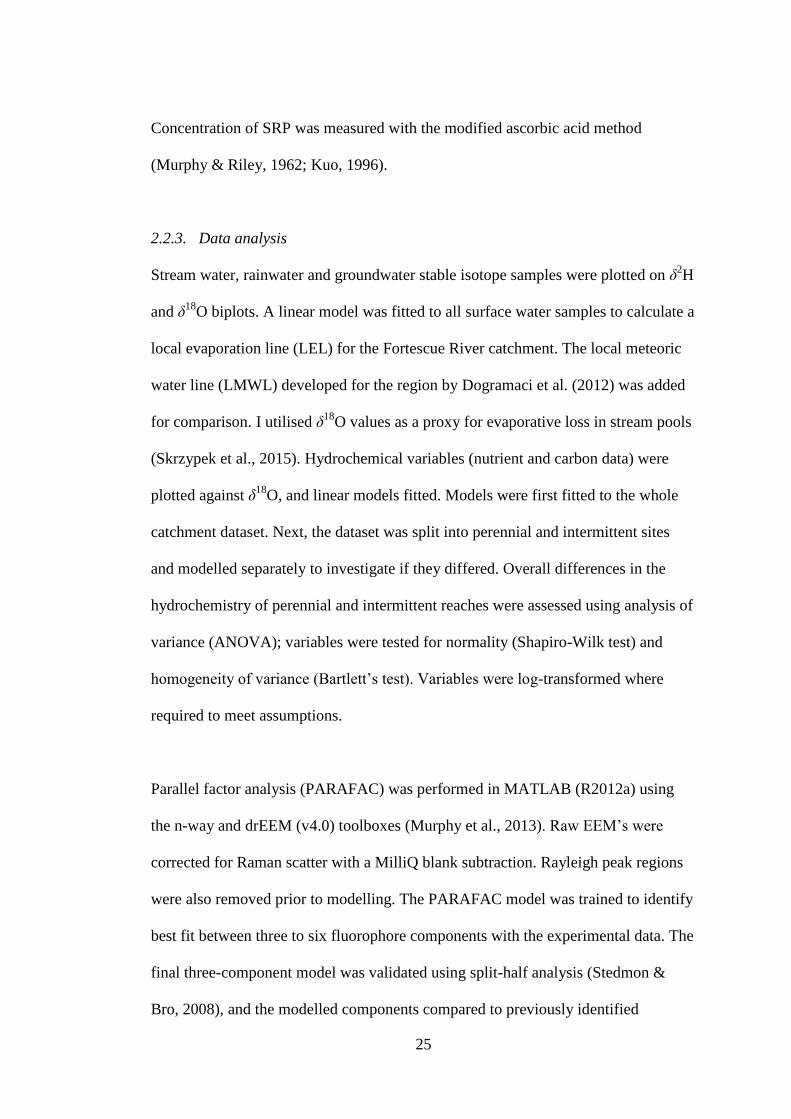
Figure 2.4 a) Excitation-emission spectra of the three modelled components from
PARAFAC analysis. b) Spectral loadings for excitation (red dash) and
emission (blue line) wavelengths for each component. Components 1 and 2
are humic-like, Component 3 is protein-like tyrosine. c) Relationship
between the stable isotope composition of water (δ18
O) and dissolved organic
matter components. Shaded fill denote perennial (red) and intermittent
(yellow) stream waters, symbols denotes Lower (□) and Upper (○) catchment
position (n = 55). ............................................................................................ 33
Figure 2.5 Principal component analysis of hydrochemical parameters of perennial
(red) and intermittent (yellow) stream waters, symbols denotes Lower (□)
and Upper (○) catchment position (n = 55). The first two axis of the PCA
explains 50.5 % of the total variance. Water stable isotopes δ2H, δ
18O and
δ13
C-DIC contribute consistently to PC1, dissolved organic matter
components C1, C2, and contribute to PC2. .................................................. 34
Figure 2.6 Relationship between the stable isotope composition of water (δ18
O) and
total dissolved nitrogen (TDN), soluble reactive phosphorus (SRP), N:P ratio,
dissolved organic carbon (DOC), dissolved inorganic carbon (DIC), and the
stable isotope composition of dissolved inorganic carbon (δ13
CDIC). Shaded

xv
fill denote perennial (red) and intermittent (yellow) stream waters, symbols
denotes Lower (□) and Upper (○) catchment position (n = 55). .................... 36
Figure 3.1 a) The Fortescue river catchment (solid fill) of the semi-arid Pilbara
region (hatching), northwest Australia. b) Location of Coondiner Creek in the
Upper Fortescue River catchment, c) ‘persistent’ (black squares) and
‘ephemeral’ (grey circles) pools sampled along Coondiner Creek. ............... 48
Figure 3.2 Non-metric multidimensional scaling (nMDS) plots of a) elemental
composition of sediments from XRF, and b) mineralogy of sediments from
XRD for ‘persistent’ (black squares) and ‘ephemeral’ (grey circles) pools of
Coondiner Creek. Data were normalised prior to scaling. ............................. 54
Figure 3.3 Fluorescent DOM components derived from fluorescence spectroscopy
and PARAFAC analysis. a) Modelled excitation-emission spectra of humic-
like components 1 and 2, protein-like component 3, and unknown component
4. b) Excitation (red dash) and emission (blue line) spectral loading of each
corresponding component. ............................................................................. 57
Figure 3.4 Experimental data from batch phosphorus adsorption experiments fitted
to Freundlich (solid line) and Langmuir (dash) isotherms. Mean adsorption
(qe) and standard error (n = 3) for sediments from ‘persistent’ (black square)
and ‘ephemeral’ (grey circle) pools versus equilibrium P concentration (Ce)
shown. ............................................................................................................ 60
Figure 3.5 Phosphorus adsorption (Pads) versus desorption (Pdes) patterns of
Pilbara sediments. Values shown are means with standard error (n = 3) of
sediments from ‘persistent’ (black square) and ‘ephemeral’ (grey circle)
pools. .............................................................................................................. 61

xvi
Figure 3.6 Dissolved organic carbon (DOC), C:N ratio, and Specific UV absorbance
at 254 nm (SUVA254), at the conclusion of batch phosphorus adsorption
experiments. Values shown are means with standard error (n = 3) for
sediments from ‘persistent’ (black square) and ‘ephemeral’ (grey circle)
pools. Note different scales on y-axis between DOC panels. ........................ 63
Figure 3.7 UV-vis and fluorescence indices measured at the conclusion of batch
phosphorus adsorption experiments. Spectral slope (S275-295) and humification
index (HIX) values are presented as means with standard error (n = 3) for
sediments from ‘persistent’ (black square) and ‘ephemeral’ (grey circle)
pools. .............................................................................................................. 65
Figure 3.8 Fluorescence maxima (Fmax) for PARAFAC derived DOM components at
the end of 24 h batch phosphorus adsorption experiments for sediments from
‘persistent’ (black) and ‘ephemeral’ (grey) pools. X-axis indicates the initial
P concentration (Ci) in batch experiments and y-axis indicates fluorescence
maxima (Fmax) of DOM components. Components 1 and 2 are humic-like
fluorophores, component 3 is protein-like (amino acids), whilst component 4
is thought to be a sediment derived OM degradation product. Values are
given as mean and standard error (n = 3). ...................................................... 66
Figure 4.1 PCA ordination diagram of ‘persistent’ (black squares) and ‘ephemeral’
(grey circles) pools of Coondiner Creek and environmental variables. Cond:
Electrical conductivity , TSS: total suspended solids, TDN: total dissolved
nitrogen, δ2H: water stable isotope deuterium, DIC: dissolved inorganic
carbon, 13C-DIC: δ13
CDIC, DOC: dissolved organic carbon, DO(avg): average
dissolved oxygen, DO(range): dissolved oxygen range, NH4: ammonium,
Temp(avg): average water temperature, Temp(range): Water temperature range,

xvii
NOx: nitrate/nitrite, SRP: soluble reactive phosphorus, Chl a: Chlorophyll a
........................................................................................................................ 85
Figure 4.2 Diel dissolved oxygen curves for stream pools along Coondiner Creek.
Values for gross primary productivity (g O2 m-3
d-1
) (GPP), community
respiration (CR24), net ecosystem production (NEP), and GPP:CR ratio are
given on the figure for each pool. Grey and light shading indicate night and
day periods. Boxed areas signify time envelope for bottle assays. ................ 87
Figure 4.3 Carbon stable isotope ratios of phytoplankton under light/dark conditions
incubated in situ with and without 13C-enriched HCO3 added. Bars are
means and error bars indicate standard error (n = 3). .................................... 89
Figure 4.4 Short-term productivity response of charophytes and phytoplankton to
nutrient additions in ‘persistent’ and ‘ephemeral’ pools estimated as rate of
13C-enriched HCO3 uptake. Bars are means and error bars indicate standard
error (n = 3). ................................................................................................... 90
Figure 4.5 Relationship between the rate of production and tissue content in
charophytes at the end of the incubation experiment. Charophyte content of
a) nitrogen, (%) b) phosphorus, and c) nitrogen:phosphorus (N:P) ratio....... 91
Figure 5.1 Periphyton chlorophyll a response to nutrient additions in ‘persistent’ and
‘ephemeral’ pools. Nutrients added to substrates were nitrogen (N) as
NH4NO3, phosphorus (P) as KH2PO4, and nitrogen + phosphorus (NP). The
control (C) received no nutrient additions. The experiment was duplicated
with ‘grazed’ and ‘ungrazed’ NDS treatments............................................. 108
Figure 5.2 HPLC chromatograms showing a) standard pigment mix, peak numbers
correspond with those in Table 5.2, and b) a typical HPLC chromatogram
from a persistent pool showing control (black), nitrogen (red), phosphorus
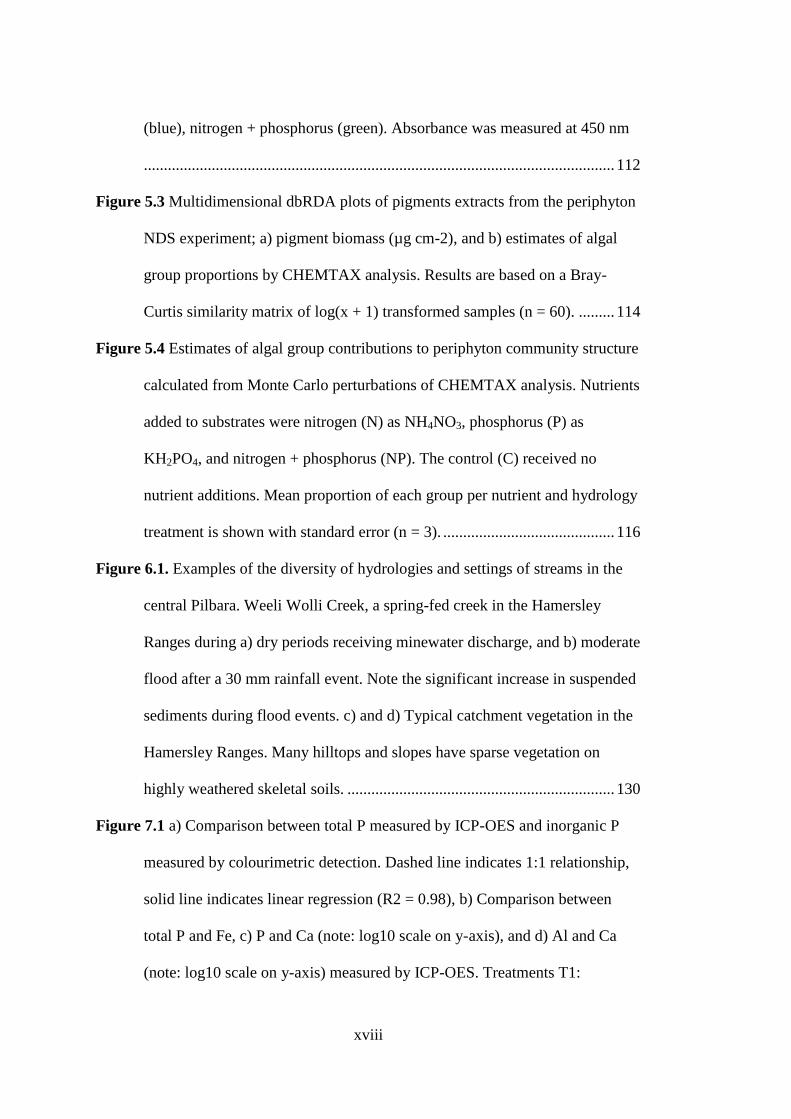
xviii
(blue), nitrogen + phosphorus (green). Absorbance was measured at 450 nm
...................................................................................................................... 112
Figure 5.3 Multidimensional dbRDA plots of pigments extracts from the periphyton
NDS experiment; a) pigment biomass (µg cm-2), and b) estimates of algal
group proportions by CHEMTAX analysis. Results are based on a Bray-
Curtis similarity matrix of log(x + 1) transformed samples (n = 60). ......... 114
Figure 5.4 Estimates of algal group contributions to periphyton community structure
calculated from Monte Carlo perturbations of CHEMTAX analysis. Nutrients
added to substrates were nitrogen (N) as NH4NO3, phosphorus (P) as
KH2PO4, and nitrogen + phosphorus (NP). The control (C) received no
nutrient additions. Mean proportion of each group per nutrient and hydrology
treatment is shown with standard error (n = 3). ........................................... 116
Figure 6.1. Examples of the diversity of hydrologies and settings of streams in the
central Pilbara. Weeli Wolli Creek, a spring-fed creek in the Hamersley
Ranges during a) dry periods receiving minewater discharge, and b) moderate
flood after a 30 mm rainfall event. Note the significant increase in suspended
sediments during flood events. c) and d) Typical catchment vegetation in the
Hamersley Ranges. Many hilltops and slopes have sparse vegetation on
highly weathered skeletal soils. ................................................................... 130
Figure 7.1 a) Comparison between total P measured by ICP-OES and inorganic P
measured by colourimetric detection. Dashed line indicates 1:1 relationship,
solid line indicates linear regression (R2 = 0.98), b) Comparison between
total P and Fe, c) P and Ca (note: log10 scale on y-axis), and d) Al and Ca
(note: log10 scale on y-axis) measured by ICP-OES. Treatments T1:

xix
NaOH+EDTA, T2: dithionite before, T3: dithionite before and after, see
methods for detail. ........................................................................................ 136
Figure 7.2 Solution 31
P-nmr spectra of NaOH-EDTA soil extract from Window pool
(WINA-t1), Coondiner creek. Prepared on a) Brucker 500 in a 10 mm tube,
and b) Brucker 600 in a 5 mm tube. The vertical scale has been exaggerated
10x on the upper trace to delineate individual peaks. .................................. 137
xx
ACKNOWLEDGEMENTS
This research was supported by an Australian Government Research Training
Program (RTP) Scholarship at The University of Western Australia and a
RangelandsNRM Pilbara Corridors Biodiversity Scholarship. The School of
Biological Sciences (formerly School of Plant Biology) provided me with a
computer and some travel support during my candidature. Financial contributions to
fieldwork and laboratory expenses were provided by Australian Research Council
Linkage Grant LP120200002 (Grierson et al.) in collaboration with Rio Tinto, and
via funding from Pilbara Corridors (RangelandsNRM). Thank you to the Australian
Freshwater Science Society (formerly ASL) for providing a student travel grant
during my candidature.
My supervisors were Dr Pauline Grierson, Dr Neil Pettit and Prof Peter Davies. I
would especially like to thank Pauline and Neil for their instrumental guidance and
feedback throughout this research journey. I am immensely grateful for your time
over the past five years. Thanks also to Pauline and Neil’s partners, J.T. and Anne,
for accommodating me during visits to Perth and Albany.
A large consortium of scientists from a number of agencies has been involved in
making this research project happen. Thank you to Dr Michael Donn for your
support and providing access to analytical instrumentation at CSIRO Land and
Water (Chapters 2 & 3). Thanks also to Dr Grzegorz Skrzypek for advice on water
isotopes and understanding evaporative loss. Ian Cotton, Theresa Belcher, and Bill
Crotching organised a number of regional workshops with RangelandsNRM.
Shawan Dogramaci, Sam Luccitti, and Naoko Zwingmann from Rio Tinto Iron Ore
gave logistical support along with XRD/XRF analysis of sediment samples in
Chapter 3. Neil Brougham and Dan Petersen of the WA Department of Parks and
Wildlife accommodated us and gave regional advice whilst in the field. Kate Bowler,
Doug Ford, and Ela Skrzypek of the West Australian Biogeochemistry Centre at
UWA provided stable isotope and nutrient analysis. Greg Cawthray (UWA) gave
critical technical advice with HPLC analysis for Chapter 5. Sara Lock, Samantha

xxi
Lostrom, Dr Jennifer Kelley, Dr Renee Gruber, Doug Ford, Dr Andre Siebers, Neil,
and Pauline gave assistance in the field.
Thank you to current and past members of the Ecosystems Research Group at UWA
who have lent a hand, given advice, been a soundboard, and provided a fun and
nurturing work environment: Dr Alison O’Donnell, Dr Gerald Page, Dr Alex
Rouillard, Dr Andre Siebers, Dr Tegan Davies, Dr Rachel Argus, Doug Ford,
Belinda Martin, Caroline Mather, Hannah Etchells, Jen Middleton, and Josh Oliver.
Thank you to the TropWater group at JCU who welcomed me and provided office
space and IT support during my final write-up. Special thanks to my trusty bicycle
for insistently reminding me no matter how long, steep or daunting, a hill is always
worth climbing at the very least for the perspective from the top, and the thrill of the
descent down the other side.
This project would not have been completed without the support and love of the
people close to me who I am thankful to call family and friends. My Iles and Gruber
families have been a constant source of motivation. Special shout-out to Micha
Campbell, Dr Lies Notebaert, Dr Stijn Masschelein, Dr Patrick Clarke, Dr James
Hitchcock, Nina Gallo, Mark Hamilton, Sam Vinton-Boot, and Freo bicycle riding
buddies: especially Zoe, Paul, Amy, Nick, Tim, Nate, Kiera, and Heath.
And finally, Renee, my love and my partner in all adventures great and small. Your
encouragement and unwavering belief in me was instrumental in completing this
task. Thank you for sharing the bumps and supporting me through this research
journey. So, what's next?

xxii
AUTHORSHIP DECLARATION: CO-AUTHORED PUBLICATIONS
This thesis contains work that has been prepared for publication. This thesis does not
contain work that I have previously published, nor work under review for publication
at the time of thesis submission.
Details of the work:
Iles, J.A., Skrzypek, G., Pettit, N.E., Grierson, P.F. (in prep) Hydrochemistry of
dryland streams in an arid-zone catchment
Location in thesis:
Chapter 2 – Overview of dryland stream hydrochemistry in the Fortescue River
catchment
Student contribution to work:
JAI contributed to study design, undertook all experimental work, analysed the data,
and wrote the manuscript. GS contributed to isotope analysis and interpreting results.
NEP contributed to study design and assisted with interpreting results. PFG
contributed to study design and assisted with interpreting results. PFG and NEP
commented on the manuscript.

xxiii
Details of the work:
Iles, J.A., Donn, M.J., Pettit, N.E., Grierson, P.F. (in prep) Phosphorus sorption and
dissolved organic matter interactions in iron-rich stream sediments
Location in thesis:
Chapter 3 – Phosphorus sorption and dissolved organic matter interactions in iron-
rich stream sediments
Student contribution to work:
JAI contributed to study design, undertook all experimental work, analysed the data,
and wrote the manuscript. MJD assisted with sample analysis and interpreting
results. NEP contributed to study design and assisted with interpreting results. PFG
helped conceptualise the study and contributed to study design and assisted with
interpreting results. PFG and NEP commented on the manuscript.
Details of the work:
Iles, J.A., Pettit, N.E., Grierson, P.F. (in prep) Does low phosphorus limit the short-
term metabolic response of phytoplankton and charophytes in an intermittent dryland
stream?
Location in thesis:
Chapter 4 – Does low phosphorus limit the short-term metabolic response of
phytoplankton and charophytes in an intermittent dryland stream?
Student contribution to work:
JAI contributed to study design, undertook all experimental work, analysed the data,
and wrote the manuscript. NEP and PFG contributed to study design and assisted
with interpreting results. PFG and NEP commented on the manuscript.

xxiv
Details of the work:
Iles, J.A., Cawthray, G.R., Pettit, N.E., Grierson, P.F. (in prep) Chemotaxonomic
responses of autotrophic periphyton communities to nutrient additions in an
oligotrophic intermittent stream
Location in thesis:
Chapter 5 – Chemotaxonomic responses of autotrophic periphyton communities to
nutrient additions in an oligotrophic intermittent stream
Student contribution to work:
JAI contributed to study design, undertook all experimental work, analysed the data,
and wrote the manuscript. GRC assisted with HPLC experiment design and analysis.
NEP and PFG contributed to study design and assisted with interpreting results. PFG
and NEP commented on the manuscript.
Student signature:
Date: 31th
August 2018
I, Pauline Grierson certify that the student statements regarding their contribution to
each of the works listed above are correct
Coordinating supervisor signature:
Date: 31 August 2018

1
1. GENERAL INTRODUCTION
Intermittent and ephemeral streams dissect the arid and semi-arid landscapes
(drylands) of the world, providing unique habitat niches in what is frequently an
otherwise hostile landscape. Temporal and spatial heterogeneity in the hydrology of
dryland streams can produce higher ecological diversity than might be expected for
such regions due to increased ecological niche and species turnover, which breaks
down boundaries between lotic, lentic, and terrestrial phases in these streams (Datry
et al., 2014; Acuña et al., 2015; Leigh & Datry, 2017). The remote Pilbara of
northwest Australia is one region known to support high biological richness and
species endemism (Pepper et al., 2013), including of aquatic organisms (Morgan &
Gill, 2004; Reeves et al., 2007; Pinder et al., 2010). The Pilbara is also rich in
mineral resources, and provides an estimated 39 % of the world's iron ore, much of
which is mined below water table (DJTSI, 2018). Consequently, freshwater
ecosystems in the Pilbara are under increasing pressure from resource extraction, as
well as municipal water extraction to support regional development (DOW, 2010;
EPA, 2014). While freshwater ecosystems across the Pilbara have long been subject
to disturbance associated with pastoral activities (see van Vreeswyk et al., 2004;
Halse et al., 2007 for overviews), impacts have generally been localised, and mainly
associated with the direct grazing of vegetation, physical trampling and inputs of
nutrients from manures (Masini, 1988). In contrast, shifts in the timing and volumes
of water flows as well as physical changes in stream morphology resulting from
resource extraction – particularly from mine dewatering – have significantly altered
stream hydrology (Gardiner, 2003; Barber & Jackson, 2011, 2012; Dogramaci et al.,

2
2015). These changes in hydrology can be both highly localised as well as
cumulative in their impacts on freshwater ecosystems across catchments
(Voeroesmarty et al., 2010; EPA, 2014). Consequently, a rigorous understanding of
how such these ecosystems function is critical in order to better predict the risks of
anthropogenic changes to the ecology of intermittent and ephemeral streams.
As for many arid zones around the world, freshwater ecosystems of the Pilbara are
both spatially and temporally highly variable (Kennard et al., 2010), and stream
biogeochemical processes are strongly mediated by an episodic hydrology (Siebers
et al., 2016). The soils that dominate the catchments across the Pilbara, where the
research described in this thesis is focused, have developed from some of the oldest
erosion surfaces on Earth, including iron-rich sedimentary deposits (2.77 - 2.4 Ga)
that have been uplifted to form the Hamersley Range (Kranendonk et al., 2002;
Arndt et al., 2007). Consequently, Pilbara soils tend to be heavily weathered, are
frequently dominated by smectite clays, and contain relatively low levels of available
nutrients and organic matter (Bentley et al., 1999; Islam & Adams, 2001; McIntyre
et al., 2009a; McIntyre et al., 2009b). Aquatic productivity of streams across the
region is therefore likely to be strongly limited by nutrient supply, particularly of
nitrogen (N) and phosphorus (P).
In largely undisturbed dryland catchments, cycles of flood and drought control fluxes
of nutrients and organic matter into streams and rivers (Bunn et al., 2006b; Leigh et
al., 2010). However, this natural biogeochemical variability remains largely
unquantified in northwest Australia and thus disentangling the impacts of altered
land use from background variability is challenging. Nevertheless, understanding of

3
both regional and more localised hydrology in the Pilbara has been improved by the
study of hydrogeochemical processes (Dogramaci et al., 2012; Skrzypek et al., 2013;
Mather et al., 2018) as well as reconstruction of past climates from tree rings
(O'Donnell et al., 2015) and flood regimes from sediments and other records
(Rouillard et al., 2015; Rouillard et al., 2016). Recent studies by Fellman et al.
(2011) and Siebers et al. (2016) have highlighted the strong influence of
hydrological connectivity to groundwater on dissolved organic matter (DOM)
biogeochemistry of stream pools in the Pilbara, with consequent impacts on trophic
structure (Siebers, 2015). However, interactions between nutrient cycling processes
and productivity of the different pools and reaches of dryland streams remain poorly
understood, not only in the Pilbara but also across many other arid regions of the
world (Mulholland & Webster, 2010; Bernhardt et al., 2018).
In this thesis, I have used field surveys coupled with manipulative experimental
approaches in both the field and laboratory to further a mechanistic understanding of
nutrient and carbon biogeochemistry of dryland streams of the Pilbara. This work is
also applied, and will help elucidate the role of hydrologic connectivity in
maintaining ecosystem function, a key concern for future management of these
systems. This introductory chapter provides a general overview of the hydrological
characteristics of dryland streams and rivers, briefly outlines the current
understanding of nutrient uptake and limitation in these streams, and provides the
context for the following experimental chapters.
4
1.1. Hydrological characteristics of intermittent and ephemeral streams in
hot arid environments
Intermittent rivers and ephemeral streams (IRES) are streams that only flow during
the periods when they receive water from springs or surface runoff, and cease
flowing during dry periods, often seasonally (Gordon et al., 2004). Locally elevated
water tables or perched aquifers may also maintain surface water during dry periods
in some intermittent streams. In contrast, an ephemeral stream only flows in direct
Figure 1.1 Pilbara streams show extreme flow intermittency and are typical of those
characterised by Kennard et al. (2010) as ‘variable summer extremely intermittent’. Daily
rainfall (red) and discharge (blue) at river gauging sites in the a) Upper Fortescue catchment
(Fortescue River at Newman 708011), and b) Lower Fortescue catchment (Fortescue River
at Bilanoo pool 708015). Data source: http://wir.water.wa.gov.au

5
response to rainfall events, such as from thunderstorms, and are typically dry for
most of the year. Intermittent and ephemeral streams make up > 50 % of
watercourses globally (Datry et al., 2016), and more than 65 % of streams of
continental Australia (De Vries et al., 2015; Datry et al., 2018a), although this is
likely an underestimation as intermittent streams are generally poorly represented in
stream gauging networks (Acuña et al., 2014). A desktop mapping approach
estimated 82 % of major streams in Australia (by stream length) as intermittent
(Geofabric, 2012), although this value increases to 98 % if also including all minor
headwater and more ephemeral streams. In light of their widespread geophysical
significance, IRES are globally underrepresented in scientific studies (Stubbington et
al., 2018).
Much of our understanding of the functioning of dryland streams within Australia
has developed from studies of lowland rivers of the highly regulated Murray-Darling
Basin (Kingsford, 2000; Mitrovic et al., 2003) and from the vast braided, flat
landscapes of inland central Australia, such as Cooper Creek (Bunn et al., 2003;
Fellows et al., 2007). However, the streams of the inland Pilbara are characterised as
extremely intermittent under a climate of highly variable rainfall (Kennard et al.,
2010). Surface water is driven by runoff associated with high intensity rainfall events
resulting from cyclonic activity and tropical lows through the austral summer
(Ruprecht, 1996). While mean annual discharge at the mouth of the Fortescue River,
one of the largest catchments in the region, is 292 GL y-1
flows are extremely
variable (range: 0 to 1420 GL y-1
, http://wir.water.wa.gov.au) (Figure 1.1). Gauging
sites across the Fortescue catchment are generally located at more persistent sites of
surface water such as large river pools, whilst intermittent streams are poorly

6
represented across the network. Where hydrological gauging data are available, a
rapid rising and falling limb of the hydrograph is observed following significant
rainfall events, hence surface flows are often intense but short lived
(http://wir.water.wa.gov.au). However, it is these larger precipitation events (> 20
mm day-1
) that drive groundwater recharge, primarily through the alluvium
(Dogramaci et al., 2012). These groundwater reserves then maintain surface water
within streams as the region progressively dries and streams contract to a series of
pools, such that the degree of alluvial connectivity is an important characteristic
which governs biogeochemical processes within these pools (Fellman et al., 2011;
Siebers et al., 2016). Figure 1.2 illustrates some examples of stream types and
landscapes found in the Pilbara.
7
Figure 1.2. Different settings across the catchment include confined gorges with bedrock
substrate at a) Dales Creek, and b) Fortescue River South at Hamersley Gorge, semi-
confined gorges with alluvium at Coondiner Creek c) and d), spring-fed rivers and streams at
e) Fortescue River at Millstream and f) Weeli Wolli Creek.

8
1.2. Processes underpinning nutrient dynamics in intermittent and
ephemeral streams
Instream processes within IRES are different to perennial systems in a number of
ways. Biophysical and ecological features of IRES are largely determined by
patterns of flow intermittence (Datry et al., 2017). Dying and rewetting cycles
resulting from the highly dynamic flows described above can be especially important
in shaping sediment geochemistry (Baldwin & Mitchell, 2000) and terrestrial organic
matter (Baldwin, 1999; Datry et al., 2018b), as well as stimulating biodiversity
(Leigh & Datry, 2017). Rewetting cycles are especially important in delivering
nutrients and carbon from the surrounding catchment, and not only in hot, arid
catchments. For example, high flows during large winter storms reconnect dried
reaches and stimulate decomposition in temperate streams (Northington & Webster,
2017). In contrast, drying and UV photo-degradation of organic matter are much
stronger influences on decomposition rates in hot dryland regions (Fellman et al.,
2013), especially when iron-oxides are present (Howitt et al., 2008). Evapo-
concentration of nutrients and carbon is also a significant process on surface waters
in hot arid regions, especially once streams cease to flow and fragmentation occurs
(Sheldon & Fellows, 2010; Siebers et al., 2016). Stream sediments regulate P content
of the water column through sorption processes and thus has a strong influence on
nutrient cycling in aquatic systems (Reddy et al., 1999). Transport and subsequent
reworking of sediments during flood flows produces ‘fresh’ material for P sorption,
whilst potentially transporting sediment-P from the active hyporheic zone and
depositing elsewhere.

9
Downstream transport of nutrients and carbon is restricted to short periods of flow in
Pilbara streams. Once flow ceases and stream pools become progressively
disconnected, allochthonous sources of energy become exhausted and the internal
cycling of nutrients and carbon becomes increasingly important. Autochthonous
production by macrophytes, phytoplankton, and periphyton increasingly maintains
consumer food webs during the longer no-flow period. However, current nutrient
transport models are inadequate for describing longitudinal nutrient dynamics within
these dryland streams. For example, the concept of nutrient spiralling, whereby
nutrients are cycled as they progress downstream (Webster, 1975; Newbold et al.,
1982) is not applicable when downstream transport occurs via intermittent flow
(Fisher et al., 2004). Previous attempts to refine the nutrient spiralling concept to
include flow variability have been unsuccessful at incorporating the extreme end of
the flow variability spectrum seen in ephemeral systems (Fisher et al., 1998).
Consequently, further exploration of river and stream functioning in tropical and
sub-tropical regions especially, should contribute to expanding such models to
include more extreme systems.
In intermittent streams of hot and arid regions, sediments are frequently dry for
periods from months to years, such that terrestrial plant litter accumulates both
within pools along the stream bed and in the adjacent parafluvial zones (Datry et al.,
2018b). When dry sediments are rewetted, organic matter is mineralised and there is
a release of nutrients and carbon into pore water and the water column (Baldwin &
Mitchell, 2000). In the Pilbara, these initial ‘flashy’ flows are highly important to the
productivity of aquatic ecosystems as they provide an opportunity for nutrients and
carbon from the surrounding catchment to enter the stream. In contrast, streams in

10
more mesic environments receive a more consistent input of materials throughout the
year via baseflow (Buffam et al., 2001; Bieroza & Heathwaite, 2016). Consequently,
productivity in Pilbara streams and other IRES in Australia is thought to be primarily
driven by allochthonous inputs of nutrients and organic matter sourced from the
catchment in the form of organic matter derived from vegetation and soils (Siebers,
2015). In contrast, food webs which lack significant inputs of allochthonous material
may revert to autochthonous algal production (Bunn et al., 2003).
Continental Australian soils are highly weathered and nutrient poor (Orians &
Milewski, 2007), especially in phosphorus (P) (Holford, 1997; Doolette et al., 2011).
Source rock and soils of the Pilbara region are especially depauperate in P compared
to many parts of the world, and available nitrogen (N) is also frequently low (Ford et
al., 2007; McIntyre et al., 2009b). Inputs of N via biological fixation processes are
limited by low P as well as aridity. Consequently, rates of terrestrial primary
production in dry arid regions are also low. Hence, the quantity of nutrient and
carbon available for transportation to streams from surrounding catchments is
limited. Therefore, bioavailable forms of N and P in surface waters across the Pilbara
are also generally very low (Pinder et al., 2010; Fellman et al., 2011) compared to
other Australian streams (Harris, 2001), and to streams globally (Smith et al., 2003;
Seitzinger et al., 2010).
Streams across the Pilbara region have a lower nutrient status compared to studies
elsewhere that have examined biogeochemical processes in IRES such as Europe
(Acuna et al., 2004; von Schiller et al., 2011) and North America (Grimm, 1992;
Sponseller & Fisher, 2006); they therefore offer novel conditions to explore nutrient

11
processes in IRES and extend knowledge of how ecosystems may be adapted to such
limitation. For example, how do stream metabolic processes occur in oligotrophic
(low nutrient) systems, especially under a highly intermittent hydrology? What
biogeochemical processes determine the availability of N and P at any one time, and
conversely what processes are most limited under these oligotrophic conditions?
How do they contrast with other IRES world-wide?
1.3. Nutrient limitation of metabolic processes in intermittent and
ephemeral streams of hot, arid regions
Ecosystem metabolism comprises the processes of productivity and respiration in
aquatic ecosystems (Odum, 1956; Staehr et al., 2011). Photosynthesis drives carbon
fixation and productivity during daylight hours, whilst both autotrophs and
heterotrophs respire. The degree of autotrophy or heterotrophy (ratio of gross
production to respiration) of a system has been interpreted elsewhere as an indicator
of overall ecosystem health (Fellows et al., 2006; Likens et al., 2009). Whilst light
and carbon inputs are important sources of energy of instream metabolism, the
ability of aquatic primary producers to acquire inorganic nutrients is a major control
on production in all systems.
The rate of primary production is controlled by Liebig’s law of the minimum (de
Baar, 1994) where the most limiting nutrient or energy source in a system determines
this rate. In freshwater systems, we are primarily interested in limitation by nitrogen
and/or phosphorus (Francoeur, 2001; Tank & Dodds, 2003; Elser et al., 2007). Much
of the pioneering research on biogeochemical processes in intermittent streams
focused on nitrogen limited arid systems, such as Sycamore Creek in Arizona

12
(Grimm et al., 1981; Grimm & Fisher, 1986). These streams are fed by seasonal
snow-melt, are frequently flow regulated by lock or flood controls, and therefore
have a comparatively predictable hydrology. Less is understood of the relative
importance of nitrogen versus phosphorus availability in IRES that occur in largely
unmodified catchments, receive very episodic flows, and where the surrounding
catchments are dominated by nutrient-poor soils. Factors controlling stream
productivity in intermittent Pilbara streams remain largely undescribed. However,
expanding our understanding of metabolic processes in IRES is considered
fundamentally important for the future management of freshwater systems given
there is a global trend of increasing stream intermittency (Acuña et al., 2017). The
Pilbara region in many ways exemplifies these global processes, with changing
spatial and temporal patterns in rainfall, and changed land use (Cullen & Grierson,
2007; O'Donnell et al., 2015; Rouillard et al., 2015; Rouillard et al., 2016).
Nutrient limitation studies have broadened our understanding of water column and
benthic autotrophic production (Francoeur, 2001) and heterotrophic respiration
(Burrows et al., 2015). Nutrient limitation has also been investigated utilising a range
of approaches including whole lake fertilisation studies (Carpenter et al., 2001),
mesocosm experiments (O'Brien & Dodds, 2007), and incubations of in situ nutrient
diffusing substrates (Fairchild et al., 1985; Tank & Dodds, 2003; Capps et al., 2011).
Typically changes in biomass or chlorophyll-a are measured to assess how primary
producer growth may respond to nutrient addition (thus indicating limitation).
However, if multiple algal species are present they may not respond uniformly to
nutrient addition (e.g. N versus P). For example, freshwater cyanobacteria containing
heterocysts have the ability to fixate atmospheric nitrogen (N2) under nitrogen

13
starvation (Carey et al., 2012). Nitrogen-fixers would be expected to show little
response to N additions though may boom under elevated P (Cottingham et al.,
2015). Consequently, studies that also examine shifts in community composition and
abundance rather than purely total periphyton production may provide greater insight
into overall nutrient limitation in any one system or time (Townsend et al., 2012;
Dalton et al., 2015).
1.4. Objectives and organisation of this thesis
The general objective of this thesis is to increase understanding of how the
intermittent and ephemeral streams of hot arid environments function ecologically,
and especially how phosphorus and nitrogen may interact to influence aquatic
metabolism in the Pilbara region of northwest Australia. I examined patterns and
processes in stream biogeochemistry in the context of stream hydrology at the
catchment to reach scale. Specifically, I sought to: i) describe the biogeochemical
characteristics of dryland streams in the Fortescue River catchment as context for
understanding the broad-scale variability in nitrogen and phosphorus availability in
relation to groundwater connectivity; ii) investigate key geochemical processes that
are likely to influence nutrient transfers between the iron and calcium-rich sediments
and the water column; iii) quantify aquatic primary production response to N and P
additions; and iv) consider the influence that connectivity to water in the alluvium
has on all of the above processes.
The research incorporates both field observations and experimental results made
over a three year period from May 2013 to October 2016. The thesis is presented as a

14
series of ‘stand-alone’ journal papers; as such, some repetition is unavoidable. I have
truncated methods and referred to their full explanation in prior chapters where it
does not detract from the flow of the text. References to in-text citations for each
chapter are compiled at the end of the thesis. Chapter 2 presents a study of the
variation in stream geochemistry across a large arid-zone catchment, and provides a
regional context for the following experimental chapters, which are then focused on
Coondiner Creek in the Upper Fortescue River sub-catchment. Chapter 3
investigates adsorption kinetics influencing phosphorus (P) bioavailability and
emphasises interactions between P, dissolved organic matter (DOM) and iron (Fe).
Chapter 4 presents a study on the short-term metabolic response of aquatic primary
producers to nutrient additions using 13
C isotopic labelling approaches. Chapter 5
investigates the response of periphyton communities to nutrient additions using
nutrient diffusing substrate and subsequent pigment analysis. Finally, Chapter 6
provides a general discussion of the overall work in the context of the functioning
and importance of intermittent and ephemeral streams both in Australia and
elsewhere, the implications of this study for assessing how changing climate,
hydrology, and land use can alter the biogeochemical character of these streams, and
opportunities to mitigate and minimise future anthropogenic changes.
15
2. OVERVIEW OF DRYLAND STREAM HYDROCHEMISTRY IN
THE FORTESCUE RIVER CATCHMENT
2.1. Introduction
Intermittent rivers and ephemeral streams (IRES), which periodically cease to flow,
comprise around 50% of the global fluvial network (Datry et al., 2017), yet are
under-represented in stream monitoring; even basic information on surface flows and
nutrient levels is generally lacking (Acuña et al., 2014). While IRES are known for
their extreme temporal hydrologic variability, hydrologic regimes in dryland
catchments are also frequently spatially heterogeneous. Dryland catchments are a
mosaic of not only intermittent and ephemeral reaches but may also contain
perennial reaches, and isolated pools maintained by alluvial groundwater.
Consequently, dryland catchments likely contain a continuum of hyporheic flow
paths that are associated with different hydrologic residence times (Boano et al.,
2014). These hyporheic zones, where surface and ground waters are exchanged, are
important for vertical and lateral connections of rivers (Ward, 1989; Thorp et al.,
2006), and play a significant role in biogeochemical cycling of carbon and nutrients
(Boulton et al., 1998; Fellman et al., 2011; Siebers et al., 2016). However, most
studies of hyporheic processes in IRES have focused on relatively small scales;
understanding of hyporheic exchange at larger scales e.g. across a catchment, is
largely lacking (Magliozzi et al., 2017).
The Pilbara region of northwest Australia typifies the challenge of acquiring better
representation of IRES-dominated catchments - the region is sparsely populated,
16
remote, largely hydrologically unregulated, and poorly represented in hydrographic
monitoring networks. Groundwater is also recognised as playing a key role in
maintaining perennial and persistent pools and reaches across the catchment
(Baimbridge et al., 2010; Siebers et al., 2016).
Where detailed monitoring data may be lacking, stable isotopes of water (δ2H and
δ18
O) have proved particularly useful tools for understanding key hydrologic
processes and identifying zones where hyporheic exchange is particularly important.
For example, the isotopic compositions of stream waters in arid regions, including
the Pilbara, has been shown to be strongly determined by fractionation due to
evaporative pressure (Dogramaci et al., 2012), as well as the degree of connectivity
to alluvial water (Fellman et al., 2011). When water isotope data are coupled with
other measures of hydrochemistry, it should thus be possible to assess if any patterns
are evident at the catchment scale.
In this chapter, I provide an overview of the hydrochemical characteristics of the
Fortescue River catchment, the largest catchment of the central Pilbara region. This
overview is primarily intended to provide broad scale context for subsequent
experimental chapters (3-5), which are focussed on understanding how nitrogen and
phosphorus availability/limitation, as well as dissolved organic matter dynamics, are
influenced by connectivity to groundwater at more localised scales. I was
particularly interested in determining if longitudinal gradients (upstream to
downstream) are evident in the Pilbara as observed elsewhere in catchments with
more perennial flows (Vannote et al., 1980). Specifically, I sought to discover if
there is any evidence of longitudinal gradients in a) stream water residence time, b)

17
nutrient concentrations and c) form and concentrations of dissolved carbon across
the catchment.
2.2. Methods
2.2.1. Study region and sampling
The Fortescue River is in the Pilbara region of northwest Australia and is 760 km in
length (Figure 2.1). The total catchment is 48,360 km2 in size but is usually
considered in two parts; The upper eastern region of the catchment (Upper Fortescue
River catchment, 29,752 km2) is endorheic draining the gorges and northern flanks
of the Hamersley Ranges in to the Fortescue Marsh (Barnett & Commander, 1985).
The Upper catchment is physiographically separated from the Lower Fortescue River
catchment (18,608 km2) by the Goodiadarrie Hills (> 410 m a.s.l;
http://www.water.wa.gov.au). The two sub-catchments are also considered to be
hydrologically disconnected, with the Fortescue Marsh acting as a terminal wetland
for drainage from the Upper catchment (Skrzypek et al., 2013).

18
Figure 2.1 a) The Fortescue river catchment of, northwest Australia. b) Location of
sampling sites across the Fortescue River catchment, northwest Australia. c) Lower and
Upper Fortescue River sub-catchments.

19
Tab
le 2
.1 S
urf
ace
wat
er s
amp
lin
g s
ites
acr
oss
the
Fort
escu
e R
iver
cat
chm
ent,
Nort
hw
est
Aust
rali
a.

20

21

22
The climate across the Fortescue catchment is sub-tropical semi-arid. Rainfall occurs
predominantly in the austral summer arising from cyclones, monsoonal lows and
tropical thunderstorms, which punctuate periods of prolonged drought (Bureau of
Meteorology, 2018). Mean annual rainfall is ~300 mm across the catchment but
highly variable both within and among years (Chapter 1: Figure 1.1). Temperatures
range from mean daily minima and maxima of 25 to 39 °C in the summer, and from
8 to 22 °C in the winter, such that mean annual pan evaporation ranges from 1200 to
2000 mm across the catchment and far exceeds mean annual rainfall (Charles et al.,
2015).
The flow regime in the Fortescue River and its tributaries is directly linked to rainfall
dynamics, with seasonal discharge during the wet summer months (January to
March) and flow only occurring following cyclonic rainfall or large low pressure
rainfall events (Rouillard et al., 2015). Due to these hydrological constraints, the
streams in this region are extremely intermittent (Kennard et al., 2010). During the
drier winter months and years with no cyclone activity, surface waterways become
disconnected through evaporation to form a chain of pools along drainage lines
(Beesley & Prince, 2010; Fellman et al., 2011; Siebers et al., 2016). Groundwater
thus plays an important role in maintaining surface water volume in many of these
stream pools throughout the catchment (Dogramaci et al., 2012), and maintains
perennial flow to some reaches (Baimbridge et al., 2010). Hence, whilst the system
is highly intermittent at the catchment scale, surface water expression at individual
stream reaches may be on a spectrum from perennial to intermittent.

23
A total of 55 surface water samples were collected from streams across the Fortescue
River catchment between May 2013 and April 2014 encompassing the two major
sub-catchments of the Fortescue River (Figure 2.1). Sampled reaches were classified
as ‘perennial’ if they were known to have continuously flowed for at least the
previous ten years, while all other sites were classed as ‘intermittent’ on the basis
that they were not flowing at time of sampling. Triplicate water samples were taken
at each site for analysis of nutrients and carbon, and a single sample per site was
collected for water isotope analysis. Three rainwater samples collected at Millstream
NP and a single groundwater sample from a flowing bore at Coondiner Creek were
collected in April 2014. A summary of pool size and other parameters are
summarised in Table 2.1.
Stable isotope composition of water (δ2H and δ
18O) was measured to assess both the
source and degree of evaporation of water within the catchment (Skrzypek et al.,
2015). Water samples for δ2H and δ
18O isotope analysis were collected in a glass vial
ensuring all headspace was removed. As regional groundwater can be bicarbonate
rich (Dogramaci & Skrzypek, 2015), the concentration of dissolved inorganic carbon
(DIC) and its stable carbon isotope composition (δ13
CDIC) were measured to also
assess relative contributions of groundwater among sites. Water samples for DIC and
δ13
CDIC analysis were field filtered through a sterile 0.2 µm filter (Sartorius Minisart)
into a glass vial, ensuring all headspace was removed. Dissolved organic carbon
(DOC), dissolved organic matter (DOM) and nutrient samples were field filtered
through a 0.45 µm syringe filter (Sartorius Minisart). Samples for total dissolved
nitrogen (TDN) and soluble reactive phosphorus (SRP) were also collected as an
indicator of trophic state and nutrient limitation. Water samples for isotope, nutrient

24
and carbon analysis were immediately refrigerated (4 °C) in the field up until time of
analysis.
2.2.2. Stable isotope, carbon, and nutrient analysis
Stable isotopes of water (δ2H and δ
18O) were measured on a Picarro L1102-i isotopic
liquid water and continuous water vapour analyser (Picarro, Santa Clara, CA,
U.S.A.). All δ2H and δ
18O values are given in per mil [‰ VSMOW] according to
delta notation (Coplen, 1996). Detailed instrument procedures and standard
verification are outlined in Skrzypek and Ford (2014). Carbon isotope of dissolved
inorganic carbon (δ13
CDIC) was measured on a Thermo Delta XL IRMS with
Gasbench II (Thermo Fisher Scientific, Waltham, MA, U.S.A.). All δ13
CDIC values
are given in per mil [‰ VPDB] according to delta notation (Coplen, 1996).
Analysis of DOC and TDN samples was conducted using a Shimadzu TOC-V
analyser coupled with a TNM-1 total nitrogen module (Shimadzu Corp., Kyoto,
Japan). The concentration of DOC and DOM was characterised with absorbance and
fluorescence spectroscopy and parallel factor analysis (PARAFAC) (Stedmon et al.,
2003). Dissolved aromatic carbon content (SUVA254) was calculated as the
absorbance at 254 nm measured on a Shimadzu UV-VIS spectrophotometer divided
by DOC concentration and is reported in the units L mg-1
m-1
(Weishaar et al., 2003).
DOM fluorescence was measured on a Varian Cary Eclipse spectrofluorometer
(Varian Medical Systems, Inc. California USA). An excitation emission matrix
(EEM) was produced for excitation wavelengths 240 to 450 nm at 5 nm intervals
with emission intensities captured from 300 to 600 nm at 2 nm intervals.
25
Concentration of SRP was measured with the modified ascorbic acid method
(Murphy & Riley, 1962; Kuo, 1996).
2.2.3. Data analysis
Stream water, rainwater and groundwater stable isotope samples were plotted on δ2H
and δ18
O biplots. A linear model was fitted to all surface water samples to calculate a
local evaporation line (LEL) for the Fortescue River catchment. The local meteoric
water line (LMWL) developed for the region by Dogramaci et al. (2012) was added
for comparison. I utilised δ18
O values as a proxy for evaporative loss in stream pools
(Skrzypek et al., 2015). Hydrochemical variables (nutrient and carbon data) were
plotted against δ18
O, and linear models fitted. Models were first fitted to the whole
catchment dataset. Next, the dataset was split into perennial and intermittent sites
and modelled separately to investigate if they differed. Overall differences in the
hydrochemistry of perennial and intermittent reaches were assessed using analysis of
variance (ANOVA); variables were tested for normality (Shapiro-Wilk test) and
homogeneity of variance (Bartlett’s test). Variables were log-transformed where
required to meet assumptions.
Parallel factor analysis (PARAFAC) was performed in MATLAB (R2012a) using
the n-way and drEEM (v4.0) toolboxes (Murphy et al., 2013). Raw EEM’s were
corrected for Raman scatter with a MilliQ blank subtraction. Rayleigh peak regions
were also removed prior to modelling. The PARAFAC model was trained to identify
best fit between three to six fluorophore components with the experimental data. The
final three-component model was validated using split-half analysis (Stedmon &
Bro, 2008), and the modelled components compared to previously identified
26
fluorophore components with OpenChrom (v1.3.0 Dalton) and the OpenFluor
spectral library (Murphy et al., 2014). Peaks are presented as maximum fluorescence
intensity (Fmax) values in Raman units for each component.
Principal component analysis (PCA) was performed with R software (R Core Team,
2017) to reveal patterns in the hydrochemical dataset across the catchment. I
conducted a log-transformation on variables that showed skewness. DIC
concentrations were excluded from the PCA as the dataset contained missing values
of this variable. Data were normalised (scaled) and a correlation matrix produced.
2.3. Results
2.3.1. Variability in hydrochemistry of surface water across the catchment
The three rainfall samples collected at Millstream in April 2014 coincided with the
previously established LMWL for the region (Figure 2.2a). Similarly, the
groundwater sample from Coondiner bore had a stable isotope composition of -
60.01/ -9.13 ‰ for δ2H/δ
18O, which is consistent with the regional groundwater
signature (Dogramaci et al., 2012). The isotopic composition of surface water
sampled across the catchment ranged from -59.49 to +34.35 ‰ for δ2H and -9.01 to
+12.01 ‰ for δ18
O (Figure 2.2a). All stream samples plotted below (to the right) of
the LMWL (Figure 2.2a), indicating evaporation. I first used a linear model to
calculate the local evaporation line from stream water samples. The initial stable
isotopic composition of stream water prior to evaporation was estimated from where
the LEL intersected with the LMWL: -58.7 ‰/9.03 ‰ for δ2H /δ
18O, closely
matching the groundwater signature reported above. Water from intermittent reaches

27
was significantly more enriched in both 2H and
18O (δ
2H: -26.2 ± 4.4 ‰, δ
18O: -2.8 ±
0.9 ‰), compared with water in perennial reaches (δ2H: -53.8 ± 0.8‰, δ
18O: -7.7 ±
0.1‰)(ANOVA: δ2H: F(1,53) = 92.6, p < 0.001, δ
18O: F(1,53) = 74.65, p < 0.001;
Figure 2.2), confirming the greater influence of evaporation at intermittent sites and
likely disconnection from alluvial groundwater. In contrast, most designated
perennial sites lay lower on the LEL, suggesting groundwater inflow. There was no
overall discernible longitudinal gradient in isotopic composition (i.e. progressive
enrichment) from the Upper to Lower catchment. However, if intermittent and
perennial reaches were considered separately, δ2H and δ
18O did reveal a pattern of
evaporative loss across downstream gradients (intermittent: δ2H: R
2 = 0.21, p =
0.016, δ18
O: R2 = 0.152, p = 0.045; perennial: δ
2H: R
2 = 0.62, p < 0.001, δ
18O: R
2 =
0.44, p < 0.001; Figure 2.2b, 2.2c), even though there was considerable variability
across intermittent reaches.
Dissolved inorganic carbon concentration ranged from 3.53 to 84.86 mg L-1
(median:
71.63 mg L-1
) during April 2014. DIC concentrations (mean ± standard error) were
significantly higher at perennial sites (77.4 ± 0.9 mg L-1
) than intermittent sites (51.8
± 4.6 mg L-1
) (ANOVA: F(1,17) = 22.19, p < 0.001). However, there was no
significant difference in DIC concentration between Lower and Upper catchments.
The stable isotope ratio of dissolved inorganic carbon (δ13
CDIC) did not differ
between perennial and intermittent sites (F(1,53) = 0.12, p = 0.728) and ranged from -
13.02 to -5.04 ‰ (median: -10.70 ‰). There was no significant difference in δ13
CDIC
between Lower and Upper catchments. Although across the whole catchment,
δ13
CDIC in perennial reaches became progressively more depleted downstream, yet
this pattern was not present in intermittent reaches (Figure 2.3).

28
Figure 2.2 a) Stable isotope composition of perennial (red) and intermittent (yellow) stream
waters, located in Lower (□) and Upper (○) catchment positions in the Fortescue River
catchment, northwest Australia. Also shown are rainwater (+) and groundwater () samples
collected from the region at the time of this study. The local evaporation line (LEL) was
calculated from 55 surface water samples whilst the local meteoric water line (LMWL) was
sourced from Dogramaci et al. (2012). b) Relationship between the distance from river
mouth and stable hydrogen (δ2H) and c) oxygen (δ
18O) isotopes of water.

29
Total dissolved nitrogen concentrations were highly variable, ranging from 40 to
1391 µg L-1
across all sites (median: 220 µg L-1
), and did not differ between
perennial and intermittent reaches overall (F(1,53) = 0.5, p = 0.48). TDN
concentrations were significantly higher in the Lower- than the Upper- catchment
(ANOVA: F(1,53) = 27.20, p < 0.001), and there was a significant longitudinal
increase in TDN (R2 = 0.169, p = 0.002, Figure 2.3). Soluble reactive phosphorus
concentration in the water column was also highly variable and ranged from < 1 to
39.4 µg L-1
(median: 2.7 µg L-1
). SRP was significantly higher in intermittent
reaches (6.0 ± 1.4 µg L-1
) compared to perennial reaches (2.7 ± 0.3 µg L-1
)
(ANOVA: F(1,53) = 9.98, p = 0.002), although there was no overall longitudinal trend
in SRP concentrations across the whole catchment (Figure 2.3). The N:P ratio of the
water column thus ranged from 3 to 563 (median: 78)(Redfield, 1934), suggesting
potentially broad scale P limitation to pool productivity across both the Lower and
Upper catchments. There was a significant longitudinal increase in N:P ratio (R2 =
0.182, p < 0.001, Figure 2.3). N:P ratios were significantly lower in intermittent
compared to perennial reaches (ANOVA: F(1,53) = 6.768, p = 0.012). Four reaches
had N:P ratios < 16:1, all of which were known highly ephemeral pools of
Coondiner Creek in the Upper Fortescue Catchment (Fellman et al., 2011).
Dissolved organic carbon concentrations ranged from 0.78 to 34.01 mg L-1
across the
whole catchment (median: 2.64 mg L-1
). DOC was significantly higher in
intermittent reaches (4.9 ± 1.2 mg L-1
) than perennial reaches (3.2 ± 0.7 mg L-1
)
(ANOVA: F(1,53) = 5.069, p = 0.029). DOC concentrations increased downstream
across these perennial reaches (R2 = 0.162, p = 0.034), while this pattern was not
present across intermittent reaches (Figure 2.3). SUVA254 ranged from 0.06 to 3.16 L

30
mg-1
m-1
(median: 1.19 L mg-1
m-1
), corresponding to 0 to 25 % aromaticity (median:
11.4 %). Overall there was no significant difference in SUVA254 values between
perennial and intermittent reaches, between Lower and Upper catchments, nor a
discernible longitudinal gradient.

31
Figure 2.3 Relationship between the distance from river mouth and total dissolved nitrogen
(TDN), soluble reactive phosphorus (SRP), N:P ratio, dissolved organic carbon (DOC),
dissolved inorganic carbon (DIC), and the stable isotope composition of dissolved inorganic
carbon (δ13
CDIC). Shaded fill denote perennial (red) and intermittent (yellow) stream waters,
symbols denotes Lower (□) and Upper (○) catchment position (n = 55).

32
PARAFAC decomposition of EEM spectra identified three fluorescing DOM
components in the dataset (Figure 2.4). Component C1 had excitation maxima of
250, 345, 445 nm with emission maxima 464 nm. Component C2 had excitation
maxima of 250 and 310 nm and emission maxima of 394 nm. Components C1 and
C2 were matched in the OpenFluor library with terrestrially derived humic-like
components C1 and C2 from Shutova et al. (2014) (r2
= 0.99 and 0.98). C1
terrestrially delivered organic matter, and C2 reprocessed terrestrially delivered
organic matter. Component C3 had excitation maxima of 250 and 280 nm and
emission maxima 304 nm. Component C3 was matched with the tyrosine-like C5
from Yamashita et al. (2013) (r2 = 0.92). Examination of error residuals from the
three component PARAFAC model indicated that a tryptophan-like component was
also present in some samples from the catchment, although the core consistency of a
four component model was lower and the model unable to be split-half validated
with our dataset. Overall there was no significant difference in DOM Fmax values for
components C1, C2, or C3 between persistent and intermittent streams, between
Lower and Upper catchments, nor discernible longitudinal gradients.
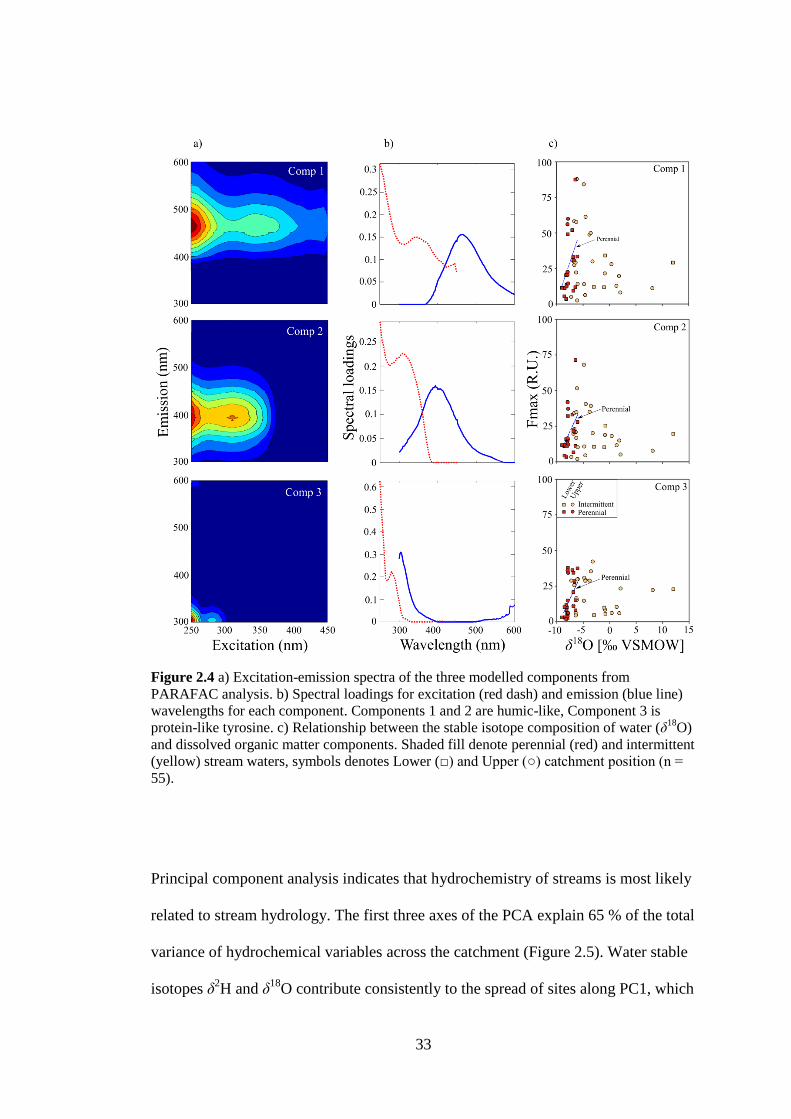
33
Principal component analysis indicates that hydrochemistry of streams is most likely
related to stream hydrology. The first three axes of the PCA explain 65 % of the total
variance of hydrochemical variables across the catchment (Figure 2.5). Water stable
isotopes δ2H and δ
18O contribute consistently to the spread of sites along PC1, which
Figure 2.4 a) Excitation-emission spectra of the three modelled components from
PARAFAC analysis. b) Spectral loadings for excitation (red dash) and emission (blue line)
wavelengths for each component. Components 1 and 2 are humic-like, Component 3 is
protein-like tyrosine. c) Relationship between the stable isotope composition of water (δ18
O)
and dissolved organic matter components. Shaded fill denote perennial (red) and intermittent
(yellow) stream waters, symbols denotes Lower (□) and Upper (○) catchment position (n =
55).

34
explained 27.1 % of the variance. Perennial and intermittent streams generally
grouped apart across this axis (Figure 2.5). The humic-like dissolved organic matter
components C1 and C2 contribute to the spread of sites along PC2, which explained
23.4 % of the variance.
2.3.2. How is stream nutrient availability linked to hydrology across the
catchment?
In order to explore how nutrient availability and organic matter in surface water are
related to hydrologic characteristics, dissolved nutrients (N and P) and dissolved
organic and inorganic carbon were plotted against the δ18
O signatures (Figure 2.6).
Figure 2.5 Principal component analysis of hydrochemical parameters of perennial (red) and
intermittent (yellow) stream waters, symbols denotes Lower (□) and Upper (○) catchment
position (n = 55). The first two axis of the PCA explains 50.5 % of the total variance. Water
stable isotopes δ2H, δ
18O and δ
13C-DIC contribute consistently to PC1, dissolved organic
matter components C1, C2, and contribute to PC2.

35
SRP was positively correlated, albeit weakly, with δ18
O across the catchment (R2 =
0.16, p = 0.003, n = 55). DOC was also weakly correlated with δ18
O across the
catchment (R2 = 0.16, p = 0.003, n = 55) for all streams combined. The strength of
the correlation is somewhat leveraged by one point for each of these parameters,
although there is no a priori reason to exclude the site as an outlier. δ13
CDIC was also
positively correlated with δ18
O across the catchment (R2 = 0.31, p < 0.001, n = 55).
In contrast, DIC concentration was negatively correlated with δ18
O (R2 = 0.44, p =
0.002, n = 19). TDN and N:P ratios of the water column were also related to degree
of pool evaporation in intermittent reaches, where both TDN (R2 = 0.23, p = 0.010, n
= 26) and N:P ratio (R2 = 0.13, p = 0.006, n = 26) tended to increase at more
enriched δ18
O signatures. In contrast, DOM in perennial but not intermittent reaches
was positively correlated to δ18
O values: DOM Fmax values for components C1 (R2 =
0.17, p = 0.032, n = 28), C2 (R2 = 0.17, p = 0.031, n = 28), and C3 (R
2 = 0.23, p =
0.010, n = 28) (Figure 2.6).

36
Figure 2.6 Relationship between the stable isotope composition of water (δ18
O) and total
dissolved nitrogen (TDN), soluble reactive phosphorus (SRP), N:P ratio, dissolved organic
carbon (DOC), dissolved inorganic carbon (DIC), and the stable isotope composition of
dissolved inorganic carbon (δ13
CDIC). Shaded fill denote perennial (red) and intermittent
(yellow) stream waters, symbols denotes Lower (□) and Upper (○) catchment position (n =
55).

37
2.4. Discussion
This study demonstrates the diversity of hydrological drivers and biogeochemical
characteristics of surface waters that can occur across dynamic catchments in hot
arid environments. This diversity stems primarily from stream reach isolation and
variable connectivity to alluvial water, and reflects the continuum of hyporheic flow
paths that can occur across the catchment. Perennial and intermittent reaches showed
distinct differences in hydrology that in turn resulted in high variability in nutrient
concentration and stoichiometryacross sites. This study also revealed stream
hydrology to be a stronger determinant of stream chemistry across the catchment,
although individual chemical parameters differed in their behaviour between
intermittent and perennial sites. Below, I discuss patterns in stream chemistry along
the upstream-downstream longitudinal gradient, followed by patterns across an
evaporative gradient throughout the Fortescue River catchment.
2.4.1. Longitudinal gradients
The chemical composition of surface water throughout the Fortescue River
catchment showed no clear patterns. At the catchment scale, one of the few
longitudinal gradients present was for nitrogen with both TDN concentration and
N:P ratio increasing from upstream to downstream. No other parameters measured in
this study indicated a gradient from upstream to downstream. (Vannote et al.,
1980)The downstream increase in TDN across the Fortescue catchment may reflect
an increase in the relative contribution of groundwater (a NO3- source) to streams
downstream. Hence, rather than instream processes (i.e. nutrient spiralling and
denitrification), nitrogen in intermittent systems is more governed by subsurface and
lateral biogeochemical processes.

38
When looking at surface waters of perennial and intermittent reaches discretely it
became clear that the hydrochemistry of these two reach types were governed by
separate processes. Across both perennial and intermittent reaches the degree of
evaporative loss progressively increased from upstream to downstream, although
evaporative loss was much greater in intermittent reaches than perennial reaches
across the catchment. Again, this is showing that flow cessation and pool isolation
create key differences in drivers of biogeochemistry between intermittent and
perennial reaches. As pools lose connectivity to alluvial groundwater, more localised
factors such as waterbody geometry (esp. surface area to volume ratio) along with
degree of exposure/shading to wind and solar irradiation will strongly determine
evaporative loss. Hence as pools become progressively isolated across catchments of
intermittent systems the remnant longitudinal stream processes get overridden by
stronger hydrological connectivity and evaporation processes.
An upstream to downstream carbon gradient was present only across perennial
reaches. DOC concentrations, along with DOM humic- and protein-like components
increased from upstream to downstream across these reaches. Whilst DIC
concentrations did not show any gradient, its isotopic ratio (δ13
CDIC) became more
negative downstream. In Mediterranean IRES DOM becomes increasingly
heterogeneous throughout the catchment during dry/drought periods, whereas DOM
is relatively homogeneous during flood (Ejarque et al., 2017). Overall, I found no
downstream carbon gradients for the Fortescue River. While not directly addressing
DOC concentrations, the RCC predicts that the diversity of dissolved organic
compounds decreases downstream, and CPOM:FPOM ratio decreases (Vannote et

39
al., 1980). There have been some recent developments in conceptualising DOM
dynamics in river catchments, although they have done little to address flow
intermittency. The Pulse-Shunt (Raymond et al., 2016), and Active-Pipe (Casas-Ruiz
et al., 2017) concepts have been developed to characterise perennial systems. While
downstream patterns of carbon were indeed evident across perennial reaches in this
study, this does not hold true for intermittent reaches of the Fortescue River
catchment. Hence the inclusion of flow intermittency and discontinuum should be a
focus of future revisions of these models.
2.4.2. Evaporative loss drives stream hydrochemistry
This study demonstrates that broad scale processes across the Fortescue River
catchment may be more appropriately framed by hydrological parameters such as the
degree of evaporation (i.e. a hydrological gradient, rather than a geographic
longitudinal gradient). Flow intermittence and hydrological connectivity in IRES
naturally creates a river dis-continuum once flow cessation has occurred and reaches
become isolated. Hence, longitudinal gradients in intermittent catchments may at
best show a legacy ‘ghost’ of prior flows, and do not well describe the ‘now’
conditions of the catchment, especially in dryland regions such as the Pilbara where
‘dry’ inter-flow periods are long compared to other IRES globally. For example the
evaporation : inflow ratio derived from water stable isotopes explains patterns in
catchment biogeochemistry across an intermittent tropical catchment (Fellman et al.,
2014). As hydrology is an important determinant of stream dynamics overall, a
gradient based on hydrological character (such as δ2H and δ
18O values) may be more
useful for understanding biogeochemical processes in IRES.
40
The evaporative pressure on stream reaches (based on δ18
O values) was related to
both carbon and phosphorus content across the catchment. DOC and SRP
concentration increase as pools contract due to evaporation. In dryland streams of
regions where flow is short-lived and rates of evaporation are high – compared to
other IRES where isolation is primarily driven by flow gradually ceasing – pools
become isolated and contract and evapo-concentration of nutrients and carbon
becomes a significant process (Hamilton et al., 2005; Sheldon & Fellows, 2010;
Siebers et al., 2016). This concentration of materials may maintain production as
these pools contract. The evaporative pressure on stream reaches also showed
patterns in stream nitrogen, although these were only present across intermittent
reaches. TDN concentrations and N:P ratios increase as pools contract due to
evaporation. This is also seen in the increase in TDN downstream across the overall
catchment, whereby stream water is progressively evaporated as it transits
downstream, and evapo-concentration acts as a nutrient retention mechanism
(McLaughlin, 2008). Consequently, we may expect rates of in-stream productivity to
be higher in lowland streams than their upland counterparts throughout the
catchment.
The isotopic δ13
CDIC values measured within the catchment indicated that the bulk of
dissolved inorganic carbon in these streams is sourced from regional groundwater
aquifers. Once DIC enters surface waters it has an inverse relationship with the
evaporative pressure on stream reaches. DIC concentration decreases as pools
contract due to evaporation, whilst δ13
CDIC values increase. The relationship between
δ13
CDIC and DIC concentration in stream water is indicative of DIC source (Miller &
Tans, 2003; Campeau et al., 2017). In this case the linear slope (δ13
CDIC: -0.07 ‰)

41
indicates a geogenic source such as a carbonate bearing aquifer. Groundwater may
hence be a major source of inorganic carbon to stream food webs in the Pilbara
region via these DIC inputs (Fellman et al., 2014). The pattern seen here seems
counterintuitive when comparing to evapo-concentration of other dissolved solutes
(i.e. DOC, TDN and SRP), although it demonstrates that either DIC is degassing
(Cao et al., 2016), being utilised for photosynthesis (Madsen & Sand-Jensen, 1991;
Chen et al., 2016), or both. For example, charophytes in carbonate rich waters are
known to take-up and precipitate bicarbonate excess to their metabolic needs (Kufel
et al., 2013). In both cases (degassing or metabolic uptake) the lighter 12
C isotope in
DIC is preferentially fractionation resulting in an increase in δ13
CDIC value.
Consequently, these results make sense in that DIC is ‘used up’ as overall
evaporative pressure increases.
This study indicates that isolation and evaporative pressure are stronger factors than
longitudinal continuum (i.e. RCC) in shaping stream chemistry across the Fortescue
River catchment, and presumably intermittent systems in general. Other processes
such as sediment sorption, nutrient uptake and organic matter cycling not accounted
for would also play a role in local variations. Further investigation into the
biogeochemical processes and uptake of nutrients and carbon in these streams is
required to understand why we observed only a weak correlation between pool
hydrology and hydrochemical parameters. Whilst it is important to understand the
spread (boundary conditions) and variance in dissolved organic matter specific for
the region, there is perhaps a scaling issue between what we see at site and at
catchment scale (e.g. von Schiller et al., 2017). To improve our understanding of
these scaling issues we would require a more comprehensive spatial and temporal
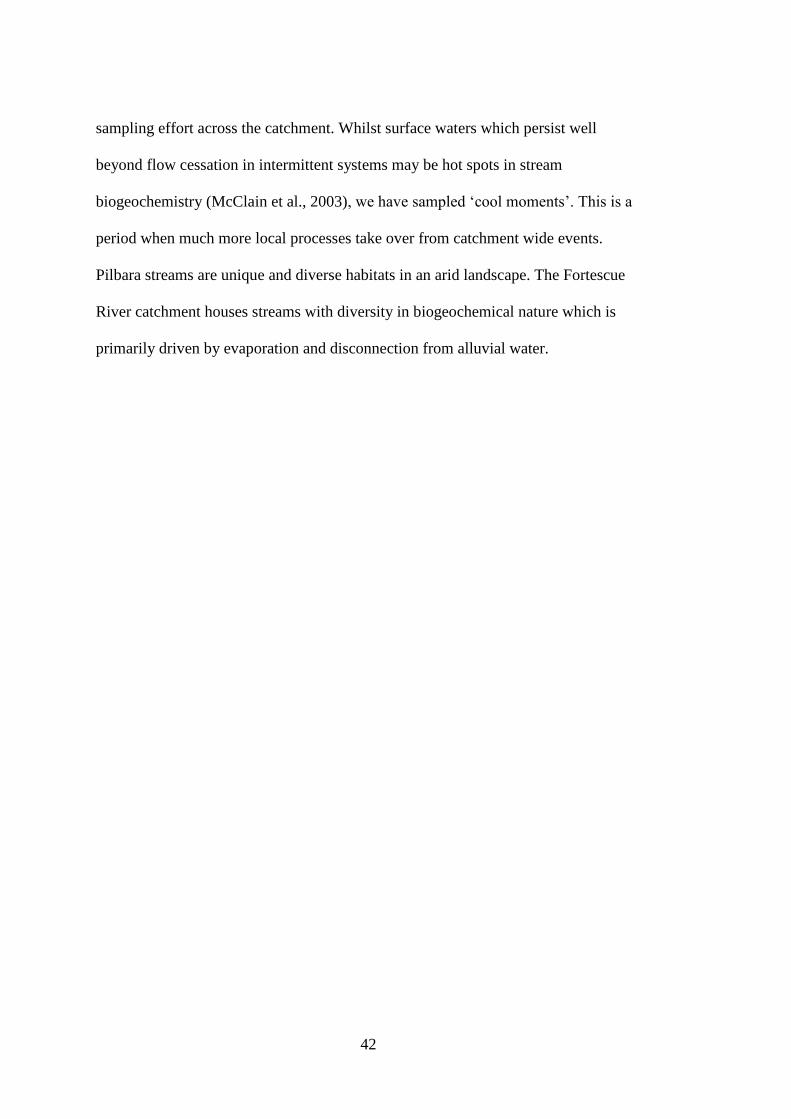
42
sampling effort across the catchment. Whilst surface waters which persist well
beyond flow cessation in intermittent systems may be hot spots in stream
biogeochemistry (McClain et al., 2003), we have sampled ‘cool moments’. This is a
period when much more local processes take over from catchment wide events.
Pilbara streams are unique and diverse habitats in an arid landscape. The Fortescue
River catchment houses streams with diversity in biogeochemical nature which is
primarily driven by evaporation and disconnection from alluvial water.

43
3. PHOSPHORUS SORPTION AND DISSOLVED ORGANIC
MATTER INTERACTIONS IN IRON-RICH STREAM
SEDIMENTS
3.1. Introduction
Phosphorus (P) sorption kinetics of stream sediments plays a key role in regulating P
content of the water column and thus has a strong influence on ecological processes
within aquatic systems (Reddy et al., 1999). Competition for limited P resources
between biotic and abiotic components of freshwater streams is increased when
sediments are dominated by minerals with high sorption capacity (Fink et al., 2016).
However, organic matter (OM) content may also influence P sorption kinetics of
stream sediments (McDowell & Sharpley, 2001), albeit in inconsistent and complex
ways. For example, P sorption in aquatic systems is linked to iron cycling and
governed by the so-called “Mortimer’s ferrous wheel” (Mortimer, 1941). What this
means is that under anaerobic conditions OM enhances the microbially-mediated
reductive dissolution of iron (III) minerals and subsequently releases the phosphate
ion (Mitchell & Baldwin, 1998; Watts, 2000a). In contrast, aerobic oxidation of iron
(II) back to iron (III) produces amorphous iron (III) oxyhydroxides with high binding
capacity, which in turn enables the recovery (sorption) of a portion of the P released.
Aerobic sorption of P to ferric mineral surfaces may be diminished by dissolved
organic matter (DOM) competing for sorption sites (Wang et al., 2008; Verbeeck et
al., 2017). The mechanisms that underpin differences in P-OM interactions in
freshwater ecosystems are complex yet likely play a key role in determining overall
nutrient limitation of within-stream productivity.

44
Allochthonous inputs from riparian vegetation can make a significant contribution to
sediment OM loads, as well as contribute to dissolved OM (DOM) in the water
column, particularly in intermittent streams of dryland regions (Baldwin, 1999;
Fellman et al., 2013; Datry et al., 2018b). Litter (leaves and small branch material),
as well as larger coarse woody debris, may enter reaches and isolated pools directly
from overhanging riparian vegetation or can be washed into streams from the
surrounding catchment during rainfall and flood events (Gonçalves et al., 2014;
Tonin et al., 2017). Direct inputs of litterfall from overhanging riparian vegetation is
especially important in dryland regions where the stream corridor – and particularly
around more persistent pools – is much more productive than the surrounding
catchment. This tannin rich litter releases significant amounts of DOM in to the
water column through the leaching of fresh litter, as well from decomposing
material. In intermittent and ephemeral streams this DOM can then be further
concentrated as surface water contracts during drought (Siebers et al., 2016; Harjung
et al., 2018).
DOM is known to influence P sorption to sediments in a number of ways. For
example, DOM can inhibit phosphate sorption to sediments through the occupation
and blocking of mineral surface sites (Gu et al., 1995). Fe catalysed photo-
degradation of DOM produces more bioavailable fractions of DOM as well as Fe(II),
which can be rapidly oxidised to Fe(III), producing amorphous Fe(III)
oxyhydroxides (Howitt et al., 2008). DOM might also act as a chelating agent in
iron-rich sediments capable of interacting with both the electron acceptors on
sediment surfaces ‘freeing’ iron and phosphate into solution (Baken et al., 2016;

45
Daugherty et al., 2017). These possible interactions are further complicated by the
variable nature of the DOM, which in freshwater ecosystems is comprised of several
different fluorescing components, including humic and fulvic acids, tryptophan and
tyrosine. Recent studies have also shown that the concentration and composition of
DOM of ephemeral streams – including the Pilbara – is strongly influenced by
surface/alluvial-water hydrodynamics (Fellman et al., 2011; Siebers et al., 2016;
Harjung et al., 2018). Thus we might expect that both hydrology and the
composition (fluorescence characteristics) of DOM will impact P sorption/desorption
processes in sediments of ephemeral and intermittent streams.
Ephemeral and intermittent streams are further characterised by cycles of drying and
rewetting, which are known to release more P than sediments or soils that are
consistently moist (Grierson et al., 1998) but also decrease the P affinity of
streambank sediments compared to sediments that remain permanently inundated
(Watts, 2000b). Drying of sediments can also decrease P adsorption capacity
(Attygalla et al., 2016), while P desorption and release from sediments is enhanced
upon rewetting (Baldwin, 1996; Kerr et al., 2010). These effects can persist for
extended periods of time. For example, P adsorption capacity was decreased for
several weeks after rewetting in wetland clays and silts (Song et al., 2007). Baldwin
and Mitchell (2000) also showed that wetland sediments that go through decadal
wetting-drying cycles have reduced adsorption capacity even when the current
inundation period has spanned many prior years. There is also high heterogeneity in
exposure to the extent of drying and rewetting that occurs within ephemeral and
intermittent streams owing to varying levels of connectivity to alluvial groundwater
(Fellman et al., 2011; Siebers et al., 2016). We might thus expect that stream

46
sediments in reaches that are less connected to groundwater and therefore dry out,
have reduced P adsorption characteristics than sediments that remain persistently
inundated. These combined processes of drying/rewetting cycles in association with
increased DOM concentrations in individual pools and different forms of DOM,
allow for the production of P-OM-Fe complexes, which may enable P to remain
suspended in solution as colloidal particles (Baken et al., 2016; Yan et al., 2017), or
form more complex structures to sorb to sediment mineral surfaces (Cheng et al.,
2004). Consequently, shifts in flood and drought cycle and heterogeneity in the
distribution of surface and alluvial groundwater along streams will have significant
impacts on biogeochemical cycles and in-stream processes (Leigh et al., 2015).
This chapter investigated phosphorus sorption processes and how DOM may modify
P sorption, in iron-rich sediments from pools along an intermittent Pilbara stream. In
this study, P sorption/desorption kinetics of sediments were compared with and
without additions of DOM derived from allochthonous sources, and among pools of
contrasting hydrological connectivity to the alluvial water table. Pools were defined
as either ‘persistent’, where alluvial through flow maintains water level in the pool
throughout the year, or ‘ephemeral’, where pools are disconnected from the alluvial
groundwater and hence sediments frequently dry out in the weeks to months
following cease to flow. I hypothesised that: i) sediments from ‘ephemeral’ pools
will have lower P adsorption capacity than sediments from ‘persistent’ pools; ii) an
increase in DOM concentration will decrease the P adsorption capacity of sediments;
and iii) an increase in DOM concentration will increase P desorption from
sediments.

47
3.2. Methods
3.2.1. Study site and sampling
Sediments and leaf litter samples were collected from six pools along 8 km of
Coondiner Creek (-23.00° S, 119.62° E), an intermittent (ephemeral) stream in the
Hamersley Ranges of northwest Australia (Figure 3.1). Coondiner Creek is
considered representative of many streams in the region that cut through a network
of semi-confined gorges throughout the ranges (Fellman et al., 2011; Siebers et al.,
2016). Stream bed sediments are primarily reworked channel iron deposits,
containing a high proportion (50 – 60%) of Fe-hydroxide minerals, primarily
hematite and goethite sourced from banded iron formations in the catchment
(Ramanaidou et al., 2003). Throughout the catchment there are also minor granitic
bodies and carbonate deposits (dolerite and calcrete) around springs (Skrzypek et al.,
2013).
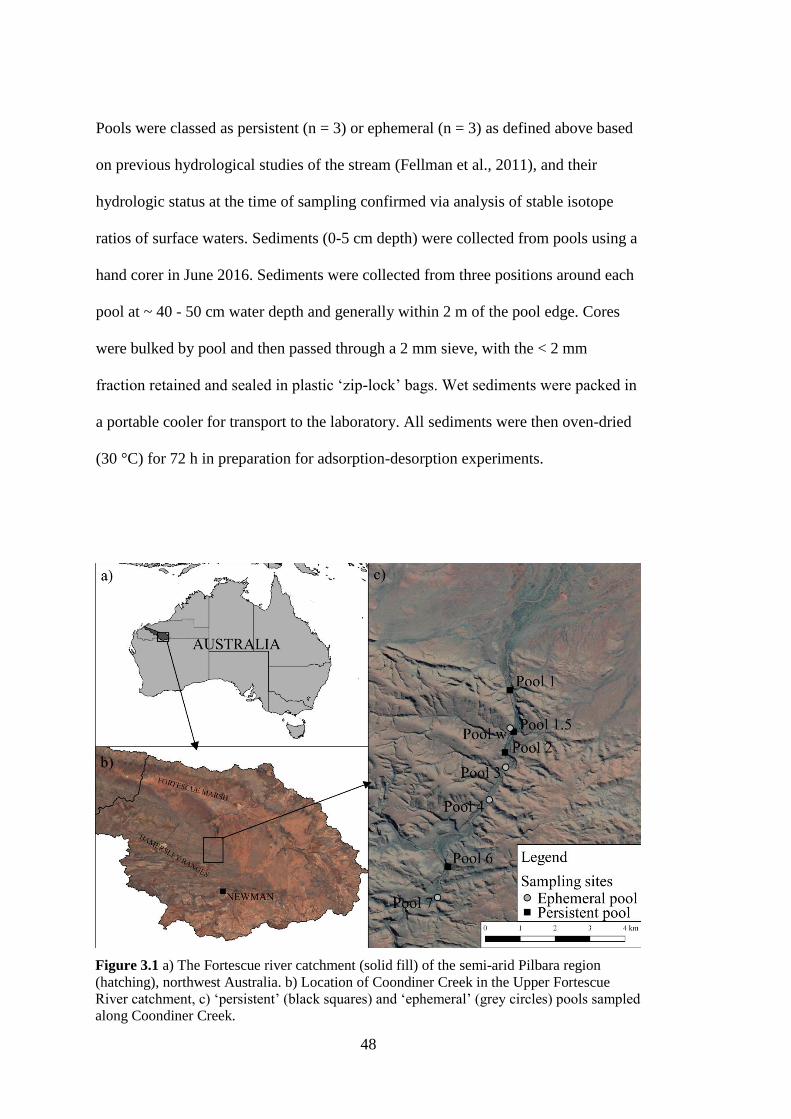
48
Pools were classed as persistent (n = 3) or ephemeral (n = 3) as defined above based
on previous hydrological studies of the stream (Fellman et al., 2011), and their
hydrologic status at the time of sampling confirmed via analysis of stable isotope
ratios of surface waters. Sediments (0-5 cm depth) were collected from pools using a
hand corer in June 2016. Sediments were collected from three positions around each
pool at ~ 40 - 50 cm water depth and generally within 2 m of the pool edge. Cores
were bulked by pool and then passed through a 2 mm sieve, with the < 2 mm
fraction retained and sealed in plastic ‘zip-lock’ bags. Wet sediments were packed in
a portable cooler for transport to the laboratory. All sediments were then oven-dried
(30 °C) for 72 h in preparation for adsorption-desorption experiments.
Figure 3.1 a) The Fortescue river catchment (solid fill) of the semi-arid Pilbara region
(hatching), northwest Australia. b) Location of Coondiner Creek in the Upper Fortescue
River catchment, c) ‘persistent’ (black squares) and ‘ephemeral’ (grey circles) pools sampled
along Coondiner Creek.

49
Leaf litter of the most dominant riparian tree species, Eucalyptus camaldulensis
subsp. refulgens, was collected adjacent to the pools to prepare DOM extracts. Litter
leachates were prepared by gently agitating 20 g leaf material in 1 L MilliQ water for
2 h on a shaker table (Fellman et al., 2013). The leachate was then filtered (Whatman
GF/F 0.7µm) to exclude particulate organic matter and retain the dissolved
components. The DOM leachate was prepared the day before batch experiments
were performed. Leachates were stored in the dark wrapped in foil and refrigerated
prior to use.
3.2.2. Sediment mineralogy and elemental chemistry
Sediment pH and electrical conductivity (EC) was measured in a 1:10 (w/v) soil-
solution. The pH was measured in the laboratory with a bench top pH meter (Orion
model 520A). A subsample of each sample was dried (50 °C) and ground to a fine
powder (< 60 µm) for mineralogical and chemical analysis. OH-extractable
inorganic (OH-Pi) and OH-extractable total P (OH-Pt) were measured after
extraction in 0.1 M NaOH (Bowman & Cole, 1978). Phosphorus concentrations in
all extracts were measured using the modified ascorbic acid method (Kuo 1996;
Murphy and Riley, 1962). Sediment crystalline structure and amorphous content was
determined by quantitative X-ray diffraction (XRD) (PANalytical Cubix3, Almelo,
Netherlands). Samples were packed and presented as un-orientated powder mounts.
ZnO and CaF2 internal standards were added to each sample and amorphous content
was determined by an internal standard scan. Sediment chemical characterisation
was determined by X-ray fluorescence (XRF) by Intertek Genalysis (Perth, WA)
using standard techniques. A fused disk of the powdered sample was prepared with

50
borate flux. Percent loss on ignition (%LOI) was determined after combustion at 425
°C, 650 °C, and 1000 °C by thermogravimetric analysis.
3.2.3. Phosphorus sorption characteristics
Phosphorus (P) adsorption experiments were undertaken by adding a range of known
P concentrations to sediments (Pant & Reddy, 2001; Nair & Reddy, 2013). In the
samples with no additions of DOM (DOM0), 5 g sediment was weighed into 125 mL
high-density polyethylene (HDPE) bottles containing 100 mL of phosphate solution
(0, 2.5, 5, 10, 20, 40, or 100 mg L-1
in 0.003 M KCl). Solution blanks were included
in all steps of the procedure to assess P recovery and ensure P was not sorbed to the
HDPE bottle. Samples were mixed on an end-over-end shaker at 22 °C (± 2 °C) for
24 h. Sediments were allowed to settle for 30 min prior to the supernatant being
filtered (Sartorius minisart 0.45µm). P concentrations in the filtered supernatant were
then analyzed using a modified ascorbic acid method (Murphy & Riley, 1962; Kuo,
1996).
To investigate the effects of dissolved organic matter (DOM) on P adsorption
characteristics, the above procedure was repeated on two further subsets of
sediments by adding leachates with (i) DOC concentrations of 3.7 mg L-1
(DOM5),
or (ii) DOC concentrations of 44.6 mg L-1
(DOM50). The two DOC treatment
concentrations were selected based on observed water column DOC concentration in
the system (Siebers et al., 2016), and a 10-fold increase to emulate the expected
higher DOC concentrations encountered in sediment pore water. P concentrations of
the filtered supernatant were analysed as above. The differences among treatments in

51
the optical absorption and DOM fluorescence properties was investigated on a subset
of samples (Ci = 0, 40, 100 mg L-1
).
The amount of P sorbed was calculated as:
𝑞𝑒 =𝑉(𝐶𝑖−𝐶𝑒)
𝑊 [Equation 1]
Where qe is the ratio of P sorbed by sediment (mg g-1
), Ci and Ce are the initial and
equilibrium P concentrations (mg L-1
), V is the solution volume (L) and W is the
weight of sediment (g). Plotting the amount of P sorbed (qe) vs equilibrium
concentration (Ce) we examined the linear region of the curve (Ce < 10 mg L-1
):
𝑞𝑒 = 𝐾𝑙𝐶𝑒+𝑏 [Equation 2]
Here, the slope is equal to the linear adsorption coefficient (Kl), and intercept (b)
equal to initial soil P. The equilibrium P concentration (EPC0) was then calculated:
𝐸𝑃𝐶0 =𝑏
𝐾𝑙 [Equation 3]
The experimental data was fitted to both Langmuir and Freundlich isotherm models
using non-linear least squares. The Freundlich equation is as follows (Freundlich,
1907):
𝑞𝑒 = 𝐾𝐹𝐶𝑒1/𝑛
[Equation 4]
Where KF (L mg-1
) is a constant related to adsorption energy, and n is a correction
factor.
The Langmuir equation (Langmuir, 1918) used was:
𝑞𝑒 =𝐾𝐿𝑏𝐶𝑒
1+𝑏𝐶𝑒 [Equation 5]
Where KL (L mg-1
) is the Langmuir isotherm constant, and b (mg g-1
) is the
maximum adsorption capacity, often referred to as ‘Smax’ (Pant & Reddy, 2001).

52
P desorption was measured at the conclusion of the incubations. For each of the three
treatments (DOM0, DOM5, and DOM50) the supernatant was discarded and the
sediment retained. Then, 100 mL 0.003 M KCl was added to each bottle and the
sediment shaken for 24 h. Samples where then filtered (0.45 µm) and the supernatant
analysed for P in solution as previously described.
Dissolved organic matter (DOM) characterisation
DOM remaining in solution for a subset of P treatments following batch adsorption
experiments was characterised in order to assess if particular components of DOM
were more likely to be sorbed than others. These subset treatments with initial P
concentration (Ci) of 0, 40 and 100 mg P L-1
were further analysed by absorbance
and fluorescence spectroscopy. Absorbance spectra 200 to 800 nm were measured on
a UV-Visible spectrophotometer (Varian Cary 50 Probe). Dissolved organic carbon
(DOC) and total dissolved nitrogen (TDN) were measured simultaneously on a
Shimadzu TOC-V analyser coupled with a total nitrogen module (Shimadzu TNM-
1). C:N ratios of the equilibrated solutions were calculated as DOC:TDN. Specific
UV absorbance at 254 nm (SUVA254) (Weishaar et al., 2003) and spectral slope
(S275-295) (Helms et al., 2008 ) were calculated from the absorbance spectra.(Helms et
al., 2008 )
DOM fluorescence was measured on a Varian Cary Eclipse spectrofluorometer
(Varian Medical Systems, Inc. California USA). Extracts were diluted to within
optical range with an auto-dilutor (Hamilton, Microlab) to avoid self-quenching due
to inner-filter effects (Ohno, 2002). Excitation emission spectra (EEM) were

53
produced for excitation wavelengths 240 to 450 nm at 5 nm intervals with emission
intensities captured from 300 to 600 nm at 2 nm intervals. Humification index (HIX)
was calculated following the methods outlined in Ohno (2002). The main
contributing fluorescing organic matter components of resulting EEM’s were
extracted and quantified via parallel factor analysis (Stedmon & Bro, 2008; Murphy
et al., 2013).
3.2.4. Data analyses
Non-metric multidimensional scaling (nMDS) of sediment characteristics to assess
similarity among pools was performed following normalisation, and quantified with
analysis of similarities (ANOSIM) in Primer (Primer v 6.1.18). Sorption model
fitting and statistical analysis were performed in R version 3.4.1 (R Core Team,
2017). Adjusted R-squared values and residual sum of squares (RSS) were assessed
to support sorption model selection. Parallel factor analysis (PARAFAC) was
performed in MATLAB (R2012a) using the n-way and drEEM (v4.0) toolboxes
(Murphy et al., 2013). The PARAFAC model was trained to look for best fit between
three to seven fluorophore components within the experimental data. The four-
component model was validated using split-half analysis (Stedmon & Bro, 2008),
model components were compared to other fluorophore components in the
OpenFluor spectral library (Murphy et al., 2014) with OpenChrom (v1.3.0 Dalton).
Peaks are presented as maximum fluorescence intensity (Fmax) values in Raman units
for each component. Finally, differences in DOM components and indices with pool
hydrology, DOM treatment, and initial P concentration were investigated with
PERMANOVA routines following log(x + 1) normalisation of Fmax values
(PERMANOVA+ v 1.0.8).

54
3.3. Results
3.3.1. Sediment properties
A summary of sediment characteristics is provided in Table 3.1. Overall, sediments
collected from pools along Coondiner Creek were iron-rich and similar in character
irrespective of hydrological regime (i.e., there was no difference between ‘persistent’
versus ‘ephemeral’ pools). The OH-extractable inorganic P (Pi) (0.2 – 1.0 µg P g-1
)
and total P (PT) (70 – 82 µg P g-1
) were also similar among pools (Table 3.1), with
the exception of ‘Pool w’. This pool had elevated P content (Pi: 4.38, PT: 302 µg P g-
1) and in contrast to the other pools sampled, was located adjacent to the main
channel, and therefore received runoff from a small tributary catchment. Elemental
Figure 3.2 Non-metric multidimensional scaling (nMDS) plots of a) elemental composition
of sediments from XRF, and b) mineralogy of sediments from XRD for ‘persistent’ (black
squares) and ‘ephemeral’ (grey circles) pools of Coondiner Creek. Data were normalised
prior to scaling.

55
XRF showed sediments were predominantly composed of iron and aluminium
oxides (Fe: 26 – 42 %, Al2O3: 5 – 10 %). XRD analysis showed sediment
mineralogy was primarily composed of hematite (20 – 37 wt %) and goethite (10 -
16 wt %), along with quartz (11 – 23 wt %). XRD results were plotted in nMDS
space to further assess if there were differences in sediment chemistry among pools
or with different hydrology (Figure 3.2). Analysis of similarity between sediments
from ‘persistent’ and ‘ephemeral’ pools indicated that sediment geochemistry did not
differ with pool hydrology; dissimilarities between groups were no greater than
dissimilarities within groups for both XRF chemical characterisation (ANOSIM:
global-R = -0.074, P = 0.70), and XRD crystalline and amorphous content
(ANOSIM: global-R = -0.037, P = 0.50).

56
Tab
le 3
.1 C
hem
ical
ch
arac
teri
stic
s o
f se
dim
ents
coll
ecte
d f
rom
Coondin
er C
reek
. E
lect
rica
l co
nd
uct
ivit
y (
EC
) an
d p
H w
ere
mea
sure
d i
n a
1:1
0 (
w/v
) so
il-s
olu
tio
n.
Bulk
sed
imen
t sa
mple
s fr
om
eac
h p
ool
wer
e ai
r-dri
ed p
rior
to c
hem
ical
an
alysi
s.

57
Figure 3.3 Fluorescent DOM components derived from fluorescence spectroscopy and
PARAFAC analysis. a) Modelled excitation-emission spectra of humic-like components 1
and 2, protein-like component 3, and unknown component 4. b) Excitation (red dash) and
emission (blue line) spectral loading of each corresponding component.

58
Ta
ble
3.2
Fre
un
dli
ch a
nd L
angm
uir
model
par
amet
ers
fitt
ed t
o e
xper
imen
tal
adso
rpti
on
iso
ther
ms.
KF:
Fre
un
dli
ch
adso
rpti
on
en
ergy c
on
stan
t, n
: F
reundli
ch c
orr
ecti
on f
acto
r, K
L:
Lan
gm
uir
iso
ther
m c
on
stan
t (L
mg
-1),
b:
Lan
gm
uir
max
imu
m a
dso
rpti
on
cap
acit
y (
mg g
-1).
Mea
n v
alues
wit
h s
tandar
d d
evia
tion i
n p
aren
thes
is (
n =
3).
Mo
del
fit
s w
ere
com
par
ed u
sin
g a
dju
sted
-R2,
and r
esid
ual
sum
of
squar
es (
RS
S).
59
3.3.2. DOM properties of litter leachates
PARAFAC decomposition of EEM spectra identified four fluorescing components in
the DOM dataset (Figure 3.3). Component C1 had excitation maxima of 310 and 400
nm with emission maxima 420 – 444 nm. Component C2 had excitation maxima of
255, 340, and 445 nm and emission maxima of 464 – 502 nm. Components C1 and
C2 were matched in the OpenFluor library with humic-like components C1 and C2
from Baker et al. (2014) (r2
= 0.93 and 0.92). Component C3 had excitation maxima
of 280 and 390 nm and emission maxima 306 – 356 nm. Component C3 was
matched with the tryptophan-like C5 from Baker et al. (2014) (r2 = 0.90).
Component C4 had excitation maxima of 250 nm and emission maxima of 304 and
was matched with tyrosine-like C6 from Shutova et al. (2014) (r2 = 0.93). The leaf
litter leachates used in the experiments consisted of humic-like C1 and C2 peaks and
a tryptophan-like C3 peak. Tyrosine-like C4 was absent from the leachate.
3.3.3. Phosphorus sorption characteristics
Phosphorus sorption characteristics for sediments from all pools were generally best
described by the Freundlich model (Table 3.2; Figure 3.4), although there were some
exceptions where a Langmuir model provided a better fit (e.g., persistent pools were
more similar to the Langmuir model when DOM was present; Table 3.2). Results for
both Freundlich and Langmuir isotherms are thus reported for comparison.
The Freundlich adsorption capacity KF ranged from 0.024 to 0.049 mg g-1
. There
was no difference in KF values between DOM treatments or with pool hydrology.
‘Persistent’ and ‘ephemeral’ pools also did not differ in sorption characteristics
(Table 3.2). However, the Freundlich n constant was significantly higher in the

60
DOM5 treatment (2.364 – 3.157) compared to both the DOM0 (1.705 – 2.192) and
DOM50 (1.952 – 2.278) treatments (Two-way ANOVA: P = 0.002).
The Langmuir model generally fitted adsorption data where Ce < 50 mg L-1
, but was
less accurate at higher concentrations and thus underestimated maximum sorption
capacity (Figure 3.4). The Langmuir isotherm constant (KL) ranged from 0.386 to
1.012 L mg-1
(Table 3.2). There was no difference in KL values between DOM
treatments or hydrology. Langmuir adsorption capacity (b) ranged from 0.106 to
0.152 mg g-1
. P adsorption capacity was significantly lower in the DOM5 treatment
(0.106 – 0.138 mg g-1
) compared to DOM0 (0.141 – 0.149 mg g-1
) and DOM50
(0.114 – 0.152 mg g-1
) (Two-way ANOVA: P = 0.004). ‘Persistent’ and ‘ephemeral’
pools did not differ in sorption characteristics and there was no interaction between
hydrology and DOM.
Figure 3.4 Experimental data from batch phosphorus adsorption experiments fitted to
Freundlich (solid line) and Langmuir (dash) isotherms. Mean adsorption (qe) and standard
error (n = 3) for sediments from ‘persistent’ (black square) and ‘ephemeral’ (grey circle)
pools versus equilibrium P concentration (Ce) shown.
61
3.3.4. Desorption of P from iron-rich sediments
The amount of P desorbed after 24 h ranged from 0 to 0.05 mg g-1
across the three
DOM treatments, demonstrating that much of the added P is retained by the Fe-rich
sediment once adsorbed (Figure 3.5). However, P desorption from sediments also
increased with the amount of P previously adsorbed. Increasing the amount of DOM
in the sediment-water mix generally increased the amount of P desorbed from
sediment. A linear fit to the experimental data indicated that the amount desorbed
was 10.0 – 12.7 % (Pearson’s r = 0.98, 0.87) for the DOM0 treatment, 11.7 – 16.4 %
(r = 0.35, 0.49) for DOM5, and 17.2 – 23.9 % (r = 0.69, 0.95) for DOM50. However,
when DOM5 was added, nearly all of the P sorbed up to 0.1 mg g-1
was retained by
the sediment (Figure 3.5). In this case, significant desorption occurs only once the
sediment P concentration exceeded 0.1 mg g-1
.
Figure 3.5 Phosphorus adsorption (Pads) versus desorption (Pdes) patterns of Pilbara
sediments. Values shown are means with standard error (n = 3) of sediments from
‘persistent’ (black square) and ‘ephemeral’ (grey circle) pools.

62
3.3.5. Changes in DOM composition with incubation and P adsorption
As expected, DOM in solution at the beginning and end of 24 h incubation in the
DOM0 treatment was below detection limit. Hence, carbon based parameters are
reported only for DOM5 and DOM50 treatments (Figure 3.6). Interestingly, the DOC
concentration remaining in solution following batch adsorption experiments was
higher for ‘persistent’ pools than ‘ephemeral’ pools in both DOM5 and DOM50
treatments. However, there was no clear relationship between initial P concentration
(Ci) and final DOC concentration. There was a positive relationship between the C:N
ratio of the equilibrated solution and initial P concentration up to 20 mg P L-1
for the
DOM50 treatment. At initial P concentrations above 20 mg L-1
, the C:N ratio of the
equilibrated solution did not change (Figure 3.6). SUVA254 values following batch
adsorption experiments ranged from 0.35 to 1.20 L mg-1
m-1
. The SUVA254 value
increased with increasing initial P concentration for the range 0 to 20 mg P L-1
for
both the DOM5 and DOM50 treatments (Figure 3.6).
Absorption spectra indicate that the composition of DOM remaining in solution at
the end of the incubation correlates to the initial P concentration (Figure 3.7). The
spectral slope value (S275-295) increased with increasing P concentration (Figure 3.7).
There was an initial rapid increase in slope value as initial P increased from 0 to 10
mg L-1
with spectral slopes flattening out at higher initial P concentrations. The
humification index (HIX) ranged from 0.46 to 0.81 (Figure 3.7).

63
Figure 3.6 Dissolved organic carbon (DOC), C:N ratio, and Specific UV absorbance at
254 nm (SUVA254), at the conclusion of batch phosphorus adsorption experiments.
Values shown are means with standard error (n = 3) for sediments from ‘persistent’
(black square) and ‘ephemeral’ (grey circle) pools. Note different scales on y-axis
between DOC panels.

64
PARAFAC analysis of the fluorescence EEM spectra split the experimental dataset
into four DOM components. The fluorescence maxima for all DOM fluorescing
components were reflective of the DOC concentration of the initial DOM treatment
additions (Figure 3.8). Fmax values were significantly different between DOM
treatments (F2,45 = 56.82, P = 0.001), with DOM50 > DOM5 > DOM0. Component
correlation plots whilst validating the model, also indicated that Fmax values for
humic-like C1 and C2 components were highly correlated (Pearson’s r = 0.94).
Fluorescence maxima (Fmax) at the end of 24 h batch phosphorus adsorption
experiments for sediments from ‘persistent’ and ‘ephemeral’ pools indicated that
humic acids (components C1 & C2) were desorbed from sediments, particularly
when initial P concentration was high (Figure 3.8). Fluorescence maxima for these
components significantly increased with increasing initial P concentration (C1: F2,45
= 4.88, P = 0.006, C2: F2,45 = 23.61, P = 0.001). There was also an interaction
between initial P and DOM treatment (C1: F4,45 = 4.55, P = 0.003, C2: F4,45 = 7.99,
P = 0.001). Tryptophan-like C3 fluorescence maxima did not change with increasing
initial P concentration (F2,45 = 0.09, P > 0.05) and there was no interaction between
initial P and DOM treatment for this component (F4,45 = 2.18, P > 0.05). Tyrosine-
like C4 appears to be either a degradation product or extracted OM from the
sediments as this component was not present in the initial DOM leachates (Figure
3.8). Fluorescence maxima significantly increased with increasing initial P
concentration (F2,45 = 4.71, P = 0.017) and there was a significant interaction
between initial P and DOM treatment (F4,45 = 11.4, P = 0.001).
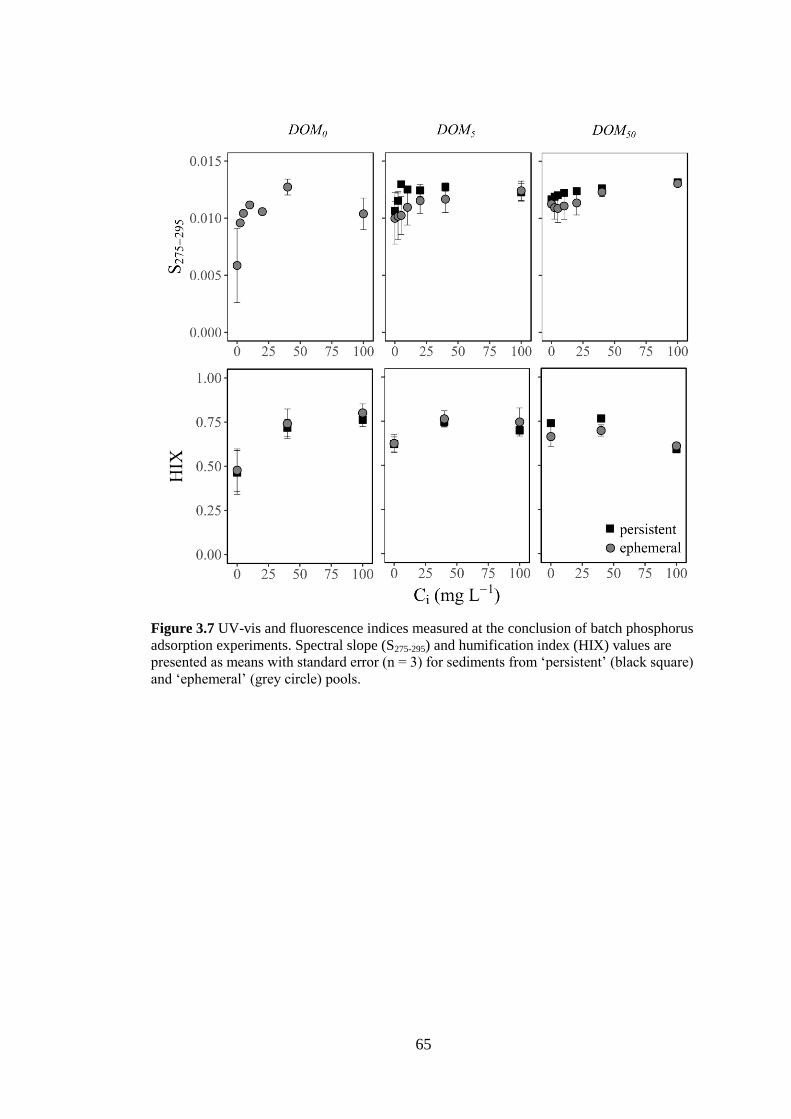
65
Figure 3.7 UV-vis and fluorescence indices measured at the conclusion of batch phosphorus
adsorption experiments. Spectral slope (S275-295) and humification index (HIX) values are
presented as means with standard error (n = 3) for sediments from ‘persistent’ (black square)
and ‘ephemeral’ (grey circle) pools.

66
Figure 3.8 Fluorescence maxima (Fmax) for PARAFAC derived DOM components at the
end of 24 h batch phosphorus adsorption experiments for sediments from ‘persistent’ (black)
and ‘ephemeral’ (grey) pools. X-axis indicates the initial P concentration (Ci) in batch
experiments and y-axis indicates fluorescence maxima (Fmax) of DOM components.
Components 1 and 2 are humic-like fluorophores, component 3 is protein-like (amino acids),
whilst component 4 is thought to be a sediment derived OM degradation product. Values are
given as mean and standard error (n = 3).

67
3.4. Discussion
The results of this study demonstrate that phosphorus adsorption and desorption
processes are both important for mediating the concentrations of potentially
biologically ‘available’ phosphorous in the water column in dryland streams. The
results also illustrate the complex ways that DOM may interact with iron-rich
sediments to influence P availability in the water column. While the iron-rich
sediments examined in this study act as a sink for phosphorous in the water column,
the concentration of DOM in the water column also appears to play a role in
regulating P desorption. In particular, DOM increased P desorption from sediments
when sediment P loading was high (i.e. Pads is above saturation). However when
sediment P loadings were high, DOM desorption from sediments also increased.
Consequently, it appears that P displaces DOM from surface sites on these
sediments.
Overall the adsorption isotherms from the sediments from Coondiner Creek are
classical "Type 1" monolayer forms, which have an initial steep slope up until
saturation is exceeded and then reaches equilibrium as the sediment adsorption
capacity is approached (Brunauer et al., 1938). Since Type 1 curves are typically
monolayer; P and DOM appear to be primarily competing for limited surface
adsorption sites in the sediment. While I measured phosphorus adsorption capacity
on relatively coarse-textured (1 – 2 mm) sediments, adsorption was comparable to
lateritic soils of much finer texture (Singh and Gilkes (1991); Zhang et al. (2012).
However, maximum adsorption capacity measured in these Pilbara sediments of 100
– 150 mg kg-1
was not high as might be expected for sediments so high in Fe (Kerr et

68
al., 2011), but did fall within range of other stream sediment studies (Agudelo et al.,
2011).
3.4.1. DOM composition is influenced by the presence of excess P
This study demonstrates that along with phosphorus, these stream sediments are a
sink for ‘recalcitrant’ DOM. The preferential removal from solution of DOM
exhibiting high spectral slope (S275-295) when P was absent or at low experimental
concentrations (< 10 mg L-1
), coincides with P saturation for the stream sediments
used in this study. While this study did not directly measure DOM molecular weight,
correlation between spectral slope and molecular weight has been observed
previously (Helms et al., 2008; Wagner et al., 2015; Wunsch et al., 2018).
Furthermore, high molecular weight DOM is preferentially sorbed to goethite (Ohno
et al., 2007), a key mineral in the sediments of Coondiner Creek. The analyses of
decreased SUVA254 (Figure 3.6), spectral slope (S275-295), humification index (HIX)
(Figure 3.7), and fluorescing humic-like components (Figure 3.8) suggests that DOM
retained in solution at lower P concentrations was of decreased aromaticity. Thus, it
is likely that aromatic high molecular weight (HMW) DOM is being preferentially
adsorbed on to sediments. If reduced aromaticity was a result of P bonding to DOM
in solution and breaking conjugated bonds then the opposite trend (i.e. decreased
aromaticity at higher initial P concentrations) would be expected. These results are
consistent with other studies that have investigated DOM adsorption in isolation
from the effects of P, showing increased molecular weight of DOM remaining in
solution with increasing DOM concentration (Gu et al., 1995; Meier et al., 1999).

69
Phosphorus addition enhanced desorption of native DOM from the Fe-rich sediments
examined. Fluorescence analysis revealed that humic acids (components C1 & C2)
were desorbed from sediments (Figure 3.8), most notably when initial P
concentration was high. However this was not discernible from DOC analysis alone,
as DOC concentrations were below detection limit. This finding suggests that P
replaces DOM associated with sediment surfaces, causing the release of stored DOM
back to the water column. Increasing phosphorous concentrations has been shown to
enhance the of release DOM from peat sediments (Sokolowska et al., 2011). The
presence of organic matter has also been shown to limit desorption of inorganic P
from eutrophic lake sediments through preferential desorption of DOP (Wang et al.,
2008). Consequently, in pools of intermittent and ephemeral streams, where litter
inputs can be significant (Datry et al., 2018b), an increase in P to the system from the
cumulative impact of mining and agriculture in the region may interfere with carbon
cycling by altering the rate of remineralisation of sediment OM. This would be most
strongly felt in pools at the more ephemeral end of the hydrological spectrum.
3.4.2. Surface/alluvial hydrodynamics do not control sediment P sorption at the
pool scale
A surprising result of this experiment was that P sorption did not differ significantly
between contrasting pool hydrologies. However, XRD and XRF analysis
demonstrated that sediments were of a similar bulk chemical and mineralogical
nature regardless of pool hydrology (Figure 3.2). This consistency in sediment type
across the 8 km of creekline examined here is likely due to regular reworking during
high discharge events that homogenises the sediments at scales greater than
individual pools. However, the frequent exposure of sediments in the field to both
70
high temperatures (where soils and dry stream beds are extremely hot for extended
periods – often in excess of 60 °C throughout the day and for weeks on end) as well
as subject to prolonged drying and rewetting cycles may have increased the
crystallinity of iron minerals (Attygalla et al., 2016) to a point where iron
crystallinity across both ‘persistent’ and ‘ephemeral’ pools becomes similar.
Attygalla et al. (2016) showed that substantial changes to the iron mineralogy in fine
and organic rich sediments was evident at drying even at 30 °C. Interestingly the
max P adsorption for sediments observed in the coarse mineral Pilbara sediments
here was very similar (~ 0.15 mg g-1
) to sediments dried at temperatures of 30 °C (or
higher) in Attygalla et al. Further experimentation to compare undried versus dried
sediments from a range of sites and mineralogies will help elucidate whether a lack
of difference among sites observed here is truly reflective of site conditions or
possibly also in part an artefact of sample treatment.
It would be useful to gain a better understanding of what the timeframe of ‘resetting’
of adsorption capacities is. As far as I am aware, no other study has investigated
post-rewetting ‘reset time’ or the effect of historical frequency of wet/dry cycles on
sediment sorption kinetics, although the issue was indirectly explored by Baldwin et
al. (2000). Over periods of years to decades, the sorption characteristics of sediments
of streams that have ephemeral wet/dry hydrological regimes may act differently to
streams with perennial flow. Consequently, as stream intermittency increases
globally (Acuña et al., 2015), sediment processes in these streams will be affected by
longer duration of flooding or indeed more regular dry periods. A consequent change
in sediment P sorption properties may be one mechanism that in turn impacts on
stream nutrient cycling and metabolism (e.g. Acuña et al., 2015; Sabater et al.,

71
2016). Further investigation of the relative importance of nitrogen and phosphorus
limitation of producers in drylands streams will enable us to better understand the
ecological outcomes of changing sediment P sorption properties.
Overall, the findings of this study have helped elucidate the fate of P in a highly
dynamic, and notionally oligotrophic, dryland catchment. I hypothesised that the
differences in wet/dry cycling and hydrological residence time in contrasting
‘persistent’ and ‘ephemeral’ pools would affect P sorption behaviour. Other studies
investigating P dynamics have previously shown drying affects both adsorption and
desorption characteristics of sediments (Baldwin, 1996; Watts, 2000b). My original
hypothesis was based on a model where sediment is spatially static and the
adsorption capacity of sediments increases with duration of inundation (i.e. time of
sampling was n months after last flood). However, my results revealed was no
evidence of differences between ‘persistent’ and ‘ephemeral’ pools in sediment P
sorption, even though ephemeral pools are more prone to drying out annually, and
sediments are exposed to ambient air temperatures exceeding 45 °C. Drying itself
can affect the crystalline structures of Fe-rich minerals (Attygalla et al., 2016). One
explanation is that high energy flood events transport and mix dry and wet sediments
and thus ultimately determine the over-riding sorption of P from the catchment onto
colloidal Fe and other fines in suspension (Müller et al., 2006; Baken et al., 2016).
Therefore it is likely that floods are an important ‘P adsorption period’, whilst quiet
periods post-cessation of flow are important for the concentration of DOM and
desorption of P to the water column. These shifts in the relative importance of
different components of biogeochemical dynamics at different times in the

72
hydrologic cycle would help explain the second flush of productivity often seen in
ephemeral pools as they dry-down (Siebers et al., 2016).
73
4. DOES LOW PHOSPHORUS LIMIT THE SHORT-TERM
METABOLIC RESPONSE OF PHYTOPLANKTON AND
CHAROPHYTES OF INSTREAM POOLS ON AN
INTERMITTENT DRYLAND STREAM?
4.1. Introduction
Like many freshwater aquatic ecosystems worldwide, autotrophic production of
intermittent rivers and ephemeral streams (IRES) in hot arid regions is limited by
nutrient availability, particularly of nitrogen (N) and phosphorus (P) (Grimm &
Fisher, 1986; Tank & Dodds, 2003; von Schiller et al., 2011). Phytoplankton,
charophytes and other macrophytes are ubiquitous to autochthonous primary
production within streams. In IRES, the productivity of phytoplankton has been
found to be linked to discharge patterns and seasonal flows, owing to associated
changes in water quality, including turbidity, dissolved carbon and nutrient
availability (Townsend & Douglas, 2017). However, in smaller streams with more
gravelly sediments, the water column may be highly transparent, such that
charophytes and submerged macrophytes may be more significant to overall
production, similar to what has recently been observed for oligotrophic shallow lakes
(Martinsen et al., 2017). Consequently, nutrient limitation of productivity of IRES
are likely to vary considerably from pool to pool in periods of low or no flow
depending on relative dominance of phytoplankton versus charophytes and
associated pool conditions.

74
Dryland streams around the world have been primarily considered nitrogen limited
(e.g. Grimm & Fisher, 1986), in part because most early studies were focussed on
relatively young geologic landscapes in the northern hemisphere (Grimm et al.,
1981; Tank & Dodds, 2003). In contrast, the intermittent streams of the semi-arid
Pilbara region of northwest Australia are considered to be oligo- to meso-trophic but
are especially depauperate in phosphorus (P) (see Chapter 2). Low P availability in
these streams has been predominantly attributed to the ancient geology of the Pilbara
craton (ca. 2.4 bya; Kranendonk et al., 2002; Arndt et al., 2007), such that the
lithosphere has been depleted in P via weathering processes and/or occluded into
secondary minerals (Wild, 1958). P availability in the water column is further
diminished due to geochemical reactions via adsorption to Fe-rich sediments
(Chapter 3). Consequently, P limitation of autotrophic production within these
streams is likely.
Intermittent and ephemeral streams (IRES) in arid regions pose a novel environment
in which to test questions of nutrient limitation on primary production. In addition to
being highly P impoverished – and also frequently low in nitrogen (McIntyre et al.,
2009b; Pinder et al., 2010) – Pilbara streams are characterised as having highly
variable summer flows and are therefore extremely intermittent in nature (Kennard et
al., 2010). Storms and large rainfall events, which may exceed 100 mm in a day,
drive catchment recharge (Dogramaci et al. 2015), although these storms and their
impacts can be highly variable both spatially and temporally (Ruprecht, 1996;
Rouillard et al., 2015). In the prolonged dry periods between flows, many of these
streams retract to isolated pools, some of which are maintained by alluvial
groundwater (persistent pools; Chapter 3). These pools may remain in this somewhat
75
isolated state for months to years (Fellman et al., 2011). Hence, in the otherwise
xeric landscape, these isolated pools are biogeochemical and ecological hotspots
between flow events, acting as refugia for fish (Morgan & Gill, 2004) and supporting
aquatic plant and invertebrate communities as well as terrestrial fauna.
Charophytes are green algae that have structure superficially similar to higher plants
and are distributed across many aquatic habitats in northern Australia (Masini, 1988;
Casanova, 2005b; Pinder et al., 2010), where they form dense beds that act as
physical structure for epiphytic communities and are important for fish grazing and
habitat (Schneider et al., 2015). Charophyte beds also act as nutrient sinks in aquatic
systems (Kufel & Kufel, 2002; Rodrigo et al., 2007). Charophytes are well adapted
to growth in oligotrophic systems (Kufel & Kufel, 2002), partly because they are
able to take up available nutrients from the sediment as well as directly from the
water column (Littlefield & Forsberg, 1965; Andrews, 1987; Komuro et al., 2017;
Rodrigo et al., 2017). This physiological trait allows charophytes to out-compete
phytoplankton for available P and maintain ‘clear’ water (characteristic of
charophyte dominated systems) by sequestering nutrients in their tissues. Hence,
high abundance of charophytes in a system would perpetuate phytoplankton biomass
remaining low. However, in ephemeral pools, charophyte mats become a source of
nutrients as pools contract and dry; nutrients are subsequently released into streams
on rewetting (Lu et al., 2017). Consequently, as pools re-fill after stream flow events,
competition occurs between charophytes and phytoplankton to establish whether a
clear charophyte-dominated or turbid phytoplankton-dominated system develops.

76
To date, the overall extent of nutrient limitation of phytoplankton and charophytes
within ephemeral Pilbara streams have not been directly tested. However, there is
now an urgent need to better understand the potential responsiveness of these
systems to nutrient additions in order to assess the escalating and likely cumulative
impacts of development across the region from intensification of pastoral production
through large-scale irrigation projects (www.agric.wa.gov.au/r4r/irrigation-pilbara),
preferential grazing of livestock in riparian corridors (Lyons, 2015) as well as
discharge of groundwater that is potentially enriched in nitrate from mine dewatering
(e.g. Halse et al., 2014). Based on pool stoichiometry, previous studies have alluded
to Pilbara streams being primarily P-limited (Pinder et al., 2010; Fellman et al.,
2011) or N and P co-limited (McIntyre et al., 2009a; McIntyre et al., 2009b).
However, estimations of response of primary production to nutrient additions
provide more direct evidence of the effects of nutrients individually or in
combination.
As previously discussed (Chapter 2, Chapter 3), connectivity to alluvial water can
also have a profound effect on organic matter inputs and nutrient fluxes (Fellman et
al., 2011; Siebers et al., 2016). Therefore in this chapter the metabolic responses of
primary producers to additions of nitrogen and/or phosphorus were compared among
pools of contrasting hydrology. Specifically, I used diel dissolved oxygen curves to
examine rates of ecosystem metabolism between ‘persistent’ and ‘ephemeral’ pools
along an arid zone stream. Concurrently I used bottle assays to assess the rate of
carbon uptake of phytoplankton and charophytes, and to test for nutrient limitation of
phytoplankton and charophytes with additions of N and/or P.
(Puche et al., 2018)

77
4.2. Methods
4.2.1. Site description
The focus for this study was Coondiner Creek, an intermittent dryland stream
situated in the Pilbara region of Western Australia (see Chapter 3, Figure 3.1). Field
experiments were conducted at Coondiner Creek during a dry-phase in August 2015.
Flow events in Coondiner Creek are rare and short lived and the dry-phase – which
may last seasons or multiple years – is the common state for the creek. At the time of
sampling, surface flows had ceased several months prior and the creek had retracted
to a series of isolated pools along the main channel. Pools were classed by their
hydrology as either predominately ‘persistent’ or ‘ephemeral’ based on previous
studies of pool-alluvium connectivity within the study catchment (Fellman et al.,
2011; Siebers et al., 2016). Connectivity to groundwater was confirmed for this
study from analysis of water stable isotope ratios measured at the time of sampling.
4.2.2. Pool water physicochemistry of persistent and ephemeral pools
Water samples were collected for analysis of stable isotopes (δ2H, δ
18O, δ
13CDIC) and
nutrients (NOx, NH4, SRP). Samples for δ13
CDIC, δ2H and δ
18O analyses were filtered
through a sterile syringe filter (PALL 0.2 µm Supor) into a glass vial ensuring all
headspace was removed. Conductivity and pH were measured in the field using a
handheld probe (YSI model 85). Water isotope and DOC/TDN samples were
immediately refrigerated (4 °C) in the field and stored until analysis. Water samples
for nutrient analysis were filtered through a sterile syringe filter (Sartorius mini-sart
0.45 µm) and frozen in the field until time of analysis. Water samples were analysed
for pool water physicochemistry as outlined in previous chapters.

78
4.2.3. Estimation of net ecosystem production
Net ecosystem production (NEP) of each pool was calculated using the single station
dissolved oxygen method (Odum, 1956; Staehr et al., 2010). Data loggers were
deployed at each pool for between 24 to 72 h to measure dissolved oxygen (DO) and
temperature (YSI ProODO). Sensors were placed at the approximate centre of pool
and ~30 cm below the surface. DO and temperature were measured and logged at a
15 minute intervals. Metabolic parameters (GPP, NEPdaytime, CR, and NEM) were
calculated following Staehr et al. (2010). Measurement periods were very still and
wind had a minimal effect on the pools over the duration of the observations; hence
piston velocity (k600 = 0.0214 m h-1
) was estimated based on a nominal wind speed
of 0.5 m s-1
.
4.2.4. Nutrient limitation experiments
Bottle incubation experiments were undertaken in-situ to assess nutrient limitation
within the water column (phytoplankton) and on charophytes (Chara sp.). Plastic
300 mL biological oxygen demand (BOD) bottles (Environmental Express,
Charleston, South Carolina) were used for the incubation experiments. Five
treatments (Light, Dark, +N, +P, +N+P), with three replicate bottles of each
treatment per site were used to assess responses to nutrient additions (procedures
described further, below). Water for the experiment was collected from each pool
and amended with 13
C-enriched sodium bicarbonate (13
C, 99%) (Cambridge Isotope
Laboratories Inc. Andover, MA) to make a final solution of 0.536 mg C L-1
above
ambient concentrations and an isotopic enrichment of +2000 ‰ over ambient DIC
values (mean ambient = ~60 mg C L-1
DIC and -12.6 ‰ δ13
CDIC; see Table 4.1 for
individual site values). A water sample was taken immediately before and once the

79
water had been enriched to confirm actual δ13
CDIC values for each series of
incubations.
Tab
le 4
.1 A
mb
ient
dis
solv
ed n
itra
te/n
itri
te (
NO
x),
am
mo
niu
m (
NH
4),
an
d s
olu
ble
rea
ctiv
e phosp
horu
s (S
RP
) co
nce
ntr
atio
ns
of
stre
am w
ater
at
each
pool.
N:P
rat
ios
calc
ula
ted a
s th
e ra
tio b
etw
een D
IN a
nd
SR
P w
her
e D
IN =
NO
x +
NH
4.
Val
ues
giv
en
are
mea
ns
and
sta
ndar
d d
evia
tion (
n =
3).
Am
bie
nt
dis
solv
ed i
norg
anic
car
bo
n (
DIC
) co
nce
ntr
atio
n a
nd
its
car
bo
n i
soto
pe
rati
o (δ
13C
DIC
) ar
e al
so g
iven
.

80
Charophytes were hand collected from each pool and gently agitated to remove loose
detritus but retain attached epiphyton. Sections of charophyte thalli were cut below
the fourth node and two of these were added to each bottle. A short piece of silicone
tubing was used to deliver the 13
C-enriched site water to the bottom of each BOD
bottle to ensure aeration of the water was minimised while filling each bottle. Bottles
were amended with either nitrate (prepared from KNO3) and/or orthophosphate
(prepared from KH2PO4) to make a final concentration of 500 µg N l-1
and/or 50 µg
P l-1
above ambient pool water concentrations (Table 4.1) to obtain a ten-fold
increase in both N and P concentrations in the water column. Bottles were
subsequently capped, the time recorded and placed in pool to incubate under ambient
conditions for 4 - 6 h. At the conclusion of the incubation, bottles were collected
from the pool and immediately processed for isotopic sampling. Each 280 mL of
incubated bottle water was filtered through a pre-combusted and pre-weighted quartz
fibre filter (Whatman QMA-25, particle retention 2.2 µm) and phytoplankton
retained on the filter. Filtrate was retained for analysis to determine NO3, NH4 and
PO4 concentrations at the end of incubation. MilliQ water (50 mL) was then passed
through the filter to flush any remaining 13
C-enriched water out of the filter matrix.
Filters were wrapped in aluminium foil and placed in individual ziploc bags.
Charophyte thalli were removed from the bottle, rinsed with MilliQ water, blotted
dry with lint-free tissue (Kimwipes) and placed in individual ziploc bags. All
samples were immediately frozen in the field until analysis in the laboratory.
4.2.5. Laboratory analyses of N, P and carbon
Charophytes and quartz filters containing phytoplankton were oven dried at 60 °C
for 24 h. Charophyte samples were weighed to estimate dry biomass then ground to a

81
fine powder in a ball mill (Retsch MM200) in preparation for bulk stable isotope
analysis. Ground charophyte samples were split and one half acidified with 4 % HCl
for 4 h to remove carbonates. Samples were then rinsed three times in MilliQ water,
oven dried and ground. The remaining non-acidified half was retained for separate
stable isotope analysis of δ15
N as the acidification process alters δ15
N values (Bunn
et al., 1995; Mazumder et al., 2010). Quartz filters were also acidified to remove any
carbonates/inorganic carbon.
Dissolved organic carbon (DOC) and total dissolved nitrogen (TDN) of water
samples were measured simultaneously on a Shimadzu TOC-V analyser coupled
with a total nitrogen module (Shimadzu TNM-1). Nitrate (NO3) and Ammonia
(NH4) were measured by continuous flow analysis (Technicon Autoanalyzser II).
Dissolved inorganic nitrogen (DIN) was calculated as DIN = NO3 + NH4. Soluble
reactive phosphorus (SRP) was measured spectrophotometry by the molybdenum
blue method (Murphy & Riley, 1962). pH was measured with a benchtop pH meter
(Orion model 520A).
4.2.6. Stable isotope analysis of plant tissues, filters and water samples
Carbon and nitrogen isotopes of solid samples (plant tissues and quartz samples)
were measured on an isotope ratio mass spectrometer with elemental analyser
(Thermo Delta V). Stable isotope values were reported in delta (δ) notation relative
to the Vienna Pee Dee Belemnite for δ13
C, and atmospheric nitrogen for δ15
N
(equation 1).
𝑅𝑝𝑒𝑟𝑚𝑖𝑙 = (𝑅𝑠𝑎𝑚𝑝𝑙𝑒
𝑅𝑠𝑡𝑎𝑛𝑑𝑎𝑟𝑑− 1) × 1000 [Equation 1]

82
Carbon isotope of dissolved inorganic carbon (δ13
CDIC) and DIC concentration were
measured on a Thermo Delta XL IRMS with Gasbench II. Water isotopes (δ2H and
δ18
O) were measured on a Picarro Cavity Ring-Down Spectrometer. Multi-points
normalization was used in order to reduce raw values to the international scale
(Skrzypek, 2013). Technical details of the instrument and used procedure can be
found in the introduction of Skrzypek and Ford (2014). All isotope values are given
in per mil [‰, VSMOW] according to delta notation (Coplen, 1996).
4.2.7. Calculation of productivity based on uptake of 13
CDIC
Rate of uptake of 13
C by charophytes (Chara sp) and phytoplankton were estimated
from the change in their isotopic compositions over the period of the incubation and
then converted to rates of production (P, mg C g-1
DW h-1
) following Nayar et al.
(2009). Briefly;
𝑃(𝐶ℎ𝑎𝑟𝑎) = 𝐶∗(𝐶𝑒𝑡−𝐶𝑏𝑡)
𝑊∗𝑡∗(𝐶𝑒𝑤−𝐶𝑏𝑡) [Equation 2]
where: P = productivity (mg C g-1
DW h-1
)
C = total carbon content of tissue (mg)
W = dry weight of tissue (g DW)
t = duration of incubation (h)
Cet = 13
C in the enriched tissue (atom %)
Cbt = 13
C in the background tissue (atom %)
Cew = 13
C in the enriched water (atom %)
𝑃(𝑃ℎ𝑦𝑡𝑜𝑝𝑙𝑎𝑛𝑘𝑡𝑜𝑛) = 𝑃𝑂𝐶∗𝑉∗(𝐶𝑒𝑡−𝐶𝑏𝑡)
𝑊∗𝑡∗(𝐶𝑒𝑤−𝐶𝑏𝑡) [Equation 3]

83
where: POC = total carbon content of tissue (mg)
V = volume of BOD bottle (L).
4.2.8. Data analyses
Statistical procedures were conducted in R (R Core Team, 2017) and PRIMER 6
(Primer-E Ltd. UK). Principal component analysis (PCA) was first performed on
pool environmental variables to confirm their hydrological status and assess for any
variance in environmental conditions during the incubations. Environmental data
were normalised then square root transformed prior to analysis. Isotopic and
productivity data was checked for normality (Shapiro-Wilk test) and homogeneity of
variance (Bartlett’s test) prior to executing a two-way ANOVA with nutrient
treatment and pool hydrology as factors. Statistical tests were assessed to be
significant at α = 0.05. Post-hoc Tukey’s HSD was performed for comparisons
where statistically significant differences within factors occurred.

84
Ta
ble
4.2
C:N
:P s
toic
hio
met
ry o
f pool
wat
er,
char
ophyte
s an
d p
hyto
pla
nkto
n.

85
4.3. Results
4.3.1. Pool hydrology and water chemistry
Principal component analysis confirmed that pools operationally defined as
‘persistent’ or "ephemeral’ were clearly differentiated based on their hydrochemistry
(Figure 4.1). The first two principal components explained 68.6 % of the variance
(39.8 % by PC1 and 28.8 % by PC2) (Figure 4.1). SIMPER analysis indicated that
difference between persistent and ephemeral pools was best explained by water
Figure 4.1 PCA ordination diagram of ‘persistent’ (black squares) and ‘ephemeral’ (grey
circles) pools of Coondiner Creek and environmental variables. Cond: Electrical
conductivity , TSS: total suspended solids, TDN: total dissolved nitrogen, δ2H: water stable
isotope deuterium, DIC: dissolved inorganic carbon, 13C-DIC: δ13
CDIC, DOC: dissolved
organic carbon, DO(avg): average dissolved oxygen, DO(range): dissolved oxygen range, NH4:
ammonium, Temp(avg): average water temperature, Temp(range): Water temperature range,
NOx: nitrate/nitrite, SRP: soluble reactive phosphorus, Chl a: Chlorophyll a
86
isotopic ratios (δ2H, δ
18O), DIC concentration and pH. DIN:SRP ratios were < 10:1
for all Coondiner Creek pools at the time of the experiment (Table 4.2). The N:P
ratios of charophyte tissues collected from pools were all less than 6:1 (Table 4.2).
4.3.2. Ecosystem metabolism
Measured dissolved oxygen in the pools ranged from 1.84 to 16.98 mg L-1
, with diel
peak to peak amplitude within any one pool from 2.19 to 10.85 mg L-1
(Figure 4.2).
Surface water temperature ranged from 12.9 to 24.3 °C across all pools, with diel
peak to peak amplitude from 1.2 to 6.3 °C. Gross primary production (GPP) in
Coondiner creek pools estimated from diel dissolved oxygen curves ranged from
1.40 to 20.64 g O2 m-3
d-1
. Community respiration (CR) ranged from 1.16 to 18.64 g
O2 m-3
d-1
. GPP:CR ratios for all pools were > 1, indicating that pools were net
autotrophic at the time of the study (Figure 4.2).

87
Fig
ure
4.2
Die
l dis
solv
ed o
xygen
curv
es f
or
stre
am p
ools
alo
ng C
oondin
er C
reek
. V
alu
es f
or
gro
ss p
rim
ary p
rod
uct
ivit
y (
g O
2 m
-3
d-1
) (G
PP
), c
om
mu
nit
y r
espir
atio
n (
CR
24),
net
eco
syst
em p
roduct
ion (
NE
P),
and G
PP
:CR
rat
io a
re g
iven
on
the
figu
re f
or
each
po
ol.
Gre
y a
nd
lig
ht
shad
ing i
ndic
ate
nig
ht
and d
ay p
erio
ds.
Boxed
are
as s
ignif
y t
ime
envel
op
e fo
r b
ott
le a
ssay
s.
88
4.3.3. 13C enrichment due to photosynthetic uptake of
13C-enriched HCO3
The δ13
C values of phytoplankton were compared at the end of the incubation period
(4 – 6 hours) in both dark and light treatments for bottles both with and without 13
C-
HCO3 additions in order to estimate enrichment due to photosynthetic uptake (Figure
4.3). Phytoplankton incubated without 13
C-HCO3 additions had δ13
C values of -35.12
+/- 1.19 ‰ when incubated under dark conditions and -33.07 +/- 1.10 ‰ under light
conditions. Phytoplankton incubated in presence of 13
C-HCO3 additions had similar
δ13
C values of -34.53 +/- 2.22 ‰ when incubated under dark conditions (controls)
but were highly enriched 103.75 +/- 19.64 ‰ under light conditions.

89
4.3.4. Short-term metabolic response of phytoplankton and charophytes to nutrient
enrichment
Chara tissues and phytoplankton were significantly enriched in 13
C after incubation
with labelled 13
C-HCO3. δ13
C values were significantly higher for ‘light’ treatments
compared to the ‘dark’ treatments for both charophytes (F = 63.7, p < 0.001) and
phytoplankton (F = 51.65, p < 0.001), confirming uptake through photosynthesis
(Figure 4.3). Based on changes in carbon isotope composition through the
incubation, photosynthetic production (P) by charophytes in the control (unamended)
treatments was estimated as 2.14 +/- 0.8 mg C g-1
DW hr-1
. Two-way ANOVA of P
showed that neither nutrient treatment (F = 0.72, p = 0.546) or pool hydrology (F =
0.03, p = 0.874) significantly influenced charophyte production. Hence, charophyte
primary production was not limited by either dissolved N or P. There was also no
interaction effect between nutrient treatment and pool hydrology (F = 0.47, p =
Figure 4.3 Carbon stable isotope ratios of phytoplankton under light/dark conditions
incubated in situ with and without 13C-enriched HCO3 added. Bars are means and error
bars indicate standard error (n = 3).

90
0.703). Charophyte tissue nitrogen content and productivity measured at the end of
incubation were positively and significantly correlated (R2 = 0.65, p < 0.001; Figure
4.5). Productivity of charophytes were also positively correlated to phosphorus tissue
content (R2 = 0.40, p < 0.001) and tissue N:P ratio (R
2 = 0.22, p < 0.001) (Figure
4.5).
Figure 4.4 Short-term productivity response of charophytes and phytoplankton to nutrient
additions in ‘persistent’ and ‘ephemeral’ pools estimated as rate of 13C-enriched HCO3
uptake. Bars are means and error bars indicate standard error (n = 3).

91
Photosynthetic production (P) by phytoplankton in the control (unamended)
treatments was 0.017 +/- 0.01 mg C g-1
DW hr-1
. Photosynthetic production (P) by
phytoplankton was also higher in ‘persistent’ pools compared to ephemeral pools (F
= 9.84, p = 0.003; Figure 4.2). There was no significant increase in productivity with
nutrient addition (F = 1.24, p = 0.302) and no interaction effect between nutrient
treatment and pool hydrology (F = 0.07, p = 0.976).
4.4. Discussion
This study indicated that both charophytes and phytoplankton were metabolically
unresponsive to increases in nutrient availability in the short-term (< 6 h). The
results indicated that both nitrogen and phosphorus were not limiting in the short-
term. Nutrient additions did not significantly increase, nor supress, the rate of
production over the experiment period. It was somewhat surprising that
phytoplankton did not show a short-term response to spikes in N and P, as the
simpler single cell thickness structure of planktonic algae would presumably enable
faster response to environmental perturbations. Other studies have shown an
increase of photosynthetic rate of charophytes in presence of elevated nitrogen
Figure 4.5 Relationship between the rate of production and tissue content in charophytes at
the end of the incubation experiment. Charophyte content of a) nitrogen, (%) b) phosphorus,
and c) nitrogen:phosphorus (N:P) ratio.

92
(Hough & Putt, 1988) or phosphorus (Francoeur, 2017), but these assays were
conducted over 12 - 48 hours, allowing more time for charophytes to respond to
nutrient additions than this study. Conversely, over longer timeframes (i.e. several
weeks), nitrate (Lambert & Davy, 2011) and phosphate (Forsberg, 1964) have also
been shown to have an inhibitory rather that stimulatory effect on growth of
charophytes. Phosphorus concentrations greater than 20 µg PO4-P L-1
can also
impact negatively on charophyte growth (Wetzel, 2001). In contrast, phytoplankton
blooms are a common occurrence when P concentrations are elevated as a result of
eutrophication. However, it is likely that N versus P limitation will vary with
seasonal factors that reflect changes in hydrology, connectivity and particularly
temperature. Recent studies have also shown that charophyte responses to nitrogen
additions are temperature dependent (Puche et al., 2018). For example, warming
favours increased %N and thus N:P ratio of the Mediterranean charophytes Chara
vulgaris and C. hispida (Puche et al., 2018). Pool temperatures varied among pools
in this study. While the effect of temperature on nutrient uptake was not formally
tested it may better explained differences between pools than differentiation of pools
by hydrologic status.
Resolving the charophyte taxonomy beyond genus level within Coondiner Creek
would be useful in determining if any of the variation in response observed between
pools is due to species differences. The interactions between nitrogen uptake and
temperature may also be dependent on species; pioneer species may exhibit more
phenotypic plasticity and be better adapted to changes in temperature and nitrate
level than other species (Puche et al., 2018). Consequently, Confirmation of species
identification is reliant on genetic analysis and detailed observation of oospore
93
features with scanning electron microscopy (Casanova, 2005b), which was beyond
the scope of this study. Visual inspection in the field and subsequent keying out with
available dichotomous keys under light microscopy (Casanova, 2005b; Casanova,
2005a), left species identification unresolved to the genus level (Chara sp.), although
this identification exercise and comparison of samples collected between pools gave
confidence that the experiment was conducted on a single species alone.
The naturally nutrient depauperate conditions of the water column in these pools
would be expected to favour charophyte production over phytoplankton. Whilst
available N and P in both the water column and sediments are low, rates of
production by the charophytes in Coondiner Creek were two orders of magnitude
higher than phytoplankton per unit mass, and even higher when calculated by
biomass. Charophytes overall contribute a much larger proportion than
phytoplankton towards the total primary production within this creek system.
Christensen et al. (2013) reported similar strongly contrasting rates of production
between charophyte beds and phytoplankton in an oligotrophic shallow pond in
Sweden. Submerged macrophyte production was also ten-fold higher than
phytoplankton based on diel dissolved oxygen measurements made in tropical
floodplain wetlands (Adame et al. (2017). The rate of production by charophytes in
the present study is similar to rates measured for other Chara species under optimal
light and temperature (1.5 - 2.6 mg C g-1
DW h-1
) by Vieira and Necchi (2003), and
under natural conditions in Sweden at 0.39 - 4.15 mg C g-1
DW h-1
(Christensen et
al., 2013). Interestingly, these charophyte rates of productivity are also similar to
global average uptake rates (2.6 mg C g−1
DW h−1
) for seagrass communities
(Duarte et al., 2010), while a seagrass species occupying coastal waters and

94
measured in the cooler seasons produces at approximately half the rate (0.93 mg C g-
1 DW h
-1; Nayar et al. (2009). These findings suggest that charophytes may be
significant carbon sinks in IRES. Hence, any reduction in the suitability of pools to
charophyte growth – such as increased phytoplankton biomass and subsequent
change in light environment – may have ramifications for the carbon budgets of
IRES.
Charophyte beds contributed to significant shifts in diel dissolved oxygen levels in
the overlying water in these pools. In this study, very large ranges in dissolved
oxygen concentrations (from 1.84 - 14.94 mg L-1
) were recorded in pools that all had
abundant charophytes. Comparatively, Andersen et al. (2017) recorded dissolved
oxygen concentrations from 3.85 - 15.25 mg L-1
at the surface of charophyte
dominated shallow Swedish lakes. Under these supersaturated conditions, shading
under charophyte beds maintains a relatively anoxic layer at the sediment-water
interface during daylight hours (Andersen et al., 2017). This vertical stratification
may benefit heterotrophic respiration of benthic biofilms, hence enhancing the daily
differences in dissolved oxygen. The dense charophyte beds can carry a significant
epiphytic algae load that is likely to also contribute substantially to pool metabolism.
For comparison, a study from wetlands in tropical Northern Australia measured
epiphyton productivity in the range of 0.57 - 1.82 mg C g-1
DW h-1
depending on
morphology of the macrophyte to which they are attached (Adame et al., 2017).
Consequently, we would expect overall production occurring in charophyte beds (i.e.
including epiphytic algae) to be higher than charophytes alone as measured in this
study.

95
In this study overall metabolic responses between pools was highly variable,
although no difference between pools of contrasting hydrology was found. This
result is somewhat surprising given that previous studies have demonstrated that
connectivity to alluvial water can have a profound effect on organic matter and
nutrient fluxes (Fellman et al., 2011; Siebers et al., 2016). The results did indicate
high production and low production pools that weren’t related to pool hydrology.
Whilst hyporheic connectivity between surface water and alluvial groundwater
somewhat governs the hydrochemical nature of each pool, a larger effect on
phytoplankton and charophyte production is likely due to variations in temperature
as experiment bottles in all pools were light-saturated for the incubations. As
mentioned earlier, the variation in temperature among pools and possibly different
species involved, may partially explain why pool hydrology does not show an effect
on phytoplankton and charophyte production (Hill et al., 2009).
Measuring autotrophic response to nutrients in remote aquatic systems such as those
examined here remains challenging. While reasonably routine approaches to
measuring production were applied here, measurable growth responses to nutrient
additions were difficult. Nevertheless, tissue analysis and coupling of ambient
measurements versus more controlled experimentation and tissue stoichiometry
revealed N to be limiting in at least some pools. The findings also "hint" that
increased P in the water column may inhibit both charophyte and phytoplankton
short-term production in these pools.
There are a few factors that may also explain the lack of significant response to
nutrient additions in the incubation experiment. First, with hindsight the duration of

96
the experiments in this study (4 - 6 h) may have been insufficient for phytoplankton
and charophyte to utilise the excess nutrients immediately i.e. there is a lag between
nutrient uptake and metabolic or growth response. Metabolically, it has been shown
that when adding nutrients to extreme oligotrophic systems it often takes time for the
system to adjust before nutrient uptake can occur (Healey, 1979). ATP production in
photosystem-I takes precedence over carbon assimilation in the Calvin cycle.
Another explanation is that the response change in production is smaller than the
variability between sampling units. Both of these problems (lag-time due to initial
priming requirement, small response) could potentially be assessed by extending the
duration of the experiments to multiple days (Wehr, 1989; Elser et al., 2009),
although day-night cycles will presumably introduce other sources of variation to the
experiment.
Overall, this study demonstrates that charophytes are an important group when it
comes to net ecosystem production. Whilst the results of the main aims of this study
are inconclusive, they are largely consistent with other recent studies of charophytes.
Further investigation into nutrient response of species assemblages over longer
timeframe are warranted to further understand the complex roles of both N and P,
along with hyporheic exchange with alluvial groundwater in regulating production in
these pools.

97
5. CHEMOTAXONOMIC RESPONSES OF AUTOTROPHIC
PERIPHYTON COMMUNITIES TO NUTRIENT ADDITIONS IN
AN INTERMITTENT STREAM
5.1. Introduction
Periphyton communities are attached to surfaces in aquatic systems such as
sediment, rocks, wood or macrophytes and consist of a complex mixture of
autotrophic organisms such as green algae and cyanobacteria, as well as
heterotrophic microorganisms (Wetzel, 2001; Larned, 2010). The biomass and
taxonomic composition of periphyton communities are primarily shaped by the
energy inputs and nutrient status of the water body in which they reside (Townsend
et al., 2012), and are thus highly responsive to nutrient enrichment (Fairchild et al.,
1985; Tank & Dodds, 2003; Tank et al., 2017). Assessment of the periphyton algae
community can provide insight into changes in environmental conditions, and has
been used to indicate the onset of eutrophication (Gaiser et al., 2004) as well as
understand periphyton responses to change in hydrology (Townsend et al., 2012;
Sabater et al., 2016), light environment (Hill et al., 2010; Rier et al., 2014), and
dissolved gasses (Brown et al., 2017). Aquatic macrophytes (Chapter 4) and the
periphyton can contribute more autochthonous biomass than water column
phytoplankton in oligotrophic systems, as whilst the overlying waters are generally
impoverished in available nutrients, the sediment surface is a hotspot for nutrient
exchange (McClain et al., 2003). Periphyton has long been recognised for its
important functional role in the retention of nutrients in aquatic ecosystems,
especially of phosphorus (Reddy et al., 1999; Dodds, 2003; Scinto & Reddy, 2003).

98
Retention of nutrients by periphyton in shallow freshwater systems is further
enhanced by the settling of nutrient-bearing particles, along with efficient uptake and
recycling of nutrients between the autotrophic and heterotrophic component of
periphyton (Dodds, 2003). Consequently, we might expect that periphyton would be
an important nutrient recycler, and basal food source, in shallow pools of dryland
streams. However, despite the ecological significance of periphyton in IRES (Sabater
et al., 2016), the potential changes in periphyton community structure due to shifts in
nutrient availability or hydrologic status of IRES remain largely unknown for much
of inland and especially north Australia.
Intermittent streams in arid regions often depend on groundwater for pools to persist
beyond flood-flow events (Chapters 1 and 2). Groundwater mixing and discharge
into these pools via the hyporheic zone during these inter-flood periods is thus
critical for maintaining stream productivity (Burrows et al., 2018) and determines
carbon and nutrient cycling in pools in IRES and helps maintain higher trophic levels
(Fellman et al., 2011; Siebers et al., 2016). Pools that are not supplemented by
groundwater will undergo evapo-concentration of solutes during prolonged drought
periods with no surface flows (Fellman et al., 2011; Siebers et al., 2016). This
difference in carbon and nutrient status among pools (and seasons) will likely alter
both the biomass and composition of autotrophic periphyton communities and in
particular may result in shifts in dominance of green algae versus cyanobacteria. For
example, recent studies have revealed that P-Fe co-limitation can strongly limit
nitrogen-fixing cyanobacteria in aquatic ecosystems even when P is abundant
(Larson et al., 2018). Further, greater taxa richness and biomass of N2-fixing
organisms have been observed under treatments of phosphorus-iron addition

99
compared to treatments with only phosphorus addition (Larson et al., 2015).
However, the relative responsiveness of different taxonomic groups to
hydrochemical changes in streams with iron-rich sediments, and in particular to
increased nitrogen and phosphorus availability (Chapter 4), is unknown.
Biochemical approaches such as pigment analysis (Tamm et al., 2015) and
metagenomics (Friesen et al., 2017; Bengtsson et al., 2018) are increasingly being
used to characterise the functional taxonomy of freshwater periphyton. Specifically,
chemotaxonomy based on algal accessory pigments via high performance liquid
chromatography (HPLC) is an alternative and straightforward method which is
compatible with algal nutrient limitation experiments (Dalton et al., 2015). Nutrient
diffusing substrate (NDS) experiments conventionally measures Chlorophyll a
pigment as a response variable (Tank et al., 2017). With HPLC the experiment can
expand to also measure the response of algal accessory pigments produced by certain
taxa, and is capable of detecting algal taxa whose physical features are not well
retained in preservative. Chemotaxonomic analysis was developed and is extensively
utilised in marine systems as a means to detect, characterise, and monitor
phytoplankton communities (Wright et al., 1991; Jeffrey et al., 1999), although this
method would be similarly capable for periphyton. Individual pigments of interest
may be isolated for analysis, or the relative abundance of algal taxonomic groups in
the periphyton can be estimated by factor analysis from the calculated pigment ratios
(CHEMTAX: Mackey et al., 1996).
This study investigated the chemotaxonomic response of autotrophic periphyton to
nutrient additions on nutrient diffusing substrate (NDS) and how this response varied

100
among pools of contrasting connectivity to the alluvial groundwater under field
conditions. First, chlorophyll a biomass was measured to identify the extent to which
N and P availability limit periphyton production. Given grazing on algae can
influence overall periphyton responses to nutrient additions (Jones et al., 2000;
Eckert & Carrick, 2014), I compared the biomass of periphyton on nutrient enriched
substrates between open and caged experiments. Second, photosynthetic and
accessory pigments of the periphyton were quantified and Chl a:pigment ratios were
used to determine how autotrophic periphyton composition changed in response to
nutrient additions and how this varied with hydrology. The expectation was that
autotrophic biomass would be limited by both N and P, and that individual nutrient
additions would favour particular periphyton groups leading to distinct changes to
community composition. I also expected that both community compositional
changes and biomass responses to nutrient additions would be most apparent in the
most hydrologically isolated pools. (Jones et al., 2000; Eckert & Carrick, 2014)
5.2. Methods
5.2.1. Site description
As described in previous Chapters, Coondiner Creek is an intermittent – and
extremely ephemeral – dryland stream situated in the Upper Fortescue river
catchment of the Pilbara region of northwest Australia (Chapter 3: Figure 3.1).
Persistent and ephemeral pools (although generally recurring annually in the same
position) are most concentrated within the semi-confined gorge section of the creek
(see Chapter 4). Duration of water retention after cessation of surface flow is based
on a combination of pool hydrology, aspect/position, and channel substrate. The

101
following experiments were conducted at Coondiner Creek during a dry-phase in
July-August 2016. At this point in time surface flows had ceased ~18 months prior
and the stream had retracted to a series of isolated pools along the main channel.
Pools were classed by their hydrology as described in previous Chapters as either
predominately ‘persistent’ or ‘ephemeral’, based on previous studies of pool-
alluvium connectivity within the study catchment (Fellman et al., 2011; Siebers et
al., 2016). Pool hydrologic status was nevertheless confirmed for this study from
water stable isotope ratios measured at the time of sampling (see earlier Chapters).
5.2.2. Nutrient limitation experiments
Nutrient diffusing substrate (NDS) were constructed from 70 mL polypropylene
containers (Sarstedt, Germany) with a glass fibre filter (Whatman GF/F) acting as a
growth surface (Fairchild et al., 1985; Tank & Dodds, 2003). A round opening (⌀42
mm) was cut from the cap to expose the growth substrate. The containers were filled
with 2 % agar solutions amended with 0.5 M NH4NO3 (‘N’ treatment), 0.5 M
KH2PO4 (‘P’ treatment), 0.5 M NH4NO3 + 0.5 M KH2PO4 (‘NP’ treatment), or
unamended (‘C’ control treatment). To test whether grazing by fish and
macroinvertebrates had a significant impact on the biomass and composition of algal
development on the NDS, the nutrient design was duplicated with matching NDS
covered in 5 mm HDPE mesh. Five replicates of each nutrient treatment and grazing
experiment were attached to wire racks with the growth surface face-up and
positioned in either ‘persistent’ or ‘ephemeral’ pools. Samplers were left in situ to
incubate for 28 days, during which time there was no surface flow. After 28 days, all
samples were retrieved and the glass fibre filters removed. Filters and attached
periphyton were immediately placed in 5 mL 90 % acetone (AR grade; Chem-

102
Supply, South Australia), wrapped in foil and refrigerated for transportation back to
the laboratory in Perth within 3 days. The pigment acetone extract was filtered
through a 0.22 µm nylon filter (Thermo Scientific) into 1 mL glass HPLC vials
(Waters, Milford MA). Vials were capped and placed in -80 °C freezer until time of
HPLC analysis. A further 2 mL of sample was filtered and diluted to 20 mL in 90%
acetone for fluorometric determination of chlorophyll a. Sample extracts were
measured on a Trilogy fluorometer (Turner designs, San Jose, CA) using the non-
acidification method (EPA 445.0: Arar & Collins, 1997).
5.2.3. HPLC Pigment analysis
A subset of NDS were selected from the nutrient limitation experiment for pigment
analysis via high performance liquid chromatography (HPLC). The 60 sample subset
consisted of three replicates of each nutrient treatment per site from the ‘grazed’
treatment. A mix of standards and reference materials was used to build up a
pigment library and to calibrate pigments extracted from the samples. A mixed
phytoplankton standard PPS-MIX-119 (DHI group, Denmark) was also injected
once for each ten samples in order to evaluate drift in retention time throughout the
experiment. Peak areas were calibrated against chlorophyll a reference standard
(DHI group, Denmark). Algal reference material extracted from pure cultures of
Dunaliella tertiolecta (chlorophyte), Tetraselmis suecica (chlorophyte), Chaetoceros
muelleri (bacillariophyte) and Tisochrysis lutea (haptophyte) were also run. Method
blanks of 90 % acetone were processed identically to samples and passed through the
entire extraction process.
103
Pigments were quantified on a Waters HPLC system (600 controller, 217
autosampler, Waters, Milford MA) with a reverse-phase C18 column (Spherisorb
ODS2, 250 mm x 4.6 mm, 5 µm particle retention). Our solvents and elution scheme
were modified from Tamm et al. (2015). Solvent A consisted of 80 % methanol: 20
% 0.5 M ammonium acetate (pH 7.2) (v/v). Solvent B consisted of 80 % methanol:
20 % acetone (v/v). The elution scheme consisted of solvents A and B initially in a
50:50 mixture, switched to 100 % solvent B at 30 min, then returned to the 50:50
mixture at 50 min. Column flow rate was set at 0.7 mL min-1
and column
temperature was set at 22 °C for the duration of the experiment. Peaks were detected
with a 996 photodiode array (PDA) detector with scanning range 310 to 750 nm at a
resolution of 1.2 nm. PDA peaks were integrated at a quantification wavelength of
450 nm. Eluent then flowed through a 470 scanning fluorescence detector
(excitation: 440 nm, emission detection: 660 nm). Chromatographs were processed
in Empower2 software. Peaks were identified by comparison with standard reference
material and documented peak retention times and absorbance characteristics;
elution order and peak shape (Wright et al., 1991; Tamm et al., 2015). Peaks were
then integrated and peak area obtained using the software.
5.2.4. Pool hydrochemistry
Water samples were collected at the beginning and end of the incubation period and
analysed for nutrients (TDN: total dissolved nitrogen, SRP: soluble reactive
phosphorus), carbon (DOC: dissolved organic carbon, DIC: dissolved inorganic
carbon, SUVA254: specific ultraviolet absorbance at 254 nm), and stable isotopes of
water (δ2H, δ
18O), and dissolved inorganic carbon (δ
13C-DIC). Nutrient and carbon
samples were filtered through a sterile syringe filter (Sartorius mini-sart 0.45µm).

104
δ13
CDIC, δ2H and δ
18O isotope samples were filtered through a sterile syringe filter
(PALL 0.2 µm Supor) into a glass vial ensuring all headspace was removed. Samples
were immediately refrigerated (4 °C) in the field for transport back to the laboratory
for analysis. DOC and TDN were measured simultaneously on a Shimadzu TOC-V
analyser coupled with a total nitrogen module (Shimadzu TNM-1). Ultraviolet
absorbance at 254 nm was measured on a UV-Vis spectrophotometer (Cary 50,
Varian Medical Systems, Inc. CA USA). Specific ultraviolet absorbance (SUVA254)
was calculated using absorbance at 254 nm and DOC concentration as an estimation
of dissolved aromatic carbon content (Weishaar et al., 2003). Nitrate/nitrite and
ammonia were measured on a continuous flow analyser (Technicon Auto-analyser
II). Soluble reactive phosphorus (SRP) was measured spectrophotometrically by the
modified ascorbic acid method (Murphy & Riley, 1962; Kuo, 1996).
Water isotope samples were measured on a cavity ring-down spectrometer (Piccaro,
Santa Clara, CA, USA) following the analytical method outlined in Skrzypek and
Ford (2014), as described in earlier Chapters. A non-steady- state model was selected
for all pools as pool volume decreased in all pools during the experiment. The
evaporative loss fraction of the pool volume (f) over the duration of the experiment
was then calculated for each pool following Skrzypek et al. (2015), which is based
on a revised Craig-Gordon model (Craig & Gordon, 1965). The stable isotope
composition of the moisture in the ambient air (δA) was calculated using the isotopic
composition of the most recent large precipitation event proceeding the sampling
period and slope of the local evaporation line (LEL).

105
5.2.5. Data analyses
Statistical procedures were conducted in R (R Core Team, 2017) and PRIMER 6 &
PERMANOVA+ (Primer-E Ltd. UK). Pigments were quantified into major algal
groups following the CHEMTAX method (Mackey et al., 1996) with the limSolve
package in R (Soetaert et al., 2009). Initial pigment ratios for determining algal
groups were sourced from freshwater studies in the literature (Schlüter et al., 2006;
Sarmento & Descy, 2008; Dalton et al., 2015; Tamm et al., 2015), and multiple starts
were performed to ensure model convergence. Differences between nutrient and
hydrology factors were assessed using a permutational multivariate analysis of
variance (PERMANOVA) model (Anderson, 2001) for the response variables of i)
chlorophyll a biomass (µg cm-2
), ii) accessory pigment biomass (µg cm-2
) for each
individual peak detected, and ii) proportional taxonomic groups derived from
CHEMTAX analysis of Chl a: Pigment ratios. Univariate PERMANOVA of
chlorophyll a biomass was performed on a euclidean distance matrix produced from
log(x + 1) transformed values. The three-factor model had a crossed design with
pool hydrology (random: ‘persistent’ vs ‘ephemeral’), grazing (fixed: ‘grazed’ vs
‘ungrazed’), and nutrient addition (fixed: ‘C’, ‘N’, ‘P’, ‘NP’) as factors. Multivariate
PERMANOVA of accessory pigment biomass and proportional taxonomic groups
were performed on a Bray-Curtis similarity matrix of log(x + 1) transformed values.
The two-factor mixed effects model was designed with pool hydrology (random) and
nutrient treatment (fixed) as the factors. Each PERMANOVA model was run for 999
permutations with Type I (sequential) sum of squares. We report permutation p-
values at a significance level of α = 0.05. Multivariate data were visualised using the
distance based linear model DistLM procedure to produce dbRDA plots. Two-way
ANOVA were performed to compare pool water nutrient and carbon concentrations

106
between pool hydrology (persistent vs ephemeral pools) and time of sampling (initial
and final).
5.3. Results
5.3.1. Pool nutrients and hydrologic characteristics
The proportion of pool volume evaporative loss (f) ranged from 0.02 to 0.04 for
‘persistent’ pools whilst f ranged from 0.21 to 0.24 for ‘ephemeral’ pools, showing
that overall volumes of persistent pools over the 28 day experimental period
remained relatively constant whereas ephemeral pools lost up to one quarter of their
volume over the same period (Table 5.1). TDN ranged between 0.07 - 0.18 mg L-1
and the concentration was significantly higher in ephemeral pools than persistent
pools (ANOVA: F(1,26) = 8.01, p = 0.009), whilst there was no significant change in
TDN concentration over the course of the experiment. SRP ranged between 1 - 2 µg
L-1
with similar concentrations across both persistent and ephemeral pools, and did
not significantly change over the experimental period (Table 5.1). DOC ranged
between 1.30 – 3.59 mg L-1
and the concentration was significantly higher in
ephemeral pools than persistent pools (ANOVA: F(1,26) = 20.91, p < 0.001), whilst
there was no significant change in DOC concentration over the course of the
experiment.
5.3.2. Periphyton biomass response to nutrient additions
Chlorophyll a biomass ranged from 0.4 to 38.5 µg cm-2
across all treatments at the
end of the 28 day NDS experiment (Figure 5.1). Grazing exclusion did not
significantly affect chlorophyll a biomass (Pseudo-F = 1.61, P (perm) = 0.139).

107
There was also no significant interaction between grazing and nutrient treatments
(Pseudo-F = 0.844, p (perm) = 0.572). The three factor PERMANOVA model
showed that there was a significant difference in how the periphyton biomass
responded to nutrient availability between ‘persistent’ and ‘ephemeral’ pools
(Pseudo-F = 20.338, P (perm) = 0.001), with a significant interaction between
hydrology and nutrient treatment (Pseudo-F = 9.7, P (perm) = 0.001). In both
persistent and ephemeral pools, simultaneous N and P additions increased algal
biomass by more than three-fold compared to the control (Figure 5.1). Biomass also
more than doubled in ‘persistent’ pools in response to "N" alone (Figure 5.1). All
other treatments combinations showed no significant effect on periphyton biomass.
* Results of two-way ANOVA of log (x+1) transformed Chl-a data and its interpretation following
the methodology from Tank & Dodds (2003) are presented in Appendix 2 for reference.
PERMANOVA and the two-way ANOVA yielded similar findings.
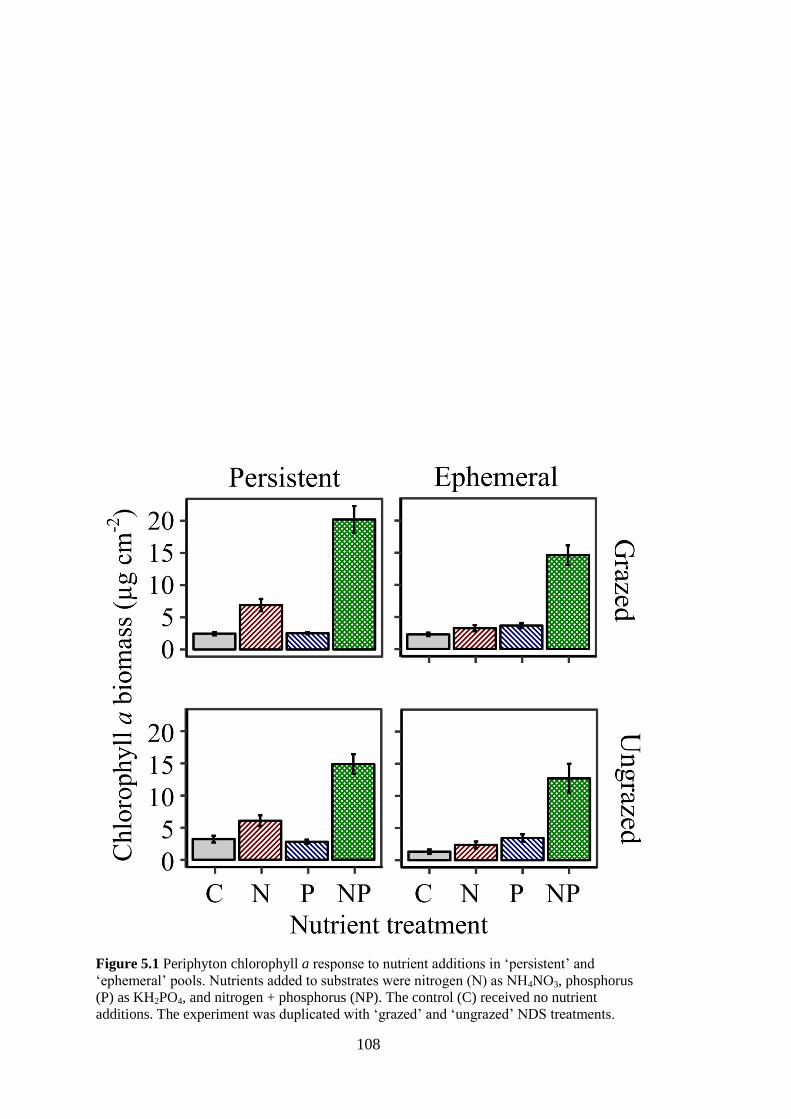
108
Figure 5.1 Periphyton chlorophyll a response to nutrient additions in ‘persistent’ and
‘ephemeral’ pools. Nutrients added to substrates were nitrogen (N) as NH4NO3, phosphorus
(P) as KH2PO4, and nitrogen + phosphorus (NP). The control (C) received no nutrient
additions. The experiment was duplicated with ‘grazed’ and ‘ungrazed’ NDS treatments.
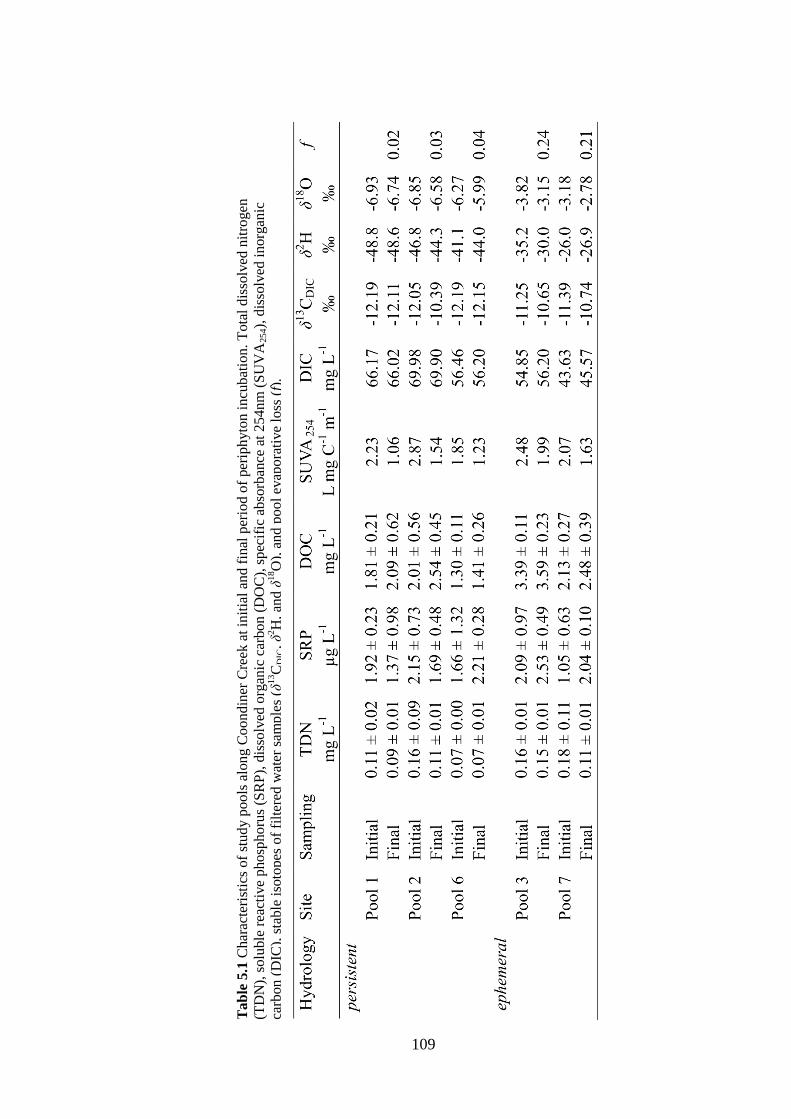
109
Tab
le 5
.1 C
har
acte
rist
ics
of
stu
dy p
oo
ls a
long C
oondin
er C
reek
at
init
ial
and f
inal
per
iod o
f per
iphyto
n i
ncu
bat
ion
. T
ota
l d
isso
lved
nit
rogen
(TD
N),
solu
ble
rea
ctiv
e p
ho
sph
oru
s (S
RP
), d
isso
lved
org
anic
car
bon (
DO
C),
spec
ific
abso
rban
ce a
t 2
54n
m (
SU
VA
254),
dis
solv
ed i
norg
anic
carb
on (
DIC
), s
table
iso
topes
of
filt
ered
wat
er s
ample
s (δ
13C
DIC
, δ
2H
, an
d δ
18O
), a
nd p
ool
evap
ora
tive
loss
(f)
.
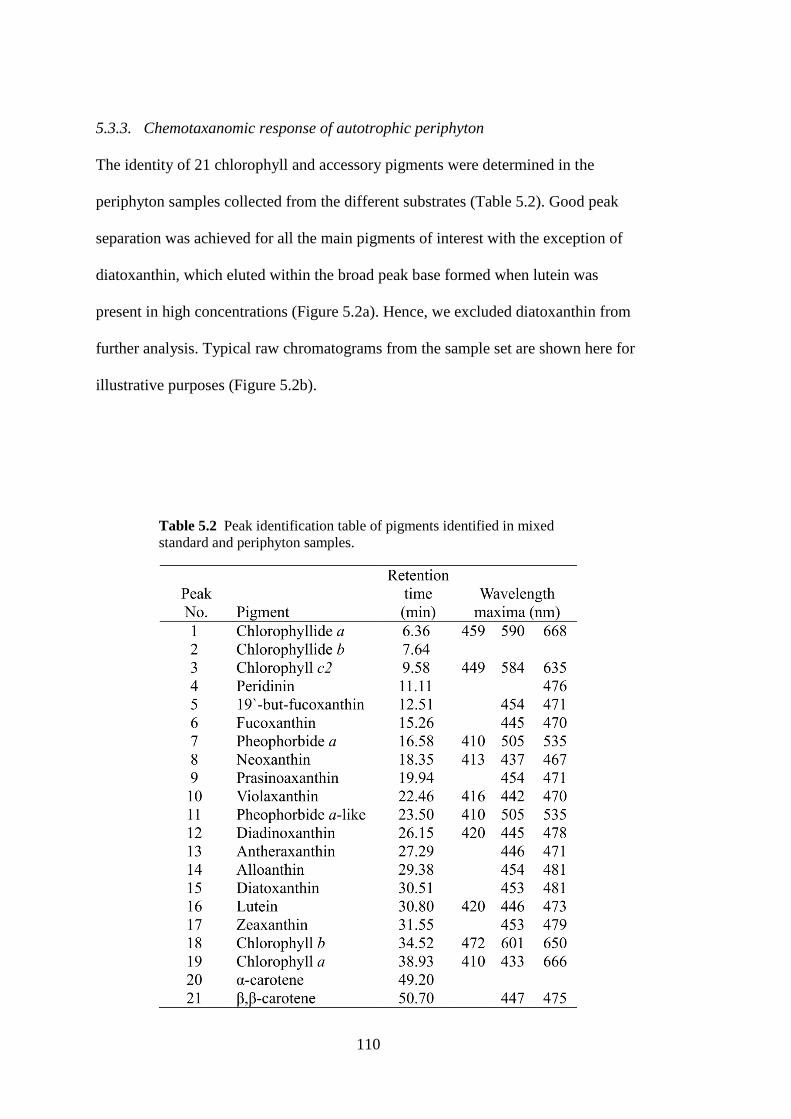
110
5.3.3. Chemotaxanomic response of autotrophic periphyton
The identity of 21 chlorophyll and accessory pigments were determined in the
periphyton samples collected from the different substrates (Table 5.2). Good peak
separation was achieved for all the main pigments of interest with the exception of
diatoxanthin, which eluted within the broad peak base formed when lutein was
present in high concentrations (Figure 5.2a). Hence, we excluded diatoxanthin from
further analysis. Typical raw chromatograms from the sample set are shown here for
illustrative purposes (Figure 5.2b).
Table 5.2 Peak identification table of pigments identified in mixed
standard and periphyton samples.

111
Changes to community structure were evident in shifts in the biomass of accessory
pigments such as Fucoxanthin, Peridinin, and Lutein. The periphyton community
structure responded to nutrient availability differently between pools of ‘persistent’
and ‘ephemeral’ hydrology (Pseudo-F = 7.55, P (perm) = 0.001) (Table 5.3a). The
variation in response among pools and between hydrology to different nutrients can
be observed on axis-1 of the dbRDA plot, with more negative values corresponding
to higher biomass (Figure 5.3a). Axis-1 explains 63.7 % of the variation in the fitted
model. Many of the major pigments also align with axis-1 and are highly correlated
(e.g. Chl-a, Chl-b, Lutein, Fucoxanthin). Axis-2 accounts for 16.9 % of the variation
of the fitted model and distinguishes ‘ephemeral’ pools from, ‘persistent’ pools by a
greater response to the P treatment. This axis illustrates an increase in peridinin and
diadinoxanthin pigments, which are indicative of a higher proportion of
dinoflagellates in ‘ephemeral’ pools, especially with P treatment.

112
Periphyton pigment compositions are considered representative of changes in major
taxonomic groups. Based on the CHEMTAX approach, communities colonising the
control NDS (no nutrient addition) were estimated to consist of 60 % diatoms, 13 -20
% chlorophytes, 7-12 % euglenophytes, 9 % cyanobacteria, and 7 % dinoflagellates
Figure 5.2 HPLC chromatograms showing a) standard pigment mix, peak numbers
correspond with those in Table 5.2, and b) a typical HPLC chromatogram from a persistent
pool showing control (black), nitrogen (red), phosphorus (blue), nitrogen + phosphorus
(green). Absorbance was measured at 450 nm

113
in both ephemeral and persistent pools (Figure 5.4). However, nutrient treatments
differed in their periphyton community structure between pool hydrology (Pseudo-F
= 2.55, P (perm) = 0.030). Relative to the control, P treatments in ‘persistent’ pools
had a decrease in the proportion of diatoms (P: 37 %, NP: 45 %; F = 10.86, p =
0.002) and euglenophytes (P: 3 %, NP: 1%; F = 39.09, p < 0.001), and an increase in
the proportion of chlorophytes (P: 37 %, NP: 38 %; F = 28.98, p < 0.001). There was
no change in the proportion of dinoflagellates. In contrast, P treatments in
‘ephemeral’ pools showed decreased proportions of diatoms (P: 18 %, NP: 22 %; F
= 32.95, p < 0.001), and an increase in dinoflagellates (P: 44 %, NP: 36 %; F =
13.92, p = 0.001) relative to the control, but no change in the proportion of
chlorophytes (Figure 5.4). The community structure of N treatments in ‘persistent’
pools was similar to the control, although the proportion of cyanobacteria was
reduced (F = 12.54, p = 0.001). In contrast, in ‘ephemeral’ pools, the proportion of
diatoms (N: 36 %, NP: 45 %), dinoflagellates (N: 25 %, NP; 36 %), and
euglenophytes (N: 14 %) all increased when N was added either alone or with P.

114
The periphyton community responded significantly differently between pools of
‘persistent’ and ‘ephemeral’ hydrology based on CHEMTAX analysis (Pseudo-F =
14.767, P(perm) = 0.001; Table 5.3b). For both ‘persistent’ and ‘ephemeral’ pools
we observed a shift away from diatom dominated periphyton community when
Figure 5.3 Multidimensional dbRDA plots of pigments extracts from the periphyton NDS
experiment; a) pigment biomass (µg cm-2), and b) estimates of algal group proportions by
CHEMTAX analysis. Results are based on a Bray-Curtis similarity matrix of log(x + 1)
transformed samples (n = 60).
Table 5.3 Factorial two-way mixed effects PERMANOVA of a) periphyton pigment
biomass (µg cm-2
), and b) estimates of algal group contributions from CHEMTAX analysis
of Chl a: Pigment ratios. Pool hydrology and nutrient treatment are included as factors.
Significant P-values are indicated in bold.

115
nutrients were non-limiting. For ‘persistent’ pools I observed a shift from diatoms to
chlorophyta, whilst in ‘ephemeral’ pools there was a shift towards a dinoflagellate
dominated periphyton community. These results are graphically illustrated on the
dbRDA plot with diatoms, chlorophytes, and dinoflagellates separated out strongly
(Figure 5.3b). Axis-1 aligns with communities being chlorophyte or diatom
dominated and explained 58.4 % of the variation of the fitted model. Axis-2 of
dbRDA plot aligns with an increase in the proportion of dinoflagellates and
explained 35 % of the variation of the fitted model.

116
Figure 5.4 Estimates of algal group contributions to periphyton community structure
calculated from Monte Carlo perturbations of CHEMTAX analysis. Nutrients added to
substrates were nitrogen (N) as NH4NO3, phosphorus (P) as KH2PO4, and nitrogen +
phosphorus (NP). The control (C) received no nutrient additions. Mean proportion of each
group per nutrient and hydrology treatment is shown with standard error (n = 3).

117
5.4. Discussion
This study improves our understanding of freshwater algae communities in
northwest Australia (Masini, 1988, 1989; McIntyre, 2009), and is the first to directly
test nutrient limitation on periphyton communities in this region. My results
demonstrate that autotrophic periphyton productivity in Coondiner Creek is nitrogen
and phosphorus co-limited regardless of whether pools were ephemeral or persistent
in hydrology. I observed subtle differences in both chlorophyll a biomass response
and shifts in community structure among pools of differing hydrology. Taxonomic
responses to nutrients varied considerably with hydrology: in general ‘persistent’
pools shifted towards a chlorophyta-dominated community, while ‘ephemeral’ pools
shifted towards a dinoflagellate-dominated community.
Periphyton production (chlorophyll a biomass) was co-limited by N and P. The
combination effect of adding both N and P causes a synergistic response in
autotrophic production. The responses observed in the pools investigated in the
present study are consistent with widespread co-limitation by N and P that has been
observed across a broad range of aquatic systems (Francoeur, 2001; Elser et al.,
2007). In Coondiner Creek, an (as yet) relatively pristine environment, periphyton
communities are most probably highly adapted to scavenging nutrients that may only
be episodically available via increased uptake efficiencies and nutrient recycling
between autotrophic and heterotrophic components (e.g. Scinto & Reddy, 2003).
Phosphorus was the primary nutrient responsible for shifts in periphyton community
structure. Other periphyton limitation studies have indicated that while phosphorus
addition may promote algal biomass, it does not generally result in a change in

118
periphyton community structure in freshwater streams (Dalton et al., 2015; DeNicola
& Lellock, 2015; Vizza et al., 2018). Within Australia, Townsend et al. (2012) found
no change in autotrophic periphyton community structure in a tropical stream
between control and nutrient additions. However, nutrient concentrations in the
Townsend et al. (2012) study were only marginally above ambient conditions. In an
alpine stream, pulses of P were found to result in a reduction in periphyton species
diversity (Davies & Bothwell, 2012). Hence, the source and duration of phosphorus
enrichment to periphyton, rather than the P concentration per se may be more
controlling of community structure.
This in situ study also showed little impact of grazing on periphyton biomass over 28
days, which was a surprising finding. It was assumed prior to deploying the NDS
experiment that grazing by fish and macroinvertebrates would have a negative effect
on the periphyton biomass (e.g. Hillebrand & Kahlert, 2001; Hill et al., 2010). We
observed fish schools within all pools when selecting sites for this study and as
isolated pools act as refuge for native fish populations between flow events (Morgan
& Gill, 2004; Beesley & Prince, 2010; Lostrom et al., 2015), predation pressure by
fish such as Rainbowfish (Melanotaenia australis) would presumably increase as the
pools contract, thus reducing grazing effects of macroinvertebrates on periphyton.
Alternatively, the mesh may have protected small (< 5 mm) grazers from fish
predation. Shading is well known to be a limiting factor in periphyton production
(Von Schiller et al., 2007; Hill et al., 2009; Guo et al., 2016). The mesh used in this
study blocked ~ 5 % light onto the GF/F. Hence, the shading effect would be
minimal and possibly insignificant.
119
This study clearly demonstrates that chemotaxonomic analysis is an effective method
for assessing changes in periphyton community structure. Chemotaxonomic analysis
may be a relatively inexpensive and straightforward approach for monitoring
responses to environmental change e.g. altered flows or nitrate inputs from mining
discharge (Dogramaci et al., 2015; Degnan et al., 2016), increased concentrations
owing to reduced flows (Siebers et al., 2016; Bestland et al., 2017), increased inputs
from dust deposition from fertilizer applications to surrounding catchments and N
and P from cattle (McDowell & Stewart, 2005; Pettit et al., 2012). Overall, these
results demonstrate that periphyton biomass in Pilbara streams is sensitive to both
nitrogen and phosphorus inputs. Surface and groundwater runoff of nitrogen, along
with atmospheric deposition are increasing in northwest Australia due to industrial
activities (fertilizer production, disturbance and airborne dust from resource
extraction), and agricultural (nutrient supplemented irrigation schemes, rangeland
grazing) sources. Hence, these new N sources have the potential to increase rates of
periphyton production in Pilbara streams, which in turn may affect higher trophic
orders.

120
6. GENERAL DISCUSSION
6.1. Overview
The findings of this thesis significantly increase knowledge of the key processes that
drive productivity and metabolism of pools in intermittent rivers and ephemeral
streams (IRES) of hot and arid environments. The results of this research also
demonstrate that IRES in the Pilbara region can be both N and P co-limited; however
the different sensitivities and /or responsiveness among producers to nutrient
additions (i.e. charophytes versus periphyton) also illustrate the complexities of
predicting ecosystem responses to anthropogenic pressures. In these Pilbara streams,
I have shown that between-pool variation in groundwater connectivity also interacts
with nutrient availability such that persistent pools may be more sensitive to excess
N compared to more ephemeral pools. In this final chapter, I discuss the major
findings of the research presented in this thesis within the broader context of current
understanding of how IRES function in hot and arid landscapes. I also consider the
implications of the research findings for the future management of Pilbara streams,
particularly where faced with altered hydrology and changing catchment land use.
6.2. Alluvial groundwater connectivity influences stream biogeochemistry
and metabolism
A strong underlying theme throughout this thesis has been developing an
understanding of the importance of alluvial groundwater connectivity to stream pool
biogeochemistry. Vertical hydrological exchange between the surface water and the
hyporheic zone mediates transport of products – such as mineralised or desorbed

121
phosphorus (Chapter 3) – from biogeochemical activities within the sediments
(Boulton et al., 2010). While hyporheic exchange and the biogeochemical processes
within the sediments are known to occur across multiple hierarchical spatial scales,
there have been remarkably few studies to date that have investigated these
interactions in arid environments. The research presented here seeks to address that
knowledge gap. In Chapter 2, I demonstrate that stream pools at both reach and
catchment scales are strongly shaped by hydrological connectivity. The responses of
the biotic components of pools to nutrient addition are also mediated by the degree
of groundwater connectivity (Chapter 5). Persistent pools also showed much greater
evidence of N limitation than more ephemeral pools. While I observed some
catchment-wide trends, such as increasing solute concentration with evaporation,
none of the typical longitudinal patterns described by the River Continuum Concept
(Vannote et al., 1980) were observed. This suggests that stream models developed
for describing temperate systems may not be suitable for explaining how intermittent
dryland streams function. It is likely that in the Fortescue River catchment local
environmental factors such as hydrology and nutrient cycling generally dominate
over catchment-scale processes.
In this semi-arid landscape stream pool persistence is prolonged by connectivity to
alluvial water. This can lead to higher in-stream productivity, as productivity is
directly dependant on the extent and duration of surface water availability (Bunn et
al., 2006a; Larned et al., 2010; Leigh et al., 2010). However, pool-scale metabolism
measured during this study could not be predicted by connectivity to the alluvial
water (Chapter 4). Other factors such as daily irradiance and tight nutrient cycling
more likely play a substantial role in IRES pool metabolism rates. As these streams
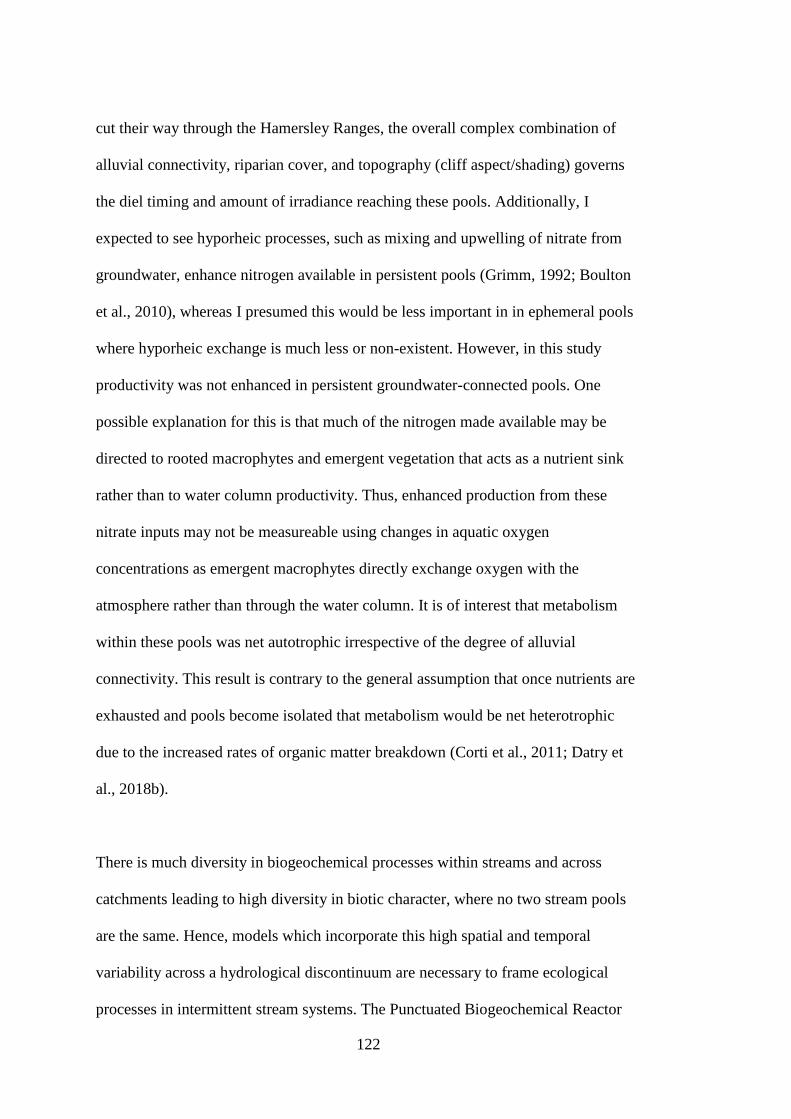
122
cut their way through the Hamersley Ranges, the overall complex combination of
alluvial connectivity, riparian cover, and topography (cliff aspect/shading) governs
the diel timing and amount of irradiance reaching these pools. Additionally, I
expected to see hyporheic processes, such as mixing and upwelling of nitrate from
groundwater, enhance nitrogen available in persistent pools (Grimm, 1992; Boulton
et al., 2010), whereas I presumed this would be less important in in ephemeral pools
where hyporheic exchange is much less or non-existent. However, in this study
productivity was not enhanced in persistent groundwater-connected pools. One
possible explanation for this is that much of the nitrogen made available may be
directed to rooted macrophytes and emergent vegetation that acts as a nutrient sink
rather than to water column productivity. Thus, enhanced production from these
nitrate inputs may not be measureable using changes in aquatic oxygen
concentrations as emergent macrophytes directly exchange oxygen with the
atmosphere rather than through the water column. It is of interest that metabolism
within these pools was net autotrophic irrespective of the degree of alluvial
connectivity. This result is contrary to the general assumption that once nutrients are
exhausted and pools become isolated that metabolism would be net heterotrophic
due to the increased rates of organic matter breakdown (Corti et al., 2011; Datry et
al., 2018b).
There is much diversity in biogeochemical processes within streams and across
catchments leading to high diversity in biotic character, where no two stream pools
are the same. Hence, models which incorporate this high spatial and temporal
variability across a hydrological discontinuum are necessary to frame ecological
processes in intermittent stream systems. The Punctuated Biogeochemical Reactor

123
(PBR) model (Larned et al., 2010) may be a more appropriate model for describing
stream processes within the Fortescue River catchment. This model is based on
material processing rates, and essentially incorporating flow variability to form an
extension of the nutrient spiralling concept (Newbold et al., 1982). The PBR
proposes that within intermittently flowing rivers material processing is rapid during
inundation periods and processing efficiency increases the further the material is
transported downstream. Whilst the PBR model is restricted to simplified contrasts
between wet and dry periods, IRES are generally much more dynamic, with
hydrological periods dominated by expansion, contraction, fragmentation and
desiccation. Hence, in IRES such as in the Pilbara – where isolated stream pools
persist, prolonging the fragmentation period – a significant contribution to material
processing also occurs. For example, DOM transitions to more labile forms over
periods of extended isolation of persistent pools (Fellman et al., 2011; Siebers, 2015;
von Schiller et al., 2015). Thus, these pools are potentially highly important for
‘priming’ of heterotrophic instream processes throughout the catchment when
subsequent flows occur (Guenet et al., 2010).
6.3. Sediment mineralogy constrains within-stream nutrient bioavailability
This study revealed that both nitrogen and phosphorus are strongly limiting at both
the catchment and local stream pool scales. Phosphorus availability in the water
column is constrained in Pilbara streams by i) sediment-P sorption, primarily with
clays and iron-rich minerals, and presumably ii) Calcium-phosphorus co-
precipitation or sorption where Ca is present either in solution or as calcium
carbonate in the sediment. Iron-rich stream sediments in Coondiner Creek acted as a

124
strong abiotic sink for phosphorus, with adsorption capacities far exceeding
phosphorus inputs (Chapter 3). Calcium-phosphorus co-precipitation may be
especially important in regions where carbonate aquifers are the predominant water
source, such as seen in this study at Weeli Wolli Creek, where outcrops of Ca-
bearing calcareous deposits are widespread. Calcium- and/or magnesium- carbonates
also play a role in P sorption processes in sediments (Pant & Reddy, 2001). Pure
calcite has an exceptionally high P sorption capacity (Moharami & Jalali, 2013), and
Ca-P sorption is high in a temperate intermittent river where sediments are
dominated by calcium carbonate (Jalali & Peikam, 2013). Hence, for parts of the
Pilbara region where stream sediments are both iron- and calcium- rich we would
expect abiotic P limitation to be especially strong.
This study demonstrated that moderate DOM additions at similar concentrations to
what we see in evaporated pools reduced sediment adsorption capacity. Chapter 2
demonstrated that there was a relationship between how evaporated a pool is and the
DOC content. Hence, this evapo-concentration of DOC may be reducing the
adsorption capacity of sediments, and therefore making it more likely for
remineralised organic P and any new inorganic P entering the stream to remain in a
bioavailable form. This may partially explain why we see a second flush of
production occurring as these pools dry down. There was a preferential sorption of
high spectral slope DOM to sediments when P is absent or at low concentrations.
Hence, this may partially explain why the proportion of labile DOM increases over
periods of extended isolation (Fellman et al., 2011; Siebers, 2015; von Schiller et al.,
2015). Interactions between organic matter and nutrients are important in regulating
nutrient availability in streams (Coble et al., 2016; Porcal & Kopacek, 2018). Adding

125
allochthonous organic matter to pools directly affects the P adsorption capacity of
sediments and release of Fe-bound phosphate from sediment sinks (Chapter 3).
Altered organic matter, nutrient loads, and/or hydrology due to land use change may
thus have significant but as yet poorly understood impacts on the ecological
functioning of intermittent streams.
The preferential desorption of DOM from sediment at elevated inorganic phosphorus
concentrations (Chapter 3) suggests a potential ‘shunting’ mechanism where
inorganic P is rapidly removed from the bioavailable pool when it come in contact
with these Fe-rich sediments (via adsorption), and releases loosely sorbed organic P
compounds. These organic P compounds may then be more readily utilised by
microbial communities beyond the sediments (e.g. epiphytic and pelagic
heterotrophic bacteria). The exact mechanisms are unclear, although may be an
interesting avenue to pursue in relation to understanding the dynamics of organic
phosphorus in streams (Baldwin, 2013). I undertook a pilot study to characterise
organic P in these Pilbara stream sediments in the early stages of this research
(Appendix I). However, organic P contents were low, and difficult to discern in these
sediments against baseline noise due to interference from iron. While not conclusive,
these initial studies identified orthophosphate monoesters (phytic acids),
orthophosphate diesters (nucleic acids) and pyrophosphates in a range of Pilbara
sediments. Further work pairing batch sorption isotherm experiments with 31
P-
nuclear magnetic resonance to observe changes in organic P associated with
sediments would help elucidate further interactions between DOM-P and
geochemistry in these systems.

126
6.4. Complex responses of aquatic primary productivity to perturbations in
nutrient status in dryland streams
This study showed contradictory results regarding which nutrients were limiting
productivity and is an example of why assessing nutrient limitation at multiple scales
can provide useful insights into the operation of biogeochemical processes within the
system. The catchment-wide stoichiometric approach (Chapter 2) suggested that the
system was P-limited. However, the process-based nutrient limitation studies at the
pool-scale (Chapter 5) demonstrated N and P co-limitation of production, which is
common in freshwater systems globally (Elser et al., 2007). Substantial previous
work has shown that the terrestrial environment (e.g. soils, agricultural production,
and plant communities) of the Pilbara region is also generally depauperate in
phosphorus (Bentley et al., 1999; Islam & Adams, 2001; McIntyre et al., 2009a;
McIntyre et al., 2009b). Within streams, periphytic algae which have evolved in P-
limited systems may be especially effective at retaining P (e.g. Dodds, 2003).
Additionally, heterotrophic microbial uptake and remineralisation of iron-bound P
(otherwise considered biologically unavailable) may be important pathways for
delivering inorganic P to autotrophic organisms (Jaisi et al., 2011). Therefore
capturing additional local pool-scale processes may fill important research gaps to
fully understand nutrient limitation in these systems.
The timing and duration of nutrient limitation experiments may be highly relevant to
a more thorough understanding of biogeochemical processes in this system. An
immediate short-term response is unlikely as the algae in this system (especially
charophytes) are presumably highly adapted to living in an environment depauperate
in P. Longer incubation time allow for algal cells to respond to new conditions, also

127
to flush/deplete internal stores of nutrients to levels where cells are forced to depend
on external inputs. Productivity and biogeochemical processes in these streams may
also vary over the wet-dry hydrological cycle (time-scales of ~seasons to years). It is
likely also that the system fluctuates between primarily N or P limitation through the
seasons and the streams natural hydrological phases (Reisinger et al., 2016). Whilst
characterisation and identification of biogeochemical processes during this ‘dry’ part
of the hydrological phase is important, we are missing the most energetic and
dynamic period within these systems. How nutrients and carbon are transported and
processed during flood-flow events has not been characterised in this study.
However, these first flows are important release of remineralised nutrients and
carbon upon rewetting of sediments (Baldwin & Mitchell, 2000). Consequently,
further investigations which capture the distinct hydrological phases that distinguish
IRES from perennial systems may provide further insights into stream nutrient
processes.
Multi-pigment analysis was used in this study to compliment the more traditional
chlorophyll a methods as a means to collect quantitative periphyton community
response data (Chapter 5). Pigment analysis is useful for characterising algal taxa
including when cryptic or difficult-to-preserve species are present. Another
promising approach consists of metagenomic sequencing of periphyton communities
as a method to simultaneously assess not just autotrophic algae, but also the
heterotrophic bacteria, fungi, and other microbes. Tools that further assess
community structural response may be a move towards novel and bespoke methods
for biomonitoring in IRES (Stubbington et al., 2018) although metagenomics
techniques such as eDNA require an increased understanding of how genetic
128
material is processed within streams (Shogren et al., 2017). Early adopters of eDNA
techniques have mainly been interested in its potential for cataloguing species
(Carew et al., 2017) along with the detecting and monitoring of endangered or
ecologically relevant species (Thomsen & Willerslev, 2015). Metagenomics have
elsewhere been utilised for the characterisation of periphyton communities (Friesen
et al., 2017). However, a breakthrough in obtaining quantitative sequencing is
required to enable eDNA techniques to be suitable for quantitative characterisation
of periphyton communities.. These emerging techniques in ecological "'omics" are a
promising avenue for future studies of the links between community compositional
and functional changes in response to nutrient limitation studies and process
measurements (i.e. productivity rates). .
6.5. Implications from this research to understanding responses of stream
ecosystems in northwest Australia to changing land use and climate
There is increasing concern over the cumulative impacts of mining and agriculture to
the ‘health’ of intermittent streams in the Pilbara. These impacts are coupled with the
uncertainty of how climate change will affect the hydrology across the region. There
is potential for atmospheric and runoff related deposition of nitrogen and phosphorus
to increase throughout northwest Australia. This is due to increase in nitrogen release
from industrial (fertilizer production, disturbance and airborne dust from resource
extraction), and agricultural (large scale nutrient supplemented irrigation schemes,
rangeland grazing) sources. Mining has resulted in numerous stream diversions and
mine voids (pit lakes) impacting the active stream, parafluvial zones, and
groundwater aquifers (McCullough & Lund, 2006; Rojas et al., 2018). A number of
major streams draining the Hamersley Ranges are also being used for current and

129
future mine wastewater discharge operations (Dogramaci et al., 2015; Cook et al.,
2016) (Figure 6.1). Hence, significant changes in groundwater/surface water
hydrology are increasingly widespread across the Pilbara due to both the direct and
cumulative impacts of resource extraction throughout the catchments. Agricultural
practices, such as unregulated cattle grazing in streams and riparian areas (Lyons,
2015), invasion of riparian zones by buffel grass (Cenchrus ciliaris) (Miller et al.,
2010; Marshall et al., 2012), and irrigated fodder crop production (Schelfhout &
Broad, 2015) all have possible impacts on delivery of allochthonous OM to streams.
Dense buffel grass can replace a sparse mixed native herb and grass understorey,
making riparian corridors much more susceptible to bushfire (Pettit & Naiman,
2007; Miller et al., 2010). Soil remineralisation due to fire alter nutrient and carbon
dynamics – in turn affecting stream metabolism through increased inputs – and also
increase the ‘flashiness’ of flows (Pettit & Naiman, 2007; Robson et al., 2018).
Furthermore, the increase in exotic grass biomass has a potential to shift the carbon
source of allochthonous OM from predominantly woody to more labile grassy
materials for aquatic food webs. It is unclear how sensitive IRES are to changes in
these carbon sources or increased catchment loads of nitrogen and phosphorus.

130
While a region of extreme climate variability, the Pilbara region has showed
noticeable wettening in recent decades compared to previous centuries (Cullen &
Grierson, 2007; O'Donnell et al., 2015; Rouillard et al., 2015; Rouillard et al., 2016).
Future climate modelling scenarios predict increased air temperature, with the
delivery of rainfall projected to also change, with a reduction in frequency, but
increase in intensity, of tropical cyclones (Charles et al., 2015; Sudmeyer, 2016).
Importantly, potential evaporation is also projected to increase (Charles et al., 2015),
which will increase the rainfall deficit, and directly affect surface waters. Hence, the
Figure 6.1. Examples of the diversity of hydrologies and settings of streams in the central
Pilbara. Weeli Wolli Creek, a spring-fed creek in the Hamersley Ranges during a) dry
periods receiving minewater discharge, and b) moderate flood after a 30 mm rainfall event.
Note the significant increase in suspended sediments during flood events. c) and d) Typical
catchment vegetation in the Hamersley Ranges. Many hilltops and slopes have sparse
vegetation on highly weathered skeletal soils.

131
extent of stream surface water throughout the region may be expected to contract and
become fragmented more rapidly after flow cessation – a key process in IRES.
Future climates may alter both the extent and duration of surface water, and the
evapo-concentration of nutrients, increasing nutrient retention in isolated stream
pools (McLaughlin, 2008). For streams where evaporation already plays a critical
role in shaping the differences between persistent (alluvially connected) and
ephemeral pools along these streams will increase. Spring-fed ‘persistent’ and the
arguably more vulnerable ‘ephemeral’ pools across the region both have unique
character and will require complementary approaches to enable each to be managed
sustainably. Understanding and managing impacts against a background of extreme
variability remains a challenge.
6.6. Conclusion
The findings of this thesis is particularly timely for intermittent rivers and streams in
the semi-arid areas of Australia in predicting the effects of impending development
on relatively undisturbed riverine landscapes. The information discussed in this
thesis provides important insights into the critical ecological processes in a semi-arid
river catchment. The functioning of intermittent rivers such the one studied here is
characterized by extremely high complexity of ecological processes and highlights
the importance of longitudinal, lateral and vertical linkages of water to the stream.
This study has been the first in the region to mechanistically investigate a key abiotic
process behind nutrient limitation. Also, this study utilised novel but relatively
straightforward approaches to directly measure response of primary producers to
nutrient additions in remote and logistically challenging field conditions. I found that

132
these intermittent hot arid streams are highly dynamic and not well-described by
current stream models. Productivity and ecological community structure is
influenced by several abiotic factors including sediment mineralogical interactions,
groundwater connectivity, and catchment hydrological processes, as well as biotic
factors such as large inputs of allochthonous carbon from riparian vegetation.
Although this thesis has provided some key details of nutrient limitation and the role
of carbon in P availability, there is still limited knowledge of how fluxes of different
forms of carbon, especially terrestrial carbon, influence these stream processes. We
still have only limited knowledge of how nutrient transfers and cycling drive primary
production within these systems where P is tightly bound to sediments and therefore
unavailable. In addition, our knowledge is limited on the mechanisms involved in the
tight cycling of nutrients between the sediments, water and plants and the role of
microorganisms. There is still insufficient knowledge of how this systems work to
predict ecological responses to either human-generated or climate-related changes.
Our limited understanding of the linkages between biogeochemistry and food web
processes in IRES is a key knowledge gap. Studies are required that merge terrestrial
and aquatic ecology with biogeochemistry and hydrology to address this.

133
7. APPENDIX 1 - PILOT STUDY INVESTIGATING THE
SUITABILITY OF 31
P-NMR FOR THE CHARACTERISATION OF
ORGANIC PHOSPHORUS IN IRON-RICH PILBARA STREAM
SEDIMENTS
7.1. Methods
Sediment samples were collected from pools along an intermittent stream
(Coondiner creek) in the Pilbara in October 2013. Sediment was sampled by
collecting the top 5cm of sediment using a corer (diameter = 60 mm). The sediment
core was sieved through 2 mm mesh and the retained <2 mm fraction was dried (60
°C) and ground in a ball mill to a fine powder prior to sample extraction. A sub-
sample of three sediments was selected from the set for this pilot study.
7.1.1. Sample pre-treatment
Samples were subjected to standard NaOH + EDTA extraction (treatment 1)
(Vestergren et al., 2012; Özkundakci et al., 2013) and two sodium dithionite
extraction treatments based on methods proposed in the literature (Reitzel et al.,
2012; Zhang et al., 2013) to reduce iron (Fe) interference in subsequent 31
P-nmr
experiments. Treatment 1 - Sediments were extracted in 0.25 M NaOH + 0.05 M
EDTA at a 1:4 w/v sediment:solvent ratio. Samples were shaken for 16 hr in a rotary
mixer and then centrifuged (2000 rpm for 30 min) and the supernatant retained.
Treatment 2 – Sediment was first extracted in 0.11M NaHCO3 + 0.11M Na2S2O4 at a
1:4 w/v sediment:solvent ratio. Samples were shaken for 2 h in a rotary mixer and
then centrifuged (2000 rpm for 30 min) and the supernatant discarded. Retained

134
solids were then extracted as per treatment 1. Treatment 3 – steps taken as per
treatment 2. 2% 0.11 M NaHCO3 + 0.11 M Na2S2O4 was then added to supernatant
and centrifuged (2000 rpm for 5 min). A 10 mL aliquot of each sample was retained
for ICP analysis and inorganic P by colorimetry. The remaining extract was
lyophilised for 31
P-nmr experiments.
7.1.2. Sediment chemistry
Elemental analysis of sediment extracts was conducted on a PerkinElmer optima
5300DV inductively coupled plasma optical emission spectrometer (ICP-OES).
Elements measured were Al, Ca, Fe, Mg, Mn, P, and S. Inorganic P (Pi) was
measured by the molybdenum-blue ascorbic acid method (Murphy & Riley, 1962).
Organic P (Po) was calculated as the difference between total P determined by ICP-
OES and Pi.
7.1.3. 31P-nmr experiment
Solution 31
P-nmr spectra were acquired at 298 °K on a Bruker AV 500 spectrometer
(Bruker, Germany) at a 31
P frequency of 202.5 MHz. Sample extract was added to a
10 mm glass nmr tube. We used a 90 ° pulse of 41.0 µs, an acquisition time of 1.0 s.
5120 scans were acquired. Chemical shift was referenced to orthophosphoric acid at
5.556 ppm. The spectra presented have a line broadening of 20 Hz and was not
decoupled.

135
T
ab
le 7
.1 C
om
posi
tion o
f se
dim
ent
extr
acts
det
erm
ined
by I
CP
-OE
S a
nd
co
louri
met
ry.
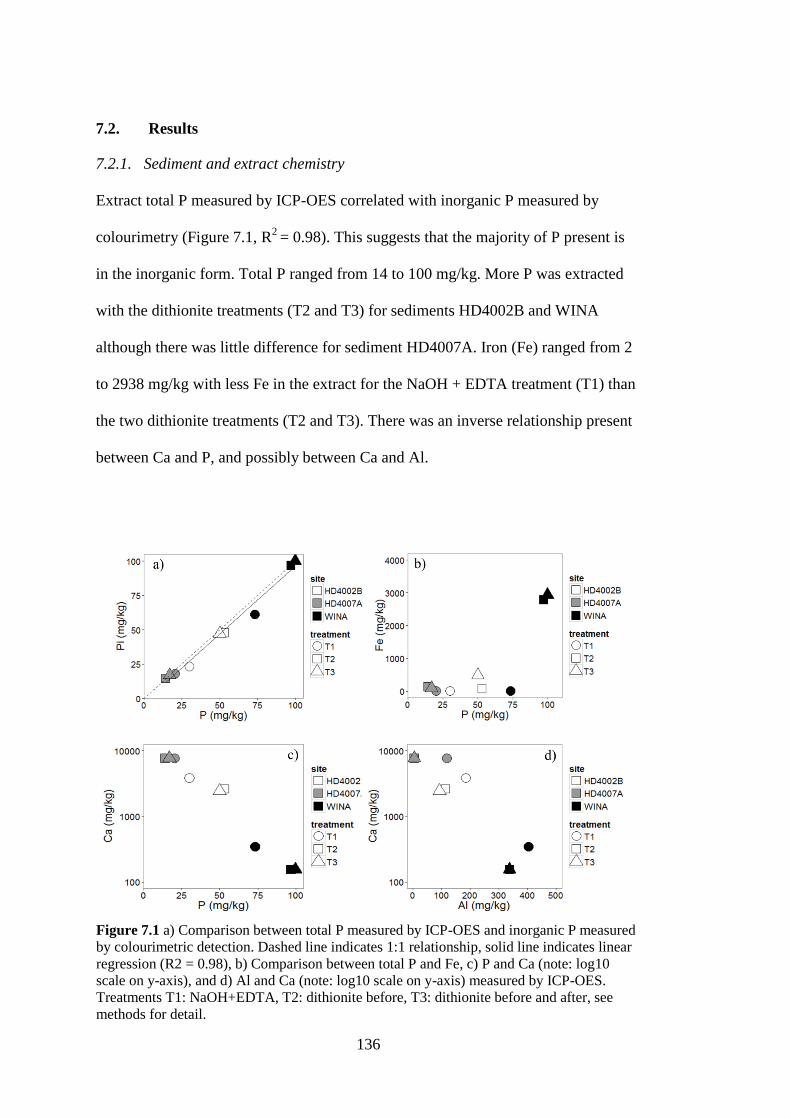
136
7.2. Results
7.2.1. Sediment and extract chemistry
Extract total P measured by ICP-OES correlated with inorganic P measured by
colourimetry (Figure 7.1, R2
= 0.98). This suggests that the majority of P present is
in the inorganic form. Total P ranged from 14 to 100 mg/kg. More P was extracted
with the dithionite treatments (T2 and T3) for sediments HD4002B and WINA
although there was little difference for sediment HD4007A. Iron (Fe) ranged from 2
to 2938 mg/kg with less Fe in the extract for the NaOH + EDTA treatment (T1) than
the two dithionite treatments (T2 and T3). There was an inverse relationship present
between Ca and P, and possibly between Ca and Al.
Figure 7.1 a) Comparison between total P measured by ICP-OES and inorganic P measured
by colourimetric detection. Dashed line indicates 1:1 relationship, solid line indicates linear
regression (R2 = 0.98), b) Comparison between total P and Fe, c) P and Ca (note: log10
scale on y-axis), and d) Al and Ca (note: log10 scale on y-axis) measured by ICP-OES.
Treatments T1: NaOH+EDTA, T2: dithionite before, T3: dithionite before and after, see
methods for detail.

137
7.2.2. 31P-nmr spectra
31P-nmr detected 4 forms of organic phosphate within sediments from Coondiner
creek (Figure 7.2). Peaks were detected at 4 ppm for orthophosphate monoesters
(phytic acid), -1 ppm for orthophosphate diesters (e.g. DNA), -5 ppm for
pyrophosphates, and -23 ppm for polyphosphates. The large peak at 6 ppm
corresponds to inorganic orthophosphate.
7.2.3. Comments on method suitability
Treatment 1 (NaOH + EDTA) was determined to be most suitable for 31P-nmr
analysis. Both treatment 2 and 3 increased the amount of iron in the final sediment
Figure 7.2 Solution 31
P-nmr spectra of NaOH-EDTA soil extract from Window pool (WINA-
t1), Coondiner creek. Prepared on a) Brucker 500 in a 10 mm tube, and b) Brucker 600 in a 5
mm tube. The vertical scale has been exaggerated 10x on the upper trace to delineate
individual peaks.

138
extract. Treatments 2 and 3 (Dithionite extraction steps) were unsuitable as it sends
Fe to the liquid phase causing Fe to go into the extractant rather than being
precipitated out of it. Possibly need to use a higher molar concentration of dithionite
to account for the very high concentration of Fe in sediments. The limit here is that
the reaction requires enough S to react with Fe. The dithionite used in these
extractions was of questionable quality as the bottle had been opened in 2007.
The sample extracts had a lot of iron oxides precipitating out. The reaction only
works if kept in a reducing state as oxidisation causes the Fe to precipitate as iron
oxide. Future studies should take note of redox potential throughout the extraction
process.

139
8. APPENDIX 2 – TWO-WAY ANOVA
Table 8.1 Results of two-way ANOVA of log(x+1) transformed Chlorophyll-a data and its
interpretation following the methodology from Tank & Dodds (2003).
Source df SS MS F-value P-value
a) Persistent pools (grazed)
Nitrogen 1 23.308 23.308 168.69 < 0.001
Phosphorus 1 4.117 4.117 29.8 < 0.001
Nitrogen:Phosphorus 1 3.457 3.457 25.02 < 0.001
Residuals 56 7.737 0.138
b) Ephemeral pools (grazed)
Nitrogen 1 5.189 5.189 56.08 < 0.001
Phosphorus 1 6.89 6.89 74.46 < 0.001
Nitrogen:Phosphorus 1 2.258 2.258 24.41 < 0.001
Residuals 36 3.331 0.093
c) Persistent pools (ungrazed)
Nitrogen 1 13.87 13.87 82.75 < 0.001
Phosphorus 1 2.065 2.065 12.32 < 0.001
Nitrogen:Phosphorus 1 2.816 2.816 16.8 < 0.001
Residuals 56 9.387 0.168
d) Ephemeral pools (ungrazed)
Nitrogen 1 4.933 4.933 21.317 < 0.001
Phosphorus 1 10.201 10.201 44.084 < 0.001
Nitrogen:Phosphorus 1 1.245 1.245 5.382 0.0261
Residuals 36 8.33 0.231
Summary N effect P effect
Interaction
NxP
Two-way ANOVA
interpretation
a) Persistent pools (grazed) Yes Yes Yes N and P colimited
b) Ephemeral pools (grazed) Yes Yes Yes N and P colimited
c) Persistent pools (ungrazed) Yes Yes Yes N and P colimited
d) Ephemeral pools (ungrazed) Yes Yes Yes N and P colimited

140
REFERENCES
Acuna, V., Giorgi, A., Munoz, I., Uehlinger, U., & Sabater, S. (2004). Flow
extremes and benthic organic matter shape the metabolism of a headwater
Mediterranean stream. Freshwater Biology, 49(7), 960-971. doi:
10.1111/j.1365-2427.2004.01239.x
Acuña, V., Datry, T., Marshall, J., Barceló, D., Dahm, C.N., Ginebreda, A.,
McGregor, G., Sabater, S.and others. (2014). Why Should We Care About
Temporary Waterways? Science, 343(6175), 1080-1081. doi:
10.1126/science.1246666
Acuña, V., Casellas, M., Corcoll, N., Timoner, X., & Sabater, S. (2015). Increasing
extent of periods of no flow in intermittent waterways promotes
heterotrophy. Freshwater Biology, 60(9), 1810-1823. doi:
10.1111/fwb.12612
Acuña, V., Hunter, M., & Ruhí, A. (2017). Managing temporary streams and rivers
as unique rather than second-class ecosystems. Biological Conservation, 211,
12-19. doi: 10.1016/j.biocon.2016.12.025
Adame, M.F., Pettit, N.E., Valdez, D., Ward, D., Burford, M.A., & Bunn, S.E.
(2017). The contribution of epiphyton to the primary production of tropical
floodplain wetlands. Biotropica, 49(4), 461-471. doi: 10.1111/btp.12445
Agudelo, S.C., Nelson, N.O., Barnes, P.L., Keane, T.D., & Pierzynski, G.M. (2011).
Phosphorus Adsorption and Desorption Potential of Stream Sediments and

141
Field Soils in Agricultural Watersheds. Journal of Environment Quality,
40(1). doi: 10.2134/jeq2010.0153
Andersen, M.R., Kragh, T., & Sand-Jensen, K. (2017). Extreme diel dissolved
oxygen and carbon cycles in shallow vegetated lakes. Proc Biol Sci,
284(1862). doi: 10.1098/rspb.2017.1427
Anderson, M.J. (2001). A new method for non-parametric multivariate analysis of
variance. Austral Ecology, 26(1), 32-46. doi: 10.1111/j.1442-
9993.2001.01070.pp.x
Andrews, M. (1987). Phosphate uptake by the component parts of Chara hispida.
British Phycological Journal, 22(1), 49-53. doi:
10.1080/00071618700650061
Arar, E.J., & Collins, G.B. (1997). Method 445.0 In Vitro Determination of
Chlorophyll a and Pheophytin ain Marine and Freshwater Algae by
Fluorescence. Washington, DC: U.S. Environmental Protection Agency.
Arndt, N.T., Nelson, D.R., Compston, W., Trendall, A.F., & Thorne, A.M. (2007).
The age of the Fortescue Group, Hamersley Basin, Western Australia, from
ion microprobe zircon U‐Pb results. Australian Journal of Earth Sciences,
38(3), 261-281. doi: 10.1080/08120099108727971
Attygalla, N.W., Baldwin, D.S., Silvester, E., Kappen, P., & Whitworth, K.L.
(2016). The severity of sediment desiccation affects the adsorption
characteristics and speciation of phosphorus. Environ Sci Process Impacts,
18(1), 64-71. doi: 10.1039/c5em00523j
Baimbridge, M., Antao, M., & Loomes, R. (2010). Groundwater dependent
ecosystems for Millstream: ecological values and issues. (13). Department of
Water: Government of Western Australia.

142
Baken, S., Moens, C., van der Grift, B., & Smolders, E. (2016). Phosphate binding
by natural iron-rich colloids in streams. Water Research, 98(Supplement C),
326-333. doi: 10.1016/j.watres.2016.04.032
Baker, A., Reynolds, D.M., Lead, J., Coble, P.G., Spencer, R.G.M., Murphy, K.R.,
Bro, R., & Stedmon, C.A. (2014). Chemometric Analysis of Organic Matter
Fluorescence Aquatic Organic Matter Fluorescence (pp. 339-375).
Cambridge: Cambridge University Press.
Baldwin, D.S. (1996). Effects of exposure to air and subsequent drying on the
phosphate sorption characteristics of sediments from a eutrophic reservoir.
Limnology and Oceanography, 41(8), 1725-1732. doi:
10.4319/lo.1996.41.8.1725
Baldwin, D.S. (1999). Dissolved organic matter and phosphorus leached from fresh
and 'terrestrially' aged river red gum leaves: implications for assessing river-
floodplain interactions. Freshwater Biology, 41(4), 675-685. doi:
10.1046/j.1365-2427.1999.00404.x
Baldwin, D.S., & Mitchell, A.M. (2000). The effects of drying and re‐flooding on
the sediment and soil nutrient dynamics of lowland river–floodplain systems:
a synthesis. Regulated Rivers: Research & Management, 16(5), 457-467. doi:
10.1002/1099-1646(200009/10)16:5<457::Aid-rrr597>3.0.Co;2-b
Baldwin, D.S., Mitchell, A.M., & Rees, G.N. (2000). The effects of in situ drying on
sediment-phosphate interactions in sediments from an old wetland.
Hydrobiologia, 431(1), 3-12. doi: 10.1023/a:1004015019608
Baldwin, D.S. (2013). Organic phosphorus in the aquatic environment.
Environmental Chemistry, 10(6), 439-454. doi: 10.1071/En13151

143
Barber, M., & Jackson, S. (2011). Aboriginal water values and resource development
pressures in the Pilbara region of north-west Australia. Australian Aboriginal
Studies, 2011(2), 32-49.
Barber, M., & Jackson, S. (2012). Indigenous engagement in Australian mine water
management: The alignment of corporate strategies with national water
reform objectives. Resources Policy, 37(1), 48-58. doi:
10.1016/j.resourpol.2011.12.006
Barnett, J.C., & Commander, D.P. (1985). Hydrogeology of the western Fortescue
Valley, Pilbara region, Western Australia. Perth: Western Australia
Geological Survey.
Beesley, L.S., & Prince, J. (2010). Fish community structure in an intermittent river:
the importance of environmental stability, landscape factors and within-pool
habitat descriptors. Marine and Freshwater Research, 61(5), 605-614. doi:
10.1071/MF09137
Bengtsson, M.M., Wagner, K., Schwab, C., Urich, T., & Battin, T.J. (2018). Light
availability impacts structure and function of phototrophic stream biofilms
across domains and trophic levels. Mol Ecol, 27(14), 2913-2925. doi:
10.1111/mec.14696
Bentley, D., Grierson, P.F., Bennett, L.T., & Adams, M.A. (1999). Evaluation of
anion exchange membranes to estimate bioavailable phosphorus in native
grasslands of semi‐arid Northwestern Australia. Communications in Soil
Science and Plant Analysis, 30(15-16), 2231-2244. doi:
10.1080/00103629909370368
Bernhardt, E.S., Heffernan, J.B., Grimm, N.B., Stanley, E.H., Harvey, J.W., Arroita,
M., Appling, A.P., Cohen, M.J.and others. (2018). The metabolic regimes of

144
flowing waters. Limnology and Oceanography, 63, S99-S118. doi:
10.1002/lno.10726
Bestland, E., George, A., Green, G., Olifent, V., Mackay, D., & Whalen, M. (2017).
Groundwater dependent pools in seasonal and permanent streams in the Clare
Valley of South Australia. Journal of Hydrology: Regional Studies, 9, 216-
235. doi: 10.1016/j.ejrh.2016.12.087
Bieroza, M.Z., & Heathwaite, A.L. (2016). Unravelling organic matter and nutrient
biogeochemistry in groundwater-fed rivers under baseflow conditions:
Uncertainty in in situ high-frequency analysis. Sci Total Environ, 572, 1520-
1533. doi: 10.1016/j.scitotenv.2016.02.046
Boano, F., Harvey, J.W., Marion, A., Packman, A.I., Revelli, R., Ridolfi, L., &
Wörman, A. (2014). Hyporheic flow and transport processes: Mechanisms,
models, and biogeochemical implications. Reviews of Geophysics, 52(4),
603-679. doi: 10.1002/2012rg000417
Boulton, A.J., Findlay, S., Marmonier, P., Stanley, E.H., & Valett, H.M. (1998). The
Functional Significance of the Hyporheic Zone in Streams and Rivers.
Annual Review of Ecology and Systematics, 29, 59-81. doi: 10.2307/221702
Boulton, A.J., Datry, T., Kasahara, T., Mutz, M., & Stanford, J.A. (2010). Ecology
and management of the hyporheic zone: stream–groundwater interactions of
running waters and their floodplains. Journal of the North American
Benthological Society, 29(1), 26-40. doi: 10.1899/08-017.1
Bowman, R.A., & Cole, C.V. (1978). An exploratory method for fractionation of
organic phosphorous from grassland soils. Soil Science, 125(2), 95-101.
Brown, T.-R.W., Low-Décarie, E., Pillsbury, R.W., Fox, G.A., & Scott, K.M.
(2017). The effects of elevated atmospheric CO2 on freshwater periphyton in
145
a temperate stream. Hydrobiologia, 794(1), 333-346. doi: 10.1007/s10750-
017-3108-4
Brunauer, S., Emmett, P.H., & Teller, E. (1938). Adsorption of Gases in
Multimolecular Layers. Journal of the American Chemical Society, 60(2),
309-319. doi: 10.1021/ja01269a023
Buffam, I., Galloway, J.N., Blum, L.K., & McGlathery, K.J. (2001). A
stormflow/baseflow comparison of dissolved organic matter concentrations
and bioavailability in an Appalachian stream. Biogeochemistry, 53(3), 269-
306. doi: 10.1023/a:1010643432253
Bunn, S.E., Loneragan, N.R., & Kempster, M.A. (1995). Effects of acid washing on
stable-isotope ratios of C and N in Penaeid shrimp and seagrass -
Implications for food-web studies using multiple stable isotopes. Limnology
and Oceanography, 40(3), 622-625.
Bunn, S.E., Davies, P.M., & Winning, M. (2003). Sources of organic carbon
supporting the food web of an arid zone floodplain river. Freshwater
Biology, 48(4), 619-635. doi: 10.1046/j.1365-2427.2003.01031.x
Bunn, S.E., Balcombe, S.R., Davies, P.M., Fellows, C.S., & McKenzie-Smith, F.J.
(2006a). Aquatic productivity and food webs of desert river ecosystems. In
R.T. Kingsford (Ed.), Ecology of Desert Rivers (pp. 76-99). Melbourne:
Cambridge University Press.
Bunn, S.E., Thoms, M.C., Hamilton, S.K., & Capon, S.J. (2006b). Flow variability
in dryland rivers: Boom, bust and the bits in between. River Research and
Applications, 22(2), 179-186. doi: 10.1002/rra.904
Burrows, R.M., Hotchkiss, E.R., Jonsson, M., Laudon, H., McKie, B.G., &
Sponseller, R.A. (2015). Nitrogen limitation of heterotrophic biofilms in

146
boreal streams. Freshwater Biology, 60(7), 1237-1251. doi:
10.1111/fwb.12549
Burrows, R.M., Rutlidge, H., Valdez, D.G., Venarsky, M., Bond, N., R. , Andersen,
M.S., Fry, B., Eberhard, S.M.and others. (2018). Groundwater supports
intermittent-stream food webs. Freshwater Science, 37(1), 42-53. doi:
10.1086/696533
Campeau, A., Wallin, M.B., Giesler, R., Lofgren, S., Morth, C.M., Schiff, S.,
Venkiteswaran, J.J., & Bishop, K. (2017). Multiple sources and sinks of
dissolved inorganic carbon across Swedish streams, refocusing the lens of
stable C isotopes. Sci Rep, 7(1), 9158. doi: 10.1038/s41598-017-09049-9
Cao, X., Wu, P., Han, Z., Tu, H., & Zhang, S. (2016). Factors controlling the isotope
composition of dissolved inorganic carbon in a karst-dominated wetland
catchment, Guizhou Province, Southwest China. Environmental Earth
Sciences, 75(14). doi: 10.1007/s12665-016-5899-4
Capps, K.A., Booth, M.T., Collins, S.M., Davison, M.A., Moslemi, J.M., El-
Sabaawi, R.W., Simonis, J.L., & Flecker, A.S. (2011). Nutrient diffusing
substrata: a field comparison of commonly used methods to assess nutrient
limitation. Journal of the North American Benthological Society, 30(2), 522-
532. doi: 10.1899/10-146.1
Carew, M.E., Nichols, S.J., Batovska, J., St Clair, R., Murphy, N.P., Blacket, M.J., &
Shackleton, M.E. (2017). A DNA barcode database of Australia’s freshwater
macroinvertebrate fauna. Marine and Freshwater Research, 68(10). doi:
10.1071/mf16304
Carey, C.C., Ibelings, B.W., Hoffmann, E.P., Hamilton, D.P., & Brookes, J.D.
(2012). Eco-physiological adaptations that favour freshwater cyanobacteria in
147
a changing climate. Water Res, 46(5), 1394-1407. doi:
10.1016/j.watres.2011.12.016
Carpenter, S.R., Cole, J.J., Hodgson, J.R., Kitchell, J.F., Pace, M.L., Bade, D.,
Cottingham, K.L., Essington, T.E.and others. (2001). Trophic Cascades,
Nutrients, and Lake Productivity: Whole-Lake Experiments. Ecological
Monographs, 71(2). doi: 10.1890/0012-
9615(2001)071[0163:Tcnalp]2.0.Co;2
Casanova, M.T. (2005a). An overview of Chara L. in Australia (Characeae,
Charophyta). Australian Systematic Botany, 18(1), 25-39. doi:
10.1071/SB04027
Casanova, M.T. (2005b). Charophytes of the Pilbara Region of Western Australia:
M.T. Casanova.
Casas-Ruiz, J.P., Catalán, N., Gómez-Gener, L., von Schiller, D., Obrador, B.,
Kothawala, D.N., López, P., Sabater, S.and others. (2017). A tale of pipes
and reactors: Controls on the in-stream dynamics of dissolved organic matter
in rivers. Limnology and Oceanography, 62(S1), S85-S94. doi:
10.1002/lno.10471
Charles, S., Fu, G., Silberstein, R., Mpelasoka, F., McFarlane, D., Hodgson, G.,
Teng, J., Gabrovsek, C.and others. (2015). Hydroclimate of the Pilbara: past,
present and future. A technical report to the Government of Western
Australian and industry partners from the CSIRO Pilbara Water Resource
Assessment. Australia.
Chen, Y., Zhang, L., Xu, C., & Vaidyanathan, S. (2016). Dissolved inorganic carbon
speciation in aquatic environments and its application to monitor algal carbon

148
uptake. Sci Total Environ, 541, 1282-1295. doi:
10.1016/j.scitotenv.2015.10.025
Cheng, W.P., Chi, F.H., & Yu, R.F. (2004). Effect of phosphate on removal of
humic substances by aluminum sulfate coagulant. J Colloid Interface Sci,
272(1), 153-157. doi: 10.1016/j.jcis.2003.08.074
Christensen, J.P.A., Sand-Jensen, K., & Staehr, P.A. (2013). Fluctuating water levels
control water chemistry and metabolism of a charophyte-dominated pond.
Freshwater Biology, 58(7), 1353-1365. doi: 10.1111/fwb.12132
Coble, A.A., Marcarelli, A.M., Kane, E.S., & Huckins, C.J. (2016). Uptake of
ammonium and soluble reactive phosphorus in forested streams: influence of
dissolved organic matter composition. Biogeochemistry, 131(3), 355-372.
doi: 10.1007/s10533-016-0284-7
Cook, P., Dogramaci, S., McCallum, J., & Hedley, J. (2016). Groundwater age,
mixing and flow rates in the vicinity of large open pit mines, Pilbara region,
northwestern Australia. Hydrogeology Journal, 25(1), 39-53. doi:
10.1007/s10040-016-1467-y
Coplen, T.B. (1996). New guidelines for reporting stable hydrogen, carbon, and
oxygen isotope-ratio data. Geochimica et Cosmochimica Acta, 60(17), 3359-
3360. doi: 10.1016/0016-7037(96)00263-3
Corti, R., Datry, T., Drummond, L., & Larned, S.T. (2011). Natural variation in
immersion and emersion affects breakdown and invertebrate colonization of
leaf litter in a temporary river. Aquatic Sciences, 73(4), 537-550. doi:
10.1007/s00027-011-0216-5

149
Cottingham, K.L., Ewing, H.A., Greer, M.L., Carey, C.C., & Weathers, K.C. (2015).
Cyanobacteria as biological drivers of lake nitrogen and phosphorus cycling.
Ecosphere, 6(1). doi: 10.1890/es14-00174.1
Craig, H., & Gordon, L.I. (1965). Deuterium and oxygen 18 variations in the ocean
and the marine atmosphere. Paper presented at the Conference on Stable
Isotopes in Oceanographic Studies and Paleotemperatures, Pisa.
Cullen, L.E., & Grierson, P.F. (2007). A stable oxygen, but not carbon, isotope
chronology of Callitris columellaris reflects recent climate change in north-
western Australia. Climatic Change, 85(1-2), 213-229. doi: 10.1007/s10584-
006-9206-3
Dalton, R.L., Boutin, C., & Pick, F.R. (2015). Determining in situ periphyton
community responses to nutrient and atrazine gradients via pigment analysis.
Science of The Total Environment, 515-516, 70-82. doi:
10.1016/j.scitotenv.2015.01.023
Datry, T., Larned, S.T., & Tockner, K. (2014). Intermittent Rivers: A Challenge for
Freshwater Ecology. BioScience. doi: 10.1093/biosci/bit027
Datry, T., Fritz, K., & Leigh, C. (2016). Challenges, developments and perspectives
in intermittent river ecology. Freshwater Biology, 61(8), 1171-1180. doi:
10.1111/fwb.12789
Datry, T., Bonada, N., & Boulton, A.J. (2017). Intermittent Rivers and Ephemeral
Streams : Ecology and Management. San Diego, UNITED STATES:
Elsevier Science & Technology.
Datry, T., Boulton, A.J., Bonada, N., Fritz, K., Leigh, C., Sauquet, E., Tockner, K.,
Hugueny, B.and others. (2018a). Flow intermittence and ecosystem services

150
in rivers of the Anthropocene. J Appl Ecol, 55(1), 353-364. doi:
10.1111/1365-2664.12941
Datry, T., Foulquier, A., Corti, R., von Schiller, D., Tockner, K., Mendoza-Lera, C.,
Clément, J.C., Gessner, M.O.and others. (2018b). A global analysis of
terrestrial plant litter dynamics in non-perennial waterways. Nature
Geoscience. doi: 10.1038/s41561-018-0134-4
Daugherty, E.E., Gilbert, B., Nico, P.S., & Borch, T. (2017). Complexation and
Redox Buffering of Iron(II) by Dissolved Organic Matter. Environmental
Science & Technology, 51(19), 11096-11104. doi: 10.1021/acs.est.7b03152
Davies, J.-M., & Bothwell, M.L. (2012). Responses of lotic periphyton to pulses of
phosphorus: P-flux controlled growth rate. Freshwater Biology, 57(12),
2602-2612. doi: 10.1111/fwb.12032
de Baar, H.J.W. (1994). von Liebig's law of the minimum and plankton ecology
(1899–1991). Progress in Oceanography, 33(4), 347-386. doi:
10.1016/0079-6611(94)90022-1
De Vries, S.B., Hoeve, J., Sauquet, E., Leigh, C., Bonada, N., Fike, K., & Datry, T.
(2015). Characterizing spatial and temporal patterns of intermittent rivers.
Paper presented at the EGU General Assembly Conference Abstracts,
Vienna, AT.
Degnan, J.R., Bohlke, J.K., Pelham, K., Langlais, D.M., & Walsh, G.J. (2016).
Identification of Groundwater Nitrate Contamination from Explosives Used
in Road Construction: Isotopic, Chemical, and Hydrologic Evidence. Environ
Sci Technol, 50(2), 593-603. doi: 10.1021/acs.est.5b03671

151
DeNicola, D.M., & Lellock, A.J. (2015). Nutrient limitation of algal periphyton in
streams along an acid mine drainage gradient. Journal of Phycology, 51(4),
739-749. doi: 10.1111/jpy.12315
DJTSI. (2018). Western Australia Iron Ore Profile May 2018. Perth: Government of
Western Australia Retrieved from http://www.jtsi.wa.gov.au/docs/default-
source/default-document-library/wa-iron-ore-profile-
0518.pdf?sfvrsn=d34f6d1c_4.
Dodds, W.K. (2003). The role of periphyton in phosphorus retention in shallow
freshwater aquatic systems. Journal of Phycology, 39(5), 840-849. doi:
10.1046/j.1529-8817.2003.02081.x
Dogramaci, S., Skrzypek, G., Dodson, W., & Grierson, P.F. (2012). Stable isotope
and hydrochemical evolution of groundwater in the semi-arid Hamersley
Basin of subtropical northwest Australia. Journal of Hydrology, 475, 281-
293. doi: 10.1016/j.jhydrol.2012.10.004
Dogramaci, S., Firmani, G., Hedley, P., Skrzypek, G., & Grierson, P.F. (2015).
Evaluating recharge to an ephemeral dryland stream using a hydraulic model
and water, chloride and isotope mass balance. Journal of Hydrology, 521,
520-532. doi: 10.1016/j.jhydrol.2014.12.017
Dogramaci, S., & Skrzypek, G. (2015). Unravelling sources of solutes in
groundwater of an ancient landscape in NW Australia using stable Sr, H and
O isotopes. Chemical Geology, 393-394, 67-78. doi:
10.1016/j.chemgeo.2014.11.021
Doolette, A.L., Smernik, R.J., & Dougherty, W.J. (2011). A quantitative assessment
of phosphorus forms in some Australian soils. Soil Research, 49(2), 152-165.
doi: 10.1071/SR10092

152
DOW. (2010). Pilbara regional water plan 2010-2030. Perth, Western Australia:
Government of Western Australia.
Duarte, C.M., Marbà, N., Gacia, E., Fourqurean, J.W., Beggins, J., Barrón, C., &
Apostolaki, E.T. (2010). Seagrass community metabolism: Assessing the
carbon sink capacity of seagrass meadows. Global Biogeochemical Cycles,
24(4), n/a-n/a. doi: 10.1029/2010gb003793
Eckert, R., & Carrick, H. (2014). Evidence for consumer regulation of biofilm–
nutrient interactions among hardwater streams (Pennsylvania, USA).
Hydrobiologia, 722(1), 183-198. doi: 10.1007/s10750-013-1699-y
Ejarque, E., Freixa, A., Vazquez, E., Guarch, A., Amalfitano, S., Fazi, S., Romani,
A.M., & Butturini, A. (2017). Quality and reactivity of dissolved organic
matter in a Mediterranean river across hydrological and spatial gradients. Sci
Total Environ, 599-600, 1802-1812. doi: 10.1016/j.scitotenv.2017.05.113
Elser, J.J., Bracken, M.E.S., Cleland, E.E., Gruner, D.S., Harpole, W.S., Hillebrand,
H., Ngai, J.T., Seabloom, E.W.and others. (2007). Global analysis of nitrogen
and phosphorus limitation of primary producers in freshwater, marine and
terrestrial ecosystems. Ecology Letters, 10(12), 1135-1142. doi:
10.1111/j.1461-0248.2007.01113.x
Elser, J.J., Andersen, T., Baron, J.S., Bergström, A.-K., Jansson, M., Kyle, M.,
Nydick, K.R., Steger, L.and others. (2009). Shifts in lake N:P stoichiometry
and nutrient limitation driven by atmospheric nitrogen deposition. Science,
326(5954), 835-837. doi: 10.1126/science.1176199
EPA. (2014). Cumulative environmental impacts of development in the Pilbara
region: Advice of the Environmental Protection Authority to the Minister for
Environment under Section 16(e) of the Environmental Protection Act 1986.

153
Retrieved from
http://www.epa.wa.gov.au/Policies_guidelines/strategicadvice/Pages/Pilbaras
16e2014.aspx.
Fairchild, G.W., Lowe, R.L., & Richardson, W.B. (1985). Algal Periphyton Growth
on Nutrient-Diffusing Substrates: An in situ Bioassay. Ecology, 66(2), 465-
472. doi: 10.2307/1940395
Fellman, J.B., Dogramaci, S., Skrzypek, G., Dodson, W., & Grierson, P.F. (2011).
Hydrologic control of dissolved organic matter biogeochemistry in pools of a
subtropical dryland river. Water Resources Research, 47. doi:
10.1029/2010wr010275
Fellman, J.B., Petrone, K.C., & Grierson, P.F. (2013). Leaf litter age, chemical
quality, and photodegradation control the fate of leachate dissolved organic
matter in a dryland river. Journal of Arid Environments, 89, 30-37. doi:
10.1016/j.jaridenv.2012.10.011
Fellman, J.B., Spencer, R.G.M., Raymond, P.A., Pettit, N.E., Skrzypek, G., Hernes,
P.J., & Grierson, P.F. (2014). Dissolved organic carbon biolability decreases
along with its modernization in fluvial networks in an ancient landscape.
Ecology, 95(9), 2622-2632. doi: 10.1890/13-1360.1
Fellows, C., Clapcott, J., Udy, J., Bunn, S., Harch, B., Smith, M., & Davies, P.
(2006). Benthic Metabolism as an Indicator of Stream Ecosystem Health.
Hydrobiologia, 572(1), 71-87. doi: 10.1007/s10750-005-9001-6
Fellows, C., Wos, M., Pollard, P., & Bunn, S. (2007). Ecosystem metabolism in a
dryland river waterhole. Marine and Freshwater Research, 58(3), 250-262.
doi: doi:10.1071/MF06142

154
Fink, J.R., Inda, A.V., Bavaresco, J., Barrón, V., Torrent, J., & Bayer, C. (2016).
Adsorption and desorption of phosphorus in subtropical soils as affected by
management system and mineralogy. Soil and Tillage Research, 155, 62-68.
doi: 10.1016/j.still.2015.07.017
Fisher, S.G., Grimm, N.B., Marti, E., Holmes, R.M., & Jones, J.B. (1998). Material
spiraling in stream corridors: A telescoping ecosystem model. Ecosystems,
1(1), 19-34. doi: 10.1007/s100219900003
Fisher, S.G., Sponseller, R.A., & Heffernan, J.B. (2004). Horizons in stream
biogeochemistry: Flowpaths to progress. Ecology, 85(9), 2369-2379. doi:
10.1890/03-0244
Ford, D.J., Cookson, W.R., Adams, M.A., & Grierson, P.F. (2007). Role of soil
drying in nitrogen mineralization and microbial community function in semi-
arid grasslands of north-west Australia. Soil Biology & Biochemistry, 39(7),
1557-1569. doi: 10.1016/j.soilbio.2007.01.014
Forsberg, C. (1964). Phosphorus, a Maximum Factor in the Growth of Characeae.
Nature, 201(4918), 517-518. doi: 10.1038/201517a0
Francoeur, S.N. (2001). Meta-analysis of lotic nutrient amendment experiments:
detecting and quantifying subtle responses. Journal of the North American
Benthological Society, 20(3), 358-368. doi: 10.2307/1468034
Francoeur, S.N. (2017). Stimulation of Saginaw Bay charophyte photosynthesis by
phosphorus. Journal of Great Lakes Research, 43(3), 192-197. doi:
10.1016/j.jglr.2017.03.015
Freundlich, H. (1907). Über die Adsorption in Lösungen. Zeitschrift für
Physikalische Chemie, 57U(1). doi: 10.1515/zpch-1907-5723

155
Friesen, V., Doig, L.E., Markwart, B.E., Haakensen, M., Tissier, E., & Liber, K.
(2017). Genetic Characterization of Periphyton Communities Associated
with Selenium Bioconcentration and Trophic Transfer in a Simple Food
Chain. Environ Sci Technol, 51(13), 7532-7541. doi:
10.1021/acs.est.7b01001
Gaiser, E.E., Scinto, L.J., Richards, J.H., Jayachandran, K., Childers, D.L., Trexler,
J.C., & Jones, R.D. (2004). Phosphorus in periphyton mats provides the best
metric for detecting low-level P enrichment in an oligotrophic wetland.
Water Research, 38(3), 507-516. doi: 10.1016/j.watres.2003.10.020
Gardiner, S.J. (2003). Impacts of Mining and Mine Closure on Water Quality and the
Nature of the Shallow Aquifer, Yandi Iron Ore Mine. Curtin University,
Unpublished thesis.
Geofabric (Cartographer). (2012). Australian Hydrological Geospatial Fabric.
Retrieved from http://www.bom.gov.au/water/geofabric
Gonçalves, J.F., de Souza Rezende, R., Gregório, R.S., & Valentin, G.C. (2014).
Relationship between dynamics of litterfall and riparian plant species in a
tropical stream. Limnologica - Ecology and Management of Inland Waters,
44, 40-48. doi: 10.1016/j.limno.2013.05.010
Gordon, N.D., McMahon, T.A., Finlayson, B.L., Gippel, C.J., & Nathan, R.J. (2004).
Stream Hydrology: An Introduction for Ecologists (2nd Edition ed.). West
Sussex, England: John Wiley & Sons.
Grierson, P.F., Comerford, N.B., & Jokela, E.J. (1998). Phosphorus mineralization
kinetics and response of microbial phosphorus to drying and rewetting in a
Florida Spodosol. Soil Biology & Biochemistry, 30(10-11), 1323-1331. doi:
10.1016/s0038-0717(98)00002-9

156
Grimm, N., B. , & Fisher, S., G. . (1986). Nitrogen Limitation in a Sonoran Desert
Stream. Journal of the North American Benthological Society, 5(1), 2-15.
doi: 10.2307/1467743
Grimm, N.B., Fisher, S.G., & Minckley, W.L. (1981). Nitrogen and Phosphorus
Dynamics in Hot Desert Streams of Southwestern USA. Hydrobiologia,
83(2), 303-312. doi: Doi 10.1007/Bf00008281
Grimm, N.B. (1992). Biogeochemistry of Nitrogen in Sonoran Desert Streams.
Journal of the Arizona-Nevada Academy of Science, 26(2), 139-155.
Gu, B., Schmitt, J., Chen, Z., Liang, L., & McCarthy, J.F. (1995). Adsorption and
desorption of different organic matter fractions on iron oxide. Geochimica et
Cosmochimica Acta, 59(2), 219-229. doi: 10.1016/0016-7037(94)00282-Q
Guenet, B., Danger, M., Abbadie, L., & Lacroix, G. (2010). Priming effect: bridging
the gap between terrestrial and aquatic ecology. Ecology, 91(10), 2850-2861.
doi: 10.1890/09-1968.1
Guo, F., Kainz, M.J., Valdez, D., Sheldon, F., & Bunn, S.E. (2016). The effect of
light and nutrients on algal food quality and their consequent effect on grazer
growth in subtropical streams. Freshwater Science, 35(4), 1202-1212. doi:
10.1086/688092
Halse, S.A., Scanlon, M.D., Cocking, J.S., Smith, M.J., & Kay, W.R. (2007). Factors
affecting river health and its assessment over broad geographic ranges: the
Western Australian experience. Environ Monit Assess, 134(1-3), 161-175.
doi: 10.1007/s10661-007-9607-4
Halse, S.A., Scanlon, M.D., Cocking, J.S., Barron, H.J., Richardson, J.B., &
Eberhard, S.M. (2014). Pilbara stygofauna: deep groundwater of an arid
landscape contains globally significant radiation of biodiversity. Records of

157
the Western Australian Museum, Supplement, 78(2). doi:
10.18195/issn.0313-122x.78(2).2014.443-483
Hamilton, S.K., Bunn, S.E., Thoms, M.C., & Marshall, J.C. (2005). Persistence of
aquatic refugia between flow pulses in a dryland river system (Cooper Creek,
Australia). Limnology and Oceanography, 50(3), 743-754. doi:
10.4319/lo.2005.50.3.0743
Harjung, A., Sabater, F., & Butturini, A. (2018). Hydrological connectivity drives
dissolved organic matter processing in an intermittent stream. Limnologica,
68, 71-81. doi: 10.1016/j.limno.2017.02.007
Harris, G.P. (2001). Biogeochemistry of nitrogen and phosphorus in Australian
catchments, rivers and estuaries: effects of land use and flow regulation and
comparisons with global patterns. Marine and Freshwater Research, 52(1),
139 - 149. doi: 10.1071/mf00031
Healey, F.P. (1979). Short-Term Responses of Nutrient-Deficient Algae to Nutrient
Addition1. Journal of Phycology, 15(3), 289-299. doi: 10.1111/j.0022-
3646.1979.00289.x
Helms, J.R., Stubbins, A., Ritchie, J.D., Minor, E.C., Kieber, D.J., & Mopper, K.
(2008). Absorption spectral slopes and slope ratios as indicators of molecular
weight, source, and photobleaching of chromophoric dissolved organic
matter. Limnology and Oceanography, 53(3), 955-969. doi:
10.4319/lo.2008.53.3.0955
Hill, W.R., Fanta, S.E., & Roberts, B.J. (2009). Quantifying phosphorus and light
effects in stream algae. Limnology and Oceanography, 54(1), 368-380. doi:
10.4319/lo.2009.54.1.0368

158
Hill, W.R., Smith, J.G., & Stewart, A.J. (2010). Light, nutrients, and herbivore
growth in oligotrophic streams. Ecology, 91(2), 518-527. doi: 10.1890/09-
0703.1
Hillebrand, H., & Kahlert, M. (2001). Effect of grazing and nutrient supply on
periphyton biomass and nutrient stoichiometry in habitats of different
productivity. Limnology and Oceanography, 46(8), 1881-1898. doi:
10.4319/lo.2001.46.8.1881
Holford, I.C.R. (1997). Soil phosphorus: its measurement, and its uptake by plants.
Australian Journal of Soil Research, 35(2). doi: 10.1071/s96047
Hough, R.A., & Putt, D.A. (1988). Factors Influencing Photosynthetic Productivity
of Chara vulgaris L. in a Moderately Productive Hardwater Lake. Journal of
Freshwater Ecology, 4(4), 411-418. doi: 10.1080/02705060.1988.9665192
Howitt, J.A., Baldwin, D.S., Rees, G.N., & Hart, B.T. (2008). Photodegradation,
interaction with iron oxides and bioavailability of dissolved organic matter
from forested floodplain sources. Marine and Freshwater Research, 59(9),
780-791. doi: 10.1071/mf07225
Islam, M., & Adams, M.A. (2001). Phosphorus Availability and the Nutrient and
Carbon Content of Mulga Understorey Species: Comparisons with Other
Vegetation Types in Sub-tropical, Semi-arid Rangelands in the Pilbara,
Western Australia. Pakistan Journal of Biological Sciences, 4(4), 381-387.
doi: 10.3923/pjbs.2001.381.387
Jaisi, D.P., Kukkadapu, R.K., Stout, L.M., Varga, T., & Blake, R.E. (2011). Biotic
and Abiotic Pathways of Phosphorus Cycling in Minerals and Sediments:
Insights from Oxygen Isotope Ratios in Phosphate. Environmental Science &
Technology, 45(15), 6254-6261. doi: 10.1021/es200456e

159
Jalali, M., & Peikam, E.N. (2013). Phosphorus sorption-desorption behaviour of
river bed sediments in the Abshineh river, Hamedan, Iran, related to their
composition. Environmental Monitoring and Assessment, 185(1), 537-552.
doi: 10.1007/s10661-012-2573-5
Jeffrey, S.W., Wright, S.W., & Zapata, M. (1999). Recent advances in HPLC
pigment analysis of phytoplankton. Marine and Freshwater Research, 50(8),
879-896. doi: Doi 10.1071/Mf99109
Jones, I.J., Moss, B., Eaton, J.W., & Young, J.O. (2000). Do submerged aquatic
plants influence periphyton community composition for the benefit of
invertebrate mutualists? Freshwater Biology, 43(4), 591-604. doi:
10.1046/j.1365-2427.2000.t01-1-00538.x
Kennard, M.J., Pusey, B.J., Olden, J.D., Mackay, S.J., Stein, J.L., & Marsh, N.
(2010). Classification of natural flow regimes in Australia to support
environmental flow management. Freshwater Biology, 55(1), 171-193. doi:
10.1111/j.1365-2427.2009.02307.x
Kerr, J., Burford, M., Olley, J., & Udy, J. (2011). Phosphorus sorption in soils and
sediments: implications for phosphate supply to a subtropical river in
southeast Queensland, Australia. Biogeochemistry, 102(1-3), 73-85. doi:
10.1007/s10533-010-9422-9
Kerr, J.G., Burford, M., Olley, J., & Udy, J. (2010). The effects of drying on
phosphorus sorption and speciation in subtropical river sediments. Marine
and Freshwater Research, 61(8), 928-935. doi: 10.1071/MF09124
Kingsford, R.T. (2000). Ecological impacts of dams, water diversions and river
management on floodplain wetlands in Australia. Austral Ecology, 25(2),
109-127. doi: 10.1111/j.1442-9993.2000.tb00012.x

160
Komuro, T., Kamiya, H., Yamamuro, M., & Seike, Y. (2017). The Effect of
Charophyte Communities on Phosphorus Flow in Lake Shinji, Japan. Aquatic
Science and Technology, 5(1). doi: 10.5296/ast.v5i1.10557
Kranendonk, M.J.V., Hickman, A.H., Smithies, R.H., Nelson, D.R., & Pike, G.
(2002). Geology and Tectonic Evolution of the Archean North Pilbara
Terrain,Pilbara Craton, Western Australia. Economic Geology, 97(4), 695-
732. doi: 10.2113/gsecongeo.97.4.695
Kufel, L., & Kufel, I. (2002). Chara beds acting as nutrient sinks in shallow lakes—a
review. Aquatic Botany, 72(3–4), 249-260. doi: 10.1016/S0304-
3770(01)00204-2
Kufel, L., Biardzka, E., & Strzałek, M. (2013). Calcium carbonate incrustation and
phosphorus fractions in five charophyte species. Aquatic Botany, 109(0), 54-
57. doi: 10.1016/j.aquabot.2013.04.002
Kuo, S. (1996). Phosphorus. In D.L. Sparks (Ed.), Methods of Soil Analysis: Part 3
(pp. 869-919). Madison: SSSA and ASA, Madison.
Lambert, S.J., & Davy, A.J. (2011). Water quality as a threat to aquatic plants:
discriminating between the effects of nitrate, phosphate, boron and heavy
metals on charophytes. New Phytologist, 189(4), 1051-1059. doi:
10.1111/j.1469-8137.2010.03543.x
Langmuir, I. (1918). The Adsorption of Gases on Plane Surfaces of Glass, Mica and
Platinum. Journal of the American Chemical Society, 40(9), 1361-1403. doi:
10.1021/ja02242a004
Larned, S.T. (2010). A prospectus for periphyton: recent and future ecological
research. Journal of the North American Benthological Society, 29(1), 182-
206. doi: 10.1899/08-063.1

161
Larned, S.T., Datry, T., Arscott, D.B., & Tockner, K. (2010). Emerging concepts in
temporary-river ecology. Freshwater Biology, 55(4), 717-738. doi:
10.1111/j.1365-2427.2009.02322.x
Larson, C.A., Liu, H., & Passy, S.I. (2015). Iron supply constrains producer
communities in stream ecosystems. FEMS Microbiol Ecol, 91(5). doi:
10.1093/femsec/fiv041
Larson, C.A., Mirza, B., Rodrigues, J.L.M., & Passy, S.I. (2018). Iron limitation
effects on nitrogen-fixing organisms with possible implications for
cyanobacterial blooms. FEMS Microbiol Ecol, 94(5). doi:
10.1093/femsec/fiy046
Leigh, C., Sheldon, F., Kingsford, R.T., & Arthington, A.H. (2010). Sequential
floods drive 'booms' and wetland persistence in dryland rivers: a synthesis.
Marine and Freshwater Research, 61(8), 896-908. doi: 10.1071/mf10106
Leigh, C., Boulton, A.J., Courtwright, J.L., Fritz, K., May, C.L., Walker, R.H., &
Datry, T. (2015). Ecological research and management of intermittent rivers:
an historical review and future directions. Freshwater Biology. doi:
10.1111/fwb.12646
Leigh, C., & Datry, T. (2017). Drying as a primary hydrological determinant of
biodiversity in river systems: a broad-scale analysis. Ecography, 40(4), 487-
499. doi: 10.1111/ecog.02230
Likens, G.E., Walker, K.F., Davies, P.E., Brookes, J., Olley, J., Young, W.J., Thoms,
M.C., Lake, P.S.and others. (2009). Ecosystem science: toward a new
paradigm for managing Australia's inland aquatic ecosystems. Marine and
Freshwater Research, 60(3), 271-279. doi: 10.1071/mf08188

162
Littlefield, L., & Forsberg, C. (1965). Absorption and Translocation of Phosphorus-
32 by Chara globularis Thuill. Physiologia Plantarum, 18(2), 291-293. doi:
10.1111/j.1399-3054.1965.tb06891.x
Lostrom, S., Evans, J.P., Grierson, P.F., Collin, S.P., Davies, P.M., & Kelley, J.L.
(2015). Linking stream ecology with morphological variability in a native
freshwater fish from semi-arid Australia. Ecology and Evolution, 5(16),
3272-3287. doi: 10.1002/ece3.1590
Lu, J., Faggotter, S.J., Bunn, S.E., & Burford, M.A. (2017). Macrophyte beds in a
subtropical reservoir shifted from a nutrient sink to a source after drying then
rewetting. Freshwater Biology, 62(5), 854-867. doi: 10.1111/fwb.12904
Lyons, M.N. (2015). The riparian flora and plant communities of the Pilbara region
of Western Australia. Records of the Western Australian Museum,
Supplement, 78(2). doi: 10.18195/issn.0313-122x.78(2).2015.485-513
Mackey, M.D., Mackey, D.J., Higgins, H.W., & Wright, S.W. (1996). CHEMTAX -
a program for estimating class abundances from chemical markers:
application to HPLC measurements of phytoplankton. Marine Ecology
Progress Series, 144, 265-283. doi: 10.3354/meps144265
Madsen, T.V., & Sand-Jensen, K. (1991). Photosynthetic carbon assimilation in
aquatic macrophytes. Aquatic Botany, 41(1-3), 5-40. doi: 10.1016/0304-
3770(91)90037-6
Magliozzi, C., Grabowski, R., Packman, A.I., & Krause, S. (2017). Scaling down
hyporheic exchange flows: from catchments to reaches. Hydrology and Earth
System Sciences Discussions, 1-53. doi: 10.5194/hess-2016-683
Marshall, V.M., Lewis, M.M., & Ostendorf, B. (2012). Buffel grass (Cenchrus
ciliaris) as an invader and threat to biodiversity in arid environments: A

163
review. Journal of Arid Environments, 78, 1-12. doi:
10.1016/j.jaridenv.2011.11.005
Martinsen, K.T., Andersen, M.R., Kragh, T., & Sand-Jensen, K. (2017). High rates
and close diel coupling of primary production and ecosystem respiration in
small, oligotrophic lakes. Aquatic Sciences, 79(4), 995-1007. doi:
10.1007/s00027-017-0550-3
Masini, R.J. (1988). Inland waters of the Pilbara, Western Australia (Part 1). Perth,
W.A: Perth, W.A : Environmental Protection Authority.
Masini, R.J. (1989). Inland waters of the Pilbara, Western Australia (Part 2). Perth,
W.A: Perth, W.A : Environmental Protection Authority.
Mather, C.C., Skrzypek, G., Dogramaci, S., & Grierson, P.F. (2018).
Paleoenvironmental and paleohydrochemical conditions of dolomite
formation within a saline wetland in arid northwest Australia. Quaternary
Science Reviews, 185, 172-188. doi: 10.1016/j.quascirev.2018.02.007
Mazumder, D., Iles, J., Kelleway, J., Kobayashi, T., Knowles, L., Saintilan, N., &
Hollins, S. (2010). Effect of acidification on elemental and isotopic
compositions of sediment organic matter and macro-invertebrate muscle
tissues in food web research. Rapid Communications in Mass Spectrometry,
24(20), 2938-2942. doi: 10.1002/rcm.4729
McClain, M.E., Boyer, E.W., Dent, C.L., Gergel, S.E., Grimm, N.B., Groffman,
P.M., Hart, S.C., Harvey, J.W.and others. (2003). Biogeochemical hot spots
and hot moments at the interface of terrestrial and aquatic ecosystems.
Ecosystems, 6(4), 301-312. doi: 10.1007/s10021-003-0161-9

164
McCullough, C.D., & Lund, M.A. (2006). Opportunities for Sustainable Mining Pit
Lakes in Australia. Mine Water and the Environment, 25(4), 220-226. doi:
10.1007/s10230-006-0136-0
McDowell, R.W., & Sharpley, A.N. (2001). A Comparison of Fluvial Sediment
Phosphorus (P) Chemistry in Relation to Location and Potential to Influence
Stream P Concentrations. Aquatic Geochemistry, 7(4), 255-265. doi:
10.1023/a:1015274426411
McDowell, R.W., & Stewart, I. (2005). Phosphorus in Fresh and Dry Dung of
Grazing Dairy Cattle, Deer, and Sheep. J. Environ. Qual., 34(2), 598-607.
doi: 10.2134/jeq2005.0598
McIntyre, R.E.S. (2009). Soil biogeochemistry and flooding in intermittent streams
of the semi-arid Pilbara region. The University of Western Australia,
Unpublished thesis.
McIntyre, R.E.S., Adams, M.A., Ford, D.J., & Grierson, P.F. (2009a). Rewetting and
litter addition influence mineralisation and microbial communities in soils
from a semi-arid intermittent stream. Soil Biology & Biochemistry, 41(1), 92-
101. doi: 10.1016/j.soilbio.2008.09.021
McIntyre, R.E.S., Adams, M.A., & Grierson, P.F. (2009b). Nitrogen mineralization
potential in rewetted soils from a semi-arid stream landscape, north-west
Australia. Journal of Arid Environments, 73(1), 48-54. doi:
10.1016/j.jaridenv.2008.09.011
McLaughlin, C. (2008). Evaporation as a nutrient retention mechanism at Sycamore
Creek, Arizona. Hydrobiologia, 603(1), 241-252. doi: 10.1007/s10750-007-
9275-y

165
Meier, M., Namjesnik-Dejanovic, K., Maurice, P.A., Chin, Y.P., & Aiken, G.R.
(1999). Fractionation of aquatic natural organic matter upon sorption to
goethite and kaolinite. Chemical Geology, 157(3-4), 275-284. doi: Doi
10.1016/S0009-2541(99)00006-6
Miller, G., Friedel, M., Adam, P., & Chewings, V. (2010). Ecological impacts of
buffel grass (Cenchrus ciliarisL.) invasion in central Australia – does field
evidence support a fire-invasion feedback? The Rangeland Journal, 32(4).
doi: 10.1071/rj09076
Miller, J.B., & Tans, P.P. (2003). Calculating isotopic fractionation from
atmospheric measurements at various scales. Tellus B, 55(2), 207-214. doi:
10.1034/j.1600-0889.2003.00020.x
Mitchell, A., & Baldwin, D.S. (1998). Effects of desiccation/oxidation on the
potential for bacterially mediated P release from sediments. Limnology and
Oceanography, 43(3), 481-487.
Mitrovic, S.M., Oliver, R.L., Rees, C., Bowling, L.C., & Buckney, R.T. (2003).
Critical flow velocities for the growth and dominance of Anabaena circinalis
in some turbid freshwater rivers. Freshwater Biology, 48(1), 164-174. doi:
10.1046/j.1365-2427.2003.00957.x
Moharami, S., & Jalali, M. (2013). Removal of phosphorus from aqueous solution
by Iranian natural adsorbents. Chemical Engineering Journal, 223, 328-339.
doi: 10.1016/j.cej.2013.02.114
Morgan, D.L., & Gill, H.S. (2004). Fish fauna in inland waters of the Pilbara (Indian
Ocean) Drainage Division of Western Australia evidence for three
subprovinces. Zootaxa, 636(1), 1-43. doi: 10.11646/zootaxa.636.1.1

166
Mortimer, C.H. (1941). The exchange of dissolved substances between mud and
water in lakes. Journal of Ecology, 29, 280-329. doi: Doi 10.2307/2256395
Mulholland, P.J., & Webster, J.R. (2010). Nutrient dynamics in streams and the role
of J-NABS. Journal of the North American Benthological Society, 29(1),
100-117. doi: 10.1899/08-035.1
Müller, B., Stierli, R., & Wüest, A. (2006). Phosphate adsorption by mineral
weathering particles in oligotrophic waters of high particle content. Water
Resources Research, 42(10). doi: 10.1029/2005wr004778
Murphy, J., & Riley, J.P. (1962). A modified single solution method for the
determination of phosphate in natural waters. Analytica Chimica Acta, 27(0),
31-36. doi: 10.1016/S0003-2670(00)88444-5
Murphy, K.R., Stedmon, C.A., Graeber, D., & Bro, R. (2013). Fluorescence
spectroscopy and multi-way techniques. PARAFAC. Analytical Methods,
5(23). doi: 10.1039/c3ay41160e
Murphy, K.R., Stedmon, C.A., Wenig, P., & Bro, R. (2014). OpenFluor- an online
spectral library of auto-fluorescence by organic compounds in the
environment. Analytical Methods, 6(3), 658-661. doi: 10.1039/c3ay41935e
Nair, P.S., & Reddy, K.R. (2013). Phosphorus sorption and desorption in wetland
soils. In R.D. DeLaune, K.R. Reddy, C.J. Richardson & J.P. Megonigal
(Eds.), Methods in biogeochemistry of wetlands: Soil Science Society of
America.
Nayar, S., Collings, G.J., Miller, D.J., Bryars, S., & Cheshire, A.C. (2009). Uptake
and resource allocation of inorganic carbon by the temperate seagrasses
Posidonia and Amphibolis. Journal of Experimental Marine Biology and
Ecology, 373(2), 87-95. doi: 10.1016/j.jembe.2009.03.010

167
Newbold, J.D., O'Neill, R.V., Elwood, J.W., & Winkle, W.V. (1982). Nutrient
Spiralling in Streams: Implications for Nutrient Limitation and Invertebrate
Activity. The American Naturalist, 120(5), 628-652. doi: 10.2307/2460950
Northington, R.M., & Webster, J.R. (2017). Experimental reductions in stream flow
alter litter processing and consumer subsidies in headwater streams.
Freshwater Biology, 62(4), 737-750. doi: 10.1111/fwb.12898
O'Brien, J.M., & Dodds, W.K. (2007). Ammonium uptake and mineralization in
prairie streams: chamber incubation and short-term nutrient addition
experiments. Freshwater Biology, 53, 102-112. doi: 10.1111/j.1365-
2427.2007.01870.x
O'Donnell, A.J., Cook, E.R., Palmer, J.G., Turney, C.S., Page, G.F., & Grierson, P.F.
(2015). Tree Rings Show Recent High Summer-Autumn Precipitation in
Northwest Australia Is Unprecedented within the Last Two Centuries. PLoS
One, 10(6), e0128533. doi: 10.1371/journal.pone.0128533
Odum, H.T. (1956). Primary Production in Flowing Waters. Limnology and
Oceanography, 1(2), 102-117. doi: 10.2307/2833008
Ohno, T. (2002). Fluorescence Inner-Filtering Correction for Determining the
Humification Index of Dissolved Organic Matter. Environmental Science &
Technology, 36(4), 742-746. doi: 10.1021/es0155276
Ohno, T., Chorover, J., Omoike, A., & Hunt, J. (2007). Molecular weight and
humification index as predictors of adsorption for plant- and manure-derived
dissolved organic matter to goethite. European Journal of Soil Science,
58(1), 125-132. doi: 10.1111/j.1365-2389.2006.00817.x

168
Orians, G.H., & Milewski, A.V. (2007). Ecology of Australia: the effects of nutrient-
poor soils and intense fires. Biol Rev Camb Philos Soc, 82(3), 393-423. doi:
10.1111/j.1469-185X.2007.00017.x
Özkundakci, D., Hamilton, D.P., McDowell, R., & Hill, S. (2013). Phosphorus
dynamics in sediments of a eutrophic lake derived from 31P nuclear
magnetic resonance spectroscopy. Marine and Freshwater Research, 65(1),
70-80. doi: 10.1071/MF13033
Pant, H.K., & Reddy, K.R. (2001). Phosphorus Sorption Characteristics of Estuarine
Sediments under Different Redox Conditions. Journal of Environmental
Quality, 30(4), 1474-1480. doi: 10.2134/jeq2001.3041474x
Pepper, M., Doughty, P., & Keogh, J.S. (2013). Geodiversity and endemism in the
iconic Australian Pilbara region: a review of landscape evolution and biotic
response in an ancient refugium. Journal of Biogeography, 40(7), 1225-1239.
doi: 10.1111/jbi.12080
Pettit, N.E., & Naiman, R.J. (2007). Fire in the riparian zone: Characteristics and
ecological consequences. Ecosystems, 10(5), 673-687. doi: 10.1007/s10021-
007-9048-5
Pettit, N.E., Jardine, T.D., Hamilton, S.K., Sinnamon, V., Valdez, D., Davies, P.M.,
Douglas, M.M., & Bunn, S.E. (2012). Seasonal changes in water quality and
macrophytes and the impact of cattle on tropical floodplain waterholes.
Marine and Freshwater Research, 63(9), 788-800. doi: 10.1071/mf12114
Pinder, A., Halse, S., Shiel, R., & McRae, J. (2010). An arid zone awash with
diversity: patterns in the distribution of aquatic invertebrates in the Pilbara
region of Western Australia. Records of the Western Australian Museum,
Supplement 78, 205–246. doi: 10.18195/issn.0313-122x.78(1).2010.205-246

169
Porcal, P., & Kopacek, J. (2018). Photochemical degradation of dissolved organic
matter reduces the availability of phosphorus for aquatic primary producers.
Chemosphere, 193, 1018-1026. doi: 10.1016/j.chemosphere.2017.11.140
Puche, E., Sánchez-Carrillo, S., Álvarez-Cobelas, M., Pukacz, A., Rodrigo, M.A., &
Rojo, C. (2018). Effects of overabundant nitrate and warmer temperatures on
charophytes: The roles of plasticity and local adaptation. Aquatic Botany,
146, 15-22. doi: 10.1016/j.aquabot.2018.01.003
R Core Team. (2017). R: A language and environment for statistical computing. R
Foundation for Statistical Computing, Vienna, Austria.
Ramanaidou, E.R., Morris, R.C., & Horwitz, R.C. (2003). Channel iron deposits of
the Hamersley Province, Western Australia. Australian Journal of Earth
Sciences, 50(5), 669-690. doi: 10.1111/j.1440-0952.2003.01019.x
Raymond, P.A., Saiers, J.E., & Sobczak, W.V. (2016). Hydrological and
biogeochemical controls on watershed dissolved organic matter transport:
pulse-shunt concept. Ecology, 97(1), 5-16. doi: 10.1890/14-1684.1
Reddy, K.R., Kadlec, R.H., Flaig, E., & Gale, P.M. (1999). Phosphorus Retention in
Streams and Wetlands: A Review. Critical Reviews in Environmental
Science and Technology, 29(1), 83-146. doi: 10.1080/10643389991259182
Redfield, A. (1934). On the proportions of organic derivations in sea water and their
relation to the composition of plankton. In R.J. Daniel (Ed.), James
Johnstone Memorial Volume (pp. 177-192): University Press of Liverpool.
Reeves, J.M., Deckker, P., & Halse, S.A. (2007). Groundwater Ostracods from the
arid Pilbara region of northwestern Australia: distribution and water
chemistry. Hydrobiologia, 585(1), 99-118. doi: 10.1007/s10750-007-0632-7

170
Reisinger, A.J., Tank, J.L., & Dee, M.M. (2016). Regional and seasonal variation in
nutrient limitation of river biofilms. Freshwater Science, 35(2), 474-489. doi:
10.1086/685829
Reitzel, K., Ahlgren, J., Rydin, E., Egemose, S., Turner, B.L., & Hupfer, M. (2012).
Diagenesis of settling seston: identity and transformations of organic
phosphorus. J Environ Monit, 14(3), 1098-1106. doi: 10.1039/c2em10883f
Rier, S.T., Shirvinski, J.M., & Kinek, K.C. (2014). In situ light and phosphorus
manipulations reveal potential role of biofilm algae in enhancing enzyme-
mediated decomposition of organic matter in streams. Freshwater Biology,
59(5), 1039-1051. doi: 10.1111/fwb.12327
Robson, B.J., Chester, E.T., Matthews, T.G., & Johnston, K. (2018). Post-wildfire
recovery of invertebrate diversity in drought-affected headwater streams.
Aquatic Sciences, 80(2). doi: 10.1007/s00027-018-0570-7
Rodrigo, M.A., Rojo, C., Álvarez-Cobelas, M., & Cirujano, S. (2007). Chara hispida
beds as a sink of nitrogen: Evidence from growth, nitrogen uptake and
decomposition. Aquatic Botany, 87(1), 7-14. doi:
10.1016/j.aquabot.2007.01.007
Rodrigo, M.A., Puche, E., & Rojo, C. (2017). On the tolerance of charophytes to
high-nitrate concentrations. Chemistry and Ecology, 34(1), 22-42. doi:
10.1080/02757540.2017.1398237
Rojas, R., Commander, P., McFarlane, D., Ali, R., Dawes, W., Barron, O., Hodgson,
G., & Charles, S. (2018). Groundwater Resource Assessment and
Conceptualization in the Pilbara Region, Western Australia. Earth Systems
and Environment. doi: 10.1007/s41748-018-0051-0
171
Rouillard, A., Skrzypek, G., Dogramaci, S., Turney, C., & Grierson, P.F. (2015).
Impacts of high inter-annual variability of rainfall on a century of extreme
hydrologic regime of northwest Australia. Hydrol. Earth Syst. Sci., 19(4),
2057-2078. doi: 10.5194/hess-19-2057-2015
Rouillard, A., Skrzypek, G., Turney, C., Dogramaci, S., Hua, Q., Zawadzki, A.,
Reeves, J., Greenwood, P.and others. (2016). Evidence for extreme floods in
arid subtropical northwest Australia during the Little Ice Age chronozone
(CE 1400–1850). Quaternary Science Reviews, 144, 107-122. doi:
10.1016/j.quascirev.2016.05.004
Ruprecht, J. (1996). Arid Zone Hydrology: Pilbara Region of Western Australia
[online]. In: Hydrology and Water Resources Symposium (23rd : 1996 :
Hobart, Tas.). Hydrology and Water Resources Symposium 1996: Water and
the Environment; Preprints of Papers. Barton, ACT: Institution of Engineers,
Australia, 1996: 301-305. ; no. 96/05. . National conference publication
(Institution of Engineers, Australia).
Sabater, S., Timoner, X., Borrego, C., & Acuña, V. (2016). Stream Biofilm
Responses to Flow Intermittency: From Cells to Ecosystems. Frontiers in
Environmental Science, 4. doi: 10.3389/fenvs.2016.00014
Sarmento, H., & Descy, J.-P. (2008). Use of marker pigments and functional groups
for assessing the status of phytoplankton assemblages in lakes. Journal of
Applied Phycology, 20(6), 1001-1011. doi: 10.1007/s10811-007-9294-0
Schelfhout, C., & Broad, M. (2015). The Woodie Woodie irrigation project. Water:
Journal of the Australian Water Association, 42(7), 33-35.
Schlüter, L., Lauridsen, T.L., Krogh, G., & Jørgensen, T. (2006). Identification and
quantification of phytoplankton groups in lakes using new pigment ratios – a

172
comparison between pigment analysis by HPLC and microscopy. Freshwater
Biology, 51(8), 1474-1485. doi: 10.1111/j.1365-2427.2006.01582.x
Schneider, S.C., García, A., Martín-Closas, C., & Chivas, A.R. (2015). The role of
charophytes (Charales) in past and present environments: An overview.
Aquatic Botany, 120, 2-6. doi: 10.1016/j.aquabot.2014.10.001
Scinto, L.J., & Reddy, K.R. (2003). Biotic and abiotic uptake of phosphorus by
periphyton in a subtropical freshwater wetland. Aquatic Botany, 77(3), 203-
222. doi: 10.1016/s0304-3770(03)00106-2
Seitzinger, S.P., Mayorga, E., Bouwman, A.F., Kroeze, C., Beusen, A.H.W., Billen,
G., Van Drecht, G., Dumont, E.and others. (2010). Global river nutrient
export: A scenario analysis of past and future trends. Global Biogeochemical
Cycles, 24(4), n/a-n/a. doi: 10.1029/2009gb003587
Sheldon, F., & Fellows, C.S. (2010). Water quality in two Australian dryland rivers:
spatial and temporal variability and the role of flow. Marine and Freshwater
Research, 61(8). doi: 10.1071/mf09289
Shogren, A.J., Tank, J.L., Andruszkiewicz, E., Olds, B., Mahon, A.R., Jerde, C.L., &
Bolster, D. (2017). Controls on eDNA movement in streams: Transport,
Retention, and Resuspension. Sci Rep, 7(1), 5065. doi: 10.1038/s41598-017-
05223-1
Shutova, Y., Baker, A., Bridgeman, J., & Henderson, R.K. (2014). Spectroscopic
characterisation of dissolved organic matter changes in drinking water
treatment: From PARAFAC analysis to online monitoring wavelengths.
Water Research, 54(Supplement C), 159-169. doi:
10.1016/j.watres.2014.01.053

173
Siebers, A.R. (2015). Organic matter dynamics of hydrologically variable pools in
intermittent streams of northwest Australia. The University of Western
Australia, Unpublished thesis.
Siebers, A.R., Pettit, N.E., Skrzypek, G., Fellman, J.B., Dogramaci, S., & Grierson,
P.F. (2016). Alluvial ground water influences dissolved organic matter
biogeochemistry of pools within intermittent dryland streams. Freshwater
Biology, 61(8), 1228-1241. doi: 10.1111/fwb.12656
Singh, B., & Gilkes, R. (1991). Phosphorus sorption in relation to soil properties for
the major soil types of South-Western Australia. Soil Research, 29(5), 603-
618. doi: 10.1071/SR9910603
Skrzypek, G. (2013). Normalization procedures and reference material selection in
stable HCNOS isotope analyses: an overview. Analytical and Bioanalytical
Chemistry, 405(9), 2815-2823. doi: 10.1007/s00216-012-6517-2
Skrzypek, G., Dogramaci, S., & Grierson, P.F. (2013). Geochemical and
hydrological processes controlling groundwater salinity of a large inland
wetland of northwest Australia. Chemical Geology, 357(0), 164-177. doi:
10.1016/j.chemgeo.2013.08.035
Skrzypek, G., & Ford, D. (2014). Stable Isotope Analysis of Saline Water Samples
on a Cavity Ring-down Spectroscopy Instrument. Environmental Science &
Technology, 48(5), 2827-2834. doi: 10.1021/es4049412
Skrzypek, G., Mydłowski, A., Dogramaci, S., Hedley, P., Gibson, J.J., & Grierson,
P.F. (2015). Estimation of evaporative loss based on the stable isotope
composition of water using Hydrocalculator. Journal of Hydrology, 523,
781-789. doi: 10.1016/j.jhydrol.2015.02.010

174
Smith, R.A., Alexander, R.B., & Schwarz, G.E. (2003). Natural Background
Concentrations of Nutrients in Streams and Rivers of the Conterminous
United States. Environmental Science & Technology, 37(14), 3039-3047. doi:
10.1021/es020663b
Soetaert, K., Van den Meersche, K., & van Oevelen, D. (2009). limSolve: Solving
Linear Inverse Models. R-package version 1.5.1.
Sokolowska, Z., Szajdak, L., & Boguta, P. (2011). Effect of phosphates on dissolved
organic matter release from peat-muck soils. International Agrophysics,
25(2), 173-180.
Song, K.-Y., Zoh, K.-D., & Kang, H. (2007). Release of phosphate in a wetland by
changes in hydrological regime. Science of The Total Environment, 380(1),
13-18. doi: 10.1016/j.scitotenv.2006.11.035
Sponseller, R.A., & Fisher, S.G. (2006). Drainage Size, Stream Intermittency, and
Ecosystem Function in a Sonoran Desert Landscape. Ecosystems, 9(3), 344-
356.
Staehr, P.A., Bade, D., Van de Bogert, M.C., Koch, G.R., Williamson, C., Hanson,
P., Cole, J.J., & Kratz, T. (2010). Lake metabolism and the diel oxygen
technique: State of the science. Limnology and Oceanography-Methods, 8,
628-644. doi: 10.4319/lom.2010.8.628
Staehr, P.A., Testa, J.M., Kemp, W.M., Cole, J.J., Sand-Jensen, K., & Smith, S.V.
(2011). The metabolism of aquatic ecosystems: history, applications, and
future challenges. Aquatic Sciences, 74(1), 15-29. doi: 10.1007/s00027-011-
0199-2

175
Stedmon, C.A., Markager, S., & Bro, R. (2003). Tracing dissolved organic matter in
aquatic environments using a new approach to fluorescence spectroscopy.
Marine Chemistry, 82(3-4), 239-254. doi: 10.1016/s0304-4203(03)00072-0
Stedmon, C.A., & Bro, R. (2008). Characterizing dissolved organic matter
fluorescence with parallel factor analysis: a tutorial. Limnology and
Oceanography-Methods, 6, 572-579. doi: 10.4319/lom.2008.6.572
Stubbington, R., Chadd, R., Cid, N., Csabai, Z., Milisa, M., Morais, M., Munne, A.,
Paril, P.and others. (2018). Biomonitoring of intermittent rivers and
ephemeral streams in Europe: Current practice and priorities to enhance
ecological status assessments. Sci Total Environ, 618, 1096-1113. doi:
10.1016/j.scitotenv.2017.09.137
Sudmeyer, R. (2016). Climate in the Pilbara. Bulletin 4873. Perth: Department of
Agriculture and Food, Western Australia.
Tamm, M., Freiberg, R., Tõnno, I., Nõges, P., & Nõges, T. (2015). Pigment-Based
Chemotaxonomy - A Quick Alternative to Determine Algal Assemblages in
Large Shallow Eutrophic Lake? PLoS ONE, 10(3), e0122526. doi:
10.1371/journal.pone.0122526
Tank, J.L., & Dodds, W.K. (2003). Nutrient limitation of epilithic and epixylic
biofilms in ten North American streams. Freshwater Biology, 48(6), 1031-
1049. doi: 10.1046/j.1365-2427.2003.01067.x
Tank, J.L., Reisinger, A.J., & Rosi, E.J. (2017). Nutrient Limitation and Uptake
Methods in Stream Ecology (pp. 147-171).
Thomsen, P.F., & Willerslev, E. (2015). Environmental DNA – An emerging tool in
conservation for monitoring past and present biodiversity. Biological
Conservation, 183, 4-18. doi: 10.1016/j.biocon.2014.11.019

176
Thorp, J.H., Thoms, M.C., & Delong, M.D. (2006). The riverine ecosystem
synthesis: Biocomplexity in river networks across space and time. River
Research and Applications, 22(2), 123-147. doi: 10.1002/rra.901
Tonin, A.M., Goncalves, J.F., Jr., Bambi, P., Couceiro, S.R.M., Feitoza, L.A.M.,
Fontana, L.E., Hamada, N., Hepp, L.U.and others. (2017). Plant litter
dynamics in the forest-stream interface: precipitation is a major control
across tropical biomes. Sci Rep, 7(1), 10799. doi: 10.1038/s41598-017-
10576-8
Townsend, S.A., Garcia, E.A., & Douglas, M.M. (2012). The response of benthic
algal biomass to nutrient addition over a range of current speeds in an
oligotrophic river. Freshwater Science, 31(4), 1233-1243. doi: 10.1899/11-
163.1
Townsend, S.A., & Douglas, M.M. (2017). Discharge-driven flood and seasonal
patterns of phytoplankton biomass and composition of an Australian tropical
savannah river. Hydrobiologia, 794(1), 203-221. doi: 10.1007/s10750-017-
3094-6
van Vreeswyk, A.M., Leighton, K.A., Payne, A.L., & Hennig, P. (2004). An
inventory and condition survey of the Pilbara region, Western
Australia. (0083-8675). Perth.
Vannote, R., Minshall, G., Cummins, K., Sedell, J., & Cushing, C. (1980). The River
Continuum Concept Canadian Journal of Fisheries and Aquatic Sciences,
37(1), 130-137. doi: 10.1139/f80-017
Verbeeck, M., Hiemstra, T., Thiry, Y., & Smolders, E. (2017). Soil organic matter
reduces the sorption of arsenate and phosphate: a soil profile study and

177
geochemical modelling. European Journal of Soil Science, 68(5), 678-688.
doi: 10.1111/ejss.12447
Vestergren, J., Vincent, A.G., Jansson, M., Persson, P., Ilstedt, U., Gröbner, G.,
Giesler, R., & Schleucher, J. (2012). High-Resolution Characterization of
Organic Phosphorus in Soil Extracts Using 2D 1H–31P NMR Correlation
Spectroscopy. Environmental Science & Technology, 46(7), 3950-3956. doi:
10.1021/es204016h
Vieira, J., & Necchi, O. (2003). Photosynthetic characteristics of charophytes from
tropical lotic ecosystems. Phycological Research, 51(1), 51-60. doi:
10.1111/j.1440-1835.2003.tb00170.x
Vizza, C., Pechal, J.L., Benbow, M.E., Lang, J.M., Chatoner, D.T., Jones, S.E., &
Lamberti, G.A. (2018). Nitrate amendment reduces biofilm biomass and
shifts microbial communities in remote, oligotrophic ponds. Freshwater
Science, 37(2), 251-263. doi: 10.1086/697897
Voeroesmarty, C.J., McIntyre, P.B., Gessner, M.O., Dudgeon, D., Prusevich, A.,
Green, P., Glidden, S., Bunn, S.E.and others. (2010). Global threats to human
water security and river biodiversity (vol 467, pg 555, 2010). Nature,
468(7321), 334-334. doi: 10.1038/nature09549
Von Schiller, D., MartÍ, E., Riera, J.L., & Sabater, F. (2007). Effects of nutrients and
light on periphyton biomass and nitrogen uptake in Mediterranean streams
with contrasting land uses. Freshwater Biology, 52(5), 891-906. doi:
10.1111/j.1365-2427.2007.01742.x
von Schiller, D., Acuña, V., Graeber, D., Martí, E., Ribot, M., Sabater, S., Timoner,
X., & Tockner, K. (2011). Contraction, fragmentation and expansion

178
dynamics determine nutrient availability in a Mediterranean forest stream.
Aquatic Sciences, 73(4), 485-497. doi: 10.1007/s00027-011-0195-6
von Schiller, D., Graeber, D., Ribot, M., Timoner, X., Acuña, V., Martí, E., Sabater,
S., & Tockner, K. (2015). Hydrological transitions drive dissolved organic
matter quantity and composition in a temporary Mediterranean stream.
Biogeochemistry, 123(3), 429-446. doi: 10.1007/s10533-015-0077-4
von Schiller, D., Acuna, V., Aristi, I., Arroita, M., Basaguren, A., Bellin, A., Boyero,
L., Butturini, A.and others. (2017). River ecosystem processes: A synthesis
of approaches, criteria of use and sensitivity to environmental stressors. Sci
Total Environ, 596-597, 465-480. doi: 10.1016/j.scitotenv.2017.04.081
Wagner, S., Jaffé, R., Cawley, K., Dittmar, T., & Stubbins, A. (2015). Associations
Between the Molecular and Optical Properties of Dissolved Organic Matter
in the Florida Everglades, a Model Coastal Wetland System. Frontiers in
chemistry, 3, 66-66. doi: 10.3389/fchem.2015.00066
Wang, S.R., Jin, X.C., Zhao, H.C., Zhou, X.N., & Wu, F.C. (2008). Effects of
organic matter on phosphorus release kinetics in different trophic lake
sediments and application of transition state theory. Journal of
Environmental Management, 88(4), 845-852. doi:
10.1016/j.jenvman.2007.04.006
Ward, J.V. (1989). The Four-Dimensional Nature of Lotic Ecosystems. Journal of
the North American Benthological Society, 8(1), 2-8. doi: 10.2307/1467397
Watts, C.J. (2000a). The effect of organic matter on sedimentary phosphorus release
in an Australian reservoir. Hydrobiologia, 431(1), 13-25. doi:
10.1023/a:1004046103679

179
Watts, C.J. (2000b). Seasonal phosphorus release from exposed, re-inundated littoral
sediments of two Australian reservoirs. Hydrobiologia, 431(1), 27-39. doi:
10.1023/a:1004098120517
Webster, J.R. (1975). Analysis of potassium and calcium dynamics in stream
ecosystems on three southern Appalachian watersheds of contrasting
vegetation. Ph.D. Dissertation. Athens, GA: University of Georgia.
Wehr, J.D. (1989). Experimental tests of nutrient limitation in freshwater
picoplankton. Appl Environ Microbiol, 55(6), 1605-1611.
Weishaar, J.L., Aiken, G.R., Bergamaschi, B.A., Fram, M.S., Fujii, R., & Mopper,
K. (2003). Evaluation of specific ultraviolet absorbance as an indicator of the
chemical composition and reactivity of dissolved organic carbon.
Environmental Science & Technology, 37(20), 4702-4708. doi:
10.1021/es030360x
Wetzel, R.G. (2001). Limnology : lake and river ecosystems / Robert G. Wetzel.
Academic Press, San Diego.
Wild, A. (1958). The phosphate content of Australian soils. Australian Journal of
Agricultural Research, 9(2). doi: 10.1071/ar9580193
Wright, S.W., Jeffrey, S.W., Mantoura, R.F.C., Llewellyn, C.A., Bjornland, T.,
Repeta, D., & Welschmeyer, N. (1991). Improved HPLC method for the
analysis of chlorophylls and carotenoids from marine-phytoplankton. Marine
Ecology Progress Series, 77(2-3), 183-196. doi: 10.3354/meps077183
Wunsch, U.J., Stedmon, C.A., Tranvik, L.J., & Guillemette, F. (2018). Unraveling
the size-dependent optical properties of dissolved organic matter. Limnology
and Oceanography, 63(2), 588-601. doi: 10.1002/lno.10651

180
Yamashita, Y., Boyer, J.N., & Jaffé, R. (2013). Evaluating the distribution of
terrestrial dissolved organic matter in a complex coastal ecosystem using
fluorescence spectroscopy. Continental Shelf Research, 66, 136-144. doi:
10.1016/j.csr.2013.06.010
Yan, J.L., Jiang, T., Yao, Y., Wang, J., Cai, Y.L., Green, N.W., & Wei, S.Q. (2017).
Underestimation of phosphorus fraction change in the supernatant after
phosphorus adsorption onto iron oxides and iron oxide-natural organic matter
complexes. Journal of Environmental Sciences, 55, 197-205. doi:
10.1016/j.jes.2016.08.005
Zhang, L., Hong, S., He, J., Gan, F., & Ho, Y.-S. (2012). Adsorption characteristic
studies of phosphorus onto laterite. Desalination and Water Treatment, 25(1-
3), 98-105. doi: 10.5004/dwt.2011.1871
Zhang, W., Shan, B., Zhang, H., & Tang, W. (2013). Assessment of preparation
methods for organic phosphorus analysis in phosphorus-polluted Fe/Al-rich
Haihe river sediments using solution 31P-NMR. PLoS One, 8(10), e76525.
doi: 10.1371/journal.pone.0076525