Embed Size (px)
Citation preview
NURTURING LATENT ENTREPRENEURSHIP AND THE GROWTH OF
SMALL FIRMS IN ZIMBABWE
A case study of Harare Metropolitan Province
BY
GODFREY MUPONDA
A thesis submitted in fulfillment of the requirements for the degree of
DOCTOR OF PHILOSOPHY (COMMERCE)
UNIVERSITY OF ZIMBABWE
Faculty of Commerce, Department of Business Studies
Supervisors: Professor Isaac CHANETA and Professor Claude MARARIKE
September, 2012

i
DEDICATION
This thesis is dedicated to my wife Memory, my children Alfred, Priscillah, Monalisa and Nigel
and to all my “clan” members VaNyere

ii
ACKNOWLEDGEMENTS
I would like to express my heartfelt indebtedness to my supervisors Professor Isaac Chaneta (Dean
of Commerce) and Professor Claude Mararike (Faculty of Social Studies) without whose
commitment and encouragement I could not have successfully completed this study. I would like to
thank them sincerely for the considerable amount of time that they spent on my thesis to correct my
mistakes, make suggestions and also providing me with valuable mentorship.
I would also like to thank the group of ten students in the Department of Business studies
(especially the group leader, Tafadzwa Moyo) who took time from their final year studies to assist
me in the field work at Glenview and also in analysing the data.
I would also like to thank MrFarai Mqedi who accompanied me on my survey of Zimbabwe‟s five
cities and acted as the “interpreter” in Bulawayo.
I also sincerely appreciate the assistance provided by Mr Nyahore, Principal Director, City of
Harare, who afforded me the chance for an interview and provided me with access to the officers at
the Glenview District Office and to the respondents at the Glenview cluster.
Finally, I wish to thank my colleagues in the Department of Business, Samuel Gumbe, Freddy
Mupambireyi and Doctor Nyasha Kaseke for their valuable advice on data analysis and also the
chairperson of the department Noel Muzondo for his insightful suggestions on marketing strategies.

iii
ABSTRACT
The phenomenon of small firms located in industrial clusters is widespread in many countries,
particularly in Italy, Brazil, Mexico, Peru and India as well as in some African countries such as
Kenya, Tanzania and Ghana. These firms have made significant inroads on the global supply chain
for various products such as fashion consumer goods, shoes, garments, precision surgical
instruments and construction tiles.
The purpose of this study was to determine the extent and significance of small-firm clustering in
Zimbabwe and the factors that contribute to the growth and dynamism of the firms in these clusters
with a view to recommending ways in which entrepreneurship among these firms could be nurtured
further. The cluster was modeled as an Entrepreneurial Technological Regime wherein it was
proposed that the growth and success of the firms depended on the existence of an enabling
environment which allowed the constant acquisition and diffusion of knowledge (technological
capabilities).
The study used a questionnaire that was distributed to a sample of 608 small furniture
manufacturing firms selected from a population of 2 144 firms located in clusters in the five major
cities of Zimbabwe. The study also used results from focus group discussions and interviews with
owner-managers of firms at the Glenview cluster in Harare.
The study arrived at there conclusions:
the firms in Zimbabwe‟s clusters are micro-enterprises (very small entities) that are
“isolated” in that they lack access to new technology and capital;
the firms are, however, worthy candidates for policy intervention because they possess
various collective attributes that place them at an advantage over other SMEs; and
the clusters possess the characteristics of complex adaptive systems (phenomena with
emergent properties), therefore any policy interventions would be more effective if they

iv
were directed at the cluster as a whole or groups of firms within the cluster rather than at
individual firms.
The study therefore recommended that measures be taken to attract long-term capital (debt and
equity) into the cluster by introducing the firms to the capital markets and also bring in new
technological capabilities from outside the cluster by forging technical alliances between the firms
in the cluster and other firms outside the cluster. This should be done within a framework that
fosters a strong private-public partnership in which the private sector takes the leading role and
involves the participation of the cluster members and the local authority.

v
LIST OF ABBREVIATIONS
CMC Cluster Management Committee
CSFS Collective Self Financing Scheme
CZI Confederation of Zimbabwe Industries
DROA DuPont Return on Assets
ESAP Economic Structural Adjustment Programme
ETR Entrepreneurial Technological Regime
FSC Forestry Stewardship Certification
GDP Gross Domestic Product
GEM Global Entrepreneurship Monitor
GPM Gross Profit Margin
GPT General Purpose Technology
OPP Opportunity based entrepreneurship
OPM Operating margin
ISO International Standards Organisation
PAAP Poverty Alleviation Action Plan
MSMED Ministry of Small and Medium Scale Enterprises
NEC Necessity-based entrepreneurship
NGO Nongovernmental organisation
RBZ Reserve Bank of Zimbabwe
ROA Return on assets
ROCE Return on capital employed
SDA Social Dimensions of Adjustment Programme
SDF Social Development Fund
SEDCO Small Enterprises Development Corporation
SME Small and medium-scale enterprise
SMEAC Small and Medium Enterprise Advisory Council
TAT Total assets turnover
WIP Work in progress
ZAMFI Zimbabwe Association of Microfinance Institutions
ZIMPREST Zimbabwe Programme of Economic Transformation

vi
LIST OF TABLES
Table Title Page
1.1 Clusters of small-scale businesses, location and main activity……………………. 3
2.1 Summary of entrepreneurial perspectives…………………………………………. 28
4.1 Study population by province, city and cluster…………………………………….. 64
4.2 Sample size by cluster location…………………………………………………….. 66
5.1 Clusters of small furniture making firms in Zimbabwe……………………………. 71
5.2 Questionnaire distribution and response rate per cluster…………………………... 76
5.3 Characteristics of the firms………………………………………………………… 77
5.4 Characteristics of owner-managers………………………………………………… 80
5.5 Characteristics of employees………………………………………………………. 81
5.6 Strength of social ties within firms………………………………………………… 83
5.7 Routines in the transformation process for two products………………………….. 90
5.8 Range of products found in the cluster: selling prices; input costs and mark-up….. 94
5.9 List of machines required for essential production routines……………………….. 96
5.10 Hand tools and equipment used in minor production routines…………………….. 97
5.11 Average stock levels per firm………………………………………………………98
5.12 Balance sheet of a small firm located in a cluster…………………………………. 99
5.13 Average total sales per firm………………………………………………………... 100
5.14 The cost of timber according to size and grade……………………………………..101
5.15 Cost of cotton and cotton lint by-products…………………………………………. 102
5.16 List of essential inputs and their costs………………………………………………103
5.17 The costs of producing a set of sofas………………………………………………. 104
5.18 Monthly income statement of a small firm located in a cluster……………………. 105
6.1 Capital employed by some stock exchange-listed firms in Zimbabwe……………..114
6.2 Epistemic communities of firms at the Glenview at the Glenview cluster…………132
6.3 Product lines and product mix in the cluster………………………………………..139
6.4 Product value package……………………………………………………………... 140
6.5 Measures of efficiency in financial management………………………………….. 144
6.6 Efficiency in financial management by small firms located in the cluster………… 145

vii
6.7 Breakdown of materials cost: sofa-sets……………………………………………..148
6.8 Profit generated from a dollar of sales……………………………………………... 148
6.9 Some companies listed on the Zimbabwe Stock Exchange……………………….. 149
6.10 Efficiency in capital utilisation by large, stock exchange-listed companies in
Zimbabwe………………………………………………………………………….. 150
6.11 Efficiency of small firms compared to large firms………………………………... 151
6.12 DuPont Return on Assets…………………………………………………………...152
6.13 Drivers of efficiency for small firms and large firms……………………………… 152
7.1 The Glenview cluster transformed to five limited liability companies…………….. 167
7.2 Distribution of bank deposits in Zimbabwe, July, 2011…………………………… 171
7.3 Market shares of weak and troubled banks in Zimbabwe, July, 2012……………... 171

viii
LIST OF FIGURES
Figure Title Page
3.1 Symmetry breaking……………………………………………………….. 50
3.2 The Entrepreneurial Industrial District Model……………………………. 51
4.1 The research continuum……………………………………………. …….. 63
5.1 Map of Zimbabwe, showing the five major cities…………………. …….. 70
5.2 Map of Harare, showing the location of Glenview………………… …….. 72
5.3 The Glenview cluster: Main Complex, Caledonia Annexe and
Willowvale Annexe ……………………………………………….. …….. 74
5.4 The typical structure of a small firm located in a cluster………….. ……... 79
5.5 Levels of specialisation in the cluster……………………………………… 86
5.6 Cluster-level specialisation at the Glenview cluster……………….. …….. 87
5.7 Sub-cluster specialisation at the Glenview cluster: wood furniture
makers……………………………………………………………………… 88
5.8 Sub-cluster specialisation at the Glenview cluster: cabinet makers………. 89
5.9 Sub-cluster specialisation at the Glenview cluster: sofa-set makers………. 89
5.10 Map of Harare, showing location of the customers of firms at the
Glenview cluster……………………………………………………………92
6.1 Weak links between firms in different epistemic communities…………… 134
6.2 Strong and weak links between firms in different epistemic
Communities………………………………………………………………. 135
6.3 Distribution channels………………………………………………………. 142
ix
TABLE OF CONTENTS
DEDICATION .............................................................................................................. i
ACKNOWLEDGEMENTS ............................................................................................ii
ABSTRACT ............................................................................................................... iii
LIST OF ABBREVIATIONS ......................................................................................... v
LIST OF TABLES ....................................................................................................... vi
LIST OF FIGURES .................................................................................................. viii
Chapter 1 Introduction to the study ........................................................................ 1
1.0 Introduction ...................................................................................................................... 1
1.1 Background to the study ........................................................................................................ 4
1.2 Statement of the problem ....................................................................................................... 5
1.3 Research Objectives............................................................................................................. 14
1.4 Research questions .............................................................................................................. 15
1.5 Significance of the study ...................................................................................................... 15
1.6 Hypothesis ........................................................................................................................... 16
1.7 Delimitation......................................................................................................................... 16
1.8 Conclusion .......................................................................................................................... 17
Chapter 2 Literature Review ................................................................................. 18
2.0 Introduction .................................................................................................................... 18
2.1 Entrepreneurship as the creation of small firms .................................................................... 18
2.2 Entrepreneurship and the individual ..................................................................................... 19
2.3 The Pre-Neoclassical perspective ......................................................................................... 20
2.4 The psychological perspective ............................................................................................. 20
2.5 The Neo-classical perspective .............................................................................................. 22
2.5 The Austrian perspective ..................................................................................................... 23
2.7 The Schumpeterian (evolutionary) perspective..................................................................... 25
2.8 Summary of perspectives on entrepreneurship ..................................................................... 27
2.9 Technological perspective of entrepreneurship..................................................................... 29

x
2.10 Entrepreneurship in an agglomeration of firms ................................................................... 31
2.11 Characteristics of industrial districts .................................................................................. 33
2.12 Success factors for firms located in industrial districts ....................................................... 34
2.13 Conclusion......................................................................................................................... 41
Chapter 3The Entrepreneurial Industrial District Model ................................... 42
3.0 Introduction ......................................................................................................................... 42
3.1 An evolutionary view of entrepreneurship............................................................................ 42
3.2 The Industrial district as an entrepreneurial technological regime ........................................ 42
3.3 The industrial district as a system of networks ..................................................................... 43
3.4 System elements: heterogeneous economic agents (firms) .................................................. 45
3.5 Bounded rationality of system elements ............................................................................... 47
3.6 System Emergence .............................................................................................................. 47
3.7 System adaptation ................................................................................................................ 49
3.8 The Entrepreneurial Industrial District Model ...................................................................... 51
3.8.1 Internal (tacit) knowledge .............................................................................................. 51
3.8.2 External (codified) knowledge ....................................................................................... 52
3.8.3 Technological capabilities ............................................................................................. 52
3.8.4 Enabling conditions ....................................................................................................... 53
3.8.5 Technological innovation (Entrepreneurship) ................................................................ 54
3.9 Conclusion .......................................................................................................................... 55
Chapter 4Research Methodology .......................................................................... 56
4.0 Introduction ......................................................................................................................... 56
4.1 Qualitative approach ............................................................................................................ 56
4.1.1 Central principles of the qualitative approach ................................................................ 57
4.1.2. Advantages and disadvantages of the qualitative approach ........................................... 58
4.2. Quantitative approach ......................................................................................................... 59
4.2.1 Advantages and disadvantages of the quantitative approach .......................................... 60
4.3. Comparison of quantitative and qualitative approaches in application ................................. 61
4.4. Methods .............................................................................................................................. 62
4.5. Research design .................................................................................................................. 63
4.6. Population .......................................................................................................................... 63

xi
4.7. Sample selection ................................................................................................................. 64
4.8 Data collection instruments .................................................................................................. 67
4.9 Data analysis ....................................................................................................................... 69
4.10 Conclusion......................................................................................................................... 70
Chapter 5Findings .................................................................................................. 71
5.0. Introduction ........................................................................................................................ 71
5.1 Location and size of small-business clusters in Zimbabwe ................................................... 72
5.2 The Glenview cluster ........................................................................................................... 73
5.3 Questionnaire administration ............................................................................................... 67
5.3.1 Dealing with ethical issues ............................................................................................ 68
5.3.2 Questionnaire distribution ............................................................................................. 69
5.4. Characteristics of small-firm clusters in Zimbabwe ............................................................. 77
5.4.1 Characteristics of the firms ............................................................................................ 77
5.4.2 Characteristics of the owner-managers .......................................................................... 80
5.4.3 Characteristics of the employees ................................................................................... 81
5.5 The functioning of the cluster .............................................................................................. 82
5.5.1 Human resources management ...................................................................................... 83
5.5.2 Production operations management ............................................................................... 85
5.5.3 Sales and marketing management .................................................................................. 91
5. 5.4 Financial management .................................................................................................. 94
5.6 Conclusion ........................................................................................................................ 105
Chapter 6Analysis and discussion of findings..................................................... 106
6.0. Introduction ...................................................................................................................... 106
6.1 Location, size and significance of Zimbabwe‟s small-firm clusters .................................... 106
6.2 Characteristics of the industry, the firms, owners and employees ....................................... 109
6.2.1 The industry ................................................................................................................ 109
6. 2.2 The firms.................................................................................................................... 111
6.2.3 The owners and employees .......................................................................................... 115
6.3 The functioning of the cluster ............................................................................................ 117
6.3.1 Human resources management .................................................................................... 117
6.3.2 Production operations management ............................................................................. 120

xii
6.4. Sales and marketing management ..................................................................................... 135
6.4.1. The marketing approach used by the firms ................................................................. 135
6.4.2 The competitive strategy of the firms .......................................................................... 136
6.4.3 The marketing strategy used by the firms .................................................................... 137
6.5. Financial management ...................................................................................................... 141
6.5.1 Efficiency in utilizing capital to create profits (ROCE) ................................................ 143
6.5.2 Efficiency in utilizing capital to create revenues (TAT) ............................................... 144
6.5.3 Efficiency in generating profits from sales (GPM) ....................................................... 145
6.5.4 Efficiency in managing operating expenses (OPM) ..................................................... 146
6.5.5 Efficiency of small firms versus large, stock exchange-listed firms in Zimbabwe ........ 147
6.5.6 Drivers of small-firm efficiency .................................................................................. 150
6.6. Conclusion........................................................................................................................ 151
Chapter 7Conclusions and recommendations .................................................... 153
7.0 Introduction ....................................................................................................................... 153
7.1 Conclusions ....................................................................................................................... 153
7.1.1 The network of small-firm clusters in Zimbabwe is extensive, significant and is growing
rapidly, but the firms in the clusters are very small (micro-enterprises) ................................ 154
7.1.2 Zimbabwe‟s small-firm clusters are worthy candidates for policy intervention because
they possess certain collective attributes that place them at an advantage over other SMEs. . 155
7.1.3 The clusters in Zimbabwe are “complex adaptive systems” with emergent properties. . 159
7.2 Recommendations ............................................................................................................. 161
7.2.1. Policy Framework for cluster development in Zimbabwe ........................................... 161
7.2.2 Administrative issues that need immediate attention .................................................... 163
7.2.3 Attracting capital into the cluster ................................................................................. 163
7.2.4 Eliminating “cluster isolation” (access to markets and new technology) and increasing the
technological capabilities of the firms in the cluster. ............................................................ 171
7.2.5 Establishing regional and global linkages .................................................................... 174
7.3 Conclusion ........................................................................................................................ 174
7.4 Areas for further study on small-firm agglomeration .......................................................... 174

xiii

1
Chapter 1
Introduction to the study
1.0 Introduction
The population census results of 2002 showed that Zimbabwe at that time had a total population of
11,631,657 inhabitants (ZMDAT, 2009). For administrative purposes however, Zimbabwe is
divided into ten provinces of which Harare is a small metropolitan province with a population of
about 1,896,000 and a geographical area of about 872 square kilometers. However, in terms of
population size, Harare is by far the largest of the ten major cities of Zimbabwe. The second major
city by population size is Bulawayo, with a population of 675 650 and the smallest is Marondera,
with a population of about 51847(Brinkhoff, 2011). Harare is also the capital and administrative
city. Before Zimbabwe‟s independence in 1980, Harare was known as Salisbury.
A notable feature of Zimbabwe‟s economic landscape today is the existence of a large number of
small-scale businesses and many “informal” entrepreneurial activities in both the central business
district and residential areas of its cities and towns. A large proportion of these activities are found
in several “clusters” of small businesses. A cursory examination of the geographical location of
these clusters seems to suggest that the reason for their apparent prominence is that they are highly
visible and accessible to both customers and suppliers of inputs. This is because they are located
close to the residential areas but also have a direct link to the central business district and other
large industrial manufacturers in the city.
Zimbabwe‟s residential areas have historically been categorized into three types: namely, the
spatially populated (low-density), high-income areas, wherein resides the more affluent section of
the population; the middle-income areas, wherein reside the not-so-affluent, but not necessarily
poor residents; and the densely populated (high-density), low-income areas, in which the poor
people, who form the vast majority of the population, reside. The high-density suburbs are the
townships that were originally built in the pre-independence period to house the black population
but after independence, the better-off families moved to lower-density suburbs, previously the

2
exclusive preserve of the white population. In recent years however, a sizeable number of the
middle-income people have also found their way into the high-density areas. The high-density
suburbs however, still remain exclusively black (Kanji, 2005).
The most prominent of Zimbabwe‟s small-business clusters are found in Harare‟s low-density
suburbs. One of them is Gazaland, which is a conglomeration of small businesses involved in a
plethora of activities such as sheet metal fabrication, light engineering, motor vehicle repairs and
maintenance, spray painting and panel beating as well as many others in the retail business such as
the supply of motor vehicle spare parts and general merchandising. Gazaland is located in the low-
income suburb of Highfield but is also a walking distance from other low-income suburbs of
Kuwadzana, Budiriro, and Glenview in the west. The second prominent cluster in Harare is The
Complex, which is a conglomeration of small businesses engaged in the manufacture of household
wood and steel furniture. It is located in the Glenview high-density suburb but is also a walking
distance from other high-density suburbs such as Budiriro, Highfield, and Glen Norah.
Both of these clusters are located close to the Willowvale industrial area, where large steel
manufacturers and stockists such as Steel Base, and ZISCO Steel are also located. Willowvale Road
is a major trunk road which links the clusters with the central business district of Harare. What
further distinguishes The Complex from Gazaland however is that the firms therein are not engaged
in numerous activities but concentrate only in the manufacture of household furniture and also that
there appears to be a lot of dynamism and growth within the cluster.
The other two prominent small-business clusters found in Harare are: Mupedzanhamo (meaning
“the vanquisher of poverty”)and Siya-so (meaning “let sleeping dogs lie”). Soya-so is another
conglomeration of small businesses engaged in a plethora of activities similar to those found at
Gazaland. The small businesses at the Mupedzanhamo cluster are engaged mainly in the sale of
used clothing from neighbouring countries such as Mozambique, Tanzania and the Democratic
Republic of Congo. Both Mupedzanhamo and Siya-so are located close to the densely populated,
low-income suburb of Mbare, which is only three kilometers from Harare‟s central business district.

3
Clusters of small industrial firms performing similar activities are also a common sight in the urban
areas of other developing countries and this phenomenon is not unique to Zimbabwe only. In
Africa, empirical evidence on this phenomenon has been gathered in Kenya by McCormick (1998),
where they are referred to as jua kali sites, a Swahili term for small businesses operating in the “hot
sun”. For example, in their study of rice miler clusters in Ghana, Furuya, Futakuchi and Sakurayi
(2006) also make reference to the existence of such clusters in other parts of the world as shown in
Table 1.1 below.
Table 1.1: Clusters of small-scale businesses, location and main activity
COUNTRY LOCATION OF CLUSTER MAIN ACTIVITY
Brazil Sinos Valley Shoes
India Turuppur and Ludhiana Knitwear
Kenya Kamukunji Metal products
Kenya Ziwani Vehicle repair
Ghana Suame Vehicle repair, metal work
South Africa Western Cape,
Durban
Clothing
Pre-owned vehicles
Mexico Guadalajara Shoes
Peru Gamarra (Lima) Clothing
Pakistan Sialkot Surgical instruments
Source : Furuya, Futakuchi and Sakurayi (2006: 65)
In both industrialized and developing countries there is increasing awareness that isolation, rather
than size, is the key obstacle preventing small and medium-scale enterprises (SMMEs) from
boosting their competitiveness (UNIDO, 2006) and that clustering and networking can help such
enterprises to raise their competitiveness (Humphrey and Schmitz, 1995).The experiences and
achievements of small firms operating in clusters or industrial districts in what is now commonly
referred to as the „Third Italy‟ as well as in Brazil and Pakistan, provided the initial spark to the
debate as to whether the concept of clustering can provide the panacea for such problems as
unemployment and slow economic growth for the less industrialized countries (Piore and Sabel,
2004). The apparent success of these SMEs has given birth to mounting research efforts in other

4
developing countries, especially in Africa with the aim of discovering if such success stories can
also be replicated in these regions. The motivation for such research efforts is the belief that the
economic development of countries can also be anchored on the development of their SME sector.
The „Third Italy” (or “Italian Distretti”) is a region located in northeast and central Italy in which
small firms clustered together have managed to grow rapidly and develop niche export markets in
shoes, leather handbags, knitwear, furniture, tiles, musical instruments and food processing. The
firms located in this district have been the subject of many studies (Becattini, 1998; Humphrey and
Schmitz, 1995) which concluded that they have become very significant contributors to the Italian
economy. For example, Becattini (1998) estimated that in 1998 the Itallian distretti contributed
twenty per cent of total manufacturing employment and thirty per cent of manufactured exports.
Other studies elsewhere in Brazil have shown that between 1970 and 1990, Brazil managed to raise
its share of world exports in leather shoes from less than one per cent to more than twelve per cent
and in 1991 was exporting nearly 100 million pairs of shoes valued at $900 million a year largely as
a result of the success of its SMEs operating in the Sinos Valley cluster (UNIDO, 2006). UNIDO
also reports that in Pakistan, near the town of Sialkot, a cluster of over 300 SMEs specializes in the
production of surgical instruments such as scissors, forceps and other precision instruments from
high-grade stainless steel. Over ninety per cent of its output is exported mostly to Europe and North
America. The cluster is said to account for over twenty per cent of world exports of surgical
instruments.
1.1 Background to the study
Agglomeration economics and lately, studies on collective efficiency and flexible specialization
(Rabellotti and Van Dijk, 2002; Sverrisson, 2006; McCormick, 1998; Bagachwa, 2001) have
brought to the fore the issue of small-scale enterprises operating in close proximity to each other.
Specific reference has been made to whether such clusters can contribute to the economic
prosperity of developing countries (Morris and Barnes, 2003; Oyelaran-Oyeyinka and
McCormick,2006).

5
A study by Bhalla (1998) based on the East African countries of Tanzania and Kenya found that
small-scale businesses in these countries operate at a low level of technological development and
innovation. Such businesses tend to use traditional technologies, that is, technologies that need
improvement or replacement (Bhalla, 1998). In the very small production units, the activities of
production and administration are undertaken by the same individual. This also seems to be the case
with respect to the enterprises in Zimbabwe‟s small-business clusters.
Studies on agglomeration economics also tend to suggest that business enterprises located in close
proximity to each other are likely to exhibit “collective efficiency”, wherein the individual
enterprise is viewed as part of an interrelated system of production and distribution (Van Dijk and
Rabellotti, 2004). As a collective, the enterprises are more efficient than they would be operating in
isolation. This is especially true where the business cluster is sector-specific, like The Complex near
Glenview, in which small, vertically disintegrated enterprises are involved in the same broad sector
of household furniture. This type of business cluster has been referred to as a “Marshallian District”
by Van Dijk and Rabellotti (2004: 20). The enterprises within such a cluster exhibit both horizontal
and vertical collaboration, resulting in agglomeration economies.
The Gazaland cluster, however, is less sector-specific than the one in Glenview (The Complex) in
that one can identify more than one industrial sector within the cluster. Such a cluster, referred to as
a “Market Town” (Van Dijk and Rabellotti 2004:28) would still, however, exhibit signs of
collective efficiency. The economies of agglomeration in such a cluster would not arise from
efficiencies within the members of the cluster per se, but from the enterprises‟ ability as a group to
attract more customers than they would individually. The larger flow of customers results in
economies of scale for each enterprise within the cluster.
1.2 Statement of the problem
The notion held in the past was that small firms were essentially a transitional phenomenon that
would pass with time as economies grew. It was believed that small businesses would “fade away”
as victims of their own inefficiencies and large business would rule the roost (Thurik and Carree,
2005; Piotr and Mareki, 2009). Recent studies in Europe and North America, however, have proved
that the opposite has actually been true in that the importance of small firms has grown, especially

6
in Europe and America. The production systems that have in the past been followed by large
industrial firms in these regions were based on „Fordism‟, that is mass production and assembly-
line techniques. These production techniques were coupled with „Taylorism‟ in management, a
clear line of command and a highly developed division of labour and stratification within the
factory, what Thurik and Audretsch (2004) refer to as the managed economy.
Indeed, global entrepreneurship, and thus the formation of small firms, has been growing rapidly in
recent years. This has been confirmed by the Global Entrepreneurship Monitor (GEM) which has
since 1999 carried out annual surveys covering 59 economies and assessing the level of “early-stage
entrepreneurial activity” in those economies. In the year 2010 alone, it was found that more than
250 million people globally were involved in early-stage entrepreneurial activity (Kelley, Bosma
and Amoros, 2010).
The main reason for the growing relative importance of the small firm globally has been the
intensifying global competition and the increasing degree of uncertainty and market fragmentation.
These changes in patterns of demand over time resulted in the need to restructure production plants
to suit the customized demand patterns of today, leading to the development of “flexible”
techniques copied from Japan, such as „Just-In-Time (JIT) inventory management systems
(Pederson et al, 2004) and a refocus on smallness.
In Africa, pre-independence and post-independence industrialization policies have also tended to
emphasize the development of large, mass-production industries along the „Fordist‟ paradigm to the
detriment of small firms (Ronnas, Sjoberg and Hemlin, 2001). Pre-independence colonial laws and
regulations were used to erect barriers to the development of small-business enterprises and to
systematically benefit the interests of the settler community at the expense of the indigenous
majority. Small, indigenously-owned businesses were regarded as “illegal”, not due to the nature of
their economic activities but to the restrictions imposed on them officially which prevented them
from accessing legality. The entrepreneurial spirit among the indigenous population was
systematically killed off, thwarting the growth of small-business enterprises from this population
sector. This process ensured that the indigenous population would always be available as a pool of
cheap labour for the mass-production factories, plantations and farms (Mhone, 2002).

7
Even after attaining independence from colonialism, small and medium-scale enterprises have not
been high on the development agenda of many African governments. “Africanisation” has always
been associated with the promotion of small enterprise, but African governments chose the state
socialist road of nationalization and public enterprise expansion as the supposedly faster road to
Africanisation. The development of small-business enterprises has historically been impeded by
these post-independence industrialization policies under which small-business enterprises were not
seen as desirable in themselves, but as a necessary first step towards the development of large-scale
industrial firms (Alila, and Pedersen, 2001; Osei et al, 2003; Ramamurthy,2008)
In Tanzania, for example, there was a fairly rapid development of small enterprises during the early
years of independence, but after the Arusha Declaration of 1967, the development of private
enterprise was no longer in line with the new socialist policies and very few commercial enterprises
were allowed to develop in the Ujamaa Villages. Outside the villages, only the large state-owned
enterprises and other large-scale import-substituting industries were allowed to flourish. These
institutions experienced several problems due to the inflexibility of their production methods
(Sverrisson, 1994) as well as dependence on imports which led to under-capacity utilization and
foreign exchange shortages (Bagachwa, 1994). Also in Uganda, the official attitude towards the
small-scale sector was generally negative (Alila and Pedersen, 2001: 3). A study carried out by the
International Labour Organisation (ILO) in Kenya in 1972 popularized the term “informal sector”
with reference to the activities of business enterprises that were viewed to be outside the system of
government regulation and not recognized by law.
In Zimbabwe as well, the small official stature of the small-business sector continued even after the
attainment of independence. As a result of the colonial legacy, like in other African countries, at
independence in 1980 Zimbabwe‟s informal economy was very small, accounting for less than 10%
of the labour force. This legacy consisted of various laws and bylaws that had been put in place to
prohibit the free movement of indigenous people, especially from rural to urban areas. Most of
these laws continued to be applied to the detriment of the growth of small-business
entrepreneurship and the most prominent of them were: the Regional Town and Country Planning
Act, Chapter 29:12/1976, the Housing Standards Control Act, 1972, Chapter 29:08 and the Urban
Councils Act, Chapter 29:15/1995 (Tibaijuka, 2005).

8
This very restrictive policy environment tended to thwart the development of small-scale
enterprises as confirmed by many studies (Chirisa, 2009; Kapoor, Mugwara and Chidavaenzi, 1997;
Moyo,1995; McPherson,1998 and Tibaijuka, 2005). These studies suggest that there were
significant barriers to entry into business by new small players which perpetuated the high levels of
concentration of ownership of productive assets inherited from the colonial era. The socialist
inclinations of the political leadership tended to discourage entrepreneurship by the private sector
by placing greater emphasis on co-operatives and large state-owned enterprises. Like in many other
African countries, small-business operators continued to be viewed in a negative social light, being
regarded as “informal sector employees”, or people without a “proper job”. This term has also been
applied in particular reference to small business enterprises that are not formally registered in terms
of the law.
Thus officially, the “informal sector” as such was viewed as an unorganized “nuisance” sector
which, at the very least, deserved to be conveniently neglected. Since small-business enterprise in
Zimbabwe was generally associated with “informality”, the initiatives that were made by
government to develop entrepreneurship at the small-scale level, such as the Small Enterprises
Development Corporation (SEDCO), the Venture Capital Company of Zimbabwe, Credit Guarantee
Company of Zimbabwe, and the Agricultural Development Bank, were rather piece-meal and
mainly ineffective (Kapoor, 1997).
In spite of these negative factors, the significance of the small-business enterprise sector in
Zimbabwe has continued to rise in recent years. Though not much is known about the exact number
of small business operators in Zimbabwe today, a study by GEMINI sponsored by USAID in1991
estimated that there were about 845 000 small enterprises in Zimbabwe at that time. Most of them
were operating in the “informal sector” and employing 1.6 million people, which was 30 percent
more than those employed in the modern, (formal sector). Another study by the Confederation of
Zimbabwe Industries (CZI) found that in November 2000, at least 1.7 million people were making
their living in the “informal sector”. Tibaijuka (2005) also reported that by 2004 the “informal
sector” was contributing forty per cent of total employment in Zimbabwe and by that year the
“informal economy” had effectively become the mainstay for the majority of Zimbabweans. The
ILO also reported in June, 2005 that between three and four million Zimbabweans earned their

9
living through informal sector employment, supporting another five million people, while the
formal sector employed just over one million people.
Certain significant developments have been responsible for the phenomenal growth of small-
business enterprise in Zimbabwe. The initial catalyst was the IMF-led Economic Structural
Adjustment Programme (ESAP) of 1991 whose intention was to impose austerity measures on the
government, particularly with respect to public sector expenditures. The austerity measures
imposed by ESAP exacerbated existing social ills, the most critical of which was the massive
retrenchment of skilled and unskilled labour in both the private and the public sector which was
accompanied by the closure of many manufacturing entities. These factors, combined with the
liberalization of the economy, led to the gradual but systematic decline of the formal economy and
to the growth of the informal sector (Fashoyin, 2008; Mhone, 2002; Tibaijuka, 2005).
The second push factor for the growth of informal businesses was the rising unemployment levels
in the formal sector as well as increasing poverty levels. Pearson and Hungwe (1997) report that a
Poverty Assessment Study Survey (PASS) carried out by the United Nations Development
Programme (UNDP) in 1997 found that sixty-two per cent of the population had per capita incomes
of less than USD122 per year and therefore could not afford to buy a basket of basic needs. They
also report that in 1997 the rate of unemployment was thirty per cent according to the Government
of Zimbabwe and forty-four per cent according to the Zimbabwe Congress of Trade Unions. The
Confederation of Zimbabwe Industries (CZI) also reported that in the year 2000 alone, 9 684
workers were retrenched and at least 90 000 people were estimated to have been forced out of
formal employment as 1 100 companies were shut down during the years between 1999 and 2000.
At that time, only forty per cent of working adults were still employed. From 2006 and 2009 more
than thirteen thousand employees were formally retrenched in the manufacturing sector with the
approval of the Ministry of Labour. The main reasons given by most firms were: downsizing,
viability problems, and company closures. The growth rate of unemployment during this three-year
period alone was 130 per cent per year (Mpemba, 2010). In June 2007 (CZI) reported that 80
percent of the labour force in Zimbabwe was unemployed (CZI, 2007).

10
As noted by Fashoyin (2008) in a report for the International Labour Organisation on Zimbabwe‟s
“informal sector”, the performance of the formal sector and its ability to create formal employment
opportunities is a crucial determinant of the size of the “informal sector”. This was also the
observation made at the 90th International Labour Conference of 2002, wherein it was concluded
that “the informal sector absorbs workers who would otherwise be without work or income”
(Fashoyin, 2008: 6).Thus, the growth of the small-business sector coincided with a drastic drop in
the Gross Domestic Product (GDP) per capita from the early 1990s to the end of that decade which
coincided with the introduction of ESAP in 1991, which was immediately followed by the
Zimbabwe Programme for Economic Transformation (ZIMPREST) and a severe drought in 1992.
These and many other factors triggered and economic melt-down which was to last until July 2008.
An International Monetary Fund country report on Zimbabwe (IMF, 2003) notes that real output
declined by about 30 per cent between 1999 and 2002 and that the real Gross Domestic Product
(GDP) per capita declined by about 26 per cent during that period. The Confederation of Zimbabwe
Industries (CZI) reports that in 2008 the manufacturing sector was producing 30 per cent of what it
used to produce in 2003 and more than 75 per cent of firms in the manufacturing sector were
operating at less than 50 per cent capacity utilization, with only 4 per cent operating above 75 per
cent, indicating very high levels of unemployment for the whole economy (CZI, 2008).
The effects of this declining real output as a result of capacity underutilization was compounded by
ensuing high inflationary levels in the economy which eroded wages and forced people to seek self-
employment in the “informal sector”. By April, 2006 the inflation rate in Zimbabwe was being
reported to be 1 000 per cent. By October 2007 it went up to 10 000 per cent and by January 2008 it
was being reported at 100 000 per cent. By June, 2008 the inflation rate was being unofficially
reported to be over one million per cent. At that time the Reserve Bank of Zimbabwe (RBZ) had
lost control of the growth rate of the broad money supply and therefore control over the inflation
rate. In January, 2008, the RBZ reported in its monthly bulletin that the money supply growth was
way out of its targeted level of 500 per cent per year set in December 2007 and was now at the rate
of 64 118 per cent (Fashoyin, 2008:19).

11
The Labour Force Survey carried out by the Zimbabwe Central Statistical Office (CSO) in 2004
found that those between the age groups of fifteen and twenty-four years were the most affected by
unemployment, taking up to fifty-seven per cent of the unemployed. It was also found that the
largest single group of the “economically inactive” population consisted of students (37 per
cent)(Fashoyin, 2008:27).These factors provided further impetus for the growth of “informal”
small-business enterprises as these young people sought apprenticeships in existing small-business
enterprises or established their own businesses instead of seeking employment in the formal sector.
A further push to the growth of small businesses was provided by the rapid urbanization of
Zimbabwe after the attainment of independence from colonial rule in 1980. Zimbabwe‟s urban
population rose rapidly from about 23 percent of the total population in 1982 to 35 per cent in 2000
and the UN-HABITAT Global Report on Human Settlements of 2003 predicted that by 2010 the
urban population would have risen to more than 43 per cent. The report also noted that the major
cities of Harare, Bulawayo, Mutare and Gweru had attained population growth rates of over 5 per
cent per year throughout the 1980s (Tibaijuka, 2005).
At the policy front, the Government of Zimbabwe had early realized the importance of the
contribution of small-business enterprises towards the recovery and growth of the economy as well
as employment creation and set up various support programs for the development of micro-
enterprises as well as micro-finance institutions. The most significant of these was the formation of
the Small Enterprises Development Corporation (SEDCO) and the Venture Capital Company of
Zimbabwe in 1984 (Kapoor, 1997).Also important was the setting up of the Social Dimensions of
Adjustment Program (SDA) as a way of cushioning the effects of ESAP. Within the SDA a special
fund known as Social Development Fund (SDF) was also set up to administer the resources for
SDA. The aim of the SDA, inter alia, was to provide training and loan facilities for retrenched
persons wishing to start their own businesses. The SDA program was later taken over by the
Poverty Alleviation Action Plan (PAAP) in 1995 which was set up with the support of the UNDP.
In addition to the SDA, in 1994 a separate Department for Employment Creation was launched in
the then Ministry of National Affairs, Employment Creation and Co-operatives with the purpose of
loans for small businesses.

12
Government also instituted a series of policies with the aim of reducing regulatory bottlenecks and
relaxing physical planning requirements. The most significant of these was Statutory Instrument
216 of 1994 of the Regional Town and Country Planning Act which effectively allowed for the
development of non-residential activities, and therefore small businesses, in residential areas. Many
activities such as hairdressing, tailoring, book-binding, wood or stone carving were deregulated.
Similarly, small and medium enterprises employing 5-10 people in such areas as welding,
carpentry, tin-smithing, shoe repair and small scale car repair were accorded special consent
(Tibaijuka, 2005).
Significant progress on the policy front was made when the National Consultative Forum, the
Ministry of Industry and International Trade together with the Ministry of Youth Development,
Gender and Employment Creation met and drafted the Zimbabwe Millennium Economic Recovery
Plan (MERP), a policy document for the support of small and medium enterprises which was then
approved by Cabinet in July, 2002. The main purpose of the policy was to create an enabling
environment for small business entities by reducing the complexity of the regulatory environment
for such entities. This would be achieved through interventions meant to revise laws and regulations
and thereby reduce the burden of doing business. The policy document also proposed several other
interventions for the development of small business. These included the introduction of incentives
such as tax relief, rate rebates and discounts on land purchases and services, access to finance
through the provision of risk capital and corporate venturing, technical assistance in marketing,
skills development and training and institutional reform (GoZ, 2002). This development culminated
in the creation of the Ministry of Small and Medium Enterprises with the specific mandate of
promoting the formation and growth of small-business ventures in the country.
Recognizing the growing importance of small businesses in Zimbabwe, The Reserve Bank of
Zimbabwe (RBZ), in its Monetary Statement of April 2004, allocated Z$12 billion to the “informal
sector” to be channeled through SEDCO. This constituted 0.8 percent of a Z$1.42 trillion special
concessional facility provided to the productive sectors of the economy which was meant to boost
capacity utilization. SEDCO, together with the City of Harare also constructed several industrial
shelters for small businesses in the Willowvale industrial area and the high-density suburbs of
Glenview and Highfield.

13
Significant contributions were also made by the donor community in an effort to boost the viability
of the small-business sector through the provision of technical assistance, training and loan
facilities. These included the Australian Agency for International Development (AUSAID), the
British Department for International Development (DFID), the Canadian International Development
Agency (CIDA), German Development Co-operation (GTZ), Hivos Foundation, Konrad Adenauer
Foundation (KAF), the Royal Netherlands Embassy, the United Nations Development Program as
well as the United States Agency for International Development (USAID).
These efforts were also complemented by local financial institutions such as Barclays Bank,
Kingdom Financial Holdings and the Commercial Bank of Zimbabwe, which set up Small Business
Units dedicated to the needs of the small-scale sector. Local non-governmental organisations
(NGOs) such as the Collective Self-financing Scheme (CSFS), Credit Against Poverty (Masvingo)
and Environmental and Development Activities (ENDA) Zimbabwe, also came into the fray
(Pearson and Hungwe, 1997).
While the government and other stakeholders in the economy have begun to realize the sectors‟
importance, there is still very little assistance for many small entrepreneurs and most are operating
at below capacity because of lack of funds. “Operation Murambatsvina”, a clean-up exercise that
was carried out in June and July 2005, was a major set-back for small-business operators which
almost wiped out the whole sector when more than 32,000 small, micro and medium-sized
enterprises were demolished (Tibaijuka, 2005).
The growth in the importance of SMEs has also occurred in the other countries in Africa as well,
where SME‟s have gained political influence and have become the focus of development strategies.
These developments have been the result of several factors. Firstly, there is the perceived key role
of SMEs in combating unemployment and poverty and the rapid shrinking of markets due to falling
incomes resulting from unemployment in the large-scale sector (Alila and Perdersen, 2008:
200).Additionally, structural adjustment policies carried out in many African countries have led to
the resurgence of the small-scale sector because of the increased perception of the greater need for
private sector participation in development, including the SME sector (Helmsing and Kolstee,
1993).The donor community has also added to this through their willingness to support SME‟s.

14
Finally, the nature of the entrepreneurs themselves has changed to become more educated, more
highly skilled and experienced. Most of them are former middle-class employees of the more
advanced industrial sector who have brought with them skills and experiences gained from that
sector after being retrenched or voluntarily leaving employment due to falling income levels and
others are school leavers with high education levels.
Small industrial firms are sine qua non to the overall industrial development of any country. As
noted by Schumpeter (1934), small businesses were the vehicle for both employment creation and
entrepreneurship in Europe during the first decades of the last century. In low-income countries,
large enterprises are very few and typically employ less than 10 percent of the manufacturing
workforce whereas small enterprises make up 90 percent or more of all manufacturing enterprises
and account for two thirds of manufacturing employment (Snodgrass and Biggs, 1996). Berry
(2002) makes the case for the importance of the SME sector in Latin America on the strength of the
high level of income inequality associated with the dualistic character of the economies in the
region
The rising importance of small-business operations in Zimbabwe and many other parts of the world
today cannot be denied and this calls for a better understanding of the dynamics that lead to the
growth of such businesses. Specifically, very little is known about the nature and dynamics of
small-business clusters in Africa and particularly in Zimbabwe especially with regards to the factors
that nurture the entrepreneurial spirit of the firms operating in them.
1.3 Research Objectives
The primary objectives of this study were:
1.3.1. To determine the extent of small-firm agglomeration and establish a topology of small-firm
agglomeration in Zimbabwe.
1.3.2. To establish the conditions necessary for pro-development agglomeration in the Zimbabwean
context.

15
1.3.3. To establish the policy measures required to foster pro-development agglomeration in the
Zimbabwean context.
1.4Research questions
The study tried to achieve these objectives through providing answers to the following questions.
1.4.1. What is the extent and diversity of small-firm clustering in Zimbabwe and how do such
clusters compare with those found elsewhere?
1.4.2. What factors are contingent to the growth of entrepreneurship within small-firm clusters in
Zimbabwe?
1.4.3. To what extent do small-firm clusters contribute to the growth of the economy and what
measures can be taken to enhance this contribution?
1.5 Significance of the study
Existing studies on capacity building and technical change have tended to concentrate mainly on
large and medium-scale businesses. The contribution of the very small firm or micro-enterprise to
wealth accumulation and capacity building seems to have been largely neglected (Bhalla, 2004: 83).
This study seeks to improve knowledge regarding the factors that make small firms succeed,
particularly those operating within a cluster. Empirical evidence on the evolution and dynamics of
small-firm clusters in the developing world, particularly in Africa, is still very scanty, save for a
few studies in Kenya and Ghana. Most empirical studies on this phenomenon are based on cases in
Europe (Italy) and Latin America (Brazil).
This study contributes to the existing knowledge on small firms and small-firm clusters by
empirically establishing the evolution and dynamics of small-firm clusters in Zimbabwe. From a
theoretical perspective, such knowledge could also contribute to existing theory on entrepreneurship
in general and the clustering of firms in particular.

16
The study also seeks to verify the authenticity of the Austrian view of entrepreneurship by taking an
evolutionary approach to empiricism within an African context, particularly with regards to
technological capability building and knowledge diffusion in small firms.
The policy debate with regards to fostering the growth of firms and small-firm clusters is still
unresolved. It is still not clear what type of programmes would be suitable for them and there has
not been much success so far. Further, a study carried out by Humphrey and Schmitz (1995)
commissioned by the United Nations Industrial Development Organization (UNIDO)‟s Small and
Medium Enterprises Branch suggests that drawing lessons from the European experience is difficult
because of the lack of causal connection between policies and the success of firm clusters. The
UNIDO study notes that, in Denmark, for example, the Danish Networking Programme aimed at
strengthening networks between SME‟s through the use of “network brokers” was only short-lived
and closed in 1993 after having been in existence for five years. Also Indonesia had an active
programme for supporting clusters of firms through credit and marketing assistance which began in
the 1990s with over 9 000 clusters but by 2005 only 200 clusters were still in the programme
(Perry, 2007).
1.6 Hypothesis
The existence of external economies of agglomeration is not on its own a sufficient condition for
the continued growth of firms operating in a cluster. Such continued growth and success also
depends on the existence of an enabling environment which allows the nurturing and diffusion of
technological capabilities within the cluster.
1.7 Delimitation
This study is concerned with small-firm industrial clusters in Zimbabwe‟s five major cities.
Although there are different activities in many of the small-firm clusters in Zimbabwe, the focus of
the study is on the furniture making industry, which appears to be the dominant activity. The study
uses the Glenview cluster in Harare as a case study of the clusters.

17
1.8 Conclusion
The issue that still has to be resolved with respect to entrepreneurship policy proposals is whether
assistance efforts should be concentrated on groups of firms or individual firms. Assisting groups of
enterprises is more cost effective than assisting individual enterprises due to lower transaction costs
and the facilitation of mutual learning (Dessing (1991).This study extends this debate to the
developing country context where reducing the large-firm bias in the overall legal and policy
framework has been a common factor in efforts to develop the SME sector, though as noted by
Humphrey and Schmitz 2001:15, these attempts have been half-hearted and ineffective.
The rest of the study is organized in seven chapters. Chapter Two is a review of the existing
literature on entrepreneurship, with particular emphasis on the clustering of small firms and
collective efficiency. Chapter Two also explores entrepreneurship as seen from various economic
perspectives. Chapter Three explains the nature of the entrepreneurial model. Taking the
evolutionary perspective which allows for the existence of uncertainty in economic behaviour, the
model uses complexity theory in examining the factors that allow for innovation and capability
building within a cluster of firms, a complex network of relationships. Chapter Four explains the
methodology used in the study. The study recognizes that entrepreneurial behaviour at the micro-
level is quasi-random, though at the macro/meso-level it can be deterministic. Thus, the study will
be equally quantitative and qualitative in approach by acknowledging the quasi-randomness that
exists at the firm-level and the determinism that exists at the aggregate (macro/meso) level. The
chapter also explains the research design, including the methods used for data collection and
analysis. Chapter Five presents the research findings and an analysis and discussion of the findings
is carried out in Chapter Six. Finally, Chapter Seven rounds up the study by discussing the
conclusions from the findings of the study and making some recommendations for policy making as
well as further study in the area of entrepreneurship.

18
Chapter 2
Literature Review
2.0 Introduction
Perspectives on entrepreneurship often take two forms (Spilling, 2008). On the one hand one could
consider entrepreneurship to mean simply the start-up of new firms. Thus, entrepreneurship is
associated with „small‟ firms, however they may be defined. On the other hand one could also take
entrepreneurial activity to mean the innovative actions that are taken by firms or individuals, such
as the creation of new products or entry into new markets. The entrepreneurial activities of firms
also occur in different contexts. The purpose of this chapter is to present entrepreneurship from its
different perspectives and to review the literature on entrepreneurship in the context of small firms
operating in geographical clusters.
2.1Entrepreneurshipas the creation of small firms
Entrepreneurship has often been associated with the start-up of firms. For example, the United
Nations Global Entrepreneurship Monitor (GEM)project, which collects data from 60 different
countries, uses an indicator called the early-stage entrepreneurial activity index as a measure of
entrepreneurship in each country. The GEM project defines entrepreneurs as people between the
ages of eighteen and sixty-four years who are actively involved in starting a new venture. Some
start-ups are the result of the active search for opportunities by the entrepreneur (opportunity-based
entrepreneurs - OPP) whereas others are the result of entrepreneurs who are pushed into starting a
firm due to necessity (necessity-based entrepreneurship - NEC). Studies based on the GEM data
base indicate that many firms are the result of OPP entrepreneurship but in the low and middle
income countries, most start-ups result from the NEC entrepreneur (Amoros, 2009).
Since start-up firms are necessarily small, entrepreneurship is also often associated with small firms
but there is no general consensus as to what exactly constitutes a “small firm”. For example, the
Government of Zimbabwe‟s Ministry of Small and Medium Enterprise Development (MSMED),
defines small, micro, and medium enterprises (SMME) with reference to the number of employees,
total assets and legal structure. According to the Ministry, a micro-enterprise is an entity that is not

19
formalized through a legal structure such as registration in terms of the Zimbabwe Companies Act
(Chapter 190), or a Partnership Agreement and employs less than five persons, a small-scale
enterprise is one that is formally registered and employs less than fifty persons and a medium-scale
enterprise, besides being also formally registered, employs more than fifty but less than seventy-
five persons (Government of Zimbabwe, 1999).
The Ghana Statistical Service considers establishments with ten or more employees as medium and
large-scale and, by implication, those with less than ten employees are small-scale (Osei et al,
2003). A study on “incipient industrialization” in Botswana‟s town of Lobatse by Nakizito and
Darkohi (2002) sates that the Small, Medium and Micro Enterprises (SMMEs) Task Force of
Botswana defines SMEs as “any unit found in the formal and informal sector employing less than
one hundred persons”.
2.2 Entrepreneurship and the individual
Entrepreneurship is widely accepted to mean more than just the start-up of new firms but to include
the entrepreneurial actions of individuals or firms. Entrepreneurship requires “action”, which also
includes the creation of new products and processes or entry into new markets (Schumpeter, 1934).
Effectively, it means the pursuit of opportunities by individuals.
If conceptualized in this way, entrepreneurship becomes a local (micro-level) phenomenon in which
personal action at the local level results in system-wide outcomes (Grebel, 2004 and Kirzner,
1973).Thus, conceptually, one could argue that entrepreneurial activity is the driver of the economic
system itself. However, by accepting entrepreneurship to mean the actions of individuals, one must
then distinguish between those actions that may be considered “entrepreneurial” and those that are
not. Further, one must also investigate the factors that differentiate individuals who take
entrepreneurial actions from those who do not.
The phenomenon of entrepreneurship can be explained from several perspectives, which are:
the Pre-Neoclassical perspective;
the psychological perspective;
the Neo-Classical perspective; and

20
the Austrian or Schumpeterian perspective (Grebel, 2004).
2.3 The Pre-Neoclassical perspective
The Pre-neoclassical school attempted to answer both questions: what constitutes entrepreneurial
actions, and what constitutes an entrepreneur?
Starting with the second question, Grebel (2004) provides a succinct exploration of this issue by
tracing the early thoughts on this subject back to Richard Cantillon, who lived between 1680 and
1734 and described the entrepreneur as an „undertaker‟ whose prominent quality is the willingness
to deal with uncertainty. From this school, early attempts to answer this question were made by
Francois Quesnay (1674-1774), who saw the entrepreneur as an independent owner of a business,
and Nicholas Badeau (1730-1792), who thought that the entrepreneur is a person whose main
concern is to reduce his cost in order to increase profit, what one may call a process innovator.
Finally, there was Jean-Baptiste Say (1767-1832), who in his now famous “Say‟s Law of Human
Industry” saw the entrepreneur as an independent economic agent who combines and coordinates
productive factors.
2.4 The psychological perspective
The investigation regarding the constitution of „the entrepreneur‟ has also taken a psychological
perspective, which tries to find out the factors that motivate the entrepreneur. A comprehensive
sketch of this perspective is to be found in Davidsson (2002) whose analysis concludes that most
empirical studies based on this perspective have tried to establish causalities between the
characteristics of the individual and his or her propensity to become an entrepreneur. According to
Davidsson (2002t), the Locus-of-control Theory which was espoused by Rotter in 1966, is the
most widely accepted example of this perspective. Briefly, it says that while some people are
„internally oriented‟ in that they are more inclined to believe that reality can be affected by their
own efforts, others are „externally oriented‟ in that they believe in the power of external forces to
influence outcomes. Internal beliefs influence the perceived chance of success and therefore,
entrepreneurial behaviour is associated more with internally oriented people.

21
A second example cited by Davidsson (2002: 62) is Prospect Theory by Kahneman and Tversky
(1984) which looks at the entrepreneurial act before it is undertaken as a choice between an
alternative with a certain outcome (normally the status quo) and a risky (entrepreneurial)
alternative. Further, entrepreneurs, like other people, are risk-averse in gain situations, and risk-
seeking in loss situations. This theory concludes that entrepreneurial acts are undertaken, not
because the individuals are more favourably disposed towards risk, but because they find
themselves in situations in which they are more willing to accept risks, for example, a job loss.
Finally, Davidsson (2002: 63) looks at the Ipsative Theory of Human Behaviour developed by
Frey (1988), which asserts that people consistently underestimate the probability of negative events
and overestimate the probability of positive events, resulting in an “illusion of control” and
“optimism bias”. The conclusion from this is that people with an entrepreneurial nature are more
likely to exhibit optimism bias and illusion of control. Such people over-extend themselves by
setting high goals and are better able to recognize opportunities.
Such studies have found the exercise of trying to identify all the relevant psychological and other
characteristics pertinent to establishing the link between the owner of the firm and entrepreneurship
to be very tortuous indeed with very little rewards at the end. This is because there are simply too
many parameters to be considered if one is to undertake a quantitative study using these
perspectives.
Davidsson (2002: 73) describes some of these attempts. For example, studies by Evans (1987)
based on Swedish firms selected firm characteristics, such as age and size, and tried to relate them
to the “growth rate” of the firm. Also using Swedish firms, Watkins (1973) tried to establish the
relationship between firm age and “innovativeness”. Other studies have tried to link the
characteristics of the entrepreneur with the success of the firm. Such characteristics include age of
the owner-manager, business education and previous experience. Boswell (1972) and Warneryd
(1988), for example, found that the age of the owner-manager is negatively related to
innovativeness and growth-orientation. Begly and Boyd (1987) also found that business founders
tend to be more entrepreneurial than non-founders. The overall conclusion from these studies is that
such factors, though important, are not strong determinants of entrepreneurship.

22
The psychological perspective does not address the question of what constitutes entrepreneurial
activity. It only tries to analyse the factors that make up the „typical‟ entrepreneur.
2.5 The Neo-classical perspective
The Neo-Classical school has been accused of ignoring the existence of entrepreneurship itself
(Dopfer, 2006 and Grebel, 2004) and does not help us at all with explanations as to what an
entrepreneur is and what constitutes entrepreneurial actions. This is because Neo-Classical
economists have tried to emulate the deterministic methodologies of the natural sciences by
generating general propositions with regards to social phenomena. But, unlike natural phenomena,
social phenomena are not amenable to laboratory-like tests and therefore unlikely to deliver
generally valid axioms such as those found in physics, for example. Social phenomena such as
entrepreneurial activity are neither constant nor predictable. Thus, from the Neo-Classical
perspective, it is quite difficult to pin down exactly what an entrepreneur is, or even what
entrepreneurs do, as Grebel (2004: 50) states:
The search for the entrepreneur in economics seems to raise the same puzzling
questions as quantum theory does in physics. We know that there is entrepreneurial
behaviour which brings along innovation and economic change. But when we look
at the specificities of an idealized entrepreneur, we are not able to figure out his
detailed profile. There is an indeterminacy phenomenon similar to the particle-wave
duality in quantum theory. We observe the light wave but cannot observe the
photon‟s locality and impulse at the same time.
Neo-Classical economics is premised on the notion that economic change can be explained on the
basis of objective laws and not the subjective activities of entrepreneurs. Though Neo-Classical
economics can be accused of not recognizing the importance of the entrepreneur in economic
activity, it can be argued that its approach is heterodox in that it acknowledges the existence of the
individual agent in economic theory. This further observation is important for the development of a
theory on entrepreneurship. According to Heertje (2004), the heterodox approach to economic
theory can also be referred to as methodological individualism in that methodologically it
acknowledges the existence of the individual economic agent. The Neo-Classical school lost sight

23
of the entrepreneur because it is based on passive methodological individualism (Dopfer, 2006) in
that it does not recognise the role of the individual economic agent in influencing economic change.
Though the approach is basically heterodox in that it acknowledges the existence of the individual
economic agent, the individual is taken as a passive observer. Thus, the Neo-Classical methodology
cannot be said to be “completely heterodox”.
As Dopfer (2006) has noted, the pioneers of Neo-Classical theory such as Walras and Jevons
realized that a proper theoretical explanation of economic phenomena would need to be premised,
not only on objective laws, but also an understanding of the cognitive capabilities and behaviour of
the individual economic agent. According to Dopfer (2006: 7), the individual economic agent of the
Neo-Classical school is, however, a Homo sapiens oeconomicus, with the extraordinary ability to
continuously generate, adopt and retain new knowledge, and therefore able to predict the future.
This individual was created with the intention of solving the “invisible hand” problem of Adam
Smith, whereby any state of uncertainty or disequilibrium is automatically corrected by the “market
forces” of supply and demand. The Homo sapiens oeconomicus only reacts to opportunities but
does not in any way change them. The Neo-Classical view of the entrepreneur as an economic agent
is that of a mere physical, quantitative object, or a “dependent variable” in a system of
mathematical equations (Ebeling, 2007: 91) with no significant role in the shaping of the future.
It is for these reasons that the Neo-classical school is accused of having “lost sight” of the
entrepreneur (Grebel, 2004; Dopfer, 2006; Ebeling, 2007).
2.5 The Austrian perspective
The Austrian school also takes a heterodox approach in that it takes entrepreneurship to mean the
activities of individuals. It is based on what Dopfer (2008) calls the “complete form” of
methodological individualism, or active methodological individualism in that it acknowledges the
role of the individual economic agent as the key to economic change. Active methodological
individualism takes the view that not only does the economic agent respond to opportunities but
also actively takes part in creating these opportunities. The Austrian definition of what constitutes
an entrepreneur can be summarized as the process of recognizing opportunities, responding to them

24
appropriately, and creating new ones. This can be deciphered from several of their thoughts on this
subject.
The Austrian school emphasizes alertness and action as the hallmarks of entrepreneurship. Grebel
(2004) also provides a comprehensive sketch of this perspective and shows that the thread to the
beginning of the Austrian school can back to Carl Menger who lived between 1810 and 1921 and
described the entrepreneur as the action man, whose main concern is the satisfaction of his human
needs. Also as espoused by Menger (1921), human action is at the centre of the transformation
process and all economic change. This theme was also taken up by Mises (1996, p254) when he
said that entrepreneurship refers to the acting man in regard to the changes occurring in the data of
the market.
The transformation process, which consists of the coordination of production, is time consuming
and besides technological knowledge, foresight is required in order to meet the future needs of
consumers. However, the future needs of consumers are not also perfectly predictable. Thus,
uncertainty is the driving force of human actions, and according to Mises (Grebel, 2004: 51). Every
action is a speculation that is guided by a definite opinion concerning the uncertain conditions of
the future. Knight (1933) then describes the entrepreneur as a business man, who is the bearer of
uncertainty:
Because of imperfect knowledge, producers have to predict consumers‟ needs,
coordinate production in accordance with these needs. Only a small group of
economic agents, the business man, is willing to face this uncertainty, has the
intellectual capacity and power to direct and control others who are rather doubtful
and timid (Grebel, 2004: 26).
Another prominent Austrian economist sighted by Grebel (2004: 74) is Kirzner who sees the
entrepreneur as the individual who is alert to market opportunities to make profit. The entrepreneur
has a certain subconscious view of the opportunities offered by the market. However, these are just
“hunches‟ which, when acted upon, may turn out to either having been correct or wrong. If the

25
hunch had been wrong, the entrepreneur will correct it and make new hunches. Thus,
entrepreneurial activity is a continuous but spontaneous learning process.
Economic agents are, however, different in the manner in which they learn. Active methodological
individualism is also associated with the observation that economic agents are heterogeneous with
respect to their individual intellectual endowments and cognitive capabilities, and therefore,
knowledge (Grebel, 2004 and Ebeling, 2007). Heterogeneity in intellectual endowments and
cognitive capabilities implies that different individuals will have different (heterogeneous) ways in
which to interpret the same set of economic phenomena and have different views (hunches)
regarding the opportunities offered by the market. Thus some individuals will have strong hunches
and act upon them, while others may not. The entrepreneurs are those individuals who act on their
hunches, or their understanding of economic opportunities. They are alert to opportunities and act
on them.
2.7 The Schumpeterian (evolutionary) perspective
According to Dopfer (2008), Schumpeter‟s idea of entrepreneurship can be summarized in his
proposition that entrepreneurs carry out innovations and swarms of followers imitate them,
resulting in “creative destruction” (economic development) from within. The entrepreneur
originates an idea (an innovation) which can then be physically actualized by many other economic
agents.
Although his views on entrepreneurship are heterodox and based on active methodological
individualism, Schumpeter takes entrepreneurship from the operant (local)to the generic(global)
level asserting that decisions made by individuals have an effect on the economy as a whole. He
takes the view that the whole economic system is a complex adaptive system which evolves over
time as a result of the activities of individual entrepreneurs. Thus, his perspective is said to be
evolutionary. Schumpeter saw the entrepreneur as a “disturber of equilibrium”, an innovator. The
innovator is one who shows leadership in carrying out new combinations, which Schumpeter listed
as: the introduction of new products or new product qualities and new production methods, the
opening of new markets, the use of new raw materials or sources of semi-manufactures and the
creation of a new industry organization (Grebel, 2004).

26
In line with the Schumpeterian perspective knowledge diffusion is critical to the innovation process
in that other economic agents will follow the actions of the innovator, resulting in “swarms of
innovations”. The entrepreneur is the hero who has the “dream and the will to found a private
kingdom” (Grebel, 2004: 94).
Schumpeter‟s ideas were based on the simple observation that change is brought about by energetic
personalities. Change involves new ideas, and in this way, the energetic agent is an innovator. The
entrepreneur is the individual who constantly comes up with new ideas and the primary agens, or
source, of change is the energetic drive of these individuals (Spilling, 2008). Accordingly, the
entrepreneur brings about novelty in the form of new ideas. Thus all important change, be it in
political, economic or social life, is brought about by entrepreneurs.
Entrepreneurship from the Schumpeterian perspective is therefore strongly critical of the Neo-
Classical perspective which states that economic change can be explained on the basis of objective
laws only in which the activities of individuals have no role to play. Instead, development is always
propagated by the agens or energetic drive of the entrepreneur. There is no “automatic” economic
progress. Thus, a proper understanding of economic phenomena such as entrepreneurship should be
premised on an understanding of the cognitive process and behaviour of individual economic
agents.
This perspective on entrepreneurship can also be described as evolutionary in that development
comes “from within” the economic system, that is from the cognitive processes and behaviour of
the agents making up the system. The entrepreneur changes the manner in which production is
organized and resources are combined. The entrepreneur develops new business activities based on
these new combinations (Spilling, 2008).
Schumpeter‟s reference to the evolutionary process of entrepreneurship as “creative destruction”
implies that the development of new combinations by way of introducing new innovations often
leads to the disturbance of the current order of things by breaking up the existing circular flow.
Any new innovations, for example the introduction of new products, must as a rule draw the
necessary means of production from some old combinations. Old structures are destroyed while

27
new structures are created, resulting in “creative destruction”. To develop something new, existing
resources have to be organized in new ways, a process which results in evolution.
Economic agents engage in activities at both the operant and the generic level and according to
Kirzner, a prominent Austrian scholar (Dopfer 2008), there is uncertainty in decision making in that
economic agents such as owner-managers of firms do not possess all the information relevant for
decision making at the operational level. They are therefore constantly involved in the search and
discovery of new information, resulting in the discovery of new opportunities, leading to arbitrage
profits and rents.
2.8 Summary of perspectives on entrepreneurship
In summary, the economic agent of the Neo-Classical school is the Homosapiens oeconomicus in
possession of perfect knowledge. This individual is not an entrepreneur at all in that he or she does
not engage in the search for information (passive methodological individualism). The Austrian
economic agent is an entrepreneur actively engaged in the search for information in a world of
uncertainty(active methodological individualism).The Austrian school and the Neo-Classical school
share common ground in that they are both confined to the operant level of the system in that the
search for knowledge by the individual economic agent does not relate to generic knowledge for all
other agents.
Schumpeter, however, argues that during the process of carrying out innovations, the economic
agent changes the knowledge base at the generic level as well. Schumpeter‟s entrepreneur searches
for and introduces into the system new generic knowledge, which, in turn, changes the system
itself. The entrepreneur carries out innovations and by so doing, destroys and at the same time
creates the structure of the economy “from within”. The Schumpeterian entrepreneur introduces
new knowledge, reconfigures generic rules, and enables the agents to use a new set of operations
inducing a reallocation of resources.
The different entrepreneurial perspectives discussed thus far can be summarized in Table 2.1 below.

28
Table 2.1: Summary of entrepreneurial perspectives
Entrepreneurial
Perspective
View on Entrepreneurship
Pre-Neoclassical Willing to take opportunities in a world of uncertainty
Neo-Classical
A deterministic world.
Passive methodological individualism.
The entrepreneur only responds to given opportunities rather than
create them.
No role for the entrepreneur.
Austrian
A world of uncertainty.
Active methodological individualism.
The entrepreneur is the active economic agent who is alert to
arbitrage opportunities but does not change the knowledge base.
Local level view of entrepreneurship.
Schumpeterian
A world of uncertainty.
Active methodological individualism.
The entrepreneur is the active economic agent who changes the
generic knowledge base.
Generic (system) view of entrepreneurship – both local and global.
Source: Author (2011)
the form of a continuum, starting from the view that does not recognize the entrepreneur at all
(Neo-Classical), followed by the acceptance of entrepreneurship at the local level (Austrian) and
finally at the generic level (Schumpeterian). This is illustrated in Table 2.1 below.
This study deviates from these common perspectives that concentrate on the characteristics of the
entrepreneur. Rather, the study is concerned with the nature of entrepreneurship within a defined
context as described below.

29
2.9Technological perspective of entrepreneurship
A recent perspective on entrepreneurship is concerned with the context within which the
entrepreneurial act is taking place rather than simply with the psyche or characteristics of
entrepreneurs. Schumpeter‟s view of entrepreneurship is that the entrepreneur is an innovator, and
innovation results in technological change. This view has been extended to the idea of
technological regimes (Spilling, 2008 and Winter, 2004).A technological regime describes the
environment within which technological developments take place.
The idea of technological regimes can be traced back to Schumpeter. In his earlier proposition on
entrepreneurship, Schumpeter associated entrepreneurship with the start-up of new firms. He
asserted that new combinations are “embodied in new firms which generally do not arise out of the
old ones but start producing beside them” (Schumpeter, op.cit p66). This early perspective on
entrepreneurship is referred to as Schumpeter Mark I and his later perspective as Mark II (Breschi et
al, 2008). The Mark I perspective says that innovations are carried out by a large number of new
firms led by individual entrepreneurs. With reference to technological regimes, this perspective has
been referred to as the entrepreneurial technological regime.
The second perspective (Mark II) which Schumpeter (1943) later provided, asserted that
innovations are carried out within firms, particularly large firms. As Spilling (2008) has observed,
this was a reflection of the fact that at that time, the larger corporations developed much stronger
positions in the economy and with their R&D departments, became very important players through
their contribution to innovation. With regards to technological regimes, this developmental mode is
now referred to as the routinised technological regime, recognizing the fact that large firms
routinely carry out innovations through structured research and development programs.
Following from these propositions, Breschi, Malerba and Orsenigo (2000) have developed a
taxonomy of technological regimes consisting of:
technological opportunities,
appropriability conditions,
cumulativity conditions, and
knowledge base for the industry.

30
Technological opportunities refer to the presence of conditions that enable innovative activities to
take place. A high level of technological opportunities provides powerful incentives for undertaking
innovative activities and denotes an economic environment that is not functionally constrained by
scarcity. This enables potential innovators to frequently come up with important innovations.
Appropriability conditions refer to the existence of conditions that protect innovations from
imitation by others and allow entrepreneurs to reap profits from their innovative activities. Low
appropriability conditions denote an economic environment characterized by the widespread
existence of externalities and technological diffusion. Cumulativity conditions refer to the
existence of an environment that enables continuous learning. These conditions allow today‟s
innovations to form the basis for tomorrow‟s innovations. High levels of cumulativeness are typical
of economic environments characterized by continuities in innovative activities and increasing
returns. The knowledge base for the industry refers to the nature of the knowledge underpinning
the innovative activities of the firms. This is similar to what Grebel (2004) calls the General
Purpose Technology (GPT) of the industry. Technological knowledge involves various degrees of
specificity, tacitness, complexity and independence, and may greatly differ across technologies.
In the entrepreneurial regime, new firms play an important role in the evolutionary process.
Technological opportunities are high and innovations are frequent. However, appropriability and
cumulativeness conditions are low, technological diffusion is widespread and new innovations are
easily imitated. The GPT is based on experience and is easily accessible and is exposed to a large
number of actors. Actors who are new to the industry perceive opportunities for organizing new
combinations, based on their new ideas introduce innovations into the economy by starting new
firms. In so doing, the circular flow represented by existing firms is disturbed, and the basis of
established firms is challenged. Thus, the entrepreneurial regime may also be associated with a
large number of exits, as the basis for the existing firms may be eroded as new firms enter. This
may have the effect of reducing the cumulativeness conditions.
The routinised regime is characterized by the dominant role of incumbent firms, which means that
innovative activities are mostly handled by large incumbent firms that have developed systematic
routines for organizing innovative activities. Appropriability and cumulativeness conditions are
high in that innovations cannot easily be imitated and knowledge diffusion is limited. Barriers to

31
entry are high and it is difficult for entrepreneurs outside the industry to enter and start up new
firms. As the main process of evolution is related to the larger firms and their internal organization
of innovation activities, this mode of evolution is also called „creative accumulation‟ (Malerba,
2004).
This perspective also suggests that entrepreneurship can be studied by analysing the nature of the
entrepreneurial regime within which a firm is operating.
2.10Entrepreneurship in an agglomeration of firms
Generally, small-scale enterprises operating in isolation may face several disadvantages, which are
detrimental to their competitiveness. The disadvantages include limitations in scope and scale.
Firms operating as part of a group in geographical proximity may compensate for these
disadvantages through their interaction with each other and with other agencies, such as traders, or
other organizations. Taken from this perspective, entrepreneurship can be studied by analysing
inter-firm linkages and their effects on the competitiveness of firms.
A recent development in Zimbabwe has been the sprouting up of large clusters of small firms
operating in spatial proximity to each other. The historical presence of an industry in a
neighbourhood enhances the quality of local entrepreneurship and labour skills. A relatively high
density of similar activities in the area translates into a relatively large local demand for certain
goods and services, increasing their supply. Small firms also compensate for their disadvantages
with flexibility in behaviour (Visser, 2004: 64). They are sensitive to opportunities offered in their
environment and may develop functional relations whereby the macroeconomic environment
provides the incentives and limits are set by the availability of institutions to guide inter-firm
linkages. Small firms are able to enhance their competitiveness relatively more from external
economies. It is for these reasons that studies on small-firm agglomeration have tended to focus on
the relations between firms. Various studies on entrepreneurship (Porter, 1998; McCormick,1997;
Nadvi,1999;Rabellotti, 1997 and Visser, 2004) have accepted Schumpeterian active methodological
individualism which asserts that the decisions made by economic agents at the individual (micro)
level can also influence developments at the generic (macro) level. As a result, the studies have
examined entrepreneurship within the context of firms operating in spatial proximity to each other.

32
This territorial dimension to the study of entrepreneurship has its roots in Alfred Marshall‟s
observations regarding the textile and metal work regions of England, Germany and France in the
19th century, which he referred to as industrial districts (Marshall, 1986):
When an industry has thus chosen a locality for itself it is likely to stay
there long: so great are the advantages which people following the same
skilled trade get from near neighbourhood to one another. The mysteries of
the trade become no mysteries but are as it were in the air, and children
learn many of them, unconsciously (Marshall, 1920, p225).
Marshall noted that the geographical concentration of small firms carrying out similar activities
would result in the division of labour, thus creating more efficiency. The specialized knowledge
that develops within the district would also be reinforced by a common set of cultural and social
values. Thus, skills and information would be found “in the air”, fostering entrepreneurial activity
and innovation.
The United Nations Industrial Development Organisation defines clusters as: a sectoral and
geographical concentration of enterprises that produce and sell a range of related or complementary
products and thus face common challenges and opportunities (UNIDO, 2001). As in this study, the
terms cluster and industrial district are often used interchangeably in the literature. However, they
do not refer to the same phenomenon because all industrial districts are clusters but not all clusters
are industrial districts. Several studies (Cuervo-Garcia and Montoro-Sanchez, 2009; McCormick,
1997 and 1998); Schmitz and Nadvi, 1999) have made this distinction by defining an industrial
district as a sectoral and spatial concentration of small and medium-sized firms or a sectorally-
specific, and geographically-bound agglomeration of firms. Sectoral specificity or sectoral
specialization refers to the existence of firms engaged in a distinct industrial activity. Spatial
concentration refers to the location of firms in the same geographic area in close proximity to each
other. The firms within the locality can be competing with each other as well as other large and
medium-scale enterprises outside it( Rabellotti, 1997: 8). An industrial district is therefore a cluster

33
of firms with sectoral specificity and spatial concentration. It is a specially advanced case of
clustering.
Porter (1998) also refers to a cluster as a geographically proximate group of interconnected firms
and associated institutions in related industries, meaning that within a cluster one may find several
industrial districts.
2.11Characteristics of industrial districts
For a cluster of firms to conform to the typical Marshallian industrial district, some key elements
must exist (Altenburg and Meyer-Stamer, 1999; Hodgkinson, 2007; Van Dijik and Rabellotti,
1997). Firstly, there must exist a strong, relatively homogeneous cultural and social background
linking the agents in the cluster, creating a common, widely accepted behavioural code, which is
sometimes explicit, but often implicit. Secondly, there must be an intensive set of backward,
forward and horizontal linkages and information exchange among the firms, institutions and
individuals within the cluster, giving rise to a creative or innovative milieu. Clustering brings with it
various types of inter-firm relations, ranging from total absence of co-operation to situations with
extensive collaborative arrangements in production (Nadvi, 1994). Thirdly, a local pool of skilled
labour, from which all cluster members can source their labour requirements, is necessary. Finally,
a network of public and private local institutions supporting the economic agents within and outside
the cluster is also required.
Some studies have also added the element of trust to these characteristics. For example, a study on
Nairobi‟s garment manufacturers in Kenya by McCormick (1997) noted that in an industrial district
the firms share a set of values and knowledge so important that they define a cultural environment
and are linked to one another by very specific relations in a complex mix of competition and
cooperation. Van Dijik and Rabellotti (1997, p9) have described the industrial district as a moral
community where the limits to trust and self-interest are understood and backed up by public
opinion. It is characterised by well-established and accepted social norms, frequent and long-term
interactions among a large number of economic agents who may know each other quite well, and
by the pervasive dissemination of information. Rules and regulations may not be written but they

34
are known and self-enforced and the social sanctions for deviant behaviour can be heavy (for
example, social exclusion) (Nadvi, 1999).
In the same vein, Becattini (1992), with reference to Italian industrial districts, also described the
Marshallian district as a socio-territorial entity which is characterised by the active presence of both
a community of people and a population of firms in one naturally and historically bounded area. In
the industrial district, community and firms tend to “merge”, bounded by extra-economic factors,
particularly social.
2.12Success factors for firms located in industrial districts
Studies carried out in various industrial districts (Giuliani, 2002; Nonaka and Takeuchi, 2004;
Visser, 2004; Van Dijk and Rabellotti, 1997; Romjin 2000;have identified certain factors as being
essential for the success of firms operating in these districts. These are:
the territorial environment,
collective efficiency,
flexible specialisation, and
the acquisition and diffusion of knowledge.
a. The territorial environment
A study by Visser (2004) on the Peruvian small-scale clothing industry in the Lima district of
Gamarra identifies the territorial environment as a critical success factor for firms operating within
an industrial district. The territorial environment refers to both the functional and the institutional
settings at a specific location. Location can be described in terms of the density of economic
activity. This is the relative concentration of similar or dissimilar firms. Location also refers to the
spatial proximity, or nearness, of the economic agents, and its history in a socio-cultural sense.
These factors mold territorially-specific conditions resulting in the conduct of economic agents
being spatially differentiated, meaning that firms located in different geographic regions would
have different characteristics, depending on their territorial environment (Visser, 2004).
The territorial environment can compensate for the so-called disadvantages of being small, by
reducing transaction costs for the firm, such as the search for and matching of products, the
35
screening, selection and monitoring of business partners, as well as the enforcement of contracts.
Other costs include the cost of gathering information on consumer preferences in product markets,
types, availability and quality of inputs, production techniques, equipment, components and
business services.
A high density of similar economic activities can reduce these costs in that spatial proximity
facilitates the gathering of information. Personal contacts are more frequent and local norms and
values may stimulate the circulation of more delicate information. This results in the diffusion of
information with little or no transaction costs taking place. Nearness of economic agents enhances
reputation effects, that is, investments in reputation are facilitated in environments where repeated
transactions occur with the same agents. Where economic agents have face-to-face contact, trust is
built and this reduces the need for information.
The functional environment is the network of firms based on vertical specialisation in one or
more steps in the transformation process and the mutual subcontracting of transformation services.
The network also includes agents providing business services, inputs, equipment and components.
Another form of functional interdependence or networking comes in the form of horizontal co-
operation between otherwise competing firms involved in the transformation of products, for
example, joint sub-contracting, joint purchasing, or marketing of products. Finally, there may also
exist upstream or downstream transactions with traders of final products and inputs whereby
producers may adjust their planning according to market information provided by the traders.
The institutional environment is exogenous to the firm and can shape the functional relations
between the firm and other economic agents. Ramamurthy (1998) defines institutions as formal
rules, such as statues, and informal rules, such as norms, that constrain behaviour. Institutions are
effective rules rather than nominal rules, with emphasis on enforcement. The institutional
environment therefore consists of the agencies through which these rules are operationalised and
enforced that, is the government, quasi-government, the private and non-governmental agencies. In
addition to these, social and cultural norms and standards also influence the behaviour of firms.

36
b. Collective efficiency
Collective efficiency, a term introduced by Schmitz (2001), holds that enterprises operating in
close geographical proximity can benefit from both local and external economies as well as joint
action.
External economies are incidental in that they are the result of agglomeration and spatial proximity
itself. External economies consist of economies of scale which result from increased production as
well as economies of scope which result from the production of several products at the same time
while using the same facilities such as marketing and transport. Nadvi (2001) also referred to the
external economies as location economies and urbanization economies. The location economies are
the advantages deriving from the spatial concentration of enterprises belonging to the same industry
or sector whereas the urbanization economies derive from localization in an urban area, for example
large markets and low transport costs. Increased market access for customers, traders, skilled
workers and other economic agents supplying inputs for the products as well as support institutions
may appear simply because they heard of the cluster (McCormick, 1999). These advantages do not
require coordinated effort but are simply incidental to the existence of the cluster of firms.
For collective efficiency to be achieved, however, the external and incidental economies must be
combined with the active participation of firms in joint actions. Spatial proximity enables resources
to be shared thereby reducing the scale of investment required by each individual firm. It fosters
information sharing, thereby facilitating learning of new techniques and upgrading existing
technologies, that is, it fosters the diffusion of innovation and technological capabilities. The
upgrading of technological capabilities and any other advantages that may occur within the
industrial district are the outcome of the collective impact of individual decisions and will be open
to all enterprises within the district.
c. Flexible specialization
Instability and uncertainty in both input and output markets are the norm today, given the
globalization of markets. These constraints are, however overcome in the context of firms operating
in close geographical proximity in that the firms will form a community of flexible enterprises
operating within flexible production networks. As noted in a study by Sverrisson (1994) on

37
carpentry enterprises in Zimbabwe and Kenya, most small and medium-sized enterprises in Africa
are flexible enterprises operating within flexible production networks. Flexible technological
networks are volatile and consist of firms that are autonomous with no central authority. The
networks are not permanently established but evolve continuously over time from preceding social
arrangements. This implies that technological change is gradual and local, that is confined to
limited sections of the economic agents within the cluster.
It has in the past been claimed that small firms in developing countries can acquire technological
capabilities through simply importing machinery and equipment from the technologically advanced
countries. This may not be entirely true (Bhalla, 1991). Technological capabilities consist of
technological skills and knowledge which accumulate over time through experience that is,
“learning by doing”. This tacit knowledge may however not be enough in that a purposive
commitment of time and human resources to those activities that lead to technological learning is
also required (Romjin, 2004).
Full knowledge about all the possible uses of a machine that has been recently acquired by a firm
takes time through the continued use of the machine. However, this can be a very cumbersome
process for the small-firm entrepreneur. The entrepreneur may be forced to acquire a machine that
is not entirely suited to the circumstances in which it will be used resulting in a discontinuity
between the technology currently in use and the adoption of new technology through the use of the
new machine. In some cases the entrepreneur may be forced to acquire locally made, low-quality
equipment and machinery due to financial constraints. Such machinery may be prone to more
breakdowns and require more intensive maintenance than imported machinery. In other cases, the
entrepreneur may be forced to squeeze maximum performance out of old-vintage second-hand
machinery which requires extensive reconditioning and repair.
Flexibility in production can be evidenced by the sophistication of production technology. In the
case of carpentry workshops in Mutare (Zimbabwe) a study carried out by Sverrison (2006) found
that technological capability ranged from the simple use of hand tools to fully mechnised
production units. However, most of the firms produced varied types of furniture, piece by piece and
the design was variable, depending on customer needs. They did not produce standardized products

38
in batches. “A single craftsman using one machine after another in the process of shaping wood
prior to assembly, which is then carried out by hand, was the most common practice” (Sverrisson,
2006:.43).
Production flexibility can also be archived if the production network is not geared permanently to a
particular product. Socially, the technological network within the enterprise is intergraded through
the division of labour that is, the allocation of tasks to workers in the workshop. The production
process is subdivided into several parts and each part or some parts are allocated to each worker or
several workers. The workers then become experts in the use of the machines that are used on their
part of the process. The machines are multi-purpose and can be used to produce a wide range of
products, reducing the enterprise‟s dependence on one product. This then, in turn, allows the firm to
adapt its operations to any changes in the external environment over which it has little control. For
example, a fall in the demand for, or restrictions in the supply of inputs for a certain product, would
not be disastrous for the firm as it can easily switch to other products.
The workers in this enterprise have become a “node‟ in a social network connected by several
machines. The workers skills levels are relatively low and are local rather than global with respect
to the complete product.
d. Knowledge acquisition and diffusion
From Marshall‟s observation, it is clear that firms that are organized in clusters or industrial
districts can benefit from knowledge acquisition and its diffusion, naturally “in the air‟ of their
locality. However, recent studies on clusters in developed countries have shown that more work
needs to be done with respect to two considerations (Giuliani, 2002). Firstly, that the approaches
applied in these studies have generally focused on production linkages, while knowledge flows and
knowledge systems within the cluster have been poorly investigated (Abu, 2007; Bell, 1999). The
second concern is that the technological isolation of a cluster or industrial district can lead to the
risk of “lock-in”, leading to “entropic death” (Camagni, 2009). As a result of these two concerns it
now appears more appropriate to investigate industrial districts as networks between the economic
agents (firms) within the district as well as networks outside the district itself (Belussi, 2000).

39
The Schumpeterian perspective on entrepreneurship, which is based on active methodological
individualism, conforms to the fact that the localization of firms is beneficial to the economic
agents operating within an industrial district in that knowledge is freely available to all agents and
each agent adds to the stock of existing knowledge, thus new knowledge is generated on an
incremental basis.
Knowledge and its diffusion are the catalysts of entrepreneurial behaviour. Without knowledge
diffusion through society, no entrepreneurial activity would take place. Knowledge is necessary to
activate actors, to initiate entrepreneurial behaviour. Knowledge has been defined in various ways.
For example, Lundvall (2001) makes a distinction between information and knowledge. Knowledge
implies a learning process that begins with understanding the existing stock of knowledge and is
followed by adding further knowledge to the stock of knowledge.
In general, two types of knowledge can be distinguished: tacit knowledge and codified
knowledge(Polanyi 1958and Giuliani, 2002). Codified knowledge is objective knowledge that is
received from the outside whereas tacit knowledge is highly specific and contextual, and may be
referred to as “learning-by-doing”. Tacit knowledge is embodied in the economic agents, what
Berry(2008) also calls implicit learning, the sort of knowledge we know we have but cannot
articulate.
Contrary to neo-classical economic theory, knowledge is not easily transferred, it is not freely
available to all economic agents, and thus cannot be considered a public good. Tacit knowledge is
highly idiosyncratic. It is situated and accumulated within the boundaries of the firm over time,
difficult to imitate and therefore not freely available in the air as suggested by Marshall (Belussi,
2000).
From the Neo-Schumpetarian perspective, the firm is the depository of tacit knowledge, which is a
localized and not completely transferable good. However, the diffusion and exploitation of local
tacit knowledge by local firms is not sufficient to guarantee the dynamic evolution of an industrial
district. Local tacit knowledge and external codified knowledge must interact in order to generate
new knowledge (Nonaka and Takeuchi, 2004). It is important to link local and global systems of

40
knowledge, that is the establishment of external networks of knowledge is fundamental to the
continued dynamism of an industrial district. Links with external sources of knowledge are not
simply a way of overcoming “lock-in” and avoiding “entropic death” but are also necessary to
maintain endogenous dynamism.
Empirical evidence gathered by some Italian scholars, (Belussi; 2000; Gottardi, 2000) on the Italian
industrial districts, recognize that industrial agglomeration is an ever-changing and dynamic
process. According to these studies, industrial districts may exhibit different levels of dynamism,
being simply “static”, “evolutionary” or “strong evolutionary”, depending on the innovative
capabilities of the firms within them, the knowledge exchange among them, and the level of
interaction between external codified and local tacit knowledge.
Recent contributions by Cowan and Foray (2000) extend the Neo-Schumpeterian view of
knowledge by distinguishing between three degrees of codification. The first is codified knowledge
that is articulated and for which a code book exists and is available. The second level is
unarticulated codified knowledge or displaced codebook where a codified body of common
knowledge, “the codebook”, exists but is not evident and manifest to the outside observer. Finally,
they also refer to tacit knowledge, where not even a codebook exists.
The last two insights are very critical to the understanding of knowledge diffusion within an
industrial district in that they suggest the existence of a boundary between “pure tacitness” and
“apparent tacitness” (Giuliani, 2002). Apparent tacitness refers to the case in which an external
observer perceives as tacit knowledge what in reality is codified and transferred through common
language and codes among the members of the same “epistemic community”. Giuliani defines
epistemic communities as networks of individuals or networks of firms that share the same
language such as technical terms or jargon. This language is codified but not easily understandable
to “outsiders”, as they do not have access to this virtual “codebook” that would allow them to
interpret the language.
This later insight is also important in that previously accepted modes of knowledge diffusion within
industrial districts such as skilled labour force mobility, informal contacts and geographical

41
proximity may not after all be very effective modes of knowledge diffusion. In this regard, Breschi
and Lossoni (2001) suggest that embodied scientific and technical knowledge remain a private
good, unless sharing agreements turn it into a “club good”. They further note that labour mobility
may not, as previously thought, represent a valuable mode of knowledge diffusion. This is because
workers who move across firms may not necessarily transfer their knowledge to the new firm but
may actually retain such knowledge unless there exists an incentive to do so. Moreover, the
dissemination of valuable knowledge by the employee is only possible if the employee is
particularly skilled and has acquired substantial technical competence before moving. Thus, labour
turnover of low-skilled employees may not necessarily add any value to the collective knowledge of
the district. In fact, too rapid labour turnover will be potentially damaging to the firm that has lost
an employee as it may not allow the firm to amortise its training costs.
2.13 Conclusion
This chapter has demonstrated that there are various perspectives from which entrepreneurship can
be studied. The earlier perspectives tended to concentrate on the characteristics or psyche of the
„typical‟ entrepreneur. From the review of the literature presented in this chapter, however, it is
clear that the Schumpeterian perspective on entrepreneurship is the most encompassing, in that it
looks at the entrepreneur as a change agent, not a mere respondent to entrepreneurial opportunities.
This is especially pertinent when extended to the concept of technological regimes. This review
indicates that a more fruitful approach to the study of small-firm entrepreneurship is to look it in the
context of technological regimes. When we extend this to small firms operating in spatial proximity
to each other, the literature suggests this phenomenon has distinct advantages for small firms.
Thus, this study is concerned with entrepreneurship from the perspective of entrepreneurial
technological regimes as well entrepreneurship in the Marshallian industrial district – the
„Entrepreneurial Industrial District‟. In this context, the study should also be concerned with the
nature of the inter-linkages among firms in the Entrepreneurial Industrial District‟ and their effects
on the competitiveness of firms.
A model of the Entrepreneurial Industrial District is to be dealt with in the next chapter.

42
Chapter 3
The Entrepreneurial Industrial District Model
3.0 Introduction
This chapter provides an explanation of why the industrial district can be described as an
entrepreneurial industrial district and also presents the five factors that make up the taxonomy of
such a district.
3.1 An evolutionary view of entrepreneurship
Following the conclusion made in Chapter 2, this study takes the Schumpeterian perspective which
interprets entrepreneurship as innovation. The study also accepts the Neo-Schumpeterian view
which has extended the interpretation of innovation to include the acquisition and diffusion of
technological capabilities, or knowledge (Cowan and Foray, 2000). The Schumpeterian perspective
is based on active methodological individualism which takes the view that knowledge gathered by
individual economic agents at the local level will, inevitably, also have an effect at the macro-level
by shaping the generic knowledge base. This view is evolutionary in that it looks at innovation as
an interactive, complex (non-linear) and path dependent process which is open-ended and never
reaches a state of equilibrium (Giuliani, 2002). Development comes “from within” the economic
system, that is from the cognitive processes and behaviour of the agents making up the system.
Innovation and the acquisition and diffusion of technological capabilities in the industrial district
are not the result of research and development but result from learning by doing and through the
interactive actions of firms.
3.2 The Industrial district as an entrepreneurial technological regime
Following Spilling‟s (2008)Neo-Schumpeterian characterization of industrial districts as
technological regimes, this study takes the view that the entrepreneurial technological
regime,(rather than the routinized regime) is the one that best explains the dynamics of industrial
districts composed of small owner-managed firms. The routinised regime is characterized by the

43
dominant role of large incumbent firms which routinely carry out research and development
activities. However, in the entrepreneurial regime, innovation is not the result of the routine
research and development activities of firms but the result of the spontaneous activities of many
small firms.
A technological regime can be characterized by the existence of four interrelated factors. The first is
the existence of technological opportunities. This refers to the presence of conditions that enable
innovative activities to take place. The second characteristic is the existence of appropriability
conditions. Appropriability conditions prevent the imitation of new innovative activities by other
firms and allow a firm to keep the right to any new technological innovations that it makes and to
reap the benefits there from. The third factor is the existence of cummulativity conditions. These
refer to the existence of an environment that enables continuous learning. The final important
condition for the development of a technological regime is the existence of a highly visible
knowledge base for the industry, which Grebel (2004: 64) calls the general purpose technology
(GPT). It is a “codified” body of knowledge which is available to all economic agents in the
district.
The industrial district is an entrepreneurial technological regime because the innovative activities
within the district are being continuously carried out by small firms operating in spatial proximity
to each other under conditions of uncertainty. The proximity of the firms within the district results
in the widespread existence of externalities and the rapid diffusion of knowledge.
3.3 The industrial district as a system of networks
Many studies (Bruun, 2004; Frenken, 2005; Goldstein, 2008; Kauffman, 2005; Lobo and Macready,
2000; Potts, 2000) have taken the view that an industrial district may be seen as a dynamic, complex
and adaptive system whose elements are the economic agents (firms). The system exhibits “swarm
intelligence” (Bruun, 2004) in that it is a deterministic system with linear properties and yet the
elements that make up the system itself have none-linear properties and appear to exhibit quasi-
random behaviour.

44
The dynamism of the system arises from the fact that the elements within the system are in a
continuous process of learning. The complexity of the system arises because of the way in which a
large number of elements within the system interact with one another. Besides being complex and
dynamic, the system is also adaptive in that it may be capable of adapting to external factors
without the individual elements being aware of it and the elements themselves may be capable of
adapting to the system.
The view of the industrial district as a system of elements focuses on the interaction between
elements within the system, rather than the characteristics of the individual elements themselves.
The system is held together by the interactions between its elements and not simply through the
existence of a collection of different elements. This view of the industrial district is a natural
development from the evolutionary approach taken by “Schumpeterian Active Methodological
Individualism” which views entrepreneurship as the innovative activities of individual economic
agents. The knowledge or technical capabilities gathered at the micro-level have a generic effect in
that they influence developments at the macro-level. Thus, central to this study are the relations
between the firms that make up the system, rather than simply the characteristics of each firm as an
isolated entity.
The relations between firms or economic agents can be interpreted in their connectivity. The
connectivity of economic agents as well as their absorptive capacity are pivotal to the development
of firms operating in the industrial district in that they allow the diffusion of knowledge among the
agents and therefore enhance further technological development. Connectivity enables firms within
the district to access both local and external knowledge flows. The absorptive capacity of individual
firms, that is their capacity to identify, assimilate and exploit knowledge coming from external
sources, determines the extent to which the knowledge that is accessible to firms is actually
absorbed by them (Giuliani, 2002).
The dynamics of the industrial district are also largely dependent on some key actors,
“technological gatekeepers” (Allen et al, 2007) or the “receptors and decoders”(Giuliani, 2002) of
external technological change. These are those economic agents in possession of relatively superior
technological capabilities who naturally assume the role of channeling external knowledge towards

45
other agents in the district and contributing to its diffusion. These are the firms to whom others refer
when they have a problem they cannot solve or they are looking for information, thus facilitate the
diffusion and absorption of knowledge among firms within the district.
The absorptive capacity of the district itself, rather than the firms that make up the district, is also
important. Giuliani (2002) has suggested a taxonomy of the district absorptive capacities, starting
from the “basic” to the “advanced”. A district exhibiting basic absorptive capacities would be
characterized by the absence of firms or institutions that link local knowledge flows to external
sources of knowledge, both tacit and codified. Firms in such a district tend to operate independently
and knowledge spillovers are weak. The firms have limited levels of technological and absorptive
capabilities. The so-called economies of agglomeration and geographical concentration as well as
collective efficiency alone, are not sufficient to induce dynamism within the district.
Industrial districts that are at an advanced level of absorptive capacity exhibit collective learning
when localized firms transfer their knowledge to other firms within the district. They also exhibit a
high degree of openness towards external sources of knowledge and technology and the collective
creation of new knowledge (innovative dynamism). Such firms are not just absorbing external
knowledge on an imitative or adaptive basis but are actually investing in new international
knowledge creation.
3.4System elements: heterogeneous economic agents (firms)
The system elements are the firms, also referred to as economic agents. They are connected
together in a complex web of information interchange. The elements of the system (the firms) are
small relative to the system itself and typically the owner of the firm is also the manager. Therefore,
rather than referring to the owner-manager as “the economic agent” responsible for making
economic decisions on behalf of the firm, the firm itself is taken to be the economic agent, the
system element, and not necessarily the owner-manager. The system elements are heterogeneous
with respect to their knowledge endowments or technological capabilities.
The heterogeneity of economic agents arises from several sources. Firstly, cognitive psychology
suggests that knowledge is subjective because knowledge represents an individual‟s subjective

46
mental model of reality (Piaget, 1994). Reality is, however, bimodal in that the individual‟s mental
representation of the world, that is their state of knowledge, their predictions and expectations, are
often different from reality itself. Thus, the cognitive capabilities of each individual economic agent
will be different from others.
The other source of heterogeneity is that of firms operating in an industrial district which are
heterogeneous in size, in the activities performed, in capabilities and in knowledge accumulated.
Capabilities and knowledge accumulation require time to be acquired as well as experience,
practice and effort. The cumulative and path dependent process of capability accumulation is
therefore highly specific to each firm, so that even if the firms are located within the same district,
they may end up with different levels of knowledge and technological capabilities (Figueiredo,
2002).
The extent to which knowledge flows among economic agents will also have an impact on their
heterogeneity. The diffusion of information among the economic agents will be more rapid than the
diffusion ofknowledge because knowledge requires a learning process. According to Piaget (1994),
learning is a four-step cumulative process of cognition which starts from assimilation, followed by
perturbation, accommodation and equilibration (acceptance). With respect to the building of
technological capabilities, economic agents may be at different steps of the process, thus resulting
in heterogeneity. The spatial proximity of the economic agents may also have an impact on the
diffusion of knowledge. Sticky knowledge (von Hippel, 1994) is transferred via a frequent, face-to-
face contact and, furthermore, depends on its geographical context.
The diffusion of knowledge not only depends on the cognitive capabilities and the behaviour which
limits emission of an actor‟s knowledge but it is also dependent on the absorptive capacity, that is
the capacity to receive and use external knowledge, knowledge that spills over from others. Some
of the knowledge will be codified, but most of it will be tacit, implicitly learned by experience and
social interaction. There is a general purpose technology (GPT) to every economic endeavour. In
the making of steel or wood furniture, for example, there are basic skills and knowledge required in
the design, making and finishing of the product, in the organisation and sourcing of the inputs and
in the marketing of the product before one can create a firm to make and sell furniture. This GPT
must be mastered by each economic agent. Each economic agent has a certain understanding of the

47
existing stock of knowledge, depending on his or her individual cognitive capabilities and
experiences.
3.5 Bounded rationality of system elements
The economic agent is not the Homo sapiens oeconomicus (Dopfer, 2004) of neo-classical
economics, who makes rational utility and profit maximising decisions under conditions of perfect
information, resulting in a state of equilibrium for the economic system (Conlisk, 2009). The
economic agent is a Homo agens (Grebel, 2004) who makes decisions under bounded rationality.
The rationality of the decisions made by the agent is bounded by uncertainty.
In order to take action in the presence of uncertainty, individual economic agents must rely on their
subjective view of the future when making decisions. Firstly, the agents have to form expectations
with regards to their future endowment of resources, capabilities and competences required to
implement a decision. Secondly, they have to assess the potential profit opportunities, such as the
market size, cost of inputs, and expected revenues. Thus, the rationality of their decision is bounded
by these uncertainties.
Bounded rationality means that the decisions made by the individual economic agents do not
necessarily lead to a state of equilibrium for the system as a whole. This is because the expectations
of the agents with regards to the future represent their own mental representation of reality. Not
knowing the true state of reality, they have to make their decisions to the best of their, albeit
limited, knowledge. Moreover, the agents will be forced to make decisions on the basis of
incomplete information due to the high opportunity costs of gathering all the relevant information.
The information would only be gathered selectively.
3.6 System Emergence
According to Corning (2002) the term “emergent” was coined by the eminent psychologist G. H.
Lewis (1874)when he distinguished between “emergent” phenomena and “resultants”. In line with
this thinking, a resultant is either the sum of or the difference between homogeneous components

48
and every resultant is clearly traceable back to its component parts. When the component parts are
heterogeneous, however, the result of bringing them together is emergent phenomena that cannot be
reduced to the sum of or the difference between its component parts.
The term “emergence‟ has rather unfortunately been taken to mean that the “whole is greater than
the sum of its parts”, rather like “synergy”. However, Corning (2002:10) suggests that in fact
synergy refers to “the combined effects that are produced by two or more particles, elements or
organisms – effects that are not otherwise attainable”. Accordingly, for synergy to exist, the whole
should not merely be an expression of its parts but must produce combined effects that the parts
cannot produce alone.
Following from the original definition by Lewis (2006), therefore, one can conclude that the
characteristics of emergent phenomena differ from those of the synergistic “whole” for two reasons.
Firstly, the elements making up the “whole” must be heterogeneous, that is of “unlike kind” as per
Lewis (2006). Secondly, emergent phenomena possess “qualitative novelties, that is unique
synergistic effects that are generated by functional complementarities or combinations of labour”
(Corning,2002: 10). This implies that the existence of synergy does not necessarily lead to the
existence of emergent phenomena. For emergence to exist, the constituent parts with different
properties must themselves be modified, re-shaped or transformed by their participation in the
whole through their functional relationships with each other. In other words, there must be a
diffusion of knowledge between them (not simply information).
“Self-organisation‟ is also a quality that has been ascribed to emergent phenomena. This is rather
misleading because emergent properties arise as a result of functional organization. As economic
agents, human beings are aim-oriented (Grebel, 2004). There is a purpose to the processes that
occur, particularly in the entrepreneurial industrial district. As a mere cluster of firms, the
agglomeration has no functional purposefulness, but when the firms are organized in an industrial
district the synergy they produce has emergent properties to it whose effects the firms alone cannot
produce. The firms as a whole produce global effects that are unique and many of these effects are
also a result of the interaction between the whole and its environment.

49
The industrial district is an emergent phenomenon. Emergent phenomena exist at the macro level, a
higher-order system relative to the micro-level components from which the emergent phenomena
have emerged. Emergent phenomena seem to have “a life of their own”, with their own rules, laws
and possibilities which are more predictable than the lower level micro phenomena from which they
arose. Functionally-organizing emergent structures, patterns and properties at the macro level arise
without being externally imposed on the system. It is a spontaneously occurring, bottom-up arising
of a new order from a near-chaotic lower-order system.(Goldstein, 2004: 9). In the same vein, an
agglomeration of firms in the form of an entrepreneurial technological regime, or an industrial
district, the emergent phenomena, seems to have a life of its own which is different from the
individual firms that make up the district.
3.7 System adaptation
The industrial district is an adaptive system in that there is a continuous process of learning. Since
the economic agents are acting on imperfect information about the future state of reality, their
decisions are fallible and imperfect. Inevitably, they make mistakes and learn from them and have
to adjust their behaviour (subconsciously) when making new decisions. By making these
adjustments they make new discoveries, about markets, technology and other aspects of their
operating environment and become aware of available opportunities and rearrange resources
allocations. They thrive on “trial-and-error” in a world of uncertainty. Their stochastic or quasi-
random behaviour at the local level, however, has global effects on the system as a whole,
continuously transforming it.
The industrial district is constantly adapting to changes occurring at the local (agent) level,
therefore will never be in a state of equilibrium. However, it will possess deterministic (linear)
properties. Though human behaviour at the individual or micro-level is not deterministic, it is not
totally stochastic or chaotic either. It is quasi-random because while certain aspects of economic
behaviour may be predictable, others are not. Firms, being composed of human beings, exhibit
quasi-random entrepreneurial behaviour. For example, with respect to innovation and knowledge
diffusion within the industrial district, some knowledge and technical capabilities may be available
to all economic agents within the district while some of it may only be accessible to a few. When

50
we aggregate the individual behaviours of economic agents at the macro level, we observe general
and predictable phenomena. This is referred to as symmetry breaking (Grebel, 2004).
Symmetry breaking implies that at the micro-level the best that a study can do is to come up with a
descriptive theory of entrepreneurship, but at the macro level, it is possible to come up with a
normative, deterministic theory of the same. An economic agent on his own makes decisions on the
basis of his own knowledge and his mental representation of reality. Within the context of a social
group, however, his behaviour will be influenced by the sociology of the group through constant
functional interactions. The firm‟s individual behaviour may be unpredictable, but within the
context of an agglomeration of firms with emergent properties, the industrial district and the
aggregate behaviours can be predictable. Symmetry breaking means that the characteristics of the
parts do not represent the whole. Grebel‟s (2004) idea of symmetry breaking can be summarized as
shown in Figure 3.1 below.
Figure 3.1Symmetry breaking
Adapted from Grebel, 2004.
Adapted from Grebel (2004: 64)
MICRO-LEVEL – THE FIRM
MACRO LEVEL- THE
INDUSTRIAL DISTRICT
Heterogeneous
economic agents
with
quasi-random
entrepreneurial
behaviour
System with
deterministic
behavior
Emergence

51
3.8 The Entrepreneurial Industrial District Model
Technological innovations within the district are the result of the technological capabilities of
economic agents. The technological capabilities of the individual economic agent (the firm) are
maximized when the agent is operating within an entrepreneurial technological regime (ETR). The
taxonomy of the entrepreneurial industrial district can be modeled as shown in Figure 3.2 below.
Figure 3.2 The Entrepreneurial Industrial District Model
The functioning of the Entrepreneurial Industrial District Model can be explained through the
interaction of the five factors shown in Figure 3.2 above.
3.8.1Internal (tacit) knowledge
This is knowledge which is highly specific and contextual, and may be referred to as “learning-by-
doing” (Polanyi 1958). It may also be referred to as implicit learning (Berry, 2004), that is the sort
of knowledge we know we have, but cannot articulate. This is knowledge for which there is no
written “code book”. It is embodied in the economic agents and is borne out of their individual
experiences. Thus, it is also an interactive, complex, path dependent and open-ended process. The
Technological
Capabilities
External (codified)
Knowledge
Internal (tacit)
Knowledge
Technological
Innovations
Enabling Environment
1. Technological Opportunities
2. Cumulativity Conditions.
3. Appropriability Conditions

52
acquisition and diffusion of tacit knowledge is also largely dependent on the cognitive capabilities
of the individual economic agents as well as their mental representation of reality. The economic
agents are heterogeneous with respect to their possession of tacit knowledge and the amount of tacit
knowledge possessed by each agent determines its technical capabilities.
3.8.2External (codified) knowledge
Codified knowledge (Polanyi 1958) is objective, received knowledge from the outside. It is
knowledge that is articulated and for which a “code book” exists and is available. However, it may
also be unarticulated (“displaced codebook”) in that a codified body of common knowledge („the
codebook”) exists but is not evident to the outside observer (Cowan and Foray, 2000). These are the
“mysteries of the trade” that, according to Marshall (1920), can be found “in the air” of the
industrial district and the economic agents unconsciously learn from them. This knowledge is
transferred through a common language such as technical terms or jargon and codes among the
members of the same “epistemic community” (Giuliani, 2006). The language is codified but not
easily understandable to “outsiders”, as they do not have access to this virtual “codebook” that
would allow them to interpret the language. Grebel (2006) has also referred to it as the “general
purpose technology” of the district. It is a body of knowledge into which all agents are free to tap in
order to enhance their technological capabilities.
3.8.3Technological capabilities
The technological capabilities of the individual economic agent are maximized when the agent is
operating within an entrepreneurial technological regime. The technological capabilities are the
result of the combination of the internal tacit knowledge and the external codified knowledge
(general purpose technology) which is gathered through the agent‟s functional interactions with
other agents.
The absorptive capacity of the economic agents and the existence of a complex network of
functional relations among the agents are important elements in the process of knowledge
acquisition and its diffusion within the district in that they determine the extent to which knowledge
and technological capabilities will be shared among them. The absorptive capacity of the agents can

53
be assessed by the extent to which knowledge and technological capabilities can freely percolate
among them. The complexity of the system can be measured by the number of functional
interactions among the agents within the system.
3.8.4Enabling conditions
Three enabling conditions are also necessary for the acquisition and diffusion of technological
capabilities to take place within the district. These are: the existence of technological opportunities,
appropriability conditions and cumulativity conditions. Technological opportunities refer to the
presence of conditions that provide incentives for innovation and enable innovative activities to
take place. Appropriability conditions refer to the existence of conditions that protect innovations
from imitation and allow entrepreneurs to reap profits from their innovative activities. Low
appropriability conditions denote an economic environment characterized by the widespread
existence of externalities and technological diffusion. Cummulativity conditions refer to the
existence of an environment that enables continuous learning. These conditions allow today‟s
innovations to form the basis for tomorrow‟s innovations. High levels of cumulativeness are typical
of economic environments characterized by continuities in innovative activities and increasing
returns.
These three conditions determine the extent to which the industrial district can become a
technological fitness landscape (Kauffman, 1996; Lobo, Miller and Fontana, 2004). Within the
district, each economic agent must continuously try to find the best “technological fit” in order to
survive. The technological efficiency of the district as a whole can then be measured by its total
“fitness” as a technological landscape.
Technological opportunities, appropriability conditions and cumulativity conditions can, however,
only flourish within a certain enabling environmental setting. The district must provide the proper
territorial, functional and institutional settings for entrepreneurial (innovative) activities to be
carried out by the various economic agents within it.

54
3.8.5 Technological innovation (Entrepreneurship)
Innovation is interpreted to mean the acquisition and diffusion of technological capabilities or
knowledge by the firm (economic agent). It is an interactive, complex, path dependent and open-
ended process. The acquisition and diffusion of technological capabilities or knowledge can be
evidenced by the extent to which the economic agents introduce new products or new product
qualities or new production methods, the opening of new markets, the use of new raw materials or
sources of semi-manufactures and the creation of a new industry organization (Schumpeter, op cit.).
The district must provide the proper territorial setting in terms of the density of economic activity
resulting from the relative concentration of the economic agents (spatial proximity). This territorial
dimension also has a socio-cultural historical aspect to it in that most of the economic agents
operating within the district share a common socio-cultural background which makes the district
spatially differentiated socially and culturally (Visser, 2007). The spatial proximity of the
economic agents helps to reduce the costs of carrying out business. Such costs include the costs of
gathering and managing information on the supply chain and the distribution chain as well as the
costs of enforcing business contracts.
The industrial district must also provide the proper functional setting in that it brings together
various economic agents that specialize in one or more steps in the transformation process and also
share and sub-contract some services in the transformation process. Though the economic agents
are otherwise competitors in business, functional interdependence in the form of horizontal co-
operation such as joint sub-contracting, joint purchasing, or marketing of products must also occur.
Finally, the industrial district must provide the proper institutional setting (Ramamurthy,1998) in
the form of formal and informal rules and norms that constrain the behaviour of the various
economic agents. The institutional environment also consists of other agencies that provide services
to the economic agents such as government, quasi-government, private and non-governmental
agencies.

55
3.9Conclusion
Schumpeterian entrepreneurship is dynamic in that the activities carried out by individual agents
result in symmetry breaking and emergence. This means that an industrial district possesses
different characteristics from those of the individual firms that make up the district. In this chapter,
the Entrepreneurial Industrial District Model has been presented as a way of analysing the
taxonomy of industrial districts composed of small, owner-managed firms operating in spatial
proximity to each other. The model therefore enables one to identify and assess the important
variables that determine this dynamism.
In the next chapter, the study will deal with the methodology used, including a review of the two
traditional methodological approaches to research, namely deductive (qualitative) and inductive
(quantitative)as well as the methods used to gather and analyse the data.

56
Chapter 4
Research Methodology
4.0 Introduction
Research methodology can be defined in two ways. It can be defined as the model or framework
that a researcher employs in a particular research project to illustrate the relationships between
important variables. A more abstract or theoretical view of methodology, however, is that it consists
of the theoretical underpinning or paradigm used by the researcher in a study (Lather, 1998). It
relates to the nature of methodology, to a theoretical and more abstract context, and perceives it in
conjunction with distinctive, unidimensional and mutually exclusive theoretical principles. From
this point of view, methodology is not determined by the research model but rather by the principles
of research entailed in a paradigm. The methodologies or approaches that result from the above
definition are the qualitative and quantitative methodologies or approaches, which are discussed
below.
4.1 Qualitative approach
The study which is under review is a qualitative or case study research. Denzin and Lincoln (1994)
define qualitative research as a multi-method in focus, involving an interpretive, naturalistic
approach to its subject matter. Creswell (1994) defines qualitative research as an inquiry process of
understanding based on distinct methodological traditions of inquiry that explore a social or human
problem. Qualitative research is invariably conducted in the field and for this reason, it is
sometimes referred to as field research (Dooley, 1992; Guba and Lincoln ;1992) say that qualitative
research is sometimes referred to as case study research. This means that qualitative researchers
study things in their natural settings, attempting to make sense of or interpret phenomena in terms
of the meaning people bring to them. Qualitative research involves the studies use and collection of
a variety of empirical materials – case study, personal experience, introductive, life story, interview,
observational, historical, interactional and usual texts that describe routine and problematic
moments and meaning in individual‟s lives.

57
Qualitative methodology is associated with many diverse methods employed in the social sciences.
For some, qualitative methodology is everything that is not quantitative. It is also perceived by
some as a supplement to quantitative research and by others as its opposite or alternative.
4.1.1 Central principles of the qualitative approach
Lathar (2008) says that the main principles of qualitative research are based on and around a
number of fundamental concepts such as communication verstehen, subject and everyday life.
These principles are somewhat diverse, since the philosophical background of qualitative
methodology is diverse. Lammeck summarises the basic principles of this methodology in the
following five points:
Research is communication. Qualitative research is embedded in a process of
communication between researcher and respondent. There is no intention to establish
independence of the researcher from the respondent or the data, researcher and respondents
are working together for a common goal, and the respondents are subjects who define,
explain, interpret and construct reality and as such, they are as important as, if not more
important than the researcher.
The process-nature of the research and the object. Reality according to this form of
research, is created and explained in interaction, in this process, reality is constructed,
managed, explained and presented. The purpose of social research is therefore, to identify
the process of reality construction and the construction of patterns of meanings and actions.
Statements collected through this research are therefore parts of this process of creation,
reproduction and explanation of social reality.
Reflexivity of object and analysis. In qualitative research every symbol or meaning is
considered to be a reflection of the context in which they were developed. A symbol is an
index of an embracing regulated context. The meaning of an object of expression is
understood through a reference to its symbolic or social context. This requires a flexible
method that is ready to react to change and to adjust its instruments according to changing
circumstances and contexts.

58
Explication. Qualitative research is set to explain clearly and accurately how respondents
will be approached. The steps of the research process as well as the rules of its operations
are expected to be made known as far as possible.
Flexibility. Qualitative methods are flexible in many ways, for example with regard to the
choice of research instruments and research procedures. Research is not rigidly set but rather
flexible and can change during its execution. In qualitative research, a design is more likely
to include guidelines than strict rules.
4.1.2. Advantages and disadvantages of the qualitative approach
Qualitative research has both strengths and weaknesses. Both relate to its nature as an approach
concerned with studying people as persons and being interested in their everyday life experiences
and interpretations. Of the summaries presented by many writers (e.g. Miles and Huberman, 2004,
Stergios, 1991 and Vlahos, 2002) the one given below is most comprehensive. Obviously, many of
the weaknesses of this type of research are related to its very nature and reflect the positivistic
prejudice of assessment. We should understand that qualitative research is a unique type of
academic activity and should be assessed in its own context.
Advantages of the qualitative approach
These are:-
Researching people in their natural settings;
Stressing of interpretation and meanings;
Achieving a deeper understanding of the respondent‟s world;
Humanising the research process by raising the interest of the researched;
Allowing higher flexibility; and
Presenting a more realistic view of the world.
Disadvantages of the qualitative approach
These are:-
Problems of reliability caused by extreme subjectivity;
Risk of collecting meaningless and useless information;

59
It is very time consuming;
Problems of representativeness and generalizability of findings;
Problems of objectivity and detachment; and problems of ethics (entering the personal
sphere of subjects).
4.2. Quantitative approach
The quantitative approach is based on the positivist philosophy. For more than a century, its
structure, process and theoretical background offered the basis for the development and practice of
the standards for the methods of the social sciences (Westhizen and Abraham, 2002). These
standards constitute the theoretical principles of the qualitative approach and can be summarised as
follows:-
Reality is objective, simple and consists of sense impressions, there is one reality in nature,
one truth.
Human beings are determined by their social world in the same manner that fixed laws
govern the naturalistic world. They are subject to fixed patterns that are empirically
observable (the theses of normological thinking).
Facts should be kept from values. Social should make value judgments (the thesis of value
neutrality).
Metaphysics, philosophical reasoning and speculation are mere sophistry or illusions, they
cannot offer reliable and verifiable data; and
Explanation is restricted purely to positive phenomena. Melville Goddard and (1996)say
that data can be qualitative or quantitative. Qualitative data have numerical values and can
be discrete or continuous. The ideological bases of this school of thought are quantitavism,
behaviourism and positive epistemology derived from the philosophy (James and Dewey,
2002). This philosophical orientation has been supplemented by modern and highly
sophisticated statistical techniques and computer models and is considered to be the school
of thought with the strongest influence on social research in the modern world. Most of the
research articles published in leading journals employ a positivist approach and use
computer-aided data analysis.

60
4.2.1 Advantages and disadvantages of the quantitative approach
The quantitative approach also has certain advantages and disadvantages, which are listed below:-
Advantages of the qualitative approach
Neopositivism is set to establish a clear and objective orientation, a vigorous, disciplined
and systematic procedure and a reality bound methodology, which allows scientists to arrive
at a theory that will be free from vague and sloppy approaches (Stergio, 1991 and Vlahos,
1984).
The ideological bases of this school of thought are positivism, quantitativism and
behaviourism. This philosophical orientation has been supplemented by modern and highly
sophisticated techniques and computer models and is considered to be the school of thought
with the strongest influence on social research in the modern world.
The majority of research articles published in leading journals employ a positivistic
methodology, including advanced statistical models and the use of computer-aided data
analysis.
Disadvantages of the quantitative approach
The over-emphasis positivists place on quantitative measures is wrong and unjustifiable for
it cannot capture the real meaning of social behaviour. Quantification often results in
meanings that are closer to the beliefs of the researcher than to those of the respondents.
Quantitative research restricts experience in two ways: first by directing research to what is
perceived by the senses and second by employing only standardised tools based on
quantifiable data to test hypotheses.
Quantitative research fails to distinguish between appearance and essence of social events; it
neglects the essence of life, studies appearance and assumes that appearance is reality.
The methodology employs a theoretical perspective and a form of research that supports the
status quo and existing power structures.

61
4.3. Comparison of quantitative and qualitative approaches in application
According to Hardiker and Littlewood (1987), positivists employ tight, preselected and pre-
structured conceptual frameworks, sampling frames, research questions, data collection instruments
and methods, coding and analytical techniques. The positivists claim that quantitative data is
objective and empirical, whereas that data collected through qualitative designs is accused of being
“subjective”, “anecdotal” and impressionistic, thus lacking in any scientific rigour. Those who are
of the humanistic persuasion which favours qualitative designs argue that the research is better
conducted through qualitative designs.
Another reason why qualitative designs may be preferred to quantitative ones is that the latter fail to
achieve the demands of objectivity, which depend on the control of exogenous variables, when
applied to the human sciences. The qualitative designs fall short when research is set in naturalistic
settings, with experimental designs being time-consuming, remote or irrelevant (Herbert, 1993).
Since paradigms are sets of basic beliefs they are not open to proof in any conventional manner and
therefore there is no means to elevate one paradigm over another on the basis of any criteria. Any
given paradigm represents only the most informed and sophisticated view that its proponents have
devised, given the way they have chosen to respond to the ontological, epistemological and
methodological questions in research (Guba and Lincoln, 2006:135).
In fact, Marvasti (2004) notes that the positivist paradigm and the interpretive paradigm have much
in common in that both paradigms are empirically grounded; they both view direct contact with the
social world as a prerequisite for conducting research. As social scientists, constructionists and
positivists base their research on systematic, empirical observations gleaned from the social world.
The two perspectives are similar in that they yield useful information, depending on the task at
hand. The positivist researcher, for example, might come up with findings that support the
relationship between entrepreneurship and financial management skills, thus supporting the
hypothesis that training in financial management enhances entrepreneurship. On the other hand, the
interpretive researcher‟s findings might generate a better understanding of the nature of
entrepreneurship in small firms. Because of this, the two analytical frameworks should be thought
of as points of emphasis rather than diametrically opposed standpoints.

62
The distinction between quantitative and qualitative methods may therefore be unnecessary if one
takes this utilitarian view of the debate. Instead of dwelling on the ontological and philosophical
issues, one should take the more practical approach of using “what works”, rather than what is
“right or wrong”. A utilitarian view allows the researcher to select the approach that may be suitable
for the task at hand.
4.4. Methods
It is not strictly true to say that the positivist paradigm necessarily rests on quantitative research
methods and that the interpretive paradigm, on the other hand, rests on qualitative methods alone. It
is in fact possible to say that research methods rest on a continuum. On this continuum, one can
distinguish between methods in terms of their relative emphasis on induction or deduction, their
degree of structure and the kinds of data they generate (Gill and Johnson, 2005:37). In this regard,
Burrell and Morgan (1979) make a distinction between two extremes on the continuum:
nomothetic and ideographic methods. Nomothetic methods emphasize the importance of basing
research upon systematic protocol and technique, as epitomized in the natural sciences, which focus
on the testing of hypotheses in accordance with the standards of scientific rigour. They take an etic
approach. Ideographic methods, on the other hand, emphasize the analysis of subjective accounts
that one generates by “getting inside” situations and involving oneself in the everyday flow of life.
They take an emic approach.
This assertion is summarized in Figure 4.1 below, wherein it is shown that on one end of the
continuum there are laboratory experiments, which are purely nomothetic and mainly
quantitative, followed by quasi-experiments, which are not fully nomothetic but are more inclined
to being quantitative than qualitative. At the other end of the continuum, there are ethnographic
methods, which can be considered purely ideographic, thus mainly qualitative, followed by action
research, which is not fully ideographic but is more inclined to being qualitative. At the centre of
the continuum there are survey research methods, which can be regarded as both nomothetic and
ideographic, thus combine both quantitative and qualitative analysis.

63
Figure 4.1 The research continuum
The continuum
ETIC EMIC
Laboratory experiments: quasi-experiments: surveys: action research: ethnography
Adapted from: Gill and Johnson(2005:37)
Methods are tools for doing research, and one need not be committed to them anymore than is
necessary to pledge one‟s allegiance to a screwdriver over a hammer. It follows then that if, for
example, we are interested in comparing profitability between small and large firms we should use
numerical data. Alternatively, if the question is how small firms exchange technological
information it might be more practical to gather descriptive data.
4.5. Research design
The study was carried out in two stages. The first stage was a survey of the small-firm furniture
manufacturing industry in Zimbabwe, with particular reference to firms operating in geographical
clusters. The purpose of this survey was to determine the size and significance of the industry and
also to determine if there are any significant differences or similarities between firms operating
from clusters in different provinces. The second part of the study was meant to provide an
understanding of the nature of the clusters and the entrepreneurial activities of the firms located in
these clusters so as to ascertain how they differ from other small firms that do not operate in
clusters. This part of the study used the Glenview cluster in Harare as a case study. The selection of
the Glenview cluster as a case was based on the fact that it is by far the largest of all the small-firm
clusters in Zimbabwe.
4.6. Population
The survey covered the six major cities of Zimbabwe. The sampling frames were based on records
of small firms kept at the Local Authority offices to which the firms pay monthly rentals for their
business premises. There are various other small businesses within each cluster but they were not

64
included in the study as they are not formally registered. Of the firms that are officially recognised
in each cluster, some are not involved in the main business of the cluster, which is furniture making.
The focus of the study was on furniture making firms since this is the dominant activity of the firms
found in most of the clusters in Zimbabwe. These are the firms that constitute the relevant
population of the study for sampling purposes. The other firms that are also located in the clusters
and are involved in various ancillary activities, such as transport and the supply of production
inputs like timber, cotton wool, nails and glues were not sampled. For example, at the Glenview
cluster, of the more than 1 500 firms that are located in the cluster, only 1 300 are involved in the
actual manufacture of furniture, mainly wood and steel furniture and are registered with the local
authority. This is the population that was sampled at that cluster.
To this end, the total population for the study consisted of the 2 144officially recognised furniture
making firms located in the six major cities of Zimbabwe. The details of the population in each
province and city are shown in Table 4.1 on the next page.
Table 4.1: Study population by province, city and cluster
Province City Cluster location Number of firms
Harare
Harare Glenview 1 300
Chitungwiza Zengeza 220
Matebeleland North Bulawayo Western Commonage 190
Mzilikazi 108
Manicaland Mutare Chikanga 77
Sakubva 87
Masvingo Masvingo Mucheke 88
Midlands Gweru Mkoba 74
TOTAL 2 144
4.7. Sample selection
Simple random samples of firms were selected from each of the clusters. In the case of the
Glenview cluster, stratified random samples were used. As noted by Israel (2002), stratified random
sampling is considered to be more statistically efficient than simple random sampling where the

65
population consists of distinct strata. The statistical efficiency of stratification arises from the fact
that each stratum is internally homogeneous, consisting of more or less similar cases, but is
externally heterogeneous with other strata.
The primary variable distinguishing the firms in the Glenview cluster is the type of activity: steel
furniture making or wood furniture making. The firms that are engaged in wood furniture
manufacturing make up about 70 per cent of the total population and the other 30 per cent consists
of those involved in steel furniture making. The sample was therefore proportionally divided into
two strata consisting of wood furniture making firms (70 per cent) and steel furniture making firms
(30 per cent). The firms from these strata were then selected using a simple random sampling
method using the register from the local authority as the sampling frame.
In order to ensure a representative sample of sufficient size, the study considered three criteria: the
precision level (sampling error), the level of confidence and the degree of variability of the firms.
The sample size was determined using Yamane‟s (Yamane, 1967) formula which is the one that is
recommended for stratified random samples (Israel, 2002; Ross, 2002):
n0 = N
1 + N(e)2
…………….….4.1.
n = n0
1 + n0 – 1
N ………………4.2.
Where: e = the sampling error,
N = the population size,
n0 = the first approximation of n, and
n = the minimum required sample size
This method of determining the sample size ensures adequate sample representativeness, especially
for heterogeneous populations such as small firms located in geographical clusters. However, in
order to populate the equations 4.1.and 4.2 above, the researcher must assume the relevant precision

66
level deemed to be appropriate for the study (Kaseke, 2012). In this study, we use a precision level
of 5%, considering that the records kept at the local authorities might not also be very accurate.
Using a 95 per cent confidence level and a precision level of ±5 per cent, the size of the sample
from the Glenview cluster was 248, obtained as shown below:
n0= 1300 = 306
1 + 1 300(0.05)2
n = 306
1 + 306 – 1
1 300
= 248
Thus, from the total population of 1,300 firms at the Glenview cluster, a total of 248 firms were
sampled, of which 174 (70 per cent) were selected from the wood furniture manufacturers and 74
(30 per cent) were selected from the steel furniture manufacturers. The sample sizes for the rest of
the populations were also calculated using the same method. Table 4.2 below shows all the samples
that were used in the study.
Table 4.2: Sample size by cluster location CITY/TOWN Location of cluster Number
of firms
Sample
size
Sample size as a percentage of
the population
Harare Glenview 1 300 248 20%
Chitungwiza Town Zengeza 220 86 39%
Bulawayo Mzilikazi 108 48 44%
Western Commonage 190 77 40%
Mutare Chikanga 77 35 46%
Sakubva 87 39 44%
Masvingo Mucheke 88 41 40%
Gweru Mkoba 74 34 46%
TOTAL 2 144 608 32%

67
4.8 Data collection instruments
The primary data collection instrument for this study was a questionnaire. The questionnaire had
two sections. The first part was designed for the purpose of carrying out the survey of firms located
in clusters in the whole industry in order to find out the following:
The number of clusters of significant size in the whole country,
the number of people employed in the industry,
the levels of income generated by the industry, and
the contribution of the industry to national income and employment.
The second part of the questionnaire was designed to understand the nature of the clusters and the
entrepreneurial activities of the firms located in these clusters so as to ascertain how they differ
from other small firms. This part contained questions to do with the characteristics of the firms,
their owners and employees and the competitive strategies that they use.
The results from the questionnaire were complemented with data collected through in-depth
interviews with selected owners or managers of firms in furniture manufacturing firms as well as
those in ancillary activities such as timber merchants, cotton merchants, subcontractors and
transporters.
Further, the study also relied on data from secondary sources, such as official data from the Central
Statistical Office, City of Harare and government ministries. The purpose of this data was to
establish the institutional framework within which the firms operate.
4.9 Questionnaire administration
A pilot study was carried out through the administration of twenty questionnaires to randomly
selected owner-managers at the Glenview cluster in Harare. The purpose of the pilot study was
two-fold. Firstly, it was used to train ten field workers who assisted in administering the
questionnaire. The result of the test indicated that for maximum response, the questionnaire had to

68
be interviewer-administered rather than self-administered. Secondly it was a means of ensuring the
validity of the questions in the questionnaire and the reliability of the responses to them.
When analysed on SPSS, the responses to the test questionnaire resulted in a Cronbach‟s alpha of
0.721. Cronbach‟s alpha is a measure of the internal consistency of an instrument and a result of
more than 0.70 is deemed to indicate that the level of consistency between the questions is
acceptable. A low alpha is usually associated with an insufficient number of questions or poor
interrelatedness between items in the questions. A high alpha confirms the internal validity and
reliability of an instrument and enables the study to generalise the responses from the questionnaire
to the population of the study with confidence (Tavakol and Dennick, 2011 and Vehkalahti, 2011).
4.10 Dealing with ethical issues
The respondents in this study, being owners of small firms who were relatively low-income earners,
naturally expected some form of material benefit such as financial assistance, or at least some
practical solutions to their problems, to come out of the research process. This study was, however,
largely for academic purposes and therefore could not easily meet such expectations. Building
rapport with the respondents and gaining access to them was therefore dependent on resolving this
dilemma. As explained by Mararike (2011), the only ethical way to resolve the dilemma and gain
access to the respondents is to avoid making any false promises to them and to immediately dispel
any hopes of material gains resulting directly from the study. It was therefore important for the
respondents to appreciate that the information collected by the study might probably help to bring
their activities to a wider audience, such as the general public, relevant arms of government and
potential donors.
Following this advice, access to the respondents was easily gained once it was made clear to them
that though there would be no direct material benefit resulting from their participation in the study,
the study would help in highlighting the significance and contribution of their activities to the
country‟s economy and also report on the challenges that they might be facing. The respondents
were made to agree with the suggestion that the “informality” of their industry needed to be ended
and their activities formally recognised. Thus, the information gathered from the study would
indirectly benefit them when it was made available to a wider audience.

69
4.11 Questionnaire distribution
Details of the questionnaires administered to respondents in the identified clusters in each city are
shown in Table 5.2 below.
Table 4.3.: Questionnaire distribution and response rate per cluster
Location of cluster Number
of firms
Sample
size
Sample size as a
percentage of the
population
Completed
questionnaires
Response
rate
Glenview 1 300 248 20% 198 80%
Zengeza 220 86 39% 81 83%
Mzilikazi 108 48 44% 45 75%
Western Commonage 190 77 40% 69 77%
Chikanga 77 35 46% 30 83%
Sakubva 87 39 44% 32 82%
Mucheke 88 41 40% 39 95%
Mkoba 74 34 46% 28 82%
TOTAL 2 144 608 32% 522 86%
A total of 608questionnaires were distributed to owners or managers of the firms in the identified
clusters and 522 were satisfactorily completed. The questionnaires were interviewer-administered.
The response rate was therefore 86 per cent of the total number of questionnaires. This was a fairly
high response rate, minimising non-response bias, thus the results can safely be generalised to the
total population. The close proximity of firms in the cluster was the main reason for the high
response rate as it was generally easy to motivate the respondents to complete the questionnaires.
4.12 Data analysis
According to Barbie and Manton (2001:490) the analysis of data gathered through qualitative
research depends on the research interest. Firstly, researcher might be interested in the
characteristics of the language used by the respondent. Secondly, the researcher might want to
discover regularities, and finally, the researcher might want to comprehend the meaning of the
language or action of the respondents. The most commonly used method of analysis for qualitative
data is content analysis. Content analysis involves the examination of words in order to make
inferences about the respondent. This method of analysis was however, complemented by statistical

70
analysis using social statistical software packages that enable the drawing of inferences from
sample statistics.
4.13 Conclusion
This study was mainly qualitative and its main purpose was to discover a grounded theory on
entrepreneurship within industrial districts consisting of small-business entrepreneurs. For this
reason, the interest of the research was to discover regularities. The analysis of the data enabled the
researcher to identify (and categorize) elements and to explore their outcomes. According to Strauss
and Corbin (1990), this can be achieved through two main processes, that is coding procedures and
adjunctive procedures. The study used the three coding procedures advocated by Strauss and
Corbin(Ibid),that is open coding, axial coding, and selective coding.
This chapter has outlined the methods that were used in the study and the next chapter will be
concerned with presenting the findings.

71
Chapter 5
Findings
5.0. Introduction
This chapter presents the findings of the fieldwork. The main objective of the study was to
determine the extent of small-firm agglomeration and establish a topology of small-firm
agglomeration in Zimbabwe. The study also had two other related objectives, which were: to
establish the conditions necessary for the development of small-firm agglomerations and the policy
measures required to foster the development of such agglomerations in the Zimbabwean context.
The three questions arising from these objectives are:
What is the extent and diversity of small-firm clustering in Zimbabwe?
To what extent do small-firm clusters contribute to the growth of the economy?
What factors are contingent to the growth of entrepreneurship within small-firm
clusters?
In order to answer these questions, the study commenced with a survey of small-business clusters in
the five major cities of Zimbabwe: Harare; Bulawayo; Gweru; Masvingo and Mutare. The survey
also included Chitungwiza, a satellite town of Harare. During the survey a questionnaire was
administered to randomly selected samples of the owners and managers of small furniture
manufacturing firms operating in identifiable geographical clusters in the aforesaid cities. The
survey of the cities was followed by in-depth interviews with managers and owners of selected
firms at the Glenview cluster in Harare.
The cities that were covered in the survey are shown in the map of Zimbabwe in Figure 5.1 on the
next page.

72
Figure 5.1: Map of Zimbabwe: showing the five major cities
Source:http:maps.google.co.zw/map (3 March, 2012)
Harare is the largest city, being the capital city. The furthest city from Harare is Bulawayo, which is
about 600 kilometres from Harare, followed by Masvingo, which is about 400 kilometres.
5.1Location and size of small-business clusters in Zimbabwe
Eight clusters of small firms specialising in the manufacture of household furniture were identified
in the five major cities as well as in Chitungwiza. All the clusters were located inside or in the
immediate vicinity of low-income suburbs such as Mkoba in Gweru, Sakubva and Chikanga in
Mutare and Mzilikazi and Western Commonage in Bulawayo. For example, 62 per cent of the
people working in the Glenview cluster resided in Glenview and the other 38 per cent came from
the other surrounding low-income suburbs such as Glen Norah, Highfield, Mufakose, Kambuzuma,
Kuwadzana and Budiriro.It was also found that the Glenview cluster also attracted people from
various parts of the city of Harare and its hinterlands such as Norton and Epworth, which are fifty
kilometres and thirty respectively away from Harare.
Table 5.1 on the next page shows the location and size of each cluster in terms of the number of
firms and employees found in each cluster.

73
Table 5.1: Clusters of small furniture making firms in Zimbabwe
CITY/TOWN Location Furniture
firms
Other
firms
Total
firms
Total
employees
Harare Glenview 1300 500 1 800 5 400
Chitungwiza Town Zengeza 220 19 239 717
Bulawayo Mzilikazi 108 11 119 357
Western Commonage 190 32 222 666
Mutare Chikanga 77 36 113 339
Sakubva 87 21 108 324
Masvingo Mucheke 88 21 109 327
Gweru Mkoba 74 10 84 252
TOTAL 2 144 652 2 796 8 382
The total number of firms that were directly involved in manufacturing household furniture was 2
144. There was great variability in the size of the clusters, ranging from 1,300 firms to 74 firms per
cluster. The largest cluster was located in Harare at Glenview with 1 300 firms. The clusters outside
Harare were comparably small, with an average of 142 firms per cluster. There also appeared to be
great similarity in the range and types of products produced in these clusters.
In addition to those firms that were directly involved in the business of the cluster, there were
numerous other firms involved in other downstream and ancillary activities such as the supply of
transport services, timber, cotton and other inputs such as wood glue, nails, varnish, door handles
and keys. More than 500 such firms, forming a third of the total population, were identified at the
Glenview cluster. It was also found that each of the firms in these ancillary activities employed at
least two people and each employee had an average of six dependents including a wife and children
and some members of the extended family.
5.2 The Glenview cluster
The Glenview cluster was selected because of its size and apparent dynamism compared to the
other clusters as well as its unique location. Glenview is a low-income suburb which is about thirty
kilometres south-west of Harare‟s central business district. Within its immediate vicinity, are the
other seven low-income suburbs of Glen Norah, Budiriro, Highfield, Mufakose, Kambuzuma,
Mbare and Kuwadzana. These suburbs are referred to as “high-density” residential areas because of

74
the large population of people living in relatively small geographical locations. According to
records kept at the City of Harare District Housing Office, the total population residing within these
eight suburbs (including Glenview) is about 800 000.
The Glenview cluster itself is located on the outskirts of Glenview suburb and covers a
geographical area of about fifteen hectares. The location of Glenview in relation to Harare‟s central
business district is shown in the map in Figure 5.2 below.
Figure 5.2: Map of Harare, showing the location of Glenview
Source:http:maps.google.co.zw/map (3 March, 2012)
The land on which the cluster is located belongs to the City of Harare and is under the jurisdiction
of the Glenview District Office. The cluster was formed in November 2005 when the Ministry of
Small and Medium-Scale Enterprises received a donation to assist small furniture manufacturing
firms in Glenview who had been displaced by a government-sponsored clean-up operation. The
firms had been operating illegally along Willowvale Road and in other parts of Glenview. The

75
Ministry then constructed 483 factory shells with an average size of twelve square meters each with
no other fittings but connected to water and electricity.
The Ministry then handed the factory shells over to the City of Harare to be administered by the
Glenview District Office. However, the allocation of the shelters to occupants was made by
Ministry officials. The result of this was that many of the resultant owners of the shelters were not
the intended furniture manufacturers themselves. Instead, the furniture manufactures were made to
rent their premises from these landlords. The owners of the factory shells were made to sign lease
agreements with the City of Harare which required them to make monthly payments of $178.00 per
unit. As it turned out, the Glenview District Office did not receive any rent and over the seven-year
period up to March, 2012 that the shelters had been in existence and the arrears in unpaid rent to the
City of Harare from the occupants were well over $7 200 000. The occupants of the shelters,
however, were making monthly rental payments ranging from $30.00 to $80.00 to the landlords
who were allocated the shelters, depending on the size of the land they occupy outside the shelter.
The shelters were too small and ill-designed for the business of furniture manufacturing. The
occupants therefore ended up working from outside, using the shelters as store rooms. As a result,
the land outside the shelters was further subdivided into smaller pieces. The number of small firms
kept growing at an exponential rate as more and more land was being cleared and occupied, albeit
with the tacit “approval” of the city authorities.
The cluster is now in three separate locations: the Main Complex, which is the original site, the
Caledonia Annexe and the Willowvale Annexe. The Main Complex is the largest of the three
locations and covers an area of about twelve hectares. It lies to the south of Willowvale Road, the
trunk road that links Glenview and other suburbs to the central business district of Harare. This part
of the cluster is occupied by sixty per cent of the total population of firms in the cluster.
The Caledonia Annexe is adjacent to the Main Complex on the other side of Willowvale road. It
covers an area of about two hectares and houses thirty per cent of the total population of firms in
the cluster. The Willowvale Annexe is located inside the Willowvale Industrial area and is about
two kilometres from the Main Complex. It covers an area of one hectare and houses about ten per

76
cent of the total number of firms in the cluster. These other two locations are used mainly as
production sites by the firms that have no space in the Main Complex but use the Main Complex as
the display area for their products. The land on which these two sites are located belongs to private
landowners who also constructed shelters for the firms and are charging monthly rentals ranging
between $30.00 and $90.00, depending on the nature of the business. Each shelter is twenty square
metres in size and is occupied by an average of four production units.
Figure 5.3 below is an aerial photograph of the map of Glenview, showing the three locations of the
Glenview cluster in relation to the suburb of Glenview. As can be seen from the map, the Glenview
cluster as a whole is a dense network of firms located in a relatively small geographical area and
operating in very close proximity to one another.
Figure 5.3: The Glenview cluster: Main Complex (A), Caledonia Annexe (B) and Willowvale
Annexe (C)
Source:http:maps.google.co.zw/map (3 March, 2012)
The maximum size of the area occupied by the production unit of each firm is about four square
metres. To compensate for this lack of space, each firm has to rent two spaces within the cluster.
One area is occupied by the firm‟s production unit and the other is used as the sales area. Most
A
C
B

77
spaces in the Caledonia Annexe and the Willowvale Annexe are used mainly for production
purposes and the areas within the Main Complex are used mainly for displaying and selling
products.
5.4. Characteristics of small-firm clusters in Zimbabwe
The study was concerned with initially establishing the characteristics of the clusters. To this end,
the respondents were requested to provide data on the following issues:
The characteristics of the firms;
The characteristics of the owners or managers of the firms; and
The characteristics of the firms‟ employees.
5.4.1 Characteristics of the firms
The study sought to establish the characteristics of the firms located in the cluster by asking the
respondents to state: the age of the firm; the number of years that the firm had been operating
within the cluster; the number of employees and whether the firm was managed by the owner or by
an appointed manager. The respondents were also requested to state whether their firms were
formally registered by way of a Certificate of Incorporation from the Registrar of Companies or
were operating on a licence from the local authority and whether the premises they were using were
being rented from the local authority or from another landlord. Table 5.3 on below contains
selected descriptive data on the characteristics of the firms in the eight clusters.
Table 5.3: Characteristics of the firms
Cluster
location
Age
of
firm
Number of
years
operating in
the cluster
Number of
employees
Managed by
appointed
manager
Premises
rented from
local
authority
Premises
rented
from land
lord
Glenview 14 7 6 15% 75% 25%
Zengeza 15 11 4 2% 86% 14%
Chikanga 13 9 3 0% 100% 27%
Sakubva 15 11 3 0% 87% 13%
Mucheke 15 10 3 0% 100% 0%
Mkoba 14 13 3 0% 97% 3%
Western
Commonage
11 9 4 0% 100% 0%
Mzilikazi 16 15 3 0% 88% 12%
TOTAL 14 11 4 1% 92% 8%

78
The respondents said that most of the firms had been in existence for a long period, with the
average age of the firms being reported to be 14 years. All the respondents reported that they were
operating elsewhere before they re-located to the cluster. The most-recently formed cluster was the
Glenview cluster in Harare which was said to be seven years old, whereas others such as the
Mzilikazi cluster in Bulawayo had been in existence for more than 15 years. Those firms that had a
longer life history were operating from other locations before they came to the cluster, due to the
perceived advantages of being in the cluster.
All the respondents stated that their firms were managed by their owners, except for a few in the
Glenview cluster (15 per cent) which had an appointed manager. The majority of the owner-
managers of the firms (96 per cent) were found to be male. However, most of the female owners of
the firms were reported to be in ancillary activities, such as tailoring and the supply of inputs such
as glue, nails and varnish. It was reported that 56 per cent of all tailoring firms were female-owned.
It was reported that on average, each firm employed four people, including the owner-manager. The
largest firms were located in the Glenview cluster, with an average of six employees per firm.
All the respondents stated that their firms did not have Certificates of Incorporation but were
operating as „sole traders‟, mostly as family-owned businesses operating on a licence from the local
authority. Some of them operated „illegally‟ albeit with the tacit approval of the local authorities.
Most firms rented their work places from landlords other than the local authority. In the Glenview
cluster, for example, only 23 per cent of the firms were formally licensed with the local authority
and were paying rentals directly to the District Housing Office. The others were leasing their
premises from other landlords.
The respondents were also requested to provide further information with regards to the management
structure of their firms. It was reported that the owner-manager was responsible for all management
functions, including production, purchasing, sales and human resources management and training of
apprentices.
The majority of the respondents (72 per cent) however stated that their firms also had an appointed
qualified and experienced sales or marketing officer who reported directly to the owner-manager.

79
The respondents indicated that the appointment of sales or marketing officers had been necessitated
by two factors. Firstly it was purely a logistical matter in the sense that the production unit of the
firm was usually situated in a different part of the cluster from the sales unit. This was found to be
the case in the Glenview cluster in which certain areas such as the Caledonia Annexe were reserved
for production activities and most areas in the Main Complex were devoted to the display and sale
of finished products.
This phenomenon was also observed in the smaller clusters. For example, the production units of
the firms at the Chitungwiza cluster (“PaGomba”) near Harare were located at Makoni Shopping
Centre, which was five kilometres away. Also in Mutare, the firms had located their production
units within the show grounds near Chikanga suburb but some of the sales units were at Sakubva,
which was closer to the central business district, ten kilometres away.
The other major reason for the appointment of sales people was the competitive nature of the
industry as a result of the high density of firms located in a relatively small geographical area.
The respondents described the structure of their firm as consisting of the owner-manager and the
production unit consisting of several artisans as well as the sales unit consisting of one or two sales
officers. The sales officers reported directly to the owner-manager. The owner-manager also
directly supervised all production management functions carried out by the artisans.
Figure 5.4 below is an illustration of the typical structure of a small firm located in a cluster.
Figure 5.4: The typical structure of a small firm located in a cluster
PRODUCTION UNITS
OWNER-MANAGER
SALES UNIT

80
5.4.2 Characteristics of the owner-managers
The respondents were also asked to describe the characteristics of the owners or mangers of the
firms, such as their age, level of education, monthly income, experience and formal training. Their
responses are summarised in Table 5.4 below.
Table 5.4: Characteristics of owner-managers
Cluster
location
Age Education :
“O” Level
and above
Monthly
income
Dependents Previous
outside
experience
Previous
inside
experience
Formal
training
Glenview 46 43% $650 7 15 3 15%
Zengeza 45 38% $420 6 13 2 5%
Chikanga 43 13% $195 8 16 2 8%
Sakubva 37 17% $205 5 15 3 11%
Mucheke 42 18% $195 6 12 2 2%
Mkoba 38 16% $200 7 11 4 12%
Western
Commonage
36 19% $400 6 14 3 6%
Mzilikazi 44 18% $300 8 17 2 8%
TOTAL 41 23% $320 7 14 3 8%
The average age of the owner-managers was reported to be forty-one years and only twenty-three
per cent of the owner-managers reported that they had “Ordinary level” education. The highest level
of education was reported in Harare but there was no great variability within the clusters outside
Harare. Only eight per cent of the respondents also reported that they had any formal training in
carpentry from the various training institutions in Zimbabwe. The rest of the respondents reported
that they had received informal apprenticeship training either as former employees of large
established furniture making companies from which they were retrenched or resigned before
starting their own firms, or within the environment of the cluster.
Previous employment experience outside the cluster was reported to be fourteen years on average.
Sixty-two per cent of the owner-managers also reported that they had had previous experience as
employees of other firms within the cluster before starting their own entities. Previous employment
experience within the cluster by such owner-managers was reported to be three years on average.

81
Thus, there was a high level of practical experience in the industry as well as informal
apprenticeship training.
The average monthly income for each owner-manager was reported to be $320. This implied that
the total annual income of the owner-managers of all the 2 144 furniture making firms identified in
the industry was more than $8 232 900. The owner-managers also reported that they had an average
of seven dependents, including members of the extended family, bringing the total number of
dependents to more than 15 000 people.
5.4.3 Characteristics of the employees
The respondents were also asked to describe the characteristics of the employees in their firms, such
as their ages, level of formal education, level of training in the carpentry trade, monthly income,
number of dependents and their previous employment experience, both inside and outside the
cluster.
The responses to these issues are summarised in Table 5.5 on the next page.
Table 5.5: Characteristics of employees
Cluster
location
Age Education
: “O”
Level and
above
Monthly
income
Dependents Previous
experience
outside the
cluster
Previous
experience
inside the
cluster
Formal
training
Glenview 33 82% $350 5 1 3 8%
Zengeza 28 81% $120 3 2 2 4%
Chikanga 24 83% $100 5 1 2 8%
Sakubva 28 77% $100 4 1 2 6%
Mucheke 32 88% $120 3 2 2 9%
Mkoba 28 81% $200 3 1 3 7%
Western
Commonage
31 89% $150 6 1 3 6%
Mzilikazi 27 88% $250 4 2 2 4%
TOTAL 28 84% $170 4 1 2 7%

82
The average age of the employees was reported to be twenty-eight years and the majority of them
(84 per cent) were reported to have “Ordinary level” education. There was no noticeable variability
in the level of education among employees from different clusters. Most of the employees in the
industry did not have any formal training in carpentry. It was reported that only seven per cent of
the employees had some form of formal training in carpentry. The majority of them were reported
to have received informal apprenticeship training within the environment of the cluster.
It was also reported that eighty-three per cent of the employees had had an average of two years
employment experience with other firms within the cluster. Most of the employees did not also
have any previous employment experience with other firms outside the cluster.
The average monthly income for each employee was reported to be $170. With each firm
employing an average of four employees, it could be deduced that the total annual income of the
employees in the 2 144 furniture manufacturing firms identified in the industry was more than $22
032 000. The employees reported that they had an average of four dependents, including members
of the extended family, bringing the total number of dependents to more than 43 200 people.
5.5 The functioning of the cluster
After having established the characteristics of the firms in the cluster the study also sought to
determine the way in which the cluster functioned. To this end, the respondents were requested to
report on the following policy matters with respect to their firms:
Human resources management;
Production operations management;
Sales and marketing management; and
Financial management
The responses to these issues are described below.

83
5.5.1 Human resources management
In order to characterise the functioning of the cluster from a human resources perspective the study
sought to establish the human resources management policies of the firms located in the cluster. In
order to achieve this, the respondents were requested to report on the recruitment, training and
remuneration practices of their firms and the following were the answers provided.
With respect to the recruitment policies of the firms, the respondents indicated that the firms had
two types of employees. The first type was that of the „permanent‟ employees, some of whom were
still under apprenticeship training and others had completed their training programmes. The second
type of employees were said to be the artisans who did not have any permanent relationships with
any particular production entity, but roamed within the cluster offering their services to all the
entities in the cluster. These formed a distinct pool of skilled labour, with the technological
capabilities and skills to make all product types and categories within the cluster.
The respondents stated that the recruitment policies of their firms were based on strong social ties,
such as family, friendship, religion, or rural family backgrounds. Only employees sharing the same
social ties were employed in the firm. The strongest social ties were of a religious nature, with more
than 55 per cent of the respondents in steel furniture firms and 59 per cent in wood furniture firms
indicating that their employees attended the same church. The social ties between employees in
firms were reported to be equally strong in steel as well as furniture making firms.
Table 5.6 below contains a summary of the distribution of social ties among firms in the Glenview
cluster.
Table 5.6: Strength of social ties within firms
Type of social ties Steel furniture (%) Wood furniture (%)
Religion 55 59
Family 28 33
Friendship 14 12
Rural background 11 5
Other 2 1
Total 100% 100%

84
These strong social ties were also reported across firms, with 30 per cent and 8 per cent of the
respondents reporting that they had the same religious affiliation and the same rural back ground
respectively with respondents from other firms. They reported that the existence of strong social
ties across firms further reduced the conflict levels between firms in the cluster, even though the
business environment of the cluster was very competitive.
With respect to the training policies of their firms, most of the respondents (76 per cent) stated that
it was only the owner-manager who had been trained outside the firm, either as a former employee
of another firm or as a college graduate. Most of the other employees received in-house
apprenticeship training from the owner-manager or a designated senior employee who acted as a
mentor.
The apprenticeship training was reported to be highly structured, with a new recruit being taken
through all the transformation processes of the products made by the firm, through the close
guidance of the owner-manager or mentor. For example, the training programme for cabinet makers
was reported to take a minimum of two years to complete and that for sofa-set and base-bed makers
about twelve months, depending on the aptitude of the trainee.
The apprenticeship training had two critical aspects to it and these were: quality of the finished
product and cost-minimisation. Because of the intense competition for customers within the cluster,
these two aspects had a bearing on the competitiveness of the firm‟s products on the market. The
quality of the finished product was assured through the workmanship of the artisan, especially,
smoothing, polishing and varnishing, in the case of cabinet makers. Costs were kept at a minimum
by minimising the wastage of inputs. For example, there were particular methods of cutting timber
so that there would be no pieces left unused, or even the securing of hinges to the doors had to be
practised so that none would be wasted.
It was stated that there were no strict bonding requirements since an apprentice, once qualified, was
free to branch off on his own or to remain within the firm. Thus, most firms in the cluster (61 per
cent) were owned by former employees of other firms within the cluster. This implied that social

85
ties were not only strong within the firm itself but also between „competing‟ firms due to the nature
of skills training and sharing of labour within the cluster.
When requested to describe the remuneration policies of their firms, the respondents said that the
employees were not paid a fixed salary but a commission-based remuneration.
The commission for sales staff was based on each item sold and the sales person received an
average of ten per cent of the sales value of the item sold. The sales person was given a range of
prices (maximum and minimum) within which the item could be sold. It was up to the sales person
to achieve the highest sales volume on the highest sales price so as to maximise his or her
commission. This policy was meant to ensure that the sales persons would polish up their sales
pitch in the highly competitive environment of the cluster.
It was also reported that the commission for artisans in the production unit was calculated using two
alternative methods, depending on the level of business at that time. During slack business times
when the demand was low or there was a shortage of inputs, the artisans would be required to
produce whole units, for example, the whole set of six sofas. In such cases the artisan would be paid
a commission of about ten per cent of the value of the whole set when sold. During that time, some
artisans even became independent commission workers who could hire out their labour to other
„competing firms‟. At other times, for example when the firm received a large order with a short
lead time, or when demand was generally high (for example during the tobacco selling season,
when tobacco farmers brought their tobacco to the auction floors), the artisans reverted to full-time
employment, receiving a „salary‟ based on the number of items sold by the firm as a whole. In this
case, they would all share equally the proceeds of the sale.
5.5.2 Production operations management
The study also sought to characterise the functioning of the cluster by requesting the respondents to
provide information on the way in which their firms managed production operations.
It was reported that production operations management within the cluster was anchored on
specialisation and division of labour in that each firm concentrated in the production of one or more

86
products made in the cluster and each artisan also concentrated in a particular routine within the
transformation processes of the products made by the firm.
5.5.2.1. Specialisation in production operations management
It was reported that production operations within the cluster were managed in a cascading spiral of
specialisation. This meant that the cluster was subdivided into sub-clusters and sub-sub-clusters of
firms, resulting in three levels as illustrated in Figure 5.5 below.
Figure 5.5: Levels of specialisation in the cluster
CLUSTER
SUB-CLUSTERS
SUB-SUB-CLUSTERS
In describing specialisation at the cluster level, all the respondents indicated that their firms
produced only household furniture. They did not produce any other type of furniture. This implied
that the cluster as a whole specialised in the production and sale of household furniture only. This
unique characteristic of the cluster was reported in all the eight clusters in Zimbabwe. In a few
other cases, such as at the Mucheke cluster in Masvingo a few respondents indicated that they also
produced other items such as coffins but this was not found in any other cluster.
The respondents who said that their firms produced wood furniture reported that they did not also
produce steel furniture and the respondents who said that their firms produced steel furniture
reported that they did not also produce any wood furniture. All the respondents stated that they did
not have the technological capabilities to produce both types of furniture. Thus there were two
distinct sub-clusters of firms within the cluster: firms producing wood furniture and firms
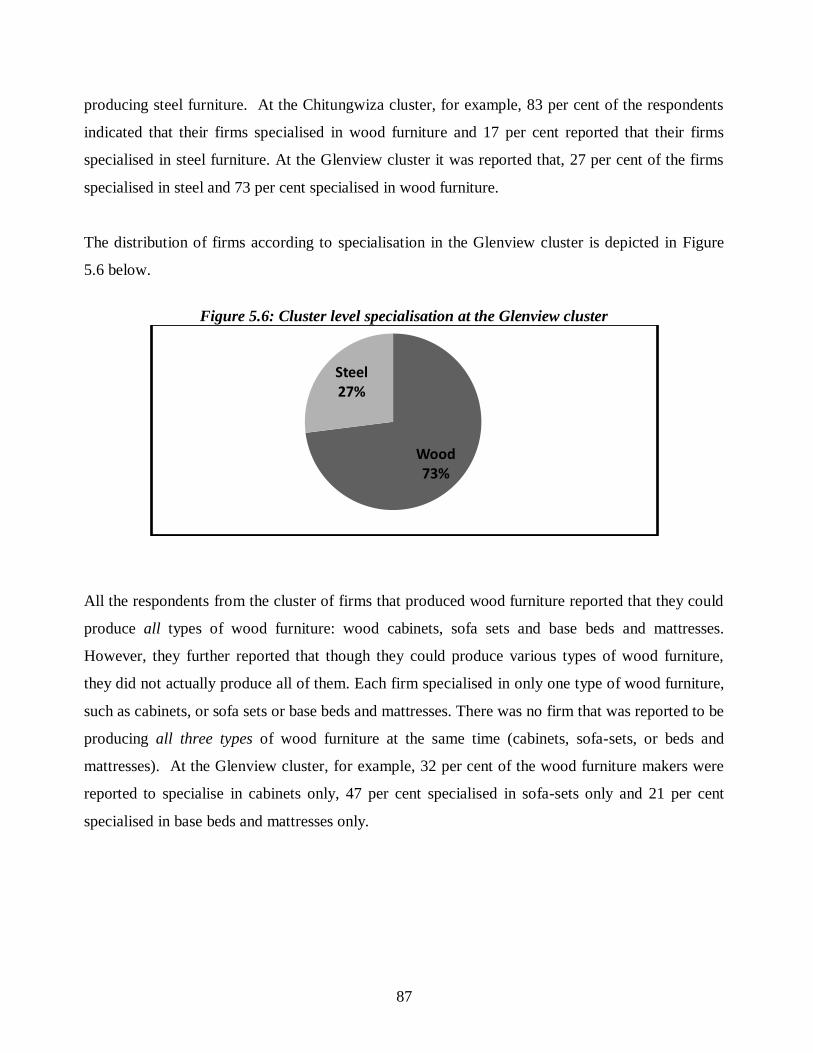
87
producing steel furniture. At the Chitungwiza cluster, for example, 83 per cent of the respondents
indicated that their firms specialised in wood furniture and 17 per cent reported that their firms
specialised in steel furniture. At the Glenview cluster it was reported that, 27 per cent of the firms
specialised in steel and 73 per cent specialised in wood furniture.
The distribution of firms according to specialisation in the Glenview cluster is depicted in Figure
5.6 below.
Figure 5.6: Cluster level specialisation at the Glenview cluster
All the respondents from the cluster of firms that produced wood furniture reported that they could
produce all types of wood furniture: wood cabinets, sofa sets and base beds and mattresses.
However, they further reported that though they could produce various types of wood furniture,
they did not actually produce all of them. Each firm specialised in only one type of wood furniture,
such as cabinets, or sofa sets or base beds and mattresses. There was no firm that was reported to be
producing all three types of wood furniture at the same time (cabinets, sofa-sets, or beds and
mattresses). At the Glenview cluster, for example, 32 per cent of the wood furniture makers were
reported to specialise in cabinets only, 47 per cent specialised in sofa-sets only and 21 per cent
specialised in base beds and mattresses only.
Wood73%
Steel27%

88
The distribution of firms according to these sub-clusters at the Glenview cluster is shown in Figure
5.7 below.
Figure 5.7: Sub-cluster specialisation at the Glenview cluster: wood furniture makers
The respondents stated that there was further specialisation even within the sub-cluster of firms
specialising in wood furniture cabinets, resulting in a sub-sub-cluster of such firms. Three distinct
sub-sub-clusters were reported within this sub-cluster: firms specialising in wardrobes; firms
specialising in kitchen units and firms specialising in room dividers.
The respondents from the firms that specialised in cabinet making reported that they could
manufacture all types of cabinet furniture, such as room dividers, wardrobes and kitchen units.
They however stated that though they had the technological capabilities to make these products,
they only specialised in one type of cabinet furniture. The majority of the firms (62 per cent) were
reported to specialise in room dividers. The other 28 per cent specialised in wardrobes and the
balance of 10 per cent specialised in kitchen units.
The distribution of firms according to the sub-sub-clusters of cabinet-making firms is shown in
Figure 5.8 below.
Cabinets32%
Sofa-sets47%
Base beds21%

89
Figure 5.8: Sub-sub-cluster specialisation at the Glenview cluster: cabinet makers
Sub-sub-clusters of firms were also reported in the sub-cluster of firms specialising in sofa-sets:
firms specialising in low-value sofa-sets and firms specialising in high-value sofa-sets. Though the
respondents from these firms stated that their firms had the technological capabilities to produce all
types of sofa-sets, they specialised in only one type. Some respondents stated that they only
specialised in low-value sofa-sets, whereas others reported that they only specialised in high-value
sofa-sets. In the Glenview cluster, the majority of the respondents (90 per cent) stated that their
firms specialised in the production and sale of low-value sofa-sets only and the rest (10 per cent)
stated that their firms specialised in the production and sale of high-value sofa-sets only.
The distribution of firms according to the sub-sub-clusters of sofa-set making firms is depicted in
Figure 5.9 below.
Figure 5.9: Sub-sub-cluster specialisation at the Glenview cluster: sofa-set makers
Room dividers
62%
Ward robes28%
Kitchen units10%
Low-value90%
High-value10%

90
The phenomenon of sub-sub-clusters was only reported at the Glenview cluster and not at any other
clusters. Moreover, this final level of specialisation was only reported within the wood furniture
sub-cluster and not in the steel furniture sub-cluster in that in the steel furniture sub-cluster there
were no further sub-clusters.
5.5.2.2 Division of labour in production operations management
The respondents were also requested to provide information on the routines that went into the
transformation of a product from the raw material stage to the finished product stage and the way in
which labour was organised within the firm as a production unit.
It was reported that each product had a standard transformation process with standard routines and
that each artisan specialised in a particular routine in the transformation process and passed on the
item to another artisan who performed the next routine until all the routines in the process had been
completed. It was reported that each artisan within the production unit was multi-skilled and was
capable of performing most of the routines in a particular transformation process for all the
products manufactured by the firm when required to do so. Each artisan, however, specialized in
only one or two routines on each process for each product.
Table 5.7 below is an example of the reported routines in the transformation process for two
products: a set of six sofas and a kitchen unit consisting of steel chairs and a table.
Table 5.7: Routines in the transformation process for two products
Set of six sofas Set of six steel chairs and a table
1. Construction of the wooden frame 1. Bending and framing steel tubes
2. Cutting and designing of covers 2. Welding pieces into frames
3. Tailoring 3. Cutting and shaping boards
4. Cutting and shaping of wings and panels 4. Painting the frames
5. Staffing and covering the frame 5. Upholstering and tailoring
It was reported that the transformation process with the five routines shown in Table 5.7 above was
normally shared among three or more artisans within the firm. In the transformation process for a
sofa set in Table 5.7 above for example, some artisans would specialise in making the frames,
whilst others would specialize in cutting, designing the fabric and staffing the frame. However, it

91
was reported that each artisan could perform all the routines when required to do so. It was also
reported that this production method would however be used only when a large order had been
received and when lead times for the delivery of a product were short. In slack periods such as
when there was low demand for the product or when there was a shortage of inputs, the artisans
would revert to performing all the routines in the transformation process.
Within the Glenview cluster, division of labour was also reported in the cluster of firms specialising
in steel furniture making. Three distinct groups of artisans were reported in this cluster. It was
reported that some artisans specialised in bending the steel tubing into chair and table frames
according to the style and design whilst a second group specialised in welding the pieces together
and a third group specialised in painting and upholstering the finished product.
A unique feature distinguishing the steel furniture making firms from the wood furniture making
firms was that, whereas in the wood furniture firms all the routines were reported to be performed
by the artisans within the firm, this was not the case in the steel furniture firms. The respondents
from the steel furniture firms stated that the firm itself did not perform any of the different routines
in the transformation processes of their products. Instead, the firm would hire the labour for each
routine when required. Thus, there was a pool of artisans which was always available to carry out
all the routines that might be required by the firms in the sub-cluster.
Division of labour at the artisan level was however reported only at the Glenview cluster and not at
any other cluster.
5.5.3 Sales and marketing management
The study also sought to characterise the functioning of the cluster by establishing the manner in
which the firms managed their sales and marketing functions. The respondents were asked to
describe the following issues relating to their sales and marketing policies:
The market for their products (the location of their customers);
The marketing communication strategies used by their firms; and
The product range.

92
In describing the market for their products it was stated that most of the customers (52 per cent)
were coming from areas in the city in which the cluster was located and others (47 per cent) from
outside. Only about one per cent of the customers were said to be from outside the country.
The location of the customers of the firms at the Glenview cluster within the Harare area, showing
the names of the residential area (underlined), is shown in the map in Figure 5.10.
Figure 5.10: Map of Harare, showing location of the customers of firms at the Glenview cluster
Source:http:maps.google.co.zw/map (3 March, 2012)
At the Glenview cluster, most of the customers were reported to come from areas that were a
walking distance from the location of the cluster, such as Glenview itself, Glen Norah, Budiriro,
Highfield, Mbare, Kambuzuma, Mufakose and Kuwadzana. These areas were located within a ten
kilometer radius of the cluster location. It was reported that the cost of transporting goods to any
destination from the Glenview cluster could range from $10,00 to $20,00 per trip. It was, however,

93
also reported that the market was not limited to the immediate locality of the cluster but also spread
to other low-income suburbs in the city, far from the cluster itself. Other customers were also
reported to come from as far away as Epworth, Hatfield, Ruwa, Mabvuku, Tafara and Mount
Hampden, more than fifty kilometres from the cluster. Some customers were also reported to come
from cities and towns outside Harare, such as Marondera, Rusape, Kwekwe, Kadoma, Bindura and
Norton. The customers from outside Harare were reported to be those who were buying the
furniture for resale in other towns.
When asked whether they sold any of their furniture through the large retail outlets in the central
business district the respondents stated that they did not do so. One of the reasons given for this
was that the sales were very slow due to the fact that the large furniture retailers tended to place
high mark-up percentages on their products, thereby increasing the selling prices of the products.
The other problem encountered was that the firms did not receive payment for their products until
they had been bought and paid for. Since the large furniture retailers sold their furniture on hire
purchase by allowing their customers to pay over long periods of up to twenty-four months the
firms in the cluster were reluctant to sell their products through these outlets as the long payment
periods would negatively affect their cash flows.
The respondents were asked to explain if they had any marketing communication strategies or
programs such as advertising or promotion. All the respondents stated that they did not have any
such strategies in place except for some photographs of products or business cards which they
occasionally gave to customers on request.
In describing the range of products produced by the firms, the respondents stated that though the
cluster was dedicated to the production and sale of wood and steel household furniture, the product
range consisted of three broad product categories of furniture: cabinets, sofa-sets and beds. Within
each category many product types were also reported. For example, within the sofa-set product
category, it was reported that there were four sofa-set types which were branded according to their
style and design. The brand names of these products were stated as: Madeira; Culture; Hamilcourt
and Saint James. It was reported that the culture and the Madeira were of higher value than the
Hamilcourt and the Saint James. Within the cabinet product category, wardrobes, room dividers and

94
kitchen units of varying designs and sizes were also reported. Twenty different types of products
were reported.
Table 5.8 below contains the full range of products, including the retail price, the wholesale price,
the input cost of manufacturing each product as well as the mark-up percentage on cost as reported
by the respondents in the Glenview cluster.
Table 5.8: Range of products found in the cluster, their selling prices, input costs and mark-up
Product Input cost
($)
Retail price ($) Mark-up on
cost
Wholesale price
($)
Culture sofa-set $650,00 $1000,00 54% $920,00
Madeira sofa-set $420,00 $650,00 55% $570,00
Hamilcourt sofa-set $250,00 $320,00 28% $290,00
St. James sofa-set $230,00 $280,00 22% $260,00
Wardrobe, 4-door $320,00 $400,00 25% $380,00
Wardrobe, 3-door $280,00 $350,00 25% $310,00
Wardrobe, 2-door $160,00 $200,00 25% $190,00
Room divider, 4-piece $370,00 $450,00 22% $400,00
Room divider, 3-piece $260,00 $320,00 23% $300,00
Room divider, 2-piece $150,00 $180,00 20% $175,00
Steel kitchen set, 8-piece $190,00 $240,00 26% $210,00
Steel kitchen set, 5-piece $110,00 $140,00 27% $130,00
Kitchen unit, 1-piece $140,00 $175,00 25% $160,00
Kitchen unit, 2-piece $230,00 $270,00 17% $250,00
Kitchen unit, 3-piece $280,00 $340,00 21% $310,00
Bed, single, spring $60,00 $75,00 25% $70,00
Bed, single, foam $120,00 $160,00 33% $140,00
Bed, ¾, spring $100,00 $120,00 20% $110,00
Bed, ¾, foam $190,00 $240,00 26% $220,00
Coffee table $110,00 $140,00 27% $130,00
5. 5.4 Financial management
The functioning of the cluster was further characterised by the way in which the firms in the cluster
managed their financial affairs. The study found that the main financial management policies of the
firms encompassed the following issues:
Sources of funds,
Employment of funds,

95
The structure of the balance sheet,
Revenue generation,
Management of production costs,
Management of operating expenses, and
The structure of the income statement.
5.5.4.1 Sources of funds
The respondents were requested to provide information with regards to the sources of the funds
used in their businesses with specific reference to funds that had been provided by the owners
(equity) and funds that had been borrowed (liabilities).
On the amount of equity contributed by the owners into the business, it was reported that the
average start-up capital introduced by the owner was $1 200. It was also reported that the firms
usually ploughed back at least ten per cent of their net monthly earnings into the business after
meeting all operating expenses, including salaries and commissions, for the purpose of financing
their inventory requirements. The monthly net operating earnings per firm were reported to be
$600 on average, of which $60 (ten per cent) would be ploughed back into the business, implying
that the total annual profit ploughed back into the business was about $720 per firm.
The average age of the firms in the Glenview cluster was reported to be about seven years, implying
that the total profits that had been ploughed back since starting up the firms would be about $5 000
for the average firm. The total equity of the owners of the firms, consisting of start-up capital ($1
200) plus profits ploughed back into the business over the years ($5 000) was therefore about $6
200 per firm on average.
The respondents were also requested to provide information on the funds that their firms had
borrowed (liabilities) either on a long-term or short-term basis from banks and other financial
institutions as well as any credit facilities provided by suppliers of raw materials and production
inputs.

96
All the respondents stated that their firms did not have any long-term or short-term loans. They also
stated that their firms purchased all their raw materials and other production inputs from the
merchants located within the cluster on a cash basis and were not provided with any credit facilities.
The above responses implied that the firms did not have any liabilities on their balance sheets. The
total amount of funds employed in each firm was $6 200, consisting only of the equity provided by
the owners on the start-up of the business and the profits that were being ploughed back into the
business.
5.5.4.2 Employment of funds
The respondents were also requested to provide information regarding the total amount of funds
that their firms had invested in the assets of their businesses.
In order to establish the value of non-current assets held by each firm, the respondents were
requested to provide a list of the equipment and machinery that they considered “essential” to the
firms‟ operations, the values of each of these items and the amounts that they had invested in them.
The respondents then provided the list contained in Table 5.9.
Table 5.9: List of machines required for essential production routines
Item Value of machine ($)
Lathe machine 3 500
Spindle molder 3 000
Thickness (surface) plane 4 000
Circular saw 1 000
Rip saw 1 000
Industrial sewing machine 300
Euro-bending machine 1500
Welding machine 150
Though they considered these assets to be essential for the operations of their businesses, the
respondents stated that their firms did not have any significant investments in such assets. They
stated that their firms did not have to buy these assets in order to carry out most of the routines in
their production processes. Instead, they simply bought the output of such routines from other firms
within the cluster that specialised in those routines, or paid for the machine-time required to

97
perform the routines. The respondents, however, reported that their firms did have a small
investment in small hand tools and equipment for the purposes of carrying out minor routines such
as putting finishing touches to their products.
The list of such tools and their values is contained in Table 5.10 below.
Table 5.10: Hand tools and equipment used in minor production routines
Type of tool/equipment Average years in use Replacement value ($)
Claw hammer 3 10.00
Router 5 20.00
Hand saw 3 10.00
Brace 2 35.00
Staple gun 1 10.00
Jake plane 6 15.00
TOTAL 3 100.00
The respondents stated that their firms had invested in at least two of each of the items listed in
Table 5.10 above. These responses implied that the total value of non-current assets held by each
firm, on average, was only about $200, consisting mainly of small hand-held tools and equipment.
The respondents were also requested to provide information on the value of the current assets
(stock, debtors and cash) held by their firms.
In order to establish the value of stock, the respondents were requested to provide information
related to the values of raw materials, work-in-progress (W-I-P) and finished goods held by their
firms. All the respondents reported that they did not keep any significant stocks of raw materials.
However with regards to finished goods, it was reported that most firms kept an average of four
items of a particular product which were on display at the sales area. For example, the firms that
reported that they specialised in sofa sets also said that they normally kept between four and five
sets of each design type and an item was only replaced when sold. The highest stock levels of
finished goods were reported in those firms that specialised in sofa sets because sofa sets were
always sold in sets of six. The second highest level of stock was reported in the wood cabinet
cluster because it was said that these items required higher-quality timber compared to other wood

98
products. On work-in-progress, however, it was reported that (at most) only one item was always
on the production line.
Table 5.11 below contains details of the average value of inventory held by each firm as indicated
by the respondents.
Table 5.11: Average stock levels per firm
Firm cluster Raw materials ($) W-I-P ($) Finished goods ($) Total ($)
Wood cabinet makers - 1 000 4 000 5 000
Sofa-set makers - 1 000 5 500 6 500
Base-bed makers - 800 2 200 3 000
Kitchen unit makers (wood) - 1 000 3 500 4 500
Kitchen unit makers (steel) - 800 1 200 2 000
Average - 920 3 280 4 200
These responses implied that the average value of stock held by each firm was $4 200, consisting
mainly of finished goods and a small amount of work-in-progress (W-I-P).
In order to establish the value of debtors carried by each firms the respondents were requested to
provide the following information related to credit sales: credit terms; selection policies and
collection policies.
With regards to credit selection policies, the respondents stated that their firms did not use any
formal procedures to screen and select credit customers, such as proof of residence, proof of ability
to pay, or the provision of collateral security. It was stated that credit customers were screened and
selected on the basis of informal interviews only.
Credit collection policies were also reported to be informal in that a credit sale was concluded with
the issue of an invoice, with no formal contract or agreement of sale being signed by both parties.
The respondents stated that their firms did not make any further contact with the customer after the
conclusion of a sale as in most cases, the customers always paid as agreed, or they would re-
negotiate extended credit periods if necessary.
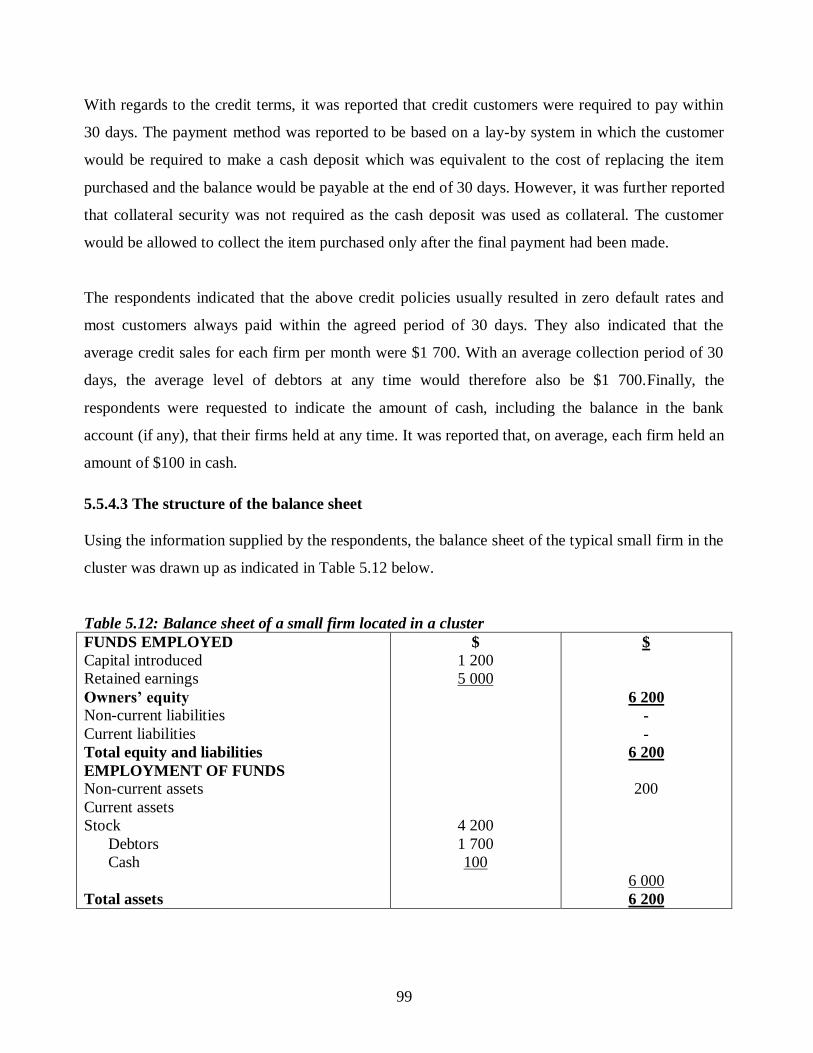
99
With regards to the credit terms, it was reported that credit customers were required to pay within
30 days. The payment method was reported to be based on a lay-by system in which the customer
would be required to make a cash deposit which was equivalent to the cost of replacing the item
purchased and the balance would be payable at the end of 30 days. However, it was further reported
that collateral security was not required as the cash deposit was used as collateral. The customer
would be allowed to collect the item purchased only after the final payment had been made.
The respondents indicated that the above credit policies usually resulted in zero default rates and
most customers always paid within the agreed period of 30 days. They also indicated that the
average credit sales for each firm per month were $1 700. With an average collection period of 30
days, the average level of debtors at any time would therefore also be $1 700.Finally, the
respondents were requested to indicate the amount of cash, including the balance in the bank
account (if any), that their firms held at any time. It was reported that, on average, each firm held an
amount of $100 in cash.
5.5.4.3 The structure of the balance sheet
Using the information supplied by the respondents, the balance sheet of the typical small firm in the
cluster was drawn up as indicated in Table 5.12 below.
Table 5.12: Balance sheet of a small firm located in a cluster
FUNDS EMPLOYED
Capital introduced
Retained earnings
Owners’ equity
Non-current liabilities
Current liabilities
Total equity and liabilities
EMPLOYMENT OF FUNDS
Non-current assets
Current assets
Stock
Debtors
Cash
Total assets
$
1 200
5 000
4 200
1 700
100
$
6 200
-
-
6 200
200
6 000
6 200

100
5.5.4.4 Revenue generation
The respondents were requested to provide information regarding the sources and amounts of
revenue that their firms generated per month. It was reported that the average monthly sales per
firm were $4 250, of which $2 550 were for cash and the rest were on credit.
The respondents indicated that there were two types of customers: wholesale customers who made
bulk purchases and retail customers who bought single items at a time. The wholesale customers
were said to contribute 60 per cent of the total revenue while the retail customers contributed the
other 40 per cent. Some wholesale customers were reported to come from other towns and cities far
from the location of the cluster.
The amount of revenue generated per month was reported to differ from firm to firm, depending on
the sub-cluster in which the firm belonged. The average total revenue generated by each firm per
month was reported to be $4 250, with cash sales amounting to 60 per cent of the total and the
balance being credit sales. As shown in Table 5.13 below, the respondents from firms making sofa
sets reported the highest monthly revenues.
Table 5.13: Average total sales of per firm
Cash Sales ($) Credit Sales ($) Total Sales ($)
Makers of wardrobes 3 050 1 900 4 950
Makers of room dividers 2 400 1 600 4 000
Makers of sofa-sets 4 450 2 500 6 950
Makers of kitchen units (wood) 2 800 850 3 650
Makers of kitchen units (steel) 1 000 700 1 700
Average monthly sales ($) 4 250
5.5.4.5 Management of production costs
The respondents were also requested to indicate the monthly costs incurred by their firms on direct
labour, raw materials and other production inputs.

101
With regards to the cost of direct labour, the respondents were requested to report on the average
salaries paid to the owner-managers and artisans employed by the firm. The monthly income of the
owner managers was reported to be $320 on average and that of the artisans was reported to be
$170. Each firm was also reported to have an average of four artisans, implying that the total cost
of direct permanent labour was $1 000 per month. In addition, the firms were also reported to hire
some non-permanent artisans from time to time, depending on the amount of business. The
respondents indicated that commissions paid to such artisans amounted to $200 per month on
average.
The responses given above implied that the average total cost of direct labour was $1 200 per
month for each firm.
The respondents were also requested to provide information on the costs that they incurred in
acquiring timber and cotton, which were considered to be the two main raw materials that they
used. It was reported that all the materials were being acquired from merchants located within the
cluster, with the exception of fabrics, which were being purchased from outside the cluster.
It was also reported that timber was being procured from the merchants in standard lengths and the
cost depended on the thickness and grade of each length. For example, a set of six sofas was said to
require 42 standard lengths of timber of varying thickness. The cost of each length was reported to
depend on the quality of the timber and its size. Table 5.14 below contains details of the cost of one
length of timber according to the grade and size.
Table 5.14: The cost of timber according to size and grade
Timber size (length x thickness) and grade Cost price per length
76cm x 22cm x 2.4m – Grade A $0.80
76cm x 22cm x 2.4m – Grade B $0.50
114cm x 22cm x 2.4m $1.50
152cm x 22cm x 2.4m $2.00
Brandering x 2.4m $1.00

102
The respondents indicated that they always used “Grade B” timber, which was cheaper than “Grade
A” timber. “Grade A” timber was only used when required to make high-cost products following
the specific request of the customer.
When requested to provide information on the costs that they incurred in procuring the cotton that
they used for staffing sofa cushions and seats, the respondents stated that they procured the cotton
from merchants in the cluster who had brought it from the various cotton ginneries and oil refineries
in Zimbabwe. Some of the cotton was reported to come from as far as Checheche, a ginnery which
was more than 500 kilometres from Harare. They also stated that they used three types of cotton
material to staff the sofa seats and cushions: raw cotton (also known as cotton moths); cotton lint
(refined cotton) and cotton husk (cotton mixed with seed shells, and therefore of very poor quality).
The cost of the staffing was said to depend on the type of material used. Table 5.15 below contains
details of the cost of the different types of cotton materials.
Table 5.15: Cost of cotton and cotton lint by-products Description Cost price to merchant Cost price to furniture firm Cost per
sofa-set
Cotton lint $80 per 200 kg bale = 40c per kg $90 per 200 kg bale = 45c per kg $80
Clean cotton
moth
$30 per 200 kg bale = 15c per kg $40 per 200 kg bale = 20c per kg $40
“Trash” cotton
moth
$20 per 200 kg bale = 10c per kg $30 per 200 kg bale = 15c per kg $30
Cotton husk $2 per 50 kg bag = 4 c per kg $3 per 50 kg bag = 6c per kg $8
Cotton lint was reported to be of higher quality than cotton moths or cotton husk, and therefore
more expensive. The respondents indicated that the least-cost material was cotton husk, which they
purchased at six cents per kilogram. Cotton lint was reported to be the most expensive as it was
being purchased at 45 cents per kilogram. However, the most commonly used were the cotton by-
products: cleaner moths and trash moths, which were being purchased at 20 cents and 15 cents per
kilogram respectively. It was reported that the amount of cotton or cotton lint required per sofa-set
depended on the type of sofa-set. The low-value set (St James) was said to require a bale (200 kg) at
$80 if cotton lint was used to staff the sofa-set. However, if actual cotton was used, it would cost
$40 or $30 to complete a set. It was also stated that when cotton husk was used to staff the sofa, the
total cost of staffing would be only eight dollars per set.

103
In order to establish the costs that they incurred in acquiring other inputs required in the production
process, the respondents were requested to provide a list of such items. It was also reported that the
merchants purchased the inputs in bulk in 20-litre containers and sold them in smaller quantities of
500 milliliters to the firms in the cluster.
Table 5.16 below contains the list of the inputs and their costs to the firm.
Table 5.16: List of essential inputs and their costs
Item Cost to firm
Clear vanish, 500 millilitres $3,50
Contact glue, 500 millilitres $2,50
Wood glue, 500 millilitres $2,00
Thinners, 500 millilitres $1,00
Sanding sealer, 500 millilitres $3,00
Nails, 1kg $3,50
16 mm screw, 1kg $3,00
Keys, per set $1,00
Sand paper, per piece $1.00
Door handles, each $0.50
Using these responses, it was established that the cost of making a set of six low-value sofas was
about $250 and the cost of making a set of six high-value sofas was about $500. The details of these
costs are contained in Table 5.17 on the next page.
Most respondents (90 per cent) from the firms that produced sofa sets indicated that their firms
produced high-value sofa sets only on the specific request of a customer. In most cases they
produced low-value sofa sets. They also stated that an average of eight sets was produced per
month.
These responses implied that the cost of materials and inputs for the firms producing sofa sets was
about $2 000 per month, consisting of the items listed in Table 5.17 on the next page.

104
Table 5.17: The costs of producing a set of six sofas
LOW-VALUE SET HIGH-VALUE SET
Item Quantity Cost Quantity Cost
Fabric 22m @$3.50 $77.00 27m @$3.50 $94.50
Framing Timber 42x2.7m „Grade B‟
@$0.60 per length
$25.20 50x2.7m „Grade A‟
@$0.80 per length
$40.00
Springs $5.00 per set of 12 $60.00 $10.00 per set of 18 $180.00
Foam rubber – back rest 3x 1-inch @$6.00 $18.00 3 x 3-inch @17.00 $51.00
Foam rubber – arm rest
and side wings
3 x 1-inch @$6.00 $18.00 3 x 2-inch @$12.00 $36.00
Foam rubber – platform 1 x 1-inch @ $6.00 $6.00 2 x 2-inch @$12.00 $24.00
Foam rubber – cushions 4-inch light density $22.00 4-inch high density $35.00
Face Panels $15.00 per set of 16 $15.00 $30.00 per set of 16 $30.00
2-inch nails 3kg @$2.50 per kg $7.50 3kg @$2.50 per kg $7.50
1-inch nails 1.5kg@$3.50 per kg $5.25 1.5kg@$3.50 per kg $5.25
TOTAL COST $253.95 $508.50
5.5.4.6 Management of operating expenses
The respondents were also requested to provide information with respect to the operating expenses
(selling, distribution and administration expenses) that their firms incurred per month.
It was reported that selling expenses such as advertising and promotion were very insignificant as
the firms did not undertake such activities. However, most firms were reported to employ one sales
officer who received a commission-based salary. It was reported that the average salary of a sales
employee was about $100 per month.
The respondents also reported that their firms did not incur any distribution expenses. It was
reported that the transportation of products was the responsibility of the customers. Such services
were provided to the customers by other firms that were located within the vicinity of the cluster.
With regards to administration expenses, the respondents stated that the only such expenses
consisted of monthly lease rental payments to the landlord, amounting to $80 on average, plus a

105
payment of $10 per month to the security guards. The other administration expenses included food
and beverages for employees, which were reported to be about $50 per month. These responses
implied that the total operating expenses per month were about $240 per firm, on average.
5.5.4.7 The structure of the income statement
Using the information supplied by the respondents, the monthly income statement of the typical
small firm in the cluster was drawn up as indicated in Table 5.18 below.
Table 5.18: Monthly income statement of a small firm located in a cluster
Sales
Cash
Credit
Cost of sales
Direct labour cost
Direct material cost
Gross profit
Operating expenses
Selling expenses
Administration expenses
Operating profit
$
2 550
1 700
1 200
2 110
100
240
$
4 250
-
3 310
940
340
600
5.6 Conclusion
The findings presented in this chapter demonstrated that the phenomenon of small furniture
manufacturing firms located in geographical clusters was quite widespread in Zimbabwe. However,
the largest cluster by far was the Glenview cluster located in Harare. It was reported that the firms
located in these clusters made a significant contribution to the economy in terms of employment
creation and income generation, with a large proportion of the urban population being employed by
them. The firms were reported to be small in terms of the number of employees, revenue generation
and the size of the balance sheet.. The management of production operations resulted in a quite
complex structure in which the firms were arranged in a spiral of specialised sub-clusters and
division of labour producing a wide range of products.
The next chapter deals with the analysis of the findings presented in this chapter.

106
Chapter 6
Analysis and discussion of findings
6.0. Introduction
This chapter makes an analysis and discussion of the findings presented in Chapter 5. The chapter
begins with a discussion of the location, size and significance of Zimbabwe‟s small-firm clusters.
This is followed by an analysis of the characteristics of the industry, the firms, their owners and
employees. The chapter then discusses the functioning of the cluster in relation to the management
of human resources, production operations, sales and marketing and finance.
6.1 Location, size and significance of Zimbabwe’s small-firm clusters
The survey results show that by March 2012 Zimbabwe had an extensive network of small
furniture- making firms located in various clusters in its five major cities. Whilst the clusters were
of variable size, with the smallest one in Mkoba (Gweru) having 84 firms and the largest in
Glenview (Harare) having 1 800 firms, their significance in terms of employment creation and
income generation, was quite apparent. There were more than 2 700 firms in all the clusters and
they were employing over 10 700 people. These people also had their own dependents numbering
more than 85 600. With an average monthly income of $350 per head, the whole industry was
generating an annual income of $9 million. The total capital invested in the industry, consisting of
start-up capital and retained earnings by that time was over $13.29 million.
The Glenview cluster in Harare was rather unique because of its disproportionately large size
compared to the rest of the clusters, with sixty-four per cent of the total population of firms located
in all clusters. Born out of the clean-up operation of June 2005 which displaced the hitherto
cottage-based small furniture making firms, the Glenview cluster had over its seven-year life
evolved into a huge entity directly employing more than 5 400 people. Another 10 400 people in
Glenview and its hinterlands, were also dependent on the cluster for their livelihood. Many more
were employed in related downstream activities such as the supply of essential inputs and materials
and the provision of essential services like transport, security, food and beverages. By March 2012,
the Glenview cluster was a massive entity generating at least $4.4 million per year in income.

107
The findings indicate that the clusters grew very rapidly in size over a short period of time. In the
case of the Glenview cluster, for example, there were only 483 firms in the factory shells
constructed by the Ministry of Small and Medium-Scale Enterprises in 2005 when the cluster was
created. However, by March, 2012 the number of firms in the cluster had grown to more than 1
800, a growth rate of more than 270 per cent. The rapid growth of the cluster, with new firms
continuously joining the existing group, implies that there was considerable heterogeneity in the
knowledge endowments of the firms in the cluster as new firms with their own limited stock of
knowledge about the industry would try to catch up with the incumbent firms. The existence of
heterogeneity in knowledge endowments was critical to the evolution and growth of the cluster
because new knowledge would be acquired and shared as the new firms strove to catch up with the
incumbent firms. As indicated by Grebel (2004), heterogeneity in knowledge endowments is fertile
ground for the growth of entrepreneurship and innovation as new firms try to tap into the existing
stock of knowledge possessed by other firms.
The locational and historical factors identified in Chapter 5 had important advantages for the firms
located in the clusters such that other firms were continuously being attracted to join them. These
factors have been described by Visser (1997) as the territorial environment of the cluster. The
findings of this study show that the growth and significance of Zimbabwe‟s small-firm clusters can
be attributed to the existence of three factors concerning their territorial environment.
The first and foremost of these factors is the geographical location of the clusters. As reported in
Table 5.1 of Chapter 5, all the clusters were located close to or inside the residential areas of middle
and low-income people: Glenview; Zengeza; Mzilikazi; Western Commonage; Chikanga; Sakubva;
Mucheke and Mkoba. This means that the main market for the products produced by the firms
inside the clusters consisted of low-income consumers. The location of the clusters also provided
convenience for the customers in that they were presented with a wide choice of furniture products
at a walking distance from their homes, eliminating transport costs for both the firms and the
customers. The significance of the location of the clusters is that the firms in the clusters were able
to compete for customers with other large furniture making firms outside the cluster.

108
The second significant feature of the territorial environment of Zimbabwe‟s small-firm clusters was
that the clusters were characterised by a high density of economic activity by a large number of
firms operating in close spatial proximity to each other. This is especially true in the case of the
Glenview cluster as illustrated in Figure 5.3, Chapter 5. It was also found that each firm was
occupying an average of only four square metres of working space. An important advantage of this
is that the close proximity of the firms resulted in a highly competitive environment fostering a
culture of continuous innovation and allowing the firms to learn from one another.
Another advantage arising from the close proximity of the firms to one another was that various
„hidden costs‟ relating to information gathering that are normally incurred by large enterprises were
eliminated. These costs include: the cost of searching for and procuring materials; the cost of
screening, selecting and monitoring business partners; the cost of enforcing contracts entered into
between the firm and other third parties in the cluster and the cost of gathering market intelligence
such as changes in consumer preferences. It has also been reported by Visser (2007) that when a
large group of firms is located close to one another, personal contacts are more frequent and local
norms and values that are unique to the members of the group are developed, helping to stimulate
the circulation of otherwise delicate information between the firms. The close proximity of the
firms would allow them to build and maintain good reputations with one another through the
repetition of business transactions with the same group of people. Continued face-to-face contact
with the owner-managers and employees of other firms, had the effect of building trust, resulting in
reducing the transaction costs related to information gathering.
The third important feature of the territorial environment of Zimbabwe‟s small-firm clusters was
the history or evolutionary path of the clusters. All the clusters had a history and background that
was shared by most firms within them. The firms in the Glenview cluster for example, originated
from the clean-up operation of June 2005, which affected a former cottage industry that had been
thriving along the sides of Willowvale Road. Thus by March 2012, the employees and owners of
the firms had been together for a long period of time including the years that they had operated as a
cottage industry plus the seven years in the cluster. This shared history acted as a unifying force
bringing the firms together and allowing them to exchange knowledge and skills in their dedicated
area of activity.

109
The firms also had a common cultural background. The majority of the owner-mangers were
reported to be former employees of large furniture making firms who had been retrenched or had
resigned from these firms before setting up their own entities in the cluster. Thus, they also shared
the same experiences gained from these firms. In all the clusters, most of the employees and owners
were reported to reside in the same low-income neighbourhood in which the cluster was located,
implying that the common social-cultural thread running through the cluster at the global level was
the low income and poor background of the owner-managers and employees of the firms.
The findings in Chapter 5 also indicate that the characteristics of the clusters with respect to the
nature of the industry, the firms, their owners and employees were also significant in explaining the
growth and dynamism of Zimbabwe‟s small-firm clusters. These issues are explained below.
6.2 Characteristics of the industry, the firms, owners and employees
6.2.1 The industry
From a competitive point of view, the industry appeared to be unattractive due to the apparently
intense rivalry among the firms. Three factors seemed to be responsible for the existence of such a
high level of rivalry.
Firstly, the firms were of equal size. The average number of employees was reported to be only four
per firm, with the largest firm size being found at the Glenview cluster were it was reported that the
average number of employees was six. Within the Glenview cluster, which had the largest number
of firms, the firm size ranged from four to eight. The equal size of the firms had the effect of
intensifying the rivalry among them as no single firm could be said to dominate activities in the
cluster. Secondly, the rapid growth of the cluster caused the supply of the products to outstrip
demand, resulting in reduced sales per firm over time. Thirdly, due to the limited number of
alternative opportunities outside the cluster, it would cost more for the owner-manager to get out of
the business than to stay in and compete, regardless of how inhibiting the environment inside the
cluster might become. The lack of alternative opportunities outside the cluster had the effect of
raising exit barriers for the incumbent firms, thus intensifying the competitive rivalry among them.
The second factor with a strong negative bearing on the competitiveness of the industry was the
existence of substitute furniture products outside the cluster. The existence of these products tended

110
to put a ceiling on the prices that the firms in the cluster could charge for their products. This was
reflected in the low prices of the products relative to those sold outside. The selling price of a sofa-
set for example, was reported to range between $320 and $640 (after adding a mark-up of twenty-
eight per cent on the cost), depending on the quality of input materials used, whereas outside the
cluster, the lowest price for a similar set was generally $1 500. The presence of substitute products
allowed customers to make comparisons between the quality and performance of the products made
within the cluster and those made outside the cluster.
Though the intense rivalry among the firms and the existence of substitute products tended to
reduce the competitiveness of the industry, more firms still continued to be attracted into the cluster
due to several factors discussed below.
The first and foremost of these factors was that there were low entry barriers into the industry. This
is evidenced by the rapid growth of the number of firms, especially at the Glenview cluster, which
grew by over 270 per cent within a period of seven years. There were several factors contributing
to the existence of low entry barriers. Firstly, the economies of scale were very low as implied
from the low start-up capital required. These low economies of scale allowed potential entrants to
enter the industry on a small-scale basis, with very little capital investment. In the case of the
Glenview cluster it was reported that an average of only $1 200 was used as start-up capital by most
firms. This start-up capital was said to be for production purposes only. Capital financing for other
costs, such as marketing, distribution and purchasing were not significant within the cluster
environment because customers came to the cluster to purchase their products and suppliers were
located in the vicinity of the cluster.
The second factor leading to low entry barriers into the industry was that new entrants into the
cluster were able to quickly gain access to the technology and specialised know-how of the industry
due to the existence of a very short learning curve. Further, the achievement of low unit costs was
not a function of experience in producing and marketing the product, implying that new entrants
were not put at a disadvantage in competing with existing firms with longer experience in the
industry. The fact that the firms were found to be producing standard products with similar brand
names, implied that potential buyers would have no attachment or loyalty to any of the products

111
produced by particular firms in the cluster and existing customers were also free to switch to other
firms. These factors also further contributed to the lowering of entry barriers into the industry.
The nature of the suppliers of inputs and the buyers of the product was also significant in enhancing
the attractiveness of the industry to new firms. It was reported that there was a large number of
suppliers of timber and cotton, who were located in the vicinity of the cluster. Because of their
large numbers, the competitive position of the suppliers relative to the manufacturing firms would
be weak as the manufacturing firms could easily switch from one supplier to another when buying
essential inputs such as timber or cotton. Further, the consumers of the furniture products produced
in the cluster were reported to be individuals with low incomes or small retailers who purchased in
small quantities. Thus, they could not easily switch to other suppliers of furniture outside the
cluster. This also resulted in their bargaining power being relatively weak vis-à-vis the bargaining
power of the manufacturing firms.
6. 2.2 The firms
As was reported in Chapter 5, all the firms in Zimbabwe‟s clusters were not registered in terms of
the Companies Act, Chapter 190 of Zimbabwe. Lack of legal incorporation did not, however,
imply that the firms were operating illegally. It only meant that they were operating more or less
informally, on the basis of an operating licence issued by the local authority. It was those entities
that did not have such licences that could be said to be operating illegally. No such firms were,
however, found in the cluster because officials from the local authority were reported to be
collecting monthly fees regularly from all the firms.
The mushrooming of firms in the cluster could be partially explained by the fact that the type of
business entity found in the cluster was such that it was simple to set up as there were no legal
formalities required except for the operating licence issued by the local authority. However, there
were several limitations associated with this lack of formality which came out of the findings.
These limitations could be detrimental to the future growth and dynamism of the firms, and
therefore the cluster as a whole.
One major growth limitation that came out was that the firms seemed to have little or no access to
adequate capital investment. Lack of adequate funding in the form of both long-term loans and

112
equity capital had the effect of inhibiting the growth of the firms, forcing them to remain small.
Because the firms were not sufficiently capitalised on a long-term basis, their ability to respond to
market opportunities was therefore severely compromised. This explains why all the firms reported
that they had not established any export markets for their products even though they had the
potential to do so and their domestic market was limited to the vicinity of the cluster, with only a
few buyers coming from outside the city in which the cluster was located.
If a firm is legally incorporated in terms of the provisions of Section 8 of the Companies Act
Chapter 190, it is allowed to issue shares up to the maximum amount authorised by its
Memorandum of Association. Because the firms in the cluster were not legally incorporated entities
and were therefore not able to issue shares to potential investors, they found it difficult to raise
meaningful amounts of equity capital from other investors outside the immediate circle of their
founders. Instead, they had to rely on the start-up capital introduced by the owners and profits that
were being regularly ploughed back into the business. This therefore meant that the amount of
equity capital invested in the firms would always remain small. The existence of this problem is
evidenced by the finding that the average start-up capital for the firms in the Glenview cluster was a
mere $1 200 and over the seven-year period from June 2005 to March 2012, the total equity capital
invested per firm had only grown to $6 200.
In order to put this problem into perspective, the amount of equity capital invested in some of
Zimbabwe‟s stock exchange-listed firms that was reported in their Annual Reports (2010) is
presented in Table 6.1 for comparison purposes.
Table 6.1: Capital employed by some stock exchange-listed firms in Zimbabwe
Name Nature of business Capital employed ($million)
Equity Long-term loans Total
African Distillers Wines and spirits 4.80 - 4.80
CAFCA Power cables 5.60 - 5.60
AICO Africa Agro-industrial 114.60 10.00 124.60
Hippo Valley Estates Sugar 167.46 1.67 169.13
PG Industries Construction 16.29 - 16.29
Average 61.75 2.33 64.08
Source: Company Annual Reports, March 2010

113
The figures presented in Table 6.1 show that though there was wide variability in the amount of
equity capital invested in the stock exchange-listed firms, ranging from $4.8 million to $167.46
million, Zimbabwe‟s cluster-located firms were relatively minute entities, with an average of only
$6 200 of equity per firm compared to an average of $61.75 million for the stock exchange-listed
firms.
The second major factor limiting the growth of the firms in the cluster is implied from the fact that
the firms were reported to have no long-term borrowings in their balance sheets (Table 5.12,
Chapter 5). The implication of the absence of long-term borrowings was that the firms were unable
to take advantage of the leverage provided by borrowed funds. Generally, an important advantage
of using borrowed funds is that a firm operating in an environment where sales (and therefore
earnings) are increasing can leverage its earnings by borrowing funds at a rate which is lower than
the rate of return that it can obtain from investing the borrowed funds. The leveraging of earnings
translates into increases in the rate of return on the equity invested by the owner (Brigham and
Gapenski, 2005).
The high growth rate in the number of firms in Zimbabwe‟s clusters, especially at Glenview, is a
clear indication of continuously growing sales volumes at the global level, though there could be
variations from firm to firm. Such an environment is conducive to leveraging because of the
associated growth in earnings. However, since it was reported that the firms were not borrowing,
they were not therefore able to take advantage of this opportunity. Thus, the lack of borrowing
severely limited the size of the firms by inhibiting their ability to leverage their earnings.
The lack of borrowing on the part of the firms in the cluster could be attributed to the existence of
high business risk in the cluster environment. This high business risk was associated with a highly
competitive environment resulting from the presence of a high density of firms competing for
customers in the same local area. Under such circumstances, the firms would naturally find it
prudent not to borrow money on a long-term basis because borrowing would have the effect of
committing the firm‟s future earnings to the repayment of interest. Prudence on the part of the
firms was required in this case due to the fact that though the earnings might be increasing, the
variability (therefore the risk) of these earnings could be very high. Since the payment of interest on

114
borrowed funds is a contractual obligation, its non-payment due to insufficient earnings could result
in the liquidation of the firm‟s assets. Thus, the firms would naturally be reluctant to expose their
assets to such a possibility.
The lack of borrowing on the part of small firms located in Zimbabwe‟s clusters cannot however be
attributed solely to the existence of high business risk in the cluster operating environment. It could
also be associated with the generally negative operating environment in which all other firms in
Zimbabwe were operating at that time. As shown in Table 6.1 above, the large stock exchange-
listed firms did not have any significant long-term borrowings on their books as well, with only
four per cent of their total capital consisting of long-term loans and the bulk of it consisting of
equity (funds contributed by the owners). This implies that not only did the small cluster-located
firms have to deal with the „normal risk‟ of the cluster environment, but they also had to manage
the high risk in the general operating environment of Zimbabwe as a whole.
The operating environment of the cluster was also fraught with many other uncertainties that could
further explain the dearth of long-term borrowed funds. At the Glenview cluster in particular, a
major source of uncertainty for the firms was the lack of permanent tenure due to the disorganised
manner in which the land had originally been allocated to the firms. As was reported in Chapter 5,
the land and the factory shells were originally allocated to 483 occupants in July 2005, only to be
further subdivided and re-allocated illegally to other firms by the original landlords. This resulted in
the local authority subsequently failing to properly enforce the lease agreements signed by the
occupants and to control the expansion of the cluster. Many other rent-seeking activities by self-
imposed authorities also added to the chaos and loss of control by the local authority. This situation
presented the potential risk that when order would eventually be restored, many existing firms
could be displaced. This uncertainty of tenure implies that banks and other financial institutions
would be unwilling to provide long-term loans to the firms in the cluster.
The third growth-inhibiting factor is implied from the finding that all the firms in the cluster were
reported to be sole proprietorships. Sole proprietorship is business ownership which is associated
with unlimited liability. Unlimited liability is the situation where the firm is not regarded as a
separate legal entity from the owner and the owner is therefore liable for the debts of the firm. This

115
type of ownership implied that the personal assets of the owners of the firms in the cluster were
exposed to the risk of liquidation in the vent that the firms failed to pay their debts. This problem
became even more poignant given the high business risk environment of the cluster and also
explains why the owners were unwilling to borrow money on behalf of their firms.
There were other growth-inhibiting disadvantages that could also be associated with the sole
proprietorship type of ownership, for example, lack of continuity in the event of the death of the
founder. Further, the fact that the owners were also the managers of the firms meant that there
could be some management limitations due to lack of all-round management skills on the part of the
owners as it was reported that the owner-managers were responsible for all management functions,
including production, purchasing, sales and human resources management and training of
apprentices.
6.2.3 The owners and employees
Despite the possible structural disadvantages discussed above, the characteristics of the owner-
managers seemed to bring with them certain advantages to the firms in the cluster.
Firstly, the owner-managers were reported to have a high level of experience in the business of the
cluster, having been in the industry for an average of fourteen years in other large furniture making
firms outside the cluster. This implies that the owner-managers had a wealth of knowledge which
they brought with them to the cluster. Secondly, all the owner-mangers were reported to be still
fairly young at an average age of forty-one years, implying that the long-term future of the cluster
was guaranteed.
The level of formal education on the part of the owner-managers was however rather limited as it
was reported that only twenty-three per cent of them had “Ordinary-level” education. It was also
reported that most of them (ninety-two per cent) did not have any formal training obtained at
training institutions in carpentry. These findings imply that the sources of skills within the cluster
were largely informal as the skills were gained mostly from practical experience with their previous
employers outside the cluster.

116
The characteristics of the employees also seemed to bring with them other advantages to the firms
in the cluster. Firstly, the employees were also reported to be fairly young, with an average age of
only twenty-eight years, implying that the long-term future of the industry was also assured as this
young and dynamic group of employees would eventually take over the management of the cluster.
The majority of the employees were also reported to have a high level of formal education up to
“Ordinary level”, implying that the learning capabilities of the employees could be reasonably high.
However, just like in the case of the owner-managers, the majority of them (93 per cent) did not
have any formal training, implying further that the sources of skills within the cluster were largely
informal and local. It was further reported that the majority of the employees did not have any
employment experience outside the cluster environment. As shown in Table 5.5 in Chapter 5, the
employees‟ skills in furniture making were being acquired within the cluster through the
apprenticeship that they were receiving from the owner-managers of their firms.
These findings raise the concern that the cluster could be technologically isolated, leading to the
risk of “lock-in” and “entropic death” (Camagni, 1991) because no new skills were coming in from
outside the cluster environment. Evidence of this is provided by the fact that not much variation
was reported with regards to the designs of the products from firm to firm and also over time. All
the firms were making standard designs that had been brought into the cluster by the owners who
had copied them from their previous employers outside the cluster. No new designs or major
changes to existing designs were being carried out. Only cosmetic changes were being made.
The reported characteristics of the employees and the owner-managers also had an implication on
the power distance between the owner-managers and the employees. Power distance is the extent
to which individuals accept the unequal distribution of power within the organisation (Hofstede,
2001).In an organization with a high power distance, communication and decision-making flow
generally from the top to the bottom of the organization. This results in an autocratic management
style.
The owners of the firms were also reported to be the managers. The employees and owner-
managers were all reported to be artisans sharing the same skills and experiences either inside or
outside the cluster environment. These findings imply that the power distance between the owner-
managers and the employees was low. The management style used in the organisation would

117
therefore be more democratic than autocratic in that control systems were based on trust in
subordinates‟ ability to complete their tasks rather than on the power of the owner-managers‟
position vis-à-vis other employees‟ positions in the firm.
The short power distance between the employees and the owner-managers had a further implication
on the level of uncertainty avoidance in the firms. Uncertainty avoidance is the extent to which
individuals feel threatened by ambiguous and risky situations and try to avoid or reduce
them(Hofstede, 2001).The level of uncertainty avoidance in an organisation also has a direct
bearing on the extent to which entrepreneurship or innovation can occur within it. Organisations
which are high on uncertainty avoidance are likely to be less entrepreneurial, to rely extensively on
written rules and rigid and formal structures and to emphasize employment stability. In the cluster
environment, uncertainty avoidance was low because of the short power-distance between the
employees and the owner-managers and also the close social ties and shared experiences between
them.
6.3 The functioning of the cluster
The findings in Chapter 5 indicate that the functioning of the cluster with respect to the human
resources management, production operations management, sales and marketing management and
financial management are also significant in explaining the growth and dynamism of Zimbabwe‟s
small-firm clusters. These issues are explained below.
6.3.1 Human resources management
The recruitment policies followed by the firms resulted in all of the employees and managers of the
firms in the cluster being members of the same family or having the same social contacts. This
closeness was further amplified by the fact that all the firms (99 per cent) were reported to be
managed by their owners. The closeness of the owner-managers to their employees resulted in the
moulding of a tight working unit.
The most significant implication of this finding was the existence of a strong culture of unity among
the firm‟s employees and between the firm and its employees. As members of the same family or
sharing the same social background, the organization's employees and owner-managers had strong

118
fraternal bonds that had been developed through a long and thorough process of socialisation. The
employees and the owner-managers knew each other very well on a personal level. Even for
employees who might not necessarily be members of the same family with the owner-manager or
current employees, a system of socialisation was in place, whereby new members were
systematically brought into the culture of the organisation. Through socialization, new employees
would quickly learn the ropes and were introduced to the norms of the organization. The strong
culture had inbuilt mechanisms for selecting the right types of employees and, once selected, for
moulding them. Moulding took place through consistent role modeling, teaching, coaching, and
enforcement by team members and managers.
Strong social ties also resulted in the cultivation of a culture of loyalty to the organisation. Loyalty
meant that members of the organisation would accept that their obligations to the organisation went
beyond the simple exchange of labour for salary and understand that the required contributions to
the organization (such as hours worked per week) might exceed any contractual agreements. This
is implied from the finding that remuneration was commission-based and also dependent on the
overall sales achieved by the firm. Loyalty also meant that employees would have a long-term
commitment to the organisation which was exchanged for the organization's long-term commitment
to the individual. This relationship was based on mutual interest and evidence of this is provided by
the finding that, though employees would temporarily join other firms during slack business
periods, they would still come back to their permanent work places.
Strong social ties between the members of the firm had the effect of breeding a „clan culture‟ in
which members would have a sense of pride in belonging to the organisation and feel pressured to
conform to important norms of the clan. The „clan culture‟ would breed a sense of belonging in
which the members of the firm had a shared image of what the organization stood for. For
example, it was reported that all members might belong to the same church and would attend
church ceremonies on specific days of the week as a group. This „clan culture‟ was enduring
because long-term „clan members‟ would serve as mentors and role models for newer members in
order to maintain the values and norms of the organization.

119
The „clan culture‟ of the firms in the cluster had the effect of further cementing the loyalty of the
employees to their firms so that an employee might temporarily „stray‟ to another firm but would
still come back to the „clan‟. The „clan culture‟ also had the effect of strengthening the bonds
between otherwise competing firms in the cluster. It was reported that eighty-three per cent of the
employees had had an average of two years employment experience with other firms within the
cluster. Thus, some employees might also „stray‟ from the „clan‟ to form their own „clan‟ but they
would still feel loyal to their original „clan‟ and maintain close ties with it.
The „clan‟ culture found in the cluster is the direct opposite of the „market culture‟ which might be
found in other firms operating in environments that are different from the cluster environment. The
„market culture‟ is characterised by a purely contractual relationship between the employee and the
organisation and the obligations of each party are agreed in advance. In a „market culture‟, the
organization does not promise (or imply) security to the employee and the employee does not
promise (or imply) loyalty to the organisation outside the confines of the employment contract. An
organisation with a „market culture‟ is therefore prone to more conflict in the workplace compared
to one with a „clan‟ culture.
The other implication of the existence of close social ties within the firms located in the cluster was
that production operations such as production scheduling and cost control were easier to manage
because the production unit was organised as a tight family unit. With respect to cost control, the
remuneration policies of the firms resulted in the relatively low average monthly earnings of $170
per employee which were reported in Chapter 5 with total monthly employee costs of only $680 per
firm. These low employee costs were achievable due to the fact that the size of the employee‟s
remuneration tended to be the outcome of negotiation and compromise between the firm and its
employees.
In the case of production scheduling, a further implication of the close social ties within the firm
was that the firms were able to use flexible production schedules. The labour force was reported to
consist of „semi-permanent‟ employees who were able to disengage themselves from their
employment contracts from time to time and work for other firms during slack business periods.
The firm could also tap into a pool of unattached labour roaming within the cluster when the need

120
arose. These policies enabled the firm to minimise the employee costs and also to align production
schedules with the cash flows of the firm.
6.3.2 Production operations management
Three key issues that stand out from the findings on the management of production operations
within the cluster are: the existence of flexible specialisation; division of labour and the acquisition
and diffusion of knowledge.
6.3.2.1 Flexible specialisation and division of labour
The findings in this study with respect to the nature of division of labour and flexible specialisation
in small-firm clusters seem to be at variance with what has been reported in other studies on these
matters.
Reports on the existence of an intricate system of sub-clusters and sub-sub-clusters of firms in
Zimbabwe‟s clusters seem to confirm the existence of flexible specialisation, a phenomenon
observed from previous studies carried out on small-firm clusters elsewhere both inside and outside
Zimbabwe. Following studies on a cluster of small furniture making firms in Mutare (Zimbabwe)
and another cluster of small garment making firms in Nairobi (Kenya), Sverrison (1994: 43) defines
flexible specialisation to mean the existence of a production operations management system in
which each firm in the cluster produces various types of products, piece by piece using variable
designs depending on customer needs. This definition of flexible specialisation implies that the firm
would always be producing all the product types that were found in the cluster, depending on
market contingencies.
The findings from this study, however, seem to bring a new dimension to the phenomenon of
flexible specialisation. It was reported in Chapter 5 that the firms operating within the cluster
environment did not produce varied types of furniture products but each firm concentrated on
producing and selling just one type. The firms were however, flexible in their ability to produce any
other types of products found in the cluster when called upon to do so by market contingencies. At
the Glenview cluster in particular, it was reported that the firm‟s production unit was not geared

121
permanently to the production of a particular product such as wood furniture cabinets but was also
capable of producing other products, such as sofa-sets on the request of a customer or another firm
within the cluster.
These findings imply that the phenomenon of flexible specialisation did exist in Zimbabwe‟s
clusters in that the firms were capable of producing various product types. However, even though
the firms possessed these capabilities, they did not in fact use them all the time. It was only on
those rare occasions when market contingencies demanded that a firm would deviate from its usual
product type. Thus, flexible specialisation under these circumstances would mean simply the ability
of the firm to deviate from its „normal‟ activity into other related activities.
The type of flexible specialisation as reported in this study is more efficient than previously thought
because it enables the firm to hone its capabilities to the production and sale of a single product
type. Just like the cluster was operating as a „differentiated entity‟ (an entity producing a single
product type) in relation to other small-firm clusters, the firms were also operating within
„differentiated‟ sub-clusters in relation to other sub-clusters in the main cluster. It was reported that
all the firm‟s artisans and production management systems would be dedicated to the single product
type produced by firms in that sub-cluster, resulting in high operating efficiencies and superior
technological capabilities. Romjin (2004) described technological capabilities as skills and
knowledge which accumulate over time through experience (learning-by-doing). Thus, through
specialising in one product type rather than all the product types produced in the cluster, the
learning threshold of the firm and its artisans would be raised over time through a process of
learning-by-doing.
By questioning the conventional wisdom on the nature of flexible specialisation in the cluster, these
findings show that in fact, the small firms located in Zimbabwe‟s clusters are using differentiated
flexible specialisation, which entails the complete dedication to the production and sale of a singe
product type(regardless of the fact that the firm might possess the capabilities to produce and sell
other product types made in the cluster).

122
The findings in this study also question the conventional wisdom with regards to the nature of
division of labour in the context of small firms located in a cluster. As reported in studies by
Sverrison (1994), production operations for small manufacturing firms operating in clusters are
managed through a system of division of labour. It was reported in these studies that division of
labour consisted of a production operations management system in which tasks were allocated to
artisans in the production unit such that the product transformation process was subdivided into
several routines and each routine or some routines were allocated to each artisan or several artisans.
The result of such an arrangement would be that each artisan became an expert in the use of the
machines that were used on his or her part of the process. According to Sverrison (1994), the
artisan became a „node‟ in a social network connected by several machines. His or her skills level
would be relatively low and local rather than global with respect to the complete product.
Rather than challenge the existence of the division of labour within the cluster environment as
defined above, the findings from this study seem to add a further perspective to the phenomenon by
pointing to the existence of two dimensions to the division of labour: flexible division of labour and
extended division of labour.
Flexibility in division of labour is implied from the fact that each artisan within the production unit
wasreported to be multi-skilled and capable of performing most of the routines in a particular
transformation process for all the products manufactured by the firm when required to do so. Each
artisan, however, specialized in only one or two routines on each process for each product. Market
contingencies, such as when a large order had been received and when lead times for the delivery of
a product were short, required that all artisans be flexible in their skills level. This flexibility in the
division of labour, coupled with the demands of the market, implied that the skills level of the
artisan would not actually be local with respect to the complete product, but global in that he or she
could perform all the transformation routines for all the products produced by the firm, contrary to
the suggestions made by previous studies.
The extended dimension to the division of labour, which is the second dimension, is implied from
the findings wherein it was reported that division of labour within the cluster environment was not
limited to the confines of the firm‟s internal production unit as described by Sverrison (1994), but

123
was extended further to the whole cluster. It was reported that the transformation process for each
product was not completed wholly within the firm‟s production unit but was further shared with
other firms that specialised in certain specific routines.
Two lists of machinery and equipment were produced in response to the request for a list of the
machinery and equipment used by the firms in the cluster. The first list (Table 5.9, Chapter 5)
consisted of machinery and equipment which was said to be “essential” to the firm‟s production
routines. The total capital investment required for these assets was reported to be $14 450. With an
investment of only $6 200 of equity, it is quite clear that the average firm in the cluster did not have
the financial resources to buy the assets listed in Table 5.9 (Chapter 5). The second list (Table 5.10,
Chapter 5) consisted of small hand tools and equipment which were reported to be valued at only
$100. It was reported that these were the assets in which the production units had invested their
capital, at an average amount of $200 per firm.
The existence of global (cluster-wide) rather than simply local (within-firm) division of labour
provides the explanation for this apparent anomaly. The production units did not need to invest their
capital in the assets listed in Table 5.9 (Chapter 5) because all the essential routines in their
production processes were being carried out by the firms that had invested their capital in these
assets. The production units would either hire the machine time required to carry out the routines or
buy the output of the routine from these „specialist firms‟. In this way, division of labour was
extended further to the rest of the cluster.
The previous studies on small-firm clusters in Zimbabwe and Kenya by Sverrison (1994) referred to
above had indicated that firms operating within a cluster environment tended to invest in multi-
purpose machines which they would use to carry out all the routines in their production processes.
The findings from this study, however, suggested that the firms in Zimbabwe‟s clusters did not
have to invest significant amounts of capital in any machinery at all. This was because the division
of labour within the cluster environment was not simply local but global.
The implication of these findings is that it is not the purported investment in multi-purpose
machines that provides flexibility to the firm. Rather, it is this extended dimension to the division of

124
labour which allows the firm to adapt its operations to changes in the external environment by
switching from product to product in line with market contingencies. For example, a fall in the
demand for a certain type of sofa-set, or restrictions in the supply of inputs for that product, would
not be disastrous for the firm as it could easily switch to other products by buying the output of the
required routines or hiring the machine-time for those routines from the specialist firms.
6.3.2.2 Acquisition and diffusion of knowledge
The findings discussed above with regards to the management of production operations through
differentiated flexible specialisation methods as well as flexible and extended division of labour,
have some implications on the way in which knowledge (technological capabilities) was being
acquired and distributed across the cluster.
Some studies on knowledge acquisition and diffusion in small-firm clusters in other countries
(Altenburg and Meyer-Stamer,1999; Hodgkinson, 2007; Van Dijik and Rabellotti, 1997) have
analysed the acquisition and diffusion of knowledge within the cluster environment on the
assumption that when firms are located in spatial proximity to each other, knowledge can easily be
picked up from the „air‟ of their locality, that is by just being present long enough within the
general environment of the cluster. The knowledge that can be acquired from the general
environment of the cluster is tacit knowledge. It is knowledge that is acquired through indirect or
implicit learning (Berry, 1997). This type of knowledge has also been referred to as the „general
purpose technology‟ of the cluster (Grebel (2004). Since it is knowledge that is freely available to
any member of the cluster, it becomes the generic knowledge base of the cluster.
The findings presented in Chapter 5 of this study, seem to confirm that in the case of Zimbabwe‟s
clusters, tacit knowledge was also being created and transmitted. However, the findings also
suggest that another type of knowledge, codified knowledge(Polanyi, 1958), was also being
generated and transmitted.
Codified knowledge is „documented knowledge‟ that has to be actively acquired from the outside to
become the personal property of its owner. In the case of firms located in the cluster, codified

125
knowledge could not easily be transferred from one artisan to the other. Thus, the mere presence of
a firm within the cluster where both codified and tacit knowledge was present, did not lead to its
acquisition of all the knowledge that could be found in the cluster. It is only tacit knowledge that
could be gained in this way.
Tacit knowledge is not effective knowledge for the firm in a cluster of other „competing‟ firms. It is
codified knowledge which is effective knowledge because, since it is the personal property of the
owner, it creates a competitive advantage for the firm whose artisans possess it. Tacit knowledge
does not provide any competitive advantage to the firm because it is knowledge that is available to
all the artisans in all the firms in the cluster. Evidence provided from these findings seems to
suggest that the competitive edge of a firm, vis-à-vis other firms in the cluster is dependent on the
amount of codified knowledge possessed by its artisans.
With regards to tacit knowledge, the findings in this study suggest that two factors are responsible
for its generation and transmission within Zimbabwe‟s clusters. These are: the spatial proximity of
the firms and the human resources management systems used by the firms.
Graphic evidence of the spatial proximity of the firms in the cluster is provided by the aerial
photograph of some of the 1 300 firms located at the Glenview cluster presented in Figure 5.3 in
Chapter 5. It was further reported that each firm at the cluster was using an area of only four square
meters on average. The implication of these findings is that the proximity of the firms to each other
enables the artisans in each firm to easily copy any new product designs or changes in existing
designs made by other artisans in the vicinity of their firm. In this way, tacit knowledge was being
transmitted from firm to firm.
The flexibility that was reported with respect to the human resources management systems within
the cluster resulted in artisans frequently moving from one firm to the other. This labour mobility
provided another important media for the generation and transmission of tacit knowledge within the
cluster in two ways.

126
Firstly, it was reported that the firms from time to time engaged the services of some artisans who
did not have any permanent relationships with any particular firm but roamed within the cluster
offering their services to all the firms in the cluster. These workers were reported to form a distinct
pool of unattached skilled labour, with the technological capabilities and skills to make all product
types and categories within the cluster. Thus, when these workers moved from firm to firm they
would also gather the knowledge in the possession of the firms they were engaged in at that time,
passing it on to the artisans in the next firm. In this way, the unattached artisans became an
important conduit for the gathering and transmission of tacit knowledge among the firms in the
cluster.
Secondly, it was also reported that during slack business times when the demand for the firm‟s
product was low or when there was a shortage of inputs, some of the firm‟s artisans who would
otherwise be permanently employed by the firm, also became independent commission workers
who offered their labour to other „competing firms‟. At other times, for example when the firm
received a large order with a short lead time, or when demand was generally high (for example
during the tobacco selling season, when tobacco farmers brought their tobacco to the auction
floors), the artisans reverted to full-time employment in their firms. In this way, tacit knowledge
was also gained and transmitted among the artisans as they moved from firm to firm.
Caution needs to be taken however, in attributing the generation and transmission of tacit
knowledge among firms through the mobility of labour within Zimbabwe‟s clusters. The need for
this caution arises from the observation by Giuliani (2002) that a distinction be made between the
„pure‟ and „apparent‟ tacitness of knowledge. Apparent tacitness refers to the case in which an
external observer perceives as tacit knowledge what in reality is codified knowledge that is being
transferred through a specific group of people.
The findings from this study seem to suggest that the tacitness of the knowledge that was being
transmitted through labour mobility within the cluster could only be regarded as „apparent‟ as
opposed to being „pure‟. This conclusion is implied from the description of a group of people
sharing a common language and codes among themselves as an „epistemic community‟ by Breschi
and Lossoni (2001).

127
The artisans who were permanently employed within a firm would perfectly fit the description of an
epistemic community by virtue of their sharing the same skills and knowledge about the product or
products made by their firm. The tacit knowledge in possession of members of this epistemic
community remained only apparent in relation to all other artisans who were not permanently
employed by their firm unless they became part of them by becoming permanent employees. When
an artisan moved from his permanent place of employment to another to temporarily join other
artisans in another firm, he would come into contact with an epistemic community of which he was
an outsider. Though the knowledge that these artisans possessed was „tacit‟ in the sense that they
were able to transmit it to other artisans who joined their firm temporarily during the time that they
were employed on a contract basis by the firm, its tacitness was only apparent because the artisans
who possessed it might not willingly transmit it to the temporary employees of other competing
firms.
In the same vein, an artisan who temporarily joined another group of artisans in another firm, was
coming from the epistemic community of artisans in his own firm, thus would not be willing to pass
his knowledge to the artisans in the firm in which he was temporarily employed. The tacitness of
his own knowledge was also therefore only apparent and not pure in relation to the artisans in the
firm in which he was temporarily employed.
The tacitness of the knowledge possessed by the artisans who roamed the cluster as an unattached
pool of labour however, was pure and not merely apparent because the description of these artisans
does not fit that of an epistemic community. These artisans could not be described as an epistemic
community because they did not belong to any particular firm in the cluster. Though they might be
in possession of common knowledge and skills with respect to the products made in the cluster,
they did not necessarily have to share this knowledge among themselves as a group of artisans. The
knowledge and skills that they possessed was more freely available to other artisans in the firms to
which they sold their labour because as independent agents, they did not have any loyalty to any
particular firm in the cluster.

128
The labour mobility patterns reported in this study suggest that only „purely tacit‟ knowledge was
being created and transmitted among the artisans in the cluster through the conduit of the
independent or „unattached‟ artisans. The other artisans possessed „apparently tacit‟ knowledge
because they would not willingly transmit their knowledge to other artisans in „competing firms‟
unless they were provided with adequate incentives to do so.
The remuneration systems described in the findings, however, seem to suggest that incentives for
the transmission of even apparently tacit knowledge among the artisans did exist. It was reported
that all workers employed on contract received a commission-based remuneration which was equal
to ten per cent of the value of the product. The permanently engaged employees were also reported
to be paid a „salary‟ based on the number of items sold by the firm as a whole. Thus, it would be in
the best interest of all employees to maximise the value of the firm‟s sales so as to maximise their
own remuneration. The need to maximise the firm‟s sales would necessarily mean that all artisans
had to share all the available knowledge about their products. Therefore there was a clear incentive
for any artisan to pass on any new knowledge that he or she might possess to other artisans in the
firm.
The reportedly strong social ties within the cluster environment could also be responsible for the
generation and transmission of tacit knowledge within the cluster. According to Table 5.9 in
Chapter 5, the strongest ties among the employees were reported to be of a religious nature,
followed by family ties. These findings imply that belonging to the same church or religious
denomination was an important vehicle for the transmission of tacit knowledge within the cluster
environment. Religious ties would provide a regular and frequent platform for both employers and
employees of different firms to meet informally and exchange knowledge, such as new product
designs or new product functions required by their customers. Family ties were also important in
that members of the same family would have a high level of trust among them, thus could
comfortably share any new knowledge.
Turning to codified knowledge, the findings in Chapter 5 clearly indicate that within the cluster
environment there was a large body of codified knowledge that was embodied within the owner-
managers as well as the artisans as separate and distinct epistemic communities. According to

129
Cowan and Foray (2000), a further distinction can be made between codified knowledge that is
articulated and for which a code book exists and unarticulated codified knowledge where „the
codebook‟ exists but is not evident and manifested to the outside observer (displaced codebook).
Evidence from these findings indicates that codified knowledge existing within Zimbabwe‟s cluster
environment was largely unarticulated because of the informal way in which it was being generated
and distributed. This is implied from the fact that most of the owner-managers stated that they did
not have any formal training in the carpentry trade with only eight per cent of them stating that they
had had such training. The knowledge that the owner-managers possessed was codified embedded
knowledge which they brought with them into the cluster from outside. This knowledge had been
acquired informally through their employment experience outside the cluster. Previous employment
experience outside the cluster was reported to range between eleven and sixteen years, with the
average being fourteen years, implying that most of the owner-managers had had extensive
experience outside the cluster environment. This knowledge was, however, unarticulated because it
had been acquired informally and not through formal training structures.
The findings also suggest that unarticulated codified knowledge was also being continuously
generated and passed on to the new and younger managers and other artisans within the cluster.
This is implied from the reported apprenticeship training system that was said to be managed by the
owner-managers. It was reported in Table 5.4 (Chapter 5) that sixty-two per cent of the owner-
managers had had previous experience as employees of other firms within the cluster before starting
their own entities. The average length of such experience was reported to be three years. This
therefore implies that the average length of the apprenticeship period in the cluster was also three
years. Thus, it was taking at least three years for the new owner-managers of firms and new
employees to acquire and codify the knowledge that was in the cluster.
The structure of the firm was reported to be very simple, as shown in Figure 5.4 in Chapter 5, with
the owner-manager being directly responsible for all functions such as procurement, financial
management and human resources management. However, one of the critical functions of the
owner-manager was reported to be the training of employees. These findings therefore imply that
the generation and diffusion of codified knowledge was being taken very seriously within the
cluster. The proper training of employees was critical to the survival of the firm in the cluster

130
environment because the stiff competition for customers meant that product quality was of
paramount importance. Thus, the owner-managers had to ensure that all the knowledge in their
possession was also passed on to the employees to become part of the body of codified knowledge
within the firm.
The findings from this study regarding the generation and diffusion of knowledge seem to strongly
dispute the claim made in previous studies on small-firm clusters that it is mere tacit knowledge
(available „in the air‟) which is acquired and shared by the firms in a cluster (Altenburg and Meyer-
Stamer,1999; Hodgkinson, 2007; Van Dijik and Rabellotti, 1997). The findings in this study seem
to point to the existence of a body of both tacit and codified knowledge that was being constantly
created and transmitted within the cluster in various ways. This then was a very strong factor
towards the competitive advantage of the firms vis-à-vis other small firms not located in clusters.
With respect to codified knowledge, though there was no written „code book‟, there were several
factors pointing to the existence of a „displaced codebook‟.
The whole cluster of 1 300 firms at the Glenview cluster can be regarded as an epistemic
community in relation to the outside world because the knowledge that they possessed was codified
and not freely available to any other entity outside the cluster. However, within the cluster itself,
there were other epistemic communities in the form of sub-clusters and sub-sub-clusters of firms
with their own knowledge which could be regarded as „codified‟ in relation to the other firms in the
cluster.
The Glenview cluster was made up of two main epistemic communities consisting of wood
furniture-making firms and steel furniture-making firms. The larger of these two was the wood
furniture-making community consisting of 910 firms or seventy per cent of the total size of the
cluster. Within the community of wood furniture makers, three other epistemic communities were
identified: a community of base-bed makers; a community of cabinet makers and a community of
sofa-set makers. The largest of these communities was the community of sofa-set makers which
consisted of 428 firms or thirty-three per cent of the total number of firms in the whole cluster.
Within the community of cabinet-makers, three other epistemic communities were identified,
consisting of makers of kitchen units, makers of wardrobes and makers of room dividers. The

131
largest of these epistemic communities was the community of room diver makers, which made up
fourteen per cent of the total number of firms in the cluster. The epistemic community of sofa-set
makers also had the largest distinct community consisting of firms making low-value sofa-sets (33
per cent of the total number of firms in the cluster). Details of the various epistemic communities at
the Glenview cluster are presented in Table 6.2 below.
Table 6.2: Epistemic communities of firms at the Glenview cluster
Wood Furniture n = 910 (70)
Base Beds n = 191 (15)
Cabinets (1) Kitchen Units [n = 29 (2)]
(2) Wardrobes [n = 81 (6)]
(3) Room Dividers [n = 181(14)
n = 291 (22)
Sofa-sets (1) High Value [n = 43 (3)
(2) Low Value [n = 385 (30)
n = 428 (33)
Steel Furniture n = 390 (30)
TOTAL N = 1 300 (100)
Since each epistemic community was reported to specialise in the production and sale of a
particular product, the members of each community had their own codified knowledge as a
community of firms which was not freely available to other firms outside that community. This
knowledge was being regularly acquired and codified in response to changing market demands in
the form of new product designs and new product functions. This new knowledge would not be
tacit or generic to the cluster as a whole as it was confined to the firms in that particular sub-cluster.
It was reported in Chapter 5 that all firms were flexible, in that they could make all products when
required to do so. The knowledge that they possessed in relation to the products that they did not
specialise in was, however, only tacit knowledge because they were not informed about the latest
demands of the market in relation to those products. Thus, each epistemic community possessed
only tacit (generic) knowledge in relation to the products made by other firms outside it and
codified knowledge in relation to the product that its own members specialised in. For example, if a
firm belonging to the sofa-set epistemic community was required to make kitchen units (a product

132
that it did not specialise in but had the skill to produce), it would need to consult with the firms that
normally made kitchen units so as to find out the current but codified knowledge related to that
product, since the knowledge that it possessed in the production of kitchen units would only be tacit
knowledge.
6.3.2.3 Strong versus weak ties among firms
Though it was reported that strong social ties existed among the employees and owner-managers of
different firms in the cluster, these findings clearly show that in fact, there were both weak and
strong linkages which existed between the firms.
The linkages between firms in different sub-clusters (epistemic communities) would be weak
because the firms in the different sub-clusters belonged to different epistemic communities with
their own stock of knowledge about the product that they specialised in. The artisans belonging to
different epistemic communities could share only the tacit knowledge that would be generic to the
cluster as a whole due to the weak linkages between their firms. For example, even though it was
reported that the artisans in the firms that specialise in cabinet-type furniture such as room dividers,
wardrobes and kitchen units, could also make sofa-sets or base beds, the knowledge that such
artisans may have about the making of sofa-sets or base beds would only be tacit and generic
knowledge due to the weak links between the three epistemic communities.
The existence of weak links and the knowledge that they transmitted is demonstrated in Figure 6.1
below.
Figure 6.1: Weak links between firms in different epistemic communities
WEAK LINKS
Sofa-sets
Cabinets Base-beds
Tacit knowledge

133
It was reported in Chapter 5 that most owner-managers (62 per cent) of the firms in the cluster were
former employees of other firms within the cluster who were also trained by the managers of other
firms making the same product before branching out to set up their own entities in the cluster. The
employees were also reported to be closely related by way of family ties and other social relations.
A former employee who branched out to set up another firm within the cluster would still maintain
the existing contacts with his or her former employer and colleagues in the same line of business.
These findings imply that the linkages between the firms in a particular sub-cluster or sub-sub-
cluster such as cabinet makers were therefore bound to be very strong.
The linkages between firms in the same sub-cluster such as cabinet makers or sofa-set makers, or
base bed makers, would be strong because the firms belonged in the same epistemic community,
sharing the same stock of knowledge about their product. Due to the strong linkages between their
firms, the stock of knowledge held by artisans belonging to the same epistemic community would
remain codified knowledge not available to any other artisan outside that community. The
knowledge held by artisans in the epistemic community of cabinet makers, for example, would be
more intricate and codified because they were always in day-to-day contact with the customers of
cabinet-type furniture.
A cluster consisting of strong and weak ties has been described as a „small world‟ (Granovetter,
1985; Goyal et al, 2006;Jackson and Rogers, 2006; Koka, 2006; Verpagen and Duysters, 2004; Uzi
and Shapiro, 2005). These studies have also shown that weak ties improve the speed with which
information is transmitted in a network by shortening the distance between the nodes in the
network. Thus, they bring strength to a network by improving the dissemination of information
throughout the network.
The three sub-clusters (Cluster 1, Cluster 2 and Cluster 3) shown in Figure 6.2 below, for example,
are epistemic communities with weak links between them. However, the firms in each cluster, such
as F1.1 and F1.2 or F2.1 and F2.2 would have very strong links with each other.

134
f
Figure 6.2: Strong and weak links between firms in different epistemic communities
WEAK LINKS
Cluster 1 Cluster 2 Cluster 3
.
F1.1 F1.2 F2.1 F2..2 F3.1 F3.2
STRONG LINKS
The findings from this study suggest that the small-firm cluster is also a „small world‟ because it
consists of many highly connected firms in sub-clusters and a few external links that connect each
sub-cluster to other sub-clusters.
The strength of the weak ties between firms in the cluster comes from the fact that, any new
codified knowledge must come from outside the sub-cluster through its weak ties with other sub-
clusters. The weak ties between firms in the cluster are of two types. Firstly a weak tie is created
when an artisan in a firm making cabinet type furniture, temporarily joins another firm making
sofa-sets. This artisan will bring back new codified knowledge on sofa sets to other artisans in his
own firm. Secondly a weak tie is also created when a firm contracts a specialist firm to perform a
routine in the transformation process of its product. A firm making cabinets might for example
contract another firm with a spindle molders to shape the panels of a cabinet. In this process, the
firm might also obtain new knowledge on current shapes and styles being used by other firms in the
cluster through the artisans in the specialist firm. In this way, the weak occasional links tend to
shorten the average distance between the firms.
In summary, the weak occasional links between firms in the cluster resulted from the following
activities of the firms:
135
the occasional hiring of some artisans from the common pool in the cluster;
the temporary employment of the firm‟s own artisans by other firms in the cluster;
co-operation between otherwise competing firms in a bid to meet large and urgent orders;
and
the purchasing of the output of production routines or machine-time for certain production
routines from the „specialist firms‟ in the cluster.
These links provided competitive strength to the cluster by enabling the constant acquisition and
diffusion of both tacit and codified knowledge to take place.
6.4. Sales and marketing management
The functioning of the cluster was also reported in terms of the way in which the firms were
managing their sales and marketing functions. These findings provide some indications about the
orientation of the firms towards the marketplace or the way in which they were approaching the
market with their products. The findings also have an implication on the competitive strategy and
the marketing strategy. These issues are explained below.
6.4.1. The marketing approach used by the firms
The finding that the firms did not have any programmes to actively market their products suggests
that they had a „product orientation‟ as opposed to a „marketing orientation‟ towards the selling of
their products (Kotler et al, 2009). A „product orientation‟ approach is based on the belief that the
firm will always be able to sell its products as long as they are reasonably priced. The assumption
behind this being that customers would always be available for the firm‟s products and therefore
finding customers for the product would be a minor function. The prevalence of this approach
among the firms in the cluster is evidenced by the emphasis of the firms on cost control and
efficiency in production.
It can, however, be argued that this approach would be difficult to maintain in the long run, given
the very competitive nature of the cluster environment whereby the customer was faced with a
wide choice of products (up to twenty different product types) among many producers. Under such

136
circumstances most firms would find it difficult to sell their products without making any further
effort to market them. Success in the marketplace would not necessarily be assured by just offering
better products. After realising this possibility, some firms had made conscious efforts to move
away from this basic approach to a „sales orientation‟ approach which entailed the adoption of more
aggressive tactics in selling and promoting the product. Evidence of this development is provided
by the fact that most firms had added the position of a sales officer to their organisation structure.
Further, the remuneration of the sales officer was commission-based as a way of incentivising the
sales officers to push sales to the maximum.
Though a „sales orientation‟ can be said to be an improvement on „product orientation‟ to the
marketing of the firm‟s products, the firms in the cluster still had not yet adopted a „marketing
approach‟, an approach that would require that the firms put their consumers at the centre of all
their efforts and activities by finding out what they wanted through the use of market research
programmes (Kotler et al, 2009).
6.4.2 The competitive strategy of the firms
Since the consumers of the products made by the firms in the cluster were reported to be low-
income consumers and small retailers, it was natural for the firms to follow a „low-cost‟ competitive
strategy which required the firms to strive to produce their products at the lowest possible cost so as
to minimise the selling price and gain market share. This strategy was necessary because of the
price competition among the firms and also because the products sold were essentially standardised
from firm to firm, with very little variations. Further, because of the presence of many firms in the
cluster, the buyers of the products would incur low switching costs in changing from one seller to
another, implying that firms with comparatively high priced products would not be able to sell
them.
Several factors can be identified as being responsible for the success of this strategy for the small
firms operating in clusters. Firstly, it was a „focused‟ low-cost strategy in that the firms chose to
focus on a narrow portion of the market (low-income consumers) rather than going for the whole
furniture market. The low-income market served by the firms had consumers with their own
distinctive preferences or requirements which were less costly to satisfy compared to the rest of the
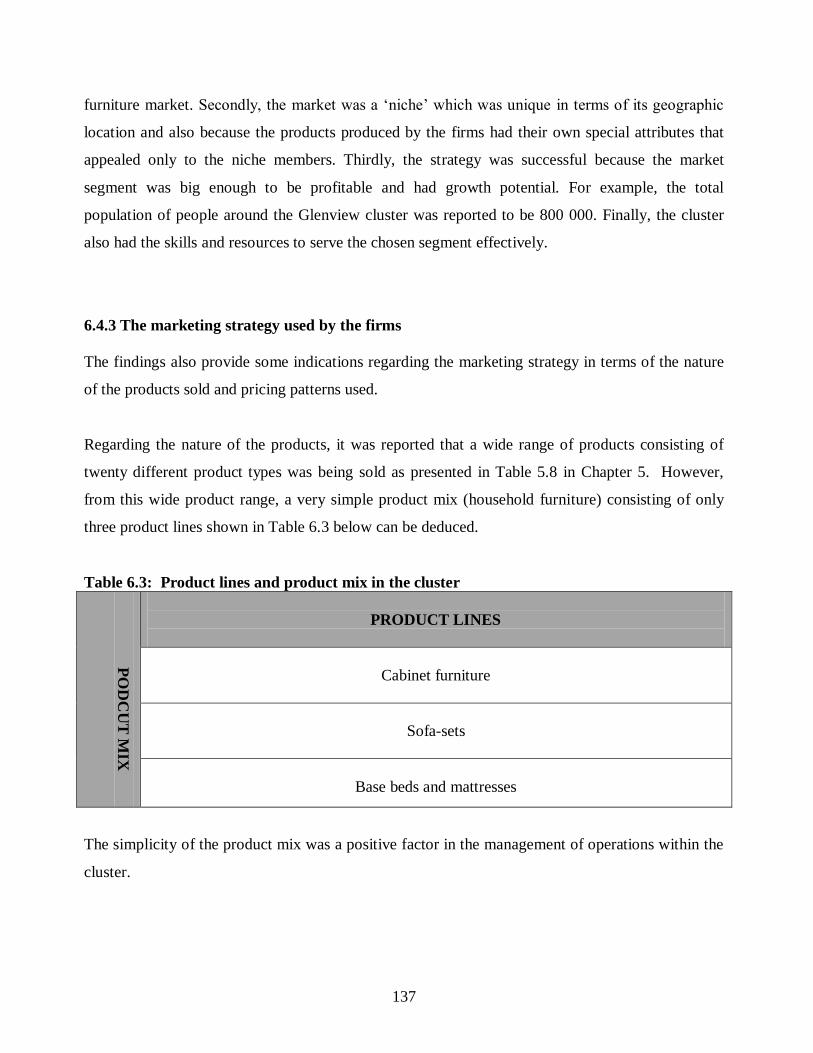
137
furniture market. Secondly, the market was a „niche‟ which was unique in terms of its geographic
location and also because the products produced by the firms had their own special attributes that
appealed only to the niche members. Thirdly, the strategy was successful because the market
segment was big enough to be profitable and had growth potential. For example, the total
population of people around the Glenview cluster was reported to be 800 000. Finally, the cluster
also had the skills and resources to serve the chosen segment effectively.
6.4.3 The marketing strategy used by the firms
The findings also provide some indications regarding the marketing strategy in terms of the nature
of the products sold and pricing patterns used.
Regarding the nature of the products, it was reported that a wide range of products consisting of
twenty different product types was being sold as presented in Table 5.8 in Chapter 5. However,
from this wide product range, a very simple product mix (household furniture) consisting of only
three product lines shown in Table 6.3 below can be deduced.
Table 6.3: Product lines and product mix in the cluster
PO
DC
UT
MIX
PRODUCT LINES
Cabinet furniture
Sofa-sets
Base beds and mattresses
The simplicity of the product mix was a positive factor in the management of operations within the
cluster.

138
Considering that the decision to buy household furniture is an important family decision, especially
for low-income people, it is important to assess those factors that the consumers would evaluate
when deciding whether to buy the products produced by the firms in the cluster. Some factors
would have a positive influence on the consumer‟s purchase decision while others would have a
negative influence. These factors could be considered as the value package of the product sold by
the firm or the total impression given by the product. From the findings, it would appear that the
value package of the products sold in the cluster environment consisted of the factors presented in
Table 6.4 below.
Table 6.4: Product value package
Value package item Assessment
Price of products Affordable for the consumers – positive
Accessibility of products to consumers Cluster located close to customers, though
cluster area too crowded - positive
Speed of delivery of product to customer Transport available and affordable - positive
Buying atmosphere Highly competitive – positive
Guarantee for product workmanship No product guarantees available – negative
Product brand name Use of popular brand names – positive
The analysis above shows that there were several positive factors that tended to enhance the value
of the product offered to the consumer. The prices of the products were generally affordable and the
availability of transport, made it possible to speedily deliver products to customers. The types of
products sold in the cluster could be described as „shopping goods‟. The cluster environment could
be likened to a „shopping centre‟ in which consumers would „shop around‟ and buy a product only
after comparing value, quality and price from the variety of sellers in the cluster. Because the
consumers were able to carefully compare the products before making a purchase decision, the
firms were forced to emphasize price, quality or service differences in selling their products. All
these factors added up to a pleasant buying atmosphere.
Other factors, however, such as the inaccessibility of the area and lack of product guarantees
seemed to impact negatively on the value of the product.
Brand equity is the combination of factors, such as awareness, loyalty, perceived quality, images
and emotions that people would associate with the goods sold in the cluster. The most important of

139
these factors is brand loyalty, which is the degree to which customers are committed to the brand.
The loyal group of customers around the cluster area represented substantial value to the
cluster.There was a certain amount of brand equity in the products sold in the cluster as was evident
from the findings, especially with respect to sofa-sets. The sofa-sets had been given brand names as
shown in Table 5.8 in Chapter 5. Though these names were not unique to the cluster, they tended to
serve the purpose of identifying the products sold in the cluster and distinguishing them from the
products sold by firms outside the cluster. These brand names were, however, generic in the sense
that they did not belong to any particular firm in the cluster but to the cluster as a whole, such that
each firm was free to use them.
Product pricing was another part of the marketing mix responsible for the success of the firms in the
cluster though there was a noticeable amount of variability in the pricing of the products within the
three product lines. The prices were generally low. The highest prices were found in the sofa set
line where there were two distinct price categories. One of the categories consisted of highly priced
sets which were being sold at an average price of $825 each. In this category, the highest priced set
was the „Culture‟ which was being sold for $1000 on average. The other category consisted of
lowly priced sets which were being sold at an average price of $300 each and in this category, the
lowest priced set was the „St. James‟, which was being sold at an average price of $280 per set. The
lowest prices were found in the base bed product line were a single bed with a spring mattress was
being sold for only $75. The average selling price for all the products in the cluster was $300.
The average mark-up on cost was twenty-eight per cent, implying that the firms were charging a
selling price of $1.28 on a product that would have cost them $1.00 to make. Thus, if the cost of
making a sofa-set was $284, as reported in Table 5.17 in Chapter 5, the selling price would be $364
after adding a mark-up of twenty-eight per cent to the cost. Under the very competitive environment
of the cluster, the average mark-up would tend to be low, since high mark-ups would lead to high
and uncompetitive selling prices for a firm‟s products. The highest mark-up percentages were in the
high-price sofa-set category where the average mark-up was fifty-five per cent on average. The rest
of the products had relatively low mark-up percentages ranging from seventeen to thirty-three per
cent.

140
There was also a noticeable difference between the prices charged to retail customers (direct
consumers) and wholesale customers (bulk purchasers). The average selling price to retail
customers was $300 whereas the average price for wholesale customers was $275.
The pricing structure and the mark-up percentages described above imply that the sofa set product
line was targeted at two distinct market segments consisting of a market for high-priced products
and a market for low-priced products. However, the bulk of the products sold in the cluster were
targeted at customers seeking low-priced products. There was also a distinct market segment
consisting of wholesale buyers. These were the buyers coming from areas outside the city in which
the cluster was located.
The pricing structure reported by the firms seems to suggest that the firms had two objectives in
pricing their products: sales maximisation and market penetration. These pricing objectives would
be achieved by producing products that would attract more customers and discourage large
competitors selling furniture in and around the vicinity of the cluster.
The firms were also reported to be using a cost-based pricing method wherein the cost was being
used as the primary basis for setting the price. This could, however, be detrimental to the survival of
the cluster in the long-term because the question that might arise is whether these prices would
remain satisfactory to the customers as well, bearing in mind that in the long-run it is the market
that determines the price of a product, not the producer. A cost-driven strategy could therefore
result in a loss of market share to large producers outside the cluster. Alternatively, the firms could
use price-led costing, a strategy that requires that they first determine what the market was willing
to pay before pricing the product.
The pricing strategy reported with respect to the sofa-set product line seems to suggest that a value
pricing strategy was being used whereby the firms were successfully providing consumers with
brand-name products at fair prices by redesigning the products and cutting costs. The reported
brand names, such as „Madeira‟, „Culture‟, „St. James‟ and „Hamilcourt‟ were common names in
the furniture industry which had been successfully adopted by the firms in the cluster. This was
evidenced by the fact that all the four names were found in all the eight clusters in different cities.

141
A value pricing strategy is superior to the other strategies in that it can be used to achieve both
pricing objectives of maximising sales and market penetration.
With respect to the distribution of the products, the findings suggest the existence of two simple
channels as illustrated in Figure 6.3 below.
Figure 6.3: Distribution channels
Channel (a)
Channel (b)
The first type of channel, Channel (a), consisted of those buyers who came directly to the cluster to
buy their furniture products whereas the second channel, Channel (b), consisted of those buyers
who came to the cluster to buy furniture products with the intention of reselling them to other
consumers, thus acting as intermediaries between the firm and the consumer. Intermediaries
perform certain marketing tasks such as transportation, storage, selling and advertising more
efficiently and effectively than the manufacturer could. They also play the role of creating exchange
efficiency by reducing the number of exchange relationships when they buy from several suppliers
at the same time. The intermediaries in Channel (b) are attracted to the cluster because, as distant
buyers they find a variety of furniture products on offer in one place.
6.5. Financial management
Finally, the growth and dynamism of small-firm clusters in Zimbabwe can also be explained
through an analysis of the findings on the way in which the firms were managing the capital
invested in them.
The findings seem to indicate that as a collective, the firms in the cluster were managing their
financial resources relatively more efficiently in creating revenues and profits than other firms,
Manufacturer Consumers
Manufacturer Retailer Consumers

142
though individually they appeared to be less efficient. The efficiency with which the firms were
managing the capital invested in them, was analysed using the measures presented in Table 6.5
below (Brigham and Gapenski, 2005; van Horne, 2006 and Atrill, 2009).
Table 6.5: Measures of efficiency in financial management
Measure How calculated
Return on Capital Employed (ROCE), Operating Profit ÷ Total capital x 100
Total Assets Turnover Rate (TAT), Sales ÷ Total Assets x 100
Gross Profit Margin (GPM), Gross Profit ÷ Sales x 100
Operating Margin (OPM) Operating Profit ÷ Sales x 100
Mark-up on cost (Mark-up) Gross Profit ÷ Cost of Sales x 100
The ROCE was used to measure the efficiency with which the firms were utilizing the capital
invested in their assets to create profits. A low ROCE indicated that the firms were not generating
sufficient profits from the capital invested in their assets. This could be attributed to the inefficient
management of operating expenses (van Horne, 2006). The TAT was used to measure the
efficiency with which the firms were utilising their assets to generate revenue. A low TAT indicated
that the firms had idle capacity in that they had invested a disproportionate amount of capital in
assets relative to the revenue being generated by those assets. A low TAT could therefore imply
that the firms were not utilising the assets that had been financed by the available capital resources
efficiently enough to generate revenues (Brigham and Gapenski, 2005; van Horne, 2006).
The GPM was used to measure the amount of profit that the firms were able to generate from a
dollar of sales. Large sales volumes do not necessarily translate into high profits. Thus, a low GPM
was used to indicate that the firms were failing to control their production costs (the cost of labour,
materials and other production expenses). A low GPM would also indicate that the firms were not
generating sufficient sales volumes and that the production costs were too high relative to the sales
being generated. The OPM was used as a measure of the efficiency with which the firms were
managing their operating expenses. A low OPM would imply that the operating expenses were too
high relative to the level of sales being generated, resulting in low profits (Atrill, 2009).

143
Applying the efficiency measures in Table 6.5 above to the data contained in the balance sheet
presented in Table 5.12 in Chapter 5 and the income statement presented in Table 5.18 also in
Chapter 5, the following results would be obtained.
Table 6.6: Efficiency in financial management by small firms located in the cluster
ROCE TAT GPM OPM Mark-up
10% 69% 22% 14% 28%
6.5.1 Efficiency in utilizing capital to create profits (ROCE)
The ROCE of ten per cent in Table 6.6 above implies that the average firm in the cluster was
generating an operating profit of $10 on every $100 of capital invested in the business. This amount
of profit appears to be very low relative to the amount of capital invested in the assets, implying an
inefficient use of capital by the firms.
The reason for the low ROCE can be revealed by a further analysis of the balance sheet in Table
5.12 in Chapter 5, which shows that the bulk of the capital in each firm (97 per cent) was invested
in current assets (debtors and stocks, with a very insignificant amount of cash). Most of this capital
(68 per cent) was invested in stocks, which were reported to be mainly finished goods and work-in-
progress. The firms did not have any stock of raw materials since it was reported that they were
using a just-in-time inventory management system of procurement. Referring to the data in Table
5.11 in Chapter 5, which shows the average stock level, held by the firm, it is clear that the bulk of
the stock (78 per cent) was in the form of finished goods. This therefore implies that the bulk of the
firm‟s capital (53 per cent) was invested in stocks of finished goods.
Why were the firms investing their capital mainly in finished goods? The answer to this question
could be that the operating environment of the cluster in which a large number of firms located in
close proximity to each other were competing for customers, most of whom were low-income
consumers with infrequent purchasing patterns, resulted in low demand for the products of each
individual firm. This explains why the bulk of their capital was invested in finished goods and is not
necessarily a reflection of inefficient investment policies on the part of the firms.

144
6.5.2 Efficiency in utilizing capital to create revenues (TAT)
The TAT of sixty-nine per cent in Table 6.6 above implies that the firms in the cluster were
generating revenues of $69 on every $100 of assets financed by the capital available to them. This
low TAT would seem to indicate that the firms had considerable amounts of idle capacity in that
thirty-nine per cent of the assets were not being effectively used in revenue generation.
A further analysis of the findings, however, would suggest that the apparently low TAT reported by
the individual firm was not the actual TAT for the whole cluster. This can be deduced from the
structure of the balance sheet presented in Table 5.12 which shows that the bulk of each firm‟s
capital (97 per cent) was invested in short-term assets, such as stocks, debtors and cash, with only
three per cent having been invested in long-term assets such as plant and machinery.
The reason for this low investment in long-term assets by each firm was that the firms directly
involved in the production and sale of furniture (the production units) stated that their firms did not
have to buy long-term assets in order to carry out most of the routines in their production processes.
It was reported that the production units only invested $200 on average to buy small hand tools and
equipment. Instead, they simply bought the output of such routines from other firms within the
cluster or paid for the machine-time required to perform the routines from the firms that specialised
in those routines. Forty-five such firms were identified in the Glenview cluster.
Table 5.9 in Chapter 5 presents the list of long-term assets and their values in which it is shown that
each of these specialist firms would require capital of $14 450 to finance these assets. This implies
that a total of $650 250 had actually been invested by the forty-five „specialist firms‟ towards the
financing of the assets used by the rest of the firms in the cluster. These then were the actual
collective assets of the cluster.
As shown in the income statement presented in Table 5.18 (Chapter 5), the average monthly
revenue generated by each firm was reported to be $4 250, implying that the total collective sales
generated by the 1 300 furniture making firms (excluding other firms carrying out ancillary
activities) in the whole cluster would be $5 525 000.

145
The above figures would imply that the TAT for the cluster as a collective of firms would therefore
be 850 per cent, based on the total collective assets of $650 250 and the total collective revenues of
$5 525 000 for the whole cluster. The collective TAT of 850 per cent indicates that the cluster itself
was collectively generating $850 of sales from $100 of capital invested in assets whereas
individually the firms were generating only $69 from the same amount of capital. This collective
TAT implies that the cluster as a collective of firms was much more efficient in utilising the
invested capital in generating revenues compared to the individual firms in the cluster.
6.5.3 Efficiency in generating profits from sales (GPM)
The figures in Table 6.6 above seem to suggest that the firms were incurring very high production
costs relative to the revenue they were generating, resulting in an apparent lack of efficiency in
generating profit from sales. The GPM of twenty-two per cent indicates that the average firm in the
cluster was generating $22 of gross profit from every $100 of revenue generated, implying that an
amount of $78 per $100 of the revenue was going towards production costs (the cost of labour,
materials and other production-related expenses).
The source of these is apparent inefficiencies can be traced to the structure of the income statement
presented in Table 5.18 in Chapter 5. An analysis of the income statement shows that the bulk of
the production costs (64 per cent) were being taken up by the cost of materials, with only fourteen
per cent going towards the cost of labour. This implies that the main source of the high production
costs was in the procurement and use of materials. The reason for this can be found from a further
analysis of Table 5.17 (Chapter 5), which contains a breakdown of the cost of making a sofa-set.
The data in this table shows that the high cost of production was being driven by the cost of fabric,
foam rubber and springs.
A further analysis of the materials cost is presented in Table 6.7 below. This analysis shows that
fabrics contributed the highest percentage (27 per cent) towards the cost of materials. This was
followed by the cost of foam rubber, which contributed twenty-three per cent and springs, which
contributed twenty-one per cent.

146
Table 6.7: Breakdown of materials cost: sofa-sets
Fabric Foam Rubber Springs Cotton Timber Panels Nails, etc
27% 23% 21% 11% 9% 5% 4%
These figures imply that though the firms could skimp and save on the cost of materials such as
timber and cotton by using low-cost materials, this would not be possible with respect to fabric,
foam rubber and springs. The reason for this was that due to the highly competitive environment of
the cluster, the firms were being forced to purchase fabrics and foam rubber of high quality. The
drivers of product quality in the case of sofa sets would be the quality of the fabric used to cover the
product, the comfort level provided by the amount of foam rubber as well as the number of springs
used on the seats, implying that the cost of these materials was largely „uncontrollable‟ for the firm.
6.5.4 Efficiency in managing operating expenses (OPM)
The OPM of fourteen per cent in Table 6.5 above, implies that the firms were generating an
average of $14 in operating profit from every $100 of sales, indicating that the other $86 was being
taken up by the cost of production plus operating expenses (selling, distribution and administration
expenses). An analysis of these results, showing the distribution of $100 of sales to the production
and operating expenses and the profit generated there from is presented in Table 6.8.
Table 6.8: Profit generated from a dollar of sales r
ITEM VALUE ($)
Sales
Cost of sales: Labour
: Materials
Gross Profit
Operating expenses
Operating profit
100,00
(14,00)
(64,00)
22,00
(8,00)
14,00
The figures in Table 6.8 above indicate that the owners of the firms were receiving an amount of
$14 from a sale of $100. The balance of $86 was being taken up by the cost of labour ($14), the

147
cost of materials ($64) and selling and administration expenses ($8). This analysis shows that
materials (timber and cotton) were absorbing the bulk of the revenue generated by the firm. As
shown in the income statement in Table 5.18 in Chapter 5, the firms did not incur any distribution
cost as it was reported that they did not have to distribute their product. Distribution was being done
by other transport operators located in the cluster. The amount of $14 attributable to the owner of
the firm appears to be very low, suggesting that generally, the firms were not operating in an
efficient manner.
6.5.5 Efficiency of small firms versus large, stock exchange-listed firms in Zimbabwe
This analysis of the findings from the study, seem to suggest that small firms located in clusters
were not very efficient in the manner in which they were utilising the capital invested in them to
generate revenues and profits and were also not generating sufficient profits from a dollar of sales.
To put these findings into their proper context however, it was necessary to compare the
performance of the cluster of small firms with that of other firms in Zimbabwe. The financial
statements of the firms listed in Table 6.9 below were used for the purpose of making this
comparison.
Table 6.9: Some companies listed on the Zimbabwe Stock Exchange
Company name Brief description
African Distillers Limited Manufacturer of wines and spirits
African Sun Limited Management of Hotels and leisure resorts
AICO Africa Limited Manufacturer of Agro-industrial products
DAIRIBOARD Limited Manufacturer of milk and dairy products
CAFCA Limited Manufacturer of electrical power cables
INSCOR Zimbabwe Limited Manufacturer of foods and meat products
PG Industries Limited Construction and timber merchants
National Foods Limited Processor of agricultural foods
Murray and Roberts Limited Large construction company
A comparative analysis of the financial statements of large firms and the small firms located in
clusters indicates that the return on capital employed (ROCE) and the total assets turnover (TAT)
rates for the small firms were higher than those of the larger firms. This implies that the small firms
located in the cluster were more efficient than the large stock exchange-listed firms in the manner in

148
which they were utilizing the available capital to create revenues and profits. The small firms were
operating from a very small capital base compared to the larger firms, but they used it more
efficiently compared to the larger firms.
The summary data for the manufacturing firms listed in Table 6.10 above that was extracted from
their Annual Reports for 2010 is presented in Table 6.10below.
Table 6.10: Efficiency in capital utilization by large, stock exchange-listed firms in Zimbabwe
Company Name ROCE
%
TAT
%
GPM
%
OPM
%
Mark-up
%
African Distillers Limited -26 104 24 -20 32
African Sun Limited -9 108 64 -11 78
AICO Africa Limited 6 122 33 8 49
DAIRIBOARD Limited 9 139 32 10 47
CAFCA Limited 11 151 23 4 30
INSCOR Zimbabwe Limited 11 190 34 7 52
PG Industries Limited -27 82 26 -18 35
National Foods Limited 2 210 24 1 31
Murray and Roberts Limited -8 78 24 -13 41
Average -3 132 32 -4 44
Source: Annual Reports, 2010
The average ROCE for the small firms was found to be ten per cent (Table 6.6), compared to the
negative return of minus three percent for the larger firms presented in Table 6.10 above. These
figures imply that the small firms were generating a return of $10 on every $100 of invested capital,
whereas the large firms were losing $3 on every $100 of invested capital invested in them.
At sixty-nine per cent, the TAT for the small firms (Table 6.6) implies that they were generating
revenues of $69from every $100of assets. The figures in Table 6.10 above, however, indicate that
the large firms were generating revenues of $132 from the same amount of assets. In this regard,
they were therefore more efficient than the smaller firms.
This apparent efficiency on the part of the large firms is, however, misleading as can be revealed
from a comparison of the mark-up percentages. Though the TAT for the large firms was

149
considerably higher, this was not being translated into profitability because the large firms were not
managing their operations as efficiently as the small firms. The inefficiencies of the large
manufacturing firms relative to the small firms located in the cluster are summarized in the data
contained in Table 6.11 below which shows the way in which $100 of sales was being distributed
and the resultant operating profit.
Table 6.11: Efficiency of small firms compared to large firms
SMALL FIRMS IN
CLUSTERS
STOCK EXCHANGE-LISTED
FIRMS
Item Value ($)
Sales
Cost of sales
Gross Profit
Operating expenses
Operating profit
100,00
(78,00)
22,00
(8,00)
14,00
100,00
(68,00)
32,00
(36,00)
- 4,00
Table 6.11 above shows that the small firms generated more profit from a dollar of sales and were
more efficient in managing their operating expenses compared to the larger firms. The small firms
generated a profit of $14 per every $100 of sales whereas the large firms generated an average loss
of $4 per $100 of sales. This was because the operating costs for the small firms were lower, at only
$8 per every $100 of sales, compared to those for the larger firms, which were $36.
The large firms tended to compensate for their inefficiencies by placing higher mark-up percentages
on their products compared to the small firms. The mark-up for small firms (Table 6.5, page 36)
shows that the small firms were charging $1,28 for a product that would have cost them $1,00 to
make, whereas the large firms would charge $1,44 for the same product (Table 6.9, page 41). This
tended to result in higher gross profit margins for the large firms which are not reflective of the way
in which the firms were managing their production costs (cost of labour, materials and production
overhead expenses).

150
6.5.6 Drivers of small-firm efficiency
The analysis of the findings seemed to indicate that the capital utilisation rates and operating
efficiencies of small firms located in clusters were relatively higher than those of large, stock
exchange-listed firms in Zimbabwe. As a way of finding out why this was the case, an analysis of
the relationship between the capital utilisation rates and operating efficiencies for both groups of
firms was carried out using the „DuPont Return on Assets‟ (Brigham and Gapenski, 2005)
presented in Table 6.12.
Table 6.12: DuPont Return on Assets
DuPont Return on Assets = Total Assets Turnover x Operating Margin
According to Brigham and Gapenski (2005), the DuPont Return on Assets (DROA) is a measure
which says that the earning power of a firm‟s assets is driven by the efficiency with which the
assets are being used to generate sales (TAT) and the efficiency with which the firm is managing its
operating expenses (OPM). In order to maximize the earning power of the assets, the firm must
maximize both the amount of sales generated from a dollar of capital invested in assets and the
amount of profit generated from a dollar of sales. If the TAT is higher than the OPM, the
implication is that the earning power of the firm‟s assets is being driven mainly by the efficiency
with which the assets are being used to generate sales. However, if the OPM is higher than the
TAT, the implication is that the earning power of the firm‟s assets is being driven mainly by the
efficiency with which it is managing its operating expenses.
Table 6.13 below presents the relative drivers of efficiency for both large firms and small firms
located in clusters using the DROA.

151
Table 6.13: Drivers of efficiency for small firms and large firms
TYPE OF FIRM DROA= TAT x OPM
Small firms in clusters 0.097= 0.69 x 0.14
Large, stock exchange-listed firms -0.03= 1.32 x -0.04
The analysis in Table 6.13 above shows that the main driver of efficiency for both large and small
firms was the total assets turnover rate (TAT), rather than the operating margin (OPM). Due to the
harsh economic environment and the general scarcity of investment capital, firms in Zimbabwe
were being forced to „sweat‟ the available assets by maximizing the amount of revenue generated
per dollar of capital invested in the assets. This was reflected by the high TAT reported by both
groups of firms.
As shown in Table 6.13 above, large firms were generating sales of $1.32 from every dollar of
assets whereas small firms were generating only 69 cents as shown in Table 6.5 on page 36. The
positive effects of high assets utilization rates for large firms were however eroded by the effects of
operating inefficiencies which resulted in negative operating margins. On the other hand, the
relatively low assets utilization rates for the small firms were enhanced by superior operating
efficiencies which resulted in high and positive operating margins. As a result, small firms
generated a positive return on capital invested (10%) compared to the negative return of minus three
per cent generated by the large firms.
This analysis clearly indicates that small firms, particularly those located in clusters, were using
their invested capital relatively more efficiently than large firms, though they were operating from a
relatively very low capital base. This is because they were more efficient in managing their
operating expenses than large firms, though they were incurring higher production costs.
6.6. Conclusion
The analysis carried out in this chapter has clearly demonstrated that Zimbabwe‟s small-firm
clusters were making a significant contribution towards the economic prosperity of the country
through employment creation and income generation. It has also been shown that the characteristics

152
of the industry, the firms, their owners and employees make the clusters unique business entities
that are dynamic and have the potential to grow even further. The reasons for this dynamism and
growth potential lies in the manner in which essential business functions are being organized and
also the nature of the operating environment which allows for the continuous acquisition and
transmission of knowledge within the cluster.
The next chapter rounds off the study by drawing some conclusions regarding the nature of the
entrepreneurial activities of small firms located in clusters and making some recommendations on
how such entrepreneurship can be nurtured in future.

153
Chapter 7
Conclusions and recommendations
7.0 Introduction
This study is set out to determine the nature and significance of small-firm agglomeration (small
firms located in industrial clusters) in Zimbabwe and to recommend the policy measures that might
be required to foster the growth and competitiveness of the firms. In line with these objectives, this
chapter concludes the study by drawing some conclusions from the findings presented and analysed
in Chapter 5 and Chapter 6 and making some recommendations from them.
7.1 Conclusions
Three major conclusions can be drawn from the study. These are summarised below:
The network of small-firm clusters in Zimbabwe is extensive, significant and growing
rapidly, but the firms in the clusters are very small (micro-enterprises).
Though they consist of micro-enterprises, Zimbabwe‟s small-firm clusters require policy
intervention because they possess certain collective attributes that place them at an
advantage over other SMEs. For these interventions to succeed however three factors that
negatively impact on the competitiveness of the firms need to be addressed and these are:
limited access to technology; limited access to markets and limited access to capital.
The small-firm clusters in Zimbabwe possess the characteristics of complex adaptive
systems (phenomena with emergent properties).
These conclusions are further explained below.

154
7.1.1 The network of small-firm clusters in Zimbabwe is extensive, significant and is growing
rapidly, but the firms in the clusters are very small (micro-enterprises)
The first and most significant conclusion is that Zimbabwe has an extensive network of small-firm
industrial clusters in all its five major cities, including the large town of Chitungiwiza, which is
close to Harare. The distribution of the clusters in terms of size is however, skewed in that Harare‟s
Glenview cluster is by far the largest of the eight clusters identified, with more than sixty-seven per
cent of the total number of firms.
The clusters have contributed, and continue to contribute, significantly to the economy by way of
employment creation and income generation. They have also contributed to the improvement of the
general welfare of thousands of low-income families as the business entities in these clusters belong
to otherwise low-income people and are located close to low-income residential areas. Thus, from a
social welfare point of view, it is incumbent upon policy makers to consider initiatives that foster
the dynamism of small-firm clusters in Zimbabwe and as such, measures could go a long way in
reducing poverty and unemployment and increasing income levels in general.
The Government of Zimbabwe‟s Ministry of Small and Medium Enterprise Development
(MSMED) acknowledges the existence of three categories of small firms in Zimbabwe: small,
micro, and medium-scale enterprises (SMME). According to MSMED, a micro-enterprise is an
entity that is not formalized through a legal structure such as registration in terms of the Zimbabwe
Companies Act (Chapter 190), or a Partnership Agreement and employs less than five persons. A
small-scale enterprise is one that is formally registered and employs less than fifty persons whilst a
medium-scale enterprise (besides being also formally registered) employs more than fifty but less
than seventy-five persons (Government of Zimbabwe, 1999).
It can be concluded from the findings in this study that, according to the MSMED definitions, the
small firms found in Zimbabwe‟s clusters can neither be described as small nor medium-scale
enterprises (SMEs) but as micro-enterprises. The firms have the following attributes which make
them micro-enterprises. They are not registered in terms of the Companies Act (Chapter 190) and
employ a very small number of people (five persons on average). Additionally, judging by the

155
amount of capital employed per firm ($6 200), they are micro-enterprises relative to the size of
other firms such as those that are listed on the Zimbabwe Stock Exchange.
7.1.2 Zimbabwe’s small-firm clusters are worthy candidates for policy intervention because
they possess certain collective attributes that place them at an advantage over other SMEs.
The conclusion that Zimbabwe‟s small firms in clusters are “micro-enterprises” raises the question
of whether such firms, due to their size, deserve any attention at all and if so what type of
intervention would be required to improve their competitiveness. The suggestion that small firms
in general (SMEs) should be singled out for special attention in development policies is still a
contentious issue given that despite the existence of a wide variety of programmes intended to assist
such enterprises in many countries, the success rate of such policies has been rather disappointing
(Hallberg, 2003). On this basis, it might therefore be argued that public intervention directed at
Zimbabwe‟s micro-enterprises located in industrial clusters may not be justified.
Though the firms in clusters are by definition “micro-enterprises” and thus appear to be
comparatively insignificant individually in terms of size, they have two distinct advantages over the
other categories of small firms (SMEs) which make them well-placed to take up a significant role
in the future growth of the economy. These are:
a. The locational and historical factors. The location and history of the firms in the clusters
result in the following advantages:
The territorial specificity (firms in one geographical location specialising in one activity) of
the clusters which makes the firms economically and geographically „visible‟ entities
compared to other small firms that are otherwise scattered all over the economic and
geographic landscape;
A shared history and shared experiences among the firms which make the cluster a cohesive
social unit; and

156
the geographical proximity of the firms to their markets, which reduces costs and provides
convenience to the customers.
b. The characteristics of the firms and the clusters. The clusters in Zimbabwe have the
following important characteristics:
the existence of a common pool of skilled labour from which all the firms can tape their
labour requirements;
the constant acquisition and diffusion of knowledge among the firms which results in a short
learning curve for new entrants into the industry;
a relatively high level of experience among the owner-managers and the relatively high level
of formal education among the employees which means that there is a certain level of skills
and knowledge which was brought into the cluster and can easily be passed on to other
cluster members;
a well-developed human resources management system based on close social ties among the
employees and owner-managers which results in harmonious labour relations, flexible
recruitment systems and the minimisation of employee costs;
a well-developed production operations management system which is based on horizontal
and vertical cooperation, flexible specialisation and division of labour that enables the
constant acquisition of knowledge and its diffusion throughout the cluster;
a well-developed sales and marketing management system based on a low-cost, niche
marketing and value-pricing strategy which enables the firms to serve a distinct market of
loyal customers; and
a well-developed financial management system which enables the firms to collectively
employ the capital invested in them efficiently and profitably.

157
The policy framework for upgrading the competitiveness of SMEs in Zimbabwe is already in place
and their role in the future of the country‟s economy is well acknowledged. For example, in the
monetary statement of March, 2012, the Reserve Bank of Zimbabwe (RBZ) noted that as the
economy was forecast to continue on a growth trajectory from a negative rate of fourteen per cent
per year in 2009 to a positive growth rate of nine per cent per year in 2012, SMEs had the potential
to contribute up to seventy-five per cent of the Gross Domestic Product (GDP). The Government of
Zimbabwe Medium Term Plan (MTP) for 2011 to 2015 (GoZ, 2011) and the Industrial
Development and National Trade Policy of 2012-16 prepared by the Ministry of Industry and
Commerce (GoZ, 2012), also acknowledge the importance of small firms in Zimbabwe‟s future.
The Small Enterprises Development Corporation Amendment Act (Chapter 24:12) which was
promulgated in March 2012, also paved the way for the establishment of a Small and Medium
Enterprise Advisory Council whose role is to advise Government on matters relating to SMEs. This
also led to the establishment of a Small and Medium Enterprises Fund with the mandate of
promoting and facilitating the access of SMEs to capital and increasing bilateral and regional
investment prospects for SMEs in Zimbabwe.
Lessons could also be drawn from the examples of initiatives that have been made to improve the
competitiveness of small firms in clusters in other countries. In some Asian countries, for example,
such initiatives were directed to those clusters that specialise in the “local treasure” or natural
resource of a community. The purpose of these initiatives was to improve the quality of the product
that was being produced by the firms in the cluster (the local “treasure”), using a management
practice known as kaizen (incremental efforts to improve quality). It was envisioned that quality
improvements would also enable the small firms to participate on the global value chain through
exporting their products to other countries. Examples of such initiatives include the One Village
One Product model in Japan, the One Village One Treasure model in China and the One Town One
Product model in the Philippines. A similar initiative, known as the Saligna Value Chain Group,
was successfully carried out in South Africa, whose local “treasure” is furniture and timber
products produced using saligna (a species of eucalyptus hardwood). The firms in the cluster were
able to obtain international status through producing Forestry Stewardship Certified (FSC) hard
wood furniture (Morris and Barnes, 2003).

158
Other examples of initiatives with a special focus on small firms in clusters have also been
documented in studies by Ffowcs-Williams (2000) and by Das (2008). The common theme of these
initiatives was the need to foster linkages between firms in the clusters and other firms and
institutions outside the cluster. In Denmark, Norway, Australia, Canada and New Zealand, for
example, Ffowcs-Williams (2000) noted the use of trained “brokers” as a means of connecting the
firms in the cluster with other firms and institutions outside the cluster. These brokers were then
remunerated on a commission basis.
The conclusions from this study, together with the various policy statements reviewed above and
the examples of some initiatives that have been carried out in other countries in support of small
firms in clusters, lend a lot of credence to the suggestion that Zimbabwe‟s small firms in clusters
are worthy candidates for more attention and developmental intervention.
The following specific areas need to be addressed for these initiatives to succeed in Zimbabwe.
a. Limited market size. The market for the firms‟ products is limited in various ways:
It is limited geographically to the immediate vicinity of the cluster as well as to some
outlying areas in the city in which the cluster is located and a few towns and cities in
Zimbabwe.
It is limited to the low-income segment of the population and the firms have no access to the
other market segments that may be available in Zimbabwe.
It is limited to the local value chain in that the firms do not have access to other national
distribution channels in which other large furniture making firms participate as well as other
regional and global markets.
Initiatives are therefore required to enable the firms to penetrate other market segments
nationally, to expand the size of their market and help them to gain access to the regional and
global value chain for furniture products.

159
b. Lack of access to new technology. The firms are “isolated” technologically because all the
knowledge that is being shared among the firms is knowledge that was acquired by the owner-
managers from their previous employment experiences outside the cluster. The close linkages
among the firms in the cluster are only local but not national, regional or global. No new
knowledge is coming in from outside because of the limited contact with other firms or
institutions outside the cluster. This could lead to the “entropic death” of the cluster.
Initiatives are therefore required to link the firms in the cluster with other firms and institutions
outside so that the “small world effect” (the strength of weak links) is expanded from the
confines of the cluster and the firms gain new knowledge from outside the cluster environment.
c. Lack of capital. The firms are small because they have no access to the financial markets for
both long-term loans and equity capital. The lack of access to capital markets is the result of the
limitations and risks associated with the type of business entity that the firms are employing,
which is too informal (sole proprietorship, rather than limited liability) and also the risk
associated with the operating environment of the cluster.
Initiatives are therefore required to eliminate the informality of the business ownership within
the cluster and the riskiness of the cluster operating environment so that the firms have access to
both debt and equity capital markets.
7.1.3 The clusters in Zimbabwe are “complex adaptive systems” with emergent properties.
The third major conclusion that can be arrived at from the findings is the clusters in Zimbabwe
largely fit the general description of complex adaptive systems with emergent properties (Corning,
2002). As explained in the model in Chapter 3, a complex system is a system whose properties are
different from the individual properties of its constituent parts. This is the property of emergence. In
the case of a cluster of firms, the constituent parts (the firms) have heterogeneous characteristics,
such as the number of employees, the amount of capital employed, the level of sales generated and
the product type.

160
Two findings in particular point to the existence of emergent properties in Zimbabwe‟s small-firm
clusters. Firstly, it was found that the efficiency with which the firms were utilising their assets
collectively as a cluster was higher than the efficiency reported by the firms individually. Secondly,
it was found that each firm did not have a clearly defined or articulated competitive strategy vis-à-
vis other firms in the cluster. However, the cluster as a collective had a clearly defined competitive
strategy (low-cost, niche marketing) vis-à-vis other firms outside the cluster.
As explained in the model in Chapter 3, a complex system also has the further characteristic of
being adaptive to changes in the environment through a pattern of symmetry breaking (Grebel,
2004). Symmetry breaking refers to a situation where decision making at the micro level of the
system (the firms) is quasi-random and yet the system itself at the macro level has deterministic,
path-dependent properties. In the case of a cluster of firms, the decisions made by the firms are
based on uncertain outcomes due to the highly competitive nature of the cluster environment. For
example, it was reported that a firm might find it necessary to use low-cost materials using a cost
pricing strategy in the hope of retaining its customer base. This decision is dictated by market
contingencies and its outcome is unpredictable. If the decision fails to work, the firm will adjust its
future decisions using the wisdom of hindsight. However, on the aggregate, the whole cluster
would end up using low-cost materials as well as a cost pricing strategy. Predictable behaviour at
the macro level (the cluster) came out of quasi-random behaviour at the micro level (the firm).
The conclusion that the cluster in Zimbabwe has emergent properties implies that any initiatives
that are meant to improve the competencies of the firms in the cluster should not be directed at
individual firms because their behaviours are quasi-random and unpredictable. Any interventions or
clustering initiatives will be more effective if they are directed at the cluster as a whole, or at the
very least, at groups of firms in the cluster. For example, training initiatives should not be directed
at artisans in a particular firm, but at groups of artisans representing the whole cluster, such as the
epistemic community of independent workers who roam the cluster and are not attached to any
particular firm in the cluster. If capital is to be mobilized, it should be mobilized on behalf of
identifiable groups of firms or epistemic communities, rather than individual firms.

161
7.2 Recommendations
The conclusions arrived at above lead to the following specific recommendations.
7.2.1. Policy Framework for cluster development in Zimbabwe
It is recommended that the policy framework outlined below be adopted for the further
development of the Zimbabwe‟s small firms in clusters:
a. The role of the state. Because the cluster is a “social entity” in which the members have
close social relations, the role of the state should change from the “direct intervention”
approach that is normally applied when assisting SMEs to “indirect animation”. This means
that the state should not provide “hands-on” support to the cluster members but should
merely create mechanisms and incentives that indirectly facilitate the further development of
the cluster in the form of appropriate policy directives. In other words, the state must stay in
a “neutral corner” as a facilitator and catalyst in enhancing the “social capital” of the cluster
by improving the social cohesion of the cluster and the linkages between the cluster and
outside institutions.
b. The role of the local authority. The local authority should be in control of the cluster
administratively and should provide guidance for the local community to take ownership of
the developmental initiatives in the cluster.
c. The role of the private sector. Since the firms in the cluster are private business entities,
the private sector should take the leading role but in partnership with the local authority and
the state. There should be a strong private/public partnership in the developmental process
of the cluster. However, this partnership must operate within a broad policy framework for
SMEs provided by the responsible government ministry, which is the Ministry of Small and
Medium Enterprise Development (MSMED).
d. Cluster Management Committee (CMC). A Cluster Management Committee,
representing the interests of all the stakeholders should be set up. The activities of the CMC
will be financed by contributions from the cluster members (firms), thus it will be mandated

162
to collect an annual or monthly membership fee from the firms in the cluster. The CMC
members should include the following officials:
Officials from the MSMED. The role of these officials will be to set up the Cluster
Management Committee and also to ensure that the activities of the Committee are in line
with government policy on SMEs;
Officials from the local authority. In the case of the Glenview cluster, these will be from
the City of Harare being represented by the Glenview District Officers. These officials will
be responsible for the general administration of the cluster including the collection of
monthly lease rental fees from firms in the cluster;
Representatives of the owner-managers of the firms in the cluster. The role of these
representatives will be to protect the interests of cluster members, advise Cluster Committee
Members on matters affecting the cluster and assist the local authority (City of Harare) in
the general administration of the cluster;
Officials from the Small and Medium Enterprise Advisory Council (SMEAC). (This
Council was established in terms of the Small Enterprises Development Corporation
Amendment Act, Chapter 24 in March, 2012 to advise Government on matters relating to
SMEs and increase bilateral and regional investment prospects for SMEs in Zimbabwe).
The officials from the SMEAC who will be seconded to the Cluster Management
Committee, will have the role of assisting cluster members to have direct access to the Small
and Medium Enterprises Fund (SMEF) which is managed by the SMEAC;
Officials from private sector organisations. These will be officials from the Confederation
of Zimbabwe Industries (CZI). The role of these officials will be to assist the firms in the
cluster to develop links with other firms in the private-sector and other private sector
institutions such as the Zimbabwe Association of Microfinance Institutions and the Bankers‟
Association of Zimbabwe. The officials will be responsible for identifying a prominent
member of CZI who is passionate about the development of SMEs to chair the Cluster
Management Committee.

163
7.2.2 Administrative issues that need immediate attention
The policy framework suggested above should be supported by a process of restoring order to the
cluster, especially at the Glenview cluster, as suggested in the following steps:
a. The proper demarcation of all stands and the drawing up of physical boundaries for each
stand and for the cluster as a whole;
b. Stopping all unauthorized expansions of the cluster and eliminating other „illegal activities‟
such as rent-seeking and parasitic activities by self-imposed authorities and the sub-letting
and sub-division of stands;
c. The registration of all the tenants and the issuing of long-term lease agreements to them to
enable the collection of monthly lease rental fees from all tenants by the District Officer;
and
d. The immediate provision of proper physical infrastructure at the cluster site, such as: access
roads; proper shelters; storage facilities; parking facilities; sanitation; amenities; water and
electricity.
7.2.3 Attracting capital into the cluster
In the recommendations that follow, it is envisaged that the Cluster Management Committee
referred to above, will play a pivotal role in mobilizing capital on behalf of the firms in the cluster.
The purpose of these recommendations is to address those market failures that create disadvantages
for small firms in clusters when accessing the financial markets, such as the cost of the funds and
the restricted access to the funds due to the perceived high risks of doing business with small firms
in clusters.
Traditionally, the government of Zimbabwe has assisted SMEs by providing subsidized credit
facilities through the Small Enterprises Development Corporation (SEDCO) and the Ministry of
Small and Medium Enterprise Development (MSMED. The government has also assisted by
164
providing funds to commercial banks for on-lending to SMEs as well as credit guarantee schemes
to enable the firms to borrow. The findings from this study suggest that this approach has not been
successful for the small firms located in clusters because they have not had access to these facilities.
The findings from this study are also supported by experiences in other countries. For example, the
government of Chile, through its Fondo de Garantia para Pequennos Empresarios (FOGAPE)
programme, provided partial credit guarantee schemes to enable small firms to access loans from
banks but the firms failed to access them (de laTorre, Gozzi and Scmukler, 2006; Hallberg, 2008).
Based on the above observations, the recommendations made in this study are premised on the
suggestion that the government of Zimbabwe should desist from those programmes and policies
which rely heavily on the direct and subsidized provision of funds to the firms. Instead, an enabling
environment should be created to correct the existing market failures so that the private sector will
be persuaded to deliver the funds to the firms.
The recommended steps are:
a. Formal registration of all the firms in the cluster.
The process of attracting private investor capital into the cluster should begin with the formal
registration of the firms in the cluster so that they become limited liability companies that can issue
shares to investors. The firms are not able to access equity capital by any other means such as
through the issuance of shares because they are not registered formerly in terms of the Companies
Act, Chapter 190. Limited liability attracts capital into the firms because of the limited exposure of
the investors to the risks in their companies. The registration process can be carried out using the
following two alternative approaches:
Register each firm as an individual entity. Using this approach, the potential number of
limited liability companies in the cluster could be large. At the Glenview cluster, for
example, a total of 1 300 companies would be created. The advantage with this approach is
that the structure of the cluster would be left more or less intact. However, the exercise itself
might be turn out to be long and impracticable due to the large number of companies that
would need to be created.

165
Register groups of firms. The second alternative to the registration process is to identify
groups of firms according to the epistemic community to which they belong as described in
Table 6.1 in Chapter 6 and then registering each epistemic community as a single limited
liability company. The advantage of this approach is that it will drastically reduce the
number of companies that would need to be registered, thus simplifying the whole exercise.
The other advantage is that it is easier to register a few large entities rather than a large
number of small ones. A potential problem with this approach however, is that the social
cohesion among the firms in the cluster might be disrupted, thus it is imperative to carefully
identify the epistemic community to which each firm in the cluster belongs before the
registration process begins.
Using the second method, the 1 300 small firms at the Glenview cluster, for example, would be
transformed into the five limited liability companies shown in Table 7.1 below.
Table 7.1: The Glenview cluster transformed to five limited liability companies
NATURE OF COMPANY SIZE OF EPISTEMIC
COMMUNITY
A company making base beds and mattresses Formerly 191 firms
A company making cabinet-type furniture (Kitchen units,
wardrobes and room dividers)
Formerly 291 firms
A company making all types of sofa-sets Formerly 428 firms
A company making steel furniture Formerly 390 firms
A sixth limited liability company should also be created from the epistemic community of firms
that were reported earlier to be specialising in the investment of capital assets on behalf of all the
other firms in the cluster. The asset turnover rate for the individual firms was lower than the rate for
the cluster as a whole due to the extended form of division of labour which enabled these
„investment firms‟ to specialise in the investment of their capital in assets on behalf of all the other
firms in the cluster. The reason for creating this company is that the injection of more capital into
the cluster for the purpose of strengthening capital utilization would be more effectively done if the
initiatives in this direction are aimed at this epistemic community of „investment firms‟ rather than

166
at all the individual firms in the cluster. By so doing, the profitability of the cluster as a whole
would be lifted.
b. Identification of suitable equity investors and sources of loan capital.
A framework already exists in Zimbabwe for the purpose of attracting capital into small enterprises,
including micro-enterprises located in clusters, as described below:
The Zimbabwe Association of Microfinance Institutions (ZAMFI) has a total of 157
micro-financing institutions under its umbrella. ZAMFI has established a “micro-finance
wholesale fund” for the purpose of providing a source of affordable wholesale funding
targeted at micro-enterprises.
The Small and Medium Enterprises Fund was created in terms of the Small Enterprises
Development Corporation Amendment Act (Chapter 24:12) and is managed by the Small
and Medium Enterprise Advisory Council.
Though there appears to be adequate avenues for small firms to access funding in Zimbabwe, a
study carried out by Nyoni (2012) has shown that the micro-finance institutions in Zimbabwe are
primarily geared for the provision of loans in the form of trade finance rather than long-term
capital. The findings from this study, however, clearly show that it is long-term capital (both debt
and equity) that is required by the firms in the clusters. The firms in the clusters have demonstrated
that they can use equity capital more efficiently than other firms and the findings also show that the
introduction of long-term debt into the cluster could have positive leveraging effects on the firms‟
earnings. Thus, it is imperative that both equity and long-term debt capital be availed to these firms,
rather than simply short-term trade finance.
There are three possible methods that can be used to attract private equity capital into the clusters
and these are:
using business angels;
using venture capital investors; and
the private placement of shares.

167
Business angles are individual investors who may be persuaded to invest in small firms, but are not
normally involved in the actual management of the firms in which they would have invested
(Brigham and Gapenski, 2005). To this end, ZAMFI could be approached to persuade its members
to become “business angels” and provide long-term funding to the firms in the clusters through
buying shares in the companies. ZAMFI should then be tasked with ensuring that the investors earn
an adequate return on their investment through regular dividend payments from the firms in the
cluster.
The advantage of this proposal is that the firms‟ cash flows will not be under pressure, as would be
the case with interest payments on loans, because dividend payments can be varied in size,
depending on the cash flows generated by the firm. The disadvantage of this approach, however,
would be the risk that the cash flows may not be sufficient to support adequate dividend payments
and since dividend payments are not contractual, it would be difficult for the investors to enforce
payment. As a result, it may be difficult to attract the required number of investors into the cluster.
In order to minimise this risk, ZAMFI would need the assistance of the Cluster Management
Committee in identifying suitable candidate firms from which the shares will be bought. Business
angels in the United Kingdom are persuaded to invest in small firms through tax incentives from
government known as Enterprise Investment Schemes (Cruickshank, 2000). This is also an avenue
that could be explored in Zimbabwe.
Venture capital investors are investors who buy a majority shareholding in small companies and
then actively manage the company by appointing a board of directors. Using this method, after the
completion of the registration process, the Management Committee could identify investors who
may already have interests in the furniture manufacturing industry and then persuade them to invest
in the companies located in the cluster.
The advantage of venture capital is that the investor is not normally interested in dividend payments
in the short term but is looking at making a capital gain after selling the shares in the future. The
venture capital investor usually has a long-term investment horizon which is typically five years,
after which the investment is sold by disposing the shares on the market. Thus, the investor would
be very keen to ensure the success of the company in the interim. A related advantage of this

168
approach is that the venture capital investor will appoint a board of experienced managers to the
firm, who will then bring new knowledge and skills into the cluster as well as introducing the firms
to new distribution channels and sources of materials. The disadvantage of venture capital to the
firms in the cluster would be that in the long-term, they may lose control of their firms when the
shares are sold by the venture capital investor to other investors. It is for this reason that the current
owners of the firms may resist this proposal.
Selling shares by private placement is a method that would require the Cluster Management
Committee to approach large individual investors, such as the pension fund managers of large
institutions and companies in Zimbabwe and ask them to buy the shares of the companies in the
cluster. The advantage of this approach is that these institutional investors have a long-term
perspective on their investments and therefore do not normally exert pressure on the firms in which
they have invested. However, they are very risk-averse, which means that a lot of effort would be
required to persuade them to invest in firms in the cluster.
From the above analysis, it would appear that the best alternative would be to use the venture
capital route because of the further advantage that such an approach would not only bring equity
capital into the cluster but also new skills, knowledge and business contacts. It is important,
however, to warn the owner-managers at the outset of the need to prepare to buy out the equity
investor at the end of the investment period.
c. Identifying sources of debt capital
There are two possible sources of loans for the firms in the cluster: bank loans and the issuing of
bonds.
Bank loans. With respect to bank loans, small firms in Zimbabwe may have very little access to
them for three reasons and these are the general shortage of funds for lending purposes, the
ownership pattern of the banks and bank risk management requirements.
The general shortage funds for lending purposes in Zimbabwe is the result of the pattern of deposits
going into the banking sector. A large percentage of the deposits are short-term demand deposits

169
which cannot be used to create loans. For example, in its monthly economic review of July, 2012,
the Reserve Bank of Zimbabwe stated that banking sector deposits in Zimbabwe for that month
were as shown in Table 7.2 below.
Table 7.2 Distribution of bank deposits in Zimbabwe, July, 2012
TYPE OF DEPOSIT PERCENTAGE OF TOTAL (%)
Demand Deposits 57.40
Savings and short-term deposits 33.00
Long-term deposits 9.60
TOTAL 100.00
Source: Reserve Bank of Zimbabwe Monthly Review, July, 2012, p 4
The figures in Table 7.2 above show that banks in Zimbabwe do not have funds for the purpose of
providing loans to companies as almost ninety per cent of their deposits are in the form of demand
deposits and short-term deposits. Only less than ten per cent of the deposits are available for
providing long-term loans.
The lack of funds for on-lending to small firms is exacerbated by the ownership pattern in the
banking sector in Zimbabwe, which is skewed towards international banks. This is shown in Table
7.3 below.
Table 7.3 Market shares of weak and troubled banks in Zimbabwe, July, 2012
TYPE OF BANK MARKET SHARE OF
ASSETS (%)
MARKET SHARE OF
DEPOSITS (%)
MARKET SHARE OF
LOANS (%)
Strong Banks 95.96 97.33 96.16
Weak Banks 4.14 2.67 3.84
TOTAL 100.00 100.00 100.00
Source: Reserve Bank of Zimbabwe Monthly Review, July, 2012, p 24
The “strong banks” are the international banks which hold the larger market share of assets,
deposits and loans and the “weak banks” are the locally-owned banks which own the smaller

170
market shares. However, the international banks are traditionally not inclined to provide loans to
small firms due to the perceived high-risk profile of such firms. Thus, the small micro-enterprises
located in the highly competitive environment of the cluster cannot expect to obtain any funding
from them. The locally-owned banks are however too weak to provide such assistance due to the
low amount of deposits that they attract. Finally, like all other banks the world over, banks in
Zimbabwe are required to comply with the risk management standards referred to as “Basel II”.
Studies in other countries have shown that these requirements are too restrictive and do not permit
banks to provide lending to small firms (Beck, 2007).
Bond issues. The organisation of the cluster into a small number of large limited liability
companies could enable the firms to access loan capital from other sources besides banks. In order
to achieve this, it is recommended that a borrowing instrument be structured which combines the
features of both debt and equity. This instrument has the advantage that it will enable the firm to
borrow at a lower interest rate than the average market rate. The instrument is known as a
“convertible bond” (Atril, 2004; Brigham and Gapenski, 2005). It is a loan that gives the lender the
option to convert it into a specified number of the borrowing company‟s shares after an agreed
period of time. The advantage of this arrangement to a small company with the potential to grow is
that if the lender exercises this option and becomes a shareholder, the company no longer has the
obligation to make interest payments on the loan but begins to make dividend payments to the
investor.
The Cluster Management Committee could therefore structure and issue a convertible bond on
behalf of the companies in the cluster. The bond will be a loan with a long-term maturity period
(such as ten years) but will be convertible in a relatively short period of time (say three years). The
Management Committee will have the task of identifying suitable investors for this purpose from
the members of organisations such as ZAMFI and CZI. Since the firms in the cluster cannot offer
sufficient collateral security for the loans, the government ministry responsible for SMEs will
arrange government guarantees on behalf of the companies in the cluster.

171
7.2.4 Eliminating “cluster isolation” (access to markets and new technology) and increasing
the technological capabilities of the firms in the cluster.
The following recommendations may be considered for the purpose of reducing the “isolation” of
the firms in the cluster.
a. Developing linkages between the cluster and other institutions (for example, ZAMFI and
CZI) and lobbying for support from government through the responsible Ministry
(MSMED);
b. Assisting the firms to participate in the local, regional and global value chain through
introducing them to distribution channels in these markets;
c. Developing linkages with other local production sub-contractors, regional traders and export
agents;
d. Familiarizing the firms with global trade norms such as International Standards
Organisation (ISO) quality certification and the Forestry Stewardship Certification (FSC);
and
e. Promoting an effective association between the cluster, state and research organisations in
order to upgrade the quality of products and reduce transaction costs. This type of
intervention has been referred to as the Industry-Academia-Government linkage or “Triple
Helix approach” (Das, 2008).
In order to enable the firms in the cluster to gain new technological capabilities from sources
outside the cluster, it is recommended that technical cooperation agreements between large
furniture manufacturing firms outside the cluster and the firms inside the cluster be negotiated. The
technical cooperation agreements should provide for the development of the following relationships
between the small firms in the cluster and other firms outside the cluster:
the small firms in the cluster will make furniture on behalf of the large firms, who in turn
will sell it using their own distribution channels;

172
the small firm in the cluster will make furniture on its own account as well as on behalf of
the large firm and the furniture will be sold within the cluster and also using the distribution
channels of the large firm;
This arrangement results in advantages to both sides. The large firms can benefit from the low
labour costs found in the cluster and the technical skills possessed by the pool of labour in the
cluster. The small firms can also benefit directly from the following contributions made by the large
firm:
finance for working capital;
training for the small firm‟s artisans;
information on product markets and sources of material;
logistical support such as freight, transport, procurement and storage;
access to distribution channels and markets;
consulting services; and
representation on industrial boards for manufacturing organisations such as the
Confederation of Zimbabwe Industries (CZI).
The technical cooperation agreements would assist in improving the technological environment and
the technological capabilities of the firms in the cluster. This will be achieved in three ways:
increasing the technological opportunities in the cluster as new and innovative products
will be introduced into the cluster from outside;
improving the appropriability conditions in the cluster since the new technology will be
more proprietary in that it will be protected by patents under the terms of the agreement; and
improving the technological capabilities of the firms in the cluster.
There are two alternative ways in which the technical cooperation agreements can be structured in
order to effectively transfer technology into the cluster.

173
The first approach is that the firms in the cluster would be provided with detailed drawings and
technical specifications on the furniture products required by the large firm (protected by patent
agreements). This approach would be suitable in the case where the large firm is using a different
competitive strategy from that employed by the small firms in the cluster. For example, the large
firm may be using a product differentiation strategy, which requires the production of high quality
products for a high-income market, whereas the firms in the cluster would be using a low-cost
strategy which is targeted at the low-income market. Through this process, the artisans in the small
firm will gradually absorb the technology behind the products made by the large firm, resulting in
its transfer into the cluster. In this way, the firms in the cluster would also eventually penetrate the
high-income market.
The second approach is that the large firm gives the small firm in the cluster the freedom to design
and manufacture the product. The long-term advantage of this arrangement is that there is a transfer
of knowledge in both directions, with both parties learning from each other. In this arrangement, the
large firm would be more willing to delegate a wider range of activities (production and marketing)
to the small local firm and or even learn from it.
If both parties under this arrangement are using the same competitive strategy and serving the same
market, it means that they also share the same knowledge about the needs of the market even
though they may be controlling different segments of it. Thus, the technical agreement between the
two parties could also be extended to include the sharing of distribution channels. In this case the
small firm in the cluster could then be able to place its own product on the distribution channels
used by the large firm.
If the firms are using different strategies to serve the market, however, elaborate communication
structures between the two parties would be necessary so that the small firm becomes familiar with
the requirements of the market being served by the large firm. However, the small firm cannot
participate in the distribution channels of the large firm but can only make products on behalf of the
large firm.

174
7.2.5 Establishing regional and global linkages
With regards to the establishment of regional and global linkages, it can be recommended that
“mother-daughter” relationships be established between local clusters and other clusters outside
Zimbabwe. An example of a successful relationship of this nature in Italy has been studied by Das
(2008) who found that some firms in the clusters in North Eastern Italy transferred some of their
production processes from their home clusters to clusters in the Timisoara region of Romania.
Whether the same arrangements can also be made with respect to Zimbabwe‟s small-firm clusters
depends on several factors that were also identified by Das (2008). Firstly, the clusters in
Zimbabwe must compete with clusters in other countries for the attention of other clusters outside
Zimbabwe by providing advantages that go beyond the cost of labour. Secondly, there should be
support for such initiatives at the policy level, with strong private/public partnerships. This support
can only be gained if the long-term survival of the firms in the local clusters can be assured through
the existence of the potential for the transfer of knowledge from the “mother” cluster to the
“daughter”. Thirdly, the “host” country must provide an environment which is attractive to the
firms in the “mother” cluster like good and reliable infrastructure (roads, electricity, and
communications) and a market which is large enough to justify the relocation of the firms.
7.3 Conclusion
This study has shown that the clusters of small firms in Zimbabwe have great potential provided
that initiatives are put in place to leverage the many positive attributes that they possess and to
eliminate the problem of “isolation” of the firms from other distribution channels, outside sources
of technology and the capital markets. If these initiatives are successfully implemented,
Zimbabwe‟s small-firm clusters can become true Entrepreneurial Industrial Districts.
7.4 Areas for further study on small-firm agglomeration
During the study, it was noted that many of the firms in the cluster were not actually buying the
machinery that they were using (such as lathe machines, rip saws and spindle molders) but were
designing it using a process of “reverse engineering”. Thus, one area concerning small-firm
clusters that calls for further study is the mapping of the social relations among the cluster members

175
using statistical methods with a view to understanding how knowledge (technology) is acquired and
shared among the cluster members and to quantify the extent and significance of such
“recapitalization” processes throughout the whole economy.

176
REFERENCES
Abraham, M and Westhuzen, G. (2002) Research paradigms. Vista University
Alila, P. and Pedersen, P. (2001) Negotiating social space : East African micro enterprises. Asmara:
Africa World Press Inc.
Altenburg, T. and Meyer-Stamer, J. (2009) How to promote clusters : policy experiences in Latin
America. World Development.. Vol. 27- 9. July.
Amin, M. and Barnajee, S.(2007) Constraints and contingencies of the small business:
acomparative perspective. The International Business and Economics Research Journal. Vol. 6 -9,
September.
Amoros, J. (2009) Entrepreneurship and quality of institutions: adeveloping-country approach.
World Institute for Development Economics Research:Research Paper Number 2009/07 /United
Nations University. Barcelona : UNU-WIDER.
Atril, P. (2009)Financial management for decision makers. 5th
ed. London: Prentice-Hall.
Babbie , E. (2005) The practice of social research. 8th Ed. London: Wadsworth Publishing.
Bagachwa, M.S.D.(2001) Impact of adjustment policies on the small-scale enterprises sector in
Tanzania. In: Helmsing, H. and Kolstee, T. (eds) Small enterprises and changing policies: structural
adjustment, financial policy and assistance programmes in Africa. pp. 91-113.
Belussi, F. (2009). Business networks and clusters in industrial districts: the governance of the
global value chain. Taylor and Francis.
Bell, M.(1999) Knowledge systems and technological dynamism in industrial clusters in developing
countries. World Development. March 1999. - 9 : Vol. 27. - pp. 22-55.
Berg, B.(2002) Qualitative research methods for the social sciences. New York: Pearson Education
Company.
Berry, A.(2002) The role of the small and medium enterprise sector in Latin America and similar
developing economies. Seton Hall Journal of Diplomacy and International Relations.
Winter/Spring, Vol. 22, pp. 104-119.
Bhalla,A.(1998) . Innovations and small producers in developing countries. London: Greenwood
Press.

177
Bhalla, A. (1996)Small and medium enterprises : technology polices and options.London:
Greenwood Press.
Bisso, R. (2003) Clusters and development strategies: reflections for a developing country's SME
policy. Bologna: Prncite-Hall.
Bojar, E., Bojar, M. and Zminda, T.(2008) The cluster as a factor attracting foreign direct
investment in less developed regions.The Journal of the Romanian Science Association. Summer:
Vol. 2, pp. 55-67.
Breschi, S. and Malerba, F. and Orsenigo, L. (2000) Technological regimes and Schumpeterian
patterns of innovation. The Economic Journal. April, Vol. 110, pp. 388-410.
Breschi, S. and Lissoni, F. (2001) Knowledge spillovers and local innovation systems : a critical
survey. Serie Economica e Impresa. Vol. 84 - 3, pp. 21-42.
Brigham, E. and Gapenski, L. Financial management: theory and practice. 9th ed. Toronto: Dryden
Press.
Brinkhoff, T. (2011) City populations.Available from: http://www.citypopulation.de. [Accessed
March 11, 2011]
Burrell, R.(1979) Sociological paradigms and organizational analysis. London: Heinmann.
Bruun, C. (2004) Agent-based computational economics: an introduction.Aaiborg University,
Denmark: Dept of Economics, Politics and Public Administration.
Camagni, R. (2009) Innovation networks: spacial perspectives.London: Belhaven Press.
Cassidy, D. (1992) Heisenberg, uncertainty and the quantum revolution. Scientific American.May,
pp. 106-112.
Chirisa, I.(2009) The geography of informal sector operations: a perspective of urban Zimbabwe
Journal of Geography and Regional Planning.Vol. 2,pp. 066-079.
Conlisk, J. (2009) Why bounded rationality? Journal of Economic Literature. June, Vol. XXXIV,
pp. 669-700.
Corning, P.(2002) The re-emergence of "Emergence" : a venerable concept in search of a
theory.Complexity. Vol. 7- 6, pp. 18-30.

178
Cowan, R. and Foray, D. (2000) The explicit economics of knowledge codification and
tacitness.Industrial and Corporate Change.March Vol. 9, pp. 22-75.
Creswell, J.(2008)Qualitative inquiry and research design : choosing among five traditions.4th
ed.
New Dheli: Sage Publications.
Cuervo-Garcia, A., Montoro-Sanchez, A. and Romero-Martinez, A.(2009) Clusters and business
innovation. In: Galindo, M., Guzman, J. and Ribeiro, D.Entrepreneurship and Business: A Regional
Perspective. Madrid: Springer-Verlag.
Dahlgren, J.(2007)Developing a framework for exploring clustering coefficient to evaluate system
coupling. Humpton, UK : The MITRE Corporation.
Davidsson, P.(2002) An economic-psychological approach to continued entrepreneurship in small
firms.Stockholm: Umea School of Business and Economics.
Dawson, C. (2002)Practical research methods. Oxford: How To Books Ltd.
Deeks, J.(2003) The small-firm owner-manager: entrepreneurial behaviour and management
practice. New York: Praeger.
DeMatteo,D.,Festinger,D. and Marczyk, G. (2005)Essentials of research design and methodology.
New Jersey: John Wiley and Sons, Inc.
Dennick, C., Tavakol, M. and Reg, F. (2011) Making sense of Cronbach's Alpha.International
Journal of Medical Education. March, Vol. 2, pp. 53-55.
Dessing, M.(2009) Support for micro-enterprises : lessons for Sub-Saharan Africa.World Bank.
Technical Paper Number 122.
Dopfer, K. (2006) The origins of meso economics : Schumpeter's legacy. In: Max Planck Institute
of Economics. Papers on Economics and Evolution. Jena, Germany: Praeger.
Dooley, D. (2002). Social research methods. London: Prentice-Hall.
Ebeling, R.(2007) Austrian economics and the political economy of freedom. New Perspectives on
Political Economy. Vol. 3-1, pp. 87-104.
Evans, D.(2007) Test of alternative theories of firm growth. Journal of Political Economy.Vol. 95,
pp. 657-674.
179
Fashoyin, T. (2008) .Employment, unemployment and informality in Zimbabwe. International
Labour Organisation (ILO) : Geneva. Policy Integration and Statistics Department, Issues Paper
No. 32.
Ffowcs-Williams,I. (2000) Policy for interfirm netwroking and clustering: apractitioner's
perspective. In: Ffowcs-Williams, I. and Wise,G.Enhancing the Competitiveness of SMEs in the
Global Economy: Strategies and Policies. Bologna : OECD/Italian Mimistry of Industry Bologna
Conference for Ministers Responsible for SMEs and INdustry Ministries., 2000.
Figueiredo, P. (2002) Does technological learning pay off? Inter-firm differences in technological
capability-accumulation paths and operational performance improvement. Research Policy. Vol. 31,
pp. 22- 34.
Foray, D. (2004) The economics of knowledge.The MT Press.
Foster, J. and Wild, P. (1999) Econometric modelling in the presence of evolutionary change
Cambridge Journal of Economics. January, Vol. 23. pp. 749-770.
Frenken, K. (2005) Applied evolutionary economics and the knowledge-based economy. Artificial
Societies and Social Simulation. Vol 10(3): pp. 102-143.
Gill, J. and Johnson, P.(2005) Research methods for managers.5th
ed. New York: Chapman
Publishing.
Giuliani, E. (2002) Cluster absorptive capability : an evolutionary approach for industrial clusters
in developing countries. In: Giuliani, E. Industrial Dynamics of the New and Old Economy - who is
embracing whom?. Copenhagen : University of Sussex, Brighton, UK, 2002. - pp. 1-29.
Goldstein, J. (2008) Complexity science applied to innovation: theory meets practice. Public Sector
innovation Journal. Vol. 1. pp. 1-16.
Government of Zimbabwe National Consultative Forum (2004). Report on the Policy
Implementation Workshop for SMEs.Harare, Zimbabwe.
Government of Zimbabwe Ministry Small, Micro and Medium Enterprises (1999). The Engine for
Growth. Harare: Government Printers.
Grebel, T. (2004) Entrepreneurship: a new perspective. London: Routledge.
Guba, E. and Lincoln, Y.(2002)Competing paradigms in qualitative research. 4thed. New Dehli:
Sage Publications.

180
Gummesson, E. (2000) Qualitative methods in management research.2nd
ed. New dehli : Sage
Publications.
Guzman, J. and Santos, F.(2009) Entrepreneurial structure from a regional perspective. In:Galindo,
M., Guzman, J. and Ribeiro, D.Entrepreneurship and Business : A Regional Perspective. Berlin :
Springer.
Hagedoorn , J. (2009) Innovation and entrepreneurship: Schumpeter revisited. Industrial and
Corporate Change. Vol. 5 -3, 883-896.
Helmsing, A.and Kolstee,T.(2000) Small enterprises and changing policies: structural adjustment,
financial policy and assistance programmes in Africa.Sydney : IT Publications.
Hodgkinson, A. (2007) Small business clustering across disciplines. Wollongong: Idea Group Inc,
2007.
Humphrey, J. and Schmitz, H. Principles for promoting clusters and networks of SMEs [Report] /
Kanji, N. (2005) Gender, poverty and economic adjustment in Harare, Zimbabwe.Environment and
Urbanization. 37 : Vol. 7, pp. 45-67.
Kapoor, K. (1997) Empowering small enterprises in Zimbabwe. World bank Discussion Paper
Numbver 379 . Washington DC : World Bank.
Kaseke, N (2012) Cost of electricity outages in Zimbabwe. Pretoria: Nelson Mandela Metropolitan
University
Katona, G.(1994) Psychology and consumer economics. Journal of Consumer Research. Vol. 1, pp.
1-8.
Kauffman, S., Lobo, J. and Macready, W. (2000) Optimal search on a technology landscape
Journal of Economic Behavior and Organization. Vol. 43,pp. 141-166.
Kelley, D., Bosma, A. and Amoros, J.(2010) Global Entrepreneurship Monitor Madrid:
Universiadad del Desarrollo.
Kharbanda, V.(2001) Facilitating innovation in Indian small and medium entreprises : the role of
clusters. Current Science. February,Vol. 80-3, pp. 11-36.
Kirzner, I. (1999) Creativity and/or alertness: a reconsideration of the Schumpetarian entrepreneur.
Review of Austrian Economics. March, Vol. 11. pp. 5-17.
181
Kothari, C.(2004)Research methodology:methods and techniques. New Delhi: New Age
International.
Kotler, P., Keller, K., Koshy, A. and Jha, M.(2009)Marketing management. a South Asian
Perspective.13th ed. New Delhi: Prentice Hall.
Lather, P. (2008) Getting smart: feminist research and pedagogy. New York: Routledge
Lancaster,J. (2005) Research methods in management: a concise introduction to research in
management and business consultancy.London: Elsevier Butterworth-Heinemann.
Leach, J. and Melicher, R. (2009) Finance for entrepreneurs.Mason, USA: South-Western Cengage
Learning.
Philippen,L.and Riccaboni,S. (2007)Radical Innovation and network evolution.
www.tinbergen.nl/discussionpapers/07039.pdf. [accessed May 2, 2011].
Mararike, C. (2011) Survival strategies in rural Zimbabwe: the role of assets, indigenous knowledge
and organisations. Harare: Best Practices Books.
Marshall, A. (1986) Principles of Economics. London: MacMillan.
Mason, J.(2004) Qualitative searching. 5th
ed. New Delhi: Sage Publications.
Matare, K. (2010)CZI-Business Intelligence Report (New Tax Collection Plan), January-March,
2010. Harare : Confederation of Zimbabwe Industries.
McClelland, D.(1978)The achieving society. 11th ed Princeton, New jersey: Princeton.
McCormick, D. (1998) Enterprise clusters in Africa: on the way to industrialisation? : Discussion
Paper Number 366.Nairobi : University of Nirobi, Institute of Development Studies.
McCormick, D. (1997) Industrial District or Garment Ghetto?: Nairobi's mini-manufacturers. In:
Van Dijk, P. and Rabellotti, R.Enterprise clusters and networks in developing countries. London:
Frank Cass.
McMullen, J. and Shephered, D. (2006) Entrepreneurial action and the role of uncertainty in the
theory of the entrepreneur. Academy of Management Review. January, Vol. 31-6, pp. 132-152.
McNeill, P. and Chapman, S. (2005) Research methods.New ork: Routledge.

182
Mhone, G. (2002)The impact of structural adjustment on the urban informal sector in Zimbabwe
Harare : Africa Regionla Policy Studies (SAPES).
Miles, W and Harbamas, D. (2004). Towards a theory of qualitative inquiry. Competence Inqury.
Vol. 13. p 372
Miles, G. and Goddard, W. (1996) Research methodology. Juta and Company.
Mises, L (1993). Epistemological problems of economics. New York: New York University Press.
Mises, L. (1996) Human action: atreatise on economics. New York : Irving-on-Hudson Foundation
for Economic Education.
Mpemba, G. (2010)Retrenchment procedures handbook and reports on court cases on retrenchment
in Zimbabwe. Harare: NCS Labour Relations and Training Consultants.
Morris, M. and Barnes, J.(2003) Policy lessons in organizing vertical and horizontal cooperation in
value chains and industrial clusters. In: Industrial Districs and Firms : The Challenge of
Globalization.Conference in honour of Professor Sebastino Brusco. Modena, Italy : 17th May, 2003.
Nadvi, K.(2001) Collective efficiency and collective failure : the response of the Sialkot Surgical
Instruments cluster to global quality pressures. World Development. Vol. 27-9, pp 55-76.
Osei, B., Baah-Nuakoh, A., Tutu, K. and Sowa, N. (2003) Impact of structural adjustment on
small-scale enterprises in Ghana. In: Cornia, G., Helleiner, G.From adjustment to development in
Africa : conflict, covergence and consensus. London: MacMillan Press.
Oyelaran-Oyeyinka, B. and McCormick, D. (2003) Industrial clusters and innovation systems in
Africa: institutions, markets and policy. Washington DC: United Nations University Press.
Pearson, P.and Hungwe, R. (1997)UNDP Microfinance Assessment Report for Zimbabwe. Harare :
United Nations Development Program, July 1997.
Pedersern, P., Sverrisson, A. and van Dijk, M.(2004)Flexible specialization: the dynamics of small-
scale industries in the South. London : Intermediate Technology Publications.
Piotr, D. and Marek, R. (2009) The relationship between entrepreneurship and economic growth:
areview of recent research achievements.In:Galindo, M., Guzman, J. and Ribeiro,
D. Entrepreneurship and business: aregional perspective.Berlin: Springer.
Porter, M. (1990) The competitive advantage of nations. New York: The Free Press.

183
Rabellotti, R. and Van Dijk, P. (2002) Clusters and networks as sources of co-operation and
technology diffusion for small entreprises in developing countries. In: Enterprise clusters and
networks in developing countries. London: Frank Cass.
Ramamurthy, B. (2008) Samll industries and institutional framework : a transaction costs approach.
In: Ronnas P, Sjoberg O and Hemlin M. Institutional adjustment for economic growth: small-scale
industries and economic transition in Asia and Africa.Geneva: Asgate Publishing Ltd.
Ross, A. and Israel, D. Quantitative and qualitative research methods. London: Dudley-Hall Inc.
Reserve Bank of Zimbabwe(2004) Monetary Policy Statement. Harare : Government of
Zimbabwe..
Ritchie, J. and Lewis, J. (2005) Qualitative research practice : aguide for social science students
and researchers. New Delhi: Sage Publications.
Romjin, H. (2000)Acquisition of technological capability in small firms in developing countries.
New York: MacMillan Press Ltd.
Rosenhead, J. Science as culture [Online] // The Human Nature Daily Review. - March 4, 1998. -
September 12, 2009. - http://www.human-nature.com/science-as-culture/rosenhead.html.
Rubinstein, A. (2006) Dilemmas of an economic theorist.Econometrica. July,Vol. 74-4, pp.112-
134.
Sakurai, T., Furuya, J. and Futakuchi, K. (2006) Rice miller cluster in Ghana and its effects on
efficiency and quality improvement International Association of Agricultural Economics.Gold
Cost, Australia.
Sarantakos, S.(2008) Social research 4th
ed. Hongkong: MacMillan Press Ltd.
Schank, T. and Wagner, D. (2004).Approximating clustering coefficient and transitivity Karlsruhe:
: University of Karlsruhe, Germany.
Schmitz, H. (2001) Collective efficiency: growth path for small-scale industry.Journal of
Development Studies. April, Vol. 5, pp. 222-243.
Schmitz, H.(2001) Collective efficiency and increasing returns. Cambridge Journal of
Economics. March, Vol. 23. pp. 122-178.
Schmitz, H.(1992) On the clustering of small firms University of Nairobi, Institute of Development
Studies Bulletin Number 23 (3). July 1992.pp. 64-68.

184
Schumpeter, J. (1986) History of economic analysis. 5th ed. London: Routledge.
Small Entreprise Development Corporationof Zimbabwe (SEDCO). (2003) Annual Report. Harare
Skala, L. and Kapsa, V. (2008) Heisenburg uncertainty relations can be replaced by stronger ones.
International Journal of Quantum Chemistry. December, Vol. 23, pp. 1624-1630.
Small Enterprises Development Corporation (SEEDCO) Annual Report for 2003 [Report]. -
Harare : SEEDCO, 2003.
Smith, H.(2005) Strategies of social research : the methodological imagination.London: Prentice-
Hall.
Snodgrass, D. and Biggs, T. (1996) Industrialisation and the small firm : patterns and policies.
New York: Havard Institute for International Development.
Spilling, O. (2008) Entrepreneurship and heterogeneity. In: Carayannis, E., Kaloudis,A. and
Mariusse, A.Diversity in the knowledge economy and society. Massacgusetts: Edward Elgar
Publishing.
Storey, W. (2004) Understanding the small business sector. 4th ed. London: Routledge.
Sverrisson, A. (2006) Gradual diffusion of flexible techniques in small and medium-size entreprise
networks. In: Pedersen, P., Sverrisson, A. and van Dijk, M. Flexible Specialization : the dynamics
of small-scale industries in the South. London: Intermediate Technology Publications.
Thurik, R. and Carree, M. (2005) The handbook of entrepreneurship and economic growth
Maastricht: Edward Elgar Publishing Ltd.
Tibaijuka, A. (2005) Report on the Fact Finding MIssion to Zimbabwe to assess the scope and
impact of Operation Murambatsvina by the UN Special Envoy on Human Settlement Issues in
Zimbabwe : United Nations Special Report Number 2/2005.
UNIDO(2001) Development of Clusters and Networks of SMES : UNIDO Doc 331101..
Uzor, O. (2004) Small and medium scale enterprises cluster development in South-Eastern Region
of Nigeria. Bremen Institute for World Economics and International ManagementDiscussion Paper
Number 86.Unversity of Bremen.
Van Horne, J. (2005) Financial management and policy. 8th ed. London: Prnctice-Hall
185
Vehkalahti, K. (2011) Reliability of measurement scales. Helsinki: Finish Statistical Society.
Vlahas. G (2002) Research paradigms in cognitive education. Vista University
Visser, E.(2004) The significance of spacial clustering : external economies in the Peruvian small-
scale clothing industry. In: van Dijik Van, P and Rabellotti, R. Entreprise clusters in developing
countries. New Delhi: Sage Publications.
Watkins, D.(2003) Technical entrepreneurship: a CIS-Atlantic View. R&D Management.Vol. 3. pp.
65-70.
Winter, S. (2004) Schumpeterian competition in alternative technological regimes. Journal of
Economic Behaviour and Organization.. Vol. 5, pp. 287-320.
Wulleman, J. http:www.xmission.com/mkeeman/essay01.pdf [Online]. - September 2010. -
September 29 , 2010.
Xiao, W., Chen, W., Qin, Y. and Parhami, B. (2007) Extended clustering coefficients in Small-
World Networks. Journal of Systems Science and Systems Engineering. Vol. 77, pp. 371-382.
Peng , Y. and Yang, Z. Analysis of the cluster knowledge innovation based on clustering
coefficient [Conference] // Conference on Innovative Computing and Communication. - Nanjing :
Government of Jiangsu, China, 2010. - pp. 12-33.
Zimbabwe Stock Exchange (2011) Company Annual Reports. Harare: ZSE (Pvt) Ltd.

186
Questionnaire to establish the characteristics of small furniture-making firms
operating in clusters
DEAR SIR / MADAM
My name is GODFREY MUPONDA. I am a Doctoral Student at the University of Zimbabwe,
Department of Business Studies. I am conducting a study to find out the technological innovations
that are being carried out by furniture manufacturing firms at the Glenview Complex so that I can
write a thesis on the operations of small firms and recommend ways in which they can be assisted
to improve their operations.
I am kindly requesting you to participate in this study by completing the attached questionnaire
(form). Please note that the information you provide will be treated as confidential and will be used
for academic purposes only and your name will not be required. Please feel free to complete the
questionnaire as your participation in the study is purely voluntary.
MANY THANKS
G. MUPONDA…………………………………………………………………..
DATE ADMINISTERED :……………………
…………………………………………….
DATE COLLECTED :
………………………………………………………………..
TIME TAKEN TO COMPLETE
:…………………………………………………………………

187
A. DESCRIPTION OF THE OWNER/MANAGER
1. Are you the manager or owner of this firm?
1. The owner……………………….. 2. An appointed manger…………
2. What is your year of birth:………………………………..
3. Sex of owner/manager:
1. Male…………………………… 2. Female …………………………
4. Level of education
1. “O” Level… ……... 2.”A”Level… ………3.Other……………………… . If
“other”, explain…………………………………………………………………………………
………………………………………………………………………………………………..
5. What is your Religious affiliation (Name of church, if any)…………………………………
6. Are you a resident of Glenview?
1. YES……………………….NO………….
7. If you stay outside Glenview, where do you stay………………………………………………..
8. What is your average monthly income as the owner/manager of the firm?..................................
9. Married ………………………..YES…………………NO………
10. Number of children and dependents……………………………
11. Were where you employed before coming to the Complex or starting this firm:……………..
…………………………………………………………………………………………………….
12. From (year)………………………TO (year)……………………………………………….
13. Where you employed elsewhere within this Complex before joining or forming this firm:
1. YES………………… ……... 2. NO…………………
14. How many years were you employed there?..............................................................
15. Were you employed as a carpenter?
1. YES………………… ….2..NO…………..

188
16. Why did you leave that firm…………………………………………………………………
…………………………………………………………………………………………………..
17. How did you become a carpenter?
1. Trained by others in my former company outside the Complex…
2. Trained by others in this firm……
3. Trained at College or Training Institution…………………Name of College and Certificate
…………………………………………………………………………………
………………………………………………………………………………………………
B. DESCRIPTION OF THE FIRM
18. Name of your firm ……………………………………………………………………
19. When did you start this firm……………..
20. Where were you operating from before you came to the Complex?..........................................
……………………………………………………………………………………………………..
21. When did you come to the Complex?.........................................................
22. Nature of your business:
1. Wood furniture…. ….2 Steel furniture………….3. Both……………
23. Is your firm a formally registered company (Certificate of Incorporation)?
1. YES……………… …… …… 2. NO………………….
24. Who do you rent these premises from?
1. City of Harare… … .2..Other landlord…..
25. What is your monthly rental? $...............................................
C. PRODUCTS MADE IN THIS FIRM
26. List of products made by the firm (put an X on the space provided):
WOOD FURNITURE

189
1. Saint James Lounge Suite (sofa)……………………….
2. Madeira Lounge Suite (sofa)…………………………..
3. Culture (Couch) Lounge Suite (sofa)………………….
4. Winchester Lounge Suite (sofa)………………………
5. Bubble B Lounge Suite (sofa)…………………………
6. Hamilcourt Lounge Suite (sofa)…………………………
7. Rolex Lounge Suite (sofa)……………………..
8. Crown Lounge Suite (sofa)……………………
9. Vanessa Lounge Suite (sofa)………………….
10.Kitchen Unit : 3- door…….4-door ……other………………………………………
11. Wardrobe: 3-door…….4-door……Other …………………………………………
12. Base bed: single………double………queen…….Other………………………………
13. Room divider: 4-piece …3-piece……2-piece…….Other…………………………
14. Dinning Suite: 7-piece….6-piece……5-piece…….Other………………………….
15. Coffee Table: 5-piece……..4-piece…….Other……………………………………
16. Bar Stool: (i) …………………………………(ii)……………………………………
17. Bedroom Suite: 5-piece……...4-piece……Other……………………………………..
18. Other products not listed above…………………………………………………
................................................................................................................................................................
................................................................................................................................................................
...............................................................................................................
27. List of products made by the firm (STEEL):
STEEL FURNITURE
1. Kitchen Unit: 7-piece……5-piece……Other…………………………….. …………

190
2. Bar Stools: ……………... Description……………………………………………….
3. Nook Chairs……. ……. Description………………………………….……………
4. Office Chairs…… ……... Description………………………………………………
5. Office Chairs…… ……... Description………………………………………………
6. Saloon Chairs…... ……... Description………………………………......................
7. Room Dividers…. ……... Description………………………………………………..
8. Room Dividers………… Description………………………………………………..
9. Other products not listed above…………………………………………………
................................................................................................................................................................
................................................................................................................................................................
...............................................................................................................
28. Material used on sofa covers and cushions
1. Fabric… ……. 2. Leather………….
29. Type of fabric used
1. Suede….. ..2. Poodle…. ..3. Java…… .. 4. Other…………………………
……………………………………………………………………………………………………..
30. Type of leather used
1. 100 per cent leather…. ..2. 80 per cent leatherette. .. ..3. Rexene….
31. Timber used on sofa frame
1. Pine……. . 2. Mukwa…. 3. Teak…..
32. Timber used on sofa outside panels (arms, wings, legs)
1. Pine……. . 2. Mukwa…. 3. Teak…..
33. Timber used on other products frames and panels, etc
1. Pine……. . 2. Mukwa…. 3. Teak…..
34. Material used inside cushions, headrest and arms
1. Cotton……. . 2. Foam rubber…. 3. Other ……………Explain…………………...

191
…………………………………………………………………………………………………………
…………………………………………………………………………………………………………
………………………………………………………………………………………………..
35 Type of finish on sofa outside panels and other products
1. Vanish……. . 2. Foil paper…. 3. Other ……………. Explain………
…………………………………………………………………………………………………….
……………………………………………………………………………………………………..
36. List of suppliers outside the Complex
1. Suppliers of Fabric (i)………………………………………………………………………….
(ii)…………………………………………………………………………
2. Suppliers of Timber (i)………………………………………………………………………..
(ii)……………………………………………………………………….
3. Suppliers of Steel (i)………………………………………………………………………
(ii)………………………………………………………………………
3. Other suppliers and what they supply…………………………………………………………
…………………………………………………………………………………………………………
………………………………………………………………………………………………….
38. List of suppliers inside the Complex and what they supply
1………………………………………………………………………………………………….
2…………………………………………………………………………………………………
3………………………………………………………………………………………………….
39. Describe the most important qualities or features that make your product different from
other products made in this Complex (eg material used, shape size, how it works)
1. Lounge suit (sofa)……………………………………………………………………………
………………………………………………………………………………………………………
2. Kitchen Unit………………………………………………………………………………..
3. Wardrobe………………………………………………………………………………….
4. Base bed………………………………………………………………………………….
5. Room divider……………………………………………………………………………
6. Other products…………………………………………………………………………………
………………………………………………………………………………………………………
…………………………………………………………………………………………………………
…………………………………………………………………………………………………

192
40. List the firms which do some of the work on your products (eg shaping of panels)
NAME OF FIRM WHAT THEY DO
1
2
3
4
41. How often do they do this work for you?
1. Every day……………. 2. Once per week…………3. Once per month……….
42. Explain how they charge for the work………………………………………………………
……………………………………………………………………………………………………
43. List the name of people whom you hire on contract to work for your firm
NAME WHAT THEY DO
1
2
3
4
44. Explain how they charge for the work………………………………………………………
……………………………………………………………………………………………………
45. How often do you hire them?
1. Every day……………. 2. Once per week…………3. Once per month……….
D. THE FIRM’S CUSTOMERS AND MARKETS
46. Where does your firm sell most of its products?
1. To customers outside Harare…… …… 2. To customers in Harare…………
47. The total value of the goods sold by your firm every month is about: $.....................

193
48. Do you sell some of your products through large shops like Pelhams, OK, Mashonaland
Furnishers, etc
1. YES……….. .. 2. NO………………..
49. If YES, name them and the amounts sold per month:
1. NAME OF SHOP……………………………………..AMOUNT $.......................................
2. NAME OF SHOP…………………………………….AMOUNT $........................................
50. Does your firm also sell some of its products to customers outside Zimbabwe?
1. YES…………. ……2. NO…………….
51. The value of the products sold outside Zimbabwe during the past 12 months was:$..............
52. List the countries to which you sell some of your products and the value of the goods sold over
the past 12 months.
COUNTRY APROX. VALUE OF GOODS SOLD
1
2
3
4
53. Does your firm also actively search for new markets for its products outside the Complex?
1. YES…………………2. NO……………..
54. To search for new markets, the firm uses the following method(s):
1. Advertising……… 2. . Merchandising (personal selling)………..
3.Other…………(Explain)…………………………………………………………………
55. Has your firm recently captured new markets outside the Complex:
1. YES… 2. . NO……..
56 If your firm receives a large order to supply a product, do you sometimes share the order with
another firm within the Complex?
1. YES……… 2.. NO…… ..

194
57. Name the firms that you share most of your orders with.
1. ………………………………………………….
2. ……………………………………………………
3. ……………………………………………………
58. Does your firm some times buy materials and other inputs jointly together with other firms in
the Complex:
1. YES…….…………….2. NO……
59. List the firms with which you jointly together buy most of your supplies or inputs.
NAME OF FIRM GOODS PURCHASED
1
2
3
60. Materials held in stock and their value (eg timber, steel, etc)
1. ITEM…………………………………………VALUE: $...........................................
2. ITEM…………………………………………VALUE: $.........................................
3. ITEM…………………………………………VALUE: $........................................
61. Goods held in stock and their value (eg sofa sets, kitchen uint, etc)
1. ITEM…………………………………………VALUE: $...........................................
2. ITEM…………………………………………VALUE: $.........................................
3. ITEM…………………………………………VALUE: $........................................
62. What percentage of your sales is for cash?
1. Less than half (50 per cent)……. 2. More than half (50 per cent)….
63. Credit terms:
1. Amount of deposit (per cent)………………
2. Payment period (months)………………….
F. THE FIRM’S EMPLOYEES
64. Number of employees in your firm (including the owner or manager) ………….

195
65. What is the average monthly income of each employee in this firm?$...............................
66. Number of employees who have worked in other firms within the Complex before joining this
firm:………………….
67. Number of employees who have worked in other firms outside the Complex before joining
this firm:…………………
68. Number of employees who were also trained by others within this firm…………….
69. How long does it take to train someone within the firm?............................
70. Number of employees with formal training and certificates from Colleges…………………
G. MACHINERY AND EQUIPMENT USED BY THE FIRM
70. List the machines / equipment currently used in your firm..
MACHINE NAME (TICK) YEAR OF PURCHASE VALUE ($)
1. Sawing Machine………… ………………………. ……………
2. Jig Saw………………….. ……………………… ……………
3. Spindle Moulder…………. ……………………… ……………
4. Rip Saw (Circular Saw)………… ……………………… …………….
5. Router…………………… ……………………… ……………..
6. Surface plane…………… …………………….. ……………..
7. Bender………………… ………………………. ………………..
8. Compressor……………… ……………………… …………………
MACHINE NAME (TICK) YEAR OF PURCHASE VALUE ($)
9. Grinder………………… ……………………. ………………….

196
10. Thickness Plane……….. …………………… ……………………
11. Lathe ………………… …………………… …………………..
71. List of other small tools (hend-held)
1. ITEM………………………………………VALUE……………………..
2. ITEM………………………………………VALUE………………………
3. ITEM…………………………………… VALUE……………………….
4. ITEM…………………………………… VALUE……………………….
5. ITEM……………………………………..VALUE……………………..
72. Of the machines listed above, which machine was manufactured or made by your firm and not
purchased?............................................................................................................................
73. What modifications or changes did you make to other machines in order to make them work for
you?......................................................................................................................................
…………………………………………………………………………………………………….
74. If a machine / equipment / tool breaks down, do you repair it yourselves
1. YES…………….. 2..NO..…
75. If the machine / equipment / tool is sent out for repairs by another firm, it is repaired by:
1. By a firm within the Complex………. (NAME)……………………………………
2. By a firm outside the Complex……… (NAME)……………………………………
3. By someone hired in the Complex……………(NAME)…………………………………
…………………………………………………………
H. THE INSTITUTIONAL ENVIRONMENT
76. Have you received any material or financial support or assistance from any institution or bank?
1. YES……… …2.NO………….

197
77. If YES, What type of assistance did you receive?
1. Loan…………………
2. Grant………………..
3. Training…………….. …..Briefly Explain……………………………….
…………………………………………………………………………………………….
4. Other ……………….. …..Briefly Explain……………………………………
………………………………………………………………………………………………..
78. If you received a loan, what was the amount?...................
79. What was the interest rate?..............
80. What was the period of the loan?..........Years
81. If you received a Grant, what was the amount?............
82. What did you use the loan or grant for?....................................................................................
…………………………………………………………………………………………………………
……………………………………………………………………………………………………
$
%
$