Embed Size (px)
Citation preview

Numerical Simulations on the Collapse Behaviors of High-Rise Towers
Daigoro Isobe1*, Le Thi Thai Thanh2 and Zion Sasaki3
1Associate Professor, Department of Engineering Mechanics and Energy, University of Tsukuba
1-1-1 Tennodai, Tsukuba-shi, Ibaraki 305−8573, Japan.2Meiko Co., Ltd., Japan
3Japan Electron Beam Irradiation Service, Japan
Received on 24 Feb 2011, Accepted on 26 Aug 2011
AABBSSTTRRAACCTTIn this paper, several numerical simulations of framed structures wereperformed to identify the specific structural cause of the high-speedtotal collapse of the World Trade Center (WTC) towers, which occurredduring the 9/11 terrorist attacks. A full-scale aircraft impact simulation ofthe WTC tower 2 was conducted to examine the dynamic unloadingphenomena that occurred in the core columns during impact, which mayhave caused the destruction of the splices between column sections.Fire-induced progressive collapse analyses of a high-rise tower with anoutrigger truss system were carried out to qualitatively demonstrate theeffects of fire patterns and structural parameters on the behavior of thistower’s collapse. In general, the tower remained standing for a longerperiod of time due to the catenary action of the outrigger truss systemonly if the load paths in the tower were protected and if the memberconnections were strong enough. However, in these analyses, thecollapse speed never reached a value as high as that of the free fallobserved in the WTC collapse, which occurred while the splices betweencolumn sections still retained their tensile strength. From these results, it isevident that the high-speed collapse of the WTC towers might havebeen caused by an inherent weakness in their member connections inaddition to the destruction directly caused by the aircraft impact.
KKeeyy wwoorrddss:: High-Rise Towers, Aircraft Impact, Progressive Collapse,Collapse Analysis
11.. IINNTTRROODDUUCCTTIIOONNThe terrorist attack on the World Trade Center (WTC) towers in New York on 9/11 was anunprecedented tragedy in the history of architecture. The twin towers, WTC 1 and WTC 2,were engulfed in flames that were caused by jet fuel, and ultimately, both towers collapsedto the ground, causing thousands of people to be trapped in the rubble. Both towers collapsedat a very high speed, which was nearly equal to that of a free fall. Official statementsregarding the incident were released by the Federal Emergency Management Agency
International Journal of Protective Structures – Volume 3 · Number 1 · 2012 1
*Corresponding author. E-mail address: [email protected]

(FEMA) in 2002 [1] and the National Institute of Standards and Technology (NIST) in 2005[2] and 2008 [3]. In its report, FEMA concluded that the heat of burning jet fuel causedadditional stress on the already damaged structural frame, simultaneously softening andweakening it. This additional loading and the resulting damage were sufficient to cause thecollapse of both structures. Many detailed numerical analyses have been performed by NIST,and they concluded that “the WTC towers likely would not have collapsed under thecombined effects of aircraft impact damage and the extensive, multi-floor fires, if the thermalinsulation had not been widely dislodged or had been only minimally dislodged by aircraftimpact”. However, the specific cause of such a high-speed collapse still remains unresolved.
Regarding this unresolved structural problem, an aircraft-impact analysis of a full-scaleWTC tower was initially performed to determine the possibility that the impact itself wasthe main cause of the high-speed collapse. It is clear that the towers experienced an extremedynamic load that no other high-rise building in history has ever experienced. Then,fire-induced collapse analyses of a high-rise tower model without any initial structuraldamage were performed to qualitatively verify the influences of fire patterns and structuralparameters, such as the axial force ratio, the member strength of the outrigger truss systemand the connection strength, with respect to the collapse initiation time (the duration from thebeginning of the fire until the beginning of the collapse). These analyses were not performedon a full-scale WTC tower because the qualitative information on the collapse behavior ofhigh-rise towers on fire and the contributions of their structural parameters to their collapsebehaviors are, for some reason, the most desired information in terms of understanding thecollapse phenomena associated with high-rise towers. The information that is obtainedshould be applicable to all high-rise buildings, not just the WTC towers.
Although the behavior of a structure prior to the initiation of its collapse is nearly static,a structure’s collapse behavior is very dynamic. Hence, there are greater calculationrequirements for the dynamic analysis of the entire sequence. Therefore, a highly accurateand less memory-intensive numerical code with a low calculation cost, which also has highreliability for the fracture and contact behaviors of structural members, was used. The codewas based on the ASI-Gauss technique [4], which is a modified form of the adaptively shiftedintegration (ASI) technique [5, 6, 7, 8] for the linear Timoshenko beam element. This codeenables the computation of highly accurate elastoplastic solutions, even if the minimumnumber of elements per member is used. An outline of the numerical code is described in thispaper, followed by a discussion of the aircraft impact simulation results for a full-scale WTC2 model and the fire-induced collapse simulation results of a high-rise tower model with anoutrigger truss system on the roof.
This paper is organized as follows. Section 2 introduces the outline of the numerical code.In section 3, the numerical results for the aircraft impact analysis of the full-scale WTC 2model are presented. Section 4 presents the numerical results for the high-rise tower modelsubjected to elevated temperatures. Finally, section 5 presents the conclusions of this paper.
22.. NNUUMMEERRIICCAALL CCOODDEEFigure 1 shows a linear Timoshenko beam element with shear effects and its physicalequivalence to the rigid bodies-spring model (RBSM). As shown in Fig. 1, the relationshipbetween the location of the numerical integration point and the stress evaluation point wherea plastic hinge is formed is expressed [9] as
(1)
where s is the location of the numerical integration point, and r is the location where thestress and strain are evaluated. The s and r terms are dimensionless quantities with valuesbetween -1 and 1.
r s= −
2 Numerical Simulations on the Collapse Behaviors of High-Rise Towers

In both the ASI and ASI-Gauss techniques, the numerical integration point is adaptivelyshifted to form a plastic hinge exactly at the point where a fully plastic section is formed.When the plastic hinge is unloaded, the corresponding numerical integration point shifts backto its original position. Here, the original position represents the location where the numericalintegration point is placed if the element acts elastically. Thus, the elastoplastic behavior ofthe element is simulated appropriately, and a converged solution is achieved using only asmall number of elements per member. In the ASI technique, the numerical integration pointis placed at the midpoint of the linear Timoshenko beam element, which is considered to beoptimal for a one-point integration if the entire region of the element behaves elastically.However, a low-order displacement function is also adopted for the linear Timoshenko beamelement, and thus, solutions in the elastic range are not sufficiently accurate compared to thoseof higher-order beam elements if the number of elements per member is very small.
The primary difference between the ASI and ASI-Gauss techniques is the original positionof the numerical integration point, as shown in Fig. 2. In the ASI-Gauss technique, the two
International Journal of Protective Structures – Volume 3 · Number 1 · 2012 3
θ1
θ1
θ2
θ2
u1
u1
u2
u2
−1 10
s
s1
Linear Timoshenko beam element
r
r1
Rigid bodies-spring model (RBSM)
Numerical integration point
Rotational and shear spring connecting rigid bars
(Plastic hinge including the effect of shear force)
Figure 1. A linear Timoshenko beam element and its physical equivalent
Numerical integration point Stress evaluation point
1 1−1 −10 0
−1 10−1/2 1/2
Member
Element 1 Element 2
sg = 1−(2/℘3), rg = −1 + (2/℘3)
1 1−1 −1sg sg
−1 10−1/℘3 1/℘3
Member
Element 1 Element 2
0rg rg
(a) ASI technique (b) ASI-Gauss technique
0
Figure 2. Locations of the numerical integration and stress evaluationpoints in the elastic range

consecutive elements that form a member are considered to be a subset, and the numericalintegration points of an elastically deformed member are located such that the stress evaluationpoints coincide with the Gaussian integration points of the member (±1/√3 in dimensionlesscoordinates). Thus, the stress and strain are evaluated at the Gaussian integration points if themembers are in an elastic stage. The use of Gaussian integration points is optimal for a two-point integration, and the accuracy of the bending deformation is mathematically guaranteed[10]. Therefore, the ASI-Gauss technique takes advantage of the benefits of a two-pointintegration while utilizing a one-point integration in the actual calculations.
Figure 3 shows the location of the numerical integration points for each stage of the ASI-Gauss technique. The numerical integration points are placed at the locations mentionedabove in the elastic stage. Once the yielding is determined for an element, the plastic hingeis expressed by shifting the numerical integration point to the opposite end of the fully plasticsection, according to Eq. (1). For example, if a fully plastic section initially occurs at theright end of an element (r = 1), as shown in Fig. 3(b), then the numerical integration pointshifts immediately to the left end of the element (s = −1). At the same time, the numericalintegration point of the adjacent element that forms the same member is shifted back to itsmidpoint (s = 0), where it is appropriately located for a one-point integration. A memberfracture is determined only at the fully plastic section and is expressed by reducing thesectional forces of the element immediately after the occurrence of the fractured section.
The yield condition used in the analysis is expressed as follows:
(2)
where fy is the yield function, and Mx, My and N are the bending moments around the x andy axes and the axial force, respectively. The terms with the subscript 0 are values that result ina fully plastic section in an element if they act on the cross section independently. The memberjoint strength ratio, CM, which indicates the moment capacity ratio of the member connectionto the adjacent member, is used to explicitly express the influence of the connection strength.The values of the ratio are fixed on the basis that the plastic moment capacity of some of thecolumn connections in the WTC towers was weak compared to those of their members [1].
fM
C M
M
C M
N
Nx
M x
y
M y
=
+
+
0
2
0
2
0
22
1 1 0− = − =fy
4 Numerical Simulations on the Collapse Behaviors of High-Rise Towers
Fracture Plastic hinge s = sg
s = sg s = 0
s = −1
s = 0
s = 0
(a) Elastic stage (b) Plastic stage (c) Member fracture
Numerical integration point Node
Figure 3. Locations of numerical integration points for each stage ofthe ASI-Gauss technique
The fracture conditions of the member joints are considered by examining the bendingstrains, axial tensile strain and shear strains in a member as follows:
where κx, κy, γxz, γyz, εz, κx0, κy0, γxz0, γyz0 and εz0 are the bending strains around the x andy axes, the shear strains for the x and y axes, the axial tensile strain and the critical values forthese strains, respectively.
Elemental contact is considered in the numerical code by connecting the gap elementsbetween the pairs of elements that are in contact, as determined by using their geometricalrelationships. More details regarding this numerical code can be found in [4].
33.. AAIIRRCCRRAAFFTT IIMMPPAACCTT AANNAALLYYSSIISS OOFF TTHHEE WWOORRLLDD TTRRAADDEE CCEENNTTEERR TTOOWWEERR 22 An aircraft impact analysis of a full-scale model of WTC 2 (the south tower) was performedusing the code that was introduced in the previous section. The details of the structuralmembers and the construction data were extracted and adopted from previous reports [1, 2, 11].The tower and the B767−200ER aircraft were modeled using linear Timoshenko beamelements. All of the members were subdivided into two elements. Figure 4 shows aschematic view of the WTC 2 tower model and the aircraft model. The tower modelconsisted of 604,780 elements, 435,117 nodes and 2,608,686 degrees of freedom, and theaircraft model consisted of 4,322 elements, 2,970 nodes and 17,820 degrees of freedom.Figure 5 shows a cross-sectional view of the tower. The floor was coarsely divided into twosections, the external and core structures, which had different structural roles. The externalstructure was primarily designed to sustain wind loads, whereas the main double trussesconnected to the core structure supported the floor loads. The entire tower was subjected toa designed vertical load of 2,890 MN and 40% of the engineered capacity load of 300 MN.The ratio between the loads of the core and external structures was adjusted to a value ofapproximately 6:4 [1]. The structural members of the B767-200ER aircraft were assumed tobe box-section type beams with the material properties of extra super duralumin. The totalmass of the aircraft at the time of impact was 142.5 tons, which is the sum of the mass of theaircraft (112.5 tons) and the jet fuel (30 tons). The mass of each engine was assumed to be19.315 tons. The nose of the aircraft was tilted 11.5 degrees to the east and 5 degreesdownward, and its left wing was inclined 35 degrees downward. The aircraft was assumed,according to information in the reports, to have collided into the 81st floor on the south faceof the WTC 2 at a speed of 590 mph (262 m/s).
Most of the column connections were weak compared to fully rigid connections, thoughthey fully satisfied the building codes of New York City. For example, the simple momentcapacity of the bolt group in the perimeter columns was 20 to 30% of the plastic momentcapacity of the column member itself [1]. The beam-to-column connections between themain double trusses and the core columns had simple connections to sustain the static,vertical loads, which satisfied the initial structural design. However, the member jointstrength ratio was set to a value of 1.0 in this analysis for simplicity, and the effect of theconnection strength was determined by the progressive collapse analysis, which is presentedlater. We assumed an elastoplastic body with a strain hardening of 1/100th of the elastic
(3)
κκ
κκ
γγ
γγ
x
x
y
y
xz
xz
yz
yz
0 0 0
0
1 0 1 0 1 0− ≥ − ≥ − ≥
−
or or or
11 0 1 00
≥
− ≥or
εε
z
z
International Journal of Protective Structures – Volume 3 · Number 1 · 2012 5

6 Numerical Simulations on the Collapse Behaviors of High-Rise Towers
Perimetercolumn
Diagonal bracemember Intermediate
support angle
Transverse truss
Main
Core column
Core beam
Spandrel
double truss
Figure 5. Cross section of the WTC tower
(a) Upper view (b) South view (c) East view
East face
West face
South face
North face
Figure 4. Analytical model of the WTC 2 and the aircraft

modulus for all structural members, and the effect of the strain rate on the yield strength wasconsidered by applying the Cowper-Symonds equation [12] as follows:
(4)
where σ ′, σ0 and ε. are the dynamic yield stress, the static yield stress and the strain rate,respectively, and D and q are the material constants. In this study, 40.4 and 5 were used forthe D and q of steel, and 6500 and 4 were used for those of duralumin.
In this analysis, we fixed the critical bending strain and the axial tensile strain values for afracture by comparing the impact damage and the motion of the engines with the observeddata. An implicit scheme with a consistent mass matrix was adopted, and numerical dampingwas applied; the integration parameters δ and β were set to 5/6 and 4/9 in Newmark’sβ method [13], respectively. An updated Lagrangian formulation was used because largedeformations were expected in the analysis, and the conjugate gradient (CG) method was usedas the solver to reduce memory requirements. The time increment was set to 0.2 ms, and theanalytical code was run on a high-performance computer (1.4 GHz Itanium*2, 8GB RAM)for approximately two months to obtain the results for an actual crash duration of 0.7 s.
A motion view of the aircraft during impact is shown in Figs. 6 and 7, in which thefractured elements are omitted. The left engine rapidly reduced its speed as it entered thecore structure; however, the right engine glanced off the core structure and passed throughthe northeast corner of the tower. Table 1 shows the impact timeline of the fuselage and bothengines. The velocity curve for the right engine is shown in Fig. 8, along with its
′ = +
σσ
ε0
1
1�D
q
International Journal of Protective Structures – Volume 3 · Number 1 · 2012 7
(a) 0.12 s after impact (b) 0.28 s after impact (c) 0.56 s after impact
Figure 6. Aircraft impact analysis of the WTC 2 (global view)

8 Numerical Simulations on the Collapse Behaviors of High-Rise Towers
(a) 0.12 s after impact (b) 0.28 s after impact (c) 0.56 s after impact
Figure 7. Motion of the fuselage and engines (upper view)
Table 1. Timeline of the impact of the B767-200ER aircraft
B767-200ER aircraft Elapsed
Phase time Left engine Right engine Nose 0.000 Hits outer-perimeter wall
A 0.048 Hits core structure 0.072 Hits outer-perimeter
wall B 0.076 Hits outer-perimeter wall C 0.128 Hits core structure D 0.168 Hits core column
No.902 E 0.504 Hits core column
No.903 F 0.512 Hits east side
outer-perimeter wall
C D EF
120
160
200
240
280
0 0.1 0.2 0.3 0.4 0.5 0.6 0.7
A B
: Observational data(ASCE/FEMA 2002)
0
40
80
Elapsed time (s)
Spe
ed (
m/s
)
Figure 8. Velocity curve for the right engine

observational data [1]. The letters “A”, “B” and so on, indicated in the figure, represent thecorresponding phases listed in Table 1. A comparison between the numerical results and theobservational data [2] for the damaged surfaces is shown in Fig. 9. Both results are in goodagreement with the observational data. Figure 10 depicts the core column numbers in theWTC tower and their relative locations to the point of aircraft impact. Figure 11 shows thetransition of the axial forces in two of the core columns (No. 508 and No. 1001) atincrements of ten stories from the ground floor to the top floor. The letters “A”, “B” and so
International Journal of Protective Structures – Volume 3 · Number 1 · 2012 9
(a) Numerical result (b) Observational data [2]
Wing tipVertical stablizer tipEngine
Figure 9. Damage to the south face of the WTC 2
501 502 503 504 505 506 507 508
601 602 603 604 605 606 607 608
701 702 703704705 706 707 708
901 902 903 904 905 906 907 908
1001
Flight no. UA175(B767-200ER)
1002 1003 10041005 1006 1007 1008
801 802 803 804805 806 807
Figure 10. Location of the core columns
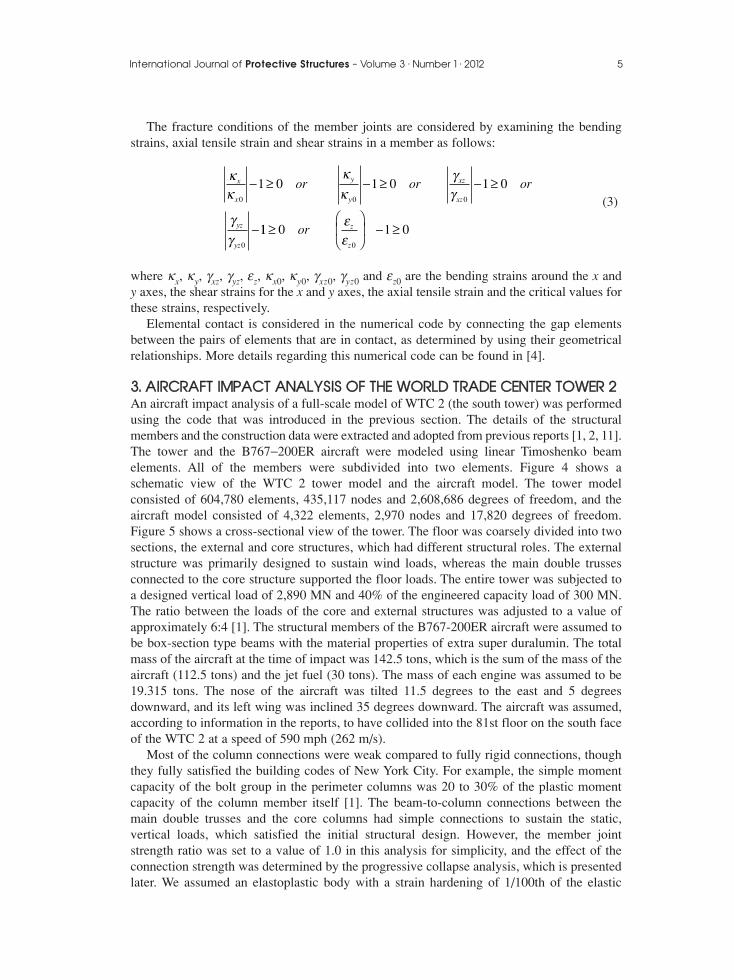
on, indicated in the figure again represent the corresponding phases given in Table 1. Corecolumn No. 1001 was compressed continuously until the nose of the aircraft reached thecore structure (Phase A in Fig. 11(a)), and a shock wave due to this impact propagated inthe horizontal and vertical directions thereafter. The wave reached core column No. 508after a slight delay (see Fig. 11(b)). The compression that occurred in column No. 1001decreased instantaneously at the floors above the impact point. At the lower levels,the compression transitioned into tension immediately after the left engine hit the corestructure (Phase C), and the axial forces continued to vibrate with a large amplitude. Notethat the lower the height, the larger the amplitude becomes. For example, as shown in Fig. 12,at the 60th floor, column No. 1001 moved 25 cm vertically in 0.2 s as a result of thisdynamic unloading. However, due to the large momentum, the floors could not havefollowed this column movement, and the beam-to-column connections were likely to havefailed in the process.
The temporal change in the distribution of the fractured main double trusses wasextracted, as shown in Fig. 13, to investigate the cause of the dynamic unloading. The
10 Numerical Simulations on the Collapse Behaviors of High-Rise Towers
A 0 0.1 0.2 0.3 0.4 0.5 0.6 0.7
B C D EF
120 1F11F21F31F41F51F61F71F81F91F101F
10080604020
Axi
al fo
rce
(MN
)
0−20−40−60−80
−100
Elapsed time (s) Elapsed time (s)
A 0 0.1 0.2 0.3 0.4 0.5 0.6 0.7
B C D EF
120 1F11F21F31F41F51F61F71F81F91F101F
10080604020
Axi
al fo
rce
(MN
)
0−20−40−60−80
−100
(a) Core column No. 1001 (b) Core column No. 508
Figure 11. Temporal change in the axial forces in the core columns
0 0.1 0.2 0.3 0.4 0.5 0.6 0.7
300
200
100
0
−100
−200
11F21F31F41F51F61F71F81F91F101F
Dis
plac
emen
t (m
m)
−300
Elapsed time (s)
Figure 12. Axial displacement due to the dynamic unloadingphenomenon

International Journal of Protective Structures – Volume 3 · Number 1 · 2012 11
fractured joints in the main double trusses are indicated as black dots in this figure. Thepropagation of fractured joints from the impact point to the upper and lower levels isapparent. The propagation speed agreed well with the theoretical speed at which thelongitudinal wave traveled through in the columns. The shock wave due to the impactpropagated through the tower and was transmitted to the other columns at the ground levelor top level of the tower, which destroyed each member connection as the wave moved alongthe columns.
The assumed scenario is described as follows: the impact of the aircraft destroyedseveral connections between the core columns and the main double trusses that supportedthe floor slabs, which resulted in a middle-class unloading of the core columns.Deformation due to the unloading caused other trusses to disconnect, which relievedadditional loads from the core columns. This disconnect-and-release process advanced ina very short period of time as a chain reaction, and this dynamic unloading phenomenonmight have occurred in many columns like a compressed spring being quickly released.This process was substantial enough to produce a large tensile force in the columns,which may have triggered the total fracture of some column connections and made thecolumns similar to toy blocks (with no connections) piled on top of one another. Thedamage to the lower levels was greater because the tensile force increased along with adecrease in height, as observed in Fig. 11. The compression strength of the columnsremained unchanged, however, which prevented the structure from falling down for sometime.
44.. FFIIRREE--IINNDDUUCCEEDD PPRROOGGRREESSSSIIVVEE CCOOLLLLAAPPSSEE AANNAALLYYSSIISS OOFF AA HHIIGGHH--RRIISSEETTOOWWEERRFire-induced collapse analyses were performed on a 30-story, seven-span tower, shown inFig. 14. An outrigger truss system was placed on the roof of the model, and the influenceof this system on the structural vulnerability of the tower was verified. In addition, severalstructural parameters were varied to determine their contributions to the collapse behavior.The axial force ratio of the columns to the structural strength capacity was varied from 0.1to 0.5, which was altered by varying only the floor loads. The member joint strength ratio
0 0.1A B C D
0.2 0.3 0.4 0.5 0.6 0.7
110
90
70
50
30
100
80
60
40
20
10
Dis
trib
utio
n of
frac
ture
d m
ain
doub
letr
usse
s (f
loor
)
0EF
Elapsed time (s)
Figure 13. Distribution of the fractured main double trusses

of every member connection in the model, CM, was varied from 0.1 to 0.6, and the memberstrength ratio of the outrigger trusses to the strength of the beams on the 1st floor wasvaried from 0.0 (no outrigger truss system in place) to 2.0. The tower model consisted of9,360 linear Timoshenko beam elements, 6,644 nodes and 39,600 degrees of freedom. Thematerial properties, including the critical fracture strains, which were obtained fromexperiments performed on high-strength joint bolts [14], and the sectional parameters ofthe columns and beams, are shown in Table 2 and Table 3. Three simple fire patterns, asshown in Fig. 15, were applied to determine how the catenary action of the outrigger trusssystem contributed to gain time before collapse. These fire patterns comprised threeadjacent rows of sections that were on fire, from the 21st to the 24th floors, located fromthe middle to the sides of the building. The height of the area on fire was assumed with
12 Numerical Simulations on the Collapse Behaviors of High-Rise Towers
Front view
Corestructure
Z
X
Y
Upper view 28 m
120 m
28 m
Outrigger truss system
Figure 14. 30-story, seven-span tower model
Table 2. Material properties of the structural members
Young’s modulus (SN490B) 206 GPaYield strength (SN490B) 325 MPaPoisson’s ratio (SN490B) 0.3 Density (SN490B) 7.9 × l0−6 kg/mm3
Critical bending strain for fracture [14] 3.333 × l0−4
Critical shear strain for fracture [14] 1.300 × 10⁻²
Critical axial tensile strain for fracture [14] 0.17

regards to the WTC 2 case; the upper one-third to one-fourth of a section was treated as onfire. The structural damage due to aircraft impact was neglected in this model. However,the effect of the dislodging of thermal insulation that was caused by the aircraft impact andthe subsequent explosions were incorporated by applying the changes in the elasticmodulus and yield strength of raw steel that occur with an increase in temperature [2], asshown in Fig. 16. It was found that at 700 degrees Celsius, which is a typical temperaturein a fire, the elastic modulus of the columns with no thermal insulation decreases to 60%of its original value, and the yield strength is reduced to 10% of its original strength. Toreduce complexity, a simple assumption was made that the temperature of the beam
International Journal of Protective Structures – Volume 3 · Number 1 · 2012 13
Table 3. Sectional properties of the structural members
Cross section of columns Cross section of beams Floor Cross section Floor Cross section 1−5 Box-700 × 28 1−10 H-700 × 300 × 13 × 24 6−10 Box-600 × 25 11−20 H-700 × 250 × 12 × 22 11−15 Box-500 × 24 21−30 H-700 × 200 × 12 × 2216−20 Box-400 × 23 21–30 Box-350 × 20
Pattern C Pattern A Pattern B
Y
X
Figure 15. Assumed fire patterns (21F−24F)
(a) Elastic modulus
Ela
stic
mod
ulus
red
uctio
n fa
ctor
Temperature (°C)
0 200 400 600 800 10000.5
0.6
0.7
0.8
0.9
1
(b) Yield strength
Yie
ld s
tren
gth
redu
ctio
n fa
ctor
Temperature (°C)
0 200 400 600 800 1000
0.2
0.4
0.6
0.8
1
Figure 16. Strength reduction of raw steel with increasing temperature

elements in the areas shown in Fig. 15 increased to 700 degrees Celsius in seven minutes,as shown in Fig. 17. The temporal change in temperature that was used followed a curveused in standard Japanese fire resistance tests. The model was dynamically analyzedthroughout the entire calculation; however, a time increment control was applied to enablea continuous calculation from static to dynamic phenomena. Specifically, the timeincrement was set to 1 s before any of the elements had deformed from their sectionalwidth in a single step and was automatically shortened to 1 ms after any deformationoccurred for each sectional width in a single step. The analysis required approximatelyeight hours of simulation time using a personal computer (CPU: 2.93 GHz Xeon).
Figure 18 shows the modes of collapse of the tower when exposed to each fire patternand the member joint strength ratio, CM, was set to 0.3 and the axial force ratio in thecolumns of the 1st floor was set to 0.33, with a regular-strength outrigger truss systemplaced on the roof (the structural strength was similar to that of the beams on the1st floor). For all of the cases examined, a total collapse was inevitable, and the resultsclearly show the effect of the weak member connections compared to the fully rigidconnections and the effect of the reduction in strength due to the elevated temperature. Asshown in Fig. 18, the collision of the upper structure with the lower structure createdshock waves that propagated through the columns and moved faster than the fallingmotion of the upper structure. The shock waves destroyed the member joints as theymoved towards the ground level. The differences in fire patterns did not appear to affectthe overall collapse behavior. However, the slant angles at the initiation of the collapsephase were different, and the time until the initiation of the collapse was shorter if the firepattern was asymmetrical. The amount of time until the initiation of the collapsedepended on the strength and the number of outrigger trusses that supported the loadpaths near structural deficiencies. Moreover, some independent structural membersappeared to fall at the speed of a free fall, whereas the upper structure experienced areduction in speed during the fall. This phenomenon appeared in all of the cases,including the case where CM = 0.1. Figure 19 shows the relationship between the axialforce ratio and the time until the initiation of the collapse. The amount of time was not
14 Numerical Simulations on the Collapse Behaviors of High-Rise Towers
Time (s)
Tem
pera
ture
(°C
)
0 200 400 600 800 1000
200
400
600
800
1000
Figure 17. Assumed temporal change in temperature

International Journal of Protective Structures – Volume 3 · Number 1 · 2012 15
(a) Fire pattern A
(b) Fire pattern B
(c) Fire pattern C
550.0 s529.5 s527.5 s500.0 s 537.0 s
540.1 s525.7 s524.2 s500.0 s 527.8 s
465.0 s449.0 s447.5 s445.0 s 450.5 s
Figure 18. Collapse progression (axial force ratio = 0.33, CM = 0.3, with anoutrigger truss system)
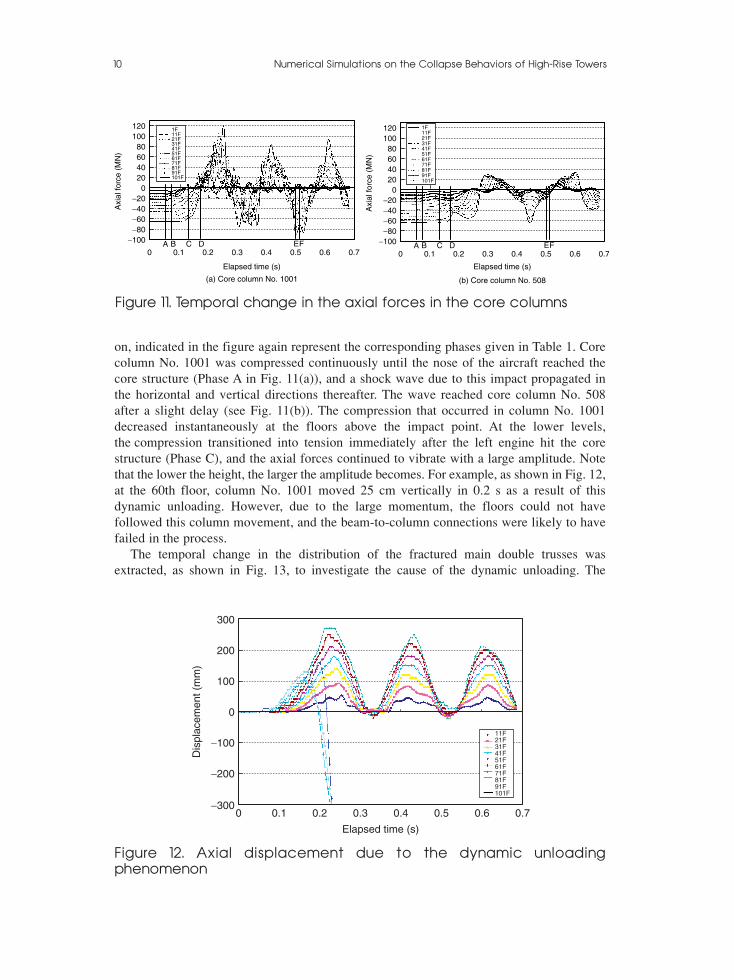
affected by the presence of the outrigger truss system if the axial force ratio was large.However, the effect of the outrigger truss system on the time until the collapse beganincreased in all of the cases if the axial force ratio had small values. Therefore, theinfluence of the structural parameters on the collapse initiation time was investigated intwo different cases: (1) axial force ratio = 0.33 (floor load: 10.0 kN/m2), for which thedifferences in collapse initiation times was small, and (2) axial force ratio = 0.19 (floorload: 5.0 kN/m2), for which the difference was larger. Figure 20 shows the results for theformer case. The results without plots are the cases in which the tower model did notcollapse during the entire calculation time. Although the strength of the outrigger trussesand the member joints slightly increases the collapse initiation time for fire patterns A andB, it does not seem to significantly affect the amount of time until the initiation of thecollapse if the fire pattern becomes as asymmetrical as fire pattern C. In particular, all ofthe cases, except for the case in which CM = 0.1, had a constant collapse initiation time of
16 Numerical Simulations on the Collapse Behaviors of High-Rise Towers
(a) Fire pattern A
Col
laps
e in
itiat
ion
time
(s)
Axial force ratio
0.2 0.3 0.4 0.50
200
400
600
800
1000
1200
1400
1600
1800
2000
(b) Fire pattern B
Col
laps
e in
itiat
ion
time
(s)
Axial force ratio
0.2 0.3 0.4 0.50
200
400
600
800
1000
1200
1400
1600
1800
2000
(c) Fire pattern C
Col
laps
e in
itiat
ion
time
(s)
Axial force ratio
0.2 0.3 0.4 0.50
200
400
600
800
1000
1200
1400
1600
1800
2000
Without outrigger truss systemWith outrigger truss system
Without outrigger truss systemWith outrigger truss system
Without outrigger truss systemWith outrigger truss system
Figure 19. Time until the initiation of the collapse vs. the axial force ratio

around 450 s when fire pattern C was applied (Fig. 20(c)). Figure 21 shows the results forcase (2), in which the axial force ratio was smaller. The collapse initiation time seems tobe largely affected by the presence of the outrigger truss system. However, the mostsignificant parameter in this case is the member joint strength ratio, CM, and not themember strengths of the outrigger trusses. For example, the collapse initiation time withCM = 0.2 under fire pattern B varies by approximately 40 s between the models with andwithout the outrigger truss system, but with CM = 0.3, the time until the initiation of thecollapse increases to more than 520 s if the outrigger truss system is present.
These results confirm that the time until the initiation of a collapse can be significantlyaffected by the member joint strength ratio, particularly if the axial force ratio is small (floorloads are low), under the condition that the fire pattern is nearly symmetrical and the loadpaths to and from the outrigger truss system are sufficiently protected.
International Journal of Protective Structures – Volume 3 · Number 1 · 2012 17
W/o outrigger truss system
(a) Fire pattern A
Col
laps
e in
itiat
ion
time
(s)
Member strength ratio of outrigger truss
0 10.5 1.5 2 0 10.5 1.5 2
0 10.5 1.5 2
0
200
400
600
800
1000
1200
1400
1600
1800
2000
(b) Fire pattern B
Col
laps
e in
itiat
ion
time
(s)
Member strength ratio of outrigger truss
0
200
400
600
800
1000
1200
1400
1600
1800
2000
(c) Fire pattern C
Col
laps
e in
itiat
ion
time
(s)
Member strength ratio of outrigger truss
0
200
400
600
800
1000
1200
1400
1600
1800
2000
CM = 0.1CM = 0.2CM = 0.3CM = 0.4CM = 0.5CM = 0.6
CM = 0.1CM = 0.2CM = 0.3CM = 0.4CM = 0.5
CM = 0.1CM = 0.2CM = 0.3CM = 0.4CM = 0.5CM = 0.6
Figure 20. Influence of the structural parameters on the time until theinitiation of the collapse (axial force ratio = 0.33)

55.. CCOONNCCLLUUSSIIOONNSSThe numerical results in this paper indicate that the high-speed total collapse of the WTCtowers might have been caused not only by the buckling and strength reduction of themembers due to elevated temperatures but also by the original weakness of the memberconnections and the destruction of the splices between the column sections that were causedby the aircraft impact itself. It has been qualitatively shown that the outrigger truss systemdelays the time until the initiation of the collapse in the models with smaller axial forceratios, greater connection strengths and symmetrical fire patterns. The results explain howWTC 1 (the north tower), which had symmetrical structural deficiencies, was able to remainstanding for a longer period of time before its total collapse compared to WTC 2, which hadasymmetrical structural deficiencies. However, the collapse speed in the analyses neverreached a value as high as that of the free fall observed in the WTC collapse when the splicesbetween column sections had at least some tensile strength remaining. These results indicate
18 Numerical Simulations on the Collapse Behaviors of High-Rise Towers
0 10.5 1.5 2
W/o outrigger truss system
(a) Fire pattern A
Col
laps
e in
itiat
ion
time
(s)
Member strength ratio of outrigger truss
0 10.5 1.5 2 0 10.5 1.5 20
200
400
600
800
1000
1200
1400
1600
1800
2000
(b) Fire pattern B
Member strength ratio of outrigger truss
(c) Fire pattern C
Col
laps
e in
itiat
ion
time
(s)
Member strength ratio of outrigger truss
0
200
400
600
800
1000
1200
1400
1600
1800
2000C
olla
pse
initi
atio
n tim
e (s
)
0
200
400
600
800
1000
1200
1400
1600
1800
2000CM = 0.1CM = 0.2CM = 0.3CM = 0.4
CM = 0.1CM = 0.2CM = 0.3
CM = 0.1CM = 0.2CM = 0.3CM = 0.4CM = 0.5
Figure 21. Influence of the structural parameters on the time until the initiation of the collapse (axial force ratio = 0.19)
that the high-speed collapse of the WTC towers might have been caused by an inherentweakness in the member connections in addition to the destruction directly caused by theaircraft impact.
We plan to perform a further, thorough investigation of the collapse of the WTC towersby carrying out a successive full-scale analysis from the aircraft impact to the fire-inducedprogressive collapse phase to examine the effect of the initial structural damage on thecollapse behavior.
AACCKKNNOOWWLLEEDDGGMMEENNTTSSThe authors would like to express their appreciation for contributions involving thecontinuous testing and refinement of the code by former and present graduate students oftheir laboratory: Kyaw Myo Lynn, Kazunori Shimizu, Kensuke Imanishi, Masashi Eguchi,Tomonobu Omuro, Naoki Katahira, Hitoshi Yokota, Tetsuya Hisanaga, Takuya Katsu andYuta Arakaki.
RREEFFEERREENNCCEESS[1] ASCE/FEMA, World Trade Center Building Performance Study: Data Collection, Preliminary Observation
and Recommendations, ASCE/FEMA, 2002.
[2] NIST NCSTAR 1, Federal Building and Fire Safety Investigation of the World Trade Center Disaster: FinalReport on the Collapse of the World Trade Center Towers, National Institute of Standards and Technology(NIST), 2005.
[3] NIST NCSTAR 1A, Final Report on the Collapse of World Trade Center Building 7, National Institute ofStandards and Technology (NIST), 2008.
[4] Lynn KM and Isobe D., Finite Element Code for Impact Collapse Problems of Framed Structures,International Journal for Numerical Methods in Engineering, 2007, 69(12), 2538−2563.
[5] Toi Y. and Isobe D., Adaptively Shifted Integration Technique for Finite Element Collapse Analysis ofFramed Structures, International Journal for Numerical Methods in Engineering, 1993, 36, 2323−2339.
[6] Toi Y. and Isobe D., Finite Element Analysis of Quasi-Static and Dynamic Collapse Behaviors of FramedStructures by the Adaptively Shifted Integration Technique, Computers and Structures, 1996, 58(5), 947−955.
[7] Isobe D. and Toi Y., Analysis of Structurally Discontinuous Reinforced Concrete Building Frames Using theASI Technique, Computers and Structures, 2000, 76(4), 471−481.
[8] Isobe D. and Tsuda M., Seismic Collapse Analysis of Reinforced Concrete Framed Structures Using theFinite Element Method, Earthquake Engineering and Structural Dynamics, 2003, 32(13), 2027−2046.
[9] Toi Y., Shifted Integration Technique in One-Dimensional Plastic Collapse Analysis Using Linear and CubicFinite Elements, International Journal for Numerical Methods in Engineering, 1991, 31, 1537−1552.
[10] Press W.H., Teukolsky S.A., Vetterling W.T. and Flannery B.P., Numerical Recipes in FORTRAN: The Art ofScientific Computing, New York: Cambridge University Press, 1992.
[11] AIJ, Report on WTC Collapse Investigation, Special Investigation Committee, Architectural Institute ofJapan (AIJ), 2003, in Japanese.
[12] Jones, N., Structural impact, New York: Cambridge University Press, 1989.
[13] Press WH, Teukolsky SA, Vetterling WT and Flannery BP, Numerical Recipes in FORTRAN: The Art ofScientific Computing, New York: Cambridge University Press, 1992.
[14] Hirashima, T., Hamada, N., Ozaki, F., Ave, T. and Uesugi, H., Experimental Study on Shear DeformationBehavior of High Strength Bolts at Elevated Temperature, Journal of Structural and ConstructionEngineering AIJ, 2007, 621, 175−180, in Japanese.
International Journal of Protective Structures – Volume 3 · Number 1 · 2012 19